HOUSE
R E P O R T
TRENDS
An overview into which trends to watch
EXPERT GUIDANCE
Navigate this year’s market with confidence
INSIDER INSIGHT
Words of wisdom from Nicole Kobrinsky
I N S I D E R L O O K A T T H E P H O E N I X M E T R O M A R K E T Copyright May © 2024 T H
E
1 A quick and insightful look at the realities of the real estate market in Phoenix Metro
2 We utilize The Cromford Index™ which is a set of market indicators to measure the balance of supply and demand
3-4 A comprehensive look at more detailed market statistics from a past and current perspective
Trends
Highlights
Overall Insights
CONTENTS
OVERALL INSIGHTS
Once again, supply continued to grow over the last month, which is seasonally abnormal However it only grew 0 6% and remains below normal Buyers have 37% more homes to choose from than they had last year but still face 30-year mortgage rates over 7% which is limiting demand.
Some signs are starting to look slightly positive We have more pending listings than last month and under contract listings comfortably exceed 9,000 at last, up 8 5% from last month, though they are still down 6 3% from this time last year The closed sales count for April was higher than both last year and last month, which is reassuring at first sight However we had 22 working days in April 2024 and only 20 in April 2023, so the comparison is weighted in favor of the month that just completed If we compute the number of closed sales per working day we are actually down 4 7% to 319 from 334 a year ago
Pricing is the brightest spot for sellers, and advanced further than expected over the last 30 days. The mix of homes that closed favors larger, more luxurious properties, as evidenced by the average sq. ft. rising from 1,975 in March to 1,996 in April. The price per square foot is up almost 10% from this time last year while the median sale price is up almost 6%. On top of stubbornly high interest rates (at least compared to the last decade), these higher prices are keeping a lid on demand In these circumstances, the under contract count is proving to be quite resilient so far
Various reports suggest that more buyers are looking for homes that are move-in ready and are less willing to consider homes that need a lot of work to bring upto-spec. This trend may partially explain why new home sales remain robust and far healthier than re-sales, an it also opens up an increased opportunity for fix-and-flip investors They should be seeing less competition from iBuyers, institutional investors looking for homes to rent and ordinary home buyers The consequence is that they may be able to get better gross margins between their buying and selling prices than in the market that prevailed over the last several years. However this effect is balanced by inflation causing fix-up costs to increase
Given the recent trend in mortgage rates, the current market is holding up a little better than expected The Cromford® Market Index stands a point above the balanced zone (90 to 110) and has barely declined over the past 2 weeks Being stuck at just over 110 is superior to being stuck at 100 from a seller's perspective Areas closer to the center of the valley still have the advantage of tight supply to keep seller's in control. However several re-sale markets are much more favorable to buyers, especially Maricopa, Buckeye and San Tan Valley, all of which suffer strong competition from new homes The outlook for May is more of the same, but the housing market remains very sensitive to any significant change in mortgage rates.
Nicole Kobrinsky PRESIDENT & BROKER OF RECORD
H O U S E R E P O R T | P A G E 1
DATA SOURCE: ARIZONA REGIONAL MULTIPLE LISTING SERVICE, INC (ARMLS) & CROMFORD ASSOCIATES LLC
HIGHLIGHTS
MARKET TYPE
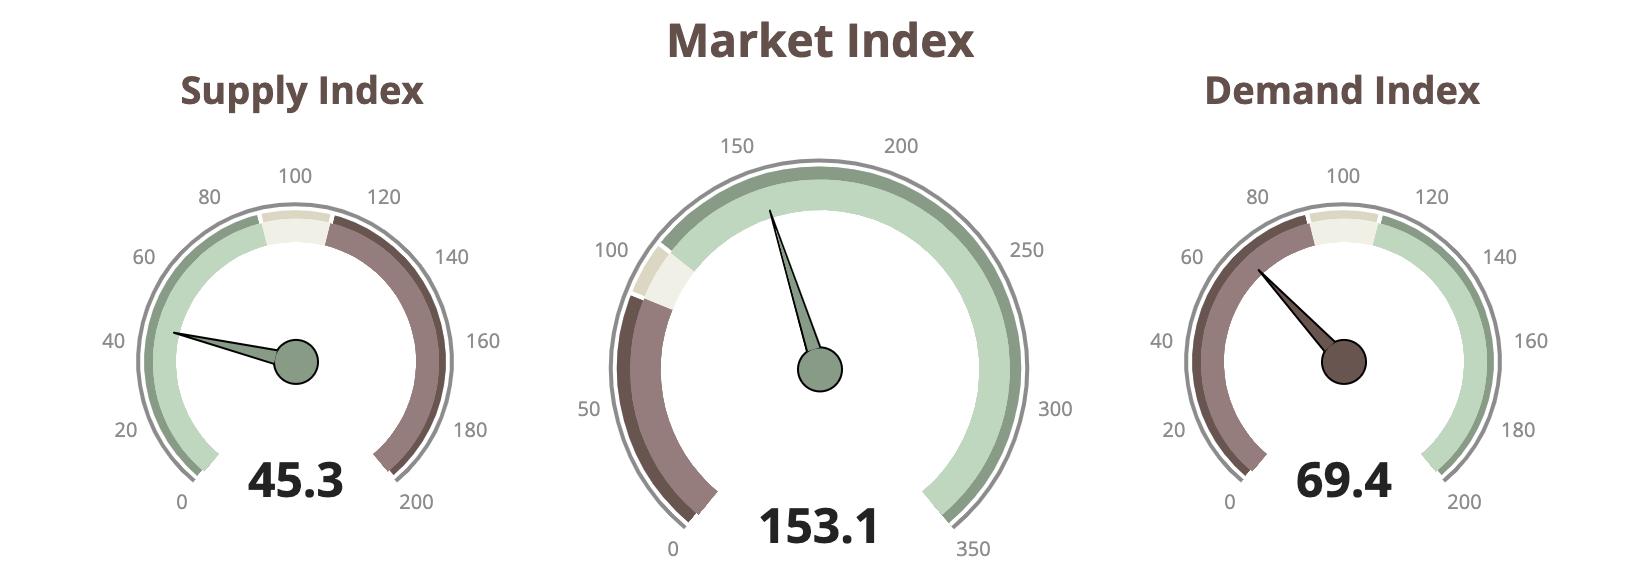
SUPPLY TREND
The Supply Trend Index increased a slight 0 9 pts in the last month
MARKET INDEX
The 100 mark represents the index value for a balanced market A value above 100 represents a market that favors a seller A value below 100 represents a market that favors a buyer. The Market Index Trend is up a minimal 0 8 pts in the last month
DEMAND TREND
The Demand Index Trend is up a small 1 8 pts in the last month
SELLER'S MARKET BALANCED BUYER'S MARKET 100 BELOW 100 ABOVE 100
C R O M F O R D M A R K E T I N D E X | A L L A R E A S & T Y P E S H O U S E R E P O R T | P A G E 2 DATA SOURCE: ARIZONA REGIONAL MULTIPLE LISTING SERVICE, INC (ARMLS) & CROMFORD ASSOCIATES LLC
TRENDS
CROMFORD MARKET INDEX
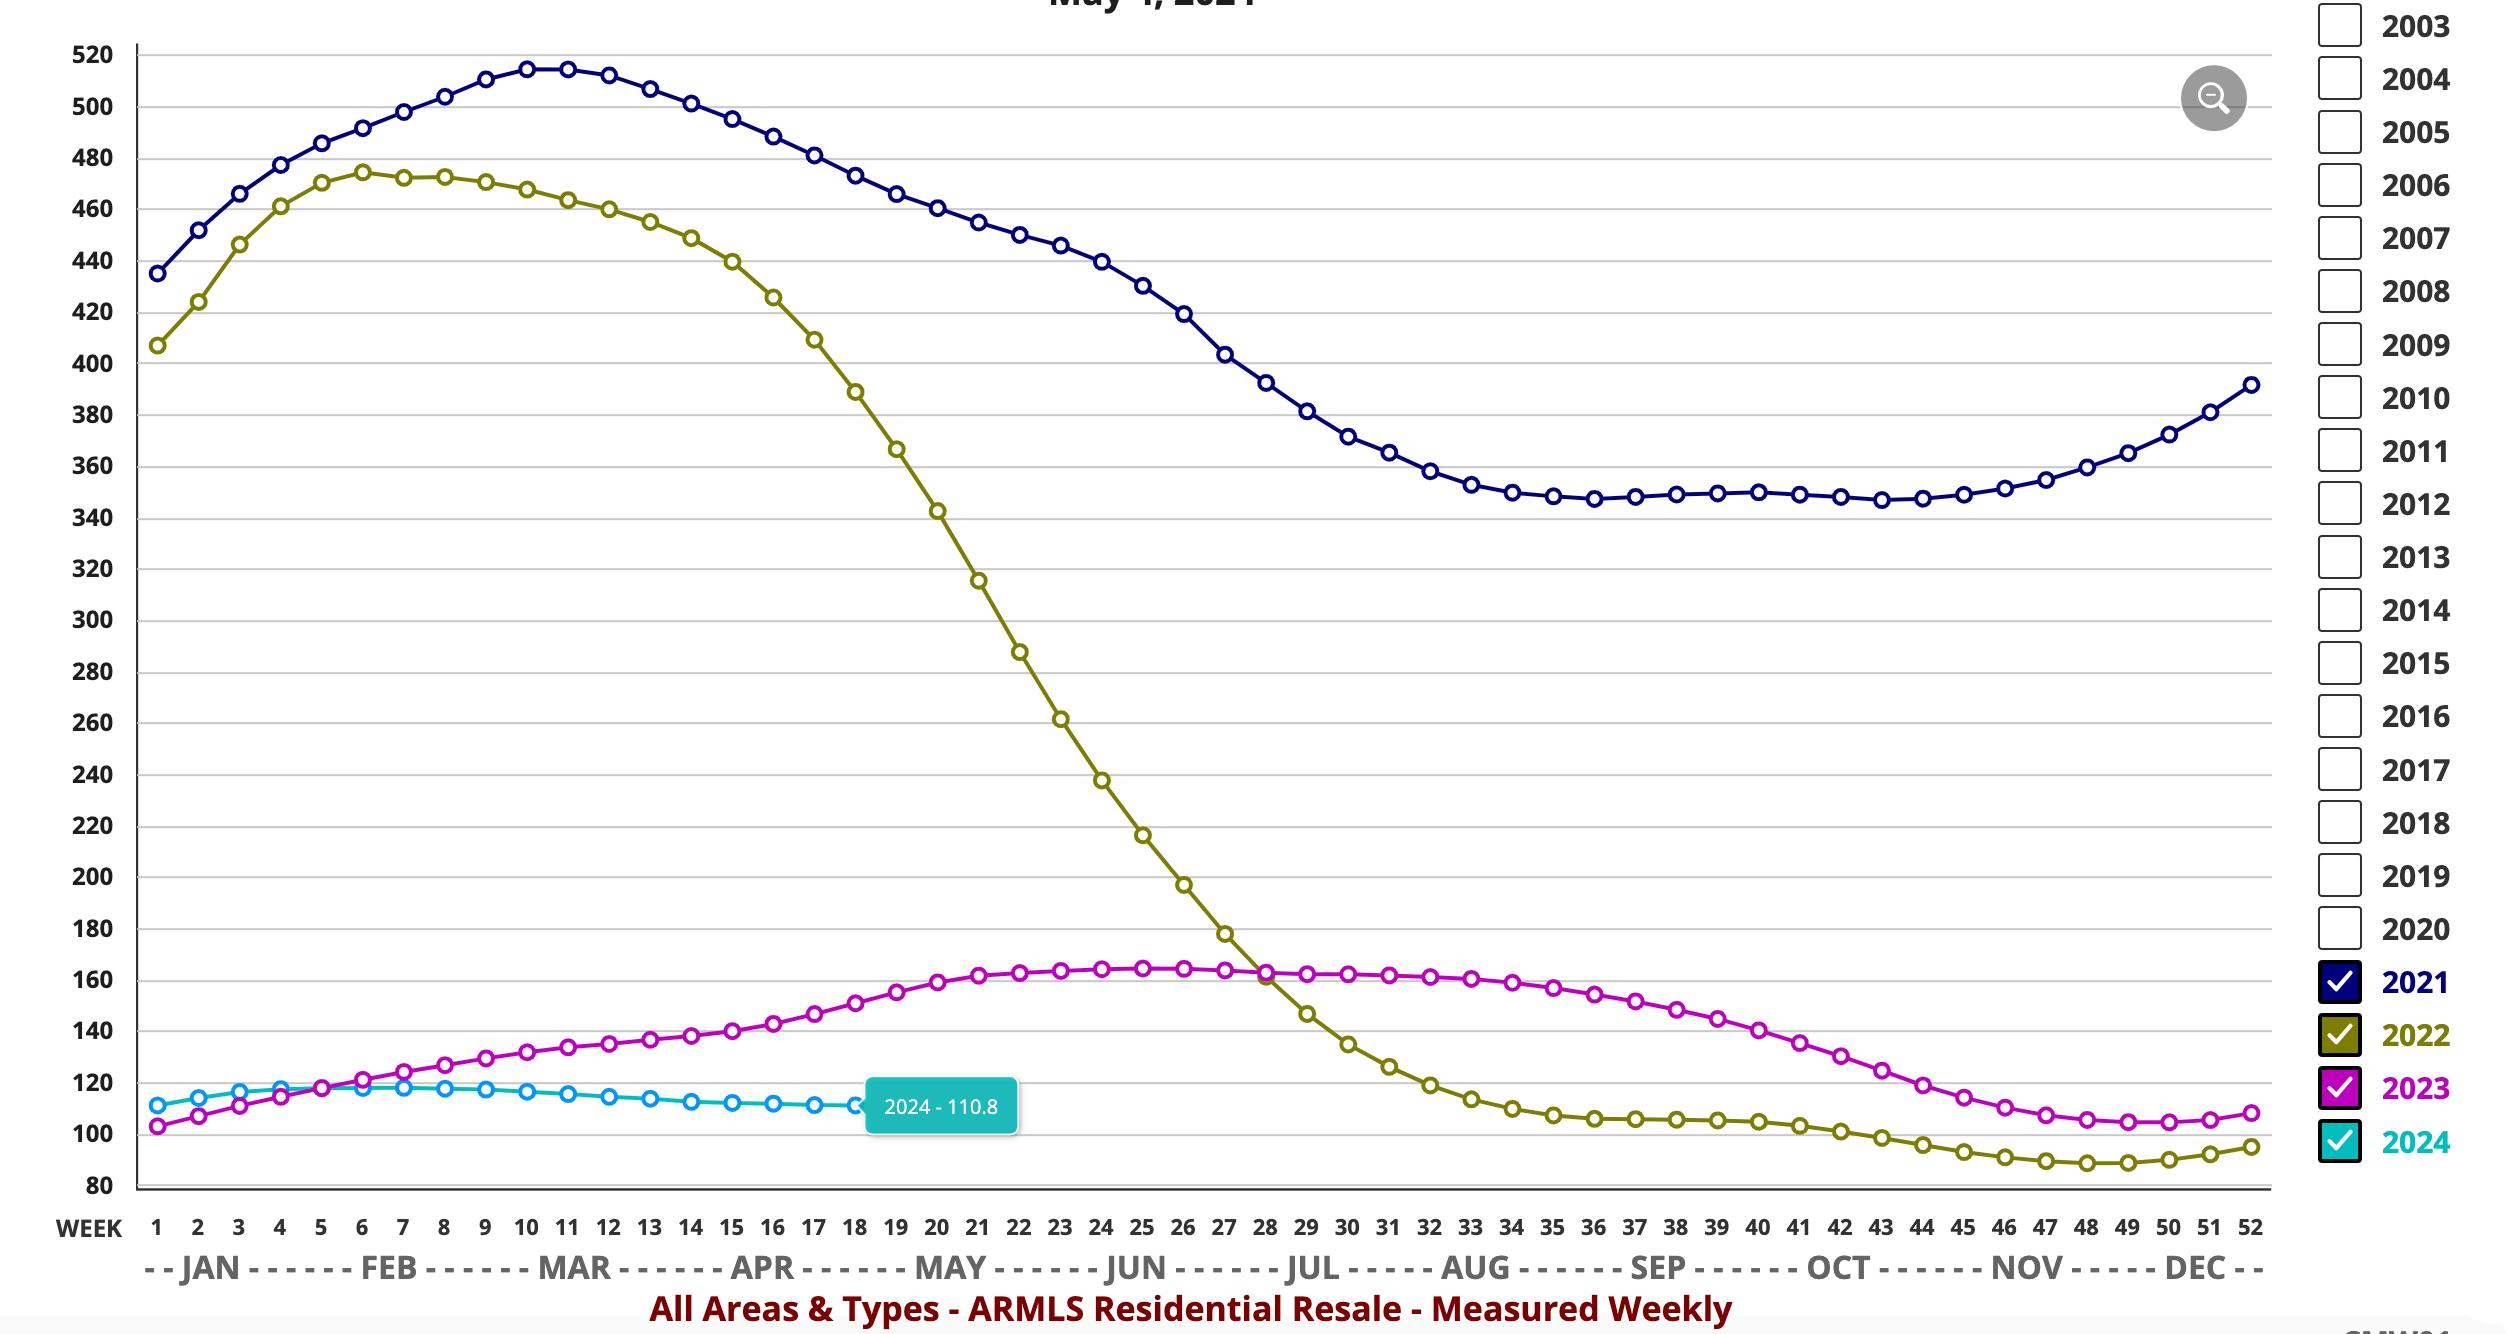
MARKET HIGH
The Market Index was 514 at the height of the market in May 2021
2024 EXPECTATIONS
Entering into 2024 we would say a case for (very) mild optimism can be made. There is certainly no sign whatsoever of a housing market crash
MARKET LOW
In the late Spring of 2022, the market decelerated quickly The lowest Market Index of 88.3 was seen in December 2022.
DATA SOURCE: ARIZONA REGIONAL MULTIPLE LISTING SERVICE, INC (ARMLS) & CROMFORD ASSOCIATES LLC
T H R E E Y E A R | A L L A R E A S & T Y P E S H O U S E R E P O R T | P A G E 3
PRICING
The monthly median sales price trend down 12% since last year The monthly average price per square foot trends up 6 1% YOY
INVENTORY
Active listings (excluding UBC) are up 22% YOY and months of inventory is up 34 7% from 1 9 to 2 7 months YOY Prices are likely to inch upward in the coming months
VOLUME
Overall volume of residential sales for the year is down 7 49% compared to April 2023
AS OF MAY 2023 AS OF MAY 2024 %Δ (yr) 1 MONTH AGO %Δ (1 mo) ACTIVE LISTINGS (excluding under contract) 12,503 17,129 37% 17,025 0 06% ACTIVE LISTINGS (including under contract) 16,248 20,979 29% 20,441 2.6% PENDING LISTINGS 6,224 5,486 -11 9% 5,185 2 1% LISTINGS UNDER CONTRACT 9,969 9,336 -6.3% 8,601 8.5% DAYS ON MARKET 73 66 -10.07% 67 -1.5% MONTHS OF INVENTORY 1 7 mo 2 5mo 31 8% 2 5 mo 0% SALES PER MONTH 6,690 7,016 4 9% 6,769 3 6% SALES PER YEAR 75,541 71,661 -5 3% 71,195 -0 65% MONTHLY AVERAGE SALES PRICE PER SQ. FT $279.74 $306.90 9.71% $294.06 4.4% MONTHLY MEDIAN SALES PRICE $425,000 $450,000 5.9% $445,000 1.1% H O U S E R E P O R T | P A G E 4
TRENDS Y E A R O V E R Y E A R | A L L A R E A S & T Y P E S DATA SOURCE: ARIZONA REGIONAL MULTIPLE LISTING SERVICE, INC (ARMLS) & CROMFORD ASSOCIATES LLC
Questions or Comments? Email Report author: Nicole Kobrinsky at nicole@housegallery com
6901 East 1st St Suite 103 Scottsdale, Arizona 85251
(480)808-1223 | housegallery com
© 2024 HOUSE GALLERY COLLECTIVE ALL WORLDWIDE RIGHTS RESERVED ALL MATERIAL PRESENTED HEREIN IS INTENDED FOR INFORMATION PURPOSES ONLY WHILE, THIS INFORMATION IS BELIEVED TO BE CORRECT, IT IS REPRESENTED SUBJECT TO ERRORS, OMISSIONS, CHANGES OR WITHDRAWAL WITHOUT NOTICE THIS INFORMATION IS BASED ON DATA FROM ARIZONA REGIONAL MULTIPLE LISTING SERVICE, INC (ARMLS), CROMFORD ASSOCIATES LLC , REALTORS PROPERTY RESOURCE®, LLC AND INTERPRETED BY HOUSE GALLERY COLLECTIVE, LLC DATA HAS BEEN LIMITED TO SALES REPORTED WITHIN THE COUNTY OF MARICOPA BOUNDARIES
IF YOUR PROPERTY IS CURRENTLY LISTED WITH ANOTHER REAL ESTATE BROKER, OR YOUR ARE UNDER A BUYER REPRESENTATION CONTRACT WITH ANOTHER REAL ESTATE BROKER, PLEASE DISREGARD THIS OFFER IT IS NOT OUR INTENTION TO SOLICIT THE OFFERINGS OF OTHER REAL ESTATE BROKERS