Overall Insights
A quick and insightful look at the realities of the real estate market in Phoenix Metro
Highlights
2
3-4
We utilize The Cromford Index™ which is a set of market indicators to measure the balance of supply and demand
Trends
A comprehensive look at more detailed market statistics from a past and current perspective
This set of numbers is a little disappointing, but by no means disastrous On the bright side, closed listing counts for February 2024 managed to exceed February 2023, but only by 0 2% This is not the recovery in volume that so many are impatiently hoping for Also brighter, sales pricing performed better than anticipated and was up 1 7% from last month based on the monthly average sales price per square foot
The monthly median sale price rose by $10,000 too However the rate at which contracts are getting signatures is lower than we expected and much lower than normal We are starting March with only 8,693 listings under contract, down 4.6% from this time last year. And last year was well below normal.
The slow contract signing rate means active listing counts have continued to grow steadily, up by 2,000 since the start of the year Last year we saw a fall of over 1,500 over the same period, because new supply was much scarcer then It was the decline in supply that allowed us to scoff a year ago when Goldman Sachs published their forecast that Arizona home prices would fall to 2008 levels in 2023 That certainly did not happen Prices are now up 8.3% from this time last year. But I suppose we should not be surprised - Goldman Sachs also had a "conviction buy" rating on Wirecard in 2019, the same company that declared insolvency 9 months later when their auditors finally spotted that over $2 billion in Wirecard's cash account did not actually exist
There is still no sign of a market crash in the short or medium term, but the market is struggling to gain traction. The healthy amount of incoming supply is not quite matched by a small improvement in demand and the balance between sellers and buyers only favors sellers by a small amount when considering the market as a whole. In many sectors of the market, buyers have more negotiating room, even though, judging by the recent price movements, most of them do not seem to realize this
At the top end of the market we have a lot of supply
Over $10 million, there are 76 active listings - this is 2 6 years of supply at the current closing rate of 29 per year
Between $5 million and $10 million, there are 221 active listings - this is 16 months of supply at the current closing rate of 164 per year
Between $3 million and $5 million, there are 319 active listings - this is 8 months of supply at the current closing rate of 455 per year.
In certain outlying areas, we also have plenty of active listings Examples include Casa Grande, Maricopa and Buckeye But many cities that are closer to Phoenix and are dominated by homes under $1 million still have a tight supply and buyers outnumber sellers in most of these areas.
Market conditions are currently quite stable, so the idea that some sort of collapse is imminent is extremely far-fetched However conditions can and often do change with little notice, so it is always worth to keeping a close eye on the key numbers
Nicole Kobrinsky
PRESIDENT & BROKER OF RECORD
H O U S E R E P O R T | P A G E 1
DATA SOURCE: ARIZONA REGIONAL MULTIPLE LISTING SERVICE, INC (ARMLS) & CROMFORD ASSOCIATES LLC
OVERALL INSIGHTS
MARKET TYPE
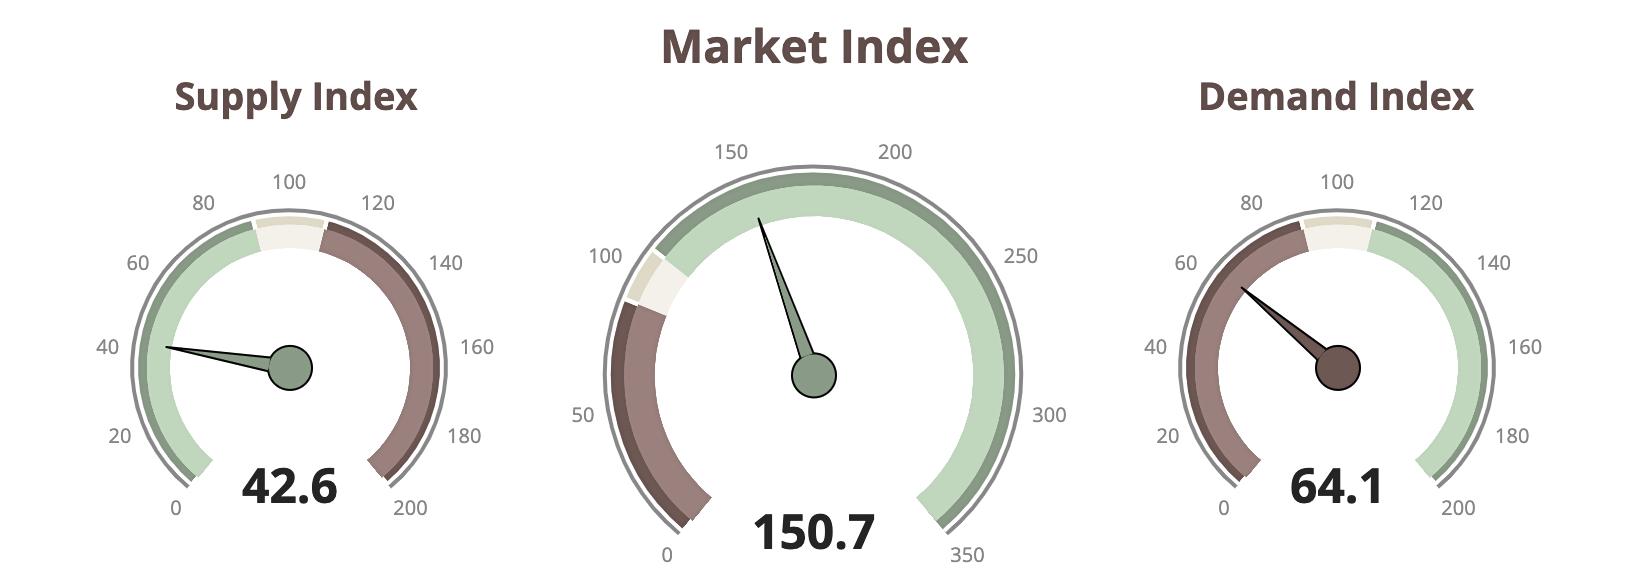
SUPPLY TREND
The Supply Trend Index increased a slight 1 1 pts in the last month
MARKET INDEX
The 100 mark represents the index value for a balanced market A value above 100 represents a market that favors a seller A value below 100 represents a market that favors a buyer. The Market Index Trend is up a slight 2 5 pts in the last month
DEMAND TREND
The Demand Index Trend is up 2 5 pts in the last month
SELLER'S MARKET BALANCED BUYER'S MARKET 100 BELOW 100 ABOVE 100
C R O M F O R D M A R K E T I N D E X | A L L A R E A S & T Y P E S H O U S E R E P O R T | P A G E 2 DATA SOURCE: ARIZONA REGIONAL MULTIPLE LISTING SERVICE, INC (ARMLS) & CROMFORD ASSOCIATES LLC
HIGHLIGHTS
TRENDS
CROMFORD MARKET INDEX
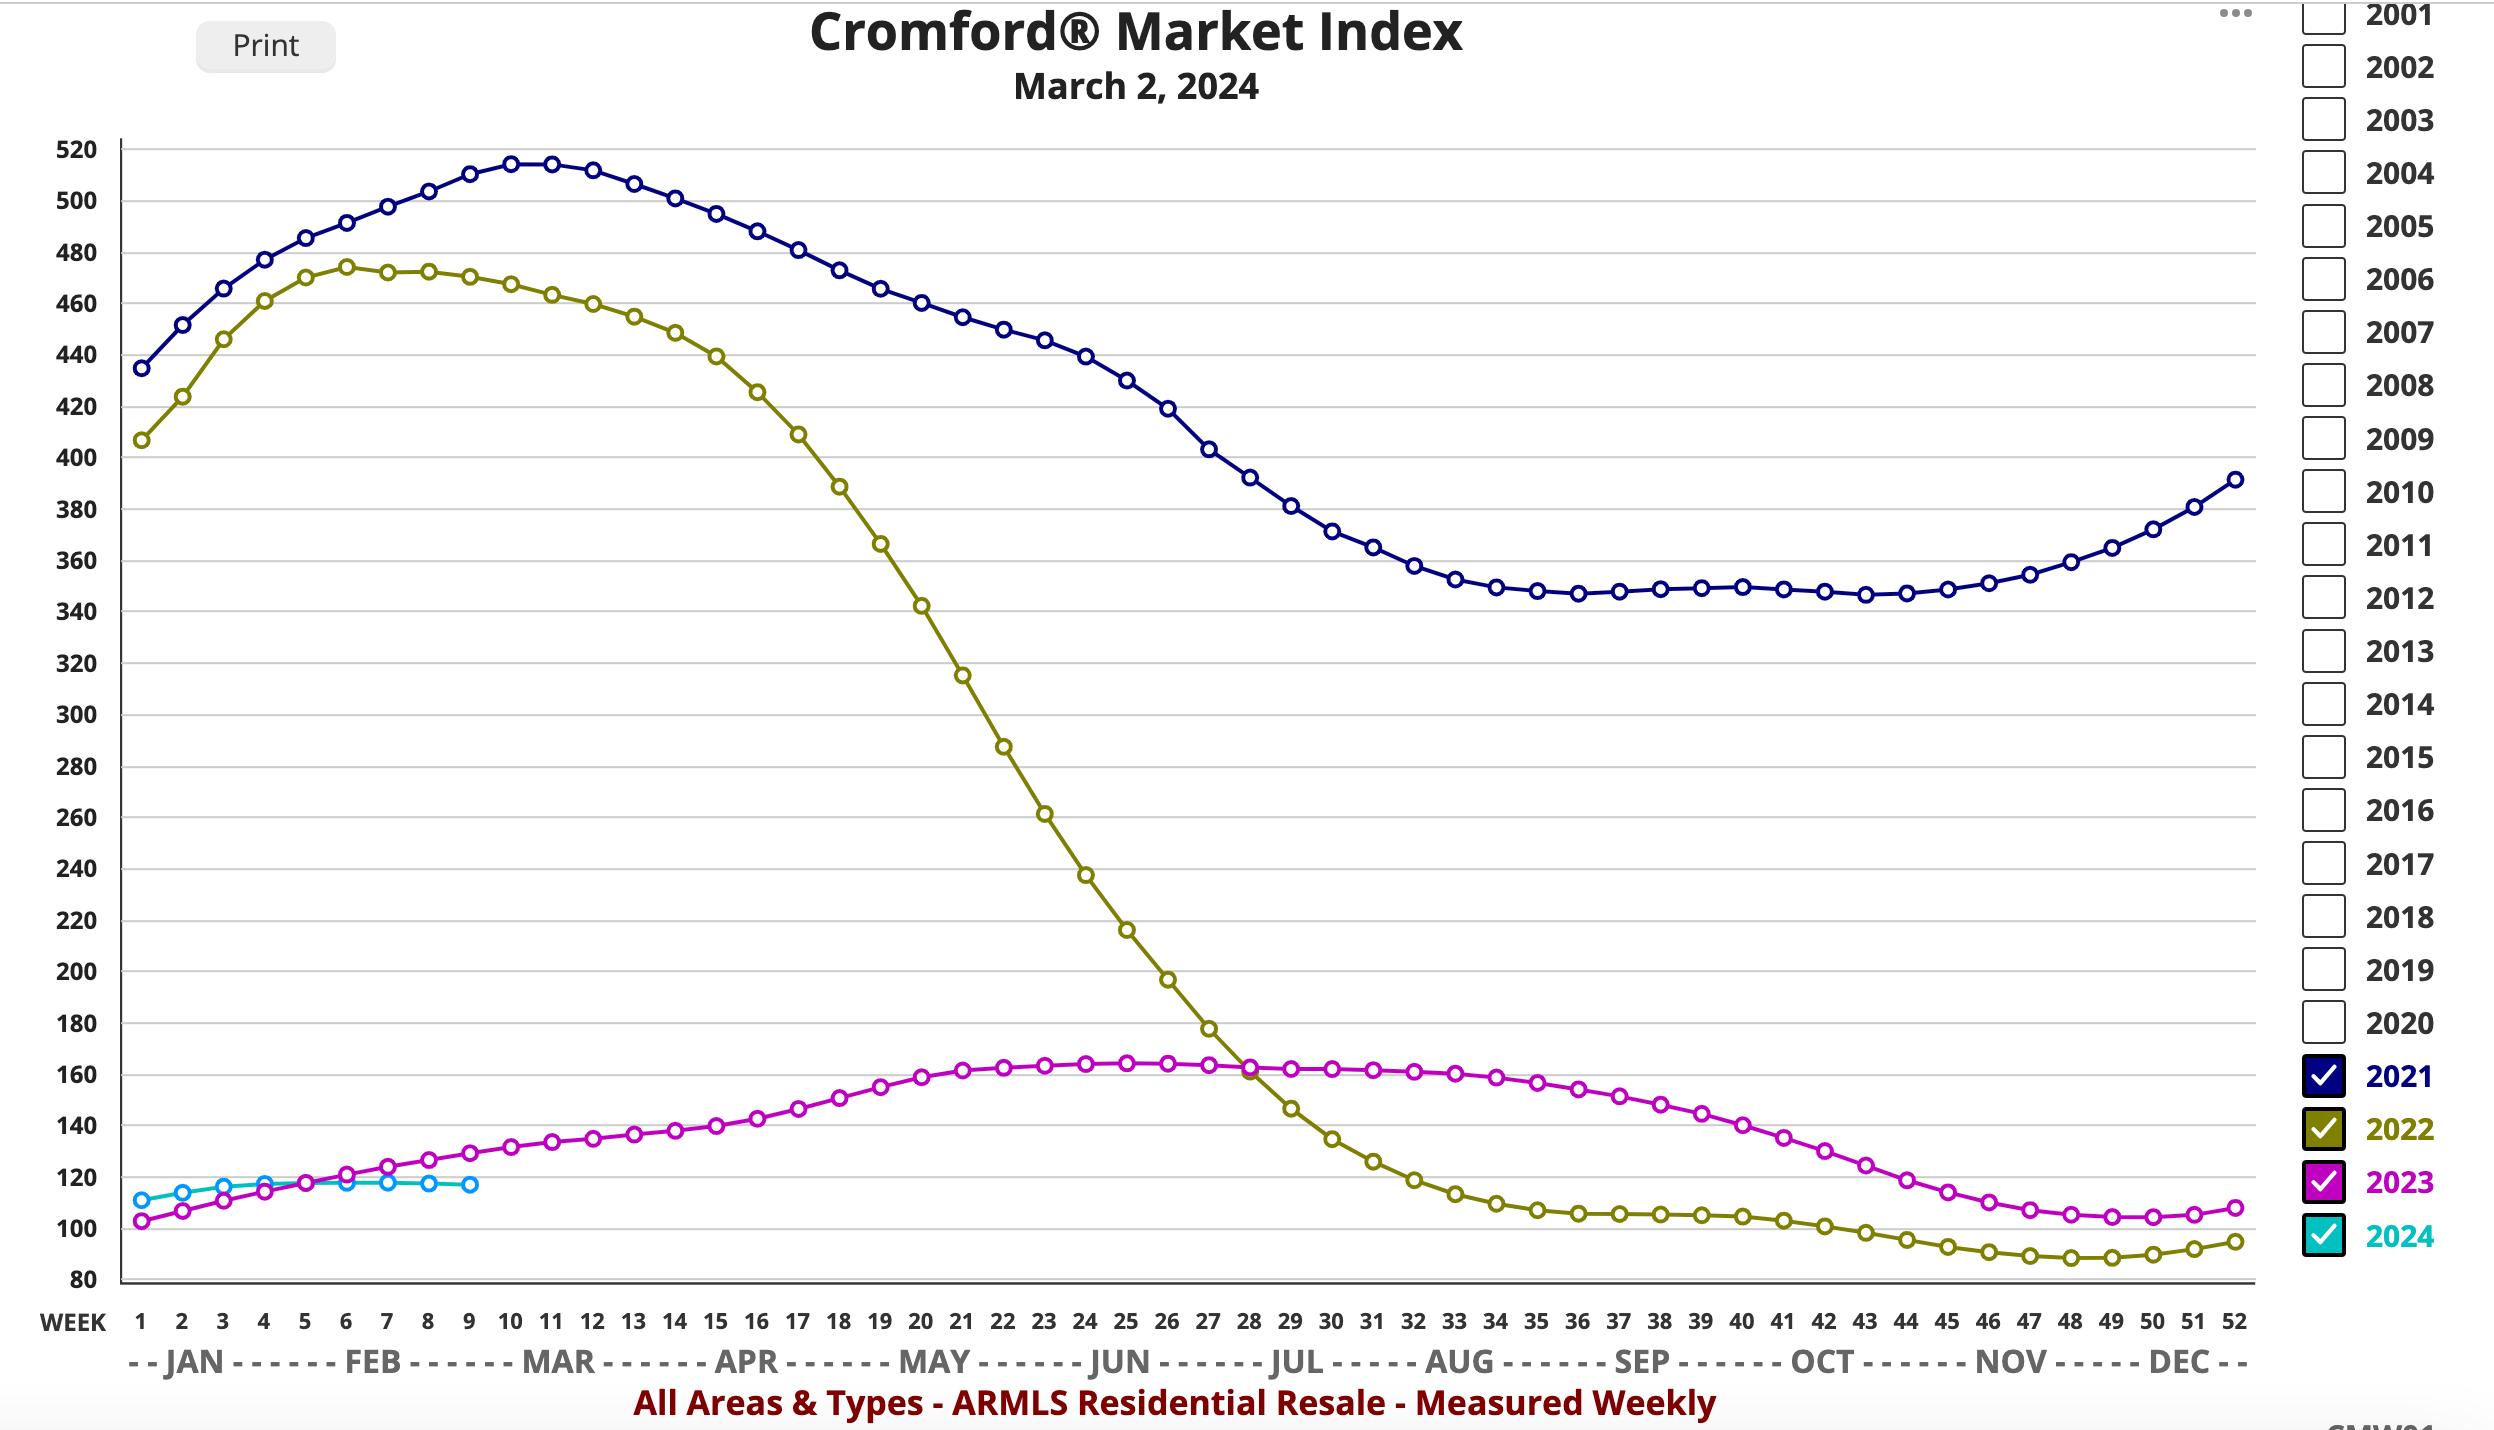
MARKET HIGH
The Market Index was 514 at the height of the market in May 2021
2024 EXPECTATIONS
Entering into 2024 we would say a case for (very) mild optimism can be made. There is certainly no sign whatsoever of a housing market crash
MARKET LOW
In the late Spring of 2022, the market decelerated quickly The lowest Market Index of 88.3 was seen in December 2022.
DATA SOURCE: ARIZONA REGIONAL MULTIPLE LISTING SERVICE, INC (ARMLS) & CROMFORD ASSOCIATES LLC
T H R E E Y E A R | A L L A R E A S & T Y P E S H O U S E R E P O R T | P A G E 3
TRENDS
PRICING
The monthly median sales price trend up a slight 0 2% since last year The monthly average price per square foot trends up 8 3% YOY
INVENTORY
Active listings (excluding UBC) are up 12% YOY and months of inventory is up 12% from 2 5 to 2 8 months YOY Prices are likely to inch upward in the coming months
VOLUME
Overall volume of residential sales for the year is down 9 61% compared to March 2023
AS OF MARCH 2023 AS OF MARCH 2024 %Δ (yr) 1 MONTH AGO %Δ (1 mo) ACTIVE LISTINGS (excluding under contract) 14,739 16,568 12% 15,574 6.4% ACTIVE LISTINGS (including under contract) 17,937 19,890 11% 18,421 8% PENDING LISTINGS 5,911 5,371 -9.1% 4,576 17% LISTINGS UNDER CONTRACT 9,109 8,693 -4 6% 7,423 17% DAYS ON MARKET 80 69 -13.75% 70 -1.43% MONTHS OF INVENTORY 2.5 mo 2.8 mo 12% 3.5 mo -20% SALES PER MONTH 5,706 5,720 0.2% 4,435 29% SALES PER YEAR 80,006 72,317 -9 61% 72,448 -0 18% MONTHLY AVERAGE SALES PRICE PER SQ. FT $271.11 $293.70 8.3% $288.74 1.7% MONTHLY MEDIAN SALES PRICE $413,000 $440,000 6 5% $430,000 2 3% H O U S E R E P O R T | P A G E 4
Y E A R O V E R Y E A R | A L L A R E A S & T Y P E S DATA SOURCE: ARIZONA REGIONAL MULTIPLE LISTING SERVICE, INC (ARMLS) & CROMFORD ASSOCIATES LLC
Questions or Comments? Email Report author: Nicole Kobrinsky at nicole@housegallery com
6901 East 1st St Suite 103 Scottsdale, Arizona 85251 (480)808-1223 | housegallery com
© 2024 HOUSE GALLERY COLLECTIVE ALL WORLDWIDE RIGHTS RESERVED ALL MATERIAL PRESENTED HEREIN IS INTENDED FOR INFORMATION PURPOSES ONLY WHILE, THIS INFORMATION IS BELIEVED TO BE CORRECT, IT IS REPRESENTED SUBJECT TO ERRORS, OMISSIONS, CHANGES OR WITHDRAWAL WITHOUT NOTICE THIS INFORMATION IS BASED ON DATA FROM ARIZONA REGIONAL MULTIPLE LISTING SERVICE, INC (ARMLS), CROMFORD ASSOCIATES LLC , REALTORS PROPERTY RESOURCE®, LLC AND INTERPRETED BY HOUSE GALLERY COLLECTIVE, LLC DATA HAS BEEN LIMITED TO SALES REPORTED WITHIN THE COUNTY OF MARICOPA BOUNDARIES
IF YOUR PROPERTY IS CURRENTLY LISTED WITH ANOTHER REAL ESTATE BROKER, OR YOUR ARE UNDER A BUYER REPRESENTATION CONTRACT WITH ANOTHER REAL ESTATE BROKER, PLEASE DISREGARD THIS OFFER IT IS NOT OUR INTENTION TO SOLICIT THE OFFERINGS OF OTHER REAL ESTATE BROKERS