1 A quick and insightful look at the realities of the real estate market in Phoenix Metro
2 We utilize The Cromford Index™ which is a set of market indicators to measure the balance of supply and demand
3-4 A comprehensive look at more detailed market statistics from a past and current perspective
OVERALL INSIGHTS
The first half of 2024 has been a very subdued periods for Greater Phoenix's residential real estate The market is not in trouble, but the closing volumes have been far below normal and buyer enthusiasm is unusually weak and getting worse. Supply is significantly higher than last year, but remains below normal and shows a few signs of starting to decline at last. The weak demand is currently well matched and we are in a balanced market overall, though significant variation can be found among sub-markets based on location and price range Compared with buyer's desires there is too much supply on the outer fringes and not enough in the center of the valley.
On the bright side, distress remains extremely low with pending foreclosures and completed foreclosures few in number. We read that the average credit rating of successful home buyers taking out mortgages are higher than they have ever been, so there is almost none of the lending risk that was out of control in the lead-up to the great housing crash of 2007
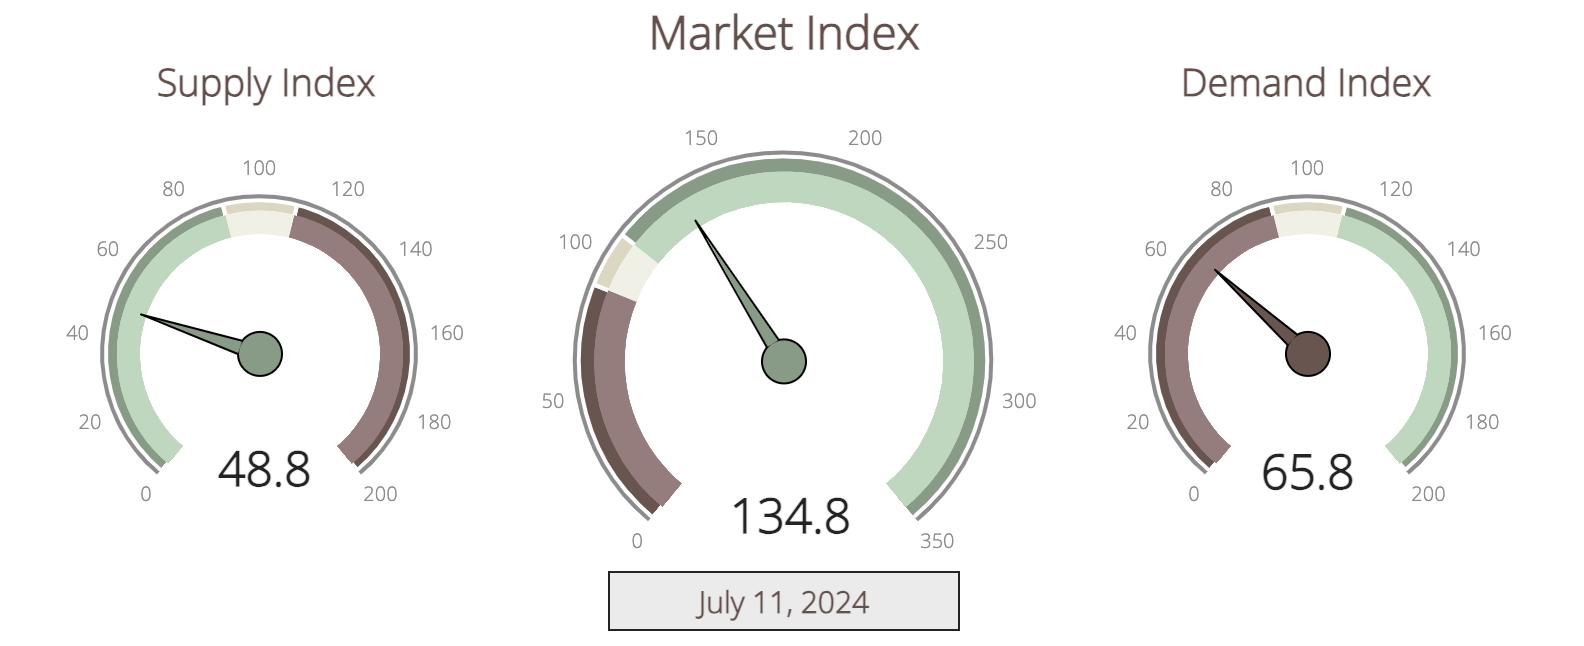
The Cromford® Market Index stands at 102 5, close to the balanced reading of 100, and has dropped slowly over the past month It shows little sign of crashing below 90 at this stage, so alarm bells are not ringing However, sellers are working with fewer buyers than normal and have more competition from other sellers, so compared with most of the past decade, they are having a tougher time.
The average asking price $/SF has fallen a long way over the past 2 months - down 5.6% from $376.65 to $355.68. This is partly because price cuts have been numerous and partly because a lot of high-end listings have been cancelled or expired for the quiet summer period. It is normal for asking prices to fall at this stage in the year, but seasonal patterns are being emphasized by the weakness in demand.
For investors who remain active during the summer months, we see increased gross margins possible from fix and flips, though more effort will probably be required on the selling side then in recent years
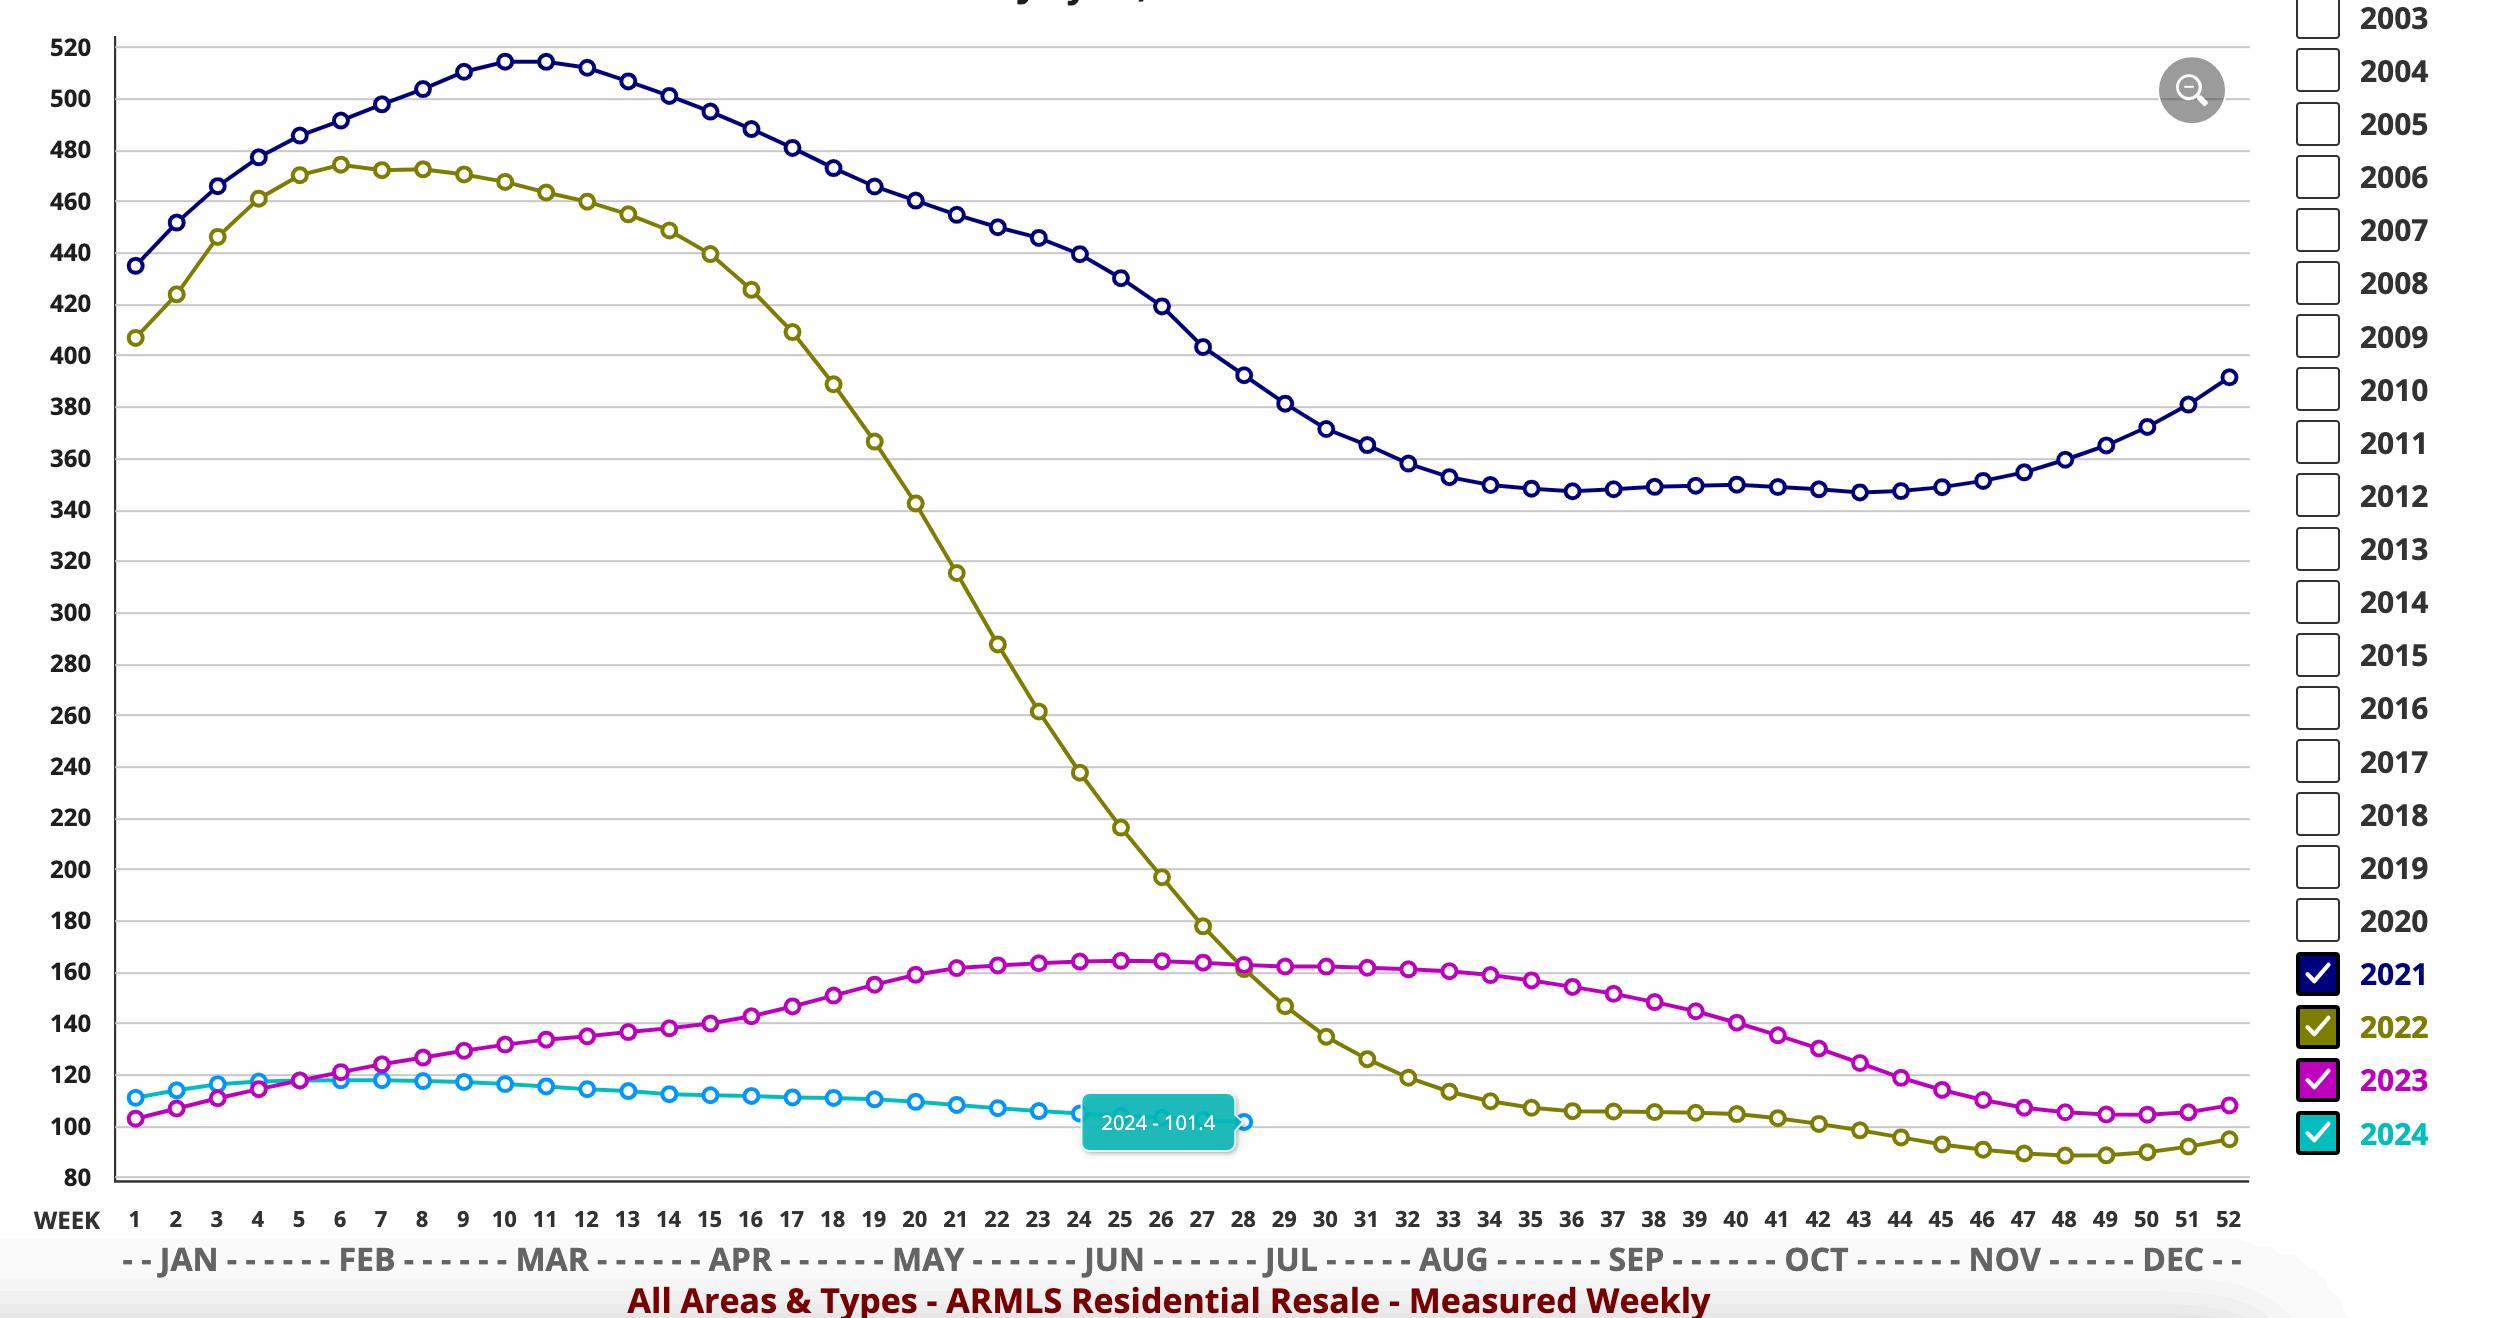
We are firmly into the quiet season and closed sales for June 2024 were already down 15% compared to June 2023. We anticipate low volumes to continue during July and we have 2 to 3 months of seasonal price weakness to endure before the market is likely to pick up steam again in October. This could be jump-started early by a drop in interest rates, but we are not holding our breath
Nicole Kobrinsky PRESIDENT & BROKER OF RECORD
HIGHLIGHTS
MARKET TYPE
SUPPLY TREND
The Supply Trend Index increase 1 pt in the last month
MARKET INDEX
The 100 mark represents the index value for a balanced market A value above 100 represents a market that favors a seller A value below 100 represents a market that favors a buyer. The Market Index Trend is down 6 2 pts in the last month
DEMAND TREND
The Demand Index Trend is down a small 1 6 pts in the last month
TRENDS
CROMFORD MARKET INDEX
MARKET HIGH
The Market Index was 514 at the height of the market in May 2021
EXPECTATIONS
We anticipate low volumes to continue during July and we have 2 to 3 months of seasonal price weakness to endure before the market is likely to pick up steam again in October
MARKET LOW
In the late Spring of 2022, the market decelerated quickly The lowest Market Index of 88.3 was seen in December 2022.
PRICING
The monthly median sales price trend down 15% since last year The monthly average price per square foot trends up 2 7% YOY
INVENTORY
Active listings (excluding UBC) are up 47% YOY and months of inventory is up 76 4% from 1 7 to 3 0 months YOY Prices are likely to inch upward in the coming months
VOLUME
Overall volume of residential sales for the year is down 4 65% compared to July 2023
Questions or Comments? Email Report author: Nicole Kobrinsky at nicole@housegallery com
6901 East 1st St Suite 103 Scottsdale, Arizona 85251
IF YOUR PROPERTY IS CURRENTLY LISTED WITH ANOTHER REAL ESTATE BROKER, OR YOUR ARE UNDER A BUYER REPRESENTATION CONTRACT WITH ANOTHER REAL ESTATE BROKER, PLEASE DISREGARD THIS OFFER IT IS NOT OUR INTENTION TO SOLICIT THE OFFERINGS OF OTHER REAL ESTATE BROKERS