1 A quick and insightful look at the realities of the real estate market in Phoenix Metro
Highlights
2 We utilize The Cromford Index™ which is a set of market indicators to measure the balance of supply and demand
3-4 A comprehensive look at more detailed market statistics from a past and current perspective
OVERALL INSIGHTS
Active listing counts peaked at last on Nov 24 at just over 22,000 and have started to decline This is a seasonal pattern that usually repeats every year with the declining pattern lasting for 5 to 8 weeks The peak was later than average but we are now up 35% from last year, which is an improvement compared with 40% last month, at least from a seller's perspective.
There were 21 working days in November 2024, and 22 in November 2023 This means we could have expected a 4 5% annual decline in monthly closings Instead we got an 11% increase This is a positive sign that demand is no longer declining. This is reinforced by the annual sales rate which reached a low point of 69,527 at the end of September but has now crept up to the 71,000 mark. This remains low compared to normal, but at least the trend is upwards again.
Under contract counts also look better than this time last year - up 9%, but they fell back almost 8% from last month and remain at a weak level.
Overall, demand is showing a few signs of life with the Cromford® Demand Index up to 77 from the low point of 73.1 we saw in September. However the Cromford® Supply Index has risen from 75 to 89 over the same period, so buyers have benefited from more choice and sellers are suffering increased competition.
Pricing remains subdued and stable with the monthly average $/SF for closed listings almost unchanged from this time last year With the Cromford® Market Index below 90 and contract ratio hovering around 30, there is almost no upward pricing pressure and downward pressure in the outer fringes of the Greater Phoenix area. But the high-end luxury market is far more buoyant than the mainstream and this is tending to support the $/SF readings, especially for pending and under contract listings, where high-end properties have an out-sized impact
The luxury market is feeding off the higher pricing in the stock and crypto markets but the mainstream housing market is still waiting for better news on mortgage rates.
Nicole Kobrinsky PRESIDENT & BROKER OF RECORD
HIGHLIGHTS
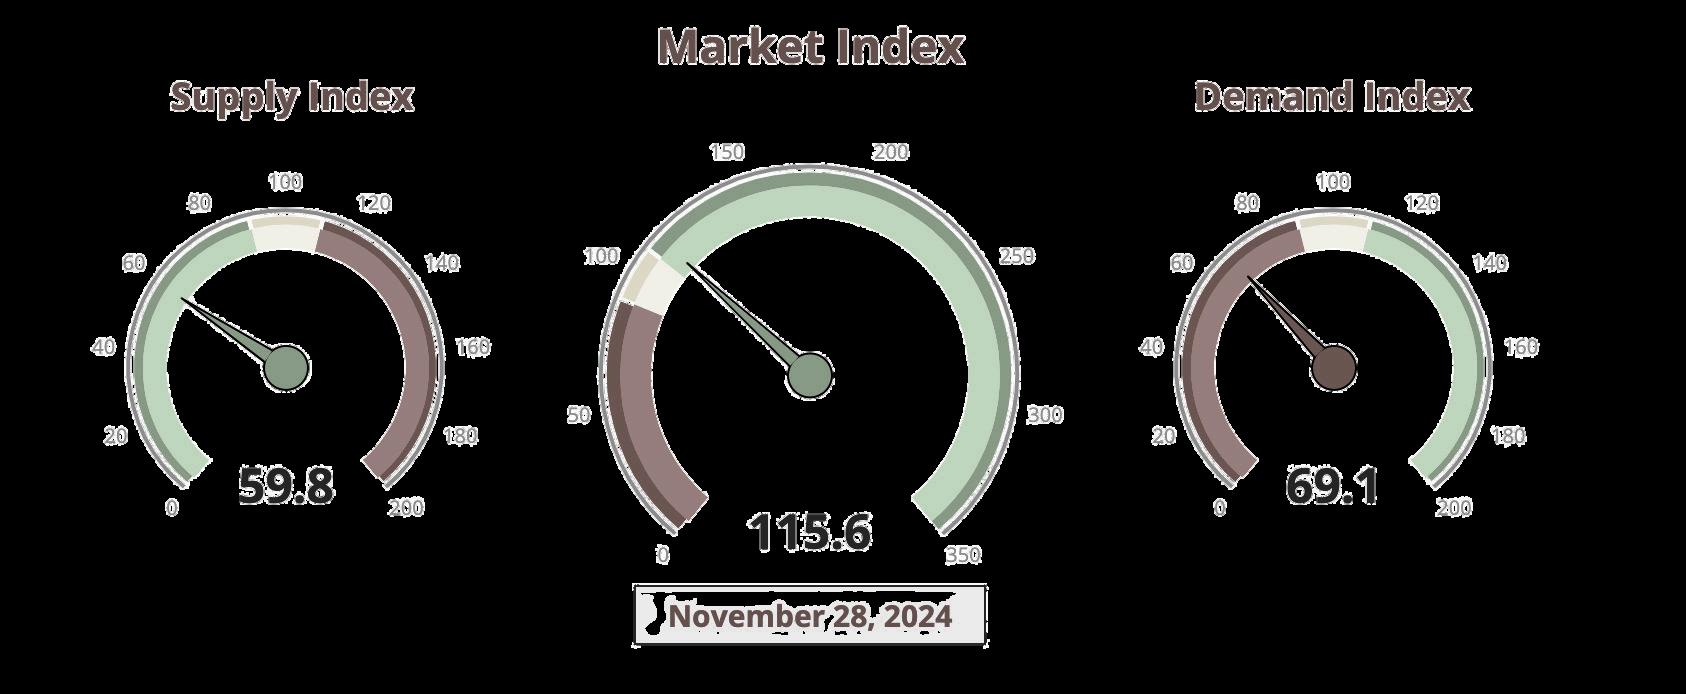
MARKET TYPE
SUPPLY TREND
The Supply Trend Index has has increased 0.7 pts since last month.
MARKET INDEX
The 100 mark represents the index value for a balanced market. A value above 100 represents a market that favors a seller. A value below 100 represents a market that favors a buyer. The Market Index Trend is up 3.2 pts in the last month.
DEMAND TREND
The Demand Index Trend is up a small 2.6 pts in the last month
TRENDS
GAUGES
MARKET HIGH
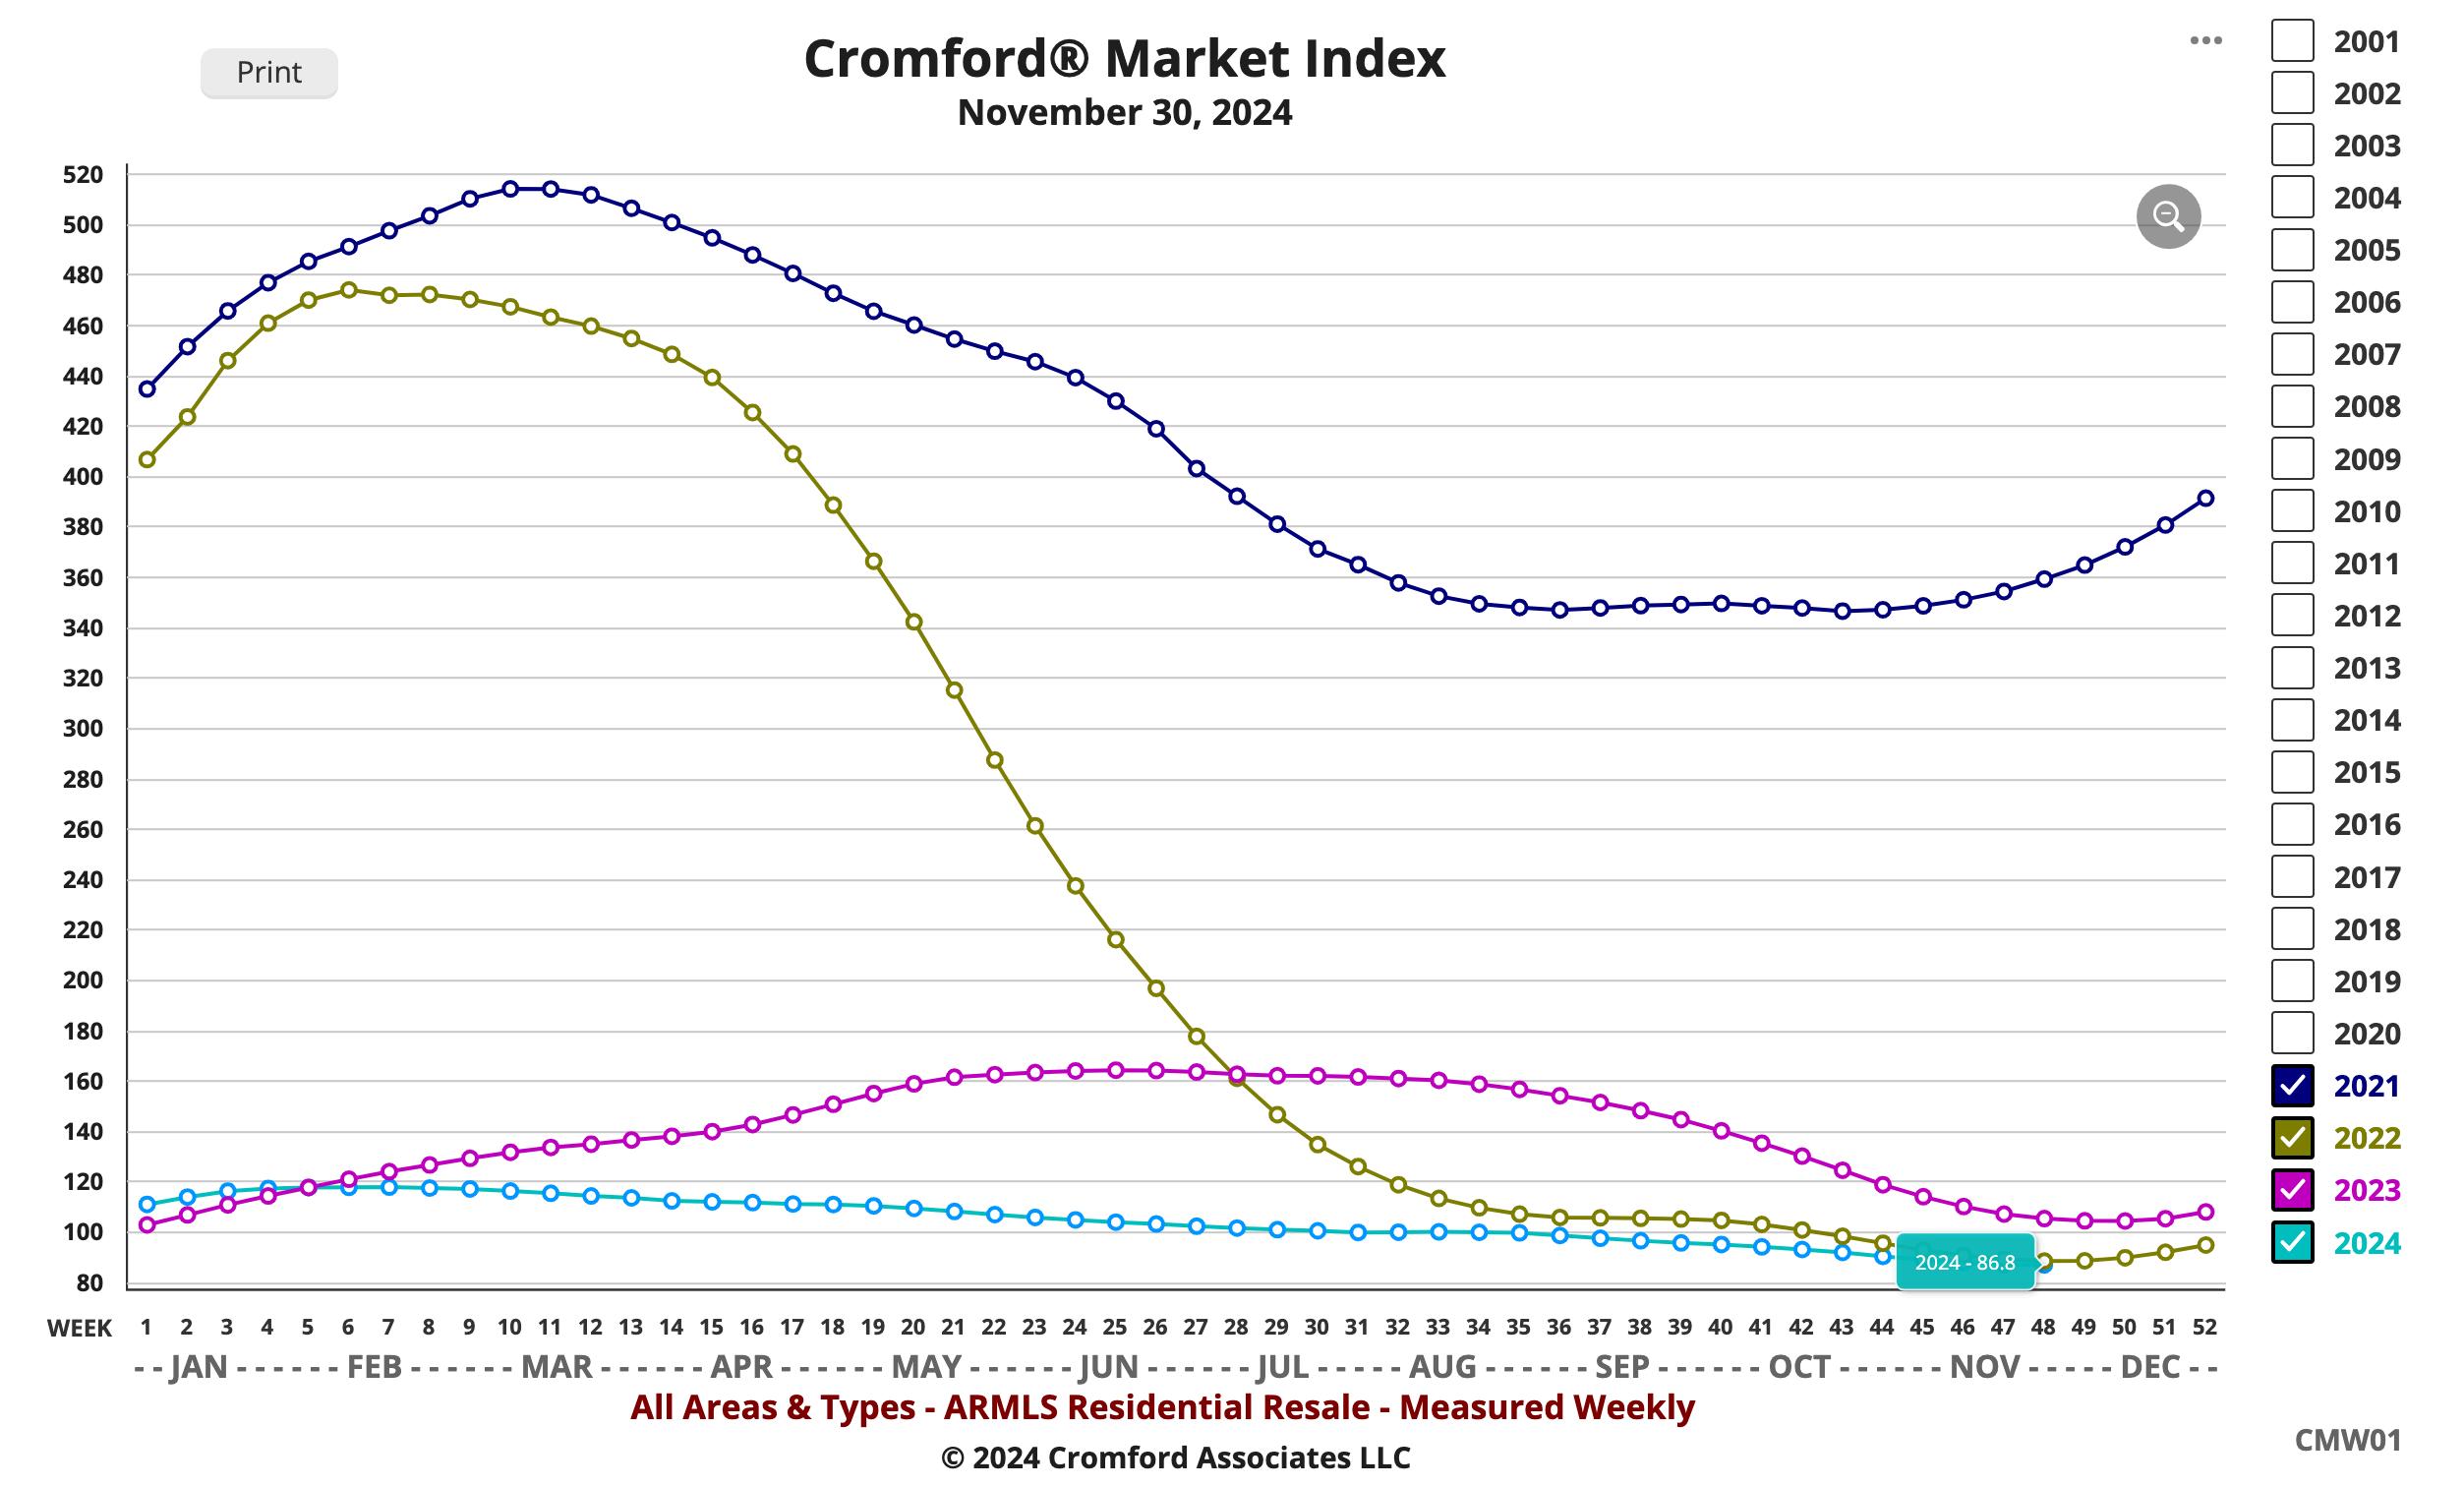
The Market Index was 514 at the height of the market in May 2021.
EXPECTATIONS
After low volumes and months of seasonal price weakness, the market is starting to pick up steam again.
MARKET LOW
In the late Spring of 2022, the market decelerated quickly. A Market Index of 88.3 was seen in December 2022. We appear to be in a similar market two years later
CROMFORD MARKET INDEX
PRICING
The monthly median sales price remained the same The monthly average price per square foot trends up 0.2% YOY. Pricing remains subdued and stable.
INVENTORY
Active listings (excluding UBC) are up 35% YOY and months of inventory is up 22.9% from 3.5 to 4.0 months YOY.
VOLUME
Overall volume of residential sales for the year is down 1 8% compared to December 2023.
Questions or Comments? Email Report author: Nicole Kobrinsky at nicole@housegallery com
6901 East 1st St Suite 103 Scottsdale, Arizona 85251
IF YOUR PROPERTY IS CURRENTLY LISTED WITH ANOTHER REAL ESTATE BROKER, OR YOUR ARE UNDER A BUYER REPRESENTATION CONTRACT WITH ANOTHER REAL ESTATE BROKER, PLEASE DISREGARD THIS OFFER IT IS NOT OUR INTENTION TO SOLICIT THE OFFERINGS OF OTHER REAL ESTATE BROKERS