OVERALL INSIGHTS
Supply continued to grow during March, which is very unusual for the time of year. However it only grew 2.8% so did not exactly pile up and remains well below normal. Not too much extra competition for sellers and a welcome increase in available choice for buyers
Demand remains low and the number of pending listings fell 3.5% from last month and stands over 9% below this time last year. Although the March closed listing count was up 17% from February, this is far less of an increase than we would see in a normal year and the monthly total is down as much as 12% from March 2023. Demand has been weak for a long time and is starting to show signs of falling further. The annual sales rate is now down to the lowest it has been since 2009. As we have pointed out many times, demand for new homes remains far stronger than for resales
A one-word summary of the current state of the market would be insipid. Volumes are unusually low but the market is stable and the level of distress remains close to record lows There is also little sign of a significant change in the near term so those hoping for a major drop in prices are no doubt indulging in wishful thinking. We are heading slowly toward balanced market conditions so the prospect for a rapid rise in prices is also minimal.
Everyone is waiting to see if mortgage rates might fall and spark some buyer enthusiasm, but all forecasts of these rates have proven to be unreliable so far.
The only certainty is that things will change at some point and we remain committed to letting you know as soon as that happens
H O U S E R E P O R T | P A G E 1
DATA SOURCE: ARIZONA REGIONAL MULTIPLE LISTING SERVICE, INC (ARMLS) & CROMFORD ASSOCIATES LLC
Nicole Kobrinsky
PRESIDENT & BROKER OF RECORD
SUPPLY TREND
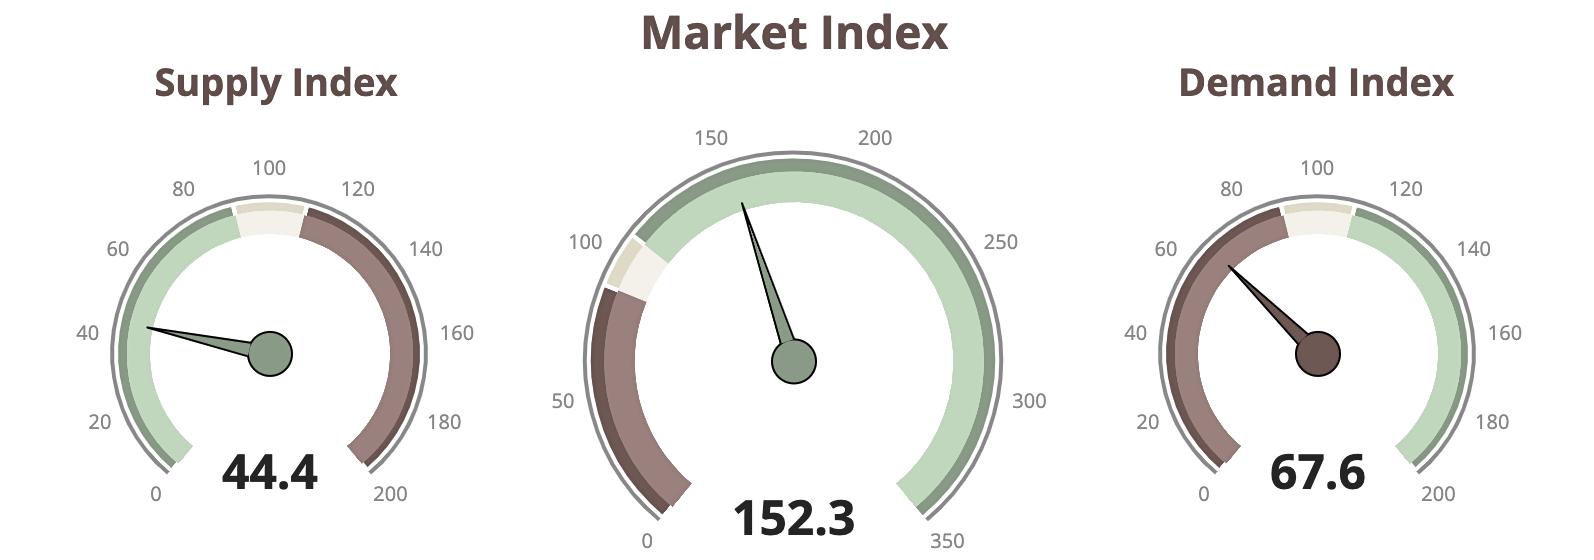
The Supply Trend Index increased a slight 1 8 pts in the last month
MARKET INDEX
The 100 mark represents the index value for a balanced market A value above 100 represents a market that favors a seller A value below 100 represents a market that favors a buyer. The Market Index Trend is up a minimal 1 6 pts in the last month
DEMAND TREND
The Demand Index Trend is up 3 5 pts in the last month
SELLER'S MARKET BALANCED BUYER'S MARKET 100 BELOW 100 ABOVE 100
C R O M F O R D M A R K E T I N D E X | A L L A R E A S & T Y P E S H O U S E R E P O R T | P A G E 2 DATA SOURCE: ARIZONA REGIONAL MULTIPLE LISTING SERVICE, INC (ARMLS) & CROMFORD ASSOCIATES LLC
MARKET TYPE
HIGHLIGHTS
CROMFORD MARKET INDEX
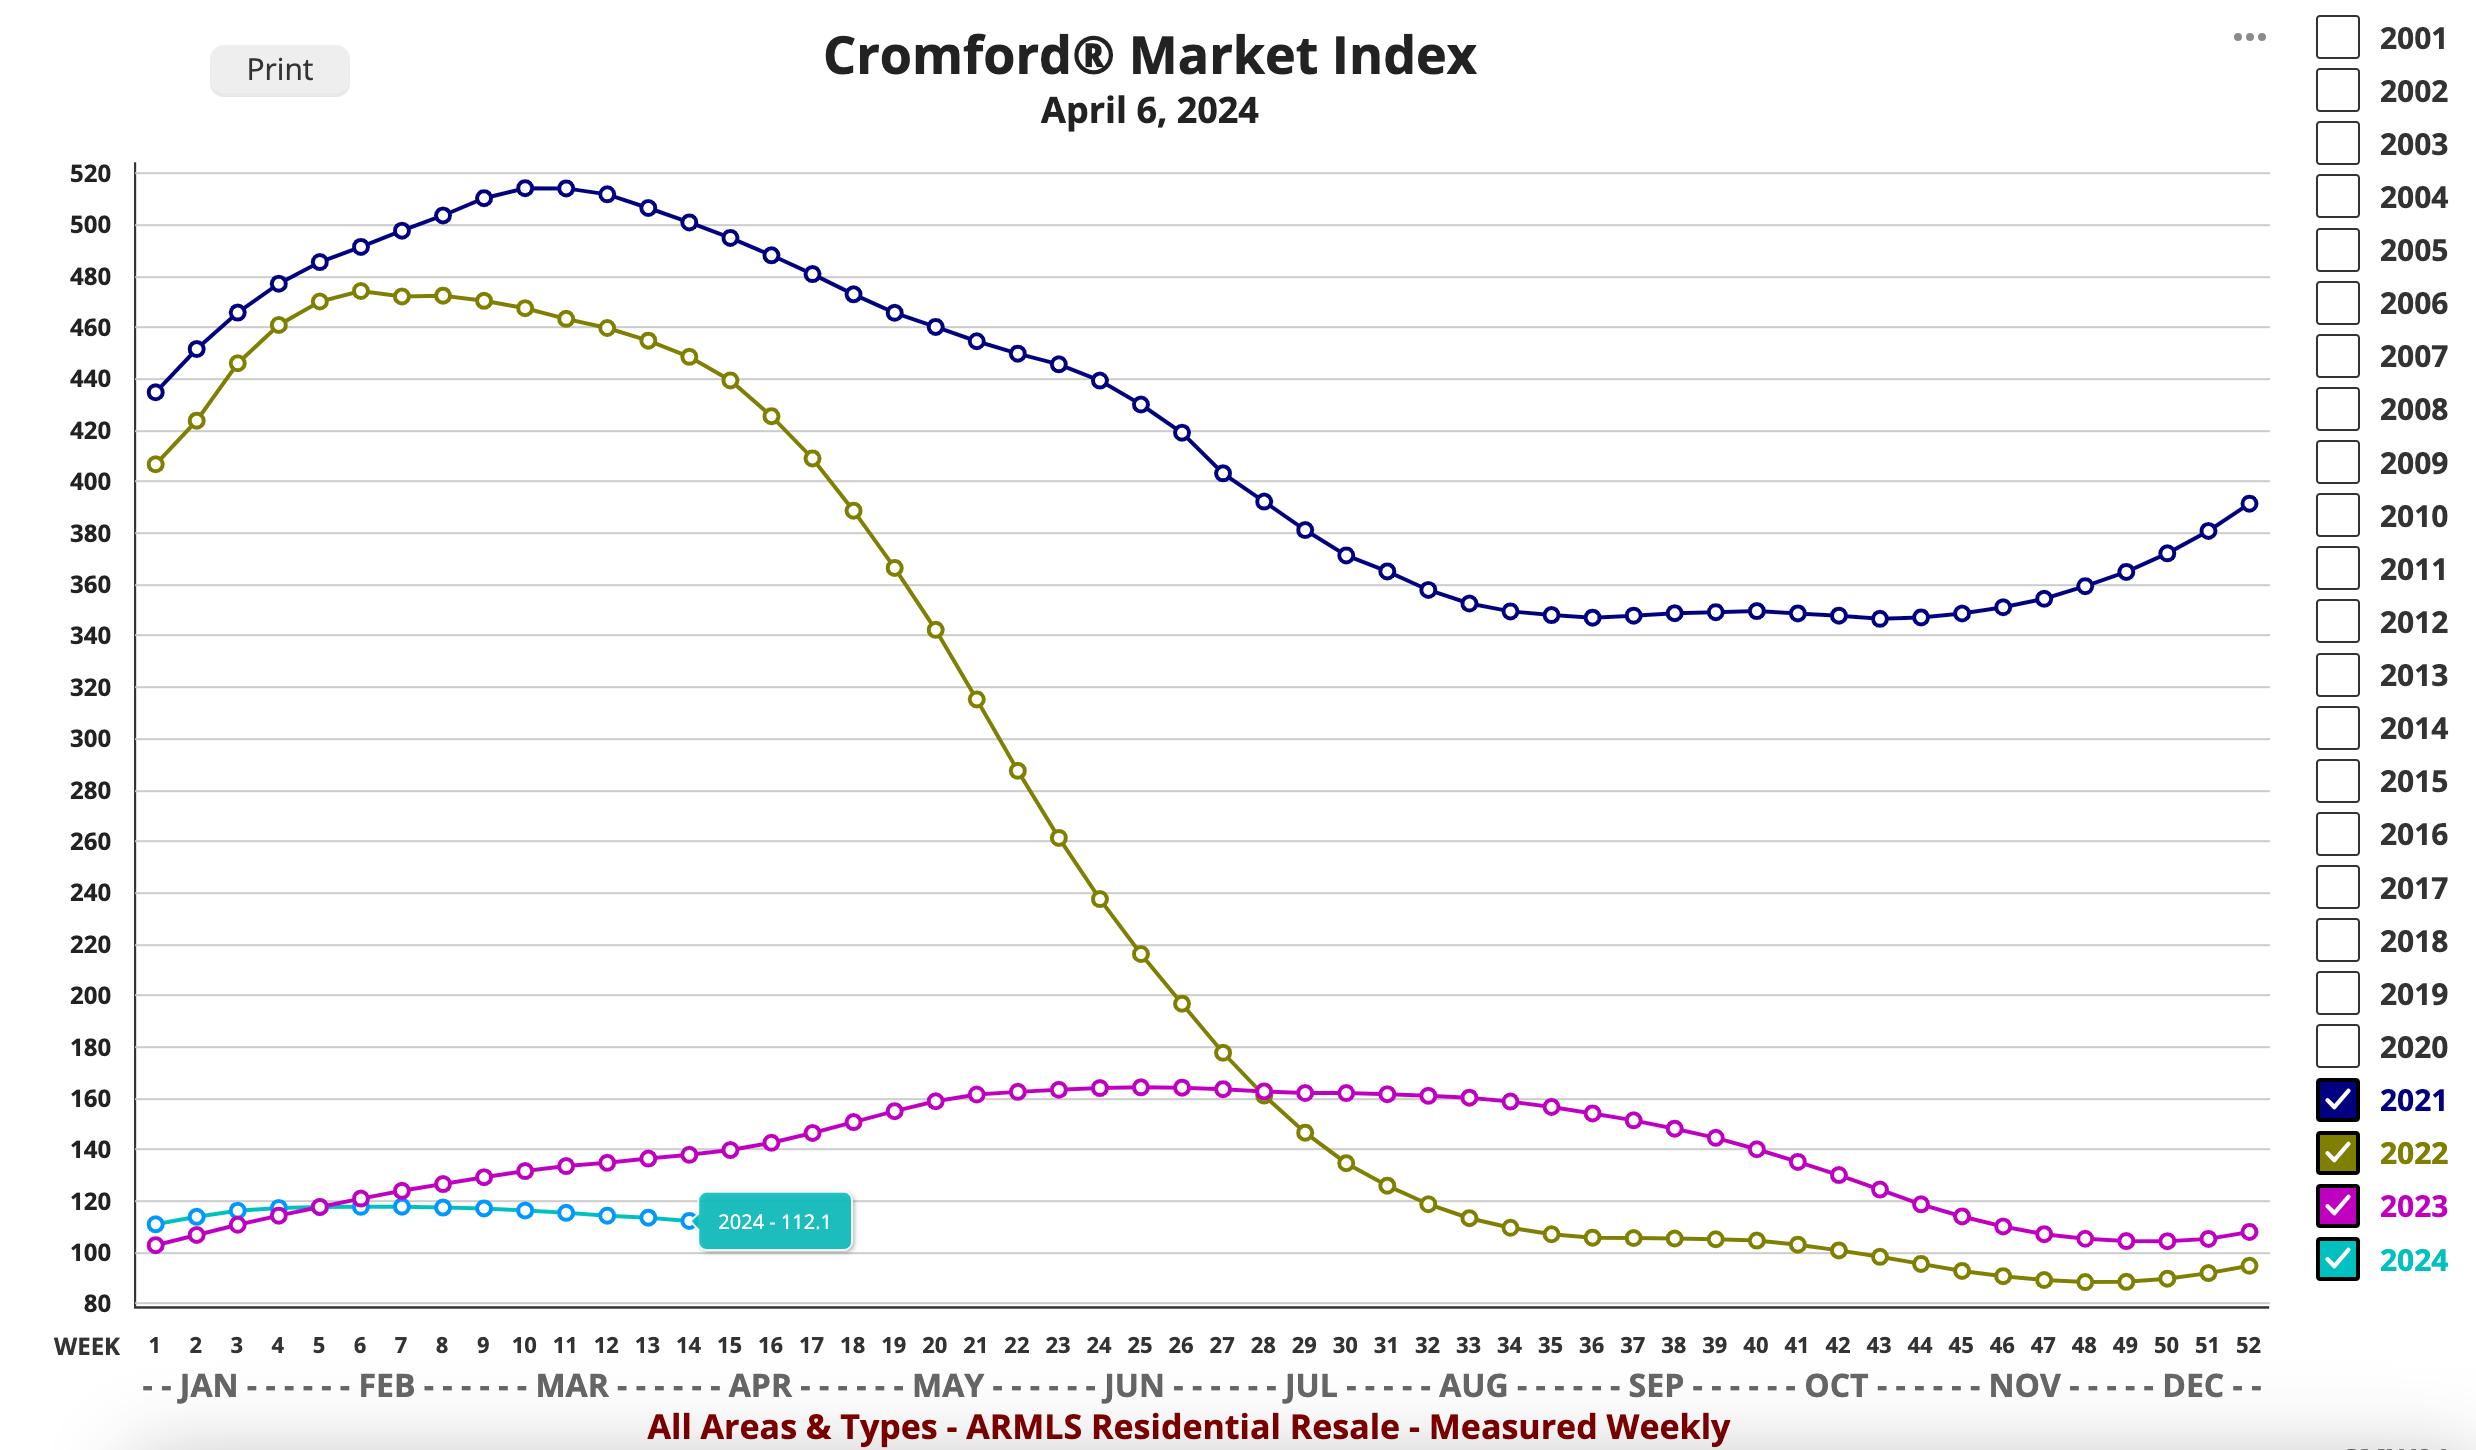
MARKET HIGH
The Market Index was 514 at the height of the market in May 2021
2024 EXPECTATIONS
Entering into 2024 we would say a case for (very) mild optimism can be made. There is certainly no sign whatsoever of a housing market crash
MARKET LOW
In the late Spring of 2022, the market decelerated quickly The lowest Market Index of 88.3 was seen in December 2022.
DATA SOURCE: ARIZONA REGIONAL MULTIPLE LISTING SERVICE, INC (ARMLS) & CROMFORD ASSOCIATES LLC
T H R E E Y E A R | A L L A R E A S & T Y P E S H O U S E R E P O R T | P A G E 3
TRENDS
TRENDS
PRICING
The monthly median sales price trend down 12% since last year
The monthly average price per square foot trends up 6 1% YOY
INVENTORY
Active listings (excluding UBC) are up 22% YOY and months of inventory is up 34 7% from 1 9 to 2 7
months YOY Prices are likely to inch upward in the coming months
VOLUME
Overall volume of residential sales for the year is down 7 49% compared to April 2023
AS OF APRIL 2023 AS OF APRIL 2024 %Δ (yr) 1 MONTH AGO %Δ (1 mo) ACTIVE LISTINGS (excluding under contract) 13,933 17,025 22% 16,568 2 8% ACTIVE LISTINGS (including under contract) 17,167 20,441 19% 19,890 2 8% PENDING LISTINGS 5,701 5,371 -9 1% 5,371 -3 5 LISTINGS UNDER CONTRACT 8,935 8,601 -3.7 8,693 -1.1% DAYS ON MARKET 76 66 -14 08% 69 -4 44% MONTHS OF INVENTORY 1 9 mo 2 7 mo 34 7% 2 8 mo -3 63% SALES PER MONTH 7,598 6,718 -12% 5,763 17% SALES PER YEAR 77,214 71,639 -7.49% 72,473 -1.16% MONTHLY AVERAGE SALES PRICE PER SQ. FT $277 59 $294 42 6 1% $293 31 0 4% MONTHLY MEDIAN SALES PRICE $419,000 $445,000 6% $440,000 1.1% H O U S E R E P O R T | P A G E 4
Y E A R O V E R Y E A R | A L L A R E A S & T Y P E S DATA SOURCE: ARIZONA REGIONAL MULTIPLE LISTING SERVICE, INC (ARMLS) & CROMFORD ASSOCIATES LLC
6901 East 1st St Suite 103 Scottsdale, Arizona 85251 (480)808-1223 | housegallery com Questions or Comments? Email Report author: Nicole Kobrinsky at nicole@housegallery com
© 2024 HOUSE GALLERY COLLECTIVE ALL WORLDWIDE RIGHTS RESERVED ALL MATERIAL PRESENTED HEREIN IS INTENDED FOR INFORMATION PURPOSES ONLY WHILE, THIS INFORMATION IS BELIEVED TO BE CORRECT, IT IS REPRESENTED SUBJECT TO ERRORS, OMISSIONS, CHANGES OR WITHDRAWAL WITHOUT NOTICE THIS INFORMATION IS BASED ON DATA FROM ARIZONA REGIONAL MULTIPLE LISTING SERVICE, INC (ARMLS), CROMFORD ASSOCIATES LLC , REALTORS PROPERTY RESOURCE®, LLC AND INTERPRETED BY HOUSE GALLERY COLLECTIVE, LLC DATA HAS BEEN LIMITED TO SALES REPORTED WITHIN THE COUNTY OF MARICOPA BOUNDARIES IF YOUR PROPERTY IS CURRENTLY LISTED WITH ANOTHER REAL ESTATE BROKER, OR YOUR ARE UNDER A BUYER REPRESENTATION CONTRACT WITH ANOTHER REAL ESTATE BROKER, PLEASE DISREGARD THIS OFFER IT IS NOT OUR INTENTION TO SOLICIT THE OFFERINGS OF OTHER REAL ESTATE BROKERS