Hawaii’s Airline No

Kākou a Pau


As Hawaii’s hometown carrier for 93 years, Hawaiian Airlines provides excellent jobs, connects people, supports local economies, and is the trusted go-to carrier for local cargo, passengers, and tourism. Every one of Hawaiian Airlines’ flights starts or ends its journey in Hawai‘i and 90% of its employees, from pilots and cabin crew to mechanics and administrative team members, live locally on the Islands. Hawaii’s geographic isolation makes the role of Hawaiian Airlines even more significant. In 2022, Hawaiian Airlines contributed 11% of Hawaii’s gross domestic product.
For this report, Hawaiian Airlines commissioned ICF to quantify its economic impact on the people, economy, and communities of Hawai‘i. As an embodiment of the notion of no kākou a pau, which translates to “interconnectedness,” this is more than an economic story. Following several years of uncertainty because of the COVID-19 pandemic, this is also a story of resilience.

Hawaiian Airlines led through the uncertainty of COVID-19, keeping its people employed, continuing to support local industry and business, providing local jobs and training, and transporting cargo and supplies. In many ways, the activity that Hawaiian Airlines pursued in recent years built up local capacity and positioned Hawai‘i for success in the recovery period—partnering with local businesses to promote new products and launching new educational partnerships.
Today, as the post-pandemic recovery gains momentum, Hawaiian Airlines remains the leading carrier for travel to, from, and within the Hawaiian Islands, fulfilling its responsibility as a part of the fabric of this community.


In Hawai‘i, civil aviation contributes nearly one dollar out of every five to the state’s GDP, a much higher rate than in any other state. Hawaiian Airlines, which pioneered commercial flights in Hawai‘i starting in 1929, spends money locally and enables the local economy in many ways, including operational purchases and capital spending, employing workers, and transporting passengers.
Direct spending by Hawaiian Airlines and its passengers is the most straightforward economic impact. But this direct spending represents only a portion of Hawaiian Airlines’ total impact. The full economic story includes the indirect impact of the airline’s business in other, related sectors and can be assessed through economic impact modeling.
For this analysis, the Hawaiian 2012 State Input-Output model was used to determine the total economic impact of Hawaiian Airlines on the state. The model depicts inter-industry relationships of Hawaii’s economy and demonstrates the connections and interdependencies of each industry on all others. ICF measured impact using the most recently available data from October 2021 through September 2022.
ICF specifically used the 2012 Inter-County Hawai‘i Input-Output model maintained by the State of Hawai‘i Department of Business, Economic Development and Tourism. Used to assess interisland and Hawai‘i impacts, the model includes 68 sectors (or industries, such air transportation, utilities, construction, etc.) for O‘ahu and 20 sectors each for Hawai‘i, Maui, and Kaua‘i counties.

With the COVID-19 pandemic, our tourism industry took a huge hit— as evidenced by a more than 90% decrease in Transient Accommodations Tax (TAT) revenue. By avoiding large numbers of layoffs, Hawaiian Airlines acted as a buffer against major economic shock, which was remarkable for our local economy.
 TOM YAMACHIKA PRESIDENT, TAX FOUNDATION OF HAWAII

Hawaiian Airlines directly contributes 7,158 jobs to the state of Hawai‘i. In addition to the direct impact of Hawaiian Airlines on the state, there are other secondary effects of its activities that include a significant impact on jobs in other industries.
This analysis concludes that Hawaiian Airlines’ activity annually supports the employment of an additional 46,342 people throughout Hawai‘i, for a total of 53,500 jobs statewide, and more than $10 billion of industry activity, or 11% of Hawaii’s total GDP. This translates to more than $607 million of realized tax revenue to the state each year.

Hawaiian Airlines’ contribution comes from its long-standing participation, and leadership, in Hawaii’s interisland and transpacific commercial and cargo carriage environment.
PAUL H. BREWBAKER, PH.D., CBE ECONOMIST
Note: Sums are rounded.
Source: ICF analysis
Note: Sums are rounded
Note: Sums are rounded
Note: Sums are rounded
Note: Sums are rounded
Secondary effects in this assessment are summarized throughout as multipliers. For example, $1 of direct activity produces a total effect that is 2.0 times greater than the initial spending. So, every dollar of direct industry output generated by Hawaiian Airlines translates to roughly $2.00 returned to the economy of Hawai‛i.
Secondary effects in this assessment are summarized throughout as multipliers. For example, $1 of direct activity produces a total effect that is 2.0 times greater than the initial spending. So, every dollar of direct industry output generated by Hawaiian Airlines translates to roughly $2.00 returned to the economy of Hawai‛i.
Secondary effects in this assessment are summarized throughout as multipliers. For example, $1 of direct activity produces a total effect that is 2.0 times greater than the initial spending. So, every dollar of direct industry output generated by Hawaiian Airlines translates to roughly $2.00 returned to the economy of Hawai‛i.
Secondary effects in this assessment are summarized throughout as multipliers. For example, $1 of direct activity produces a total effect that is 2.0 times greater than the initial spending. So, every dollar of direct industry output generated by Hawaiian Airlines translates to roughly $2.00 returned to the economy of Hawai‘i.
Secondary effects in this assessment are summarized throughout as multipliers. For example, $1 of activity produces a total effect that is 2.0 times greater than the initial spending. So, every direct industry output generated by Hawaiian Airlines translates to roughly $2.00 returned economy of Hawai‛i.
Note: Job and industry output multipliers represent, for every job or dollar in output that Hawaiian Airlines directly supports, the subsequent jobs and industry activity that are supported across the islands.
Source: ICF analysis
*Each color represents a county


Hawaiian Airlines is the largest air carrier in the state, responsible for bringing visitors from across the world to the Hawaiian Islands every year. This number has been significantly impacted by COVID-19 and the related restrictions imposed on travel. Statewide, Hawai‘i has yet to see international tourist volumes recover to pre-pandemic rates. Its major foreign visitor markets such as Japan, Canada, and others in the Asia-Pacific region faced challenges in attracting visitors given mandatory quarantine periods upon returning home and general public sentiment toward international travel. Japan, for instance, placed caps on international arrivals. In addition, macroeconomic headwinds that impacted foreign exchange rates, U.S. inflation, and airline fuel surcharges have contributed to a generally slow return to pre-pandemic levels.
As domestic travel to Hawai‘i continued to recover throughout 2022, Hawaiian Airlines has enabled large numbers of visitors from the mainland United States to travel to Hawai‘i.
Passengers on Hawaiian Airlines flights accounted for 43% of the total passengers in Hawai‘i in 2022. Tourism accounted for 1.6M visitors and 128K jobs in Hawai‘i—30.5% of those jobs were supported by Hawaiian Airlines.
The graphic below shows the total number of visitors to Hawai‘i transported by Hawaiian Airlines and their total spending in millions of dollars.
$173 M* 2.4 M 1.6 M
A passenger is a traveler who boards a Hawaiian Airlines aircraft, while a visitor is distinguished as a passenger who is a non-Hawai‘i resident. Visitor counts were estimated by ICF referencing multiple data sources that include Hawaiian Airline records and U.S. DOT Origin-Destination Survey data.
Total Number ofVisitors (In-Bound)
Total Number of Visitors (Inbound)
Total Number ofVisitors (In-Bound)
Visitors (In-Bound) Total Spending ($ Millions)
Visitors’ Total Spending Statewide ($ millions)
Visitors (In-Bound) Total Spending ($ Millions)
Total Number of Passengers (In-Bound)
Total Number of Passengers (In-Bound)
Total Number of Passengers (Inbound)
Passengers (In-Bound) Total Spending ($ Millions) $3,260 M
$3,260 M
Passengers (In-Bound) Total Spending ($ Millions)
Passengers’ (Inbound) Total Spending Hawai‘i Airports ($ millions)
*Reflects the direct spend by passengers from the airport when leave Hawai'i
*Reflects the direct spend by passengers from the airport when leave Hawai'i
*Reflects the direct spend by passengers at the airport they use to leave Hawai‘i.

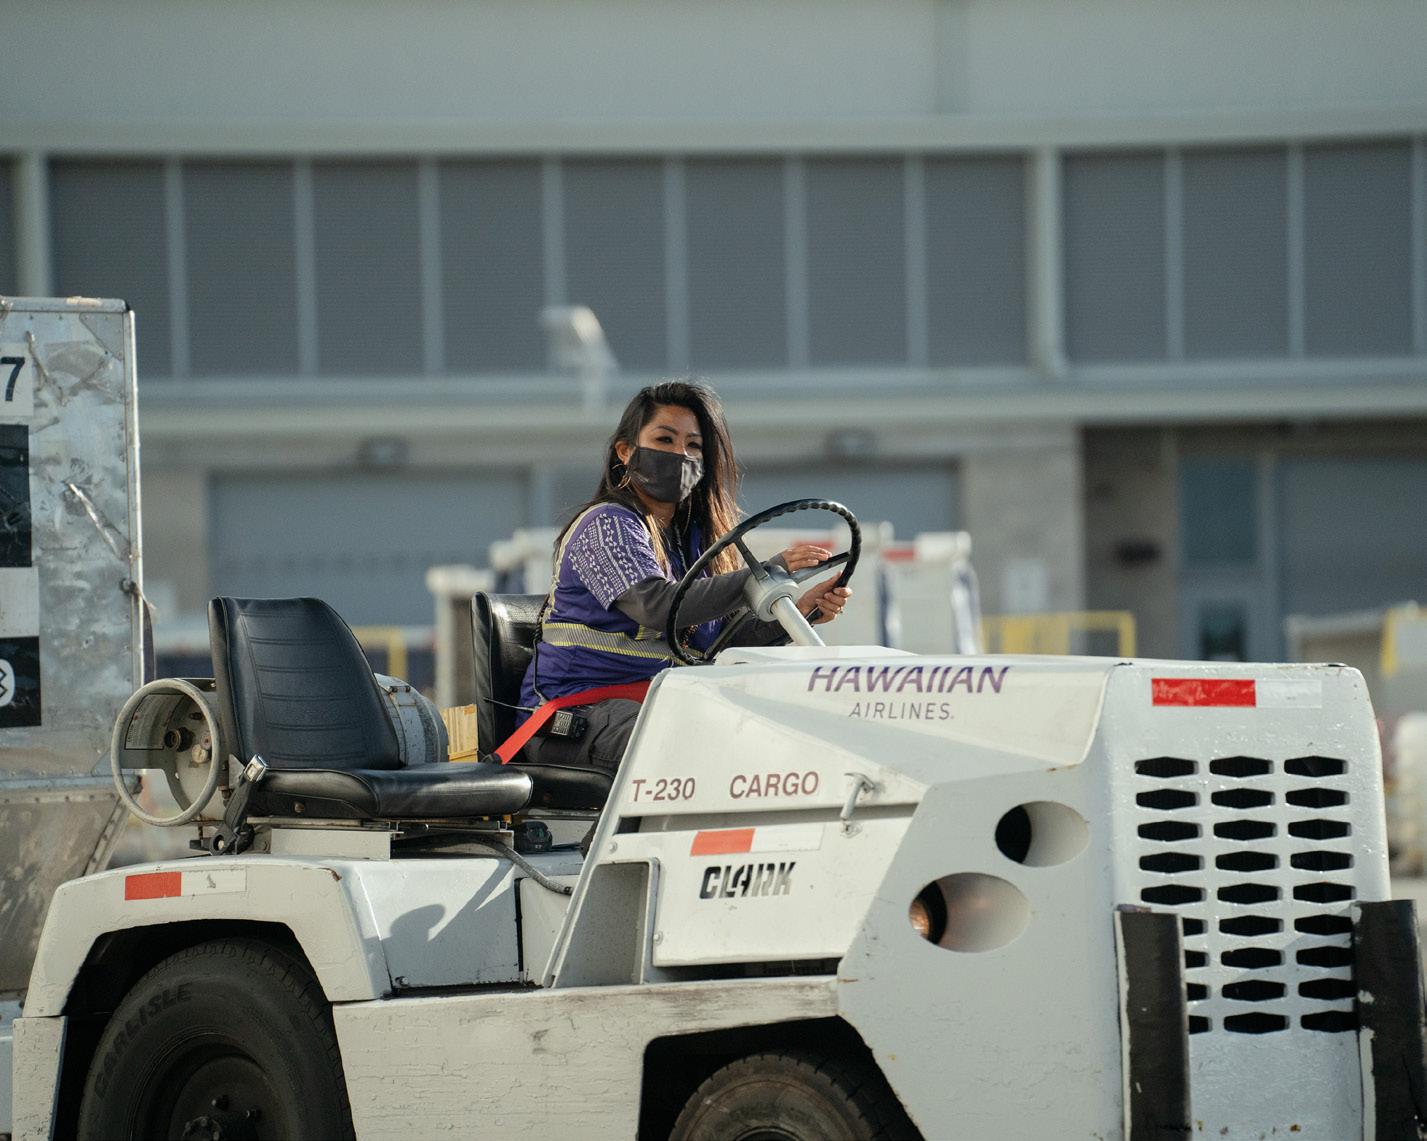
Though the majority of cargo arrives to Hawai‘i by ship, Hawaiian Airlines is a critical link in Hawaii’s cargo chain, enabling businesses to transport goods to and from the Hawaiian Islands with speed and efficiency. Only dedicated freight carriers transport more air cargo to Hawai‘i. Industries including healthcare, retail, hospitality, and agriculture are disproportionately reliant on Hawaiian Airlines’ air cargo services.
Hawaii’s exports by air to the U.S. mainland and foreign markets have increased on average 2–3% each year since 2009. Income from major state export industries as of 2021 has increased at an annual average rate of 1.4% since 2000.
Note: All dollar figures shown on the charts on this page are in 2022 US$ millions for the YE Sept. 2022 period.
Percentage of Hawaiian Airlines Cargo Revenue Between O‘ahu and Other Islands
Hawaiian Airlines plays a significant role in bringing high-value goods to Hawai‘i by air. The airline’s high-frequency schedule means it is often best positioned to transport the most critical types of cargo, including medical and surgical equipment.
Optic, Photo, Medic, or Surgical Instruments, 14% Special Classification Provisions, 14%
Industrial Machinery, 10%
Seafood, 10% Apparel, 10%
Stone Art,10%
Optic, Photo, Medic, or Surgical Instruments, 14%
Electric Machinery, 7%
Special Classification Provisions, 14%
Industrial Machinery, 10%
Seafood, 10%
Apparel, 10%
Stone Art,10%
Optic, Photo, Medic, or Surgical Instruments, 14%
Source: U.S. Census Bureau via USATrade Online
Electric Machinery, 7%
Transport Parts, 6% Furniture, 2%
Toys, Games & Sports Equipment, 2% Other*, 16%

Special Classification Provisions, 14%
Industrial Machinery, 10%
Seafood, 10%
Apparel, 10%
Stone Art, 10%
Electric Machinery, 7%
U.S. Census Bureau via USATrade Online
Source: U.S. Census Bureau via USA Trade Online
Transport Parts, 6%
*Other commodity types that represent between 0.5% – 2.0% of import value include plants and trees, clock parts, footwear, textiles, food items (fruits, vegetables, dry goods, edible preparations), art, among others.
Furniture, 2%
Toys, Games & Sports Equipment, 2%
Other*, 16%
Source: U.S. DOT T-100 (YE Sept. 2022), ICF analysis
Data includes all flights with cargo capacity. Competitors include Southwest, Mokulele Airlines, Aloha Air Cargo, and cargo integrators like FedEx and UPS.
Transport Parts, 6%
commodity types that represent between 0.5% – 2.0% of import value include plants and trees, clock parts, footwear, textiles, food items (fruits, vegetables, goods, edible preparations), art, among others.
Furniture, 2%
*Other commodity types that represent between 0.5%–2.0% of import value include plants and trees, clock parts, footwear, textiles, food items (fruits, vegetables, dry goods, edible preparations), art, among others.
Toys, Games & Sports Equipment, 2%
All other airport routes that Hawaiian Airlines (HA) does not operate have on average 115 daily departures. These non-HA routes are primarily served by Mokulele Airlines (aircraft operated by Southern Airways Express) that connect other smaller neighbor islands like Moloka‘i and Lāna‘i to O‘ahu and Maui.

Thanh Lam, owner of La Tour Bakehouse, and his son, Brandon Lam, CEO of La Tour Bakehouse, discuss their longstanding partnership with Hawaiian Airlines.


When Thanh Lam left Vietnam and first came to Hawai‘i in 1984, he fell in love with the island and the community. And having built his life and business in Hawai‘i, he still appreciates the way people look out for each other. “In Hawai‘i it is very important that we work together, we help each other, and we support local as much as we can.”
Community and connection have been cornerstones for Mr. Lam in his almost 40-year career as a business owner. Starting with a single Ba-Le Sandwich shop in Honolulu’s historic Chinatown in 1984, today he is responsible for nearly 20 Ba-Le shops, a thriving wholesale business, five La Tour Café restaurants on O‘ahu, and a multitude of partnerships, including a long-standing relationship with Hawaiian Airlines.
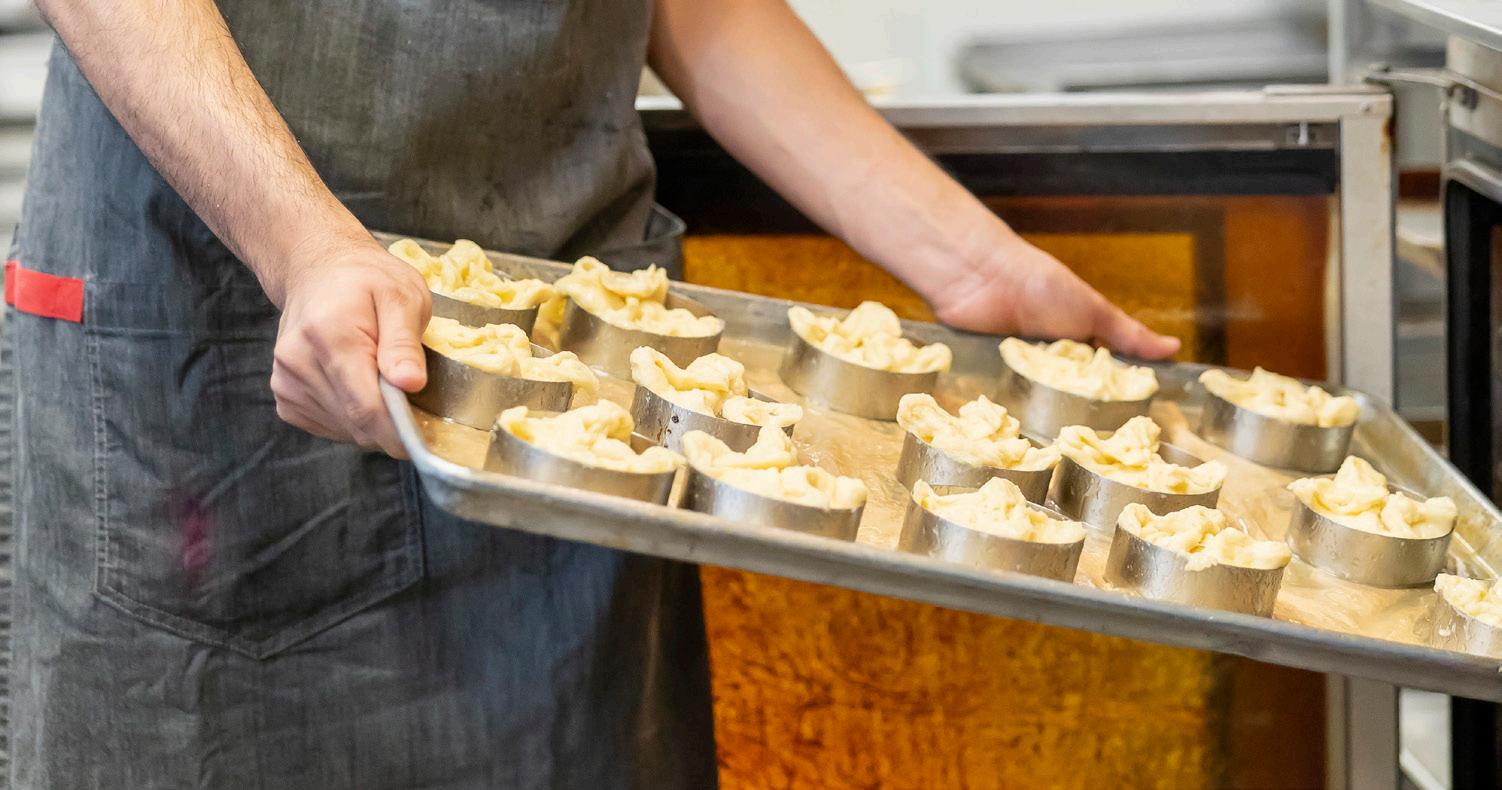
“It all started with banana bread,” he shared with a chuckle, recalling his early experiences with Hawaiian Airlines. A local woman with a much-loved banana bread recipe had been approached by Hawaiian Airlines to produce her bread for distribution in-flight. She lacked the capacity to fulfill the order, and Mr. Lam stepped in to help. So began his relationship with Hawaiian Airlines, which has brought on board cookies, croissant sandwiches, desserts, and much, much more. Hawaiian Airlines’ high-volume catering operations were instrumental in supporting the expansion of Mr. Lam’s business and workforce.
“Hawaiian Airlines has shown us that they really try and support local manufacturers whenever possible,” said his son, Brandon Lam, CEO of La Tour Bakehouse. This support mattered when the hospitality industry in Hawai‘i faced unprecedented uncertainty because of the COVID-19 pandemic. La Tour Bakehouse and Hawaiian Airlines worked together to help keep people employed and, ultimately, provide a benefit for both companies.
“We worked with Hawaiian Airlines to come up with a new product—our sandwich bakes,” Lam shared. “We were able to help keep people employed and now we provide both outbound and inbound meals,” Lam explained, meaning more of the food served to passengers on Hawaiian Airlines flights comes from Hawai‘i—further supporting local industry and jobs.
Interstate and interisland commerce is an essential part of Hawaiian Airlines’ service to the local economy and a key resource for local businesses. And Lam also relies on Hawaiian Airlines to get his products to neighbor island kitchens. “For us, as local manufacturers, we are always needing to find ways to shorten the supply chain and provide solutions to business partners across the islands,” he said.

“It is a good partnership because it’s a win–win,” Mr. Lam added. And, as a local employer, he feels strongly about giving back and supporting the community in meaningful ways. “We are so lucky, we have some employees who have been with our company more than 30 years,” he said. “We have more than 150 employees and we pay 100% of their health insurance premium … I love the things I can do for my employees.”
Since 1996, Hawaiian Airlines has been a valued partner to La Tour Bakehouse. Lam characterizes it as a “true symbiotic relationship,” one that supports and benefits from shared success. “As an immigrant family, sharing our story is very important, to show what Hawai‘i has given to us, and also show how we can thrive in Hawai‘i.”
By prioritizing and supporting local manufacturers and entrepreneurs, Hawaiian Airlines helps the community thrive.

When we buy from Hawai‘i businesses, we’re doing more than supporting a local shop, restaurant, or service provider. We’re investing in a community of hardworking entrepreneurs who are passionate about sharing all that makes Hawai‘i special through their unique, island-made products.
RENEE AWANA MANAGING DIRECTOR OF PRODUCT DEVELOPMENT AT HAWAIIAN AIRLINES

Hawaii’s economy relies heavily on critical infrastructure that is provided by interisland flights. The state’s unique geography requires this service for the economy to function. Today, with more than 19,500 daily departing interisland seats offered, which has captured 74% of all interisland passengers in the recent year, along with 30+ daily roundtrip flights to the U.S. mainland and the Asia-Pacific region, the network that Hawaiian Airlines provides is unmatched anywhere else in the United States and most of the world.
Total: 678,941
Hawaiian Airlines Share of Interisland

Flights (YE Sept 2022)
Flights (YE Sept 2022)
Passenger Flights (YE Sept. 2022)
Interisland Passenger Volume (In Thousands, YE Sept 2022)
Interisland Passenger Volume (In Thousands, YE Sept 2022)
Interisland Passenger Volume (In Thousands, YE Sept. 2022)
Source: U.S. DOT T-100, Scheduled passenger services only
Source: U.S. DOT T-100, Scheduled Passenger services only
Source: U.S. DOT T-100, Scheduled Passenger services only
Source: U.S. DOT T-100, Scheduled passenger services only
Source: U.S. DOT T-100, Scheduled Passenger services only
Source: U.S. DOT T-100, Scheduled Passenger services only


Mike Unebasami, vice president for administrative affairs at University of Hawai‘i Community Colleges and Karen Lee, chancellor of Honolulu Community College, discuss the innovative partnership with Hawaiian Airlines that will graduate local students as aviation maintenance technicians.
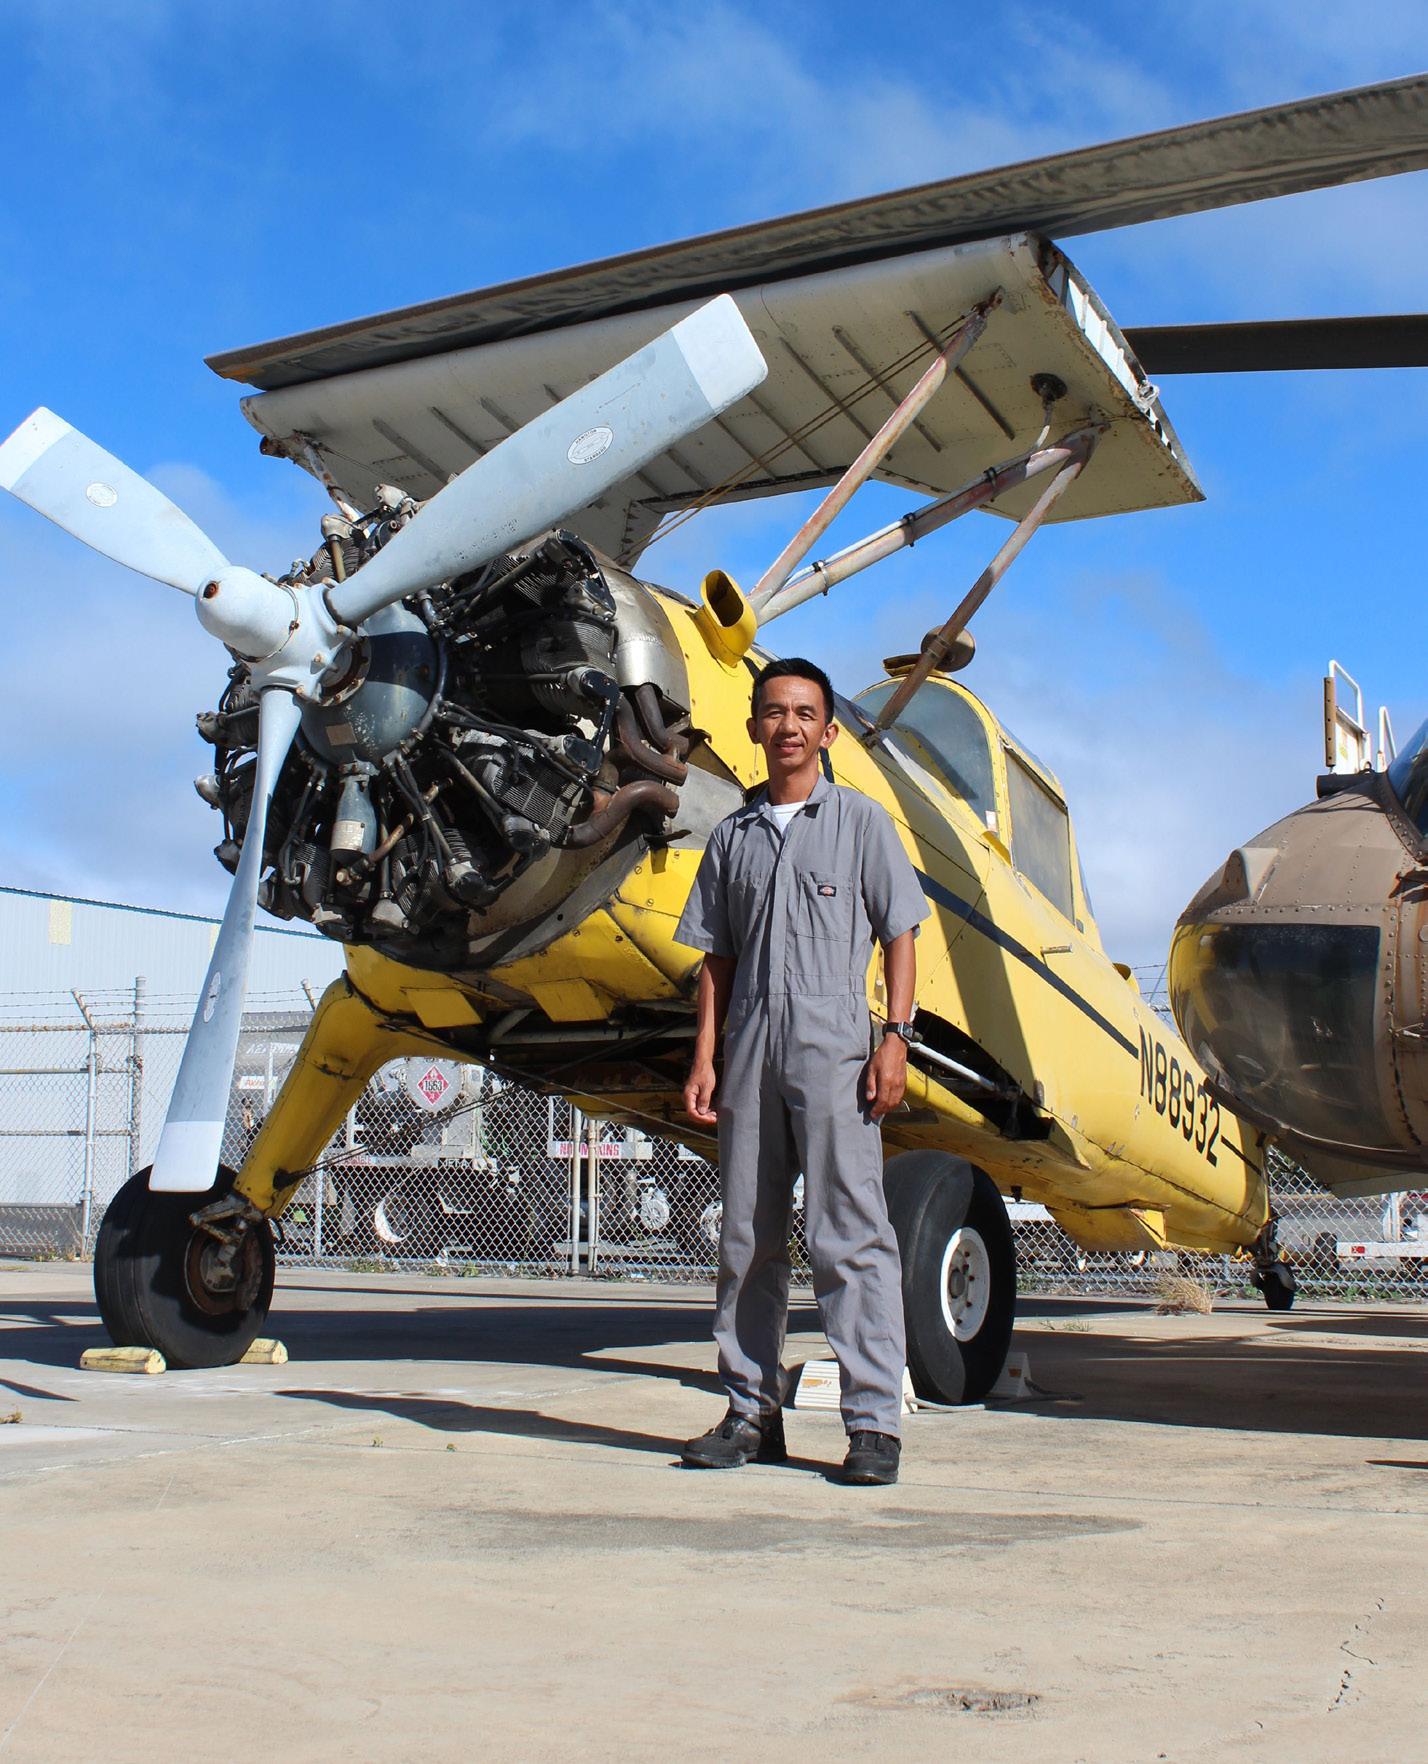
In the fall of 2022, Hawaiian Airlines and Honolulu Community College (HonCC) launched a new partnership to increase capacity in the campus’ Aeronautics Maintenance Technology Program. For years, the program—the only one of its kind in the Pacific—has maintained an extensive waitlist but has been unable to grow and meet applicant demand due to a lack of qualified instructors.
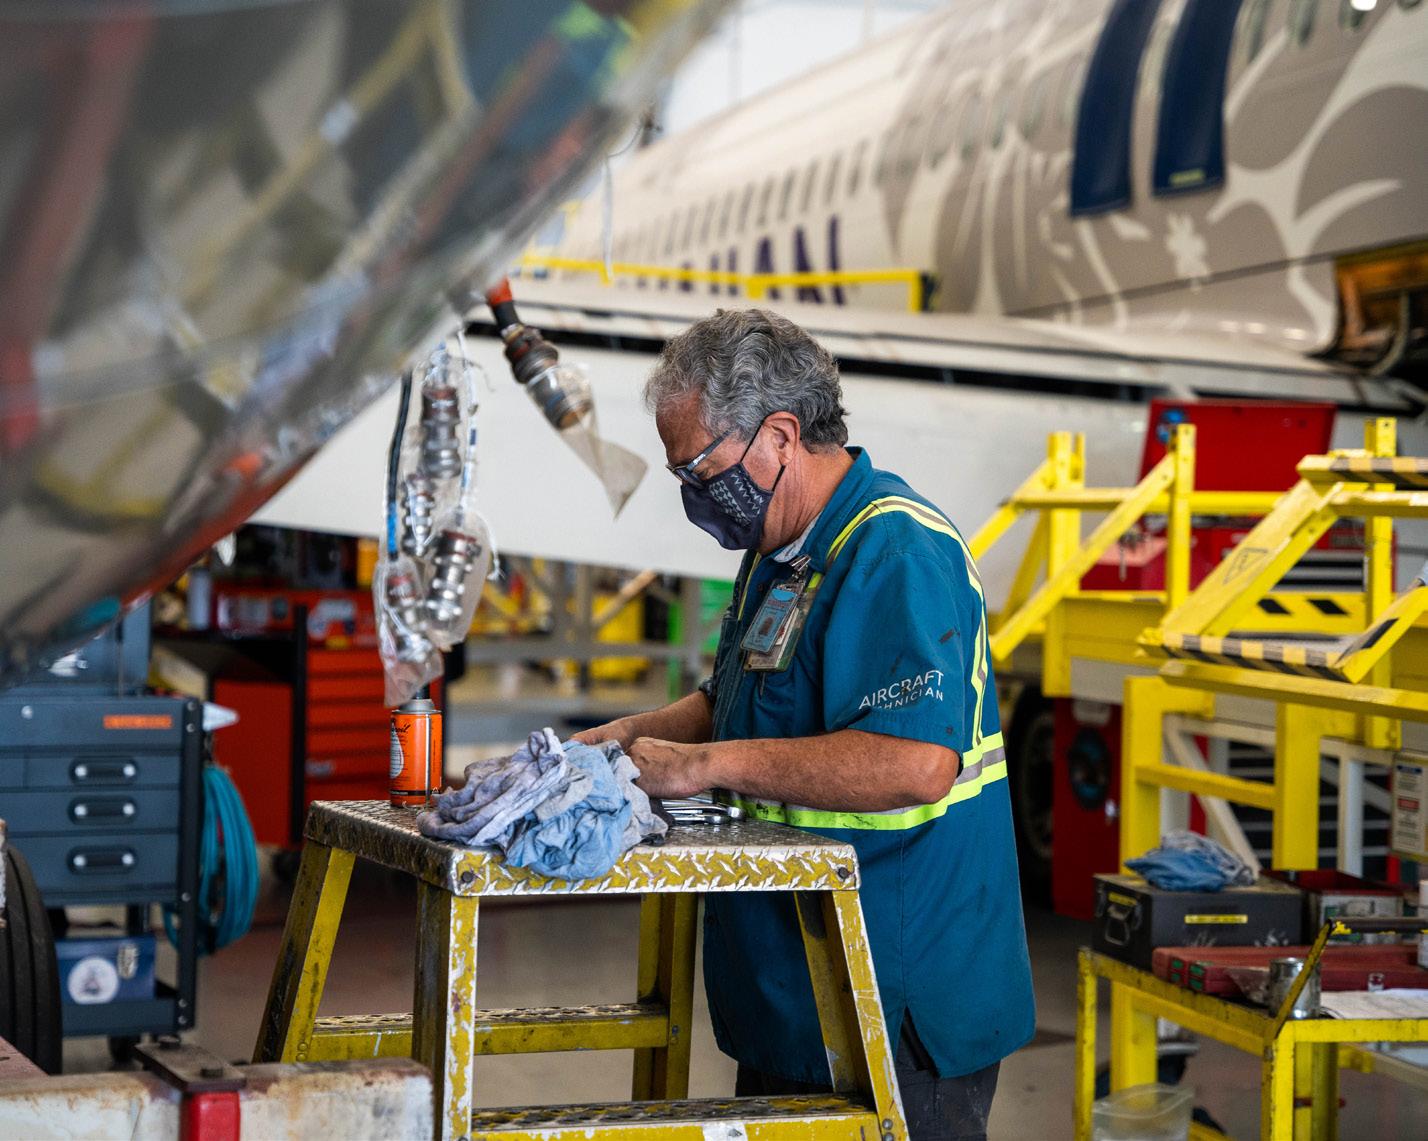
Hawaiian Airlines has long had a strong partnership with the program, providing guest speakers, access to hangars, on-the-job training, and more. In anticipation of an increased need for trained technicians, Hawaiian Airlines saw an opportunity to do more and help increase program capacity.
Under the partnership, Hawaiian Airlines employees are working as instructors, allowing the program to double enrollment so that there is a pipeline of qualified aviation technicians locally.


“We’ve never done anything like this before,” shared HonCC Chancellor Karen Lee. “I think it works because it’s a win-win. Hawaiian Airlines is investing in students who may eventually become their employees. For us, we can increase the number of students, and we know that they’re going to get an education that will lead to high-paying job opportunities in aviation.”
“This is a novel way to address private sector needs and the needs of Honolulu Community College—to come up with a solution that will benefit both sides,” said Mike Unebasami, associate vice president for administrative affairs with the University of Hawai‘i Community Colleges. “The winners in all of this really are our students, and the state of Hawai‘i.”
In fact, providing local educational opportunities that connect to local jobs is a priority that both Hawaiian Airlines and the University of Hawai‘i Community Colleges share. “We know our students can go anywhere,” Lee said. “But, if we
have jobs and the career ladders that allow them to stay in Hawai‘i … if they can truly have a living and family-sustaining wage, we want to help create that opportunity.”
“We hope Honolulu Community College graduates will consider joining our ‘ohana to enjoy a rewarding career right here at home with Hawaii’s airline,” said Robin Kobayashi, senior vice president of human resources at Hawaiian Airlines.

“Our employees are proud to share their expertise with Hawaii’s students and to help inspire and prepare them for successful careers in aviation.”

“As the workforce development arm of the state, of the university, this is a very positive partnership with the private sector,” Unebasami added. “They are providing resources to help us produce graduates in a specific area where there is a specific need.”
This unique partnership took time, collaboration, and strong relationships to develop and launch, but both Hawaiian Airlines and Hawai‘i Community College are excited for its future. The first cohort of graduates is expected in 2024.
In a world dominated by network carriers, Hawaiian Airlines is an extraordinary example of a destination carrier—all planes arrive in the Hawaiian Islands. Hawaiian Airlines remains a crucial and complementary part of the network that connects Hawaii’s economy with the rest of the world—transcending Hawaii’s geographic isolation and remoteness.
PAUL H. BREWBAKER, PH.D., CBE ECONOMIST
Hawaiian Airlines invests in infrastructure, buildings, land, and improvements throughout Hawai‘i. Capital infrastructure spending by Hawaiian Airlines creates secondary impacts throughout Hawai‘i including $91.1 million of capital infrastructure spending supporting 479 jobs, $132.48 million of industry output, and $8.40 million in tax revenue.

Note: Job and industry output multipliers represent for every job or dollar in output that Hawaiian Airlines directly supports, the subsequent jobs and industry activity that are supported across the islands.
Hawaiian Airlines’ direct spending also has a significant impact throughout the state.
Direct Operational Expenditures, October 2021-September 2022
Millions)
Direct Operational Expenditures, October 2021-September 2022 ($ Millions)
* O‘ahu sector specifically allows for “Air Transportation” but no other county has such granularity.

no other
direct spending also has a significant impact throughout the state.
*O‘ahu sector specifically allows for “Air Transportation” but no other county has such granularity.
* O‘ahu sector specifically allows for “Air Transportation” but no other county has such granularity.
* O‘ahu sector specifically allows for “Air Transportation” but no other county has such granularity.
specifically allows for “Air Transportation” but no other county has such granularity.
Hawaiian
spending also has a significant impact throughout the state.
Note: Job and industry output multipliers represent for every job or dollar in output that Hawaiian Airlines directly supports, the subsequent jobs and industry activity that are supported across the islands.
Hawaiian Airlines’ direct spending also has a significant impact throughout the state.
direct spending also has a significant impact throughout the state.
direct spending also has a significant impact throughout the state.

From its very origin, Hawaiian Airlines’ story has been one of no kākou a pau— interconnectedness with the state of Hawai‘i. In 1929, its first Sikorsky S-38 aircraft took off from Honolulu bound for Hilo, stopping in Maui along the way. Today, Hawaiian Airlines is the most reliable way to travel across Hawai‘i, and its services fuel the state’s economy, driving impact for individuals and communities that are felt in all aspects of life.


