
Using Ray-tracing To Create Acoustical Energy Maps


EthanAdeniran,Sophomore| FacultyMentor:Dr.FernandoEspinoza,DepartmentofPhysicsandAstronomy HofstraUniversity
TheArt ofAcoustic Imaging and Mapping Results/Discussion
Inavarietyofscientificfields,theprocessofimagingisusedtoquantifyand qualifydatabyprovidingawaytoturnthemintoagraphicalrepresentation. Inacoustics,engineersanddesignersoftenusebeamformingtechniquesasa methodtolocalizeandquantifysoundsources.Thisworksbyspatial filtering,whichenhancessignalsinplaceswheretheyareneededwhilealso suppressingunwantednoiseandinterference.Thismethodcanalsobe adaptedtopredictacousticparametersinrooms.Bymeasuringthe parametersinthefashionofanarray,theseparameterscanbe“mapped”ona modelofthevenue,whichisknownas acoustic imaging
Theprocessofacousticimagingbeginswithusinganomnidirectional microphonearray.Aftersendingasignal,thedataarethensentthrougha programthatanalysesthewaveformspickedupbyeachindividual microphone,thusgivingdatafortheacousticparameters.Afterreceivingthe datafortheinteractions,thosedatacanthenbemappedontoa three-dimensionalmodel,oratwo-dimensionalimagedependingonthe need.
Imagingprovidesmanybenefitsasopposedtotheclassicalmethodologyof measurementandanalysis.Namely,imagingallowsformorespecified measurementsduetotheuseofarraysinsteadofasingularmicrophone pointedinonedirectionorusinganSPLmeter.Inthisstudy,wewillgoone stepfurther.Weeliminatetheuseofmicrophoneswithray-tracing techniques tosimulatethepropagationofsoundwavestopredict(orinthiscase, confirm)acousticparameterspreviouslymeasuredclassically.
Ascanbeseenfromtheclassicalmethodofmeasurement,it’sdifficultto pinpointexactlywheretheboundariesforeachacousticparameterlie.
Methodology
Inthiscasestudy,theprogramI-SIMPAwillbeusedtocarryoutthe simulation.I-SIMPAworksbytakinga3-dimensionalmodelofavenue, or“scene,”andthensimulatingthepropagationofwavesbasedona varietyoffactorsthataffectsound,suchastheabsorptioncoefficientsof materialsinthevenue,temperature,barometricpressure,andothers.
Optimal Measurements
Forachurch,theidealreverberationtimeisintherangeof1.4secondsto 2.4secondsdependingonthesizeofthebuildingandwhatatypicalservice entails.Inourcase,arangeof1.3secondsto2.0secondswouldbebest.
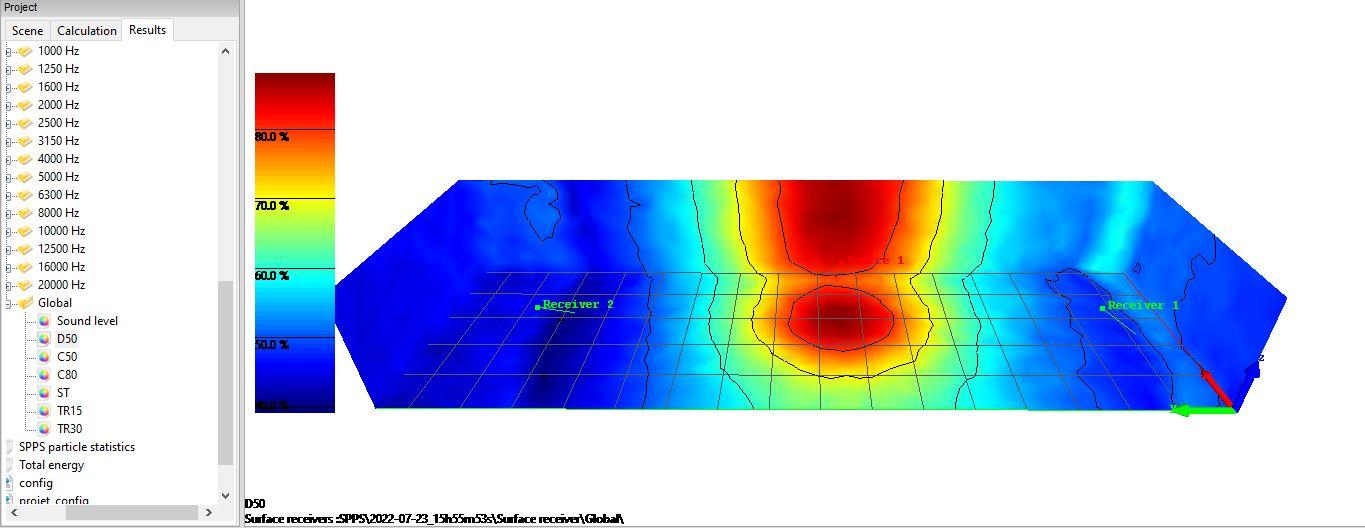
Intermsofclarity,forspeechintelligibility,thevalueoftheC50addedto thenoisefloorshouldnotbelessthan55dBorexceed75dB.The DefinitionIndex(D50)canalsobeusedtodeterminespeechintelligibility, inwhichvaluesabove50%indicategoodintelligibility.Forclarityor fullnessofmusic(C80),optimalvaluesshouldlieintherangeof-4dBor +1dB.
Theexpectedsimulatedresultsbasedontheclassicalexperimentconducted priorare:
ReverberationTime(RT60):Rangeof1.41s–2.00s
Clarity(C80):Rangeof 5.69dBto8.24dB
Definition(D50)-64%-74%
AmodelofthechurchwascreatedusingSketchup2022andimportedinto I-SIMPAasa3dsfile.
InI-SIMPA,thenextstepistodefinethematerials’acousticabsorption coefficients,definesoundsources,andreceivers.
Afterthisisdone,thesimulationcanberun.I-SIMPAsimulatessound throughhundredsofthousandsofparticles,asthewaysoundenergy propagatesthroughamedium.
Finally,thesimulationdatacanbeturnedintovisualdatathatarethen mappedontothe3Dmodelofthechurch.

DataAnalysis
Thesimulatedresultsforthevenueareasfollows:
Dataforeachofthepunctualreceivers(theareaswhereclassical measurementsweretaken)werealsoobtainedformoredetailed comparison:
Fromthedataobtained,severalobservationscanbemade.
Firstly,lookingattheRT60datacomparison,thesimulationtendedto producedatathatfellbelowtheexpectedvalue,butremaininlinewiththe optimalvaluesofavenueofthissize.Infact,thesimulateddatafallmorein linewiththerealvaluesthantheexpecteddataastheexpecteddatawere skewedbyaveragingthreetrials,oneofwhichtendedtoproduceoutlier results(whichisreflectedinRTvaluessuchas2.03seconds).
Intermsofclarity,acomparisonisinterestingasthedataobtainedbythe simulationwereextremelyaccurateincomparisontotheexpecteddatato theoptimalvalues.Thisindicatesthattheexpecteddatamayhavebeen wronginsomemeasurements,orthattheywereinterpretedincorrectly. Regardless,thesimulationprovedtobeausefultoolforclarity measurements.
Wherethesimulation didn’t reachexpectedvalueswasinthemeasurement ofthedefinitionindex.InareassuchastheL1andR1locations,thedata seemedtoreflecteachother.However,inallotherareas,thepercentages deviatedgreatly.WecaninferthatL1andR1havesuchhighpercentages duetotheirlocationrelativetothesoundsources.Becausethereceiversare locatedsoclosetothedirecttransmissionofthesourcecomparedtothe otherreceivers(includingM1),thisgavetheL1andR1moreconsistent percentages.ThismaybebestexplainedbythemethodinwhichI-SIMPA operates;namelyneedingveryspecificinputvaluesforabsorption coefficients.Unfortunately,manyofthedocumentsformaterialabsorption coefficientsonlyconsiderfrequencybandsfor125Hz,250Hz,500Hz, 1000Hz,2000Hz,and4000Hz.Consideringthatthespectrumextendsto 20,000Hz,thislackofdataprobablylimitstheusefulnessofthesimulation.
Othersourcesof“error”mayincludealackofprecisenessinmeasurements, duetolimitationsinaccesstobuildingplansandmaterials.Anothermaybe thelackofdetailthatcangointotheactualmodelbeingused,asI-SIMPA oftenrunsintocomputingissuesthemoresurfaces(thataredividedinto triangles)thatareintroduced.
References
Adeniran,EthanX.,Espinoza,Fernando.“AnalysisofWorshipCenter AcousticQualityforAudiences.” Hofstra Horizons for Undergraduate and Graduate Research,summer2022.
Picaut,Judicael,FortinNicolas.I-SIMPA(version1.3.4)[Computer Software]
Trimble,SketchUpPro2022[ComputerSoftware]
 Example graph of D50 index (definition index)
Classical RT60 Map
Example graph of D50 index (definition index)
Classical RT60 Map