1. Link to the Integrated Strategic Planning and Reporting Framework
This section describes how the Budget links to the achievement of the Community Vision and Council Plan within an overall integrated strategic planning and reporting framework. This framework guides the Council in identifying community needs and aspirations over the long term (Community Vision and Financial Plan), medium term (Council Plan, Workforce Plan, and Revenue and Rating Plan) and short term (Budget) and then holding itself accountable (Annual Report).
1.1 Legislative planning and accountability framework
The Budget is a rolling four-year plan that outlines the financial and non-financial resources that Council requires to achieve the strategic objectives described in the Council Plan. The diagram below depicts the integrated strategic planning and reporting framework that applies to local government in Victoria. At each stage of the integrated strategic planning and reporting framework there are opportunities for community and stakeholder input. This is important to ensure transparency and accountability to both residents and ratepayers.
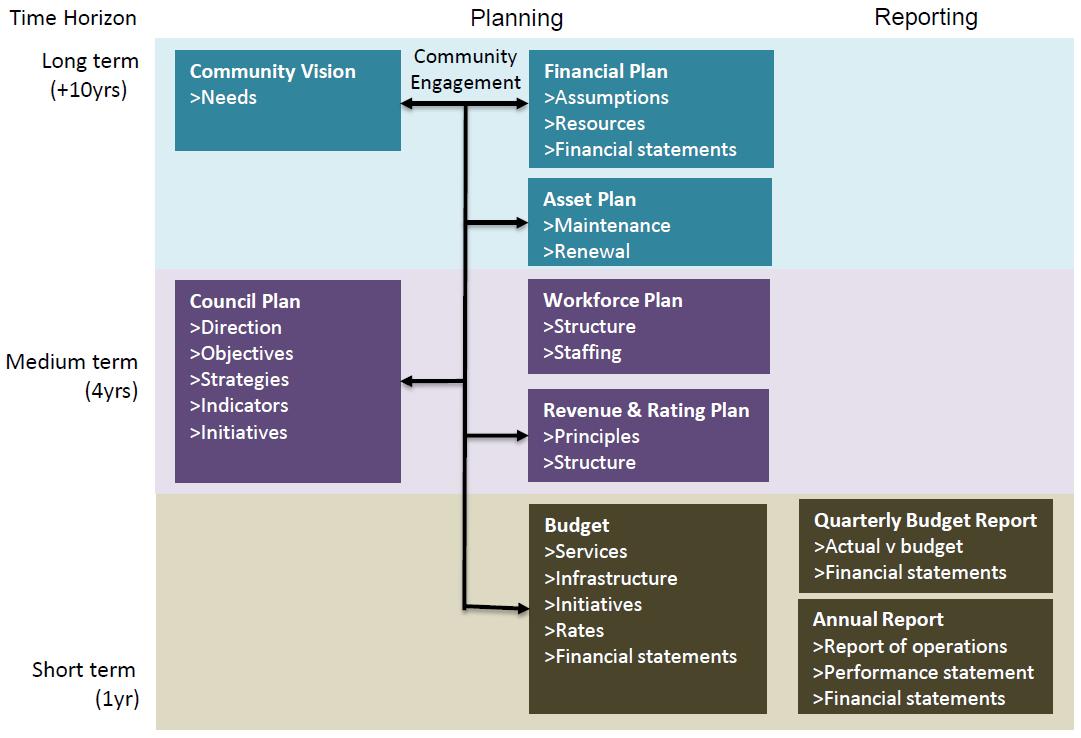
Source: Department of Jobs, Precincts and Regions
The timing of each component of the integrated strategic planning and reporting framework is critical to the successful achievement of the planned outcomes.
1.1.2 Key planning considerations
Service level planning
Although councils have a legal obligation to provide some services— such as animal management, local roads, food safety and statutory planning—most council services are not legally mandated, including some services closely associated with councils, such as libraries, building permits and sporting facilities. Further, over time, the needs and expectations of communities can change. Therefore councils need to have robust processes for service planning and review to ensure all services continue to provide value for money and are in line with community expectations. In doing so, councils should engage with communities to determine how to prioritise resources and balance service provision against other responsibilities such as asset maintenance and capital works.
Community consultation needs to be in line with a councils adopted Community Engagement Policy and Public Transparency Policy.
Page 3
1.2 Our purpose
Our Vision
• Working together to be a connected, inclusive and prosperous community.
Our mission
1. Increase accessible services to enable the community to be healthy, active and engaged.
2. Provide infrastructure essential to support the community; and to protect and enhance our natural environment.
3. Foster a sustainable and diversified local economy where economic growth is encouraged and supported.
4. Promote user friendly services to ensure transparency, good governance and financial sustainability.
5. Advance gender equality, equity and inclusion for all.
Our values
Hindmarsh Shire Council is committed to:
• Transparent and accountable actions and decisions
• Inclusion and collaboration with residents
• Showing respect and integrity to all
• Being proactive and responsible by encouraging innovation
1.3 Strategic objectives
Council delivers services and initiatives under 47 service categories. Each contributes to the achievement of one of the four Key Result Areas (KRA) set out in the Council Plan for the years 2021-2025. The following table lists the four KRA as described in the Council Plan.
Strategic Objective Description
Our Community
Built and Natural Environment
• A community well informed and engaged.
• Communities that feel safe and are resilient.
• Provide arts and cultural activities that strenthen social connection.
• A range of effective and accessible services to support the health and wellbeing of our community.
• Support healthy living and provide services and activities for people of all ages and abilities.
• A range of transport options.
• Assist our community to recover from COVID-19.
• A diverse community.
• Recognise, respect and support Traditional Owners.
• Digital connectivity to support learning and work.
• Well-maintained physical assets and infrastructure to meet community and organisational needs.
• Environmentally sustainable practices.
• Attractive streetscapes.
Competitive and Innovative Economy
Good Governance & Financial Sustainability
• Facilitating and supporting economic development..
• Develop and promote local tourism opportunities that attract visitation.
• Stong governance practices
• Long-term financial sustainability.
• Ensure responsible risk management principles.
• A skilled Council and workforce capable of meeting community needs.
• Gender equity, respect and leadership.
Page 4
2. Services and service performance indicators
This section provides a description of the services and initiatives to be funded in the Budget for the 2023/24 year and how these will contribute to achieving the strategic objectives outlined in the Council Plan. It also describes several initiatives and service performance outcome indicators for key areas of Council’s operations. Council is required by legislation to identify initiatives, major initiatives and service performance outcome indicators in the Budget and report against them in their Annual Report to support transparency and accountability. The relationship between these accountability requirements in the Council Plan, the Budget and the Annual Report is shown below:
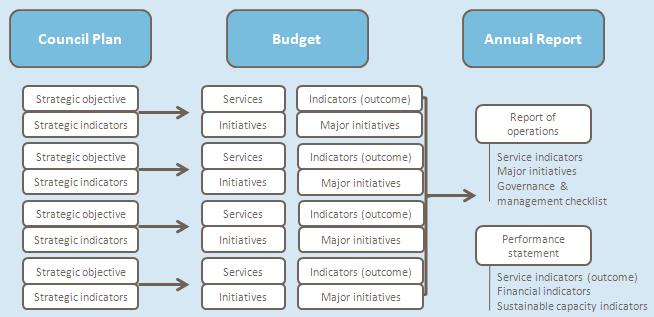
Source: Department of Jobs, Precincts and Regions
2.1 Strategic Objective 1: Our Community
To achieve our KRA Our Community, our mission is to increase accissible services to enable the community to be health, active and engaged. The services, initiatives, major initiatives and service performance indicators for each business area are described over the following pages.
Community Development
Initiatives:
Councils Community Development Team works with community groups, organisations and individuals to assist communities reach their aspirations and be healthy, active and engaged.
• Establish stronger links with the indigenous community through the Barengi Gadjin Land Council, Goolum Goolum Aboriginal Cooperative and Wurega Aboriginal Corporation.
• Continue to support the integration of migrants into the community.
• Support and celebrate volunteering and work collaboratively with volunteer groups.
• Provide ongoing financial assistance and operational support for town committees to ensure they remain strong and focused conduits between community and Council and that their statutory obligations are met.
• Commence work towards outcomes and projects identified and prioritised in the Dimboola and Nhill Community Precinct Plans.
Maternal and Child Health Centres
Initiatives:
Maintain Maternal and Child Health facilities in Dimboola and Nhill. Council provides support to early years' services through the Municipal Early Years Plan.
Council does not provide Maternal and Child Health Services. This service is provided by West Wimmera Health Services in Dimboola, Jeparit, Nhill and Rainbow.
• Maintain the Dimboola and Nhill Maternal and Child Health Centres.
Computation
As Council does not have operational control over the delivery of Maternal and Child Health Services, the prescribed indicators for performance and prescribed measures have not been included in this budget.
Service area Description of services provided 2021/22 2022/23 2023/24 Actual Forecast Budget Operating Expenditure 252,592 401,228 177,509 Operating Revenue 77,944 500,775NET Expenses (Revenue) 174,648 (99,547) 177,509 Capital Expenditure 4,500 625,000Service area Description of services provided 2021/22 2022/23 2023/24 Actual Forecast Budget Operating Expenditure 8,003 17,497 17,542 Operating Revenue - -NET Expenses (Revenue) 8,003 17,497 17,542 Capital Expenditure - - -
Service Indicator Performance Measure
Page 5
Kindergarten Services
Initiatives:
Provision of Kindergarten services in Dimboola, Jeparit, Nhill and Rainbow under contract with Emerge. Council does not directly deliver Kindergarten Services.
• Maintain all kindergartens in Dimboola, Jeparit, Nhill and Rainbow, and ensure buildings comply with Department of Education and Training regulations.
• Review and implement Municipal Early Years Plan.
Youth Services Improve the wellbeing of and opportunities for youth within the Shire.
Initiatives:
• Facilitation of youth activities including school holiday activities as well as FreeZa and Engage! events.
• Broaden the engagement of young people in the Shire and continue to facilitate the Hindmarsh Youth Council.
Aged & Disability Services *
Initiatives:
Council’s Aged and Disability Services aim to support people in their own homes and communities by providing services that promote and maintain independence. The program assists frail older people, people with a disability and their carers. These services provide basic support and maintenance to people living at home or who are at risk of premature or inappropriate admission to longterm residential care.
Deliver the full range of services provided by Council's Aged and Disability Services department including:
• Assessments occur in the client’s home and are required to determine a person's eligibility to receive state or federally funded services. These assessments define a person’s capabilities, are goal oriented and delivered to suit client needs.
• Delivered Meals and Centre Based Meals service provides a nutritious, appetising and culturally appropriate main meal delivered to the consumer’s home or to a community centre where meals are eaten in a social setting.
• Personal Care provides assistance with those tasks which a person would normally do themselves but because of illness, disability or frailty they are unable to perform without the assistance of another person, including:
o Bathing, showering or sponging;
o Dressing and undressing;
o Shaving, hair care and grooming;
o Eating, drinking, cooking, and meal preparation;
o Mobility;
o Toileting;
o Self-medication;
o Transporting to medical and other related appointments.
• Respite Care services support the caring relationship by providing the carers of frail older people and people of any age with a disability, with a break from their caring responsibilities. It also provides an opportunity for the person being cared for to have a break or an outing without their usual carer.
• Home Care / Domestic Assistance services are to maintain a safe, secure, healthy home environment for frail older people and people with a disability. While cleaning tasks form an essential part of Home Care it is more than a cleaning service. It is focused on enhancing the consumers independence by providing basic levels of assistance required to maintain the home.
• Property Maintenance provides assistance with maintenance and minor modifications of the consumer’s home, garden or yard to maintain the home in a safe and habitable condition
* Council will cease delivery of in-home based care during 2023/24. Council will continue to operate the service until it is transitioned to an external provider.
Service area Description of services provided 2021/22 2022/23 2023/24 Actual Forecast Budget Operating Expenditure 137,292 122,137 134,235 Operating Revenue 88,976 62,604 60,980 NET Expenses (Revenue) 48,316 59,533 73,255 Capital Expenditure 20,210 -Service area Description of services provided 2021/22 2022/23 2023/24 Actual Forecast Budget Operating Expenditure 122,664 199,352 154,298 Operating Revenue 65,000 75,000 42,750 NET Expenses (Revenue) 57,664 124,352 111,548 Capital Expenditure - -Service area Description of services provided 2021/22 2022/23 2023/24 Actual Forecast Budget Operating Expenditure 1,005,188 1,142,263 434,920 Operating Revenue 1,050,814 1,036,597 330,587 NET Expenses (Revenue) (45,626) 105,666 104,333 Capital Expenditure 1,827 23,549 -
Page 6
Health Promotion To protect and enhance the health of the community.
• Education and enforcement of the legislative regulations pertaining to food preparation, storage and handling, accommodation houses, hairdressers and other licensed premises.
• Issue permits for the installation of septic tanks.
• Work with communities to educate on and improve environmental health issues.
• Continue to implement Municipal Public Health and Community Wellbeing Plan.
and major noncompliance notifications. (Percentage of critical and major noncompliance notifications that are followed up by Council).
Computation
[Number of critical non-compliance notifications and major non-compliance notifications about a food premises followed up / Number of critical noncompliance notifications and major non-compliance notifications about food premises] x100 Libraries
Provision of permanent library services in Dimboola and Nhill, and improving services to Jeparit and Rainbow.
Initiatives:
• Support library based initiatives to encourage people to enhance their learning.
Major Initiatives:
• Improve security for clients and staff
library borrowers. (Percentage of the municipal population that are active library borrowers in the last 3 financial years).
Computation
[Number of active library borrowers over last 3 financial years / municipal population over last 3 financial years] x100
Arts, Culture and Community Events
Promote and support activities relating to arts, culture and community events throughout the Shire.
Initiatives:
• Promote and support activities during Volunteer Week, Children's Week, Youth Week, and Senior's Week.
• Promote activities to celebrate International Day of Disabled Persons and Harmony Day.
• Support community groups to identify external grant opportunities.
• Assist community groups and project working groups to manage and implement projects in accordance with funding agreements.
• Encourage social connectedness through New Resident Meet and Greet Barbecues in Dimboola, Jeparit, Nhill and Rainbow.
• Promote and support regional community events.
Service area Description of services provided 2021/22 2022/23 2023/24 Actual Forecast Budget Operating Expenditure 351,054 229,947 160,741 Operating Revenue 116,229 66,152 31,000 NET Expenses (Revenue) 234,825 163,795 129,741 Capital Expenditure 2,169 -Service Indicator Performance Measure Food safety Health and safety Critical
Service area Description of services provided 2021/22 2022/23 2023/24 Actual Forecast Budget Operating Expenditure 305,862 394,412 409,619 Operating Revenue 514,860 378,133 129,156 NET Expenses (Revenue) (208,998) 16,279 280,463 Capital Expenditure 693,642 166,556 56,000 Service Indicator Performance Measure Libraries Participation
Service area Description of services provided 2021/22 2022/23 2023/24 Actual Forecast Budget Operating Expenditure 125,611 124,873 131,179 Operating Revenue 23,477 700NET Expenses (Revenue) 102,134 124,173 131,179 Capital Expenditure - - -
Active
Initiatives:
Page 7
Recreation Programs Providing a range of recreation programs that encourage an active and healthy life.
Initiatives:
• Support from staff to achieve long term infrastructure needs in relation to sports and recreation.
Public Order & Safety
Initiatives:
Educate the community about public order and safety and enforce Council’s compliance with the local laws when required.
Operate the school crossing on the Western Highway in Nhill and maintain school crossings throughout the Shire.
• Educate the community in responsible pet ownership.
• Education and enforcement in animal control and local laws, with a particular focus on animal registration and littering.
• Operation and maintenance of the animal pound.
• Enforcement of breaches of animal control regulations.
• Assist with the identification and implementation of initiatives that ensures residents’ safety and wellbeing are met.
• Continue implementation of Domestic Animal Management Plan.
Early Years
Lead a joint effort that will give Hindmarsh children the best start in life, working collaboratively with community and early years providers.
Service area Description of services provided 2021/22 2022/23 2023/24 Actual Forecast Budget Operating Expenditure 14,006 14,713 15,167 Operating Revenue - -NET Expenses (Revenue) 14,006 14,713 15,167 Capital Expenditure - -Service area Description of services provided 2021/22 2022/23 2023/24 Actual Forecast Budget Operating Expenditure 259,250 227,621 209,966 Operating Revenue 87,987 95,200 81,250 NET Expenses (Revenue) 171,263 132,421 128,716 Capital Expenditure - -Service Indicator Performance Measure Animal Management Health and safety Animal management prosecutions. (Number of successful animal management prosecutions). Service area Description of services provided 2021/22 2022/23 2023/24 Actual Forecast Budget Operating Expenditure 23,591 37,941 29,401 Operating Revenue - -NET Expenses (Revenue) 23,591 37,941 29,401 Capital Expenditure - - -
Computation Number of successful animal management prosecutions
Page 8
2.2 Strategic Objective 2: Built & Natural Environment
To achieve our KRA Built and Natural Environment, our mission is to provide infrastructure essential to support the community; and to protect and enhance our natural environment.
Provide safe, all-weather access to residences and allow for efficient transport of goods to and from the Shire.
• The aim of the road network is to provide property access for local traffic. Council endeavours to provide all-weather access to existing residential homes and dry weather access roads to nonresidential properties.
Local Roads & Bridges
• Council’s road network comprises 573 kilometres of sealed roads, 845 kilometres of gravel roads (allweather) and approximately 1470 kilometres of earth roads (dry-weather only, some contain gravel sections, though not maintained to an all-weather standard). The network also comprises six bridges and a significant number of large culverts.
VicRoads is responsible for main roads including highways and marked routes. Similarly, state government agencies are responsible for roads and tracks within declared parks such as the Little Desert, Big Desert and along the Wimmera River.
Routine Maintenance:
The primary aim of the routine maintenance program is to keep the existing network in a serviceable condition.
Council’s aim is to conduct inspections and provide maintenance according to the Road Management Plan (RMP) which includes:
• Inspection frequency by road classification;
• Risk assessment and response times;
• Services levels and standards; and
• Assessment with roads hierarchy.
Council will undertake programmed inspections in a timely manner to identify defects. These defects are programmed for repair in accordance with the RMP which take account of the road hierarchy and seriousness of the defect.
In addition, reactive inspections are carried out in response to customer action requests. These inspections are carried out within one week of the request and required repairs scheduled as per the RMP. All customer action requests are co-ordinated through Council's asset management system.
Other activities carried out include:
• Sealed roads - shoulder grading, pavement patching, crack sealing, edge repairs and line-marking.
• Unsealed roads - grading of gravel roads on an annual or as needs basis where funds allow.
• Formed only roads – grading on an as needs priority basis as funds allow (on average once in every 5 years).
• Replacement and maintenance of road signage and guideposts.
Capital Expenditure: (Refer to Capital Works Program for further details)
Council’s capital expenditure on road assets is split into two basic categories. These are new/upgrade or renewal.
Service area Description of services provided 2021/22 2022/23 2023/24 Actual Forecast Budget Operating Expenditure 4,212,715 4,953,321 4,592,042 Operating Revenue 4,329,509 1,627,317 3,688,926 NET Expenses (Revenue) (116,794) 3,326,004 903,116 Capital Expenditure 6,772,087 4,698,805 4,060,010
Page 9
The majority of Council’s capital expenditure is spent on renewal to ensure that the current service levels are maintained. In 2016, Council appointed an external road condition assessor to benchmark the performance of Council’s road assets. The results of this assessment determined that the level of expenditure required to maintain the network to a serviceable level is $2.5 million
Council aims to divide the renewal expenditure into the following asset classes:
• Sealed pavement and shoulders - Council's goal is to reconstruct $800,000 per year. The average useful life of this asset class is 80 years.
• Bituminous seals - Council's goal is to reseal $800,000 per year. The average useful life of this asset class is 20 years.
• Sealed shoulders - Council's goal is to resheet $220,000 per year. The average useful life of this asset class is 15 years.
• Unsealed roads - Council's goal is to resheet $500,000 per year. The average useful life of this asset class is 25 years.
• Bridges - The average useful life of this asset class is 100 years.
Major Initiatives:
• Undertake repairs to roads damaged during the November 2022 floods
• Continue sealed road construction on the Woorak Ni-Ni Lorquon Road
• Undertake shoulder resheets of the Dimboola Minyip Road
• Undertake sealed construction on the Antwerp-Warracknabeal Road
Computation
Community satisfaction rating out of 100 with how Council has performed on the condition of sealed roads.
Additional grants may become available, and natural disaster recovery works may be undertaken during the financial year, however the extent and timing is yet to be determined. Any additional works will be funded/reimbursed by the state/commonwealth and will not impact on the budgeted result of Council.
Drainage Management
Initiatives:
Well maintained, fit for purpose drainage systems within townships.
• Maintenance of Council’s drainage systems including open drains and culverts, an extensive underground drain network and kerb and channel.
Paths & Trails
Well maintained pedestrian access, including disabled access to critical and popular destinations around our townships.
Initiatives: (Refer to the Capital Works Program for further details).
• Council will inspect and maintain the existing network of 40 kilometres of footpaths in accordance with Council’s Road Management Plan.
• Maintenance will include grinding to remove tripping edges and removal of hazards.
Major Initiatives:
• Footpath construction William St Nhill
• Footpath Construction Bow St, Rainbow
Service Indicator Performance Measure Roads Satisfaction Satisfaction with sealed local roads (Community satisfaction rating out of 100 with how Council has performed on the condition of sealed roads) Service area Description of services provided 2021/22 2022/23 2023/24 Actual Forecast Budget Operating Expenditure 476,159 652,321 543,628 Operating Revenue - -NET Expenses (Revenue) 476,159 652,321 543,628 Capital Expenditure 24,165 271,233 34,839 Service area Description of services provided 2021/22 2022/23 2023/24 Actual Forecast Budget Operating Expenditure 240,449 242,838 251,848 Operating Revenue 5,000 300,000NET Expenses (Revenue) 235,449 (57,162) 251,848 Capital Expenditure 313,204 1,284,940 129,839
Page 10
Conduct maintenance, inspections and replanting works on Council road reserves, parks and gardens, and recreation reserves.
Initiatives:
• Undertake reactive and programmed inspections in accordance with Council’s Road Management Plan in relation to nature strip trees that impede footpaths.
• Trim, remove and replace urban trees as necessary. Maintenance of trees is prioritised to ensure a safe passage for pedestrian, access for vehicle traffic and to protect infrastructure.
• Undertake proactive inspections of trees located in high trafficked areas such as parks and recreation reserves for safety purposes.
• Trim and remove rural trees as necessary for road safety purposes.
• Liaise with Powercor and its agencies in relation to trimming and removal of trees under power lines.
Town Beautification
Initiatives:
Maintain and redevelop public open spaces in Dimboola, Jeparit, Nhill and Rainbow.
• Mechanical street sweeping of commercial and urban areas eight times per year.
• Cleaning and maintenance of 17 public toilets located within the four towns.
• Maintenance of grassed parks and open spaces to enhance the amenity of each town.
• Delivery of reactive and programmed inspections in relation to Council-controlled playgrounds.
• Maintenance of playground equipment and soft fall at the 14 playgrounds within the four towns.
Major Initiatives:
• Nhill Streetscape Plan Implementation - Phase 2.
Community Centres & Public Halls
Initiatives:
Maintenance, renewal and upgrade of Councilowned and controlled community centres and halls, and support of communities that undertake these activities on behalf of Council. To protect and enhance the health of the community.
• Maintenance of all Council owned and controlled community centres and halls.
• Inspections and safety audits of community centres and halls.
• Implementation and monitoring of hire agreements for community centres and halls.
• Continue to promote the Nhill Memorial Community Centre to fully utilise the digital projection equipment upgrade.
• Public Halls assistance grants.
Major Initiatives:
• Remedial works on the Nhill Memorial Community Centre.
Recreation Facilities
Initiatives:
Maintenance, renewal and upgrade of Council owned and controlled recreational land, buildings and facilities. Council also supports groups that undertake these activities on behalf of Council.
• Undertake capital works on the Nhill Memorial Community Centre
• Maintenance of Council-owned and controlled recreational buildings and facilities.
• Undertake Davis Park renewal
• Repairs to the Nhill Historical Society
• Caravan Park upgrades
Major Initiatives:
• Davis Park upgrades - AFL compliant changerooms and tiered seating.
municipal population).
Computation
Number of visits to aquatic facilities / Municipal population
Service area Description of services provided 2021/22 2022/23 2023/24 Actual Forecast Budget Operating Expenditure 220,568 443,179 375,807 Operating Revenue - 9,500NET Expenses (Revenue) 220,568 433,679 375,807 Capital Expenditure - -Service area Description of services provided 2021/22 2022/23 2023/24 Actual Forecast Budget Operating Expenditure 698,914 714,684 796,511 Operating Revenue 12,300 6,000NET Expenses (Revenue) 686,614 708,684 796,511 Capital Expenditure 71,658 206,216 155,000 Service area Description of services provided 2021/22 2022/23 2023/24 Actual Forecast Budget Operating Expenditure 230,487 249,372 277,330 Operating Revenue 4,616 6,900 5,000 NET Expenses (Revenue) 225,871 242,472 272,330 Capital Expenditure 14,653 108,684 175,000 Service area Description of services provided 2021/22 2022/23 2023/24 Actual Forecast Budget Operating Expenditure 911,025 945,690 1,080,437 Operating Revenue 198,939 3,100 6,000 NET Expenses (Revenue) 712,086 942,590 1,074,437 Capital Expenditure 364,456 2,489,956 940,000 Service Indicator Performance Measure Acquatic Facilities Utilisation Utilisation of aquatic facilities (Number of visits to aquatic facilities per head of
Tree
Management
Page 11
Waste Management
Initiatives:
Management of Council’s transfer stations and collection and disposal of domestic waste and recyclables across the Shire.
• Weekly kerbside collection of garbage bins.
• Fortnightly kerbside collection of recycle bins.
• Manage the operations of transfer stations.
• Regular removal of litter from commercial and urban areas.
• One free green waste month per year.
• Roll out of mobile glass bins for residents.
[Weight of recyclables and green organics collected from kerbside bins / Weight of garbage, recyclables and green organics collected from kerbside bins] x 100
Quarry Operations Management of Council-owned and controlled quarries and gravel pits for extraction of gravel for road making.
Initiatives:
• Coordinate the timely extraction and crushing of suitable quarry materials to ensure sufficient quantities are available for Council’s maintenance and capital projects.
• Ensure quarries are operated and rehabilitated in line with work authority guidelines and statutory obligations.
• Researching and exploring new gravel supplies.
Waterway Management Management of Council-controlled waterways including weir pools and lakes.
Initiatives:
• Maintenance of navigational aids on Council-controlled waterways including Dimboola and Jeparit weir pools and Lake Hindmarsh.
• Implement management arrangements for the Dimboola and Jeparit weirs.
• Provide water allocation to assist maintenance of water levels of Nhill Lake.
Environmental Management Manage, protect and enhance Council’s natural assets in conjunction with Government departments and environmental groups.
Initiatives:
• Continue to work with local Landcare groups.
• Implement Council's Roadside Management Strategy.
• Eradication of pest plants and pest animals.
• Explore innovative waste management options for green waste.
• Continue to support the Wimmera Mallee Sustainability Alliance.
Fire Prevention Identification of potential fire hazards and prevention of loss of life and property caused by fire.
Initiatives:
• Conduct annual inspections of properties that may pose a fire risk.
• Issue notices to property owners to remove potential fire risks.
• Slashing or spraying of roadsides to reduce fire hazards.
• Review the Municipal Fire Management Plan.
Service area Description of services provided 2021/22 2022/23 2023/24 Actual Forecast Budget Operating Expenditure 1,274,483 1,592,899 1,432,926 Operating Revenue 1,331,971 1,368,575 1,433,142 NET Expenses (Revenue) (57,488) 224,324 (216) Capital Expenditure - 460,000Service Indicator Performance Measure Waste Collection Waste diversion Kerbside collection waste diverted from landfill (Percentage of garbage, recyclables and green organics collected from kerbside bins that is diverted from landfill) Service area Description of services provided 2021/22 2022/23 2023/24 Actual Forecast Budget Operating Expenditure 406,793 251,952 255,080 Operating Revenue 412,858 2,500 2,500 NET Expenses (Revenue) (6,065) 249,452 252,580 Capital Expenditure - -Service area Description of services provided 2021/22 2022/23 2023/24 Actual Forecast Budget Operating Expenditure 95,530 99,542 97,351 Operating Revenue 22,631 -NET Expenses (Revenue) 72,900 99,542 97,351 Capital Expenditure - -Service area Description of services provided 2021/22 2022/23 2023/24 Actual Forecast Budget Operating Expenditure 209,498 185,287 159,489 Operating Revenue 79,464 75,000 75,000 NET Expenses (Revenue) 130,034 110,287 84,489 Capital Expenditure - -Service area Description of services provided 2021/22 2022/23 2023/24 Actual Forecast Budget Operating Expenditure 111,641 140,777 150,447 Operating Revenue 36,958 45,000 35,000 NET Expenses (Revenue) 74,683 95,777 115,447 Capital Expenditure - - -
Computation
Page 12
2.3 Strategic Objective 3: Competitive and Innovative Economy
To achieve our KRA Competitive and Innovative Economy, our mission is to foster a sustainable and diversified local economy where economic growth is encouraged and supported.
Economic Development
Initiatives:
Facilitate an environment that is conducive to a sustainable and growing local business sector and provides opportunities for residents to access employment.
• Support and promote work experience, apprenticeships and cadetships.
• Represent Council at local, regional and state shows and expos in order to market the Shire’s liveability, tourism assets and opportunities.
• Support local business associations and local businesses.
• Membership of Rural Councils Victoria and the Wimmera Development Association.
• Support and promote caravan and camping accommodation within the Shire.
• Support the Nhill Aerodrome Masterplan Advisory committee.
• Provide support and advocate on behalf of newly migrated residents.
Tourism
To develop a thriving Wimmera Mallee Tourism industry predominantly based on, but not limited to, the Shire’s heritage and environmental assets.
Initiatives:
• Promote and maintain a Hindmarsh Tourism website.
• Work collaboratively with Wimmera Mallee Tourism, the Wimmera Mallee region’s Indigenous Tourism Group and Hindmarsh Visitor Information Centre Volunteers.
• Assist community based groups and project working groups to manage projects promoting tourism growth.
• Work with Yurunga Homestead and Wimmera Mallee Pioneer Museum Committees of Management to assist them to promote and market their respective assets in order for them to realise their tourism potential.
• Implement the recommendations in the Wimmera Mallee Pioneer Museum master plan.
• Support innovative community-driven events and festivals that stimulate growth in the region.
• Continue to replace old town entry and tourism signs with newly designed signs.
Major Initiatives:
• Nhill Historical Society veranda and roof urgent works.
Private Works
Provision of private civil works services.
• Provide quotations for private works undertaken by Council’s works department to residents, contractors and other authorities.
• Potential private works include grading of farm driveways, grading of fence lines, construction of driveway cross-overs, and supply of labour, plant and materials.
Private works also include repair to Council's infrastructure caused by repair work to third party assets.
Service area Description of services provided 2021/22 2022/23 2023/24 Actual Forecast Budget Operating Expenditure 314,921 246,767 146,649 Operating Revenue 287,766 7,500 7,500 NET Expenses (Revenue) 27,155 239,267 139,149 Capital Expenditure 28,461 50,000 50,000 Service area Description of services provided 2021/22 2022/23 2023/24 Actual Forecast Budget Operating Expenditure 216,170 331,601 302,206 Operating Revenue 201,309 705,700NET Expenses (Revenue) 14,861 (374,099) 302,206 Capital Expenditure 213,199 1,356,610 139,796 Service area Description of services provided 2021/22 2022/23 2023/24 Actual Forecast Budget Operating Expenditure 370,216 391,567 442,726 Operating Revenue 343,253 398,000 508,000 NET Expenses (Revenue) 26,964 (6,433) (65,274) Capital Expenditure - - -
Page 13
Caravan Parks and Camping Grounds Maintenance, renewal and upgrade of Council Caravan Parks and Camping Grounds.
Initiatives:
• Support caravan parks and camping grounds accommodation managers within the Shire.
• Maintenance and enhancement of buildings and grounds at Council caravan parks and camping grounds.
• Continue the implementation of the Riverside Holiday Park, Dimboola master plan.
Major Initiatives:
• New New powered sites for Dimboola Holiday Park.
Land Use Planning
Initiatives:
To ensure that any development that occurs in Hindmarsh Shire is carried out in accordance with relevant planning policies, principals and controls.
• Provide customers with advice on planning scheme requirements.
• Prepare and assess planning scheme amendments and consider planning permit applications.
• Represent Council at Panel Hearings and at Victorian Civil and Administrative Tribunal.
• Undertake planning scheme compliance checks when necessary.
• Process subdivisions and planning certificates.
• Implement actions from the Wimmera Southern Mallee Regional Growth Plan.
To provide statutory and private building services to the community
Initiatives:
• To carry out Council's statutory private building requirements.
• Issuing of building permits and certificates.
• Receipt and recording of building permits undertaken by private building surveyors.
• Undertake building enforcement and compliance checks.
• Provision of reports to the Building Control Commission. Aerodrome Manage and maintain the Nhill Aerodrome
Initiatives:
• Scheduled inspections and maintenance at the Nhill Aerodrome.
• Provide support to the Nhill Aerodrome Masterplan Advisory Committee to update and implement the Nhill Aerodrome Master Plan.
Service area Description of services provided 2021/22 2022/23 2023/24 Actual Forecast Budget Operating Expenditure 508,352 569,067 596,271 Operating Revenue 1,357,964 1,497,000 730,000 NET Expenses (Revenue) (849,613) (927,933) (133,729) Capital Expenditure 1,276,104 2,762,501 166,000 Service area Description of services provided 2021/22 2022/23 2023/24 Actual Forecast Budget Operating Expenditure 254,561 245,601 291,086 Operating Revenue 100,655 74,000 81,500 NET Expenses (Revenue) 153,906 171,601 209,586 Capital Expenditure - -Service Indicator Performance Measure Statutory Planning Decision making Council planning decisions upheld at VCAT (Percentage of planning application decisions subject to review by VCAT and that were not set aside) Service area Description of services provided 2021/22 2022/23 2023/24 Actual Forecast Budget Operating Expenditure 205,336 272,643 245,713 Operating Revenue 51,218 41,500 49,000 NET Expenses (Revenue) 154,118 231,143 196,713 Capital Expenditure - -Service area Description of services provided 2021/22 2022/23 2023/24 Actual Forecast Budget Operating Expenditure 115,153 115,868 94,069 Operating Revenue 13,169 155,000 5,000 NET Expenses (Revenue) 101,984 (39,132) 89,069 Capital Expenditure - 300,000 30,000
Computation [Number of VCAT decisions that did not set aside Council’s decision in relation to a planning application / Number of VCAT decisions in relation to planning applications] x 100 Building
Control
Page 14
2.4 Strategic Objective 4: Good Governance and Financial Sustainability
To achieve our KRA Good Governance and Financial Sustainability, our mission is to promote user friendly services to ensure transparency, good governance and financial sustainability, and to advance gender equality, equity and inclusion for all.
Civic Governance & Leadership
Initiatives:
To ensure that Council provides effective leadership and that its decisions are transparent, inclusive and based on sound recommendations and advice.
• Management support for the Mayor and Council.
• Regular media releases and newsletters to inform the community of current issues.
• Lobbying of politicians and government departments.
• Advocacy on behalf of the community on key local government issues.
• Memberships include Municipal Association of Victoria, Rural Council Victoria, North West Municipalities Association and Wimmera Development Association.
• Community Satisfaction Survey.
Satisfaction with Council decisions (Community satisfaction rating out of 100 with how Council has performed in making decisions in the interests of the community)
Computation
Community satisfaction rating out of 100 with how
Council has performed in making decisions in the interests of the community
Customer Service Centres
Initiatives:
Operation and maintenance of customer service centres to provide facilities from which Council can efficiently deliver services to the community. Provision of information to ratepayers and the general public on a broad range of services provided by Council and other government agencies.
• Seek improvement in the community satisfaction survey conducted annually.
• Provision of licensing and registration services on behalf of VicRoads.
Council Elections
Efficient and effective running of Elections by the Victorian Electoral Commission on behalf of Council.
Financial Management
Initiatives:
To ensure the efficient and effective allocation of resources through sound financial planning and management that secures the long term financial viability of the municipality.
• Preparation of Council’s annual budget, including the capital works budget, and refinement of Council's 10 year financial plan to aide in Council's long term financial sustainability.
• Preparation of Council’s Annual Financial Report.
• Preparation of management reports to Council and Senior Managers.
• Support of the internal and external audit functions.
• Continued lobbying of governments for additional funding and resources.
Service area Description of services provided 2021/22 2022/23 2023/24 Actual Forecast Budget Operating Expenditure 968,651 1,077,627 1,227,525 Operating Revenue - -NET Expenses (Revenue) 968,651 1,077,627 1,227,525 Capital Expenditure 1,405 -Service Indicator
Governance
Service area Description of services provided 2021/22 2022/23 2023/24 Actual Forecast Budget Operating Expenditure 479,714 513,619 584,074 Operating Revenue - -NET Expenses (Revenue) 479,714 513,619 584,074 Capital Expenditure 2,283 24,057 180,000 Service area Description of services provided 2021/22 2022/23 2023/24 Actual Forecast Budget Operating Expenditure 1,836 - 4,000 Operating Revenue 4,671 500NET Expenses (Revenue) (2,835) (500) 4,000 Capital Expenditure - -Service area Description of services provided 2019/20 2021/22 2022/23 Actual Forecast Budget Operating Expenditure 469,235 491,473 530,444 Operating Revenue 7,725,049 3,995,976 6,860,872 NET Expenses (Revenue) (7,255,814) (3,504,503) (6,330,428) Capital Expenditure - - -
Performance Measure
Satisfaction
Page 15
Rating and Valuations
Management of Council's rating system, including valuation of properties and the levying of rates and charges.
• Review and implementation of Council's Rating Plan.
• Maintenance of property and valuation records, including supplementary valuations.
• Administering Pensioner rate concessions on behalf of the State Government.
• Issue of quarterly Rates and Valuations notices.
• Collection of rates and legal action where necessary.
• Issue of Land Information Certificates.
Initiatives:
• Further enhance the MagiQ records module.
• Provide training and development for staff to implement further efficiencies and features in the records management system.
Major Initiatives:
• Continue the collaboration with neighbouring Councils in the Rural Council's Transformation Project.
Risk Management
Monitor and manage Council's risks in relation to operations, employment and infrastructure.
Initiatives:
• Monitor and review the Risk Register.
• Regular review of the risks and control measures by Senior Management.
• Ensuring that Council's assets and interests are insured adequately against risk.
• Management of WorkCover Authority insurance and work place injury claims.
• Advise staff and contractors in relation to Workplace Health and Safety.
• Ensure that Council is aware of, and complies with, all of its statutory obligations.
• Integrate risk management into all Council projects, conducting risk assessments at the strategic, planning and implementation stages.
Contract Management
Initiatives:
Preparation of contract specifications, administration of tender processes and management of Council's contracted services.
• Tender preparation and specification development.
• Supervision and management of contracted Council services.
• Ensure that Council's tendering processes (including letting of tenders and appointment of contractors) comply with Council purchasing policies and statutory obligations.
• Ensure value for money and best products are achieved.
Service area Description of services provided 2021/22 2022/23 2023/24 Actual Forecast Budget Operating Expenditure 206,305 228,367 232,748 Operating Revenue 8,124,640 8,244,551 8,512,912 NET Expenses (Revenue) (7,918,336) (8,016,184) (8,280,164) Capital Expenditure - -Service area Description of services provided 2021/22 2022/23 2023/24 Actual Forecast Budget Operating Expenditure 57,886 81,102 106,779 Operating Revenue - -NET Expenses (Revenue) 57,886 81,102 106,779 Capital Expenditure - -Service area Description of services provided 2021/22 2022/23 2023/24 Actual Forecast Budget Operating Expenditure 301,416 360,922 420,250 Operating Revenue - -NET Expenses (Revenue) 301,416 360,922 420,250 Capital Expenditure 65,206 104,500 85,000 Service area Description of services provided 2021/22 2022/23 2023/24 Actual Forecast Budget Operating Expenditure 475,704 565,818 687,523 Operating Revenue 1,022 72,000 35,000 NET Expenses (Revenue) 474,681 493,818 652,523 Capital Expenditure - -Service area Description of services provided 2021/22 2022/23 2023/24 Actual Forecast Budget Operating Expenditure 251,261 202,725 202,911 Operating Revenue - -NET Expenses (Revenue) 251,261 202,725 202,911 Capital Expenditure - -Records Management Effective and efficient recording, storage, retrieval and disposal of records in line with the standards of the Public Records Office of Victoria.
efficient
effective services.
Information Technology Using Information Technology as a tool to connect with the community and provide
and
Initiatives:
Page 16
Provision of payroll services to Council employees and the provision of Human Resources services to management.
Initiatives:
• Review payroll processes for employees.
• Ensure compliance with legislation and Council's Enterprise Agreement.
Emergency Management
Initiatives:
Provide support to the community in the areas of emergency preparedness, emergency response and emergency recovery.
• Training for staff undertaking emergency management roles.
• Actively participate in the Wimmera Emergency Management Cluster with Horsham Rural City Council, Yarriambiack Shire Council, and West Wimmera Shire Council.
Depots & Workshops
Initiatives:
Operation of Council's depots and workshops including the provision of heavy plant and equipment.
• Securely house plant, equipment and materials.
• Provide a base for the outdoor staff.
• Provide a location to carry out maintenance and repairs of Council’s plant and equipment.
• Purchase and maintain plant and equipment to enable the delivery of works.
Asset Management
Initiatives:
Provision of skills, resources and systems to ensure the most efficient and effective management of Council's assets.
• Ensure that Council targets the correct level of asset expenditure to achieve and maintain the desired levels of service into the foreseeable future.
• Ensure that Council’s asset renewal expenditure targets the most critical assets.
• Provide regular condition and defect audits of Council’s assets to ensure safety and levels of service are maintained.
• Provide Council’s asset valuations.
• Continued review of Council’s roads hierarchy and Road Management Plan.
• Management and maintenance of Council’s electronic asset management system. The system is used as a repository for infrastructure asset data, and used to manage asset related inspections and corrective actions, and customer action requests.
• Further develop Council’s electronic asset management system to store and manage all of Council’s asset related data.
• Protect and monitor Council’s assets in relation to private works including:
o Inspections
o Road Opening Permits
o Act as a planning referral body
• An asset inspection program which includes:
o Up to three (3) road inspections per year (including a night time inspection);
o Monthly inspections of kindergartens, playgrounds, exercise equipment and skate parks across the four (4) towns;
o Swimming pool inspections four (4) times per year;
o Six (6) bridge and numerous car park inspections twice per year;
o 542 Fire Plug inspections annually;
o Tree inspections twice per year in high use public areas; and
o Reactive inspections as a result of Customer Action Requests.
Service area Description of services provided 2021/22 2022/23 2023/24 Actual Forecast Budget Operating Expenditure 303,166 369,908 389,840 Operating Revenue - -NET Expenses (Revenue) 303,166 369,908 389,840 Capital Expenditure - -Service area Description of services provided 2021/22 2022/23 2023/24 Actual Forecast Budget Operating Expenditure 61,344 78,337 81,476 Operating Revenue - -NET Expenses (Revenue) 61,344 78,337 81,476 Capital Expenditure - -Service area Description of services provided 2021/22 2022/23 2023/24 Actual Forecast Budget Operating Expenditure 213,420 1,300,690 1,281,731 Operating Revenue - 32,000 16,000 NET Expenses (Revenue) 213,420 1,268,690 1,265,731 Capital Expenditure 2,057,667 2,063,666 1,145,000 Service area Description of services provided 2021/22 2022/23 2023/24 Actual Forecast Budget Operating Expenditure 239,069 393,739 274,183 Operating Revenue 2,696 1,500 2,000 NET Expenses (Revenue) 236,374 392,239 272,183 Capital Expenditure- -
Payroll and Human Resources Services Page 17
Fleet Management
Ensure that Council's vehicle fleet is managed, maintained and replaced in the most efficient and efficient way possible.
• Timely maintenance of fleet vehicles.
• Purchase and replacement of fleet vehicles in accordance with Council policy.
• Maintenance of secure payment systems and processes.
• Payment of invoices in accordance with Council’s payment terms (within 30 days).
• All payments to be made via EFT or Direct Credit.
• Monthly invoicing of accounts.
• Ensure Council's Outstanding Debtor are followed up in a timely manner.
• Regular reports to management on outstanding debtors.
2.5 Reconciliation with budgeted operating result
Service area Description of services provided 2021/22 2022/23 2023/24 Actual Forecast Budget Operating Expenditure 216,846 239,506 217,864 Operating Revenue 83,973 80,000 86,200 NET Expenses (Revenue) 132,873 159,506 131,664 Capital Expenditure 250,127 525,373 246,000 Service area Description of services provided 2021/22 2022/23 2023/24 Actual Forecast Budget Operating Expenditure 36,977 38,428 37,412 Operating Revenue - -NET Expenses (Revenue) 36,977 38,428 37,412 Capital Expenditure - -Service area Description of services provided 2021/22 2022/23 2023/24 Actual Forecast Budget Operating Expenditure 13,866 18,410 18,030 Operating Revenue - -NET Expenses (Revenue) 13,866 18,410 18,030 Capital Expenditure - -1,198,853 1,874,576 675,723 6,048,469 10,012,895 3,964,426 737,720 2,118,720 1,381,000 (692,988) 6,296,789 6,989,777 Total 7,292,055 20,302,981 13,010,926 7,292,055 8,523,207 Waste charge revenue 1,281,142 Total funding sources 9,804,349 Operating (surplus)/deficit for the year (2,512,294) Initiatives:
Initiatives:
Initiatives:
Funding
Rates
Built
Competitive
Good
Deficit before funding sources
sources added in:
and charges revenue Our Community
& Natural Environment
& Innovative Economy
Governance & Financial Sustainability
Net Cost Expenditure Revenue Accounts Payable Payment of invoices in
Accounts Receivable Receival of payments from debtors in
and
an efficient and timely manner.
an efficient
timely manner.
Page 18
3. Financial Statements
This section presents information in regard to the Financial Statements and Statement of Human Resources. The budget information for the year 2023/24 has been supplemented with projections to 2026/27
This section includes the following financial statements prepared in accordance with the Local Government Act 2020 and the Local Government (Planning and Reporting) Regulations 2020
Comprehensive Income Statement
Balance Sheet
Statement of Changes in Equity
Statement of Cash Flows
Statement of Capital Works
Statement of Human Resources
Page 19
Forecast Actual 2022/23 2023/24 2024/25 2025/26 2026/27 NOTES $’000 $’000 $’000 $’000 $’000 Income / Revenue Rates and charges 4.1.1 9,434 9,804 10,098 10,401 10,713 Statutory fees and fines 4.1.2 197 203 209 216 222 User fees 4.1.3 1,652 1,606 1,654 1,704 1,755 Grants - operating 4.1.4 2,316 5,502 5,430 5,593 5,761 Grants - capital 4.1.4 6,565 4,770 2,081 2,081 2,081 Contributions - monetary 4.1.5 18 12 12 13 13 Net gain (or loss) on disposal of property, infrastructure, plant and equipment 332 480 300 300 300 Share of net profits (or loss) of associates and joint ventures 17 - - -Other income 4.1.6 435 443 430 443 456 Total income / revenue 20,964 22,820 20,215 20,750 21,301 Expenses Employee costs 4.1.7 8,250 8,062 7,747 7,961 8,179Materials and services 4.1.8 6,271 5,860 6,065 6,277 6,747 Depreciation 4.1.9 5,460 4,839 5,080 5,330 5,330 Other expenses 4.1.10 1,537 1,548 1,602 1,658 1,716 Total expenses 21,518 20,308 20,494 21,225 21,972 Surplus/(deficit) for the year (553) 2,512 (278) (475) (670) Total comprehensive result (553) 2,512 (278) (475) (670) Budget Projections Page 20
Comprehensive Income Statement For the four years ending 30 June 2027
Balance Sheet
For the four years ending 30 June 2027
Forecast Actual 2022/23 2023/24 2024/25 2025/26 2026/27 NOTES $’000 $’000 $’000 $’000 $’000 Assets Current assets Cash and cash equivalents 2,070 2,018 1,949 2,191 1,673 Trade and other receivables 1,825 1,600 1,920 2,208 2,506 Inventories 505 507 523 522 522 Other assets 54 23 24 25 25 Total current assets 4.2.1 4,454 4,149 4,415 4,946 4,727 Non-current assets Investment in Wimmera Development Association 295 295 295 295 295 Property, infrastructure, plant & equipment 213,513 216,129 215,579 214,537 214,061 Total non-current assets 4.2.1 213,808 216,424 215,874 214,832 214,356 Total assets 218,262 220,573 220,289 219,778 219,083 Liabilities Current liabilities Trade and other payables 2,153 1,903 1,823 1,709 1,604 Trust funds and deposits 102 81 81 81 81 Provisions 2,215 2,264 2,332 2,402 2,474 Total current liabilities 4.2.2 4,470 4,249 4,236 4,192 4,159 Non-current liabilities Provisions 218 238 246 253 261 Total non-current liabilities 4.2.2 218 238 246 253 261 Total liabilities 4,688 4,487 4,482 4,445 4,419 Net assets 213,574 216,086 215,808 215,333 214,663 Equity Accumulated surplus 79,329 81,842 81,563 81,089 80,418 Reserves 134,244 134,244 134,244 134,244 134,244 Total equity 213,574 216,086 215,808 215,333 214,663
Budget Page 21
Projections
Statement of Changes in Equity
For the four years ending 30 June 2027
Total Accumulated Surplus Revaluation Reserve NOTES $’000 $’000 $’000 2023 Forecast Actual Balance at beginning of the financial year 214,127 79,882 134,245 Surplus/(deficit) for the year (553) (553)Net asset revaluation increment/(decrement) - -Balance at end of the financial year 213,574 79,329 134,245 2024 Budget Balance at beginning of the financial year 213,574 79,329 134,245 Surplus/(deficit) for the year 2,512 2,512Net asset revaluation increment/(decrement) - -Balance at end of the financial year 4.3.1 216,086 81,841 134,245 2025 Balance at beginning of the financial year 216,086 81,841 134,245 Surplus/(deficit) for the year (278) (278)Net asset revaluation increment/(decrement) - -215,808 81,563 134,245 2026 Balance at beginning of the financial year 215,808 81,563 134,245 Surplus/(deficit) for the year (475) (475)Net asset revaluation increment/(decrement) - -215,333 81,088 134,245 2027 Balance at beginning of the financial year 215,333 81,088 134,245 Surplus/(deficit) for the year (670) (670)Net asset revaluation increment/(decrement) - -214,663 80,418 134,245 Balance at end of the financial year Balance at end of the financial year Balance at end of the financial year Page 22
Statement of Cash Flows
For the four years ending 30 June 2027
Forecast Actual 2022/23 2023/24 2024/25 2025/26 2026/27 Notes $’000 $’000 $’000 $’000 $’000 Inflows Inflows Inflows Inflows Inflows (Outflows) (Outflows) (Outflows) (Outflows) (Outflows) Rates and charges 9,414 9,784 10,098 10,401 10,713 Statutory fees and fines 33 27 209 216 222 User fees 1,926 2,047 1,654 1,704 1,755 Grants - operating 2,316 5,552 5,430 5,593 5,761 Grants - capital 6,115 4,770 2,081 2,081 2,081 Contributions - monetary 18 12 12 12 12 Interest received 210 240 252 252 252 Other receipts 1,045 203 178 191 204 Net GST refund / payment - - - -Employee costs (8,204) (8,016) (7,747) (7,961) (8,179) Materials and services (7,185) (6,129) (6,386) (6,581) (7,050) Trust funds and deposits repaid - (20) (20) (20) (20) Other payments (1,537) (1,548) (1,602) (1,658) (1,716) Net cash provided by/(used in) operating activities 4.4.1 4,152 6,923 4,160 4,231 4,036 (17,394) (7,455) (4,530) (4,288) (4,854) 332 480 300 300 300 Net cash provided by/ (used in) investing activities 4.4.2 (17,062) (6,975) (4,230) (3,988) (4,554) Net increase/(decrease) in cash & cash equivalents (12,910) (52) (70) 243 (518) 14,980 2,070 2,018 1,949 2,191 2,070 2,018 1,949 2,191 1,673 Projections Budget Cash flows from operating activities Cash flows from investing activities Cash and cash equivalents at the end of the financial year Cash and cash equivalents at the beginning of the financial year Payments for property, infrastructure, plant and equipment Proceeds from sale of property, infrastructure, plant and equipment Page 23
Statement of Capital Works
For the four years ending 30 June 2027
* Future Capital works reflect what Council requires to meet it's capital renewal target.
Forecast Actual 2022/23 2023/24 2024/25 2025/26 2026/27 NOTES $’000 $’000 $’000 $’000 $’000 Property Land - - - -Total land - - - -Buildings 4,594 1,180 250 250 250 Total buildings 4,594 1,180 250 250 250 Total property 4,594 1,180 250 250 250 Plant and equipment 2,113 1,291 1,250 1,250 1,250 Fixtures, fittings and furniture 5 5 5 5 5 Computers and telecommunications 105 85 60 60 60 Library books 56 50 40 40 40 Total plant and equipment 2,278 1,431 1,355 1,355 1,355 Infrastructure Roads 3,897 3,822 2,350 2,280 2,150 Bridges 424 - 10 10 330 Footpaths and cycleways 1,285 130 140 185 383 Drainage 271 35 - - 246 Recreational, leisure and community facilities - - 175 38 40 Kerb & Channel 378 100 250 170 100 Other infrastructure 4,267 757 - -Total infrastructure 10,522 4,844 2,925 2,683 3,249 Total capital works expenditure 4.5.1 17,394 7,455 4,530 4,288 4,854 Represented by: New asset expenditure 5,432 357 - -Asset renewal expenditure 7,323 5,934 4,495 4,288 4,854 Asset expansion expenditure - 180 - -Asset upgrade expenditure 4,638 984 35 -Total capital works expenditure 4.5.1 17,394 7,455 4,530 4,288 4,854 Grants 11,328 4,770 2,081 2,081 2,081 Contributions - - - -Council cash 6,066 2,685 2,449 2,207 2,773 Total capital works expenditure 4.5.1 17,394 7,455 4,530 4,288 4,854
Plant, machinery and equipment Funding sources represented by:
Projections
Budget Page 24
Statement of Human Resources
For the four years ending 30 June 2027
A summary of human resources expenditure categorised according to the organisational structure of Council is included below:
A summary of the number of full time equivalent (FTE) Council staff in relation to the above expenditure is included below:
Forecast Actual 2022/23 2023/24 2024/25 2025/26 2026/27 $’000 $’000 $’000 $’000 $’000 Staff expenditure Employee costs - operating 7,211 8,062 7,744 7,961 8,179 Employee costs - capital 1,039 894 918 944 970 Total staff expenditure 8,250 8,956 8,662 8,905 9,149 FTE FTE FTE FTE FTE Staff numbers Employees 98.6 96.1 91.8 91.8 91.8 Total staff numbers 98.6 96.1 91.8 91.8 91.8 Budget 2023/24 Full Time Part time $'000 $'000 $'000 $'000 $'000 Civic Governance 768 768 - -Corporate and Community Services 2,643 1,658 911 75Infrastructure 4,650 4,155 356 139Total permanent staff expenditure 8,062 6,581 1,267 214Other employee related expenditureCapitalised labour costs 894 Total expenditure 8,956 Budget 2023/24 Full Time Part time Civic Governance 4 4 - -Corporate and Community Services 28 17 9 2Infrastructure 65 57 5 3Total staff 96 78 13 5 -
Permanent Comprises Department Comprises Permanent Casual Temporary Casual Temporary Department Projections Budget Page 25
Summary of Planned Human Resources Expenditure
For the four years ending 30 June 2027
2023/24 2024/25 2025/26 2026/27 $'000 $'000 $'000 $'000 768 789 811 833 Women 495 509 523 537 Men 273 281 288 296 768 789 811 833 1,658 1,633 1,678 1,724 Women 1,158 1,119 1,150 1,182 Men 500 514 528 543 911 517 531 546 Women 911 517 531 546 Men 0 0 0 0 2,569 2,150 2,209 2,270 Infrastructure 4,155 4,269 4,387 4,507 Women 128 132 135 139 Men 4,027 4,138 4,252 4,368 356 366 376 386 Women 292 300 308 317 Men 64 66 68 69 4,511 4,635 4,763 4,893 Casuals, temporary and other expenditure 214 173 178 183 Capitalised labour costs 894 918 944 970 8,062 7,747 7,961 8,179 2023/24 2024/25 2025/26 2026/27 FTE FTE FTE FTE 4.0 4.0 4.0 4.0 Women 3.0 3.0 3.0 3.0 Men 1.0 1.0 1.0 1.0 4.0 4.0 4.0 4.0 17.0 16.0 16.0 16.0 Women 12.0 11.0 11.0 11.0 Men 5.0 5.0 5.0 5.0 8.5 6.0 6.0 6.0 Women 8.5 6.0 6.0 6.0 Men 0.0 0.0 0.0 0.0 25.5 22.0 22.0 22.0 Infrastructure 57.0 57.0 57.0 57.0 Women 1.0 1.0 1.0 1.0 Men 56.0 56.0 56.0 56.0 4.7 4.8 4.8 4.8 Women 3.2 3.2 3.2 3.2 Men 1.5 1.5 1.5 1.5 61.7 61.8 61.8 61.8 Casuals and temporary staff 4.9 4.0 4.0 4.0 Capitalised labour 13.0 13.0 13.0 13.0 96.1 91.8 91.8 91.8 Permanent - Part time Permanent - Full time
Civic Governance Permanent - Full time Total Civic Governance Corporate and Community Services Permanent - Full time Permanent - Part time Total Corporate and Community Services Total Infrastructure Total staff expenditure Corporate and Community Services Total staff numbers Total Infrastructure Permanent - Part time Total Corporate and Community Services Permanent - Full time Permanent - Part time Permanent - Full time Civic Governance Permanent - Full time Total Civic Governance Page 26
4. Notes to the financial statements
This section presents detailed information on material components of the financial statements. Council needs to assess which components are material, considering the dollar amounts and nature of these components.
4.1 Comprehensive Income Statement
4.1.1 Rates and charges
Rates and charges are required by the Act and the Regulations to be disclosed in Council’s budget.
As per the Local Government Act 2020 , Council is required to have a Revenue and Rating Plan which is a four year plan for how Council will generate income to deliver the Council Plan, program and services and capital works commitments over a four-year period.
In developing the Budget, rates and charges were identified as an important source of revenue. Planning for future rate increases has therefore been an important component of the financial planning process. The Fair Go Rates System (FGRS) sets out the maximum amount councils may increase rates in a year. For 2023/24 the FGRS cap has been set at 3.50% The cap applies to both general rates and municipal charges and is calculated on the basis of council’s average rates and charges.
The level of required rates and charges has been considered in this context, with reference to Council's other sources of income and the planned expenditure on services and works to be undertaken for the community.
To achieve these objectives while maintaining service levels and a strong capital expenditure program, the average general rate and the municipal charge will increase by 3.50% in line with the rate cap.
This will raise total rates and charges for 2023/24 to $370.383.
4.1.1(a)
reconciliation of the total rates and charges to the Comprehensive Income Statement is as follows:
*These items are subject to the rate cap established under the FGRS
4.1.1(b) The rate in the dollar to be levied as general rates under section 158 of the Act for each type or class of land compared with the previous financial year
2022/23 2023/24 Forecast Actual Budget $’000 $’000 $’000 General rates* 7,403 7,676 273 3.69% Municipal charge* 749 747 (2) -0.29% Kerbside collection and recycling 1,118 1,218 100 8.90% General waste charge 56 63 7 13.00% Windfarm in lieu of rates 108 100 (8) -7.05% Total rates and charges 9,434 9,804 370 3.93% 2022/23 2023/24 cents/$CIV* cents/$CIV* Residential properties 0.00287260 0.00208960 -27.26% Farm Land 0.00258530 0.00188070 -27.25% Business, Industrial & Commercial Land 0.00258530 0.00188070 -27.25% Recreational & Cultural Land 0.00143630 0.00104480 -27.26% Urban Vacant Land 0.00574520 0.00417920 -27.26%
The
Change
%
Type or class of land Change
Page 27
4.1.1(c) The estimated total amount to be raised by general rates in relation to each type or class of land, and the estimated total amount to be raised by general rates, compared with the previous financial year
4.1.1(d) The number of assessments in relation to each type or class of land, and the total number of assessments, compared with the previous financial year
4.1.1(e) The basis of valuation to be used is the Capital Improved Value (CIV)
4.1.1(f) The estimated total value of each type or class of land, and the estimated total value of land, compared with the previous financial year
2022/23 2023/24 $’000 $’000 $’000 % Residential properties 1,124 1,049 (75) -6.69% Farm Land 6,088 6,462 375 6.16% Business, Industrial & Commercial Land 152 124 (29) -18.90% Recreational & Cultural Land 3 3 (0) -14.10% Urban Vacant Land 36 39 3 8.55% Total amount to be raised by general rates 7,403 7,676 273 3.69% 2022/23 2023/24 Number Number Number % Residential properties 2,548 2,559 11 0.43% Farm Land 2,087 2,102 15 0.72% Business, Industrial & Commercial Land 326 326 - 0.00% Recreational & Cultural Land 15 15 - 0.00% Urban Vacant Land 167 170 3 1.80% Total number of assessments 5,143 5,172 29 0.56%
2022/23 2023/24 $’000 $’000 $’000 % Residential properties 395,759 502,048 106,289 26.86% Farm Land 2,355,908 3,436,238 1,080,330 45.86% Business, Industrial & Commercial Land 59,071 65,752 6,681 11.31% Recreational & Cultural Land 2,208 2,608 400 18.12% Urban Vacant Land 6,309 9,224 2,915 46.21% Total value of land 2,819,254 4,015,869 1,196,614 42.44%
Type or class of land Change Type or class of land Change Type or class of land Change
Page 28
4.1.1(g) The municipal charge under Section 159 of the Act compared with the previous financial year
4.1.1(h) The estimated total amount to be raised by municipal charges compared with the previous financial year
4.1.1(i) The rate or unit amount to be levied for each type of service rate or charge under Section 162 of the Act compared with the previous financial year
4.1.1(j) The estimated total amount to be raised by each type of service rate or charge, and the estimated total amount to be raised by service rates and charges, compared with the previous financial year
4.1.1(k) The estimated total amount to be raised by all rates and charges compared with the previous financial year
*These items are subject to the rate cap established under the FGRS
Per Rateable Property Per Rateable Property 2022/23 2023/24 $ $ $ % Municipal 200 200 - 0.00% 2022/23 2023/24 $ $ $ % Municipal 749,000 746,800 (2,200) -0.29% Per Rateable Property Per Rateable Property 2022/23 2023/24 $ $ $ % Kerbside waste/recycling collection charge 418 453 35 8.37% General waste charge 15 17 2 13.33% Total 433 470 37 8.55% 2022/23 2023/24 $ $ $ % Kerbside waste/recycling collection charge 1,118,150 1,217,664 99,514 8.90% General waste charge 56,175 63,478 7,303 13.00% Total 1,174,325 1,281,142 106,817 9.10% 2022/23 2023/24 $’000 $’000 $’000 % General Rates* 7,403 7,676 273 3.69% Municipal charge* 749 747 (2) -0.29% Kebside collection and recycling 1,118 1,218 100 8.90% General waste charge 56 63 7 13.00% Windfarm in lieu of rates 108 100 (8) -7.05% Total Rates and charges 9,434 9,804 370 3.93% Change
Type of Charge Change Change
Type of Charge Change
Type of Charge Type of Charge Change
Page 29
4.1.1(l) Fair Go Rates System Compliance
Hindmarsh Shire Council is required to comply with the State Government’s Fair Go Rates System (FGRS). The table below details the budget assumptions consistent with the requirements of the Fair Go Rates System.
Base Average Rate
4.1.1(m) Any significant changes that may affect the estimated amounts to be raised by rates and charges
There are no known significant changes which may affect the estimated amounts to be raised by rates and charges. However, the total amount to be raised by rates and charges may be affected by:
• The variation of returned levels of value (e.g. valuation appeals)
• Changes of use of land such that rateable land becomes non-rateable land and vice versa
• Changes of use of land such that residential land becomes business land and vice versa.
4.1.1(n) Differential rates
Rates to be levied
The rate and amount of rates payable in relation to land in each category of differential are:
• A general rate of 0.20896% (0.0020896 cents in the dollar of CIV) for all residential propertis;
• A general rate of 0.18807% (0.0018807 cents in the dollar of CIV) for all farming properties
• A general rate of 0.18807% (0.0018807 cents in the dollar of CIV) for all Business, Industrial & Commercial properties
• A general rate of 0.104483% (0.0010448 cents in the dollar of CIV) for all recreation and cultural land
• A general rate of 0.41792% (0.0041792 cents in the dollar of CIV) for all urban vacant land.
Each differential rate will be determined by multiplying the Capital Improved Value (CIV) of each rateable land (categorised by the characteristics described below) by the relevant percentages indicated above.
Council considers that each differential rate will contribute to the equitable and efficient carrying out of council functions. Details of the objectives of each differential rate, the types of classes of land, which are subject to each differential rate and the uses of each differential rate, are set out below.
2022/23 2023/24 $ 8,152 $ 8,423 5,143 5,172 1.58508 1.62862 1.75% 3.50% $ 1,588 $ 1,634 $ 8,167,501 $ 8,450,635 $ - $Budgeted Supplementary Rates $ - $$ 8,152,051 $ 8,423,207
Total Rates Number of rateable properties Budgeted General Rates and Municipal Charges Revenue Maximum Rate Increase (set by the State Government) Maximum General Rates and Municipal Charges Revenue Capped Average Rate Budgeted Total Rates and Municipal Charges Revenue Page 30
Residential Land
Residential Land is any land which less than 2 hectares in area and is occupied for the principal purpose of providing private housing; or provides multi-unit private dwellings for families or individuals.
The objective of this differential rate is to ensure that all rateable land makes an equitable financial contribution to the cost of carrying out the functions of Council, including, but not limited to, the:
• Construction and maintenance of infrastructre assets;
• Development of health and community services; and
• Provision of general support services.
Farm Land
Farm land is any rateable land:
• That is not less than 2 hectares in area;
• That is used primarily for grazing (including agistment, dairying, pig farming, poultry farming, fish farming, tree farming, bee keeping, viticulture, horticulture, fruit growing or the growing of crops of any kind or for any combination of these activities);
• That is used by a business
• That has a significant and substantial commercial purpose of character;
• That seeks to make a profit on a continuous or repetitive basis from its activities on the land; and
• That is making a profit from its activities on the land, or that has a reasonable prospect of making a profit from its activities on the land if it continues to operate in the way that it is operating.
The objective of this differential rate is to ensure that all rateable land makes an equitable financial contribution to the cost of carrying out the functions of Council, including, but not limited to, the:
• Construction and maintenance of infrastructre assets;
• Development of health and community services; and
• Provision of general support services.
Business, Industrial and Commercial Land
Business, Industrial and Commercial land is any rateable land:
• That is generally less than 2 hectares in area;
• That is used by a business
• That has a significant and substantial commercial purpose of character;
• That seeks to make a profit on a continuous or repetitive basis from its activities on the land; and
• That is making a profit from its activities on the land, or that has a reasonable prospect of making a profit from its activities on the land if it continues to operate in the way that it is operating.
The objective of this differential rate is to ensure that all rateable land makes an equitable financial contribution to the cost of carrying out the functions of Council, including, but not limited to, the:
• Construction and maintenance of infrastructre assets;
• Development of health and community services; and
• Provision of general support services.
Recreational and Cultural Land
Recreational and Cultural Land is any rateable land that;
• Which is used for sporting, recreational or cultural purposes or similar activities; or
• Land which is used primarily as agricultural showgrounds.
The objective of this differential rate is to ensure that all rateable land makes an equitable financial contribution to the cost of carrying out the functions of Council, including, but not limited to, the:
• Construction and maintenance of infrastructre assets;
• Development of health and community services; and
• Provision of general support services.
Urban Vacant Land
Urban Vacant Land is any rateable land within the residential zone which does not contain a dwelling suitable for habitation. The objective of this differential rate is to ensure that all rateable land makes an equitable financial contribution to the cost of carrying out the functions of Council, including, but not limited to, the:
• Construction and maintenance of infrastructre assets;
• Development of health and community services;
• Provision of general support services;
• To encourage land owners to develop land; and
• To ease a cronic housing shortage within the Shire.
Page 31
4.1.2 Statutory fees and fines
Statutory fees and fines consist of fees and fines levied in accordance with legislation and include animal registrations and town planning fees. Increases in statutory fees are made in accordance with legislative requirements.
4.1.3 User fees
User fees relate mainty to the recovery of service delivery costs through the charging of fees to users of Council's services. These include fees for aged care services, aerodrome leases, movie screenings, caravan parks and camping grounds, transfer stations and private works.
** As of 2023/24 Hindmarsh Shire Council will no longer provide Home Care services to the community. The budgeted costs allow for Council to provide the services until they are transitioned to a new external provider.
Forecast Actual Budget 2022/23 2023/24 $’000 $’000 $’000 % Infringements and costs 54 49 (5) -8.88% Town Planning Fees 77 87 11 13.73% Swimming Pools 3 8 4 114.35% Animal Registrations 62 60 (2) -3.23% Other 1 - (1) -100.00% Total statutory fees and fines 196 203 7 3.70%
Forecast Actual Budget 2022/23 2023/24 $’000 $’000 $’000 % Aged and health services ** 396 116 (280) -70.64% Garbage/recycling 142 139 (3) -1.94% Caravan park/camp ground 597 730 133 22.28% Private works 398 508 110 27.64% Building 35 36 1 2.86% Other Commercial Fees 84 77 (8) -9.06% Total user fees 1,652 1,606 (46) -2.79%
Change Change Page 32
4.1.4 Grants
Grants are required by the Act and the Regulations to be disclosed in Council’s budget.
Forecast Actual Budget 2022/23 2023/24 $’000 $’000 $’000 % Grants were received
Summary of grants Commonwealth funded grants 5,260 9,852 4,592 87% State funded grants 3,620 420 (3,200) -88% Total grants received 8,881 10,272 1,391 16% (a) Operating Grants Recurrent - Commonwealth Government Financial Assistance Grants 1,162 4,937 3,775 325% General home care 165 129 (36) -22% Environmental planning 32 16 (16) -50% Recurrent - State Government Aged care 493 101 (392) -79% School crossing supervisors 8 8 0 0% Libraries 129 129 0 0% Youth 75 43 (32) -43% Seniors Week 3 3 0 0% Immunisation Services 4 - (4) -100% Facilitated Playgroup 63 61 (2) -3% Infrastructure 85 75 (10) -12% Total recurrent grants 2,218 5,502 3,284 148% Non-recurrent - Commonwealth Government Queens Jubilee Tree Planting 10 - (10) -100% Non-recurrent - State Government Family and Children 1 - (1) -100% Community Health 30 - (30) -100% State Library Innovation 23 - (23) -100% Kerbside Reform Support 27 - (27) -100% Animal Welfare 7 - (7) -100% Total non-recurrent grants 98 - (98) -100% Total operating grants 2,316 5,502 3,186 138% (b) Capital Grants Recurrent - Commonwealth Government Roads to recovery 1,081 1,081 - 0% Recurrent - State Government Total recurrent grants 1,081 1,081 - 0% Non-recurrent - Commonwealth Government Regional Airports Program 150 - (150) -100% Regional Infrastructure Grant 500 - (500) -100% Flood Recovery 500 1,985 1,485 297% Local Roads and Infrastructure Program 2,162 1,705 (457) -21% InfrastructureNon-recurrent - State Government Buildings 1,050 - (1,050) -100% Plant and Equipment 76 - -Infrastructure 1,047 - (1,047) -100% Total non-recurrent grants 5,484 3,689 (1,795) -33% Total capital grants 6,565 4,770 (1,795) -27% Total Grants 8,881 10,272 1,391 0 Change
in respect of the following:
Page 33
4.1.5 Contributions
4.1.6 Other income
Other income includes the sale of scrap metal and garbage bin parts as well as internal recoupments.
4.1.7 Employee costs
Employee costs include all labour related expenditure such as wages, salaries and direct overheads. Direct overheads include allowances, leave entitlements, employer superannuation, WorkCover premiums, fringe benefit tax and protective clothing.
4.1.8 Materials and services
Marterials and services include the purchases of consumables as well as payments to contractors for the provision of services.
Forecast Actual Budget 2022/23 2023/24 $’000 $’000 $’000 % Monetary 18 12 (6) -32.20% Total contributions 18 12 (6) -32.20%
Forecast Actual Budget 2022/23 2023/24 $’000 $’000 $’000 % Interest 210 240 30 14.29% Sales 28 21 (8) -26.79% Recoupments 191 177 (14) -7.43% Other 6 6 0 0.00% Total other income 435 443 8 1.91%
Forecast Actual Budget 2022/23 2023/24 $’000 $’000 $’000 % Wages and salaries 7,336 6,448 (888) -12.11% WorkCover 121 200 79 64.87% Superannuation 464 857 393 84.73% Training/travel/accommodation 132 219 87 65.85% Other 197 340 142 72.11% Total employee costs 8,250 8,062 (187.31) -2.27%
Forecast Actual Budget 2022/23 2023/24 $’000 $’000 $’000 % Aerodrome, saleyard and commercial operations 165 168 4 2.12% Building maintenance 203 238 35 17.35% Community development, tourism, economic development, childrens' and youth services 385 106 (279) -72.51% Home and community care 201 61 (141) -69.85% Information technology 406 561 155 38.04% Libraries 63 58 (6) -9.06% Office administration 557 573 16 2.87% Parks, reserves, camp grounds and caravan parks 220 221 1 0.58% Plant and fleet operations 1,281 1,331 50 3.94% Quarry operations 161 155 (6) -3.74% Rating & valuation 28 29 1 3.64% Roads, footpaths & drainage management 967 823 (144) -14.93% Swimming pool maintenance & management 296 383 87 29.37% Statutory services 372 350 (22) -5.82% Waste 967 804 (164) -16.90% Total materials and services 6,271 5,860 (412) -6.57%
Change Change Change Change
Page 34
4.1.9 Depreciation
Depreciation is an accounting measure which attempts to allocate the value of an asset over its useful life. This relates to Council's property, plant and equipment as well as infrastructure assets such as roads, drains and footpaths.
4.1.10 Other expenses
Add additional tables for each material component of the Comprehensive Income Statement
Other expenses includes the transfer of waste to facilities outside Hindmarsh Shire, Fire Service Levy which is payable to the State Government, the cost of use of major plant and equipement which is recovered through internal charges, as well administration expenses.
Forecast Actual Budget 2022/23 2023/24 $’000 $’000 $’000 % Property 439 404 (35) -7.93% Plant & equipment 1,276 1,184 (92) -7.18% Infrastructure 3,745 3,250 (495) -13.22% Total depreciation 5,460 4,839 (621.41) -11.38%
Forecast Actual Budget 2022/23 2023/24 $’000 $’000 $’000 % Councillor allowances 208 221 13 6.04% Advertising 64 68 4 6.31% Insurance 385 418 32 8.34% Audit fees 76 79 3 3.68% Waste management costs 280 325 45 16.07% Utilities & telecommunications 384 392 8 1.95% Postage 26 24 (2) -7.69% Council contributions 180 117 (64) -35.28% Bank charges 34 34 0 0.00% Fire service levy 25 25 0 0.00% Memberships & subscriptions 165 183 17 10.46% Legal fees 54 77 77 143.93% Other expenses (345) (414) (68) 19.84% Total other expenses 1,537 1,548 11 0.71% Change Change
Page 35
4.2 Balance Sheet
4.2.1 Assets
Current Assets ($0.305 million decrease) and non-current assets ($2.7311 million increase).
Cash and cash equivalents include chash and investments such as cash held in the bank and in petty cash, the value of investments in deposits of highly liquid investments with short term maturities of three months or less.
Property, infrastructure, plant and equipment is the largest component of Council's worth and represents the value of all the land, buildings, roads, vehicles, equipment etc. which has been built up by Council over many years. The increase in this balance is due to the net result of the capital works program, depreciation of assets and the written down value of assets.
4.2.2 Liabilities
Current liabilities ($0.221 million decrease) and non-current liabilities ($201 million increase).
Trade and other payables are those to who Council owes money as at 30 June. Provisions include Employee Costs (current) which are accrued long services leave, annual leave and rostered days off owing to employees, as well as the future rehabilitation of Quarries and Landfill.
4.2.3 Borrowings
Council does not hold any borrowings but does hold a $2 million overdraft facility to cover a short term cash deficit which may arise from a timing variance. Council does not propose any new long term borrowings into the near future.
4.3 Statement of changes in Equity
4.3.1 Equity
Total equity always equals net assets and is made up of the following components:
• Asset revaluation reserve which represents the difference between the fair value of the asset and the historic cost.
• Accumulated surplus which is the value of all net assets less reserves that have accumulated over time. The increase in accumulated surplus of $2.512m results directly from the operating profit for the year.
4.4 Statement of Cash Flows
4.4.1 Net cash flows provided by/used in operating activities
Operating activities refers to the cash generated in the normal service delivery functions of Council. Cash remaining after paying for the provision of services to the community may be available for investment in capital works.
4.4.2 Net cash flows provided by/used in investing activities
Investing activities refers to cash generated or used in the enhancement or creation of infrastructure and other assets. These activities also include the acquisition or sale of other assets such as vehicles, property and equipment.
Page 36
4.5 Capital works program
This section presents a listing of the capital works projects that will be undertaken for the 2023/24 year, classified by expenditure type and funding source. Works are also disclosed as current budget or carried forward from prior year.
4.5.1 Summary
Forecast Actual Budget 2022/23 2023/24 $’000 $’000 $’000 Property 4,594 1,180 (3,414) -74.31% Plant and equipment 2,278 1,431 (847) -37.18% Infrastructure 10,650 4,844 (5,806) -54.52% Total 17,522 7,455 (10,067) -57.46% New Renewal Upgrade Expansion Grants Contrib. Council cash $’000 $’000 $’000 $’000 $’000 $’000 $’000 $'000 Property 1,180 - 1,180 - - 700 - 480 Plant and equipment 1,431 - 1,431 - - - - 1,431 Infrastructure 4,844 357 3,323 984 180 4,070 - 774 Total 7,455 357 5,934 984 180 4,770 - 2,685
% Change Project Cost Asset expenditure types Summary of Funding Sources Page 37
4.5.2 Current Budget
Capital Works Area New Renewal Upgrade Expansion Grants Contrib. Council cash $’000 $’000 $’000 $’000 $’000 $’000 $’000 $'000 PROPERTY Land Land Improvements Buildings NMCC Capital Works 100 - 100 - - - - 100 Essential Building Renewal 75 - 75 - - - - 75 Davis Park Renewal 700 - 700 - - 700 -Nhill Historical Society 80 - 80 - - - - 80 WSM Caravan Park Upgrades 50 - 50 - - - - 50 Building Maintenance 175 - 175 - - - - 175 TOTAL PROPERTY 1,180 - 1,180 - - 700 - 480 PLANT AND EQUIPMENT Plant, Machinery and Equipment Jeparit Town Truck 100 - 100 - - - - 100 Water Truck 270 - 270 - - - - 270 Water Truck 270 - 270 - - - - 270 Patching Truck 370 - 370 - - - - 370 Minor Plant 35 - 35 - - - - 35 Utility 45 - 45 - - - - 45 Utility 45 - 45 - - - - 45 Utility 45 - 45 - - - - 45 Sedan 52 - 52 - - - - 52 Sedan 59 - 59 - - - - 59 Fixtures, Fittings and Furniture Office Furniture 5 - 5 - - - - 5 Computers and Telecommunications workstations & Ipads 40 - 40 - - - - 40 IT Capital Projects 45 - 45 - - - - 45 Library books Books 50 - 50 - - - - 50 TOTAL PLANT AND EQUIPMENT 1,431 - 1,431 - - - - 1,431 Project Cost Asset expenditure types Summary of Funding Sources Page 38
New Renewal Upgrade Expansion Grants Contrib. Council cash $’000 $’000 $’000 $’000 $’000 $’000 $’000 $'000 INFRASTRUCTURE Roads Dimboola Minyip Road 1,146 - 1,146 - - 1,146 -Lorquon-Netherby Rd & Lorquon Rd 518 - 518 - - 518 -Tarranyurk East Rd 322 - 322 - - 322 -Woorak-Ni-Ni-Lorquon Rd * 331 - - 331 - 331 -Dimboola Minyip Road 88 - 88 - - 88 -Tarranyurk East Rd * 55 - - 55 - 55 -Tarranyurk West Rd * 137 - - 137 - 137 -Western Beach Rd * 100 - - 100 - 100 -Starick Rd 48 - 48 - - 48 -Weirs Rd 155 - 155 - - 155 -Mt Elgin Rd * 20 - - 20 - 20 -Reseals 100 - 100 - - 100 -Nossacks Rd 64 - 64 - - 64 -Drendel Rainbow Rd 40 - 40 - - 16 - 24 C Werner Rd N 101 - 101 - - 101 -Propodollah Netherby Rd 68 - 68 - - 68 -P Colberts Rd 55 - 55 - - 55 -F Wheatons Rd 58 - 58 - - 58 -Lorquon Woorak West Rd 41 - 41 - - 41 -Propodollah Extension 70 - 70 - - 70 -Hazeldene Rd 24 - 24 - - 24 -Designs and vegetation assessments 40 - 40 - - - - 40 Heinrich Rd 77 - 77 - - - - 77 Indoor Salaries 164 - 164 - - - - 164 Kerb & Channel Designs 15 - 15 - - - - 15 Albert St Rainbow * 85 - - - 85 85 -Bridges Footpaths and Cycleways Williams St Nhill * 50 - - - 50 50 -Bow St Rainbow * 45 - - - 45 37 - 8 Indoor Salaries 35 - 35 - - - 35 Drainage Indoor Salaries 35 - 35 - - - - 35 Capital Works Area Project Cost Asset expenditure types Summary of Funding Sources Page 39
Projects marked with an asterix (*) are subject to the receipt of funding.
New Renewal Upgrade Expansion Grants Contrib. Council cash $’000 $’000 $’000 $’000 $’000 $’000 $’000 $'000 Aerodromes Nhill Aerodrome Runway 30 - 30 - - - - 30 Other Infrastructure -Bus Shelter Screen Dimboola 20 - 20 - - - - 20 Dimboola Town Clock 10 - 10 - - - - 10 Nhill Streetscape Plan Implementation 125 125 - - - 80 - 45 Security Cameras Nhill Library 6 6 - - - - - 6 Playgrounds 100 - - 100 - 100 -Caneball Court 40 40 - - - 40 -Dimboola toddler pool 70 - - 70 - 70 -Skate park facilities 30 30 - - - 30 -Council contribution for grant funded projects 50 50 - - - - - 50 Silo Art 40 40 - - - - - 40 Tourism Signage 20 - - 20 - - - 20 Park Cabins fit outs 50 - - 50 - - - 50 Dimboola Caravan Park Capital Works Includes visitor access 66 66 - - - 61 - 5 Depots and Workshops 100 - - 100 - - - 100 TOTAL INFRASTRUCTURE 4,844 357 3,323 984 180 4,070 - 774 TOTAL NEW CAPITAL WORKS 7,455 357 5,934 984 180 4,770 - 2,685 Capital Works Area Project Cost Asset expenditure types Summary of Funding Sources
Page 40
Summary of Planned Capital Works Expenditure
For the years ending 30 June 2025, 2026 & 2027
Total New Renewal Expansion Upgrade Total Grants Contributions Council Cash Borrowings $'000 $'000 $'000 $'000 $'000 $'000 $'000 $'000 $'000 $'000 Property - - - - - - - - -- - - - - - - - -250 - 250 - - 250 - - 250250 - 250 - - 250 - - 250250 - 250 - - 250 - - 250Plant and Equipment 1,250 - 1,250 - - 1,250 - - 1,2505 - 5 - - 5 - - 560 - 60 - - 60 - - 6040 - 40 - - 40 - - 401,355 - 1,355 - - - - - 1,355Infrastructure 5-Chain Rd 50 - 50 - - 50 50 - -Heinrich Rd 40 - 40 - - 40 40 - -J Bones Rd 205 - 205 - - 205 205 - -McKenzie Antwerp Rd 120 - 120 - - 120 120 - -Jeparit East 120 - 120 - - 120 120 - -Stasinowsky 70 - 70 - - 70 70 - -Intersection Lake & Railway St 100 - 100 - - 100 100 - -Designs 30 - 30 - - 30 - - 30Vegetation 10 - 10 - - 10 - - 10Re-Sheet as per Audit 250 - 250 - - 250 - - 250As identified in the 2023-24 Audit 1,355 - 1,355 - - 1,384 1,376 - 8As identified in the 2023-24 Audit 10 - 10 - - 10 - - 10Lloyd St, Dimboola 35 - - - 35 6 - - 6As identified in the 2023-24 Audit 105 - 105 - - 105 - - 105250 - 250 - - 250 - - 250175 - 175 - - 175 - - 175- - - - - - - - -2,925 - 2,890 - 35 2,925 2,081 - 8444,530 - 4,495 - 35 4,530 2,081 - 2,4492024/25 Asset Expenditure Types Total Plant and Equipment Roads Other infrastructure Total Infrastructure Total Capital Works Expenditure Bridges Footpaths and cycleways Drainage Kerb & Channel Funding Sources Land Computers and telecommunications Library books Total Property Plant, machinery and equipment Fixtures, fittings and furniture Total Land Buildings Total Buildings Recreational, leisure and community facilities
Page 41
Total New Renewal Expansion Upgrade Total Grants Contributions Council Cash Borrowings $'000 $'000 $'000 $'000 $'000 $'000 $'000 $'000 $'000 $'000 Property - - - - - - - - -- - - - - - - - -- - - - - - - - -250 - 250 - - 250 - - 250250 - 250 - - 250 - - 250250 - 250 - - 250 - - 250Plant and Equipment 1,250 - 1,250 - - 1,250 - - 1,2505 - 5 - - 5 - - 560 - 60 - - 60 - - 6040 - 40 - - 40 - - 401,355 - 1,355 - - - - - 1,355Infrastructure As identified in the 2024-25 Audit 2,280 - 2,280 - - 2,280 2,081 - 19910 - 10 - - 10 - - 10- - - - - - - - -As identified in the 2024-25 Audit 185 - 185 - - 185 - - 185- - - - - - - - -Major Culverts - - - - - - - - -38 - 38 - - 38 - - 38170 - 170 - 170 - - 170- - - - - - - - -- - - - - - - - -- - - - - - - - -- - - - - - - - -- - - - - - - - -2,683 - 2,683 - - 2,683 2,081 - 6024,288 - 4,288 - - 4,288 2,081 - 2,2072025/26 Asset Expenditure Types Funding Sources Land Land improvements Computers and telecommunications Library books Total Land Buildings Total Buildings Aerodromes Plant, machinery and equipment Fixtures, fittings and furniture Total Plant and Equipment Roads Total Property Kerb & Channel Waste management Parks, open space and streetscapes Total Infrastructure Total Capital Works Expenditure Off street car parks Other infrastructure Bridges Footpaths and cycleways Drainage Recreational, leisure and community facilities Page 42
Total New Renewal Expansion Upgrade Total Grants Contributions Council Cash Borrowings $'000 $'000 $'000 $'000 $'000 $'000 $'000 $'000 $'000 $'000 Property - - - - - - - - -- - - - - - - - -- - - - - - - - -250 - 250 - - 250 - - 250250 - 250 - - 250 - - 250250 - 250 - - 250 - - 250Plant and Equipment 1,250 - 1,250 - - 1,250 - - 1,2505 - 5 - - 5 - - 560 - 60 - - 60 - - 6040 - 40 - - 40 - - 401,355 - 1,355 - - - - - 1,355Infrastructure As identified in the 2025-26 Audit 2,150 - 2,150 - - 2,150 2,081 - 69- - - - - - - - -As identified in the 2025-26 Audit 330 330 330 - 330- - - - - - - - -As identified in the 2025-26 Audit 383 - 383 - - 383 - - 383- - - - - - - - -As identified in the 2025-26 Audit 246 - 246 - - 246 - - 246100 - 100 - - 100 - - 10040 - 40 - - 40 - - 40- - - - - - - - -3,249 - 3,249 - - 3,249 2,081 - 1,1684,854 - 4,854 - - 4,854 2,081 - 2,773Land Recreational, leisure and community facilities 2026/27 Asset Expenditure Types Funding Sources Library books Total Plant and Equipment Total Property Roads Kerb & Channel Other infrastructure Total Infrastructure Total Capital Works Expenditure Bridges Footpaths and cycleways Drainage Plant, machinery and equipment Fixtures, fittings and furniture Total Land Buildings Computers and telecommunications Total Buildings Land improvements Page 43
5. Revenue and Rating Plan
The Local Government Act 2020 requires Council to prepare a Revenue and Rating Plan to cover a minimum period of four years following each Council election. The Revenue and Rating Plan establishes the revenue raising framework within which the Council proposes to work.
The purpose of the Revenue and Rating Plan is to determine the most appropriate and affordable revenue and rating approach for the Hindmarsh Shire Council which, in conjunction with other incomes sources, will adequately finance the objectives in the Council Plan.
This plan is an important part of Council’s integrated planning framework, all of which is created to help Council achieve its vision of “a caring, active community enhanced by its liveability, environment and economy.”
Strategies outlined in this plan align with the objectives contained in the Council Plan and will feed into our budgeting and long-term financial planning documents, as well as other strategic planning documents under our Council’s strategic planning framework.
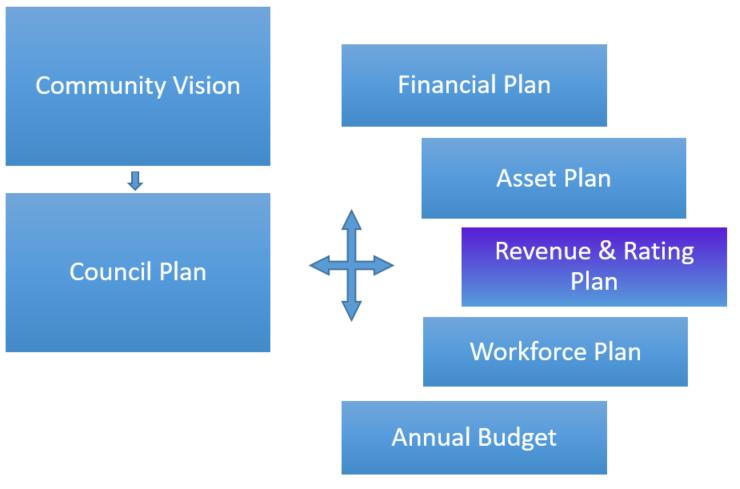
This plan will explain how Council calculates the revenue needed to fund its activities and how the funding burden will be apportioned between ratepayers and other users of Council facilities and services.
In particular, this plan will set out decisions that Council has made in relation to rating options available to it under the Local Government Act 2020 to ensure the fair and equitable distribution of rates across property owners. It will also set out principles that are used in decision making for other revenue sources such as fees and charges.
It is also important to note that this plan does not set revenue targets for Council, it outlines the strategic framework and decisions that inform how Council will go about calculating and collecting its revenue.
Page 44
1. REVENUE SOURCES
Council provides a number of services and facilities to our local community, and in doing so, must collect revenue to cover the cost of providing these services and facilities.
Council’s revenue sources include:
• Rates and charges including kerbside collection and recycling
• Grants from other levels of Government
• User fees and charges including Statutory Fees and Fines
• Other revenue including contributions, interest from investments and sale of assets
Rates are the most significant revenue source for Council and make up roughly 45-50% of its annual income.
The introduction of rate capping under the Victorian Government’s Fair Go Rates System (FGRS) has brought a renewed focus to Council’s long-term financial sustainability. The FGRS continues to restrict Council’s ability to raise revenue above the rate cap unless applications is made to the Essential Services Commission for a variation. Maintaining service delivery levels and investing in community assets remain key priorities for Council. This strategy will address Council’s reliance on rate income and provide options to actively reduce that reliance.
Council revenue can also be adversely affected by changes to funding from other levels of government. Some grants are tied to the delivery of Council services, whilst many are tied directly to the delivery of new community assets, such as roads or recreational facilities. It is important for Council to be clear about what grants it intends to apply for and the obligations that grants create in the delivery of services such as infrastructure.
2. COMMUNITY ENGAGEMENT
The Revenue and Rating Plan outlines Council’s decision-making process on how revenues are calculated and collected. The following public consultation process has been and will be followed to ensure due consideration and feedback is received from relevant stakeholders.
The Revenue and Rating Plan community engagement process is:
• Draft Revenue and Rating Plan prepared by officers;
• Draft Revenue and Rating Plan placed on public exhibition following adoption at the June 2023 Council meeting calling for public submissions;
• Community engagement through local news outlets, social media and community consultation meetings;
• Receiving of public submissions from Thursday 1 June 2023 to Wednesday 21 June 2023: and
• Draft Revenue and Rating Plan presented to the June Council meeting for adoption.
LEGISLATIVE FRAMEWORK
Raising of revenue including the levying of rates and charges by Hindmarsh Shire Council is legislated by the Local Government Act 2020 , and the Valuation of Land Act 1960 The rates and charges provision is contained within the Local Government Act 1989 pending the outcome of the Local Government Rating System Review.
3.
45% 4% 43% 8% Government Grants other revenue Rates and Charges User fees and charges Page 45
4. ASSESSMENT OF CURRENT RATING LEVELS
Comparing the relativity of rating levels between Council’s can be a difficult exercise due to debate over the most appropriate methods to use and the inability to take into account the intricacies of rating structures in different Council’s. Each local government sets rates based on an assessment of the desires, wants and needs of its community and as each community is different, direct comparisons can be difficult. For example, cash holdings of municipalities vary and Council’s have significantly different infrastructure needs and geographic sizes. Each municipality also has significantly different levels of capital works, funding structures for capital works and varying levels of debt.
On a rates per assessment basis, Hindmarsh Shire was well within the average for the group of small rural Council’s in the 2021/22 financial year.
Average Rates per property assessment Small Rural Councils
*source Know Your Council, 2021/22 Annual Reporting data
The graph below, showing that Council is at the lower end of its peer group in terms of rates as a percentage of overall revenue, is an indication of the focus Council places on raising revenue from sources other than rate payers, such as grant revenue.
Rates & Charges as a % of adjusted underlying revenue Small Rural Councils
*source Know Your Council, 2021/22 Annual Reporting data
5. RATE CAPPING
The Fair Go Rates System (FGRS) sets out the maximum amount Council’s may increase rates in financial year. For 2023/24 the rate cap is set at 3.5% (2022/23 – 1.75%). The cap applies to both general rates and municipal charges and is calculated based on the average rates payable per assessment.
0 0.1 0.2 0.3 0.4 0.5 0.6 0.7
0 500 1000 1500 2000 2500
Page 46
AND CHARGES
Rates are property taxes that allow Councils to raise revenue to fund essential public services which cater to their municipal population. Importantly it is a taxation system that includes flexibility for Councils to utilise different tools in its rating structure to accommodate issues of equity and to ensure fairness in rating for all ratepayers.
Council has established a rating structure comprised of three key elements. These are:
• General Rates – Based on property values using the Capital Improved Valuation methodology, which are indicative of capacity to pay and form the central basis of rating under the Local Government Act 2020 ;
• Service Charges – A ‘user pays’ component for Council services to reflect the recovery of the expenses of Council from ratepayers who benefit from a service; and
• Municipal Charge – A ‘fixed rate’ portion per property to cover some of the administrative costs of Council.
Striking a proper balance between these elements will help to improve equity in the distribution of the rate burden across residents.
Hindmarsh Shire Council uses the capital improved value (CIV) system of valuation. This means the sum that the land might be expected to realise at the time of valuation if offered for sale on any reasonable terms and conditions which a genuine seller might in ordinary circumstances be expected to require.
The formula for calculating General Rates, excluding any additional charges, arrears or additional supplementary rates is:
• Valuation (Capital Improved Value) x Rate in the Dollar (Differential Rate Type).
The rate in the dollar for each rating differential category is included in Council’s annual budget.
Property Valuations
The Valuation of Land Act 1960 is the principle legislation in determining property valuations. Under the Valuation of Land Act 1960 , the Victorian Valuer-General conducts property valuations on an annual basis.
Council needs to be mindful of the impacts of revaluations on various property types in implementing differential rates to ensure that rises and falls in Council rates remain affordable and that rating ‘shocks’ are mitigated to some degree.
Supplementary Valuations
Supplementary valuations are carried out for a variety of reasons including renovations, new constructions, extensions, installation of swimming pools, rezoning, subdivisions, amalgamations, occupancy changes and corrections. The Victorian Valuer-General is tasked with undertaking supplementary valuations and advises Council annually on the basis of valuation and Australian Valuation Property Classification Code (AVPCC) changes.
Supplementary valuations bring the value of the affected property into line with the general valuation of other properties within the municipality. Objections to supplementary valuations can be lodged in accordance with Part 3 of the Valuation of Land Act 1960 Any objection must be lodged with Council within two months of the issuance of the supplementary rate notice.
Objections to property values
Part 3 of the Valuation of Land Act 1960 provides that a property owner may lodge an objection against the valuation of a property or the Australian Valuation Property Classification Code (AVPCC) within two months of the issue of the original or amended supplementary Rates and Valuation Charges Notice (Rates Notice), or within four months if the notice was not originally issued to the occupier of the land.
Objections to a valuation shown on Council's valuation and rates notice can be lodged electronically with the Victorian State Government's objection portal. Council's website provides further information on Rating Valuation Objections.
Rates differentials
Council makes a further distinction when applying general rates by applying rating differentials based on the purpose for which the property is used. That is, whether the property is used for residential, farming or Commercial/Industrial. This distinction is based on the concept that different property categories should pay a fair and equitable contribution, taking into account the benefits those properties derive from the local community.
Hindmarsh Shire Council’s rating structure comprises five differential rates. These rates are structure in accordance with the requirements of Section 158 of the Local Government Act 1989 and the Ministerial guidelines for Differential Rating 2013.
6.
RATES
Page 47
The differential rates are currently set as follows:
• General 100%
• Farm 90% (a discount of 10% for farms)
• Commercial/Industrial 90% (a discount of 10% for businesses)
• Recreational 50% (a discount of 50% for recreational and cultural properties)
• Urban Vacant 200% (a penalty of 100% for urban vacant land in Nhill, Dimboola, Jeparit and Rainbow).
Note: The term ‘discount’ in relation to farms and businesses means the difference between the rate in the dollar applied to farms and businesses, and the rate in the dollar applied to residential properties. Similarly, the term ‘penalty’ means the difference between the rate in the dollar applied to urban vacant land and the rate in the dollar applied to residential properties. The rate in the dollar is the figure that is multiplied by a properties capital improved valuation to calculate the rates.
The highest differential rate must be no more than four times the lowest differential rate.
Differential definitions
The definition of each differential rate is set out below:
General
General rates applies to land which is not Farm / Commercial / Industrial / Recreational / or Urban Vacant.
The objective of the general rate is to ensure that all rateable land makes an equitable financial contribution to the cost of carrying out the functions of Hindmarsh Shire. The money raised by general rates will be applied to the items of expenditure described in the Hindmarsh Shire Council budget.
The characteristics of the planning scheme zoning are applicable to the determination of vacant land which will be subject to the rate of residential land. The vacant land affected by this rate is that which is zoned residential under the Hindmarsh Shire Council Planning Scheme. The classification of the land will be determined by the occupation of that land for its best use and have reference to the planning scheme zoning. The use of land is any permitted under the Hindmarsh Shire Council Planning scheme.
The types and classes of rateable land within this rate are those having the relevant characteristics described below:
a. Used primarily for residential purposes; or
b. Any land that is not defined as Farm Land / Commercial / Industrial / Recreational / or Urban Vacant.
This rate is applicable to land within the municipal district. The types of buildings on the land within this rate are all buildings already constructed on the land or which will be constructed prior to the expiry of the 2022/23 financial year.
Farm
Farm land applies to land which is not Residential / Commercial / Industrial / Recreational / or Urban Vacant and which is ‘farm land’ within the meaning of section 2(1) of the Valuation of Land Act 1960
The objective of the farm rate is to encourage farming and to provide moderate rate relief to farmers whose property values have remained high and to ensure that all rateable land makes an equitable financial contribution to carrying out the functions of Hindmarsh Shire. The money raised by farm rates will be applied to items of expenditure described in the Hindmarsh Shire Council budget.
The characteristics of the planning zoning are applicable to the determination of farm land which will be subject to the rate of farm land. The classification of the land will be determined by the occupation of that land for its best use and have reference to the planning scheme zoning.
The types and classes of rateable land within this rate are those having the relevant characteristics described below:
a. Used primarily for primary production purposes; or
b. Any land that is not defined as General Land or Commercial / Industrial Land.
This rate is applicable to land within the municipal district. The types of buildings on this land are buildings already constructed on the land or which will be constructed prior to the expiry of the 2022/23 financial year.
Page 48
Commercial / Industrial
Commercial / Industrial land applies to land which is not Residential / Farm / Recreational / or Urban Vacant. Commercial / Industrial land is any land which is:
a. used primarily for carrying out the manufacture or production of, or trade in goods or services (including tourist facilities) and in the case of a business providing accommodation for tourists, is prescribed accommodation under the Public Health and Wellbeing Act (Vic) 2008 ; or
b. unoccupied building erected which is zoned Commercial or Industrial under the Hindmarsh Shire Council Planning Scheme; or
c. Unoccupied land which is zoned Commercial or Industrial under the Hindmarsh Shire Council Planning Scheme.
The objective of the commercial / industrial rate is to encourage economic development and to ensure that all rateable land makes an equitable financial contribution to carrying out the functions of Hindmarsh Shire. The money raised by commercial / industrial rates will be applied to items of expenditure described in the Hindmarsh Shire Council budget.
The characteristics of the planning scheme zoning are applicable to the determination of vacant land which will be subject to the rate applicable to Commercial / Industrial Land. The classification of land will be determined by the occupation of that land for its best use and have reference to the planning scheme zoning.
The types and classes of rateable land within this rate are those having the relevant characteristics described below:
a. Used primarily for commercial purposes; or
b. Any land that is not defined as General Land or Farm Land or Recreational Land.
This rate is applicable to land within the municipal district. The types of buildings on this land are buildings already constructed on the land or which will be constructed prior to the expiry of the 2022/23 financial year.
Recreational
Recreational and cultural land applies to land as defined under the Cultural and Recreational Lands Act 1963
The objective of the recreational rate is to recognise the contribution that these community organisations and volunteers make to the Hindmarsh Shire in the provision of sporting, cultural and recreational activities. The money raised by recreational rates will be applied to items of expenditure described in the Hindmarsh Shire Council budget.
The characteristics of the planning scheme zoning are applicable to the determination of Recreational and Cultural land.
The types and classes of rateable land is less than 1500m2 within this rate are those having the relevant characteristics described below:
a. Occupied by a body which exists for cultural or recreational purposes and applies its profits in promoting the furthering of this purpose; or
b. Owned by the body, by the Crown or by Council;
c. Not agricultural show grounds.
This rate is applicable to land within the municipal district. The types of buildings on this land are buildings already constructed on the land or which will be constructed prior to the expiry of the 2022/23 financial year.
Urban Vacant
Urban Vacant land applies to any land which is not Residential / Farm / Commercial / Industrial / or Recreational; and which no dwelling has been erected in the four towns.
The objective of the urban vacant rate is to encourage development of vacant land and to ensure that all rateable land makes an equitable financial contribution to carrying out the functions of Hindmarsh Shire. The money raised by urban vacant rates will be applied to items of expenditure described in the Hindmarsh Shire Council budget.
The characteristics of the planning scheme zoning are applicable to the determination of vacant land which will be subject to the rate applicable to residential land.
They types and classes of rateable land within this rate are those having the relevant characteristics described below:
• Residential land within the four towns (Dimboola, Jeparit, Nhill and Rainbow) on which no dwelling has been erected.
This rate is applicable to land within the municipal district.
Page 49
Municipal charge and general waste charge
Council also levies a municipal charge and general waste charge.
The Municipal charge is a fixed charge per property or assessment regardless of the valuation of the property. It operates in combination with the general rates based on Capital Improved Value.
Council has proposed the municipal charge will remain steady for 2023/24 at $200. The municipal charge is designed to recoup some of the administrative costs of Council, and to ensure that lower valued properties pay a fair amount of rates. Council believes that the $200 municipal charge achieves these objectives.
The budgeted municipal charge for 2023/24 is $746,800 which is approximately 10% of the total revenue from rates and charges.
The general waste charge was introduced in 2018/19 to cover waste costs not covered by the kerbside collection / recycling charge. This includes urban area litter removal and commercial area litter removal.
Council has proposed the general waste charge will increse for 2023/24 to $17 ($15 in 2022/2023). The general waste charge is applied using the same criteria as the Municipal charge.
7.
SERVICE RATES AND CHARGES
Council may declare a service rate or charge under section 162 of the Local Government Act 1989 for the provision of the following services:
• Provision of water supply
• Collection and disposal of refuse
• Provision of sewage services
• Any other prescribed service.
Kerbside waste and recycling collection
Council levies a kerbside waste and recycling collection charge.
The purpose of this charge is to meet the costs of waste disposal and recycling activities throughout the Hindmarsh Shire area, including development and rehabilitation of landfill sites and the operating of transfer stations.
The kerbside waste and recycling collection charge is proposed to increase to $453 in 2023/24 ($418 in 2022/23). The increase in the charge reflects the introduction of glass recycling in 2023/24. Unfortunately, Council’s garbage and recycling costs are impacted significantly by the global recycling crisis and the State Government’s landfill levies.
8.
SPECIAL RATES AND CHARGES
Council may declare a special rate or charge under section 163 of the Local Government Act 1989
Council does not have any current special rates and charges schemes in place.
Page 50
9. PAYMENT OF RATES AND CHARGES
In accordance with section 167(1) of the Local Government Act 1989 ratepayers have the option of paying rates and charges by way of four instalments. Payments are due on the prescribed dates bellows:
• 1st Instalment: 30 September
• 2nd Instalment: 30 November
• 3rd Instalment: 28 February
• 4th Instalment: 31 May
Council offers a range of payment options including:
• In person at Council Customer Service Centres (cheques, money orders, EFTPOS, credit/debit cards and cash);
• BPay;
• Australia Post (over the counter, over the phone via credit card and on the internet);
• By mail (cheques and money orders only);
• Direct Debit (weekly, fortnightly, monthly, by instalment or annually);
• Centrepay.
10. PENALTY INTEREST
Interest is charged on all overdue rates in accordance with Section 172 of the Local Government Act 1989 The interest rate applied is fixed under section 2 of the Penalty Interest Rates Act 1983 , which is determined by the Minister and published by notice in the Government Gazette.
11. PENSIONER REBATES
Holders of Centrelink or Veteran Affairs Pension Concession card or a Veteran Affairs Gold card which stipulates TPI or War Widow may claim a rebate on their sole or principal place of residence. Upon initial application, ongoing eligibility is maintained, unless rejected by Centrelink or the Department of Veteran Affairs during the annual verification procedure. Upon confirmation of an eligible pensioner concession status, the pensioner rebate is deducted from the rate account before payment is required by the ratepayer. Eligible pensioners are also entitled to receive a concession on the Fire Services Property Levy.
12.
FINANCIAL HARDSHIP
Council is committed to assisting ratepayers who are experiencing financial difficulty. Council has approved a financial hardship policy which provides guidance for the collection of rates and charges where the ratepayer is experiencing financial hardship.
Ratepayers experiencing financial hardship should contact Council’s Rates Department to confidentially discuss their situation.
13.
DEBT RECOVERY
Council makes every effort to contact ratepayers at their correct address but it is the ratepayers’ responsibility to properly advise Council of changes to their contact details. The Local Government Act 1989 section 230 and 231 requires both the vendor and buyer of property, or their agents (eg solicitors and or conveyancers), to notify Council by way of notice of disposition or acquisition of an interest in land.
In the event that an account becomes overdue, Council will issue an overdue reminder notice which will include accrued penalty interest. In the event that the account remains unpaid, Council may take legal action without further notice to recover the overdue amount. All fees and court costs incurred will be recoverable from the ratepayer.
If an amount payable by way of rates in respect to land has been in arrears for three years or more, Council may take action to sell the property in accordance with section 181 of the Local Government Act 1989
14. FIRE SERVICES PROPERTY LEVY
In 2013 the Victorian State Government passed legislation requiring the Fire Services Property Levy to be collected from ratepayers. Previously this was collected through building and property insurance premiums. The Fire Services Property Levy helps fund the services provided by Fire Rescue Victoria (FRV) and Country Fire Authority (CFA), and all levies collected by Council are passed through to the State Government.
The Fire Services Property Levy is based on two components, a fixed charge, and a variable charge which is linked to the Capital Improved Value (CIV) of the property. The levy is not included in the rate cap and increases in the levy are at the discretion of the State Government.
Page 51
OTHER REVENUE ITEMS
Fees and Charges
Fees and charges consist of statutory fees and fines and user fees charges. Statutory fees mainly relate to fees and fines levied in accordance with legislation and include animal registration fees, building and planning fees, and fines including local laws and animal fines. User fees relate to the recovery of service delivery costs through the charging of fees to users of Council’s services including home and community care, waste depot fees, and hall hire.
The provision of infrastructure and services form a key part of Council’s role in supporting the local community. In providing these, Council must consider a range of ‘Best Value’ principles including service cost and quality standards, value-for-money, and community expectations and values. Council must also balance the affordability and accessibility of infrastructure and services with its financial capacity and in the interests of long-term financial sustainability.
Council must also comply with the government’s Competitive Neutrality Policy for significant business activities they provide and adjust their service prices to neutralise any competitive advantages when competing with the private sector.
In providing services to the community, Council must determine the extent of cost recovery for particular services consistent with the level of both individual and collective benefit that the services provide in line with the communities expectations.
Council will develop a table of fees and charges as part of its annual budget each year. Proposed pricing changes will be included in this table and will be communicated to stakeholders before the budget is adopted, giving them a chance to review and provide valuable feedback before the fees are locked in.
Grants
Grant revenue (recurrent and non-recurrent) represents income usually received from other levels of government. Some grants are singular and attached to the delivery of specific projects, whilst others can be of a recurrent nature and may or may not be linked to the delivery of projects.
Council will pro-actively advocate to other levels of government for grant funding support to deliver important infrastructure and service outcomes for the community. Council may use its own funds to leverage higher grant funding and maximise external funding opportunities.
Contributions
Contributions represent funds received by Council, usually from non-government sources. Contributions may include funds from user groups towards facility upgrades or community projects.
Other Revenue
Council receives revenue from interest on investments and interest on rates arrears. The amount of revenue earned from these sources fluctuates from year to year depending on the level of cash and investments and outstanding rates and charges balances.
15.
Page 52
6. Financial Performance Indicators
6a. Targeted performance indicators
The following tables highlight Council’s current and projected performance across a selection of targeted service and financial performance indicators. These indicators provide a useful analysis of Council’s intentions and performance and should be interpreted in the context of the organisation’s objectives. The targeted performance indicators below are the prescribed performance indicators contained in Schedule 4 of the Local Government (Planning and Reporting) Regulations 2020. Results against these indicators and targets will be reported in Council’s Performance Statement included in the Annual Report.
Targeted performance indicators - Service
6b. Financial performance indicators
The following table highlights Council’s current and projected performance across a range of key financial performance indicators. These indicators provide a useful analysis of Council’s financial position and performance and should be interpreted in the context of the organisation’s objectives. The financial performance indicators below are the prescribed financial performance indicators contained in Part 3 of Schedule 3 of the Local Government (Planning and Reporting) Regulations 2020 Results against these indicators will be reported in Council’s Performance Statement included in the Annual Report.
+ Forecasts improvement in Council's financial performance/financial position indicator o Forecasts that Council's financial performance/financial position indicator will be steady Forecasts deterioration in Council's financial performance/financial position indicator
Actual Forecast Target Trend 2021/22 2022/23 2023/24 2024/25 2025/26 2026/27 +/o/Governance Satisfaction with community consultation and engagement Community satisfaction rating out of 100 with the consultation and engagement efforts of Council 1 55 57 59 61 63 65 + Roads Sealed local roads below the intervention level Number of kms of sealed local roads below the renewal intervention level set by Council / Kms of sealed local roads 2 99.83% 99.80% 99.80% 99.80% 99.80% 99.80% o Statutory planning Planning applications decided within the relevant required time Number of planning application decisions made within the relevant required time Number of decisions made 3 90.16% 90% 90% 90% 90% 90% + Waste management Kerbside collection waste diverted from landfill Weight of recyclables and green organics collected from kerbside bins Weight of garbage, recyclables and green organics collected from kerbside bins 4 32.39% 40% 40% 40% 40% 40% + Actual Forecast Target Trend 2021/22 2022/23 2023/24 2024/25 2025/26 2026/27 +/o/Liquidity Working Capital Current assets current liabilities 5 347.90% 100% 98% 73% 55% 19% + Obligations Asset renewal Asset renewal and upgrade expense / Asset depreciation 6 235.61% 221.41% 146.75% 80.53% 70.23% 41.49% o Stability Rates concentration Rate revenue adjusted underlying revenue 7 45.23% 60.94% 51.25% 52.56% 52.67% 52.77% + Efficiency Expenditure level Total expenses / no. of property assessments 8 $3,239 $4,184 $3,927 $3,962 $4,104 $4,248 +
Actual Forecast Budget Trend 2021/22 2023/24 2023/24 2024/25 2025/26 2026/27 +/o/Operating position Adjusted underlying result Adjusted underlying surplus (deficit) / Adjusted underlying revenue 9 11.6% 39.0% -6.2% -6.7% -7.5% -8.2% + Liquidity Unrestricted cash Unrestricted cash / current liabilities 10 178.82% 46% 47% 28% 17% -14% o Obligations Indebtedness Non-current liabilities / own source revenue 11 1.72% 1.81% 1.91% 1.94% 1.94% 1.94% + Stability Rates effort Rate revenue CIV of rateable properties in the municipality 12 0.45% 0.33% 0.24% 0.25% 0.26% 0.27% o Efficiency Revenue level General rates and municipal charges no. of property assessments 13 $1,561 $1,834 $1,896 $1,953 $2,011 $2,071 + Sustainability Capacity Key to Forecast Trend:
Indicator Measure Notes Target Projections Targeted performance indicators - Financial Indicator Measure Notes Target Projections Indicator Measure Notes Projections
Page 53
6a
1. Satisfaction with community consultation and engagement
Satisfaction with community consultation continues to remain steady.
2. Sealed local roads below the intervention level
Sealed roads below the intravention level will decline unless capital grants are obtained to maintain the current level.
3. Planning applications decided within the relevant required time
Council utilise contract planning services for the provision of Statutory Planning. Planning decisions are made within the required timeframe.
4. Kerbside collection waste diverted from landfill
Kerbside collection of recylables continued in 2022/2023 and will continue in future years. Council introduced glass recycling in 2022/2023.
5. Working Capital
Working capital is expected to decline as own source revenue is used to fund the asset renewal gap unless grant income becomes available.
6. Asset renewal
Asset renewal will decline unless grant income becomes available.
7. Rates concentration
Rates will continue to be a major source of Councils revenue.
8. Expenditure level
The increase in expenditure due to inflation will see the expenditure level per rateable property increase.
6b
9. Adjusted underlying result
The adjusted underlying result will decrease as Council uses own source funds to maintain the renewal gap on roads.
10. Unrestricted Cash
The unrestricted cash available will decrease as Council uses own source funds to maintain the renewal gap on roads.
11. Debt compared to rates
Council continues to remain debt free.
12. Rates effort
Property values are increasing at a higher rate than rate capping.
13. Revenue level
General rates and municipal charges will increase in line with rates capping.
Notes to indicators
Page 54
7. Schedule of Fees and Charges
This appendix presents the fees and charges of a statutory/non-statutory nature which will be charged in respect to various goods and services during the financial year 2023/24.
Fees and charges are based on information available at the time of publishing and may vary during the financial year subject to any changes in Council's policy or legislation.
$ $ $ % AGED CARE AND DISABILITY SERVICES COMMUNITY CARE SERVICES - DOMESTIC ASSISTANCE Low income rate - Single per hour Non-taxable $ 8.40 $ 8.60 0.20 $ 2.3% Non-statutory Low income rate - Couple per hour Non-taxable $ 9.30 $ 9.50 0.20 $ 2.1% Non-statutory Medium income rate - Single per hour Non-taxable $ 15.70 $ 16.10 0.40 $ 2.5% Non-statutory Medium income rate - Couple per hour Non-taxable $ 17.70 $ 18.10 0.40 $ 2.2% Non-statutory High income rate - Single per hour Non-taxable $ 20.90 $ 21.40 0.50 $ 2.3% Non-statutory High income rate - Couple per hour Non-taxable $ 24.50 $ 25.10 0.60 $ 2.4% Non-statutory COMMUNITY CARE SERVICES - SOCIAL SUPPORT INDIVIDUAL Low income rate - Single per hour Non-taxable $ 8.40 $ 8.60 0.20 $ 2.3% Non-statutory Low income rate - Couple per hour Non-taxable $ 9.30 $ 9.50 0.20 $ 2.1% Non-statutory Medium income rate - Single per hour Non-taxable $ 15.70 $ 16.10 0.40 $ 2.5% Non-statutory Medium income rate - Couple per hour Non-taxable $ 17.70 $ 18.10 0.40 $ 2.2% Non-statutory High income rate - Single per hour Non-taxable $ 20.90 $ 21.40 0.50 $ 2.3% Non-statutory High income rate - Couple per hour Non-taxable $ 24.50 $ 25.10 0.60 $ 2.4% Non-statutory COMMUNITY CARE SERVICES - PERSONAL CARE Low income rate - Single or Couple per hour Non-taxable $ 5.70 $ 5.80 0.10 $ 1.7% Non-statutory Medium income rate - Single or Couple per hour Non-taxable $ 8.90 $ 9.10 0.20 $ 2.2% Non-statutory High income rate - Single or Couple per hour Non-taxable $ 16.30 $ 16.70 0.40 $ 2.4% Non-statutory COMMUNITY CARE SERVICES - RESPITE CARE Low income rate - Single or Couple per hour Non-taxable $ 5.70 $ 5.80 0.10 $ 1.7% Non-statutory Medium income rate - Single or Couple per hour Non-taxable $ 8.90 $ 9.10 0.20 $ 2.2% Non-statutory High income rate - Single or Couple per hour Non-taxable $ 16.30 $ 16.70 0.40 $ 2.4% Non-statutory HANDYMAN CHARGES Low income rate - per hour plus materials Non-taxable $ 13.80 $ 14.10 0.30 $ 2.1% Non-statutory Medium income rate - per hour plus materials Non-taxable $ 20.90 $ 21.40 0.50 $ 2.3% Non-statutory High income rate - per hour plus materials Non-taxable $ 38.00 $ 39.00 1.00 $ 2.6% Non-statutory MEALS ON WHEELS Meals on Wheels - per meal (Client fee - Low / Medium income) Jeparit, Nhill & Rainbow Non-taxable $ 13.30 $ 13.60 0.30 $ 2.2% Non-statutory Meals on Wheels - per meal (Client fee - Low / Medium income) Dimboola Non-taxable $ 9.70 $ 9.90 0.20 $ 2.0% Non-statutory Meals on Wheels - per meal (Client fee - High income) Jeparit, Nhill & Rainbow Non-taxable $ 16.30 $ 16.70 0.40 $ 2.4% Non-statutory Meals on Wheels - per meal (Client fee - High income) Dimboola Non-taxable $ 13.30 $ 13.60 0.30 $ 2.2% Non-statutory Meals on Wheels - per meal (Agency fee / Non HACC or CHSP funded) Jeparit, Nhill & Rainbow Taxable $ 20.80 $ 21.30 0.50 $ 2.3% Non-statutory Meals on Wheels - per meal (Agency fee / Non HACC or CHSP funded) Dimboola Taxable $ 14.80 $ 15.20 0.40 $ 2.6% Non-statutory COMMUNITY CARE SERVICES - AGENCY SERVICES 6am to 6pm - per hour Non-taxable $ 62.60 $ 64.20 1.60 $ 2.5% Non-statutory Home maintenance - per hour Non-taxable $ 72.70 $ 74.50 1.80 $ 2.4% Non-statutory After hours / weekends - per hour Non-taxable $ 73.00 $ 74.80 1.80 $ 2.4% Non-statutory Public holidays - per hour Non-taxable $ 89.80 $ 92.00 2.20 $ 2.4% Non-statutory Travel - per kilometre Non-taxable $ 1.70 $ 1.70 - $ 0.0% Non-statutory
Fee Increase / (Decrease) Basis of Fee Description of Fees and Charges GST Status 2022/23 Fee Inc GST 2023/24 Fee Inc GST (Proposed) Fee Increase / (Decrease ) Page 55
FINES (Domestic Animals Act 1994)
Note: Prices are for one cat or dog and include the government levy
$ $ $ % Fee Increase / (Decrease) Basis of Fee Description of Fees and Charges GST Status 2022/23 Fee Inc GST 2023/24 Fee Inc GST (Proposed) Fee Increase / (Decrease ) ANIMAL BUSINESS Domestic Animal Business - Licence Fee Taxable $ 320.00 $ 320.00 - $ 0.0% Non-statutory ANIMAL CAGES Hire of Cat Trap Taxable $ 27.00 $ 27.70 0.70 $ 2.5% Non-statutory Hire of Cat Trap - Bond Taxable $ 51.50 $ 52.80 1.30 $ 2.5% Non-statutory Hire of Cat Trap - Pensioner Discount Taxable $ 17.00 $ 17.00 - $ 0.0% Non-statutory Hire of Cat Trap - Pensioner Bond Taxable $ 50.00 $ 50.00 - $ 0.0% Non-statutory ANIMAL
Note: Fees are indexed annually by the Department of Justice Failure to apply to register or renew the registration of a dog or cat over the age of 3 months Non-taxable $ 370.00 $ 370.00 - $ 0.0% Statutory Identification marker not worn outside of premises Non-taxable $ 92.00 $ 92.00 - $ 0.0% Statutory Unregistered dog or cat wearing Council identification marker Non-taxable $ 92.00 $ 92.00 - $ 0.0% Statutory Person removing, altering or defacing identification marker Non-taxable $ 92.00 $ 92.00 - $ 0.0% Statutory Dog or cat on private property after notice served Non-taxable $ 92.00 $ 92.00 - $ 0.0% Statutory Dog at large or not securely confined - during the day Non-taxable $ 277.00 $ 277.00 - $ 0.0% Statutory Dog at large or not securely confined - during the night Non-taxable $ 370.00 $ 370.00 - $ 0.0% Statutory Cat at large or not securely confined in restrictive district Non-taxable $ 92.00 $ 92.00 - $ 0.0% Statutory Dog or cat in prohibited place Non-taxable $ 185.00 $ 185.00 - $ 0.0% Statutory Greyhound not muzzled or not controlled by chain, cord or leash Non-taxable $ 277.00 $ 277.00 - $ 0.0% Statutory Not complying with notice to abate nuisance Non-taxable $ 277.00 $ 277.00 - $ 0.0% Statutory ANIMAL IMPOUND FEES Impound Fees - Dog Pound release fee Taxable $ 113.00 $ 116.00 3.00 $ 2.6% Non-statutory Daily pound keeping fee (Monday to Friday) Taxable $ 52.00 $ 53.00 1.00 $ 1.9% Non-statutory Daily pound keeping fee (Saturday and Sunday) Taxable $ 72.00 $ 74.00 2.00 $ 2.7% Non-statutory Pound release fee - Repeat offenders Taxable $ 226.00 $ 232.00 6.00 $ 2.6% Non-statutory Impound Fees - Cat Pound release fee Taxable $ 113.00 $ 116.00 3.00 $ 2.6% Non-statutory Daily pound keeping fee (Monday to Friday) Taxable $ 52.00 $ 53.00 1.00 $ 1.9% Non-statutory Daily pound keeping fee (Saturday and Sunday) Taxable $ 72.00 $ 74.00 2.00 $ 2.7% Non-statutory Pound release fee - Repeat offenders Taxable $ 226.00 $ 232.00 6.00 $ 2.6% Non-statutory Livestock Livestock Taxable $ 41.00 $ 42.00 1.00 $ 2.4% Non-statutory ANIMAL REGISTRATIONS
Dangerous/Restricted breed Non-taxable $ 724.00 $ 742.00 18.00 $ 2.4% Non-statutory Standard Registration Non-taxable $ 151.00 $ 155.00 4.00 $ 2.6% Non-statutory Desexed and microchipped - Cat Non-taxable $ 38.00 $ 39.00 1.00 $ 2.6% Non-statutory Desexed and microchipped - Dog Non-taxable $ 47.00 $ 48.00 1.00 $ 2.1% Non-statutory Desexed registration - Cat Non-taxable $ 41.00 $ 42.00 1.00 $ 2.4% Non-statutory Desexed registration - Dog Non-taxable $ 52.00 $ 53.00 1.00 $ 1.9% Non-statutory Working Dogs Non-taxable $ 52.00 $ 53.00 1.00 $ 1.9% Non-statutory Animals over 10 years old - Cat Non-taxable $ 41.00 $ 42.00 1.00 $ 2.4% Non-statutory Animals over 10 years old - Dog Non-taxable $ 52.00 $ 53.00 1.00 $ 1.9% Non-statutory Animals registered with VCA or FCC - Cat Non-taxable $ 41.00 $ 42.00 1.00 $ 2.4% Non-statutory Animals registered with VCA or FCC - Dog Non-taxable $ 52.00 $ 53.00 1.00 $ 1.9% Non-statutory Animal permanently identified (microchipped) - Cat Non-taxable $ 108.00 $ 111.00 3.00 $ 2.7% Non-statutory Animal permanently identified (microchipped) - Dog Non-taxable $ 134.00 $ 137.00 3.00 $ 2.2% Non-statutory Breeding animal on registered premises - Cat Non-taxable $ 41.00 $ 42.00 1.00 $ 2.4% Non-statutory Breeding animal on registered premises - Dog Non-taxable $ 52.00 $ 53.00 1.00 $ 1.9% Non-statutory Late payment penalty fee (after 10 April) Non-taxable $ 20.00 $ 21.00 1.00 $ 4.8% Non-statutory Pensioner reduction rate Non-taxable 50% 50% - $ 0.0% Non-statutory Animal tag replacement Taxable $ 11.00 $ 11.00 - $ 0.0% Non-statutory View Animal Register Taxable $ 20.00 $ 21.00 1.00 $ 4.8% Non-statutory Page 56
BUILDING DEPARTMENT
Note: Prices do not include the statutory government levy applicable to all building works over $10,000 New Dwelling / Dwelling - Extension/Alteration
Includes partial compliance
Protection works additional $800
Performance solutions additional $1,000 (up to 2, more than 2 to be negotiated)
Includes four (4) mandatory inspections - additional inspections $190 each
Protection works additional $800
Performance solutions additional $1,000 (up to 2, more than 2 to be negotiated)
Includes four (4) mandatory inspections - additional inspections $190 each
Note: Includes three (3) mandatory inspections - additional inspections $190 each
Value of Works above $500,000 (or negotiated with Council)
Notes:
Includes partial compliance
Protection works additional $800
Performance solutions additional $1,000 (up to 2, more than 2 to be negotiated)
Includes four (4) mandatory inspections - additional inspections $190 each
$ $ $ % Fee Increase / (Decrease) Basis of Fee Description of Fees and Charges GST Status 2022/23 Fee Inc GST 2023/24 Fee Inc GST (Proposed) Fee Increase / (Decrease )
Up to $5,000 Taxable $ - $ - - $ 0.0% Non-statutory $5,001 to $10,000 Taxable $ 819.50 $ 819.50 - $ 0.0% Non-statutory $10,001 to $20,000 Taxable $ 1,072.50 $ 1,072.50 - $ 0.0% Non-statutory $20,001 to $50,000 Taxable $ 1,540.00 $ 1,540.00 - $ 0.0% Non-statutory $50,001 to $100,000 Taxable $ 2,051.50 $ 2,051.50 - $ 0.0% Non-statutory $100,001 to $150,000 Taxable $ 2,376.00 $ 2,376.00 - $ 0.0% Non-statutory $150,001 to $200,000 Taxable $ 2,794.00 $ 2,794.00 - $ 0.0% Non-statutory $200,001 to $250,000 Taxable $ 3,135.00 $ 3,135.00 - $ 0.0% Non-statutory $250,001 to $300,000 Taxable $ 3,520.00 $ 3,520.00 - $ 0.0% Non-statutory $300,001 to $350,000 Taxable $ 3,993.00 $ 3,993.00 - $ 0.0% Non-statutory $350,000 and above Taxable $ 4,224.00 $ 4,224.00 - $ 0.0% Non-statutory Notes:
New Dwellings,
Value of works $1 to $200,000 Taxable $ 3,135.00 $ 3,135.00 - $ 0.0% Non-statutory Value of works $200,001 to $250,000 Taxable $ 3,619.00 $ 3,619.00 - $ 0.0% Non-statutory Value of works $250,001 to $350,000 Taxable $ 3,916.00 $ 3,916.00 - $ 0.0% Non-statutory Value of works $350,001 and above Taxable $ 3,998.50 $ 3,998.50 - $ 0.0% Non-statutory
Re-erection/Re-siting
Notes:
Miscellaneous
Building Permits Garage/Carport/Shed/Patio/Verandah/Pergola Taxable $ 951.50 $ 951.50 - $ 0.0% Non-statutory Swimming Pool (Fence Alterations Only) Taxable $ 398.20 $ 398.20 - $ 0.0% Non-statutory Swimming Pool Fence (New Fence Only) Taxable $ 704.00 $ 704.00 - $ 0.0% Non-statutory Swimming Pool and all Fences Taxable $ 902.00 $ 902.00 - $ 0.0% Non-statutory Restumping (works must be performed by a Registered Builder) Taxable $ 968.00 $ 968.00 - $ 0.0% Non-statutory Demolish / Remove Building - Domestic (shed / house) Taxable $ 869.00 $ 869.00 - $ 0.0% Non-statutory Demolish / Remove Building - Commercial Taxable $ 913.00 $ 913.00 - $ 0.0% Non-statutory
-
Commercial Works Up to $10,000 Taxable $ 1,028.50 $ 1,028.50 - $ 0.0% Non-statutory $10,001 to $50,000 Taxable $ 1,485.00 $ 1,485.00 - $ 0.0% Non-statutory $50,001 to $100,000 Taxable $ 2,200.00 $ 2,200.00 - $ 0.0% Non-statutory $100,001 to $150,000 Taxable $ 2,722.50 $ 2,722.50 - $ 0.0% Non-statutory $150,001 to $200,000 Taxable $ 3,080.00 $ 3,080.00 - $ 0.0% Non-statutory $200,001 to $250,000 Taxable $ 3,630.00 $ 3,630.00 - $ 0.0% Non-statutory $250,001 to $300,000 Taxable $ 4,202.00 $ 4,202.00 - $ 0.0% Non-statutory $300,001 to $500,000 Taxable $ 4,785.00 $ 4,785.00 - $ 0.0% Non-statutory
Taxable (Value of works ÷ 50) (Value of works ÷ 50)
Page 57
compliance certificate - FORM 23 or FORM 24 (non-compliance)
$ $ $ % Fee Increase / (Decrease) Basis of Fee Description of Fees and Charges GST Status 2022/23 Fee Inc GST 2023/24 Fee Inc GST (Proposed) Fee Increase / (Decrease ) Community Group (Not for Profit) Building works - Building Permits (Discount on Permit fees only - State Government Levy still applies) Fee may be negotiated Fee may be negotiated Non-statutory Levies / Bonds Building Administration Fund Levy (State levy) Value of work x 0.00128 Value of work x 0.00128 Non-statutory Bond/Guarantee for Re-erection of buildings (The lesser the cost of the building work or $5,000) (The lesser the cost of the building work or $5,000) Council Infrastructure (Asset) Protection Deposit $ 770.00 $ 770.00 - $ 0.0% Inspections Additional Mandatory Inspections - per hour $ 209.00 $ 209.00 - $ 0.0% Non-statutory Inspections of Swimming Pool and Spa Barriers (compliance inspections) First Inspection $ 330.00 $ 330.00 - $ 0.0% Non-statutory Re-inspection $ 203.50 $ 203.50 - $ 0.0% Non-statutory Note: Includes
Excludes
lodgement
Swimming Pools and Spa's (Lodgement fees) Swimming Pool / Spa registration fee As per adopted regulatory fee As per adopted regulatory fee Swimming Pool / Spa records search determination fee As per adopted regulatory fee As per adopted regulatory fee Lodging a certificate of pool and spa barrier non-compliance As per adopted regulatory fee As per adopted regulatory fee Lodging a certificate of pool and spa barrier compliance As per adopted regulatory fee As per adopted regulatory fee Report and Consent Application for report and consent (To build over an easement vested in Council) As per adopted regulatory fee As per adopted regulatory fee (Regulation 310 Part 4 - Siting, 513,515,604,802 and 806) Application for report and consent (To build over an easement vested in Council) As per adopted regulatory fee As per adopted regulatory fee (Regulation 610 - Location of Point of Stormwater Discharge) Application for report and consent (section 29a - Demolition of building) As per adopted regulatory fee As per adopted regulatory fee Request for Information Property Information Requests As per adopted regulatory fee As per adopted regulatory fee (Regulation 326(1), 326(2) and 326(3) Request for Professional Advice/Consultation - per hour Taxable $ 175.00 $ 175.00 - $ 0.0% Non-statutory Page 58
prescribed
fees
(Refund only for inspections not carried out, based on inspection fee at time of cancellation)
of Section 80, 30 and 73) (lodged via hard copy/email/facsimile)
of Section 80, 30 and 73) (lodged wholly online via Greenlight only)
$ $ $ % Fee Increase / (Decrease) Basis of Fee Description of Fees and Charges GST Status 2022/23 Fee Inc GST 2023/24 Fee Inc GST (Proposed) Fee Increase / (Decrease ) File Retrieval / Search File Retrival - Minor Document (eg building / Occupancy Permit / Plans) each $ 49.50 $ 49.50 - $ 0.0% Non-statutory File Retrieval/Search (eg Permit History) Each $ 132.00 $ 132.00 - $ 0.0% Non-statutory Amended Building Permit Amended Building Permit - minor alterations Taxable $ 187.00 $ 187.00 - $ 0.0% Non-statutory Amended Building Permit - major alterations Taxable $ 308.00 $ 308.00 - $ 0.0% Non-statutory Time Extension - Building Permit - first request Taxable $ 319.00 $ 319.00 - $ 0.0% Non-statutory Time Extension - Building Permit - second request Taxable $ 363.00 $ 363.00 - $ 0.0% Non-statutory Time Extension - Building Permit - third request Taxable $ 407.00 $ 407.00 - $ 0.0% Non-statutory Inspection fee for permits issued by private building surveyors Taxable $295 + $1.86 per km outside of Nhill $295 + $1.86 per km outside of Nhill Non-statutory Refunds Withdrawn Application – Permit Lodged Not Yet Assessed Taxable $ 396.00 $ 396.00 - $ 0.0% Non-statutory Withdrawn Application – Permit Assessed Not Yet Issued Taxable 40% of fees (Minimum $480.00) 40% of fees (Minimum $480.00) Non-statutory Permit Cancellation – After Permit Issued
Taxable Permit fees retained Permit fees retained Non-statutory Permit Cancellation - After Permit Expited Taxable No refund No refund Non-statutory Lodgement Fee Lodgement fee for Private Building Surveyors As per adopted regulatory fee As per adopted regulatory fee Non-statutory (Submission
Lodgement fee for Private Building Surveyors As per adopted regulatory fee As per adopted regulatory fee Non-statutory (Submission
Events Place of Public Entertainment (POPE) Occupany Permit Taxable $ 440.00 $ 440.00 - $ 0.0% Non-statutory Temporary Siting Approval or Temporary Structure Inspection Taxable $ 286.00 $ 286.00 - $ 0.0% Non-statutory Entertainment / Event Consideration, Notification and Approval - No Permit Required Taxable $ 22.00 $ 22.00 - $ 0.0% Non-statutory Page 59
CAMPING FEES
Note: Some items may not be available at all times
$ $ $ % Fee Increase / (Decrease) Basis of Fee Description of Fees and Charges GST Status 2022/23 Fee Inc GST 2023/24 Fee Inc GST (Proposed) Fee Increase / (Decrease )
Peak Times Four Mile Beach - Powered Site Daily Taxable $ 15.00 $ 15.00 - $ 0.0% Non-statutory Four Mile Beach - Powered Site Weekly Taxable $ 92.00 $ 94.00 2.00 $ 2.1% Non-statutory Four Mile Beach - Unpowered Site Daily Taxable $ 10.00 $ 10.00 - $ 0.0% Non-statutory Four Mile Beach - Unpowered Site Weekly Taxable $ 61.00 $ 63.00 2.00 $ 3.2% Non-statutory Caravan Park Fees - Jeparit and Rainbow Daily Rates Linen fee - to be charged when customers want linen changed during lengthy stay in cabins Taxable $ 51.00 $ 52.00 1.00 $ 1.9% Non-statutory Powered site (2 persons) Taxable $ 25.00 $ 25.00 - $ 0.0% Non-statutory Unpowered site Taxable $ 20.00 $ 20.00 - $ 0.0% Non-statutory Extra person > 16 years old Taxable $ 10.00 $ 10.00 - $ 0.0% Non-statutory Extra person 6 - 15 years old Taxable $ 5.00 $ 5.00 - $ 0.0% Non-statutory Rainbow - On Site Caravan Taxable $ 51.00 $ 52.00 1.00 $ 1.9% Non-statutory Jeparit - Studio Cabin Taxable $ 105.00 $ 105.00 - $ 0.0% Non-statutory Jeparit - 2 bedroom cabin luxury Taxable $ 150.00 $ 150.00 - $ 0.0% Non-statutory Rainbow - 2 bedroom cabin luxury Taxable $ 150.00 $ 150.00 - $ 0.0% Non-statutory Weekly Rates (less than 40 days) Powered site (2 persons) Taxable $ 153.00 $ 157.00 4.00 $ 2.5% Non-statutory Unpowered site Taxable $ 92.00 $ 94.00 2.00 $ 2.1% Non-statutory Extra person > 16 years old Taxable $ 46.00 $ 47.00 1.00 $ 2.1% Non-statutory Extra person 6 - 15 years old Taxable $ 31.00 $ 32.00 1.00 $ 3.1% Non-statutory Rainbow - On Site Caravan Taxable $ 306.00 $ 314.00 8.00 $ 2.5% Non-statutory Jeparit - Cabin Taxable $ 612.00 $ 627.00 15.00 $ 2.4% Non-statutory Jeparit - Studio Cabin - Trades/Contractors Taxable $ 510.00 $ 523.00 13.00 $ 2.5% Non-statutory Jeparit - 2 bedroom cabin luxury Taxable $ 750.00 $ 750.00 - $ 0.0% Non-statutory Rainbow - 2 bedroom cabin luxury Taxable $ 750.00 $ 750.00 - $ 0.0% Non-statutory Caravan Park Fees - Dimboola Daily Rates Peak Times Linen fee - to be charged when customers want linen changed during lengthy stay in cabins Taxable $ 50.00 $ 50.00 - $ 0.0% Non-statutory Powered site (2 persons) Taxable $ 40.00 $ 40.00 - $ 0.0% Non-statutory Unpowered site Taxable $ 25.00 $ 25.00 - $ 0.0% Non-statutory Extra person > 16 years old Taxable $ 10.00 $ 10.00 - $ 0.0% Non-statutory Extra person 6 - 15 years old Taxable $ 10.00 $ 10.00 - $ 0.0% Non-statutory Ensuite site Taxable $ 60.00 $ 60.00 - $ 0.0% Non-statutory Cabin (Number 53 & 54) - 2 adults Taxable $ 110.00 $ 110.00 - $ 0.0% Non-statutory Cabin (2 bedroom) - 2 adults, 2 children Taxable $ 175.00 $ 175.00 - $ 0.0% Non-statutory Cabin (2 bedroom) - luxury Taxable $ 185.00 $ 185.00 - $ 0.0% Non-statutory Off Peak Times Linen fee - to be charged when customers want linen changed during lengthy stay in cabins Taxable $ 51.00 $ 52.00 1.00 $ 1.9% Non-statutory Powered site (2 persons) Taxable $ 36.00 $ 37.00 1.00 $ 2.7% Non-statutory Unpowered site Taxable $ 20.00 $ 21.00 1.00 $ 4.8% Non-statutory Extra person > 16 years old Taxable $ 10.00 $ 10.00 - $ 0.0% Non-statutory Extra person 6 - 15 years old Taxable $ 10.00 $ 10.00 - $ 0.0% Non-statutory Ensuite site Taxable $ 56.00 $ 56.00 - $ 0.0% Non-statutory Cabin (Number 53 & 54) - 2 adults Taxable $ 105.00 $ 105.00 - $ 0.0% Non-statutory Cabin (2 bedroom) - 2 adults, 2 children Taxable $ 155.00 $ 155.00 - $ 0.0% Non-statutory Cabin (2 bedroom) - luxury Taxable $ 160.00 $ 160.00 - $ 0.0% Non-statutory Page 60
Note: Nhill Caravan Park fees are set by the licensee and are not included in the above fees.
$ $ $ % Fee Increase / (Decrease) Basis of Fee Description of Fees and Charges GST Status 2022/23 Fee Inc GST 2023/24 Fee Inc GST (Proposed) Fee Increase / (Decrease ) Weekly Rates (less than 40 days) Peak Times Powered site (2 persons) Taxable $ 245.00 $ 251.00 6.00 $ 2.4% Non-statutory Unpowered site Taxable $ 150.00 $ 150.00 - $ 0.0% Non-statutory Extra person > 16 years old Taxable $ 60.00 $ 60.00 - $ 0.0% Non-statutory Extra person 6 - 15 years old Taxable $ 45.00 $ 45.00 - $ 0.0% Non-statutory Ensuite site Taxable $ 305.00 $ 305.00 - $ 0.0% Non-statutory Cabin (Number 53 & 54) - 2 adults Taxable $ 680.00 $ 680.00 - $ 0.0% Non-statutory Cabin (Number 53 & 54) - Trades/Contractor Taxable $ 565.00 $ 565.00 - $ 0.0% Non-statutory Cabin (2 bedroom) - 2 adults, 2 children Taxable $ 1,050.00 $ 1,050.00 - $ 0.0% Non-statutory Cabin (2 bedroom) - luxury Taxable $ 1,110.00 $ 1,110.00 - $ 0.0% Non-statutory Off Peak Times Powered site (2 persons) Taxable $ 214.00 $ 219.00 5.00 $ 2.3% Non-statutory Unpowered site Taxable $ 122.00 $ 125.00 3.00 $ 2.4% Non-statutory Extra person > 16 years old Taxable $ 61.00 $ 63.00 2.00 $ 3.2% Non-statutory Extra person 6 - 15 years old Taxable $ 46.00 $ 47.00 1.00 $ 2.1% Non-statutory Ensuite site Taxable $ 275.00 $ 282.00 7.00 $ 2.5% Non-statutory Cabin (Number 53 & 54) - 2 adults Taxable $ 612.00 $ 627.00 15.00 $ 2.4% Non-statutory Cabin (Number 53 & 54) - Trades/Contractor Taxable $ 510.00 $ 523.00 13.00 $ 2.5% Non-statutory Cabin (2 bedroom) - 2 adults, 2 children Taxable $ 875.00 $ 875.00 - $ 0.0% Non-statutory Cabin (2 bedroom) - luxury Taxable $ 900.00 $ 900.00 - $ 0.0% Non-statutory *Peak Times: Other items Fire drum hire (per visit) Taxable $ 10.00 $ 10.00 - $ 0.0% Non-statutory Fire wood - 20kg bag Taxable $ 10.00 $ 10.00 - $ 0.0% Non-statutory Bike hire - 30 minutes Taxable $ 5.00 $ 5.00 - $ 0.0% Non-statutory
COMMUNITY BUS Community Group Hire Fees - per kilometre Taxable $ 0.40 $ 0.40 - $ 0.0% Non-statutory *Note: Fuel at cost of hirer; bus must be returned
tank of fuel. Other Hirer Fees - per kilometre Taxable $ 1.00 $ 1.00 - $ 0.0% Non-statutory *Note: Fuel at cost of hirer; bus must
DISABLED PARKING LABELS Disabled parking labels Taxable $ 9.20 $ 9.40 0.20 $ 2.1% Non-statutory ELECTIONS Candidate deposits Non-taxable $ 250.00 $ 250.00 - $ 0.0% Statutory Failure to vote fines (Local Government Act 2020) Non-taxable $ 91.00 $ 91.00 - $ 0.0% Statutory EVENTS Hire of Variable Message Sign (per week) (including set up of message) Taxable $ 206.00 $ 211.20 5.20 $ 2.5% Non-statutory Completion of Traffic Management Plan (per hour) Taxable $ 61.80 $ 63.30 1.50 $ 2.4% Non-statutory Execution of Road Closure for events including all signage (per hour) Taxable $ 181.60 $ 186.10 4.50 $ 2.4% Non-statutory Newspaper advertising of Road Closures Taxable At Cost At Cost Non-statutory Page 61
with full
be returned with full tank of fuel.
$ $ $ % Fee Increase / (Decrease) Basis of Fee Description of Fees and Charges GST Status 2022/23 Fee Inc GST 2023/24 Fee Inc GST (Proposed) Fee Increase / (Decrease ) FIRE PREVENTION NOTICES Fire Hazard Removal Taxable $205.00 plus removal costs $205.00 plus removal costs Non-statutory Failure to comply with Fire Prevention Notice (Country Fire Authority Act 1958) Non-taxable $ 1,849.00 $ 1,849.00 - $ 0.0% Statutory FREEDOM OF INFORMATION REQUESTS Freedom of Information - Application fee Non-taxable $ 30.60 $ 31.80 1.20 $ 3.8% Statutory Freedom of Information - Search fee (per hour) Non-taxable $ 22.94 $ 23.85 0.92 $ 3.8% Statutory Freedom of Information - Supervision charge (per 15 minutes) Non-taxable $ 5.73 $ 6.00 0.27 $ 4.4% Statutory Freedom of Information - Photocopy charge (black and white) Non-taxable $ 0.20 $ 0.20 - $ 0.0% Statutory GARBAGE BIN SALES 120 litre bin Taxable $ 77.00 $ 79.00 2.00 $ 2.5% Non-statutory 240 litre bin Taxable $ 97.00 $ 99.00 2.00 $ 2.0% Non-statutory Replacement bin lid - 120 litre Taxable $ 26.00 $ 27.00 1.00 $ 3.7% Non-statutory Replacement bin lid - 240 litre Taxable $ 26.00 $ 27.00 1.00 $ 3.7% Non-statutory HALL HIRE Jeparit Hall Bond Taxable $ 214.00 $ 219.00 5.00 $ 2.3% Non-statutory Community Group Hall Hire - Full day Taxable $ 153.00 $ 157.00 4.00 $ 2.5% Non-statutory Community Group Hall Hire - Half day Taxable $ 112.00 $ 115.00 3.00 $ 2.6% Non-statutory Community Group Hall Hire - Evening Taxable $ 112.00 $ 115.00 3.00 $ 2.6% Non-statutory Hall Hire - Private Functions Taxable $ 388.00 $ 398.00 10.00 $ 2.5% Non-statutory Hall Hire - Meetings (up to 3 hours) Taxable $ 87.00 $ 89.00 2.00 $ 2.2% Non-statutory Kitchen Taxable $ 37.00 $ 38.00 1.00 $ 2.6% Non-statutory Cool room Taxable $ 21.00 $ 22.00 1.00 $ 4.5% Non-statutory Small meeting room (hourly rate) Taxable $ 15.00 $ 15.00 - $ 0.0% Non-statutory Nhill Memorial Community Centre Bond Non-Taxable $ 210.00 $ 210.00 - $ 0.0% Non-statutory Community Group Hall Hire - Full day Taxable $ 155.00 $ 155.00 - $ 0.0% Non-statutory Community Group Hall Hire - Half day Taxable $ 125.00 $ 125.00 - $ 0.0% Non-statutory Community Group Hall Hire - Evening Taxable $ 125.00 $ 125.00 - $ 0.0% Non-statutory Hall Hire - Private Functions Taxable $ 425.00 $ 425.00 - $ 0.0% Non-statutory Hall Hire - Meetings (up to 3 hours) Taxable $ 205.00 $ 205.00 - $ 0.0% Non-statutory Hall Hire - Functions (after 1am per hour) Taxable $ 55.00 $ 55.00 - $ 0.0% Non-statutory Hall Hire - Set up / Pack up (daily) Taxable $ 55.00 $ 55.00 - $ 0.0% Non-statutory Kitchen / Bar / Cool room Hire Taxable $ 50.00 $ 50.00 - $ 0.0% Non-statutory Baby Grand Piano Taxable $ 55.00 $ 55.00 - $ 0.0% Non-statutory Table Cloths (round or oblong) - each Taxable $ 15.00 $ 15.00 - $ 0.0% Non-statutory Cleaning Taxable $ 155.00 $ 155.00 - $ 0.0% Non-statutory Meeting Room Hire Dimboola Library Community Group Hire - per hour Taxable $ 15.00 $ 15.00 - $ 0.0% Non-statutory Private Function Hire - per hour Taxable $ 25.00 $ 25.00 - $ 0.0% Non-statutory Page 62
HEALTH REGISTRATIONS
*Premises should be registered to the highest risk activity
$ $ $ % Fee Increase / (Decrease) Basis of Fee Description of Fees and Charges GST Status 2022/23 Fee Inc GST 2023/24 Fee Inc GST (Proposed) Fee Increase / (Decrease ) Movie Tickets Adult Taxable $ 12.00 $ 12.00 - $ 0.0% Non-statutory Concession Taxable $ 7.00 $ 7.00 - $ 0.0% Non-statutory Family (2 Adults & 3 Children/Concession) Taxable $ 30.00 $ 30.00 - $ 0.0% Non-statutory Bulk Buy - Adult (6) Taxable $ 60.00 $ 60.00 - $ 0.0% Non-statutory Bulk Buy - Child/Concession (6) Taxable $ 30.00 $ 30.00 - $ 0.0% Non-statutory Bulk Buy - Family (6) Taxable $ 150.00 $ 150.00 - $ 0.0% Non-statutory VIP Seating *Note: VIP Seating includes medium popcorn and a drink. Adult Taxable $ 25.00 $ 25.00 - $ 0.0% Non-statutory Child/Concession Taxable $ 20.00 $ 20.00 - $ 0.0% Non-statutory Double - Adult Taxable $ 40.00 $ 40.00 - $ 0.0% Non-statutory Double - Child Taxable $ 30.00 $ 30.00 - $ 0.0% Non-statutory Special Movie Event Tickets Adult Taxable $ 10.00 $ 10.00 - $ 0.0% Non-statutory Concession Taxable $ 5.00 $ 5.00 - $ 0.0% Non-statutory
Initial Registration of Premises Non-taxable Relevant renewal fee + 50% Non-statutory Transfer of registration fee (PH&W only) Non-taxable 50% of relevant renewal fee Non-statutory Transfer of Registration - Accommodation Non-taxable 50% of annual fee 50% of annual fee Non-statutory Transfer of food premises Non-taxable 50% of annual fee 50% of annual fee Non-statutory Additional inspection due to continued non-compliance Non-taxable $ 150.00 150.00 $ 100.0% Non-statutory Additional sampling due to continued non-compliance Non-taxable At cost + 50% Non-statutory Inspection by request Non-taxable $ 135.00 $ 150.00 15.00 $ 10.0% Non-statutory Food Act - Fixed Premises Food premises class 1 (hospital / aged care / child care) Non-taxable $ 440.00 $ 450.00 10.00 $ 2.2% Non-statutory Food premises class 2 standard (including community groups) Non-taxable $ 315.00 $ 350.00 35.00 $ 10.0% Non-statutory Food premises class 3 (including community groups) Non-taxable $ 160.00 $ 175.00 15.00 $ 8.6% Non-statutory Food premises class 4 Non-taxable $ - $ - Non-statutory Food Act Streattrader Class 2 - Mobile yearly fee business Non-taxable $ 350.00 350.00 $ 100.0% Non-statutory Class 2 - Community Group Non-taxable $ 50.00 50.00 $ 100.0% Non-statutory Class 3 - Mobile yearly fee business Non-taxable $ 175.00 175.00 $ 100.0% Non-statutory Class 3 with class 2 fixed premises registration Non-taxable $ 50.00 50.00 $ 100.0% Non-statutory Class 3 - Community Group Non-taxable $ 50.00 50.00 $ 100.0% Non-statutory Public Health and Wellbeing Prescribed accommodation - Hotels, motels, B&B able to sleep 5 or more people etc <10 beds Non-taxable $ 230.00 $ 200.00 (30.00) $ -15.0% Non-statutory Prescribed accommodation - Hotels, motels, B&B able to sleep 5 or more people etc 10-20 beds Non-taxable $ 250.00 250.00 $ 100.0% Non-statutory Prescribed accommodation - Hotels, motels, B&B able to sleep 5 or more people etc >20 beds Non-taxable $ 300.00 300.00 $ 100.0% Non-statutory Beauty (including Hairdressing) – waxing, nails and ear piercing etc annual renewal Non-taxable $ 185.00 $ 150.00 (35.00) $ -23.3% Non-statutory Hairdressers/make up – one off registrations (inspect 3 years) hairdressing & make up only – no other activity Non-taxable 50% of annual fee $ 150.00 Non-statutory Transfer of Registration - Hairdressers Non-taxable $ 90.00 $ 90.00 - $ 0.0% Non-statutory Skin Pen - tattooing, ear piercing etc Non-taxable $ 200.00 200.00 $ 100.0%
Page 63
*Note:
on 01 July each year.
$ $ $ % Fee Increase / (Decrease) Basis of Fee Description of Fees and Charges GST Status 2022/23 Fee Inc GST 2023/24 Fee Inc GST (Proposed) Fee Increase / (Decrease ) Aquatic Facilities Pools public / private accommodation / spas Non-taxable $ 200.00 200.00 $ 100.0% Non-statutory Caravan Parks - Total number of sites (other than camp sites) Not exceeding 25 Non-taxable $ 249.40 $ 249.40 - $ 0.0% Statutory Exceeding 25 but not 50 Non-taxable $ 495.60 $ 495.60 - $ 0.0% Statutory Exceeding 50 but not 100 Non-taxable $ 1,000.00 $ 1,000.00 - $ 0.0% Statutory Transfer of Registration - Caravan Park Non-taxable $ 90.00 $ 90.00 - $ 0.0% Non-statutory Late payment penalty for all registrations Non-taxable 50% of annual fee 50% of annual fee Non-statutory Environmental Protection Act Application to install a septic system Non-taxable $ 350.00 350.00 $ 100.0% Non-statutory Application to amend/alter an existing system Non-taxable $ 150.00 150.00 $ 100.0% Non-statutory Application to extend a septic application Non-taxable $ 175.00 175.00 $ 100.0% Non-statutory Additional inspection due to non-compliance Non-taxable $ 110.00 110.00 $ 100.0% Non-statutory INSURANCE Stall holder - one off event Taxable $ 37.70 $ 38.60 0.90 $ 2.3% Non-statutory Stall holder - regular event Taxable $ 20.90 $ 21.40 0.50 $ 2.3% Non-statutory Hall hire Taxable $ 16.30 $ 16.70 0.40 $ 2.4% Non-statutory Performers / Buskers / Artists Taxable $ 38.30 $ 39.30 1.00 $ 2.5% Non-statutory Tutors - Non sporting (music teachers, craft teachers etc.) - Annual coverage Taxable $ 202.00 $ 207.10 5.10 $ 2.5% Non-statutory LITTERING FINES (Environment Protection Act 2017) Littering fines - deposit small item of litter Non-taxable $ 370.00 $ 370.00 - $ 0.0% Statutory Littering fines - deposit litter Non-taxable $ 370.00 $ 370.00 - $ 0.0% Statutory Littering fines - deposit burning litter Non-taxable $ 740.00 $ 740.00 - $ 0.0% Statutory Unsecured load fines Non-taxable $ 740.00 $ 740.00 - $ 0.0% Statutory LOCAL LAWS PERMIT FEES Document processing fee (Admin fee) $ 20.00 $ 20.00 - $ 0.0% Non-statutory Fire permits Non-taxable $ 39.30 $ 40.30 1.00 $ 2.5% Non-statutory Waste containers Non-taxable $ 61.80 $ 63.30 1.50 $ 2.4% Non-statutory Recreational Vehicles Non-taxable $ 30.90 $ 31.70 0.80 $ 2.5% Non-statutory Street Traders and Collectors Permits Non-taxable $ 46.40 $ 47.60 1.20 $ 2.5% Non-statutory Signs on pavement, street furniture and/or merchandise - 3 years Non-taxable $ 216.20 $ 221.60 5.40 $ 2.4% Streets and Roads - Temporary Vehicle Crossing Non-taxable $ - $ - Non-statutory Streets and Roads - Heavy or Long Vehicles Non-taxable $ 92.80 $ 95.10 2.30 $ 2.4% Non-statutory Streets and Roads - Removal of Firewood Non-taxable $ 30.90 $ 31.70 0.80 $ 2.5% Non-statutory Streets and Roads - Cut and Burn on Road Reserves Non-taxable $ 39.30 $ 40.30 1.00 $ 2.5% Non-statutory Keeping of Animals Dogs - permit to exceed prescribed number of animals (where no planning permit required) - 3 years Non-taxable $ 216.20 $ 221.60 5.40 $ 2.4% Non-statutory Cats - permit to exceed prescribed number of animals (where no planning permit required) - 3 years Non-taxable $ 216.20 $ 221.60 5.40 $ 2.4% Non-statutory Horses and Cattle - 3 years Non-taxable $ 216.20 $ 221.60 5.40 $ 2.4% Non-statutory Domestic Birds and Poultry - 3 years Non-taxable $ 216.20 $ 221.60 5.40 $ 2.4% Non-statutory Pigeons - 3 years Non-taxable $ 216.20 $ 221.60 5.40 $ 2.4% Non-statutory Rodents and Reptiles - 3 years Non-taxable $ 216.20 $ 221.60 5.40 $ 2.4% Non-statutory Other Animals - 3 years Non-taxable $ 216.20 $ 221.60 5.40 $ 2.4% Non-statutory Different Types of Animals - 3 years Non-taxable $ 216.20 $ 221.60 5.40 $ 2.4% Non-statutory Protection of Council Assets
fees are set
VicRoads
Road Opening Permit - L1 Taxable $ 657.90 $ 674.30 16.40 $ 2.4% Non-statutory Road Opening Permit - L2 Taxable $ 358.00 $ 367.00 9.00 $ 2.5% Non-statutory Road Opening Permit - L3 Taxable $ 141.80 $ 145.30 3.50 $ 2.4% Non-statutory Road Opening Permit - L4 Taxable $ 91.80 $ 94.10 2.30 $ 2.4% Non-statutory Page 64
These
by
PARKING FINES (Road Safety Rules 2017)
$ $ $ % Fee Increase / (Decrease) Basis of Fee Description of Fees and Charges GST Status 2022/23 Fee Inc GST 2023/24 Fee Inc GST (Proposed) Fee Increase / (Decrease ) Legal point of Discharge Non-taxable As per adopted regulatory fee As per adopted regulatory fee Statutory Asset Surveillance Non-taxable As per adopted regulatory fee As per adopted regulatory fee Statutory Other Abandoned motor vehicle Non-taxable $355.00 plus towing expenses $355.00 plus towing expenses - $ 0.0% Non-statutory MUSEUM FEES Wimmera Mallee Pioneer Museum Adult Taxable $ 10.00 $ 10.00 - $ 0.0% Non-statutory Pensioner Taxable $ 6.00 $ 6.00 - $ 0.0% Non-statutory Adult over 90 Taxable $ - $ - Non-statutory Children under 5 Taxable $ - $ - Non-statutory Children over 5 but under 12 Taxable $ 3.00 $ 3.00 - $ 0.0% Non-statutory Family Taxable $ 20.00 $ 20.00 - $ 0.0% Non-statutory Groups of 10 or more Taxable $ 5.00 $ 5.00 - $ 0.0% Non-statutory School groups (per student - teachers no charge) Taxable $ 5.00 $ 5.00 - $ 0.0% Non-statutory Yurunga Homestead Adult Taxable $ 5.00 $ 7.50 2.50 $ 33.3% Non-statutory Secondary School Student $ 5.00 5.00 $ 100.0% Non-statutory Children under 12 Taxable $ 3.00 Free Groups Lunch Taxable $ 17.50 17.50 $ 100.0% Non-statutory Lunch plus tour Taxable $ 25.00 25.00 $ 100.0% Non-statutory Morning or afternoon tea Taxable $ 10.00 $ 15.00 5.00 $ 33.3% Non-statutory Morning/Afternoon plus tour $ 22.50 22.50 $ 100.0% Non-statutory
Heavy vehicles parked in a built up area longer than 1 hour Non-taxable $ 111.00 $ 111.00 - $ 0.0% Statutory Parked in a disabled area Non-taxable $ 185.00 $ 185.00 - $ 0.0% Statutory Stopped in a no-stopping area Non-taxable $ 185.00 $ 185.00 - $ 0.0% Statutory Stopped in a children's crossing Non-taxable $ 185.00 $ 185.00 - $ 0.0% Statutory Stopped in a loading zone Non-taxable $ 185.00 $ 185.00 - $ 0.0% Statutory PHOTOCOPIES & SCANNING A4 - Black and White Taxable $ 0.60 $ 0.60 - $ 0.0% Non-statutory A4 - Colour Taxable $ 1.10 $ 1.10 - $ 0.0% Non-statutory A3 - Black and White Taxable $ 1.10 $ 1.10 - $ 0.0% Non-statutory A3 - Colour Taxable $ 2.40 $ 2.50 0.10 $ 4.0% Non-statutory Engineering plans Taxable $ 7.70 $ 7.90 0.20 $ 2.5% Non-statutory A2 - Black and White Taxable $ 17.20 $ 17.60 0.40 $ 2.3% Non-statutory A2 - Colour Taxable $ 23.00 $ 23.60 0.60 $ 2.5% Non-statutory A1 - Black and White Taxable $ 29.10 $ 29.80 0.70 $ 2.3% Non-statutory A1 - Colour Taxable $ 33.20 $ 34.00 0.80 $ 2.4% Non-statutory A0 - Black and White Taxable $ 32.60 $ 33.40 0.80 $ 2.4% Non-statutory A0 - Colour Taxable $ 39.30 $ 40.30 1.00 $ 2.5% Non-statutory B Size Surcharge Taxable $ 3.50 $ 3.60 0.10 $ 2.8% Non-statutory Scanning up to 10 pages Taxable $ 2.60 $ 2.70 0.10 $ 3.7% Non-statutory Scanning 10 - 50 pages Taxable $ 5.10 $ 5.20 0.10 $ 1.9% Non-statutory Scanning over 50 pages Taxable $ 7.70 $ 7.90 0.20 $ 2.5% Non-statutory Laminating A4 Taxable $ 1.20 $ 1.20 - $ 0.0% Non-statutory Laminating A3 Taxable $ 1.50 $ 1.50 - $ 0.0% Non-statutory Page 65
To develop land or to use and develop land for a single dwelling per lot or to undertake development ancillary to the use of the land for a single dwelling per lot if the estimated cost of development included in the application
16 - to remove a restriction (within the meaning of the Subdivision Act 1988) over land if the land has been used or developed for more than 2 years before the date of the application in a manner which would have been lawful under the Planning and Environment Act 1987 but for the existence of the restriction
Act
to remove a right
to create, vary or remove an easement other than a right of way;
to vary or remove a condition in the nature of an easement other than a right of way in a Crown grant
permit
not provided for in
$ $ $ % Fee Increase / (Decrease) Basis of Fee Description of Fees and Charges GST Status 2022/23 Fee Inc GST 2023/24 Fee Inc GST (Proposed) Fee Increase / (Decrease ) PLANNING Planning Certificate Fee Non-taxable $ 21.70 $ 21.70 - $ 0.0% Statutory Certificate of Compliance Non-taxable $ 317.90 $ 317.90 - $ 0.0% Statutory Applications for Permits (Regulation 9) Class 1 - Use Only Non-taxable $ 1,286.10 $ 1,286.10 - $ 0.0% Statutory Class 2 -
is: <$10,000 Non-taxable $ 195.10 $ 195.10 - $ 0.0% Statutory >$10,001 - $100,000 Non-taxable $ 614.10 $ 614.10 - $ 0.0% Statutory >$100,001 - $500,000 Non-taxable $ 1,257.20 $ 1,257.20 - $ 0.0% Statutory >$500,001 - $1,000,000 Non-taxable $ 1,358.30 $ 1,358.30 - $ 0.0% Statutory >$1,000,001 - $2,000,000 Non-taxable $ 1,459.90 $ 1,459.90 - $ 0.0% Statutory VicSmart VicSmart application if the estimated cost of development is: <$10,000 Non-taxable $ 195.00 $ 195.00 - $ 0.0% Statutory >$10,000 Non-taxable $ 419.10 $ 419.10 - $ 0.0% Statutory Permits <$100,000 Non-taxable $ 1,119.90 $ 1,119.90 - $ 0.0% Statutory $100,000 - $1,000,000 Non-taxable $ 1,510.00 $ 1,510.00 - $ 0.0% Statutory $1,000,001 - $5,000,000 Non-taxable $ 3,330.70 $ 3,330.70 - $ 0.0% Statutory $5,000,001 - $15,000,000 Non-taxable $ 8,489.40 $ 8,489.40 - $ 0.0% Statutory $15,000,001 - $50,000,000 Non-taxable $ 25,034.60 $ 25,034.60 - $ 0.0% Statutory >$50,000,001 Non-taxable $ 56,268.30 $ 56,268.30 - $ 0.0% Statutory Class 12 - to subdivide an existing building Non-taxable $ 1,286.10 $ 1,286.10 - $ 0.0% Statutory Class 13 - to subdivide land into two lots Non-taxable $ 1,286.10 $ 1,286.10 - $ 0.0% Statutory Class 14 - to effect a realignment of a common boundary between lots
consolidate
more lots Non-taxable $ 1,286.10 $ 1,286.10 - $ 0.0% Statutory Class 15 - to subdivide land Non-taxable $1286.40 per 100 lots created $1286.40 per 100 lots created Statutory Class
Non-taxable $ 1,286.10 $ 1,286.10 - $ 0.0% Statutory Class 17 - to create,
or
Subdivision
1988; or
of
Non-taxable $ 1,286.10 $ 1,286.10 - $ 0.0% Statutory Class 18 -
Non-taxable $ 1,286.10 $ 1,286.10 - $ 0.0% Statutory Class 21 - a
regulation Non-taxable $ 1,286.10 $ 1,286.10 - $ 0.0% Statutory Page 66
or to
two or
vary
remove a restriction under the
way
or
otherwise
to Permits
Amendment to a permit to change the use of land allowed by the permit or allow a new use of land
Amendment to a permit (other than a permit to develop land for a single dwelling per lot to use and develop land for a single dwelling per lot or to undertake development ancillary to the use of land for a single dwelling per lot) to change the statement of what the permit allows or to change any or all of the conditions which apply to the permit.
$ $ $ % Fee Increase / (Decrease) Basis of Fee Description of Fees and Charges GST Status 2022/23 Fee Inc GST 2023/24 Fee Inc GST (Proposed) Fee Increase / (Decrease )
Amendments
Non-taxable $ 1,286.10 $ 1,286.10 - $ 0.0% Statutory
Non-taxable $ 1,286.10 $ 1,286.10 - $ 0.0% Statutory Amendment to a class 2 permit Non-taxable $ 195.10 $ 195.10 - $ 0.0% Statutory Amendment to a class 3 permit Non-taxable $ 614.10 $ 614.10 - $ 0.0% Statutory Amendment to a class 4 permit Non-taxable $ 1,257.20 $ 1,257.20 - $ 0.0% Statutory Amendment to a class 5 or class 6 permit Non-taxable $ 1,358.30 $ 1,358.30 - $ 0.0% Statutory Amendment to a class 7 permit Non-taxable $ 195.10 $ 195.10 - $ 0.0% Statutory Amendment to a class 8 permit Non-taxable $ 419.10 $ 419.10 - $ 0.0% Statutory Amendment to a class 9 permit Non-taxable $ 195.10 $ 195.10 - $ 0.0% Statutory Amendment to a class 10 permit Non-taxable $ 1,119.90 $ 1,119.90 - $ 0.0% Statutory Amendment to a class 11 permit Non-taxable $ 1,510.00 $ 1,510.00 - $ 0.0% Statutory Amendment to a class 12, 13, 14, or 15 permit Non-taxable $ 3,330.70 $ 3,330.70 - $ 0.0% Statutory Amendment to a class 16 permit Non-taxable $ 1,286.10 $ 1,286.10 - $ 0.0% Statutory Amendment to a class 17 permit Non-taxable $ 1,286.10 $ 1,286.10 - $ 0.0% Statutory Amendment to a class 18 permit Non-taxable $ 1,286.10 $ 1,286.10 - $ 0.0% Statutory Amendment to a class 19 permit Non-taxable $1286.10 per 100 lots created $1286.10 per 100 lots created Statutory Amendment to a class 20 permit Non-taxable $ 1,286.10 $ 1,286.10 - $ 0.0% Statutory Amendment to a class 21 permit Non-taxable $ 1,286.10 $ 1,286.10 - $ 0.0% Statutory Planning Additional Fees - Advertising (conducted on applicants behalf) Newspaper advertisement - At cost Taxable At cost At cost Non-statutory Placing of notice onsite Taxable $ 113.20 $ 116.00 2.80 $ 2.4% Non-statutory Notice of planning permit by mail (if more than 10 letters, per letter) Taxable $ 7.10 $ 7.30 0.20 $ 2.7% Non-statutory Planning - Additional Fees Secondary Consent Application Taxable $ 206.00 $ 211.20 5.20 $ 2.5% Non-statutory Extension of Time to planning permit Taxable $ 257.60 $ 264.00 6.40 $ 2.4% Non-statutory Section 173 Agreements Taxable $ 208.10 $ 213.30 5.20 $ 2.4% Non-statutory Written Advice on Planning Controls Taxable $ 154.50 $ 158.40 3.90 $ 2.5% Non-statutory Copy of Permit and Endorsed Plans (per planning permit) Taxable $ 144.20 $ 147.80 3.60 $ 2.4% Non-statutory Request for Council consent where no planning permit required (i.e. liquor license) Taxable $ 141.30 $ 144.80 3.50 $ 2.4% Non-statutory Planning - Withdrawal of Application After lodgement (no work undertaken) Taxable 75% of app fee refundable 75% of app fee refundable Non-statutory After request for further information but prior to commencement of advertising Taxable 50% of the application fee refunded 50% of the application fee refunded Non-statutory After advertising Taxable Refund discretionary Refund discretionary Non-statutory Secondary Consent Taxable Refund discretionary Refund discretionary Non-statutory Extension of Time Taxable No refund No refund Non-statutory Page 67
Note: Swimming Pool fees are set by the contractor
$ $ $ % Fee Increase / (Decrease) Basis of Fee Description of Fees and Charges GST Status 2022/23 Fee Inc GST 2023/24 Fee Inc GST (Proposed) Fee Increase / (Decrease ) PUBLIC SPACES Minor use of facilities –Parks, Soundshells, Rotundas etc. Taxable $ 33.70 $ 34.50 0.80 $ 2.3% Non-statutory Major use of facilities –Parks, Soundshells, Rotundas etc. Taxable $ 169.30 $ 173.50 4.20 $ 2.4% Non-statutory RATES Rates - debt recovery fees Non-taxable Cost recovery Cost recovery Non-statutory Land information certificate Non-taxable As per adopted regulatory fee As per adopted regulatory fee Statutory - $ #DIV/0! RECYCLING TRAILER - $ #DIV/0! Recycling Trailer Hire (per event) Taxable $ 20.40 $ 20.90 0.50 $ 2.4% Non-statutory Recycling Trailer Hire - Bond (per event) Non-taxable $ 306.00 $ 313.70 7.70 $ 2.5% Non-statutory SALEYARD FEES Pigs (per pig / day) Taxable $ 0.70 $ 0.70 - $ 0.0% Non-statutory Sheep (per sheep / day) Taxable $ 0.70 $ 0.70 - $ 0.0% Non-statutory Yard fee per sale (per agent) Taxable $ 1,377.00 $ 1,411.40 34.40 $ 2.4% Non-statutory SEPTIC TANK FEES Application to install a septic system Non-taxable $ 350.00 350.00 $ 100.0% Non-statutory Application to amend/alter an existing system Non-taxable $ 150.00 150.00 $ 100.0% Non-statutory Application to extend a septic application Non-taxable $ 175.00 175.00 $ 100.0% Non-statutory Additional inspection due to non-compliance Non-taxable $ 110.00 110.00 $ 100.0% Non-statutory
POOLS
SWIMMING
WASTE DEPOT FEES Unsorted recyclables, general waste and hard plastic Car boot Taxable $ 12.20 $ 12.50 0.30 $ 2.4% Non-statutory 6 x 4 trailer / ute – Level Taxable $ 32.60 $ 33.40 0.80 $ 2.4% Non-statutory 6 x 4 trailer / ute – Heaped Taxable $ 61.20 $ 62.70 1.50 $ 2.4% Non-statutory Tandem trailer / Light truck – Level Taxable $ 87.70 $ 89.90 2.20 $ 2.4% Non-statutory Tandem trailer / Light truck – Heaped Taxable $ 166.30 $ 170.50 4.20 $ 2.5% Non-statutory Builders waste clean sorted – Per cubic metre Taxable $ 74.50 $ 76.40 1.90 $ 2.5% Non-statutory Builders waste dirty non-sorted – Per cubic metre Taxable $ 180.50 $ 185.00 4.50 $ 2.4% Non-statutory Concrete Non-sorted – Per tonne Taxable $ 127.50 $ 130.70 3.20 $ 2.4% Non-statutory Concrete Clean, sorted – Per tonne Taxable $ 36.70 $ 37.60 0.90 $ 2.4% Non-statutory Heavy truck loads Taxable Not accepted Not accepted Mattresses (Double and larger) Taxable $ 51.00 $ 52.30 1.30 $ 2.5% Non-statutory Mattresses (Single) Taxable $ 25.50 $ 26.10 0.60 $ 2.3% Non-statutory Asbestos (per kilogram) Taxable $ 2.00 $ 2.10 0.10 $ 4.8% Non-statutory Clean Fill Dirt (per ton) Taxable new $ 10.00 Non-statutory Sorted recyclables Newspapers, Cardboard, Bottles, Cans etc. Taxable $ - $ - - $ 0.0% Non-statutory Page 68
$ $ $ % Fee Increase / (Decrease) Basis of Fee Description of Fees and Charges GST Status 2022/23 Fee Inc GST 2023/24 Fee Inc GST (Proposed) Fee Increase / (Decrease ) Tyres Car and Motorcycle Taxable $ 9.20 $ 9.40 0.20 $ 2.1% Non-statutory Light Commercial Taxable $ 25.50 $ 26.10 0.60 $ 2.3% Non-statutory Truck –Standard Taxable $ 77.50 $ 79.40 1.90 $ 2.4% Non-statutory Tractor - under 2 metres high Taxable $ 137.70 $ 141.10 3.40 $ 2.4% Non-statutory Tractor - over 2 metres high Taxable $ 280.50 $ 287.50 7.00 $ 2.4% Non-statutory Car bodies Car bodies / scrap steel Taxable $ - $ - - $ 0.0% Non-statutory Green Waste & Timber Car boot Taxable $ 6.10 $ 6.30 0.20 $ 3.2% Non-statutory 6 x 4 trailer / ute – Level Taxable $ 12.20 $ 12.50 0.30 $ 2.4% Non-statutory 6 x 4 trailer / ute – Heaped Taxable $ 15.30 $ 15.70 0.40 $ 2.5% Non-statutory Tandem trailer / Light truck – Level Taxable $ 22.40 $ 23.00 0.60 $ 2.6% Non-statutory Tandem trailer / Light truck – Heaped Taxable $ 30.60 $ 31.40 0.80 $ 2.5% Non-statutory Heavy truck Taxable $ 58.10 $ 59.60 1.50 $ 2.5% Non-statutory E-waste E-Waste – non-compliant Taxable $ 2.00 per kg $ 2.00 per kg Non-statutory E-Waste - compliant Taxable $ 1.00 per kg $ 1.00 per kg Non-statutory Furniture Small Item – e.g. Chair (per unit) Taxable $ 10.20 $ 10.50 0.30 $ 2.9% Non-statutory Medium Item – e.g. bed, dressing table etc. (per unit) Taxable $ 36.70 $ 37.60 0.90 $ 2.4% Non-statutory Large Item – e.g. Couch, wardrobe etc. (per unit) Taxable $ 102.00 $ 104.60 2.60 $ 2.5% Non-statutory Oil Oil (per litre) Taxable $ 0.50 $ 0.50 Non-statutory Oil Drum disposal (per drum) Taxable $ 5.10 $ 5.20 0.10 $ 1.9% Non-statutory WOOD PERMITS Council controlled land – Full rate Taxable $ 30.90 $ 31.70 0.80 $ 2.5% Non-statutory Council controlled land – Pensioner rate Taxable $ 20.60 $ 21.10 0.50 $ 2.4% Non-statutory Page 69

HINDMARSH
2023/2024 - 2032/2033
SHIRE COUNCIL Long Term Financial Plan
Pictured: Rainbow resident enjoying a cuppa and complimentary morning tea at the Rainbow Library
CONTENTS 1. Legislative Requirements 73 1.1 Strategic Planning Principles 74 1.2 Financial Management Principles 74 1.3 Engagement Principles 75 1.4 Service Performance Principles 75 1.5 Asset Plan Integration 75 2. Financial Plan Contect and Challenges 2.1 Overview 76 2.2 Our Challenges 76 2.3 Strategic Actions 76 2.4 Assumptions to the financial plan staements 76-77 3. Financial Plan Statements 78 3.1 Comprehensive Income Statement 79 3.2 Balance Sheet 80 3.3 Statement of Changes in Equity 81-82 3.4 Statement of Cash Flows 83 3.5 Statement of Capital Works 84 3.6 Statement of Human Resources 85
1. Legislative Requirements
This section describes how the Financial Plan links to the achievement of the Community Vision and the Council Plan within the Integrated Strategic Planning & Reporting framework. This framework guides the Council in identifying community needs and aspirations over the long term (Community Vision), medium term (Council Plan) and short term (Annual Budget) and then holding itself accountable (Annual Report).
The following diagram provides an overview of the core legislated elements of an integrated strategic planning and reporting framework and outcomes.
Source: Department of Jobs, Precincts and Regions
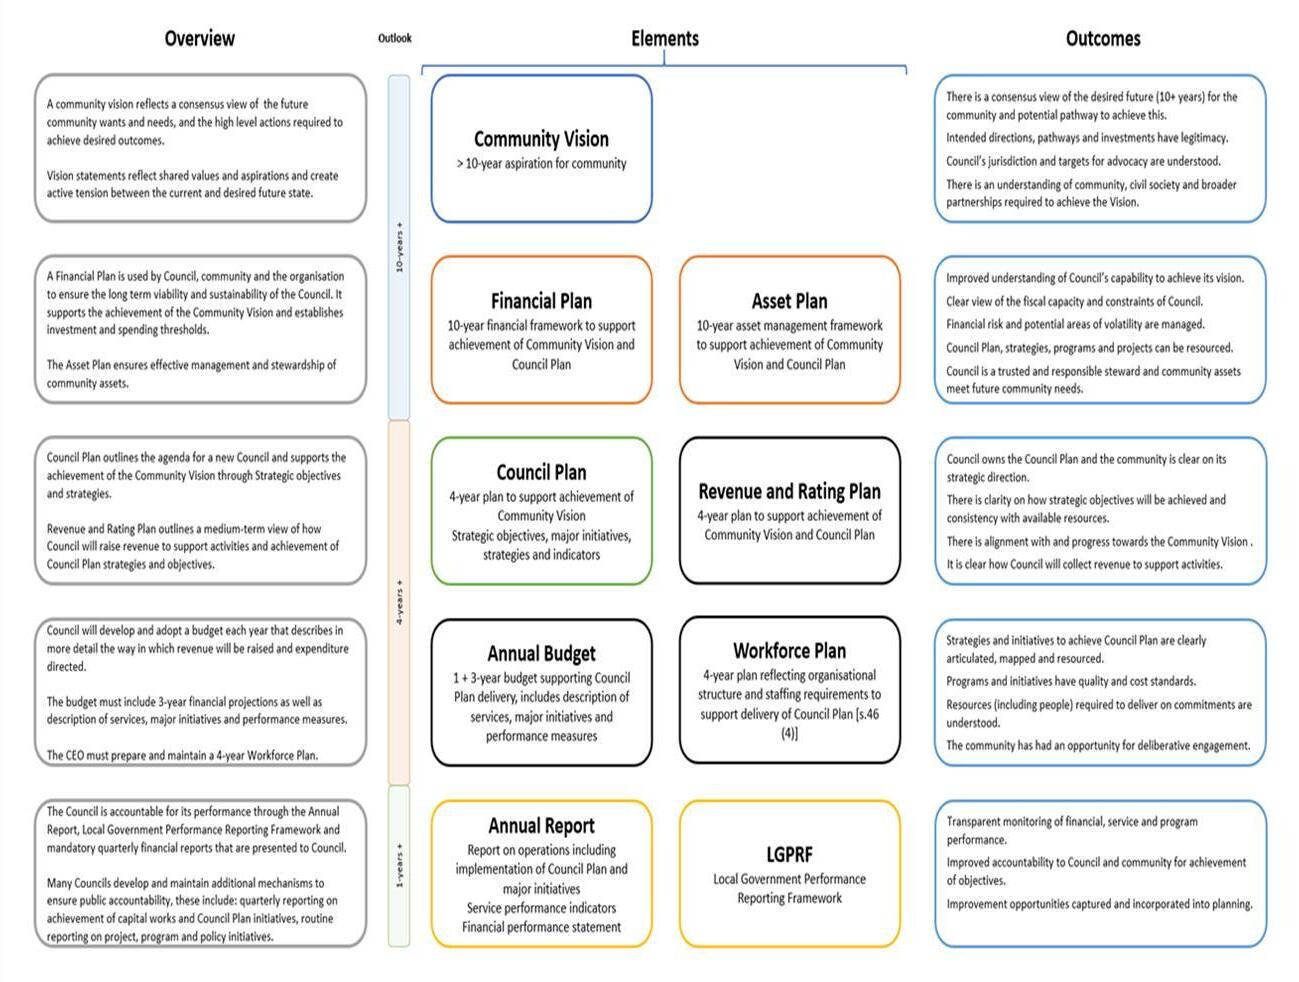
Page 72
The following figure demonstrates how each element might inform or be informed by other parts of the integrated framework.
1.1 Strategic Planning Principles
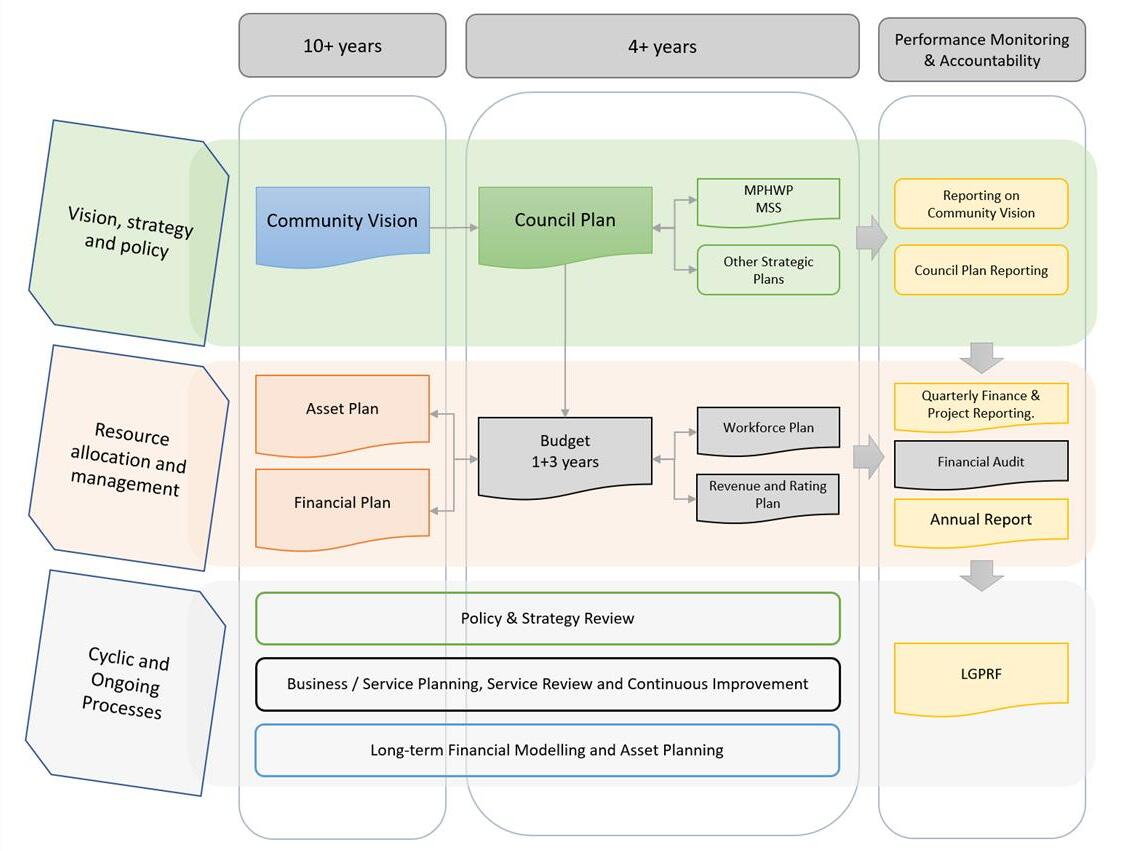
The Financial Plan provides a 10 year financially sustainable projection regarding how the actions of the Council Plan may be funded to achieve the Community Vision. The Financial Plan is developed in the context of the following strategic planning principles:
a) Council has an integrated approach to planning, monitoring and performance reporting.
b) Council’s financial plan addresses the Community Vision by funding the aspirations of the Council Plan. The Council Plan aspirations and actions are formulated in the context of the Community Vision.
c) The Financial Plan statements articulate the 10-year financial resources necessary to implement the goals and aspirations of the Council Plan to achieve the Community Vision based on the best available information at the time of preparation.
d) Council's strategic planning principles identify and address the risks to effective implementation of the Financial Plan. The financial risks are included at section 1.2.2 below.
1.2 Financial Management Principles
The Financial Plan demonstrates the following financial management principles:
1.2.1 Revenue, expenses, assets, liabilities, investments and financial transactions are managed in accordance with Council's financial policies and strategic plans.
1.2.2 Management of the following financial risks:
a) the financial viability of the Council, and
b) the management of current and future liabilities of the Council. The estimated 10 year-liabilities are disclosed in section 3.2 Balance Sheet projections.
1.2.3 Financial policies and strategic plans are designed to provide financial stability and predictability to the community.
1.2.4 Council maintains accounts and records that explain its financial operations and financial position (refer section 3 Financial Statements)
Page 73
1.3 Engagement Principles
Council developed and adopted a comprehensive community engagement framework. The following consultation process will be undertaken to ensure due consideration and feedback is received from relevant stakeholders.
a) Draft Financial Plan prepared by management in conjunction with Council;
b) Draft Financial Plan prepared in conjunction with the Annual Budget placed on public exhibition following 31 May 2023 Council meeting for the period 1 June to 21 June 2023 and calling for public submissions;
c) Community engagement is conducted using local news outlets and social media;
d) Hearing of public submissions to the Financial Plan at the 28 June 2023 Council meeting;
e) Draft Financial Plan, including any revisions, presented to 28 June 2023 Council meeting for adoption.
1.4 Service Performance Principles
Council services are designed to be for a purpose, targeted to community needs and value for money. The service performance principles are listed below:
a) Services are provided in an equitable manner and are responsive to the diverse needs of the community. The Council Plan is designed to identify the key services and projects to be delivered to the community. The Financial Plan provides the mechanism to demonstrate how the service aspirations within the Council Plan may be funded.
b) Services are accessible to the relevant users within the community.
c) Council provides quality services that provide value for money to the community. The Local Government Performance Reporting Framework (LGPRF) is designed to communicate council’s performance regarding the provision of quality and efficient services.
1.5 Asset Plan Integration
Integration to the Asset Plan is a key principle of the Council’s strategic financial planning principles. The purpose of this integration is to ensure that future funding is allocated in a manner that supports service delivery in terms of the plans and the effective management of Council’s assets into the future.
The Asset Plan identifies the operational and strategic practices which will ensure that Council manages assets across their life cycle in a financially sustainable manner. The Asset Plan, and associated asset management policies, provide council with a sound base to understand the risk associated with managing its assets for the community’s benefit.
The Asset Plan is designed to inform the Financial Plan by identifying the amount of capital renewal, backlog and maintenance funding that is required over the life of each asset category. The level of funding will incorporate knowledge of asset condition, the risk assessment issues as well as the impact of reviewing and setting intervention and service levels for each asset class.
In addition to identifying the operational and strategic practices that ensure that Council manages assets across their life cycle in a financially sustainable manner, the Asset Plan quantifies the asset portfolio and the financial implications of those practices. Together the Financial Plan and Asset Plan seek to balance projected investment requirements against projected budgets.
Council updated its Asset Plan in accordance with the legislative requirements of the Local Government Act 2020 and the plan was presented to Council on 1 June 2022.
This section describes the context and external/internal environment and consideration in determining the 10-year financial projections and assumptions.
Page 74
2.1 Overview
Hindmarsh Shire Council is located halfway between Melbourne and Adelaide and comprises 7,500 square kilometres and a population of approximately 5,588. The Western Highway, the main thoroughfare between Melbourne and Adelaide, runs through the Shire.
Hindmarsh Shire has four main townships (Dimboola, Jeparit, Nhill and Rainbow) and is largely dependent on agriculture, health services, manufacturing and retail. Our towns have excellent sporting facilities, schools and hospitals, and our natural and heritage attractions draw thousands of visitors each year.
2.2 Our Challenges
Hindmarsh Shire Council continues to face the following challenges that impact the financial environment in which we operate:
a) The Victorian State Government introduced a cap on rates from 2016/2017. The cap for 2023/2024 has been set at 3.5%.
b) Local Government provides services to the community on behalf of the State and Federal Government. Over time the funds Council receives to deliver these services do not increase in line with real cost increases resulting in significant cost shifting onto Council.
c) Hindmarsh Shire Council has a small rate base and is heavily reliant on external grant funding to deliver services and capital works projects throughout the Shire.
d) Council faces challenges associated with the provision and renewal of the significant road network, paths and community and recreation facilities.
e) Isolation and large distances increase transport costs when compared to most other shires. This is not just an issue for residents but also for the cost of Council’s works as transport costs make up a large portion of the Council Budget.
2.3 Strategic Actions
Council has identified the following strategic actions that will support the aspirations of the Council Plan.
· Maintain service levels to the community to support our vision of well-maintained roads, building and other assets that service our community needs.
Prioritise renewal of existing assets and advocate for increased funding to support the maintenance and upgrades of Council’s extensive road network and infrastructure.
Develop and promote local tourism opportunities that will attract visitation.
Advocate for increases to recurrent grants to enable Council to maintain services and undertake asset renewal.
Maintain minimum cash reserve of $2.1m to ensure Council can meet its financial obligations at any time. This is only possible if nonrecurrent capital grants are received or there is a reduction in capital works expenditure. Where additional grants are received, capital works renewal will be prioritised.
2.4 Assumptions to the financial plan statements
This section presents the assumptions to the Comprehensive Income Statement for the 10 years from 2023/24 to 2032/33. The assumptions are based on the best available information at the time of preparation and will be updated each year as necessary.
Page 75
2.4a Economic Assumptions
Assumption
Notes to Assumptions
1. Rate Cap
Council increases Rates each year in line with the rate cap set by the Minister as outlined in the Revenue and Rating Plan
2. Population Growth
Population growth in Hindmarsh remains unchanged
3. Investment Interest Rate
Interest rates are based on available cash.
4. CPI
Based on the rates published in December for the year for Melbourne.
5. User Fees
Council increases the user fees in line with the rate cap set each year by the Minister as outlined in the Revenue and Rating Plan.
6. Grants - Recurrent
Grants - recurrent is due to decline in 2023/2024 as Council will no longer be providing Aged Care Services.
7. Employee Costs
Council increases employee costs in line with the current published Enterprise Agreement with allowance for movement with the bands.
Actual Forecast Budget Trend 2021/22 2022/23 2023/24 2024/25 2025/26 2026/27 +/o/Rate Cap Increase 1 1.50% 1.75% 3.50% 3% 3% 3% Population Growth 2 0% 0% 0% 0% 0% 0% Investment Interest Rate 3 % % 3% 3% 3% 3% CPI 4 1.5% 3.9% 3.5% 3% 3% 3% User Fees 5 8% 19% -3% 3% 3% 3% Grants - Recurrent 6 18% -30% 240% -2% 3% 3% Grants - Non-Recurrent -55% 66% -38% -44% 0% 0% Contributions -405% -478% -150% 3% 3% 3% Proceeds from sale of assets $557 $332 $480 $300 $300 $300 Other Revenue -538% 154% 3% 3% 3% 3% Employee Costs 7 -2% 6% -1% 2.75% 2.75% 2.75% Contactors, consultants and materials -18% -7% 3% 3% 3% 3% Utilities -18% -7% 3% 3% 3% 3% Depreciation $4,524 $ 5,460 $ 4,839 $ 5,080 $ 5,330 $ 5,330 Other expenses % % % 3% 3% 3%
Notes Projections
Page 76
3. Financial Statements
This section presents information in regard to the Budget for the 4 years from 2023/24 to 2026/27 and Financial Plan Statements for the 10 years from 2023/24 to 2032/33.
This section includes the following financial statements prepared in accordance with the Local Government Act 2020 and the Local Government (Planning and Reporting) Regulations 2020
Comprehensive Income Statement
Balance Sheet
Statement of Changes in Equity
Statement of Cash Flows
Statement of Capital Works
Statement of Human Resources
Page 77
3.1 Comprehensive Income Statement
2022/23 2023/24 2024/25 2025/26 2026/27 2027/28 2028/29 2029/30 2030/31 2031/32 2032/33 $’000 $’000 $’000 $’000 $’000 $’000 $’000 $’000 $’000 $’000 $’000 Income Revenue 9,434 9804 10098 10401 10713 11,035 11,366 11,707 12,058 12,420 12,792 Statutory fees and fines 197 203 209 216 222 229 236 243 250 257 265 User fees 1,652 1606 1654 1704 1755 1,808 1,862 1,918 1,975 2,034 2,095 Grants - Operating 2,316 5502 5430 5593 5761 5,934 6,112 6,295 6,484 6,678 6,879 Grants - Capital 6,565 4770 2081 2081 2081 2,581 2,581 2,281 2,281 2,281 2,281 Contributions - monetary 18 12 12 13 13 14 14 14 15 15 16 Net gain/(loss) on disposal of property, infrastructure, plant and equipment 332 480 300 300 300 300 300 300 300 300 300 Share of net profits/(losses) of associates and joint ventures 17 0 0 0 0 - - - - -Other income 435 443 430 443 456 470 484 498 513 529 545 Total income / revenue 20,964 22,820 20,215 20,750 21,301 22,369 22,954 23,256 23,876 24,515 25,173 Expenses Employee costs 8,250 8,062 7,747 7,961 8,179 8,404 8,635 8,873 9,117 9,368 9,625 Materials and services 6,271 5,860 6,065 6,277 6,747 6,949 7,157 7,372 7,593 7,821 8,056 Depreciation 5,460 4,839 5,080 5,330 5,330 5,490 5,655 5,824 5,999 6,179 6,364 Other expenses 1,537 1,548 1,602 1,658 1,716 1,767 1,820 1,875 1,931 1,989 2,049 Total expenses 21,518 20,308 20,494 21,225 21,972 22,610 23,268 23,944 24,640 25,357 26,094 Surplus/(deficit) for the year (553) 2,512 (278) (475) (670) (241) (314) (688) (764) (842) (921) Total comprehensive result (553) 2,512 (278) (475) (670) (241) (314) (688) (764) (842) (921) Rates and charges Forecast / Actual Page 78
3.2 Balance Sheet
2022/23 2023/24 2024/25 2025/26 2026/27 2027/28 2028/29 2029/30 2030/31 2031/32 2032/33 $’000 $’000 $’000 $’000 $’000 $’000 $’000 $’000 $’000 $’000 $’000 Assets Current assets Cash and cash equivalents 2,070 2018 1949 2191 1673 1,950 2,219 2,180 2,133 2,078 2,017 Trade and other receivables 1,825 1600 1920 2208 2506 2,619 2,737 2,860 2,986 3,117 3,255 Inventories 505 507 523 522 522 538 554 571 588 605 624 Other assets 54 23 24 25 25 26 27 28 29 29 30 Total current assets 4,454 4,149 4,415 4,946 4,727 5,133 5,537 5,638 5,735 5,830 5,926 Non-current assets Investments in Wimmera Development Association 295 295 295 295 295 295 295 295 295 295 295 Property, infrastructure, plant & equipment 213,513 216,129 215,579 214,537 214,061 213,523 212,920 212,251 211,514 210,706 209,826 Total non-current assets 213,808 216,424 215,874 214,832 214,356 213,818 213,215 212,546 211,809 211,001 210,121 Total assets 218,262 220,573 220,289 219,778 219,083 218,951 218,751 218,184 217,543 216,832 216,047 Liabilities Current liabilities Trade and other payables 2,153 1,903 1,823 1,709 1,604 1,644 1,684 1,726 1,770 1,818 1,868 Trust funds and deposits 102 81 81 81 81 81 81 81 81 81 81 Provisions 2,215 2,264 2,332 2,402 2,474 2,536 2,602 2,672 2,744 2,818 2,894 Total current liabilities 4,470 4,249 4,236 4,192 4,159 4,261 4,368 4,479 4,595 4,716 4,843 Non-current liabilities Provisions 218 238 246 253 261 268 276 285 293 302 311 Total non-current liabilities 218 238 246 253 261 268 276 285 293 302 311 Total liabilities 4,688 4,487 4,482 4,445 4,419 4,529 4,644 4,764 4,888 5,018 5,154 Net assets 213,574 216,086 215,808 215,333 214,663 214,421 214,107 213,420 212,655 211,813 210,893 Equity Accumulated surplus 79,329 81,842 81,563 81,089 80,418 80,177 79,863 79,175 78,411 77,569 76,648 Reserves 134,244 134,244 134,244 134,244 134,244 134,244 134,244 134,244 134,244 134,244 134,244 Total equity 213,574 216,086 215,808 215,333 214,663 214,422 214,108 213,419 212,655 211,814 210,893 Forecast / Actual Page 79
3.3 Statement of Changes in Equity
Total Accumulated Surplus Revaluation Reserve $’000 $’000 $’000 2023 Forecast Actual Balance at beginning of the financial year 214,127 79,882 134,245 Surplus/(deficit) for the year (553) (553)Balance at end of the financial year 213,574 79,329 134,245 2024 Balance at beginning of the financial year 213,574 79,329 134,245 Surplus/(deficit) for the year 2,512 2,512Balance at end of the financial year 216,086 81,841 134,245 2025 Balance at beginning of the financial year 216,086 81,841 134,245 Surplus/(deficit) for the year (278) (278)215,808 81,563 134,245 2026 Balance at beginning of the financial year 215,808 81,563 134,245 Surplus/(deficit) for the year (475) (475)215,333 81,088 134,245 2027 Balance at beginning of the financial year 215,333 81,088 134,245 Surplus/(deficit) for the year (670) (670)214,663 80,418 134,245 Balance at end of the financial year
Balance at end of the financial year Balance at end of the financial year Page 80
Total Accumulated Surplus Revaluation Reserve $’000 $’000 $’000 2028 Balance at beginning of the financial year 214,663 80,418 134,245 Surplus/(deficit) for the year (241) (241)214,422 80,177 134,245 2029 Balance at beginning of the financial year 214,422 80,177 134,245 Surplus/(deficit) for the year (314) (314)214,108 79,863 134,245 2030 Balance at beginning of the financial year 214,108 79,863 134,245 Surplus/(deficit) for the year (688) (688)213,419 79,174 134,245 2031 Balance at beginning of the financial year 213,419 79,174 134,245 Surplus/(deficit) for the year - (764)212,655 78,410 134,245 2032 Balance at beginning of the financial year 212,655 78,410 134,245 Surplus/(deficit) for the year (841) (841)211,814 77,569 134,245 2033 Balance at beginning of the financial year 211,814 77,569 134,245 Surplus/(deficit) for the year (921) (921)210,893 76,648 134,245 Balance at end of the financial year Balance at end of the financial year Balance at end of the financial year Balance at end of the financial year Balance at end of the financial year Balance at end of the financial year Page 81
3.4 Statement of Cash Flows
2022/23 2023/24 2024/25 2025/26 2026/27 2027/28 2028/29 2029/30 2030/31 2031/32 2032/33 $’000 $’000 $’000 $’000 $’000 $’000 $’000 $’000 $’000 $’000 $’000 Inflows Inflows Inflows Inflows Inflows Inflows Inflows Inflows Inflows Inflows Inflows (Outflows) (Outflows) (Outflows) (Outflows) (Outflows) (Outflows) (Outflows) (Outflows) (Outflows) (Outflows) (Outflows) Rates and charges 9,414 9,784 10,098 10,401 10,713 11,035 11,366 11,707 12,058 12,420 12,792 Statutory fees and fines 33 27 209 216 222 229 236 243 250 257 265 User fees 1,926 2,047 1,654 1,704 1,755 1,808 1,862 1,918 1,975 2,034 2,095 Grants - operating 2,316 5,552 5,430 5,593 5,761 5,934 6,112 6,295 6,484 6,678 6,879 Grants - capital 6,115 4,770 2,081 2,081 2,081 2,581 2,581 2,281 2,281 2,281 2,281 Contributions - monetary 18 12 12 12 12 14 14 14 15 15 16 Interest received 210 240 252 252 252 300 300 300 300 300 300 Other receipts 1,045 203 178 191 204 170 184 198 213 229 245 Employee costs (8,204) (8,016) (7,747) (7,961) (8,179) (8,404) (8,635) (8,873) (9,117) (9,368) (9,625) Materials and services (7,185) (6,129) (6,386) (6,581) (7,050) (6,949) (7,157) (7,372) (7,593) (7,821) (8,056) Trust funds and deposits repaid - (20) (20) (20) (20) (20) (20) (20) (20) (20) (20) Other payments (1,537) (1,548) (1,602) (1,658) (1,716) (1,767) (1,820) (1,875) (1,931) (1,989) (2,049) Net cash provided by/(used in) operating activities 4,152 6,923 4,160 4,231 4,036 4,929 5,021 4,816 4,915 5,017 5,123 (17,394) (7,455) (4,530) (4,288) (4,854) (4,951) (5,052) (5,155) (5,262) (5,371) (5,484) 332 480 300 300 300 300 300 300 300 300 300 Net cash provided by/ (used in) investing activities (17,062) (6,975) (4,230) (3,988) (4,554) (4,651) (4,752) (4,855) (4,962) (5,071) (5,184) Net increase/(decrease) in cash & cash equivalents (12,910) (52) (70) 243 (518) 277 269 (39) (47) (54) (61) 14,980 2,070 2,018 1,949 2,191 1,673 1,950 2,219 2,180 2,133 2,078 2,070 2,018 1,949 2,191 1,673 1,950 2,219 2,180 2,133 2,078 2,017 Cash flows from financing activities Cash and cash equivalents at the beginning of the financial year Cash and cash equivalents at the end of the financial year Cash flows from operating activities Cash flows from investing activities Payments for property, infrastructure, plant and equipment Proceeds from sale of property, infrastructure, plant and equipment Forecast / Actual Page 82
3.5 Statement of Capital Works
2022/23 2023/24 2024/25 2025/26 2026/27 2027/28 2028/29 2029/30 2030/31 2031/32 2032/33 $’000 $’000 $’000 $’000 $’000 $’000 $’000 $’000 $’000 $’000 $’000 Property Land - - - - - - - - - -Total land - - - - - - - - - -Buildings 4,594 1,180 250 250 250 250 250 250 250 250 250 Total buildings 4,594 1,180 250 250 250 250 250 250 250 250 250 Total property 4,594 1,180 250 250 250 250 250 250 250 250 250 Plant and equipment 2,113 1,291 1,250 1,250 1,250 1,250 1,250 1,250 1,250 1,250 1,250 Fixtures, fittings and furniture 5 5 5 5 5 5 5 5 5 5 5 Computers and telecommunications 105 85 60 60 60 60 60 60 60 60 60 Library books 56 50 40 40 40 40 40 40 40 40 40 Total plant and equipment 2,278 1,431 1,355 1,355 1,355 1,355 1,355 1,355 1,355 1,355 1,355 Infrastructure Roads 3,897 3,822 2,350 2,280 2,150 2,215 2,281 2,349 2,420 2,492 2,567 Bridges 424 - 10 10 330 340 350 361 371 383 394 Footpaths and cycleways 1,285 130 140 185 383 394 406 419 431 444 457 Drainage 271 35 - - 246 253 261 269 277 285 294 Recreational, leisure and community facilities - - 175 38 40 41 42 44 45 46 48 Kerb & Channel 378 100 250 170 100 103 106 109 113 116 119 Other infrastructure 4,267 757 - - - - - - - -Total infrastructure 10,522 4,844 2,925 2,683 3,249 3,346 3,447 3,550 3,657 3,766 3,879 Total capital works expenditure 17,394 7,455 4,530 4,288 4,854 4,951 5,052 5,155 5,262 5,371 5,484 Represented by: New asset expenditure 5,432 357 - - - - - - - -Asset renewal expenditure 7,323 5,934 4,495 4,288 4,854 4,951 5,052 5,155 5,262 5,371 5,484 Asset expansion expenditure - 180 - - - - - - - -Asset upgrade expenditure 4,638 984 35 - - - - - - -Total capital works expenditure 17,394 7,455 4,530 4,288 4,854 4,951 5,052 5,155 5,262 5,371 5,484 Grants 11,328 4,770 2,081 2,081 2,081 2,581 2,581 2,281 2,281 2,281 2,281 Contributions - - - - - - - - - -Council cash 6,066 2,685 2,449 2,207 2,773 2,370 2,471 2,874 2,981 3,090 3,203 Total capital works expenditure 17,394 7,455 4,530 4,288 4,854 4,951 5,052 5,155 5,262 5,371 5,484 Plant, machinery and equipment Funding sources represented by: Forecast / Actual Page 83
3.6 Statement of Human Resources
A summary of human resources expenditure categorised according to the organisational structure of Council is included below:
A summary of the number of full time equivalent (FTE) Council staff in relation to the above expenditure is included below:
Staff expenditure 2022/23 2023/24 2024/25 2025/26 2026/27 2027/28 2028/29 2029/30 2030/31 2031/32 2032/33 $’000 $’000 $’000 $’000 $’000 $’000 $’000 $’000 $’000 $’000 $’000 Staff expenditure Employee costs - operating 7,211 8,062 7,744 7,961 8,179 8,404 8,635 8,872 9,116 9,367 9,625 Employee costs - capital 1,039 894 918 944 970 996 1,024 1,052 1,081 1,111 1,141 Total staff expenditure 8,250 8,956 8,662 8,905 9,149 9,400 9,659 9,924 10,197 10,478 10,766 Staff numbers 2022/23 2023/24 2024/25 2025/26 2026/27 2027/28 2028/29 2029/30 2030/31 2031/32 2032/33 FTE FTE FTE FTE FTE FTE FTE FTE FTE FTE FTE Staff numbers Employees 98.6 96.08 91.8 91.8 91.8 91.8 91.8 91.8 91.8 91.8 91.8 Total staff numbers 98.6 96.1 91.8 91.8 91.8 91.8 91.8 91.8 91.8 91.8 91.8 Budget 2023/24 Full Time Part Time Casual Temporary $'000 $'000 $'000 $'000 $'000 Civic Governance 768 768 - -Corporate and Community Services 2,643 1,658 911 75Infrastructure 4,650 4,155 356 139Total permanent staff expenditure 8,062 6,581 1,267 214Other employee related expenditure Capitalised labour costs 894 Total staff expenditure 8,956 Budget 2023/24 Full Time Part Time Casual Temporary Civic Governance 4 4 - -Corporate and Community Services 28 17 9 2Infrastructure 65 57 5 3Total staff 96 78 13 5Department Comprises Permanent
Department Comprises Permanent
Page 84

Main Office: 92 Nelson Street NHILL VIC 3418 Postal Address: PO Box 250 NHILL VIC 3418 Phone: 03 5391 4444 Email: info@hindmarsh.vic.gov.au Website: www.hindmarsh.vic.gov.au Facebook: www.facebook.com/hindmarshshirecouncil

 Pictured: Jeparit residents enjoying a cuppa and complimentary morning tea at the Jeparit Library