Heron Instruments Software Manual
Written for Software Version 8.1.39.0
Revision 1 (2025-08-11)
Contact Details
Heron Instruments Inc.
447 Moxley Rd. Dundas, Ontario, L9H 5E2, Canada
Phone: 1-800-331 2032
Email: info@heroninstruments.com
Web: heroninstruments.com
Introduction
This manual covers the basic operation and use of the Heron Instruments software used to interface with Heron’s manufactured products and services. This manual may not be fully comprehensive of all features and capabilities. Heron Instruments is constantly working to improve its products and therefore, feature sets and capabilities may change without notice. Features and capabilities may differ depending on region/language/settings/etc. Methods/systems/materials used or suggested may not comply with all regional regulations. It is the customer’s responsibility to use the software and the manual within the limits of their regional rules and regulations.
Language Support
The Heron Instruments software is developed in English and translations are applied afterwards. The accuracy of translations cannot be guaranteed – if in doubt, the English version should be consulted for clarification. Further clarification can be obtained by contacting Heron Instruments directly. Languages currently available are:
• English
• French
• Spanish
• Portuguese
• Japanese
• Hindi
• Chinese
• Bengali
• Russian
• Indonesian
If you require a language that is not listed, please contact Heron Instruments to request its addition.
Data Protection
Data downloaded to the Heron Instruments software is stored in a local database. This database is managed by your operating system. If the software is uninstalled or removed, the database may also be deleted by your operating system. It is strongly recommended to back up your computer regularly to protect your data. Backing up your database to protect against unforeseen incidents is also recommended. Heron Instruments is not responsible for the loss of any data that may occur due to a function or bug in the software. It is the responsibility of the user to manage their data and protect it in a way that is commensurate.
Compatibility
The Heron Instruments software is tested on a wide variety of computer configurations; however, compatibility is not guaranteed. To ensure the best compatibility, it is recommended to run the latest version of Windows. This software is designed to run on Windows 10 Windows 11 (x86, x64, and ARM compatible) and modern Apple Computers A USB type A port with USB 2.0 or 3.0 protocols is required The software will run on as little as 2GB of RAM and 32GB of storage. For the best experience a minimum of 8GB of RAM and 256GB of storage is recommended.
Installation and Updates
The software is available from the Microsoft Store or the Apple App Store. Updates are handled by Microsoft or Apple and should be performed automatically depending on your settings.
Installing on Windows
From the overview page on the Microsoft Store, select Install If you are signed into a Microsoft account, your installation will happen automatically. If you are not signed into a Microsoft account, you will be presented with an option to sign in or an option to skip. If you select skip, the software will still be installed automatically. A Microsoft account is not required to install the software
Once installation is complete, the software will be available on your Windows Start menu.
What You Need to Get Started
If you are connecting to a logger directly you will need the following items:
• A Windows 10, Windows 11 or modern Apple computer with the Heron Instruments software installed.
• A compatible dipper-Log data logger.
• A compatible PC-communication cable.
Starting a New Mission
Connecting to the Software
Connect your logger to the computer using the PC-communication cable. Open the software.
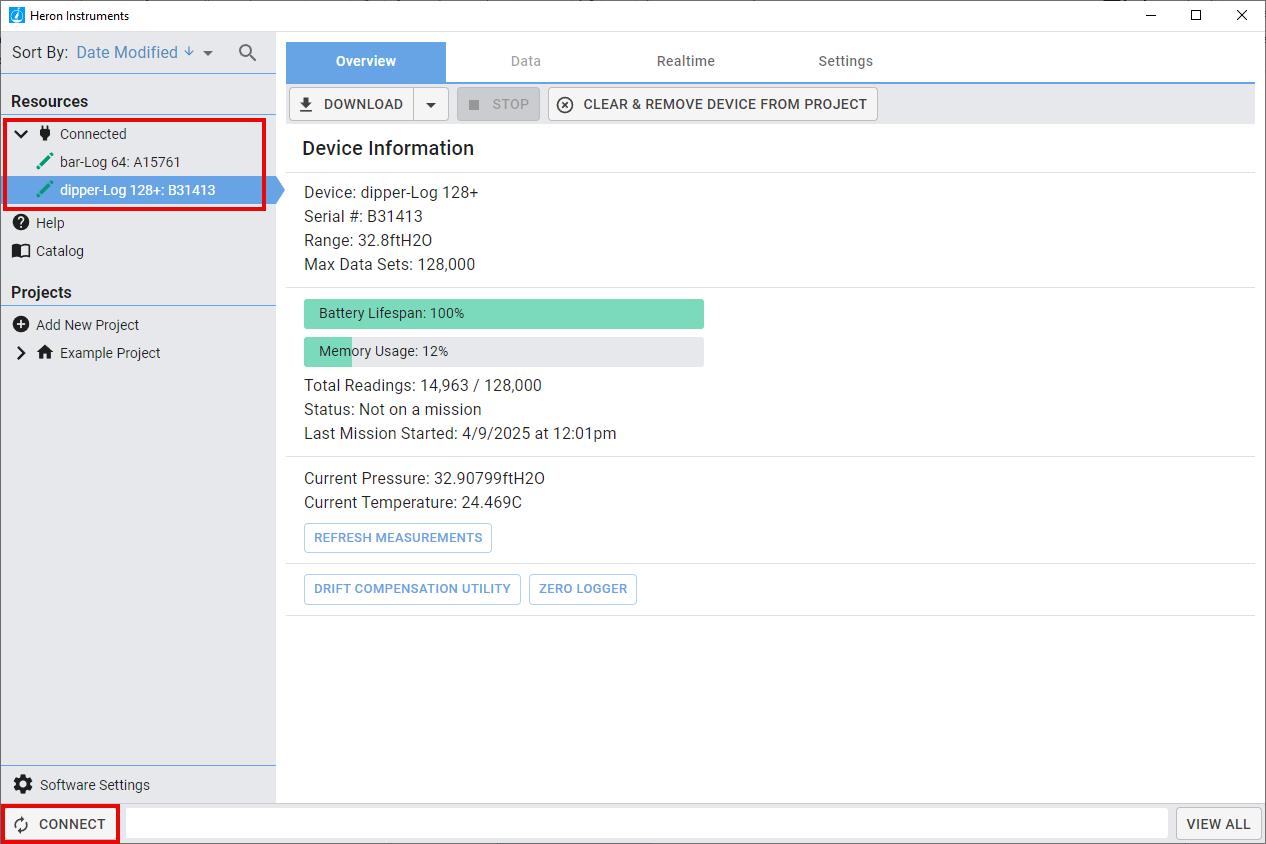
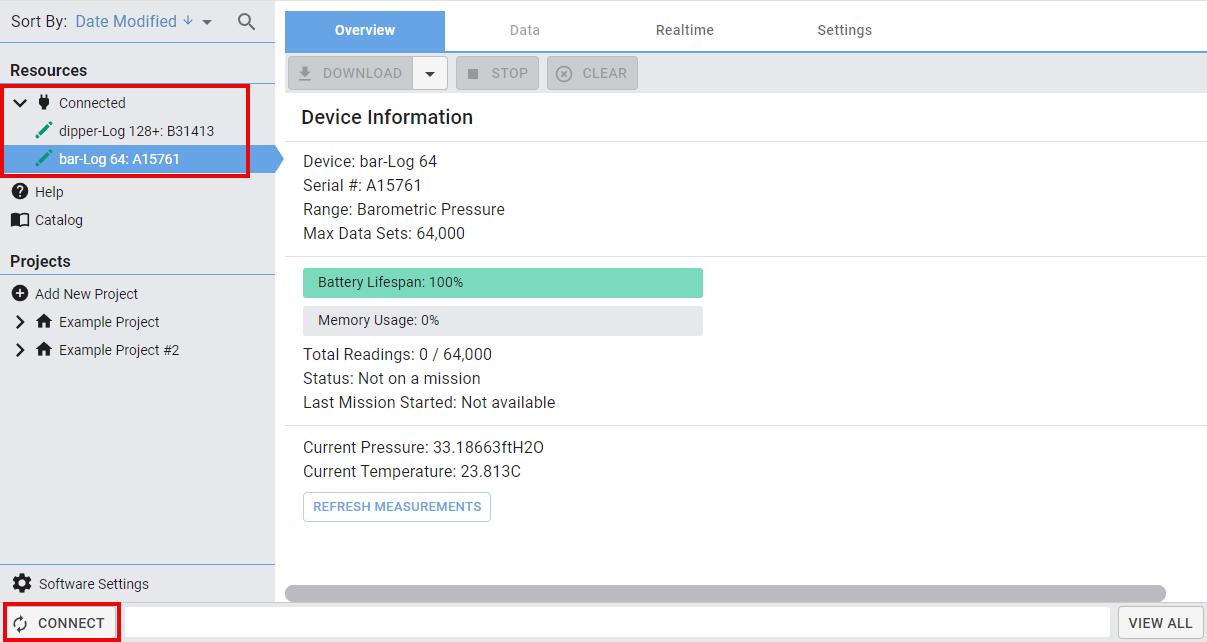
When the software opens it will display all connected loggers on the top left-hand side under the Connected dropdown menu of the Resources section. If your device is not showing up, click the CONNECT button in the bottom left-hand corner. This will scan all ports for any Heron Instruments devices.
Settings Tab
If multiple loggers are connected, select your device. The Overview tab will be displayed on default giving an overview of your device and its current state.
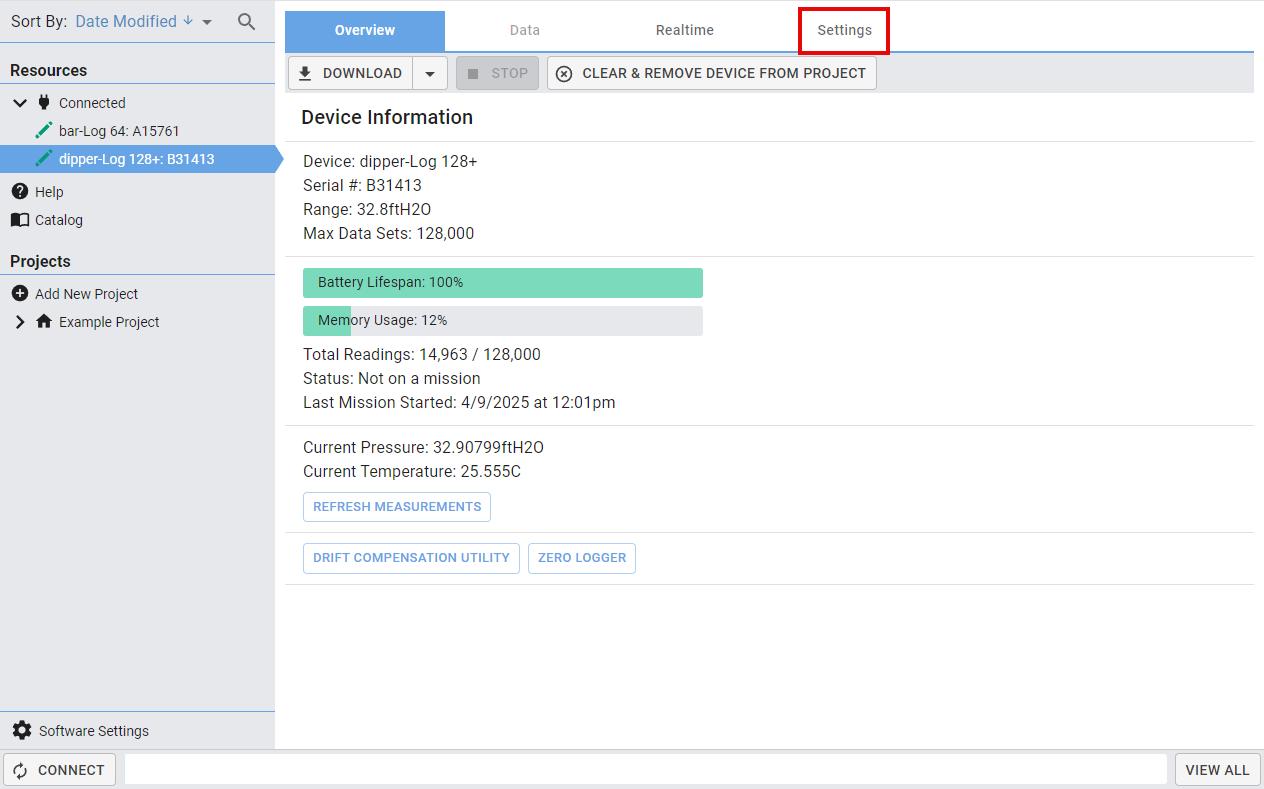
To set up your logger, click on the Settings tab. This tab allows you to enter your mission details.
Note: Available settings are dependent on the logger type.
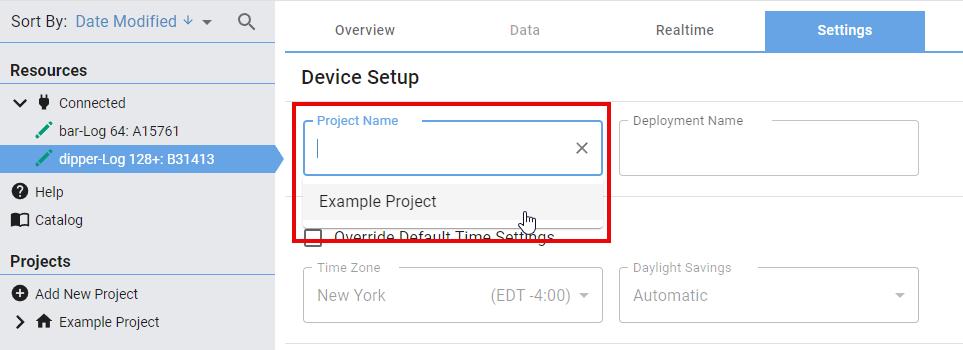
Naming a Project
Enter a Project Name and Deployment Name. These will be used to organize your data in the data management panel under Projects If you are adding a device to an existing project, the project name and deployment name will be selectable as a dropdown option within the data field.

Time Settings
The Time Settings default to your current location. To manually adjust the settings, click the Override Default Time Settings box. Then select your desired time zone and daylight savings settings.
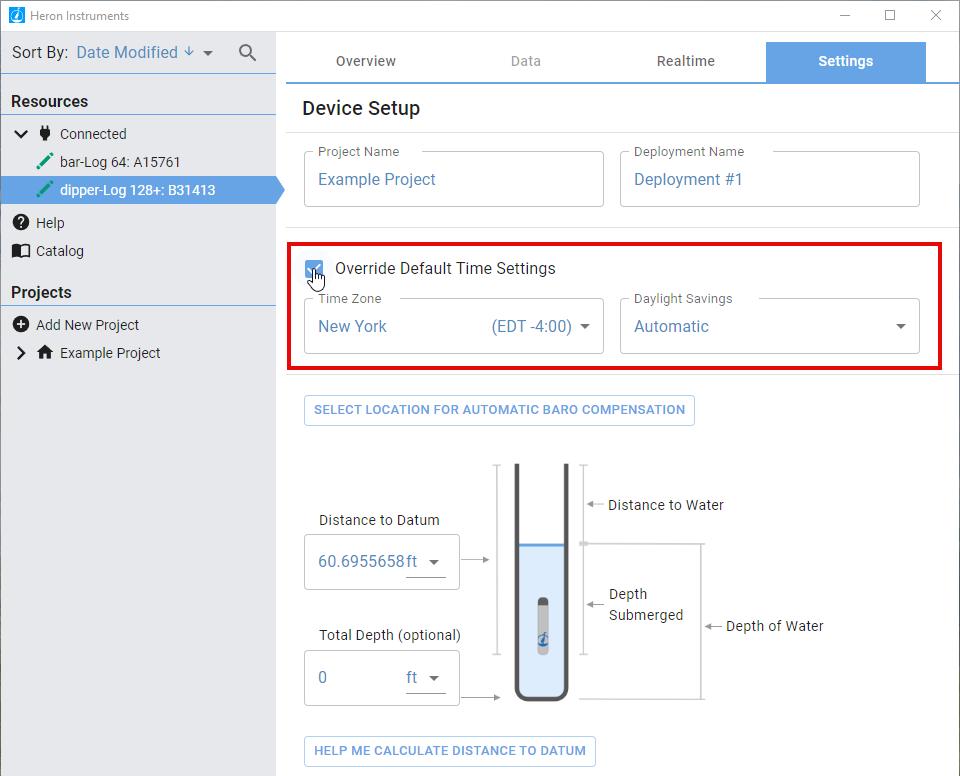
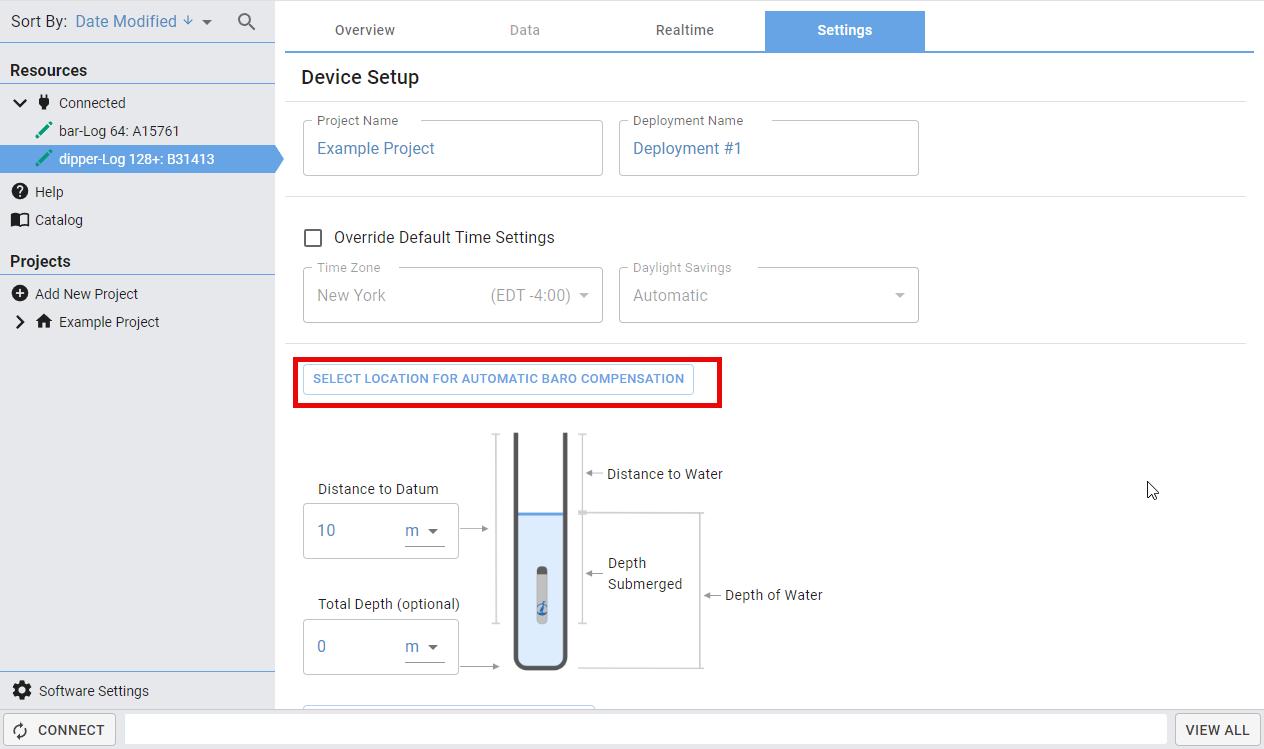
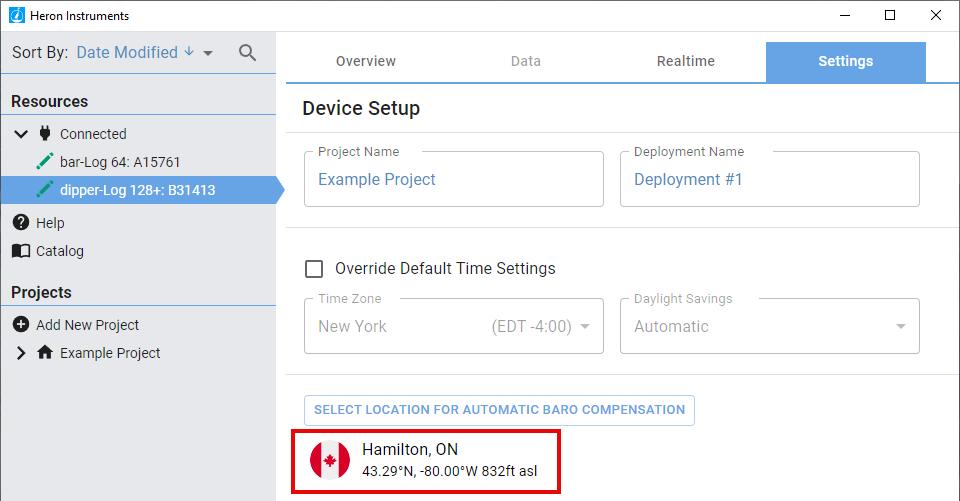
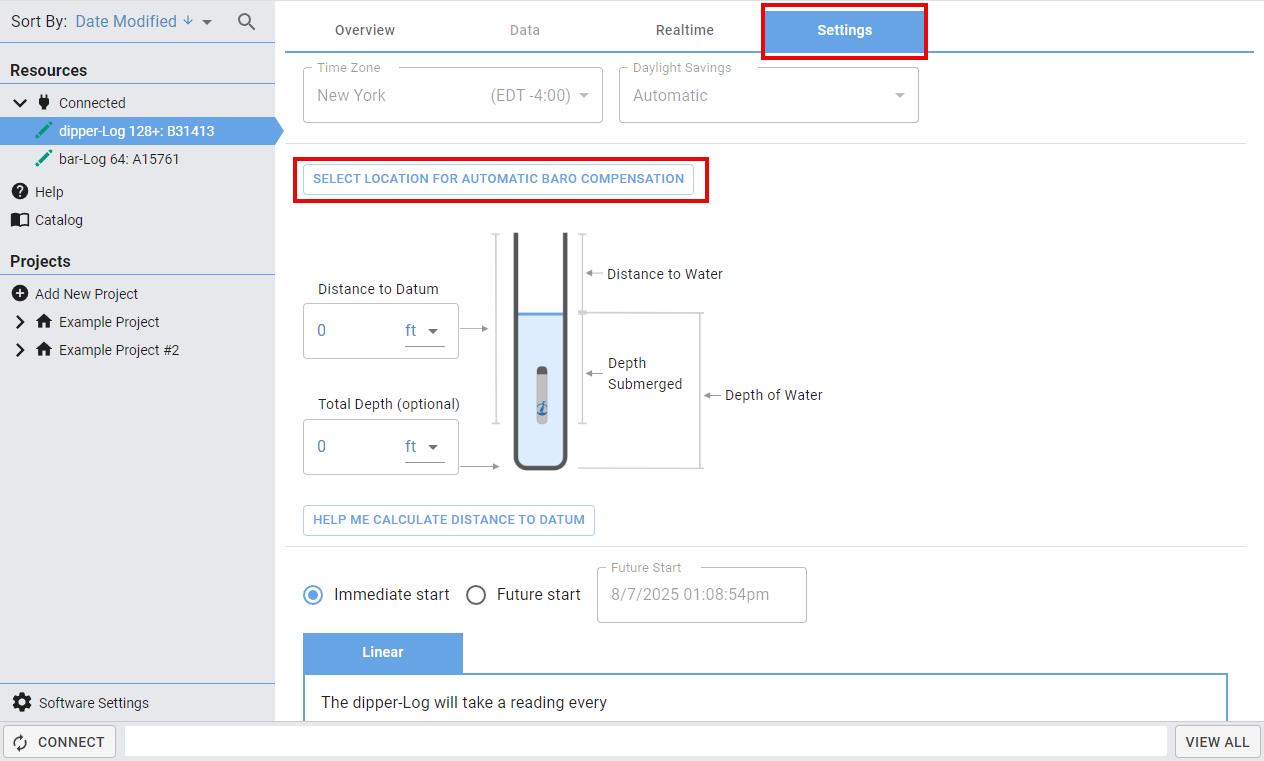
Selecting a Location for Automatic Baro Compensation
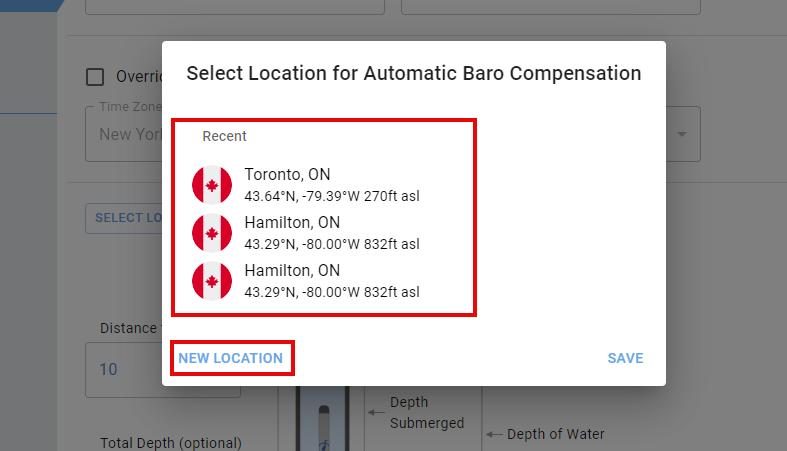
If you would like to use the automatic barometric compensation feature on your data (for more information see the Auto-Baro chapter), click on the SELECT LOCATION FOR AUTOMATIC BARO COMPENSATION button. Select one of your recent locations or click on NEW LOCATION.
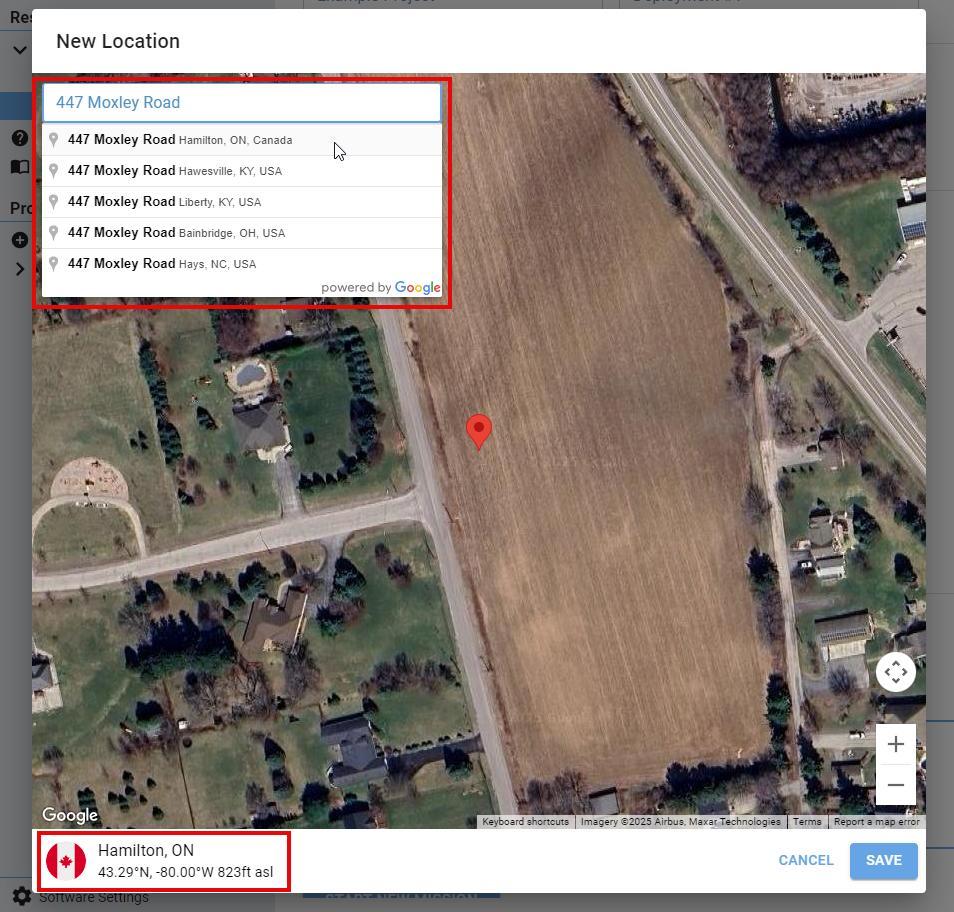
If selecting a new location, start typing the address of your deployment location and select an option from the dropdown menu. The coordinates will populate in the lower right-hand corner, then click SAVE. Select your recently added location and click SAVE. Your deployment location will now be displayed on the Settings tab.
Note: An active internet connection is required for this feature.
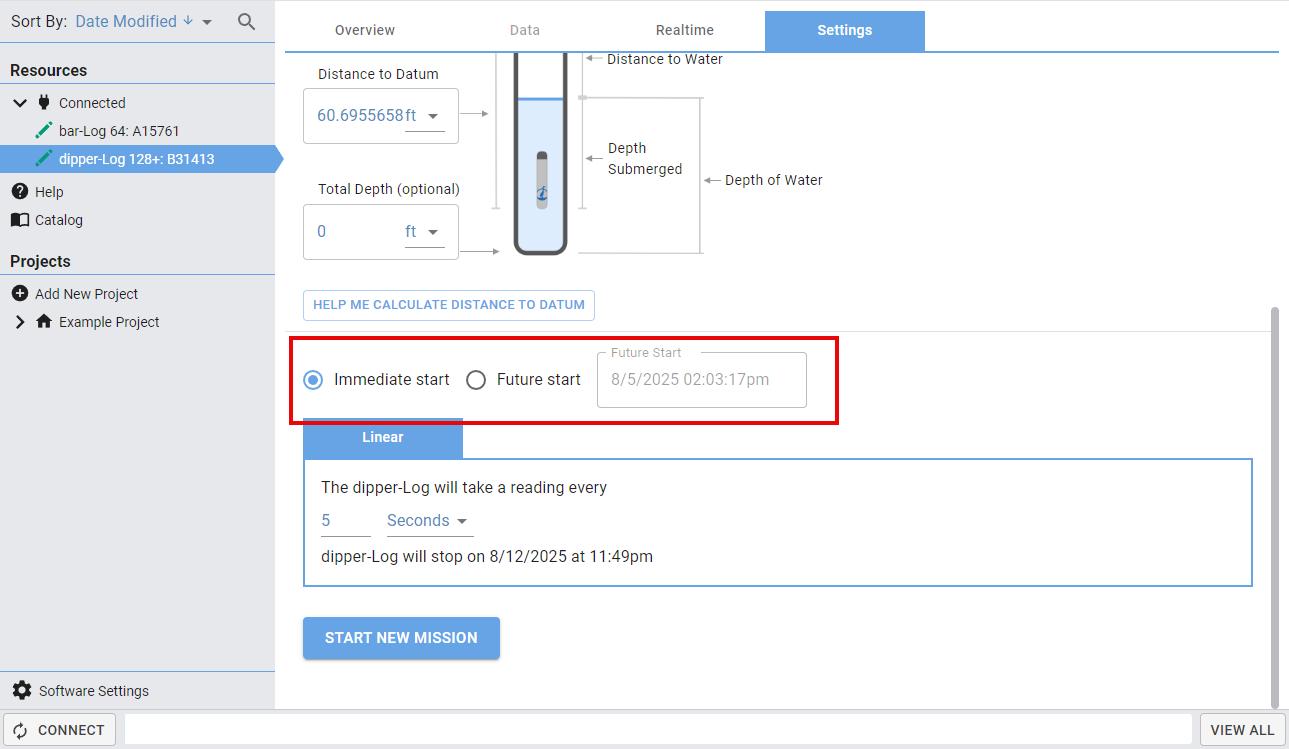
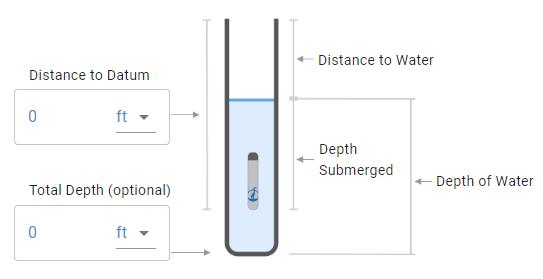
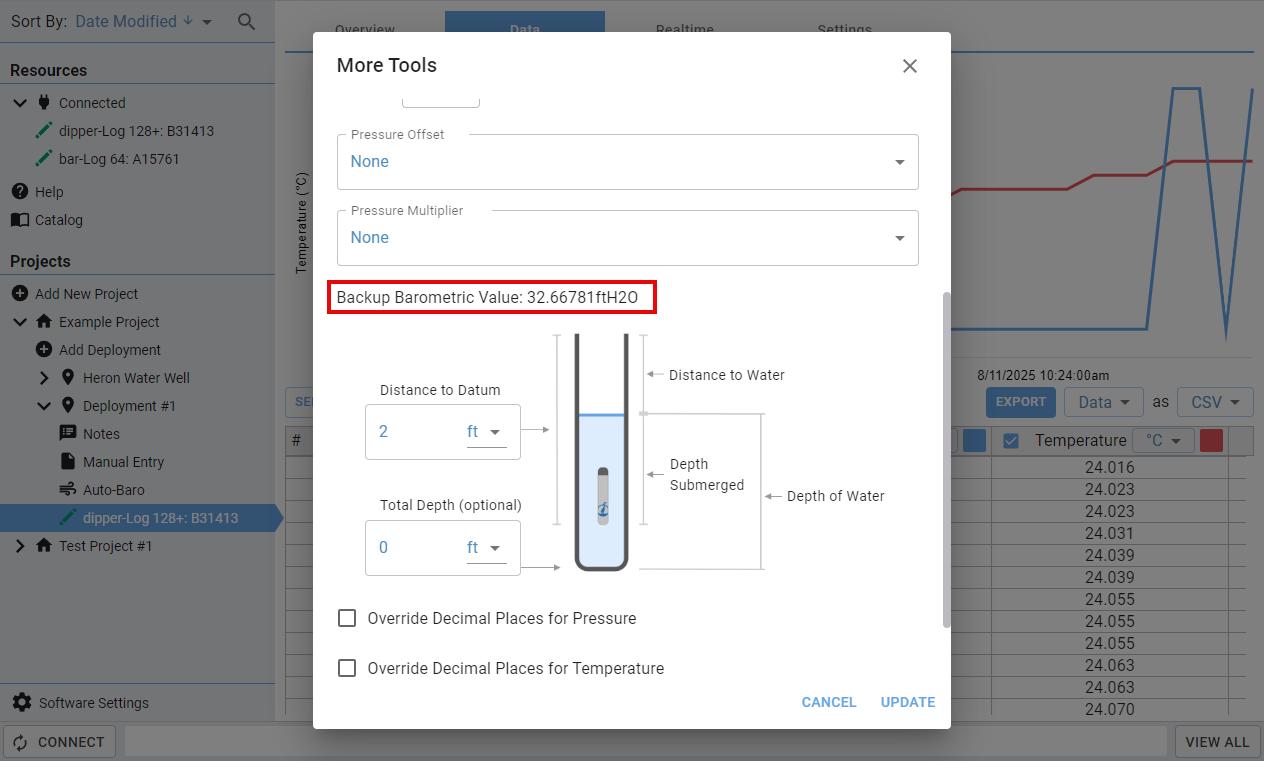
Distance to Datum
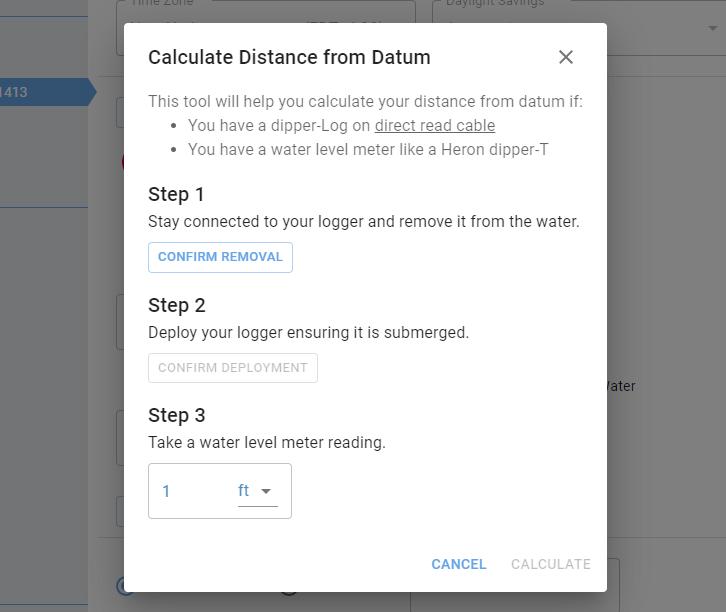
The Distance to Datum measurement is the distance between where the device is deployed and your datum point (e.g. the top of the well casing). This field is mandatory. If you have a dipper-Log on a direct read cable or a Heron water level meter, you can click on the HELP ME CALCULATE DISTANCE TO DATUM button This tool is a useful step-by-step guide to calculate your Distance to Datum measurement.
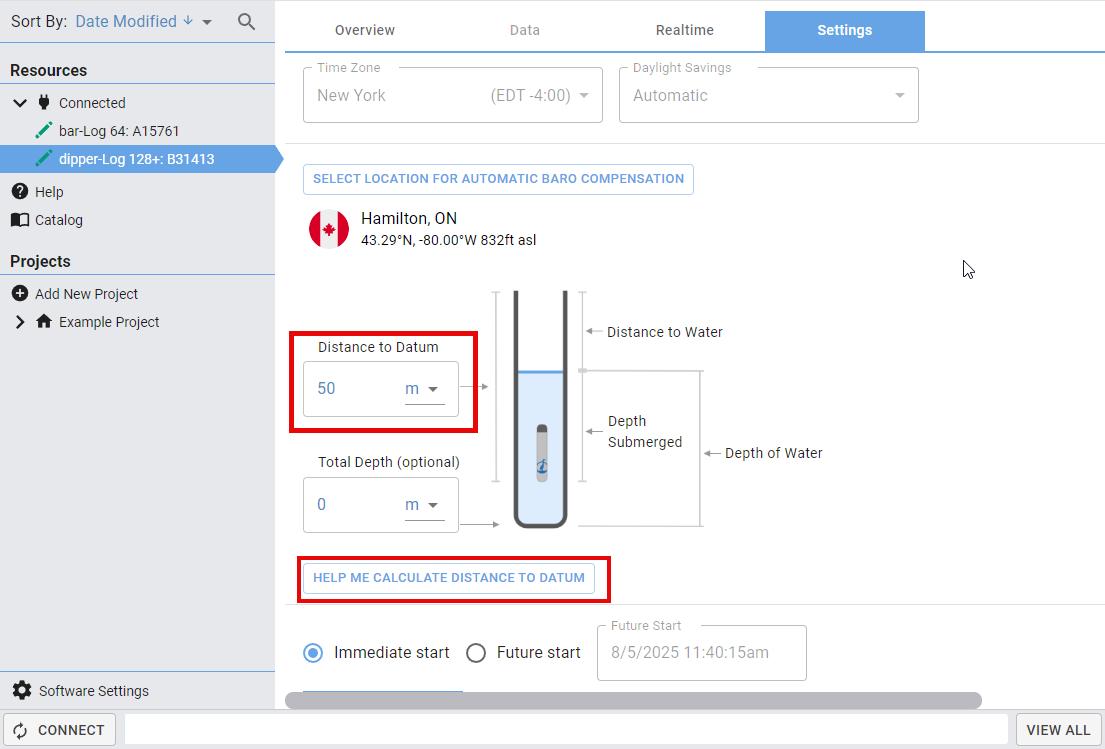
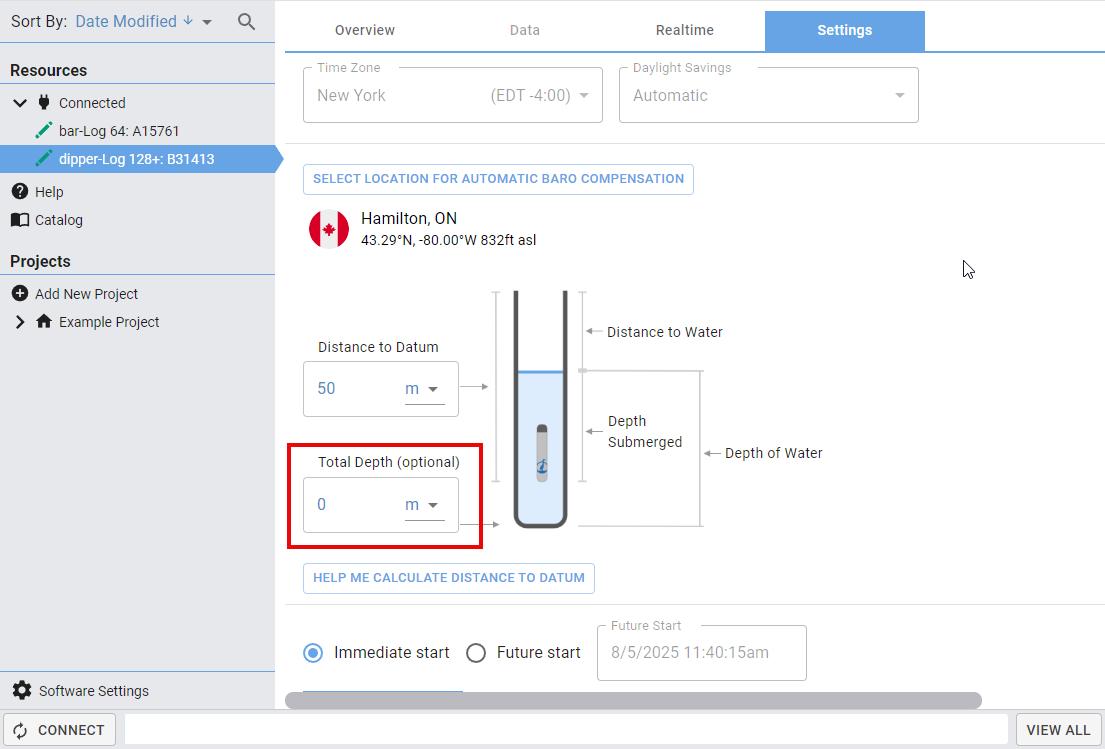
Total Depth
Total Depth is optional but recommended. It is the distance from the datum point to the bottom of the well or body of water being measured. The software can use the total depth to automatically calculate more information and save you from additional work.
Use a Heron dipper-T2 with the optional well depth indicator probe to get an accurate reading of the depth of your water column.
Start Time
By default, the logger is set to start its mission immediately. To input a future start date and time, check the Future Start box and edit the date and time by clicking in the date/time field.
Logging Intervals
Most loggers only support linear reading intervals – however, some will also support scheduled intervals. Select the Linear or Scheduled tab.
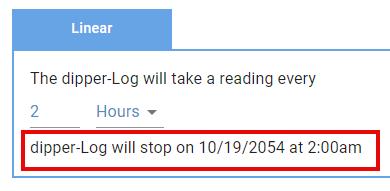
Linear Mode
Linear mode allows you to set the amount of time between each reading. Some loggers may also allow you to select a maximum number of readings.
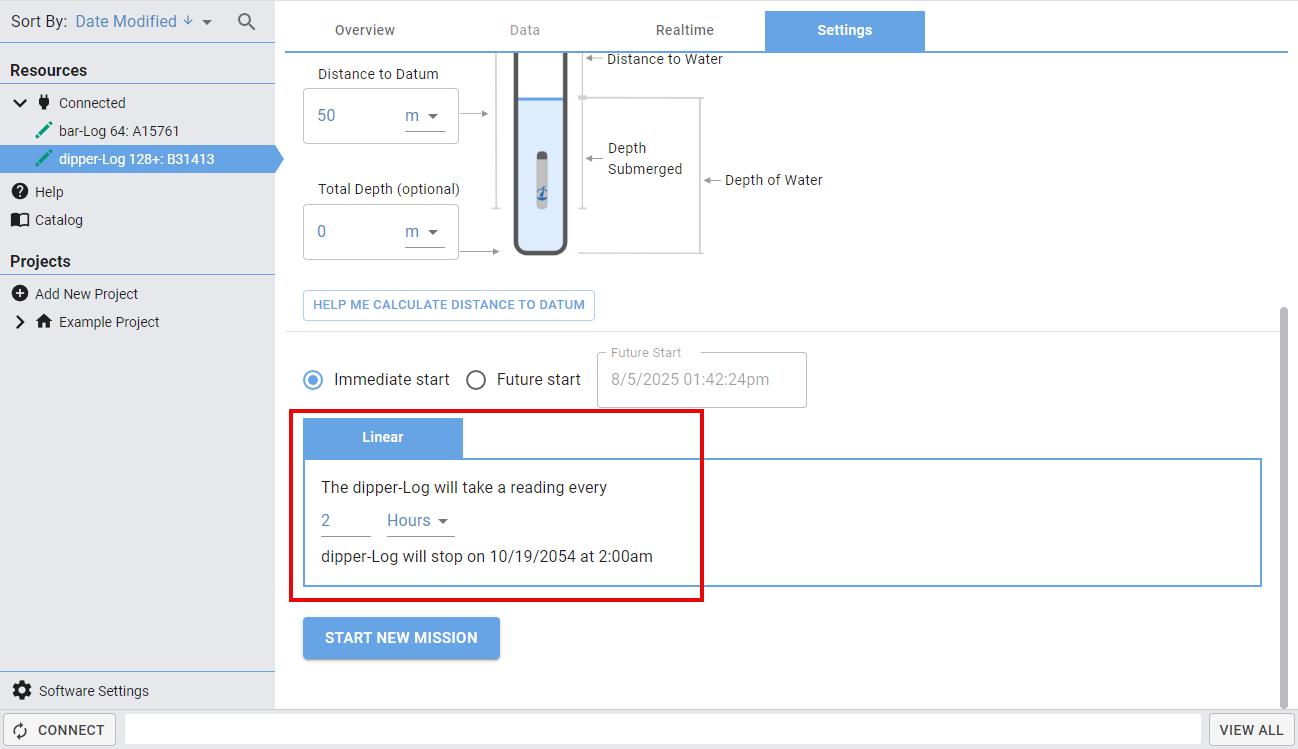
Note: The software displays the logger’s estimated stop time based on its current storage and the reading interval.
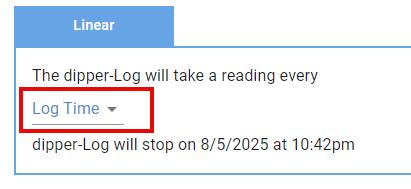
Log Time records the first reading at 1 second and adds 1 second to each subsequent reading interval for 255 readings. Note: This feature is supported by some but not all loggers.
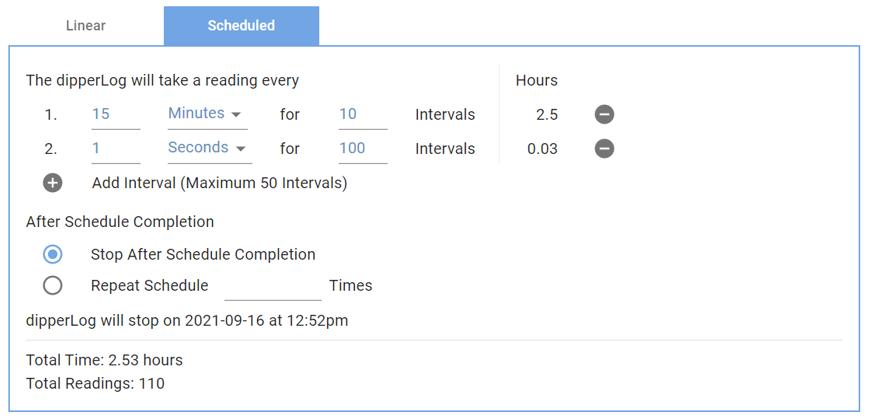
Scheduled Mode
The Scheduled mode allows you to create a custom logging schedule for your logger. This mode is highly flexible and can be as simple or complex as required. Create an interval and input a maximum number of readings for that interval. Click the (+) button to add more intervals and use the (-) button to remove intervals. After creating your schedule, select whether your mission will stop at the end of the schedule or if the schedule will repeat.
Checks Before Starting the Mission
Starting a new mission will delete any data stored on the logger! Make sure to download your data before starting a new mission – data downloaded to the database on your computer will not be affected. Starting a new mission will also overwrite the previous mission settings.
Once all settings are entered, click the START NEW MISSION button. This will upload your settings to the logger, and it will now appear in your data management panel under the appropriate project and deployment. You can now disconnect your logger and deploy it.
Downloading Data
Connecting the Logger
Connect your logger to the computer using the PC-communication cable. Open the software.
When the software opens it will display all connected loggers on the top left-hand side under the Connected dropdown menu of the Resources section. If your device is not showing up, click the CONNECT button in the bottom left-hand corner. This will scan all ports for any Heron Instruments devices.
Find the logger in the data management panel under Projects and click on the device.
Note: Connected devices will have a green logger icon, while disconnected devices will have a black logger icon.
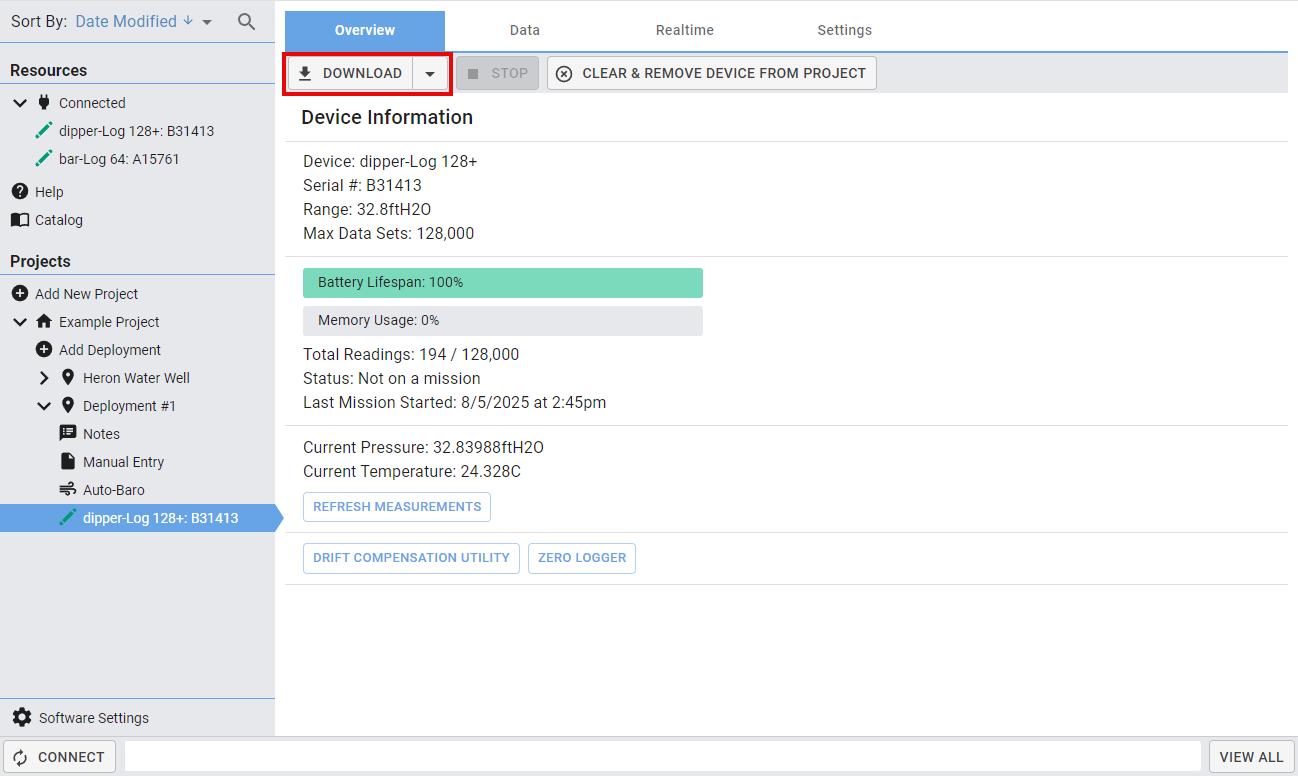
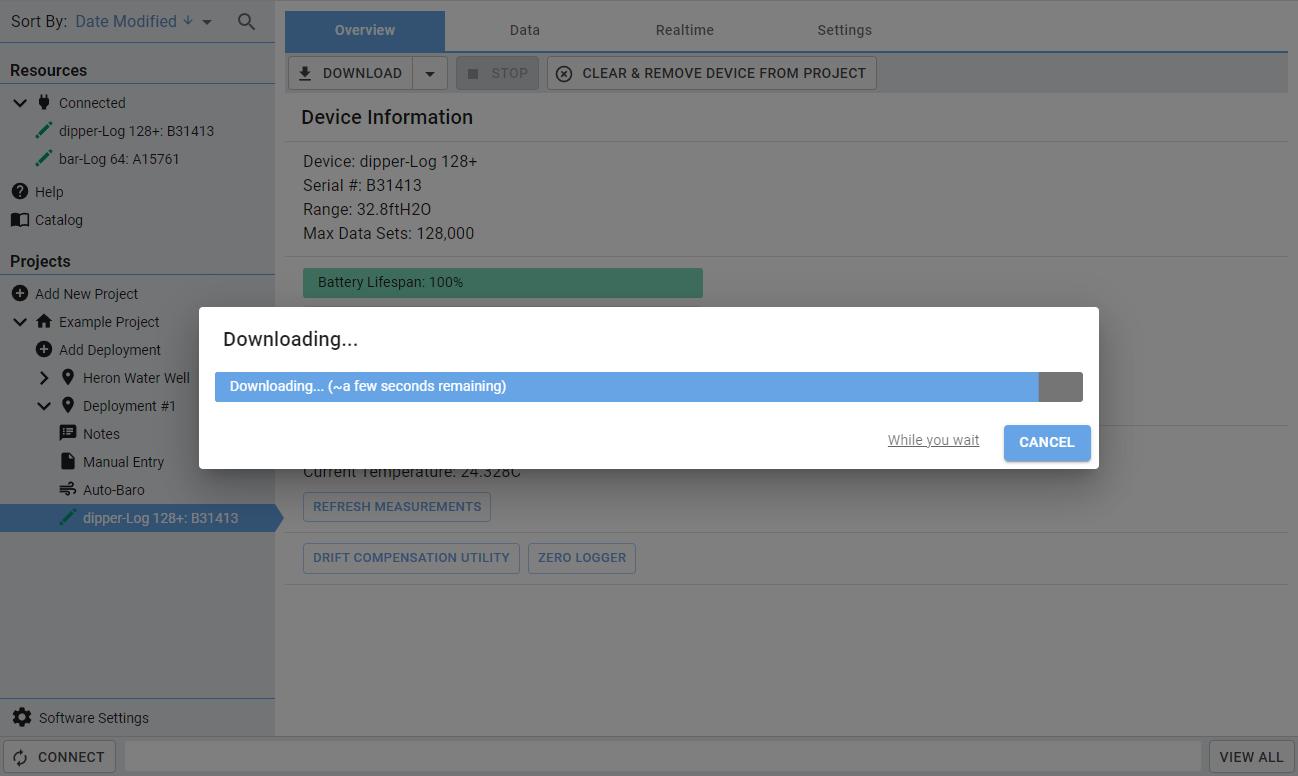
Downloading the Data
Click the DOWNLOAD button and your data will begin downloading.
Viewing and Refining the Data
Data Tab
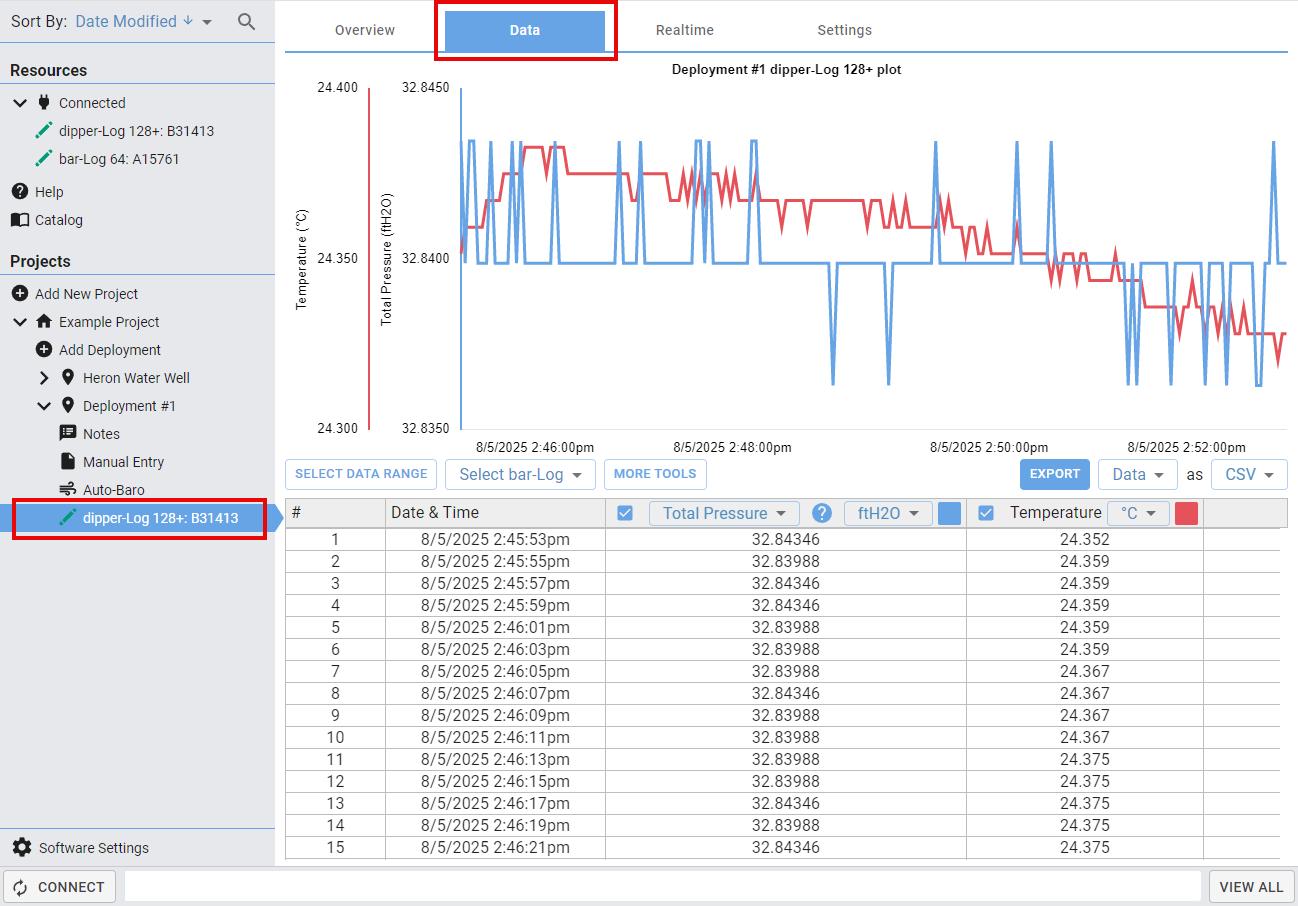
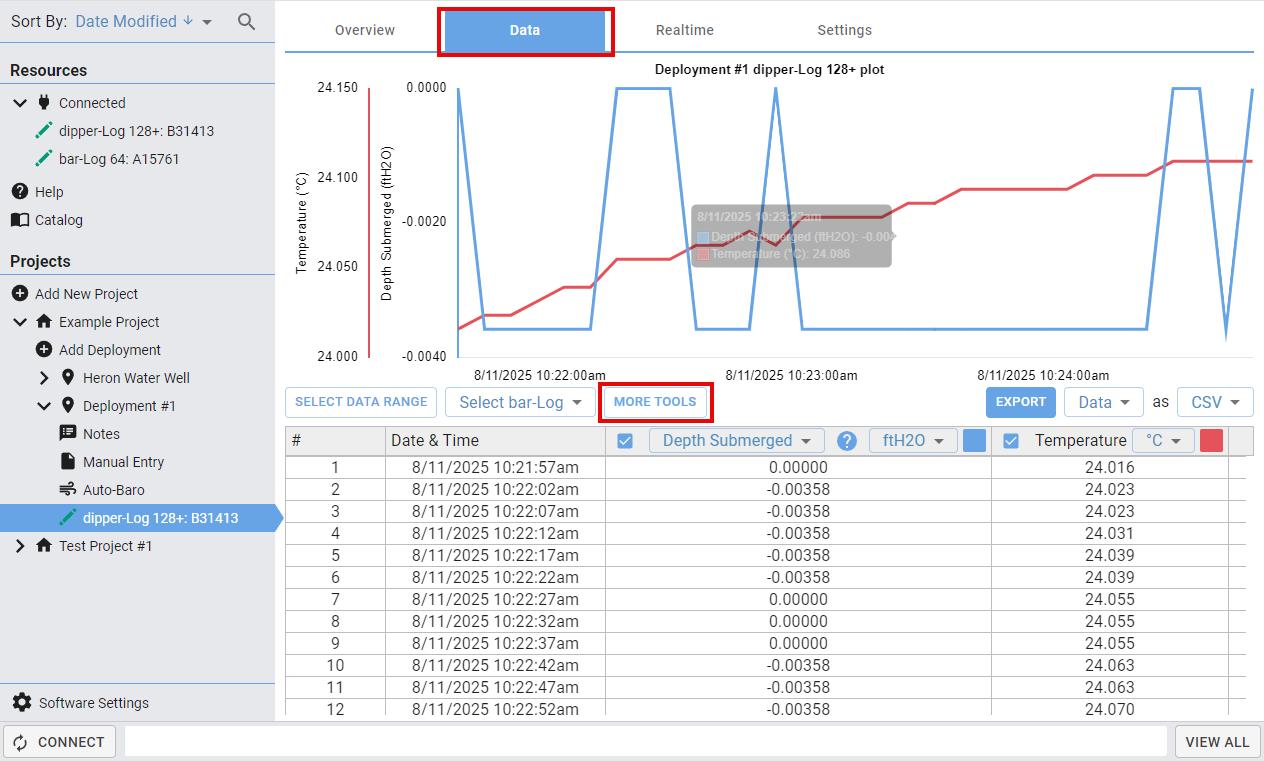
Navigate to the desired device in the data management panel under Projects. Select the device and click on the Data tab. Note: Your device does not need to be actively connected if the data was previously downloaded.
A view of all the downloaded data will be displayed.
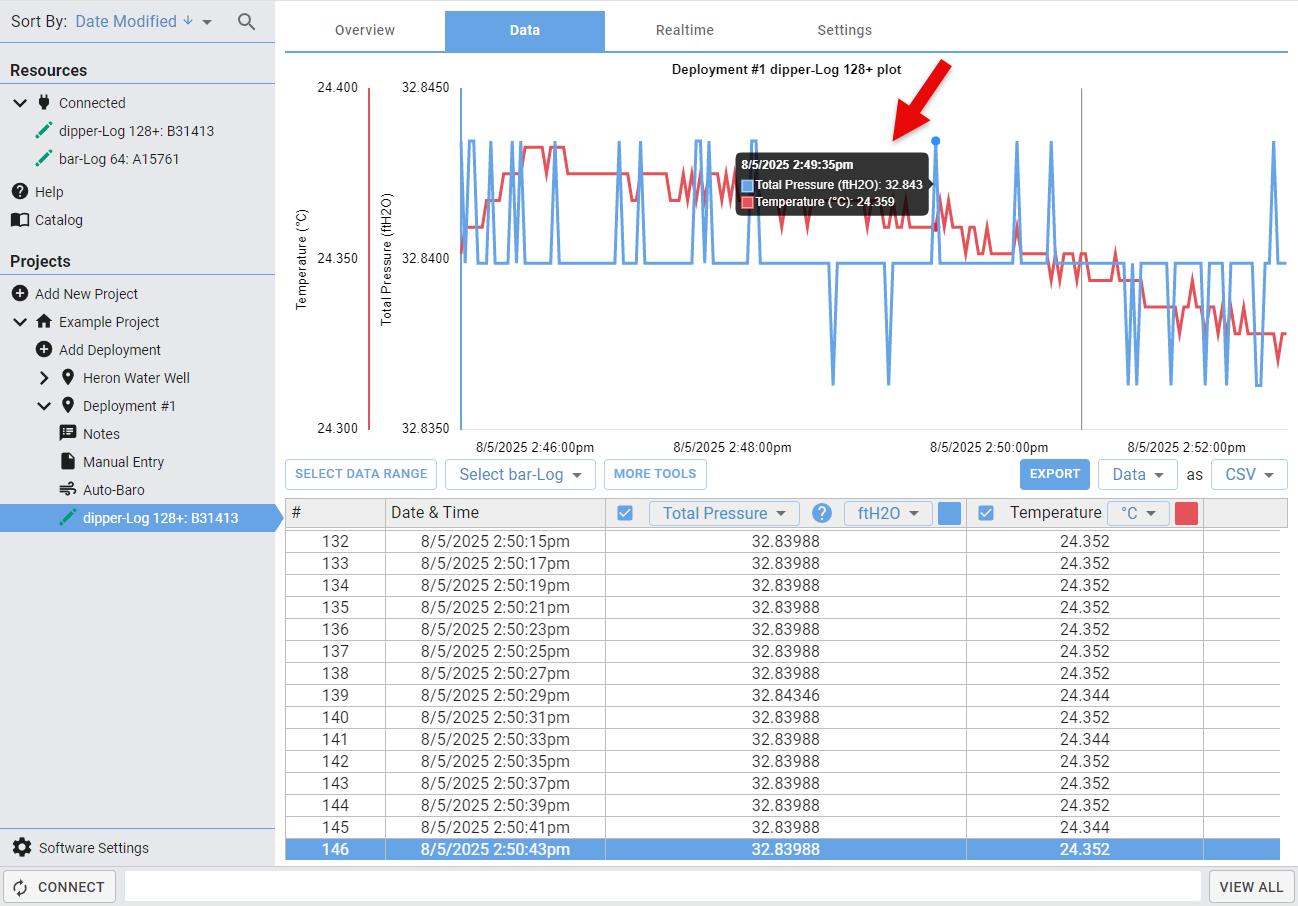
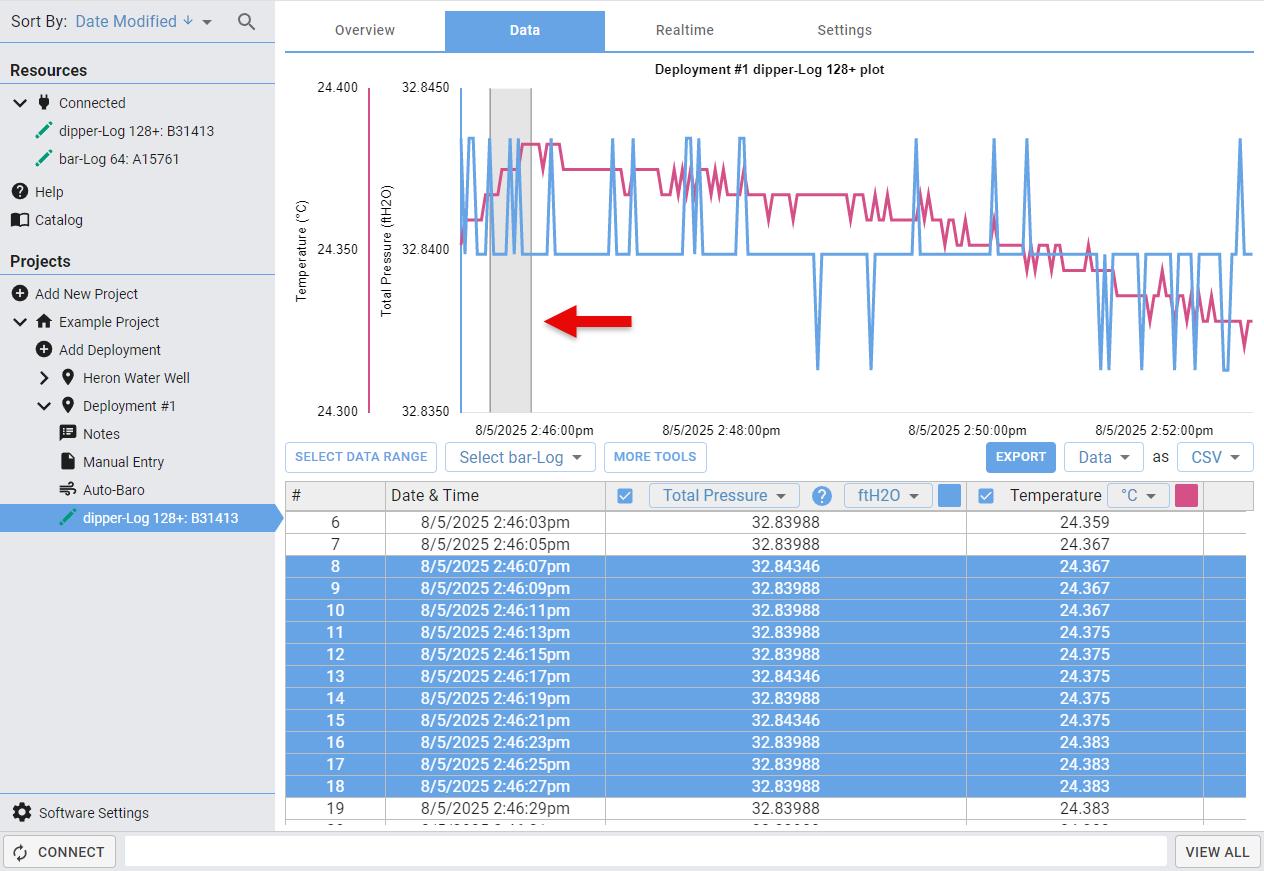
Viewing Specific Data Points on the Graph
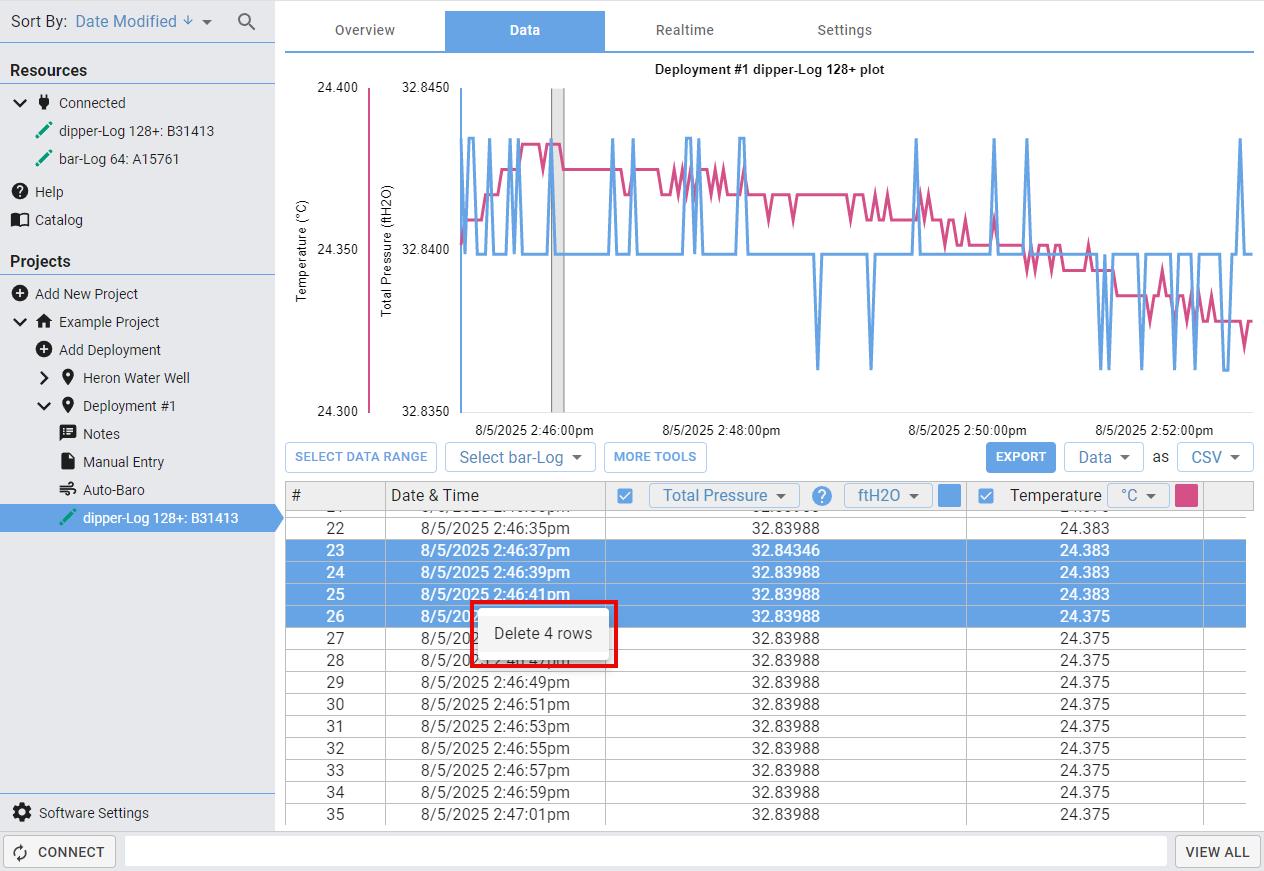
By default, all parameters will be visible on the graph. Hover over the graph (or click and drag on touch screen devices) to see details of specific data points. Clicking on the graph will highlight the corresponding data point in the table. Clicking and dragging will select a region on the graph and the corresponding data points will be highlighted in the table.
Delete unwanted data points by selecting them in the table, right-clicking and pressing delete. Note: This action cannot be undone – deleted data cannot be recovered.
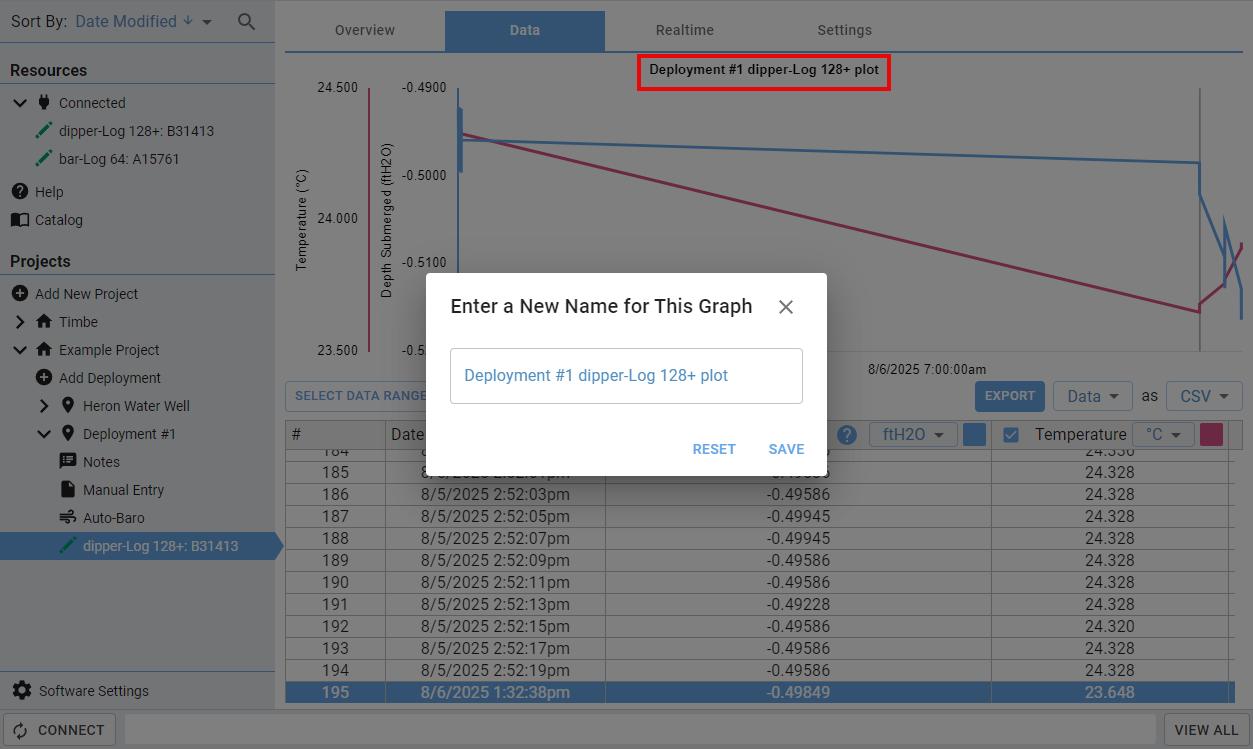
Changing the Graph Title
Click on the title at the top of the graph and enter the new title in the pop-up window. Click the RESET button to return to the default title.
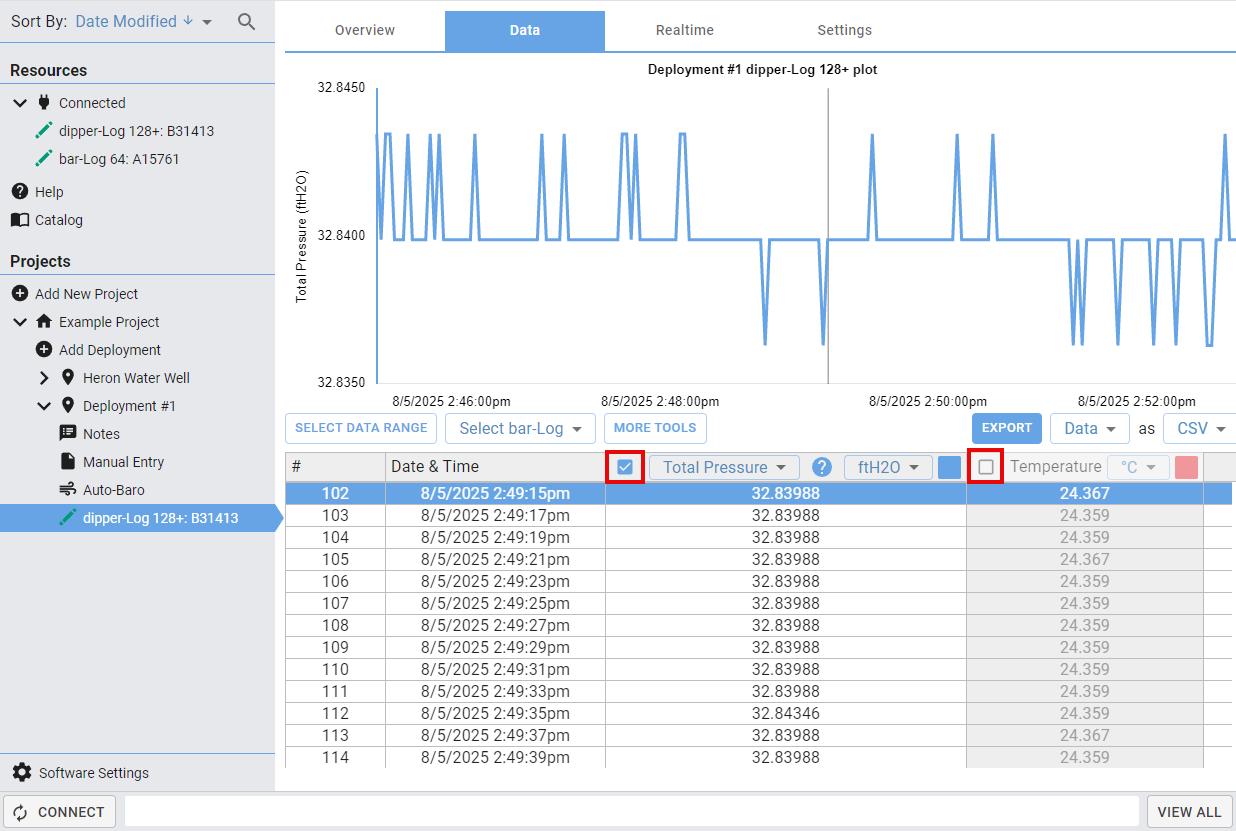
Modifying the Parameters Shown on the Graph and their Colours
Modify the parameters shown in the graph by selecting/deselecting the columns in the chart.
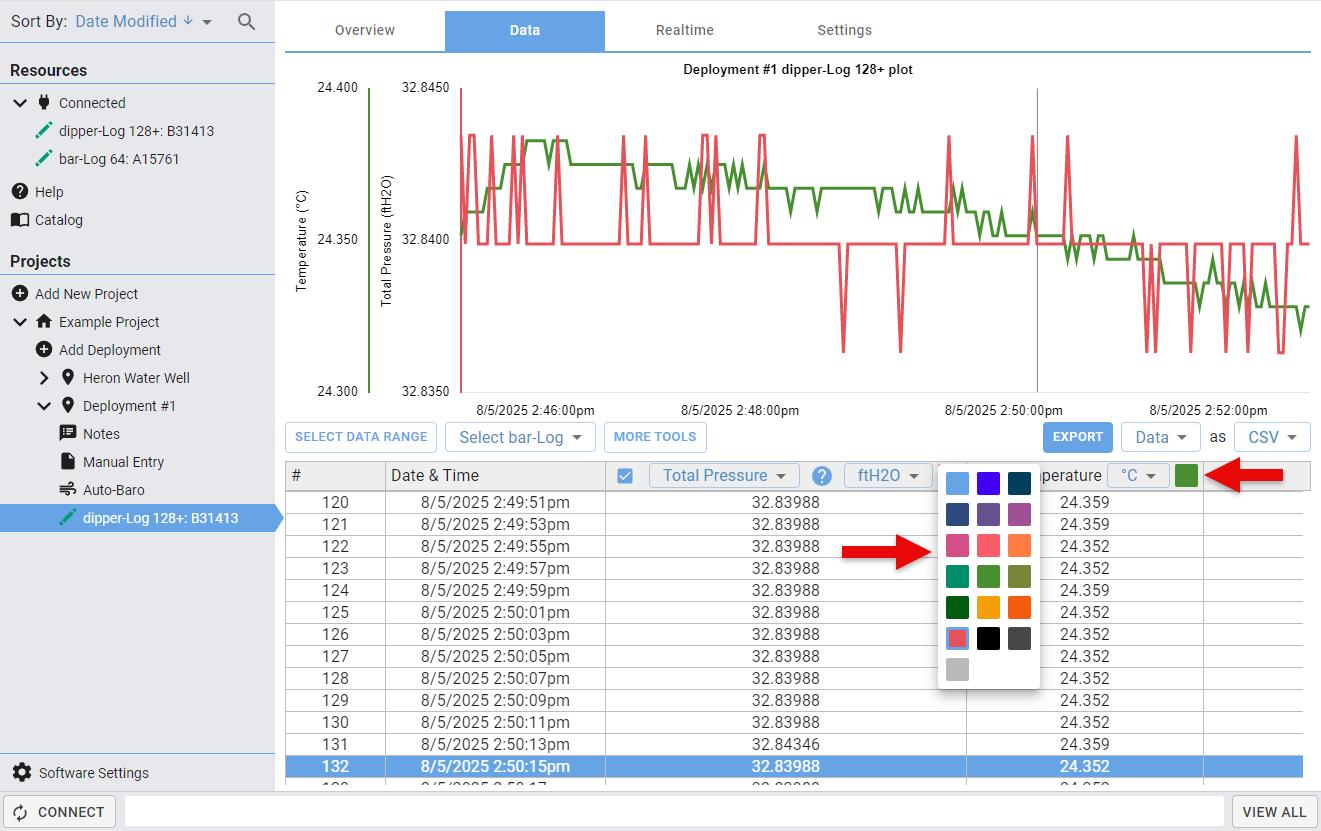
Change the line colour on the graph by selecting the colour swatches in the chart header Choose a colour and the graph will be updated to reflect your new selection.
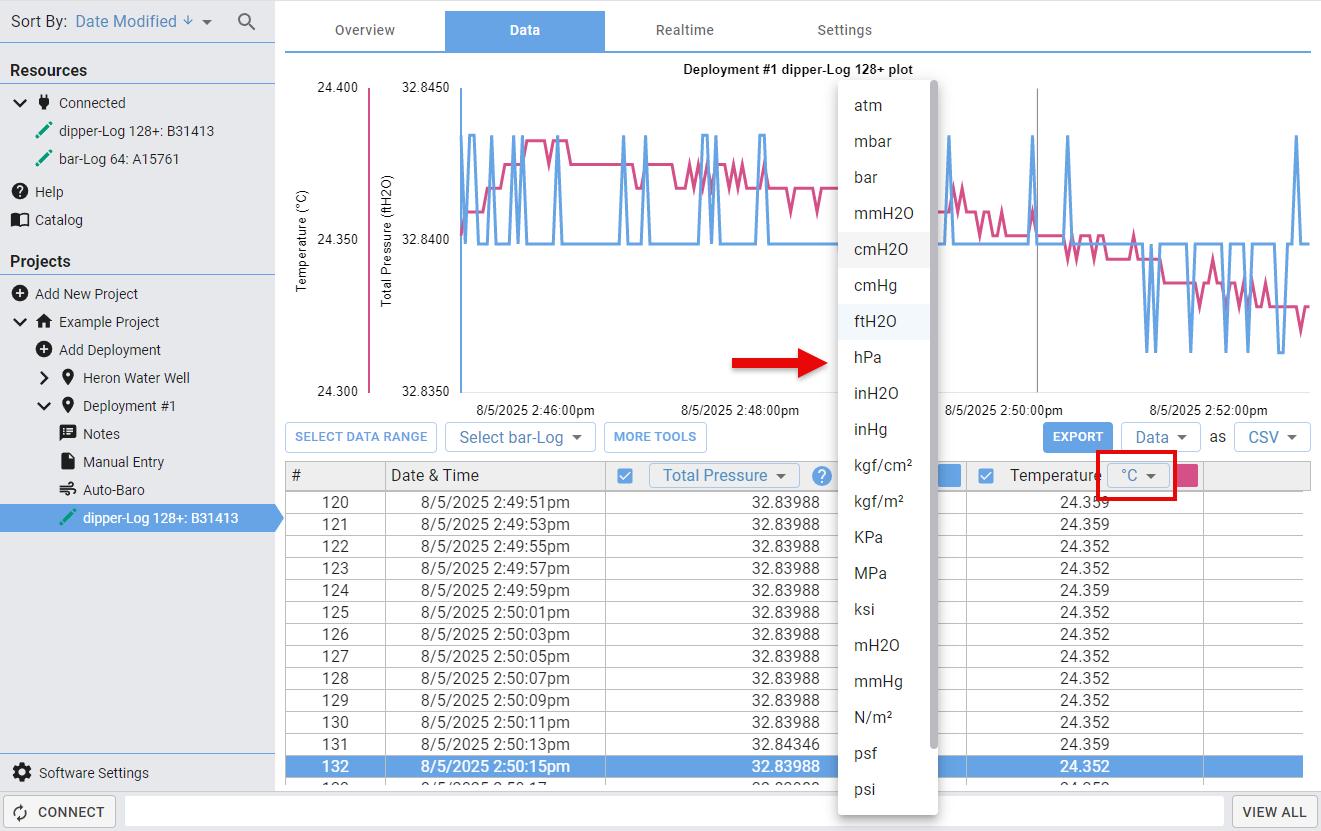
Changing the Units
Click on the units in the chart header and a dropdown menu will appear. All the data points and the graph will automatically update when a new unit is selected.
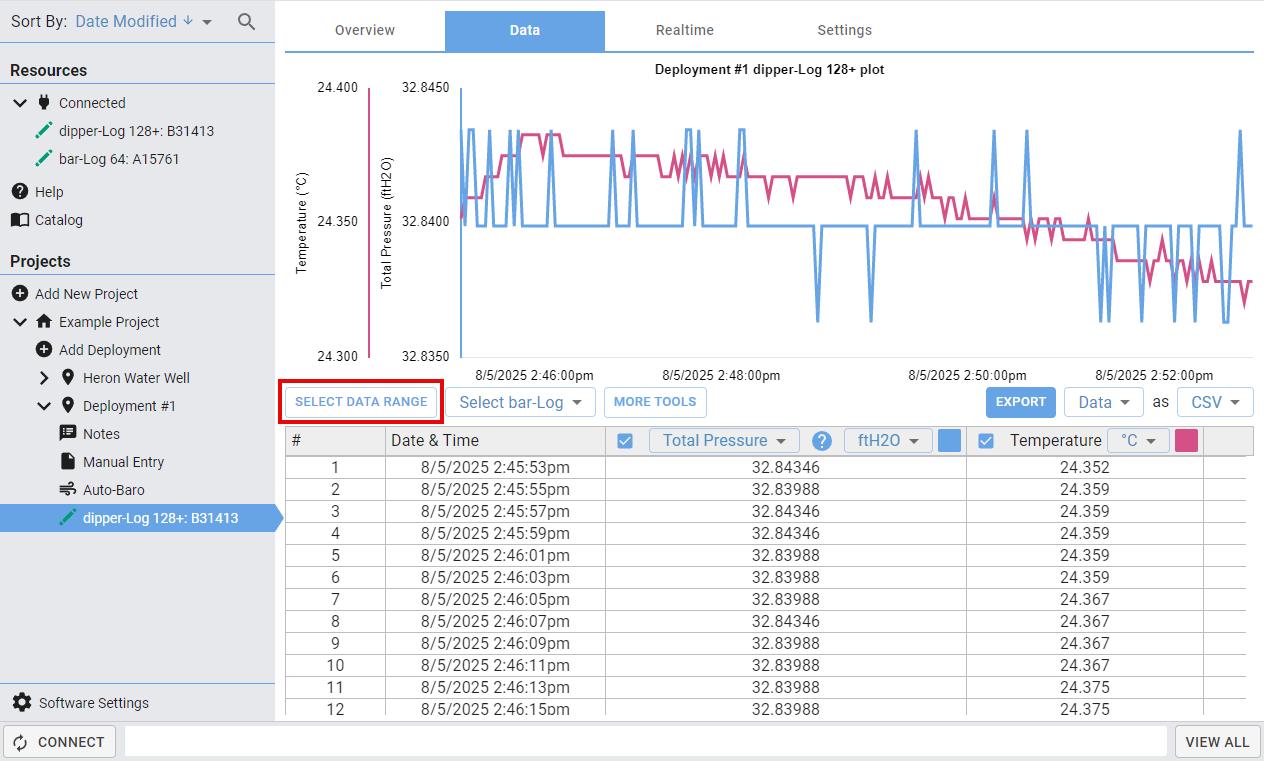
Filtering the Data Range
Refine your data by clicking on the SELECT DATA RANGE button. In the pop-up window you can filter your data by a date range or the download date and apply upper and lower limits to the Y-axis
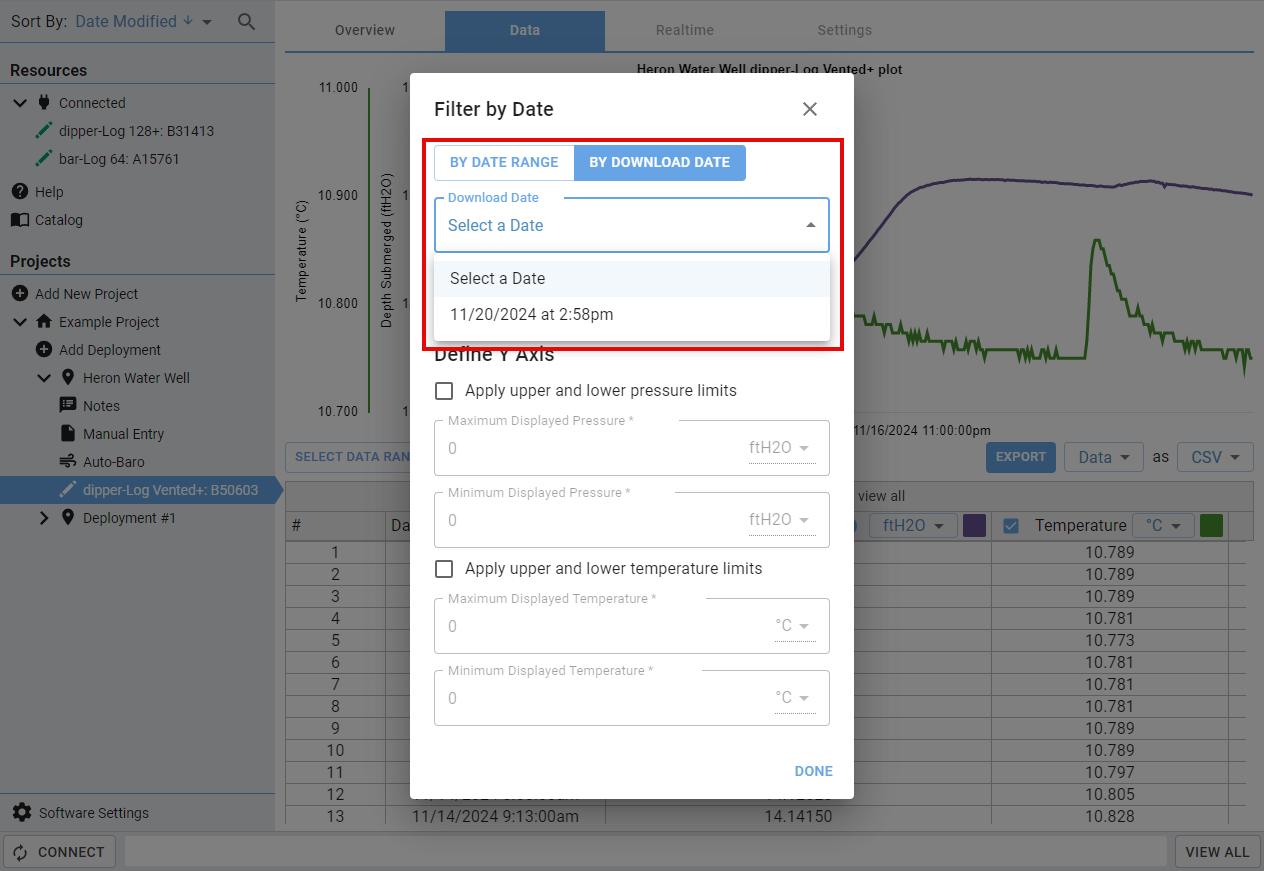
To enter a specific date range, go to the By Date Range tab, input a start and end date Hitting RESET will set the date range to cover all data points available (the default setting). Clicking on REMOVE FILTER will remove the filter entirely. To filter the data to a specific download date, go to By Download Date tab and select a download date from the dropdown list.
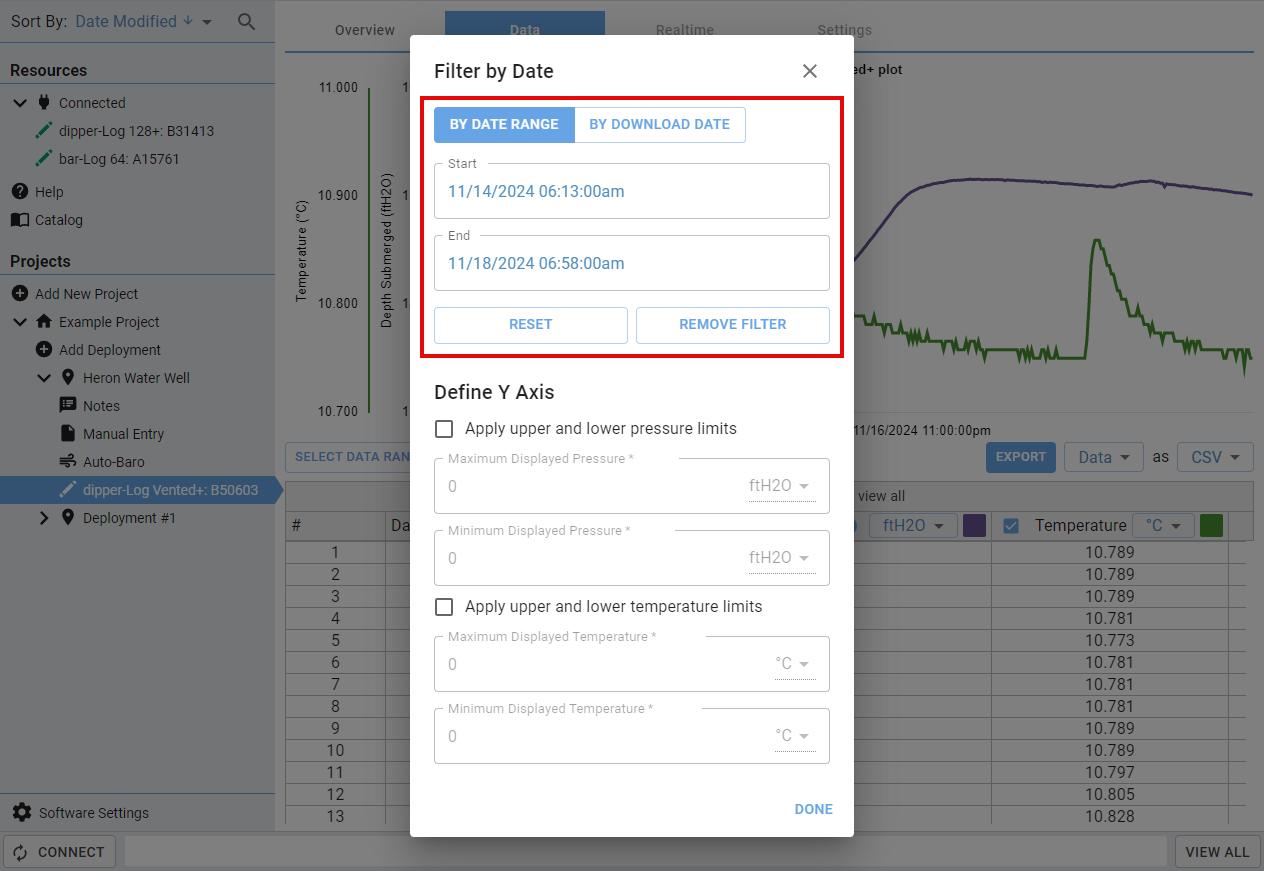
To define upper and lower parameter limits, check the applicable box under Define Y Axis. Input a maximum and minimum value and select your units. Note: the units do not need to match the units selected in the chart; they will be converted automatically.
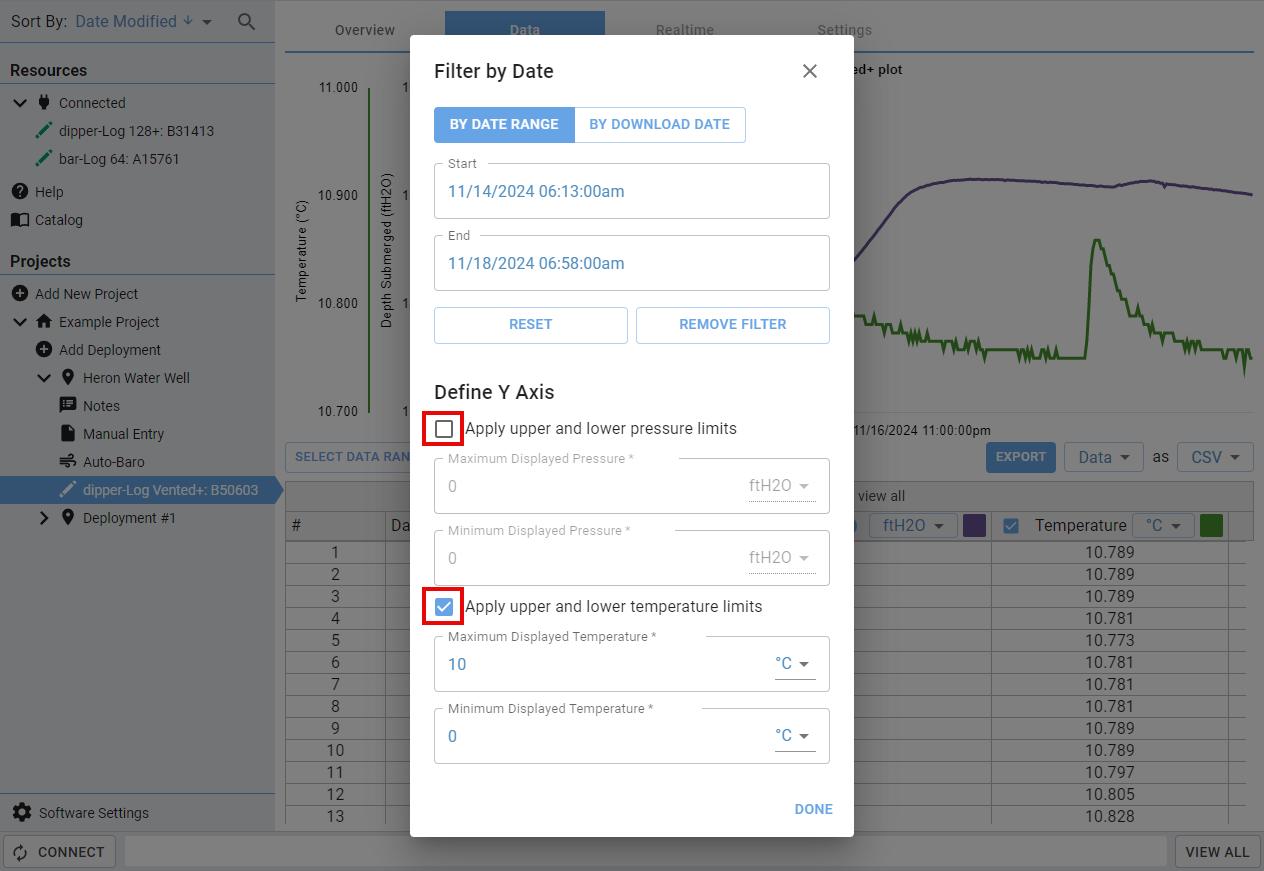
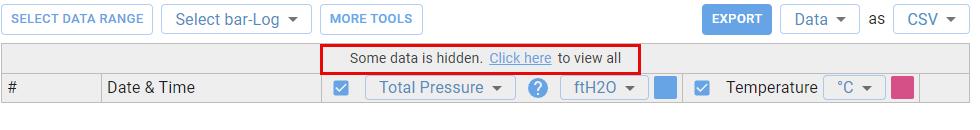
Click DONE once you have added your desired filters and the table and graph will update. A bar will appear indicating that some of your data is hidden. Use the Click here button to view your unfiltered data.
Pressure Loggers
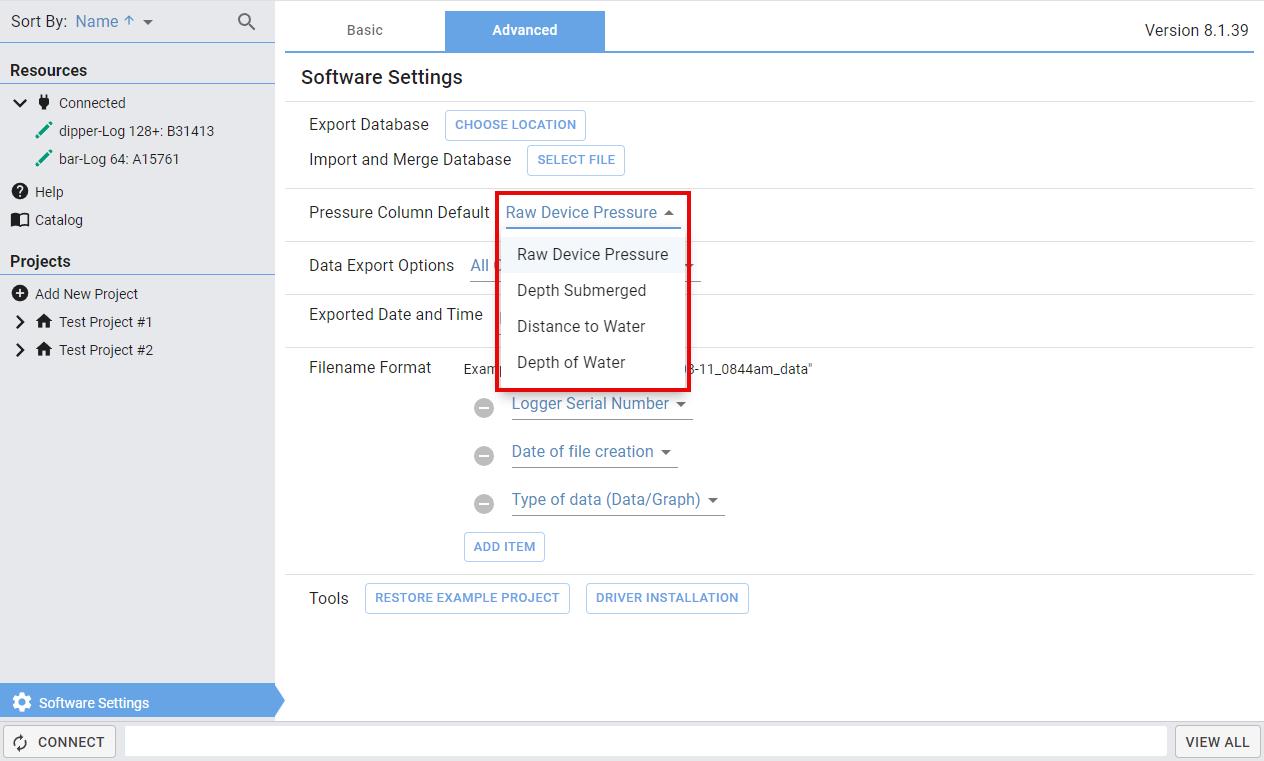
When using a pressure logger, the default header will be Total Pressure You can select alternatives by clicking on the header and selecting an option from the drop-down menu
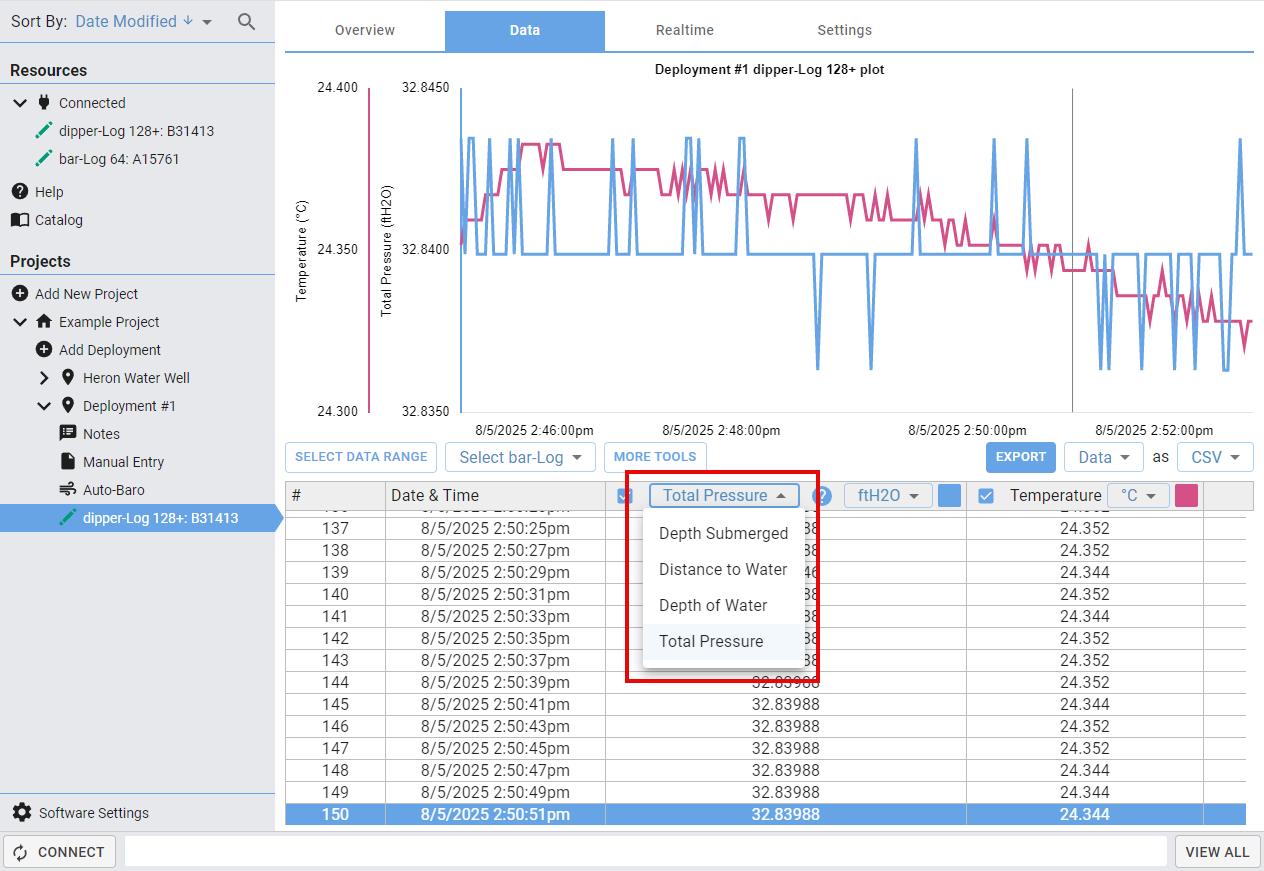
Total Pressure: The raw pressure values measured by the pressure transducer.
Depth Submerged: The vertical distance from the water’s surface to the logger’s pressure transducer.
*See the following section (Barometric Pressure Compensation) to select the source for barometric pressure
Distance to Water: The vertical distance from your datum point to the water’s surface
Depth of Water: The vertical distance from the water’s surface to the bottom of the body of water
*Only available if Total Depth has been entered*
Barometric Pressure Compensation
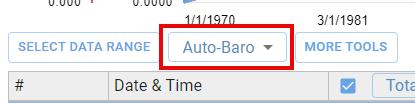
There are three sources of barometric pressure that can be used to compensate your data: Auto-Baro, a bar-Log or a manual entry Click on the Select bar-Log button to view a dropdown menu of the options.
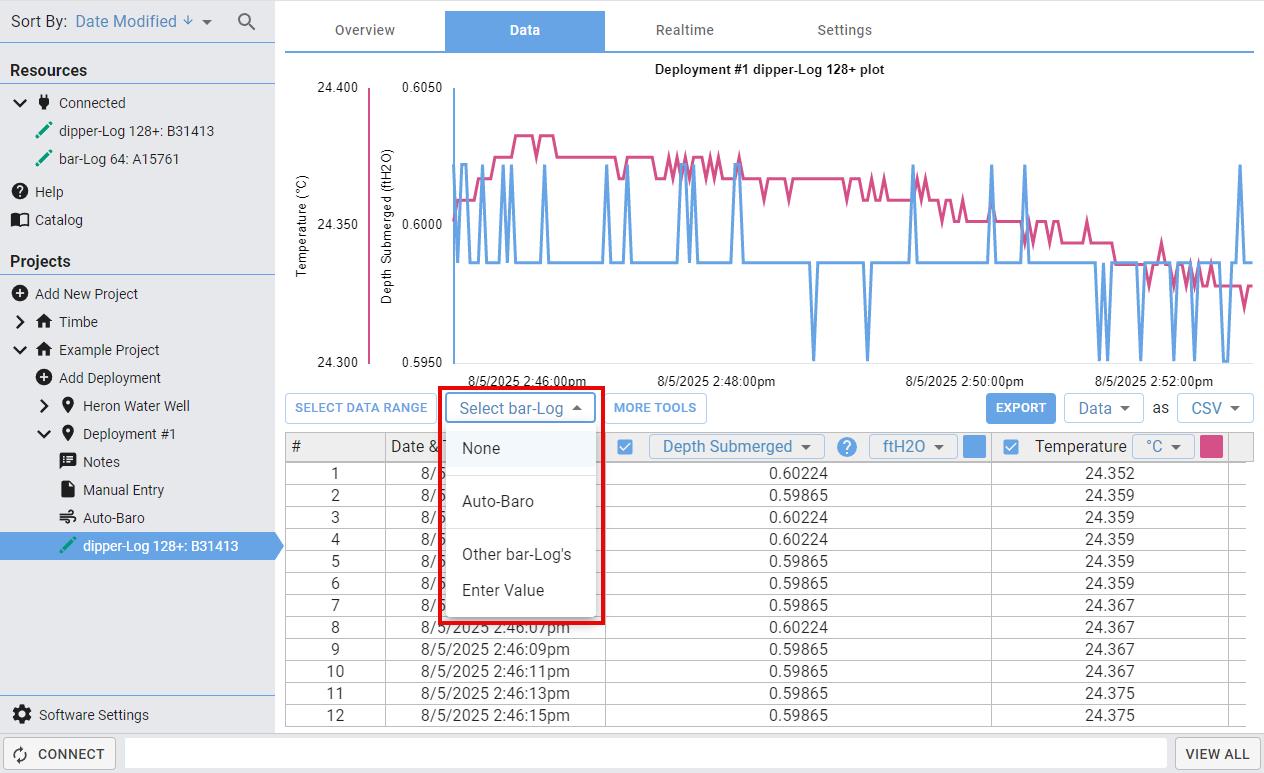
Auto-Baro
Select Auto-Baro from the dropdown list. This will automatically compensate your data based on the location chosen in device setup. For more information on the Auto-Baro feature please see the AutoBaro chapter.
Bar-Log
Select Other bar-Log’s from the dropdown list In the pop-up window, select the desired bar-Log. To view other dipper-Logs, check the Show dipper-Logs box. This allows you to select a dipper-Log to compensate your data however, this is not recommended.
Manual Entry
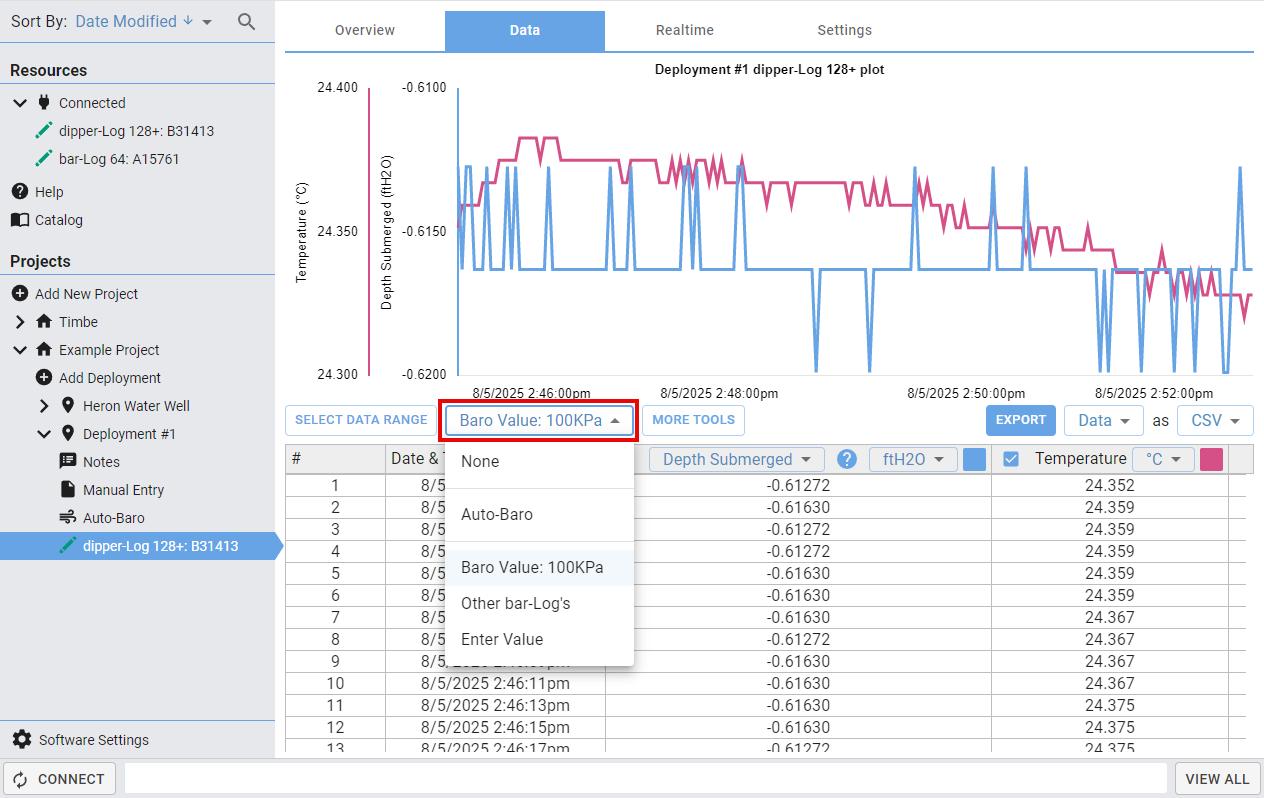
Select Enter Value from the dropdown list. Input a barometric pressure value and select the units (they do not need to match the table units).
The field box will indicate which compensation source you are using. To remove a source, click on the field box and select None.
If no source is selected, the software will use the back-up barometric pressure/programmed value stored in the logger (from zeroing the logger) to calculate depth submerged.
More Tools
Additional tools are available to manipulate your data. They can help account for elevation and/or density differences and correct for mistakes made during setup or deployment.
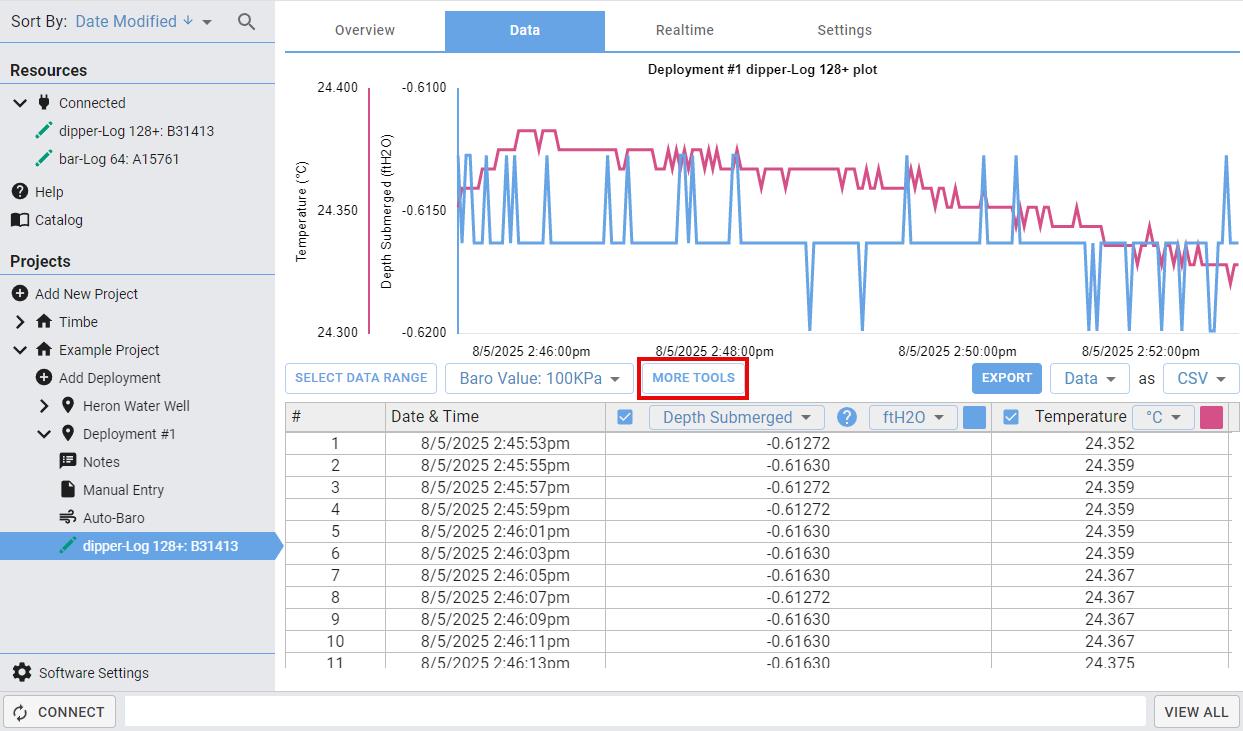
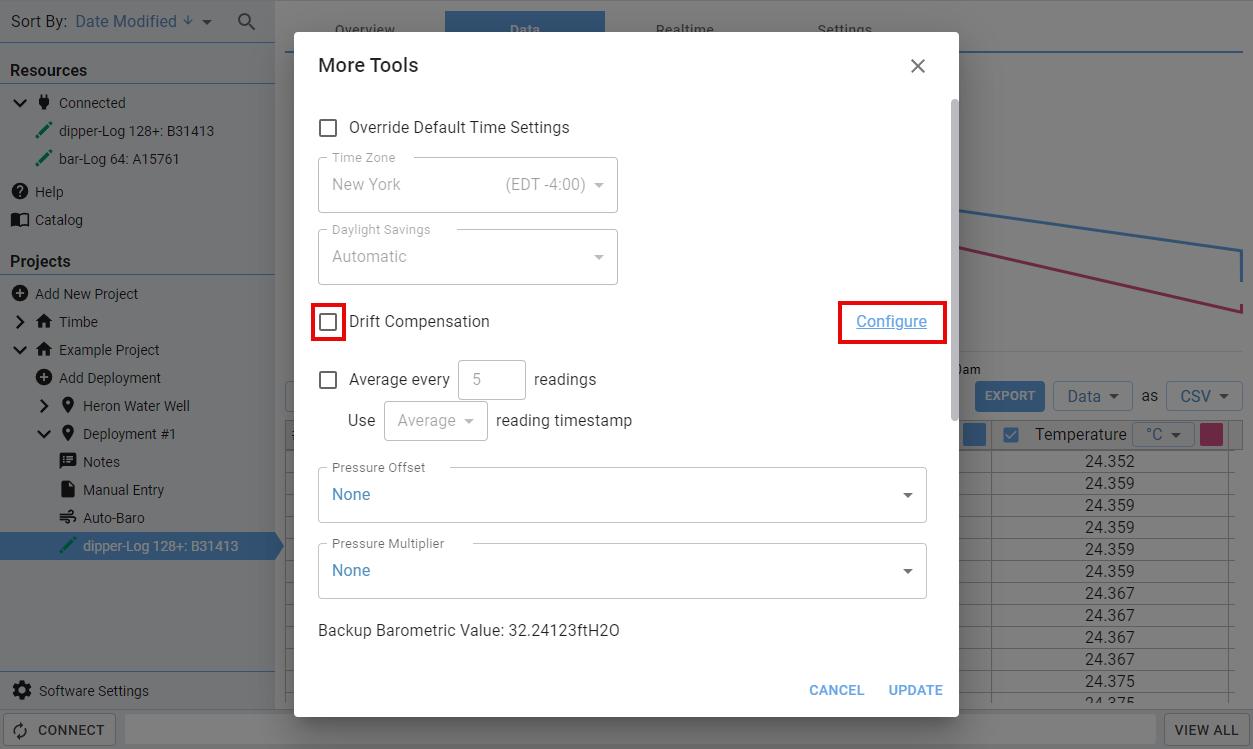
Click on the MORE TOOLS button. You have the option to:
• Override the default time settings
• Apply drift compensation
• Average your readings
• Apply a pressure offset
• Apply a pressure multiplier
• Adjust Distance to Datum and Total Depth values
• Override the default decimal place setting
• Adjust data to match manual entry from a water level meter
Override the Default Time Settings
Check the Override Default Time Settings box and select your time settings from the dropdown menus.
Drift Compensation
To apply drift compensation, check the Drift Compensation box. See the Drift Compensation section for more details on configuring this tool.
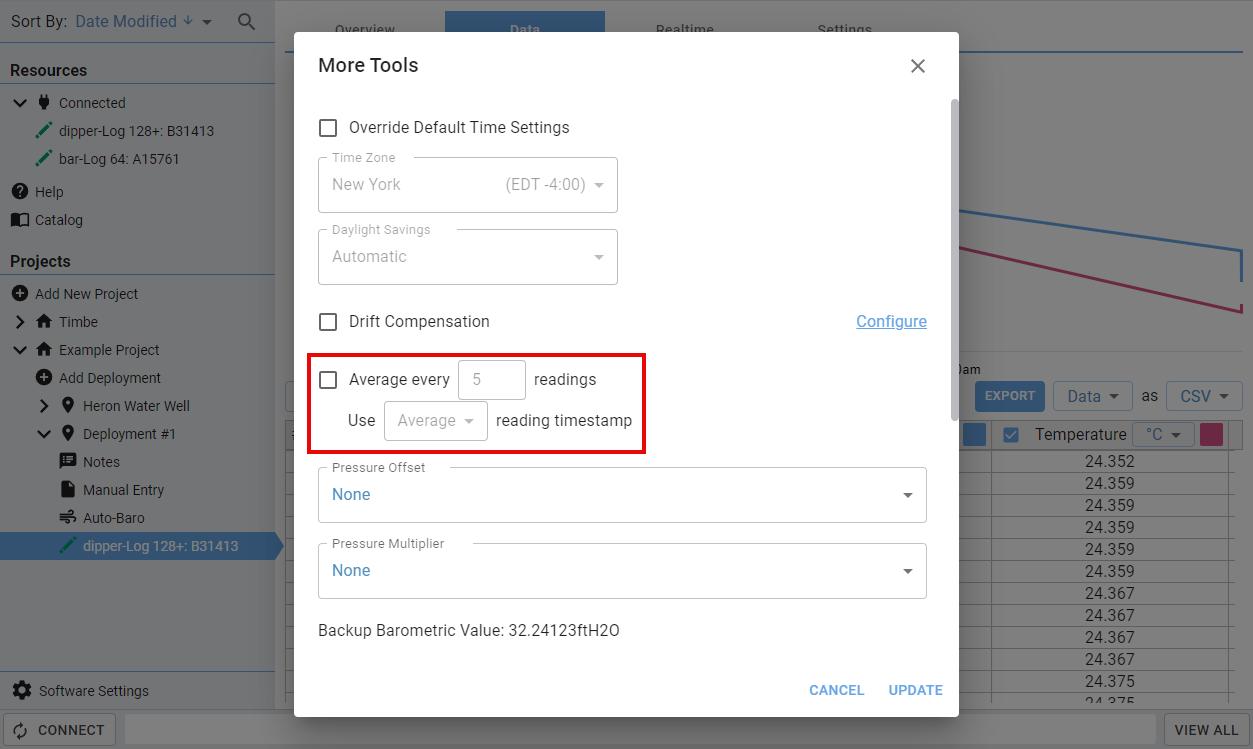
Averaging the Readings
Check the box next to “Average every __ readings.” This feature will average a group of readings into one data point. The new data point will assume the time stamp of the first reading, last reading or average timestamp of the group.
For example, if “Average every 5 readings, use first reading timestamp” was inputted, it would average every 5 readings into one (500 readings would become 100 readings) and each reading would assume the timestamp of the first reading in each group.
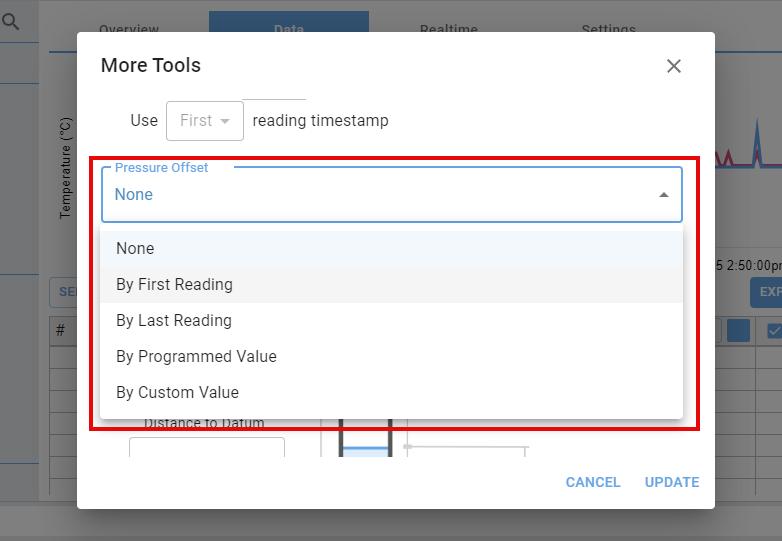
Applying a Pressure Offset
To apply a constant shift to your pressure data set there are 4 options to choose from:
• By First Reading: Uses the first pressure reading of the mission as the constant barometric pressure value. Use when no bar-Log data is available and your dipperLog started logging before placement in the well.
• By Last Reading: Uses the last pressure reading of the mission as the constant barometric pressure value. Use when no bar-Log data is available and your dipperLog started logging when already submerged in the well.
• By Programmed Value: Uses the back-up barometric pressure value from zeroing the logger.
• By Custom Value: Shifts the pressure values by a manually entered value.
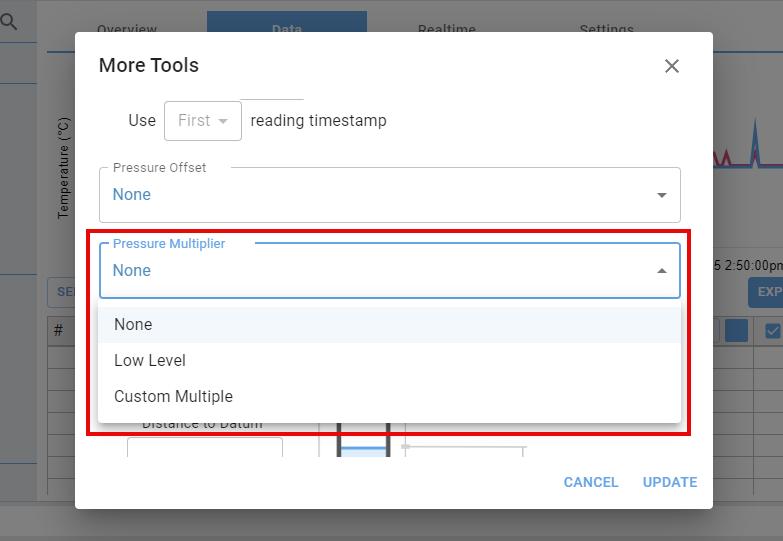
Applying a Pressure Multiplier
To apply a constant scaling factor to the pressure dataset, there are 2 options to choose from:
• Low Level: Multiplies the pressure values by 0.9.
• Custom Multiple: Multiplies the pressure values by a manually entered value. Use this option when the liquid you are monitoring has a density that is not equal to 1 (e.g. seawater or brackish water).
Adjust Distance to Datum and Total Depth values
Allows you to update the Distance to Datum and Total Depth values, if they differ from the values inputted during device setup.
Override Default Decimal Places
The default number of decimal places displayed is 3. To override this value, check the Override Decimal Places box for the desired parameter and input a number.
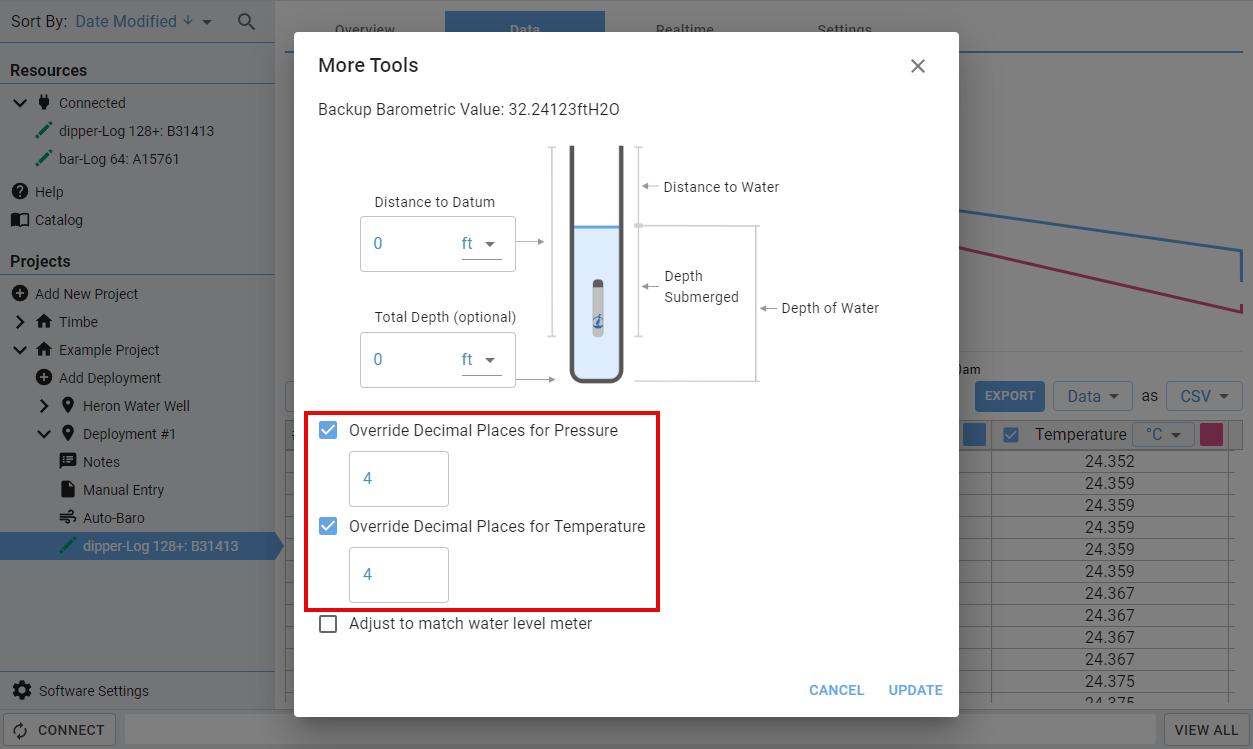
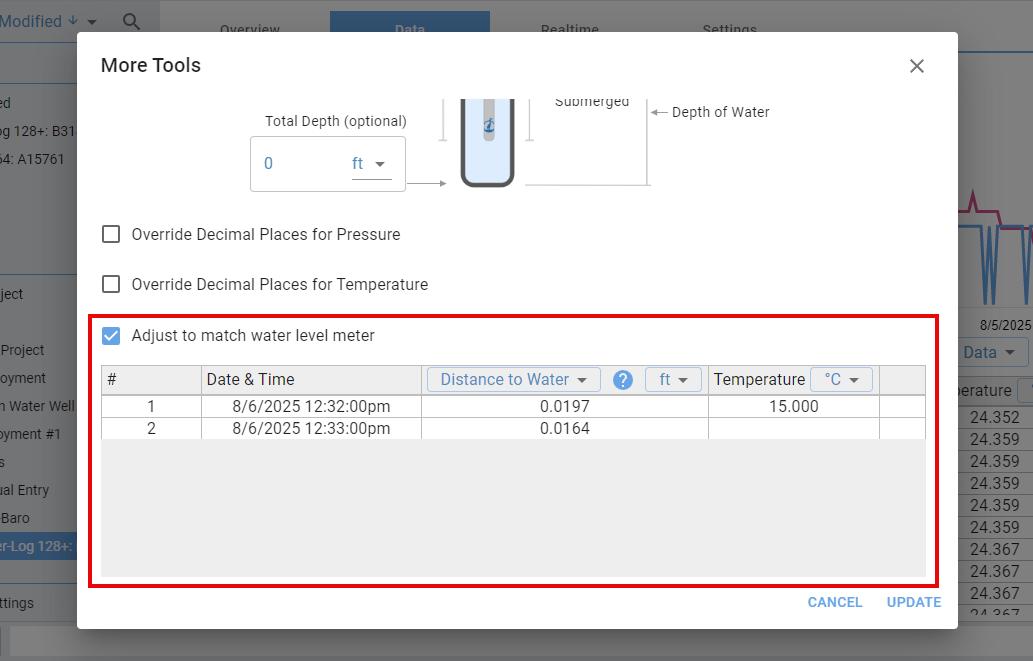
Adjusting to Match a Water Level Meter
To adjust your dataset to match data that was collected using a Heron water level meter, check the Adjust to match water level meter box This will pull data that was manually added to the Manual Entry section under the deployment. For more details on how to enter the data and the adjustments made, please see the Manual Entry chapter of this manual.
Once all desired tools have been employed, click UPDATE and your data will be adjusted. To modify your applied tools or revert to your original dataset, click the MORE TOOLS button and make your changes/deselect the boxes.
Exporting the Data
From the Data tab, you can export your data in the form of a table or a graph.
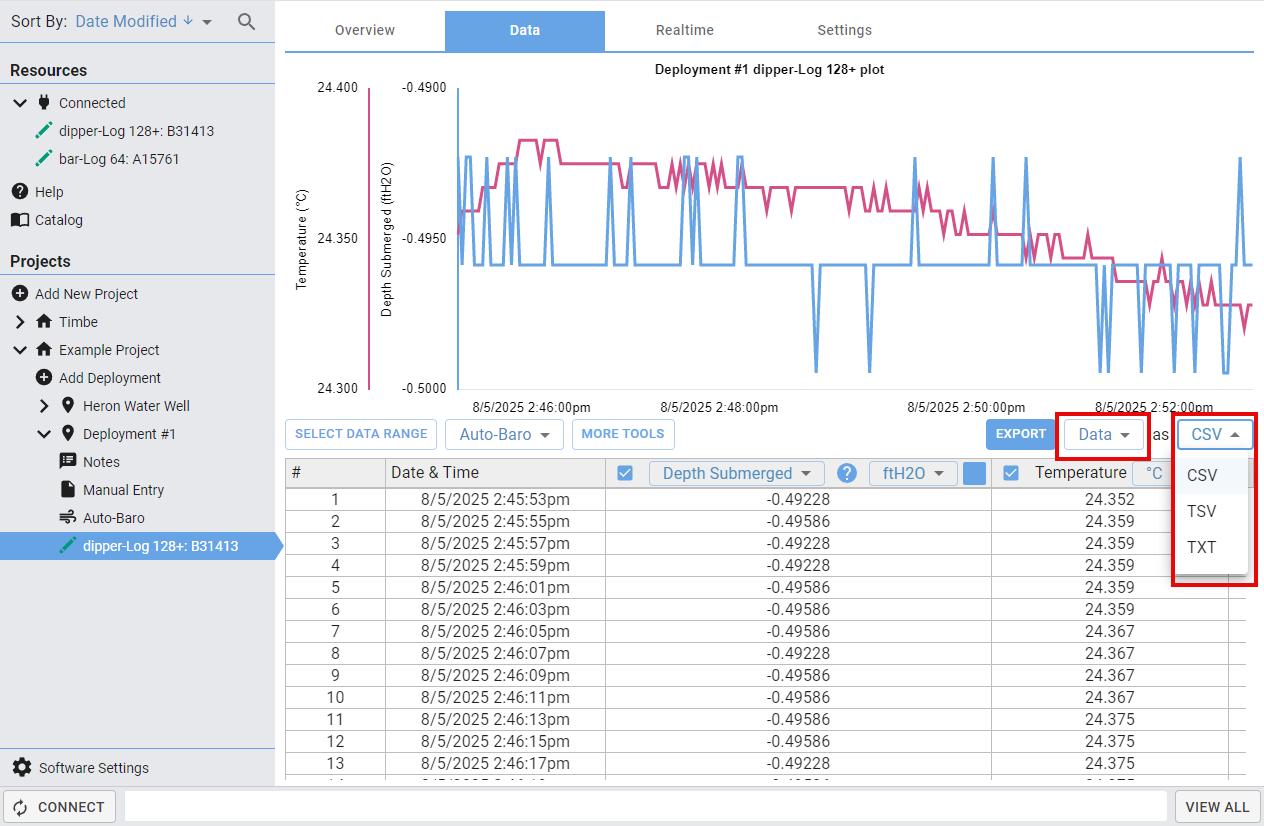
Exporting a Table
From the dropdown beside the EXPORT button, select Data and then select the file type. Any data filters, adjustments, etc. will be reflected in the exported data. Click EXPORT to finish.
To modify the default export settings, see the Advanced Settings section of the Changing the Default Settings chapter
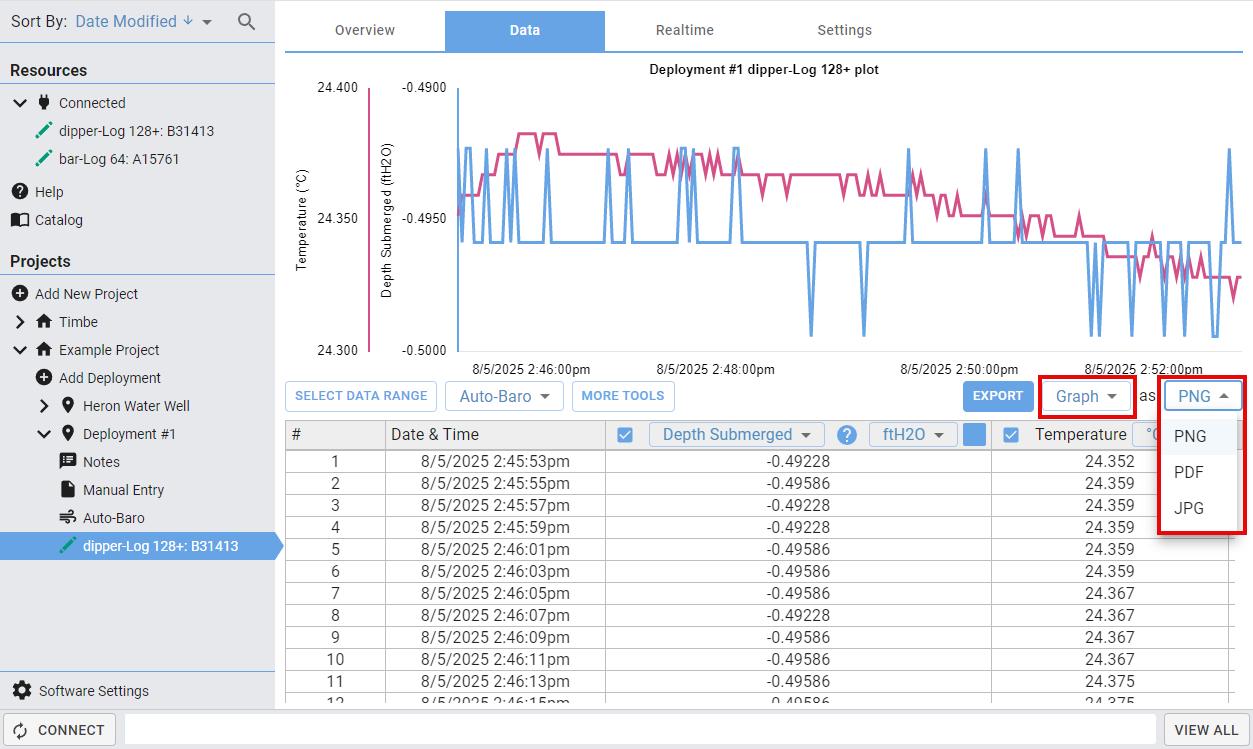
Exporting a Graph
From the dropdown beside the EXPORT button, select Graph and then select the file type. The exported graph will reflect exactly what is shown on the Heron Instruments software – including any filters, adjustments, etc. applied to the graph. Click EXPORT to finish.
Realtime Readings
Realtime readings can be accessed in the Realtime tab for connected devices. Realtime readings will immediately begin to populate the table and graph every 1 second.
This tab functions similarly to the Data tab. Details on how to modify the graph, changing parameters/units and using the MORE TOOLS options can be found under the Viewing and Refining the Data chapter.
Note: To calculate the Depth Submerged in the Realtime readings the back-up/programmed value from zeroing the logger is used as the barometric pressure. For more details see the Pressure Loggers and Barometric Pressure Compensation sections.
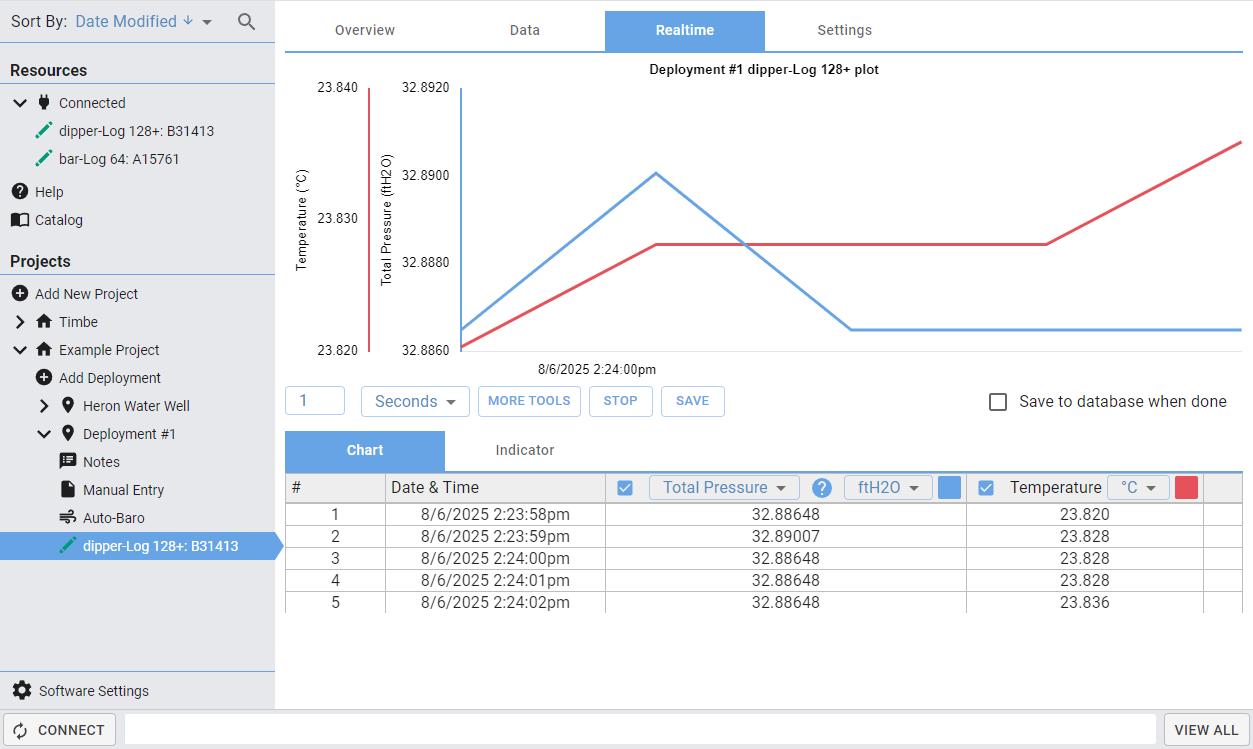
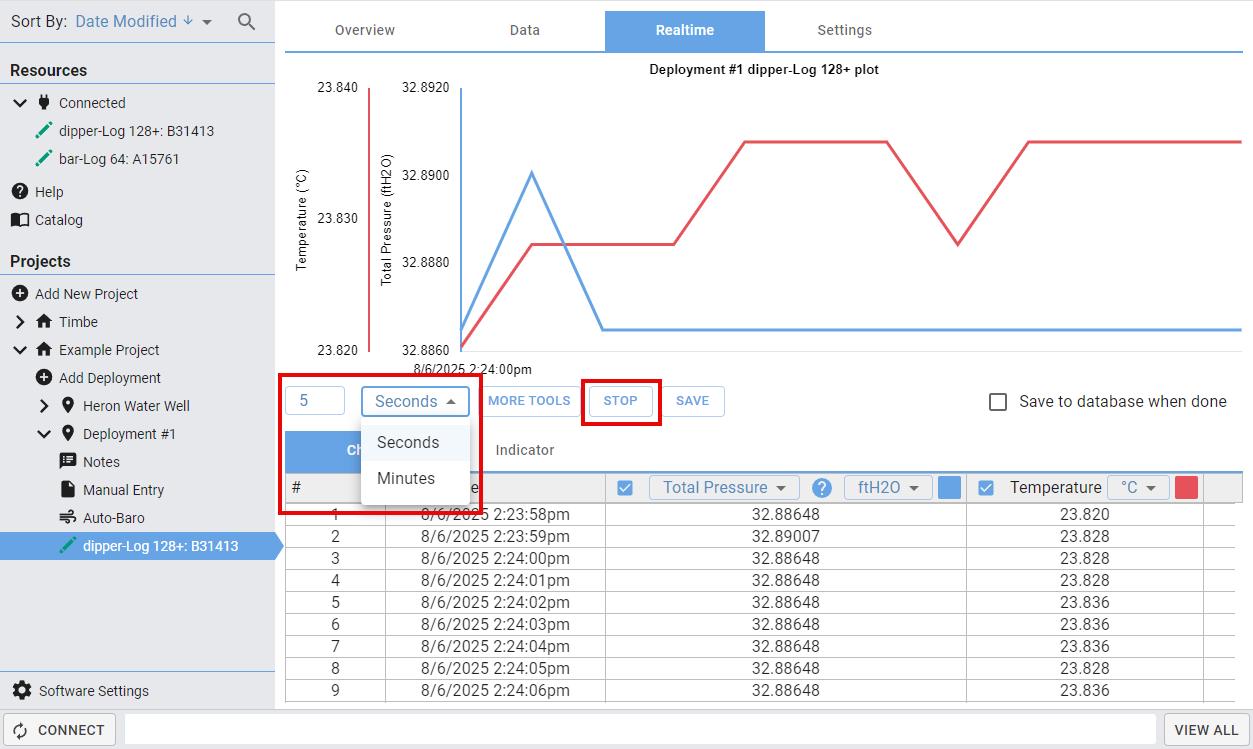
Changing the Reading Interval and Pausing the Readings
The reading interval can be changed by entering a new value and selecting the time unit from the dropdown list on the Realtime tab
Pause the real-time readings from populating by pressing the STOP button. Start the readings again by clicking the START button
Auto-Scrolling
In Realtime view, new readings will add to the bottom of the table. The software will automatically scroll, so you are always able to see the new datapoint populated at the bottom.
If you scroll away from the bottom of the table, the auto-scrolling will pause allowing you to look at specific rows of the table without shifting. To resume the auto-scrolling, scroll to the very bottom of the table.
The Rise/Fall Indicator
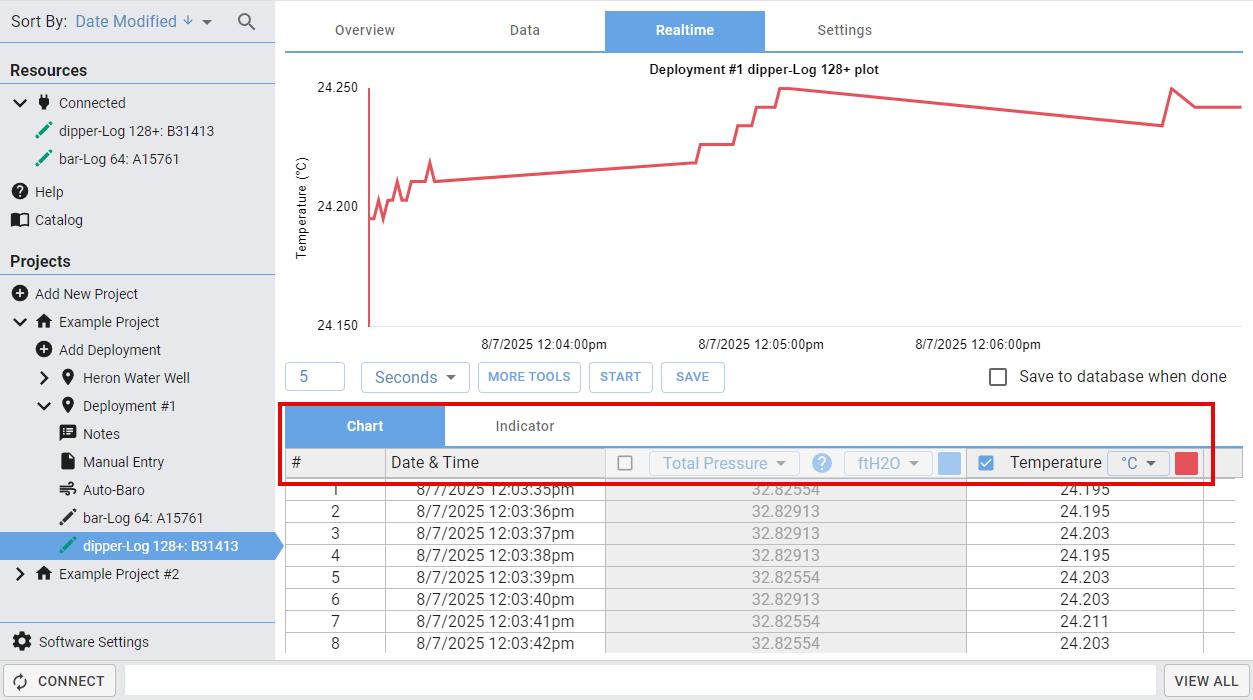
The Indicator tab provides a rolling/moving average of a single parameter and indicates whether the readings are increasing or decreasing.
To use the Indicator feature, ensure you only have one parameter selected on the Chart tab.
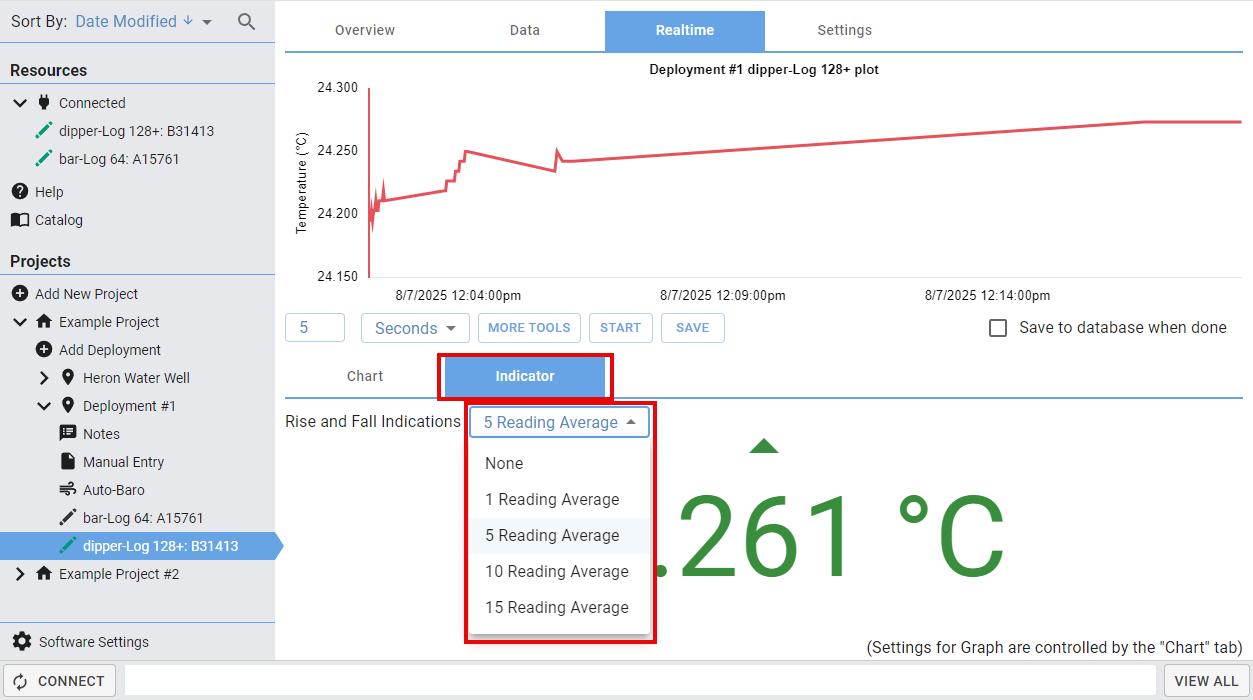
Click on the Indicator tab. To adjust the number of readings used in the rolling average, click the dropdown field to the right of Rise and Fall Indications and make your selection. The rolling average will update every time a new reading is populated. If “5 Reading Average” is selected, this means that the average is calculated using the five most recent data points.
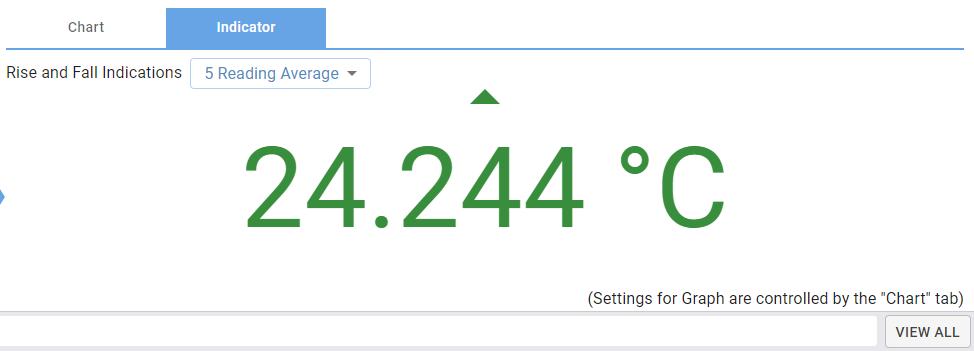
The rolling average will be displayed in Red, Green or Black text with an indication arrow. Red indicates that the reading values are falling, green indicates that they are rising and black indicates no change.
Saving Realtime Data
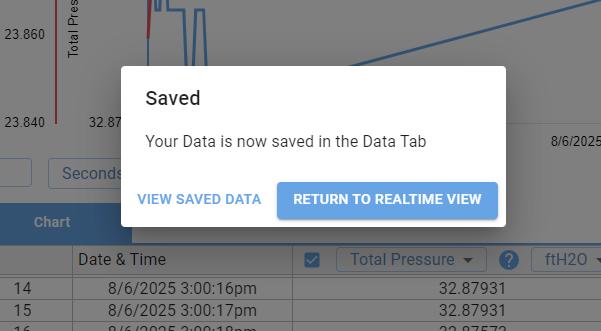
There are two ways to save real-time readings to the Data tab: the SAVE button or the Save to database when done checkbox.

The SAVE button can be clicked at any time, and the real-time data will be immediately added to the Data tab. If there is currently data open in the Data tab, the real-time readings will be added to the end of the table (as they have the most recent timestamps). You will be given the option to view the saved data in the Data tab or return to Realtime view.
Note: if you select VIEW SAVED DATA, the Realtime tab will reset – all previous data and settings will be cleared. This will happen any time you click away from the Realtime tab.
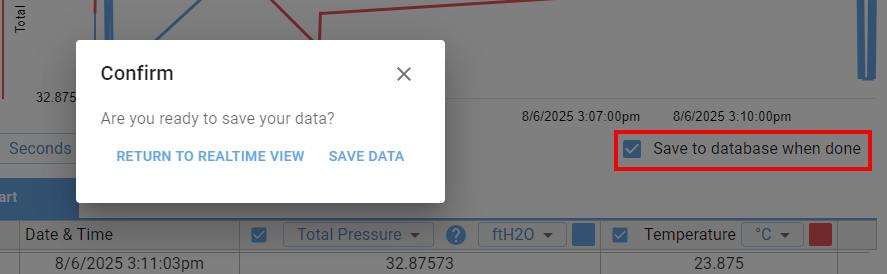
When the Save to database when done box is checked, if you try to exit the Realtime tab a window will appear giving you the option to save your data or return to Realtime view. The SAVE DATA button functions the same way as the SAVE button and your data will be added to the Data tab. Clicking RETURN TO REALTIME VIEW will keep you on the Realtime tab and the Save to database when done box will still be checked. This feature is very useful in reminding you to save your data before exiting the Realtime tab.
Note: Saving data from Realtime view is considered a “Download” and each save has a “Download Date”. Therefore, in the Data tab you can filter Realtime data based on when you saved it. For more details on how to filter by download date, see the Filtering the Data Range section.
Data Management
Data management is handled by a database that can be imported or exported as required. The data management panel is used to navigate the database. It has two main sections: Resources and Projects.
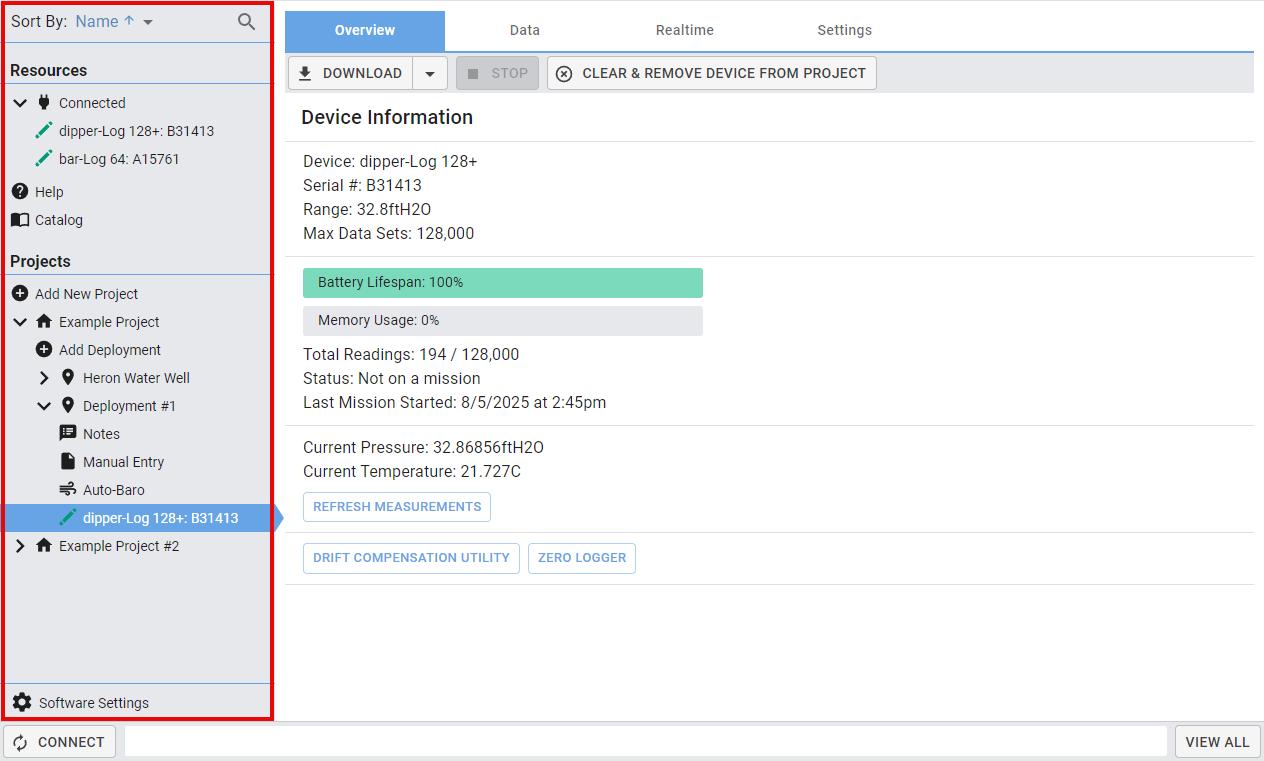
Resources
In Resources, all your connected devices will be displayed under Connected. Help will bring you to a page with troubleshooting tips, this manual, and a contact page if you need further assistance. Catalog will display the most recent version of Heron Instruments’ catalog.

Projects Overview
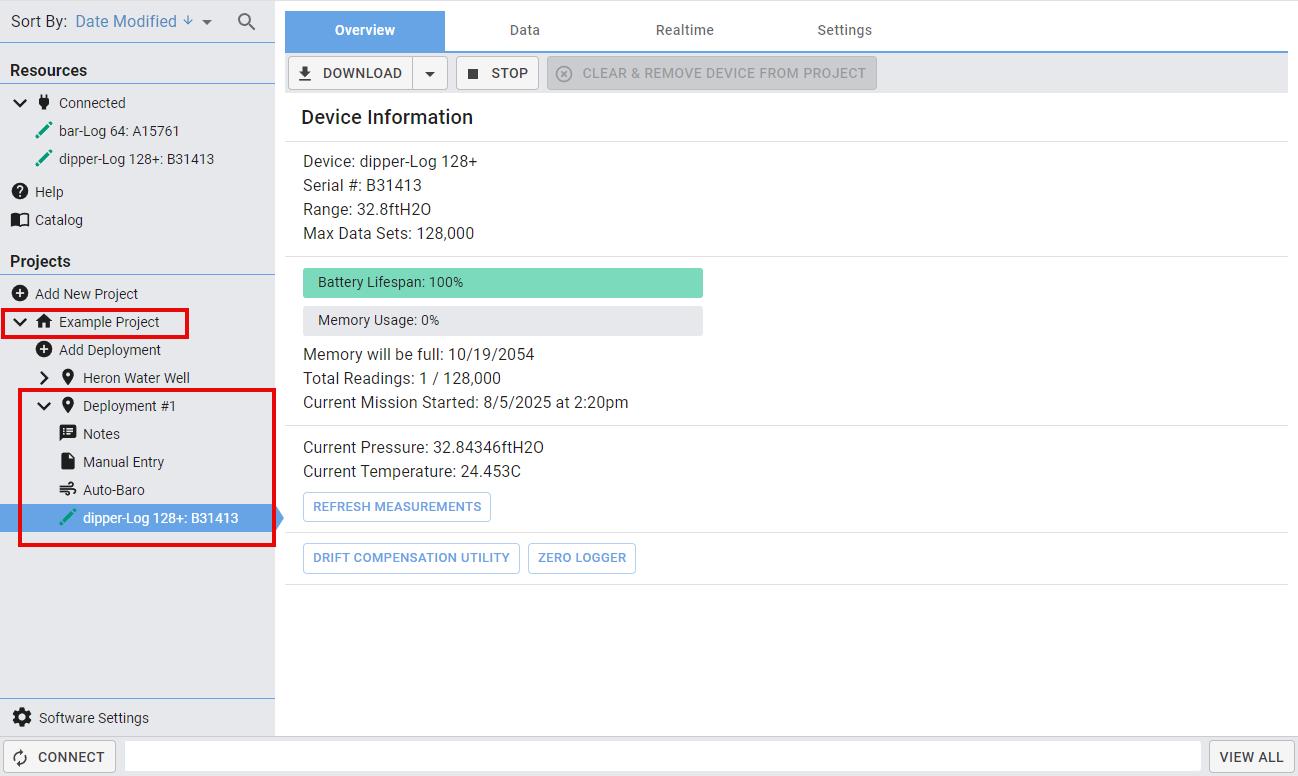
The Projects section is where all projects and their deployments are organized. Expand and collapse projects and deployments using the dropdown arrows.
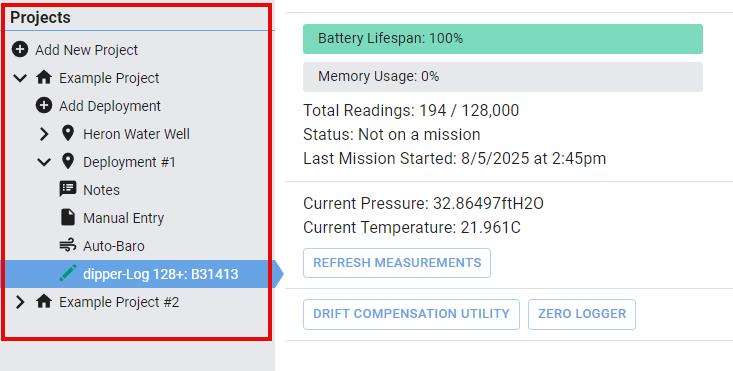
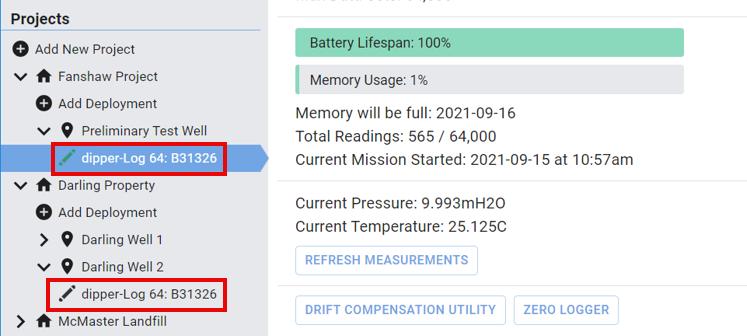
Under deployments, the devices used will be listed. Connected devices will have a green logger icon, while disconnected devices will have a black logger icon.
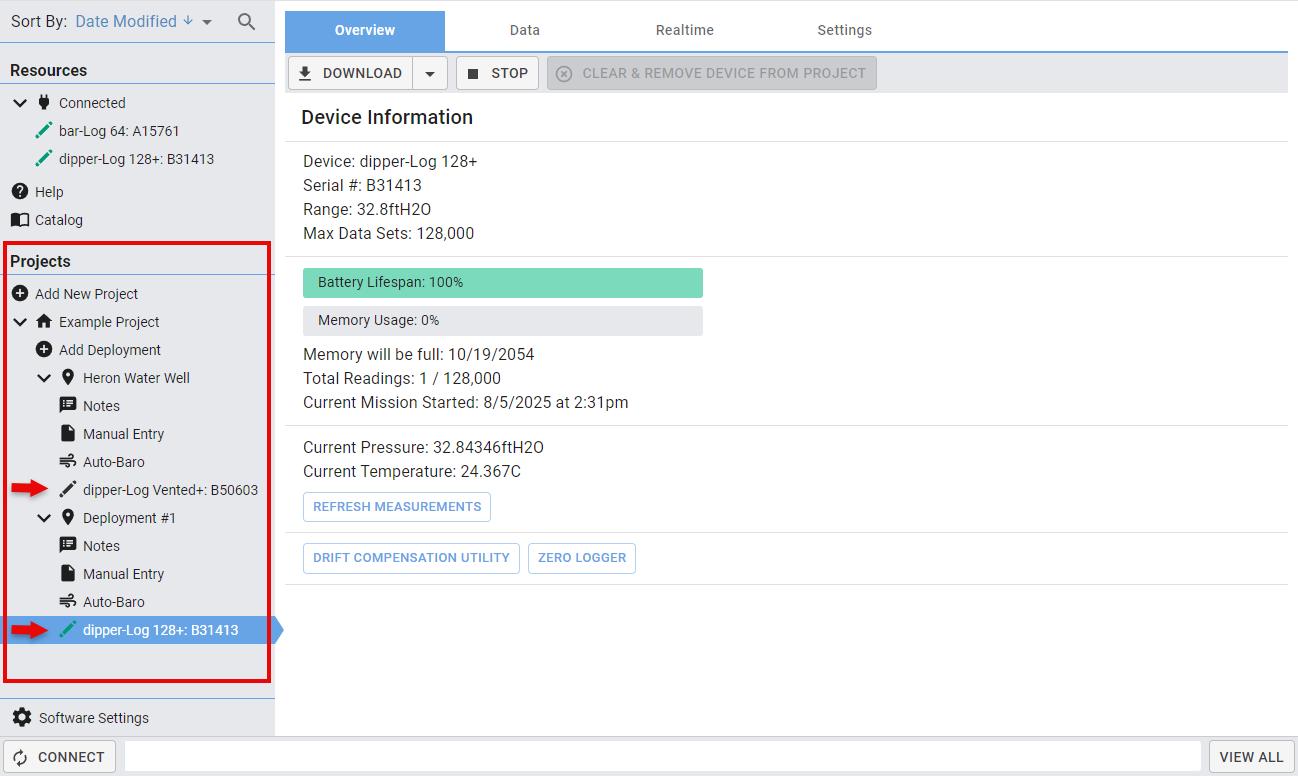
If a logger has been used in multiple projects, it may appear multiple times in the Projects section. When connected, the current project the device is assigned to will have the green logger icon, while older projects will have the black logger icon. This means that even though the device is connected, it is no longer assigned to that project.
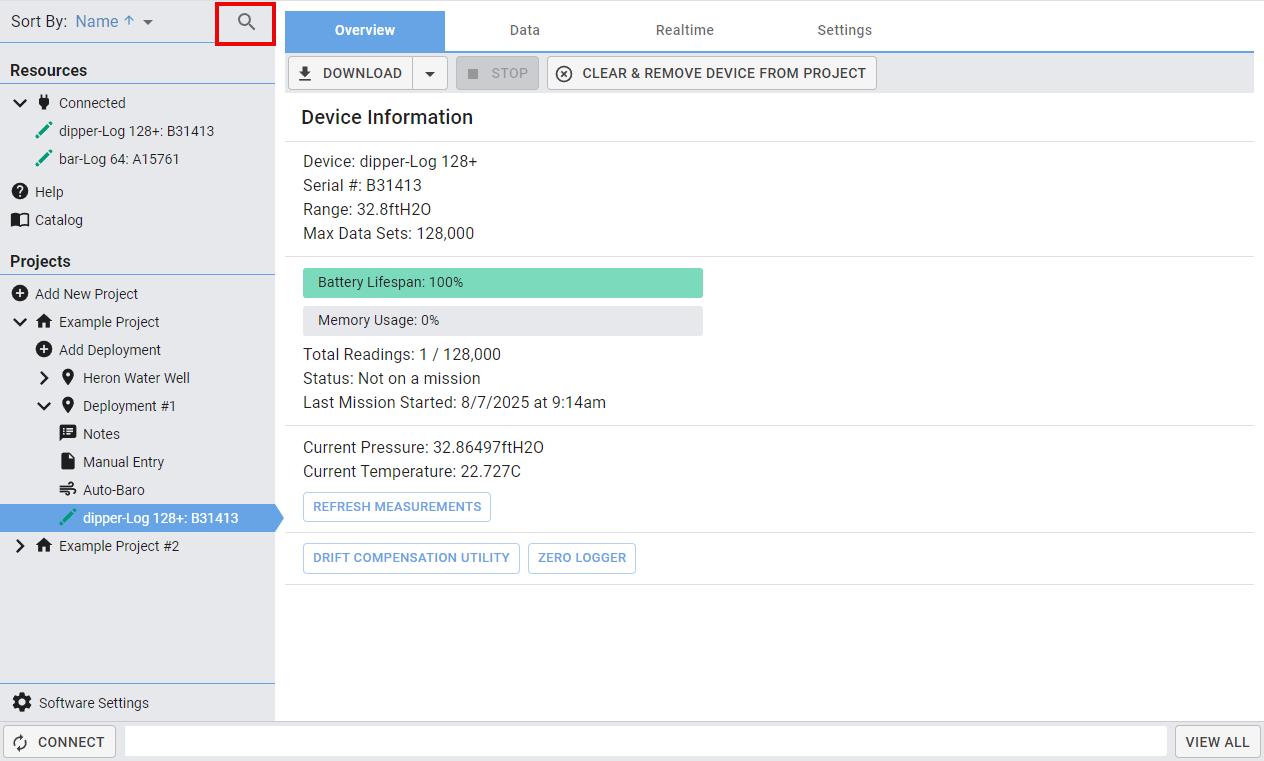
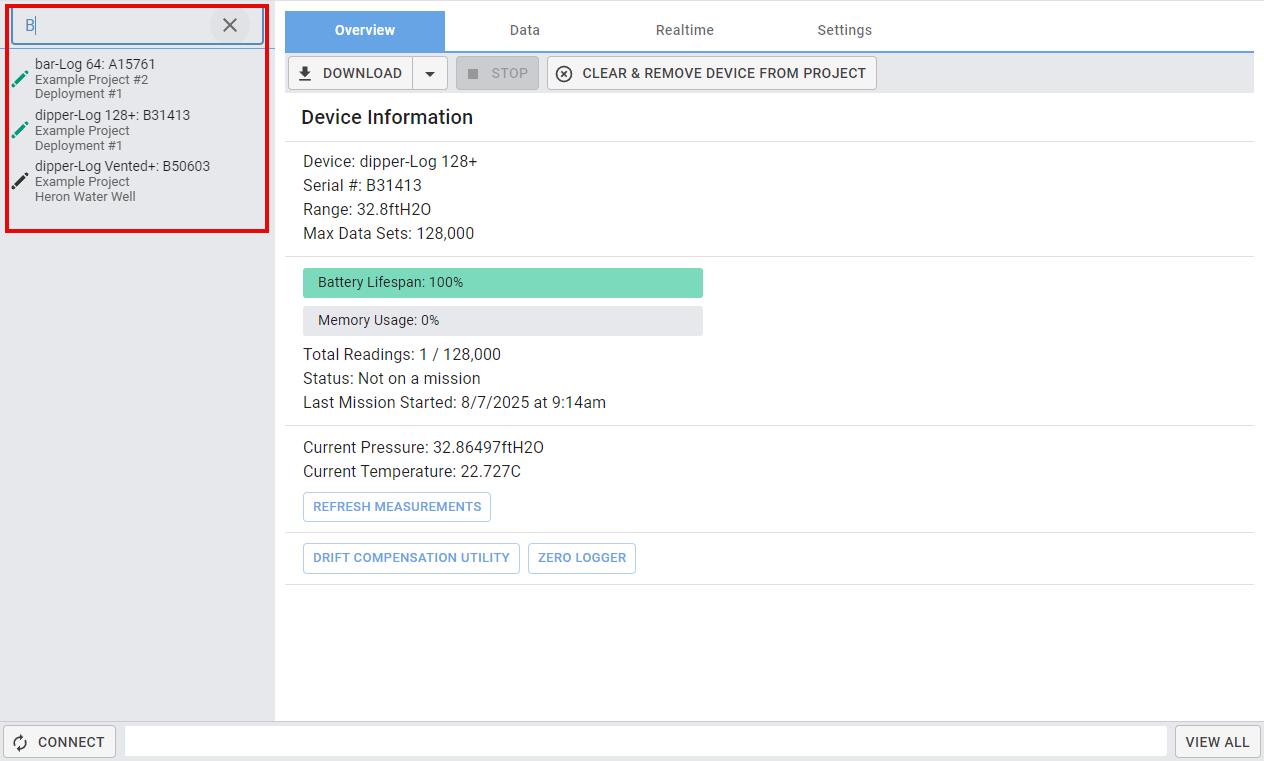
Search for projects, deployments and devices using the search feature at the top of the Data Management Panel.
Organizing the Projects
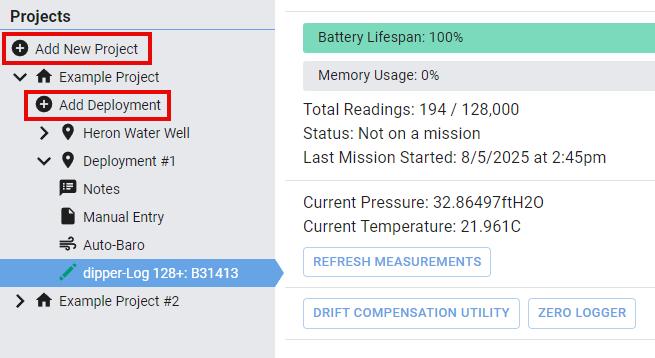
On the Data Management panel use the Add New Project button to create new projects. Within the projects, use the Add Deployment button to create new deployments. Note: Devices will not yet appear under newly created sections until they are assigned in device setup.
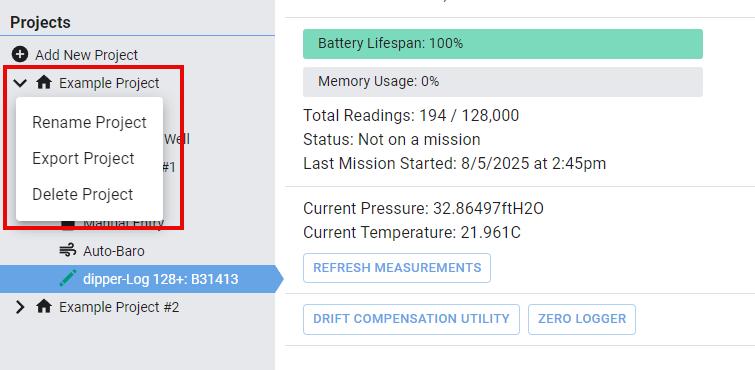
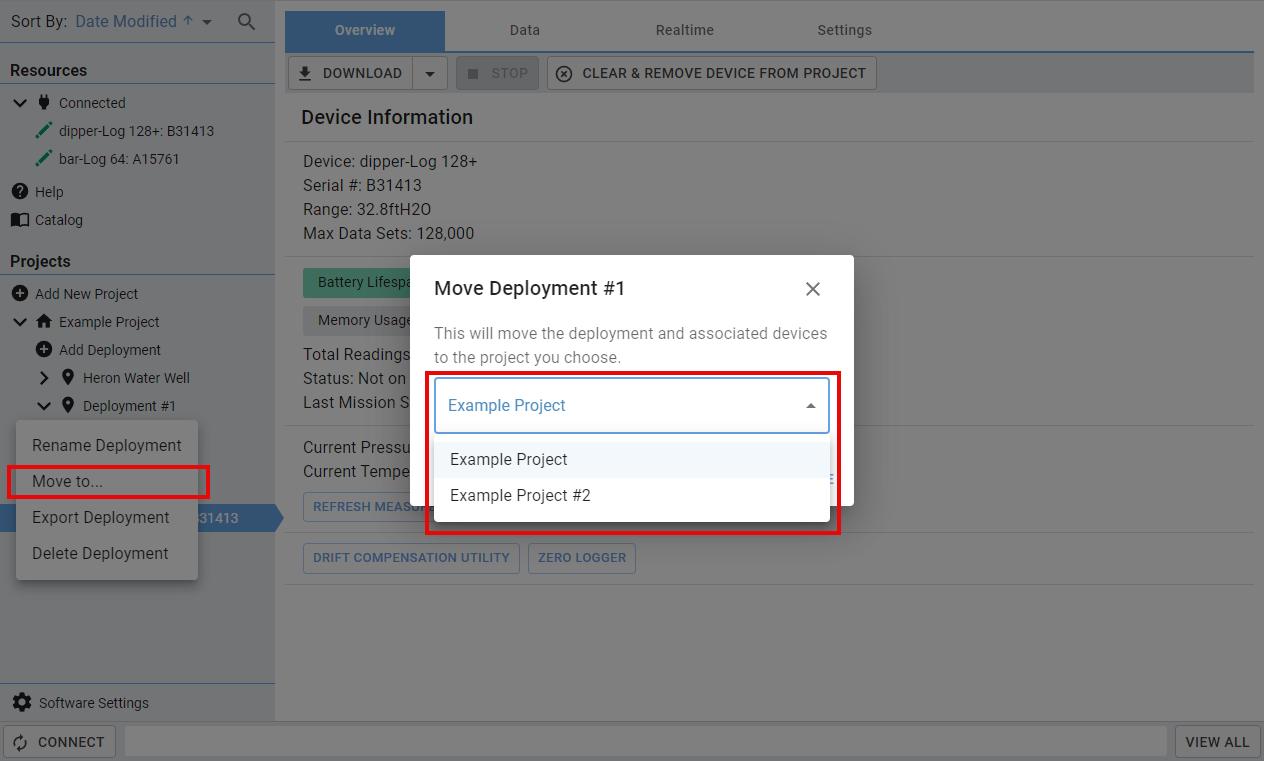
Right-click on any project or deployment to rename, export or delete it. More information regarding importing and exporting can be found in the Importing and Exporting the Database section. For deployments, when you right-click there is also a Move to option. This allows you to move a deployment to a different project by selecting an existing project from the dropdown list.
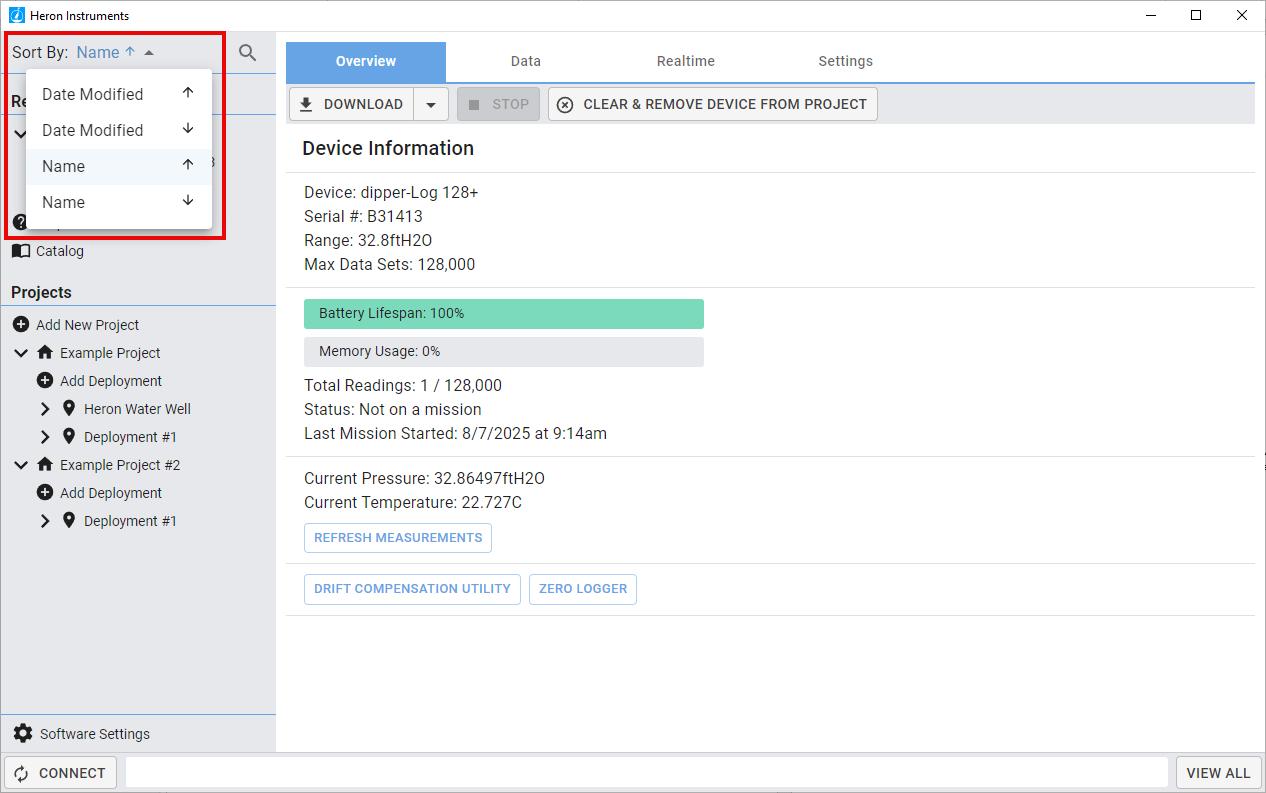
Sort your projects in the data management panel by Name or by Date Modified using the dropdown menu in the top left-hand corner of the screen. Note that this does not sort the order of deployments within the project – they remain in the order that they were added.
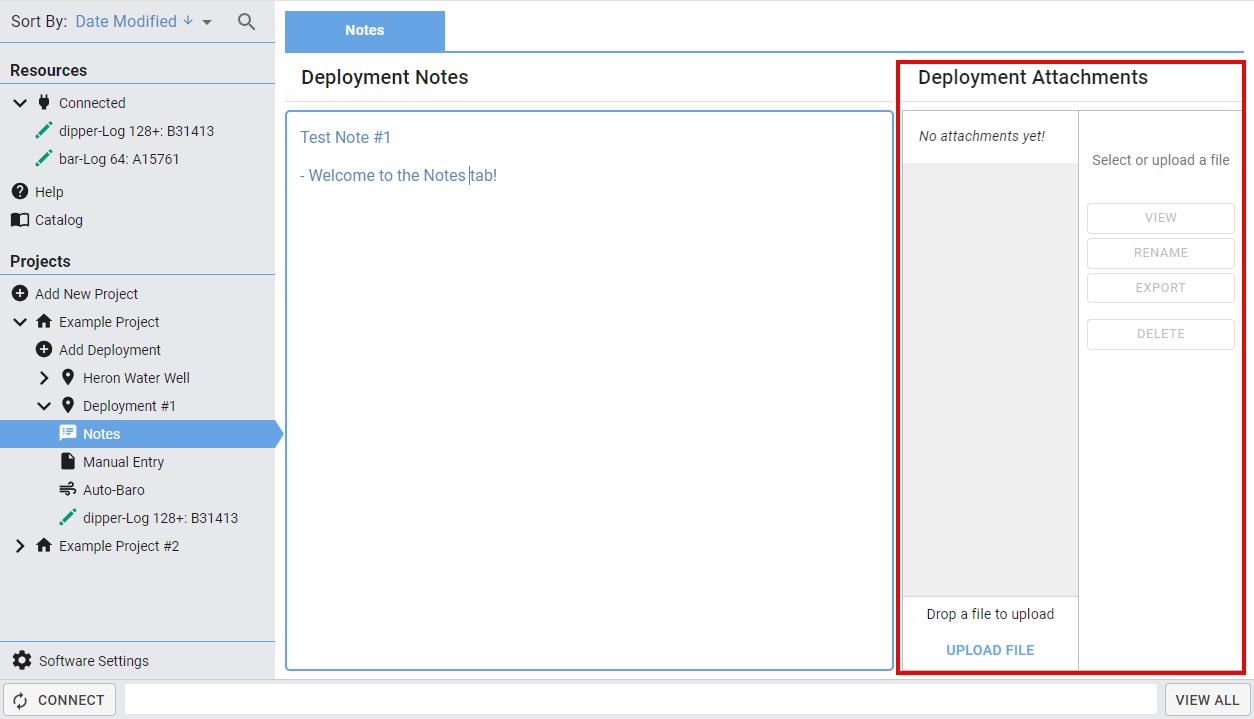
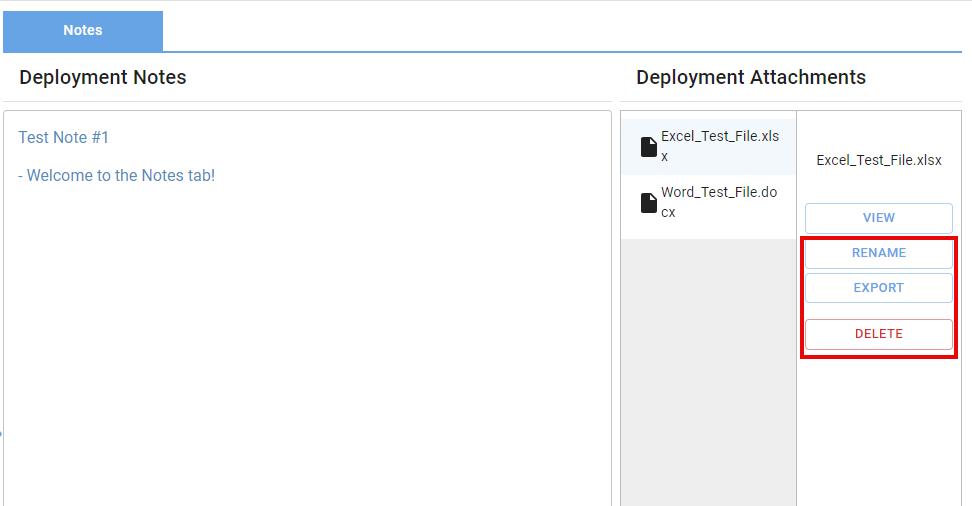
Notes Tab
Within each deployment there is a Notes bar After clicking on Notes, you will be brought to the Notes tab. It has two sections: Deployment Notes and Deployment Attachments The main space under Deployment Notes is a text box to jot down your notes.
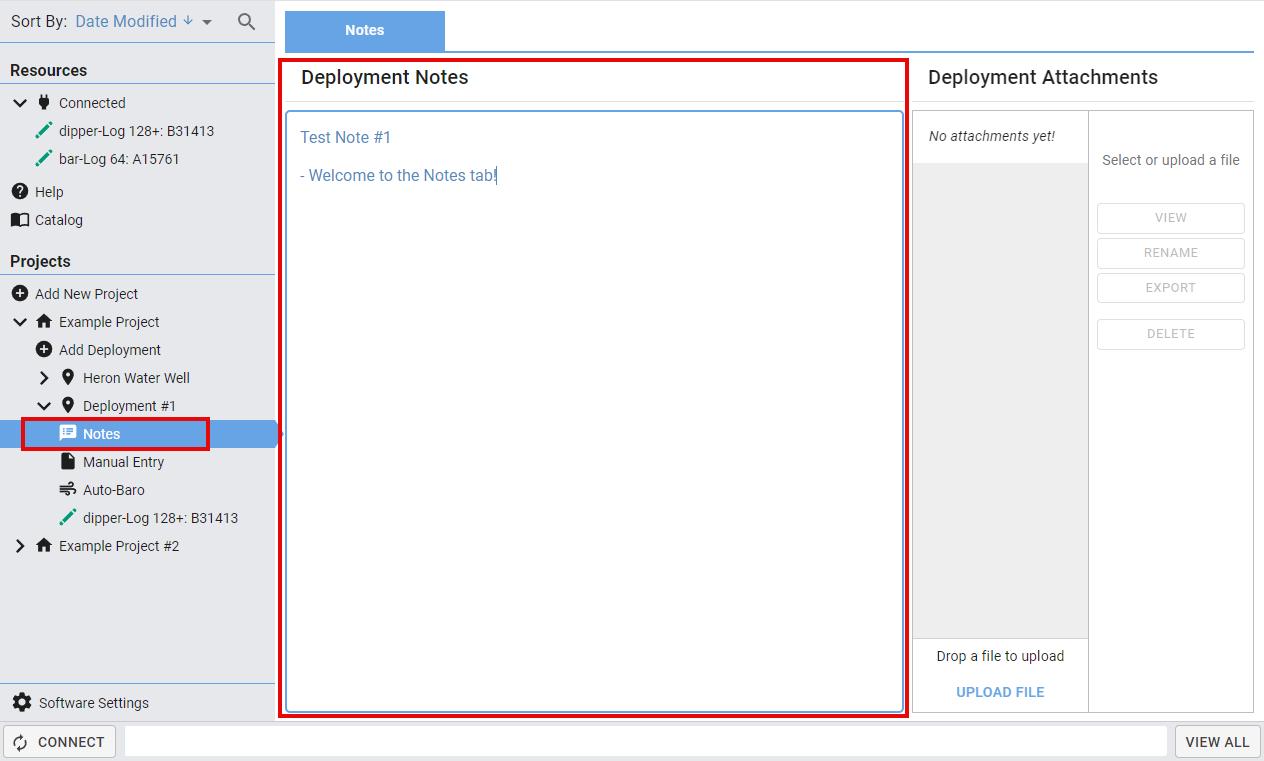
The Deployment Attachments section allows you to upload files and store them within a deployment for easy access.
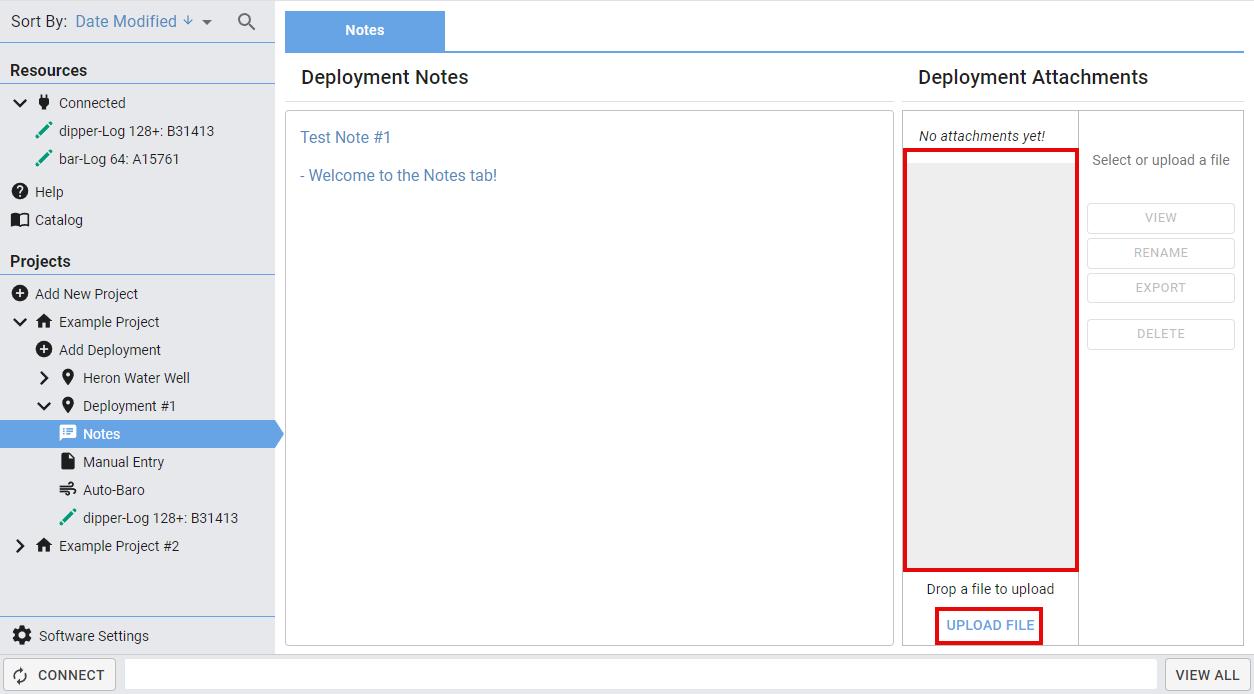
Uploading a File
To upload a file, click the UPLOAD FILE button and select the file from your computer or drop a file into the gray region Note: You can select/drop multiple files at once.
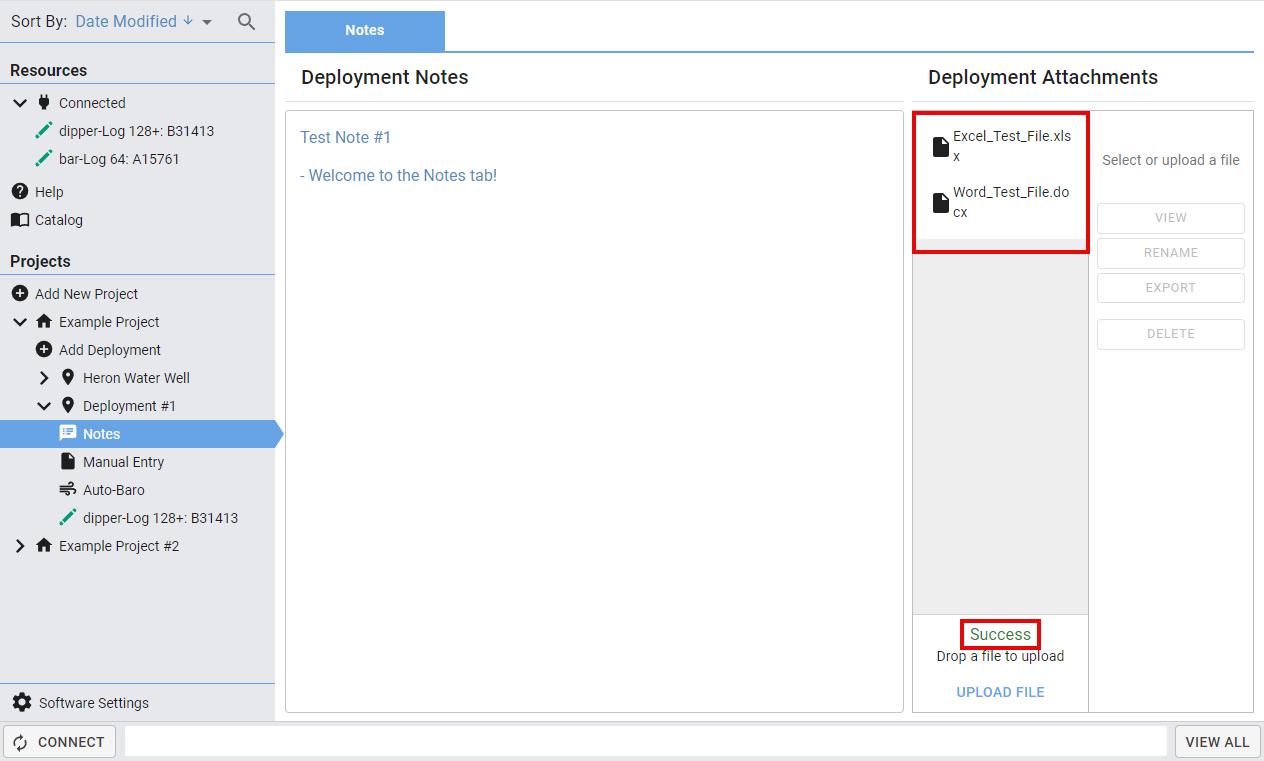
Once the file has been uploaded, you will receive a “Success” message, and your file will be listed in the gray region.
Viewing a File
Select the file and click on the VIEW button. This will export the file and open it using the appropriate app on your computer. Note: If you edit the file, the changes will not be stored in the Heron Instruments software, and the file will need to be reuploaded.
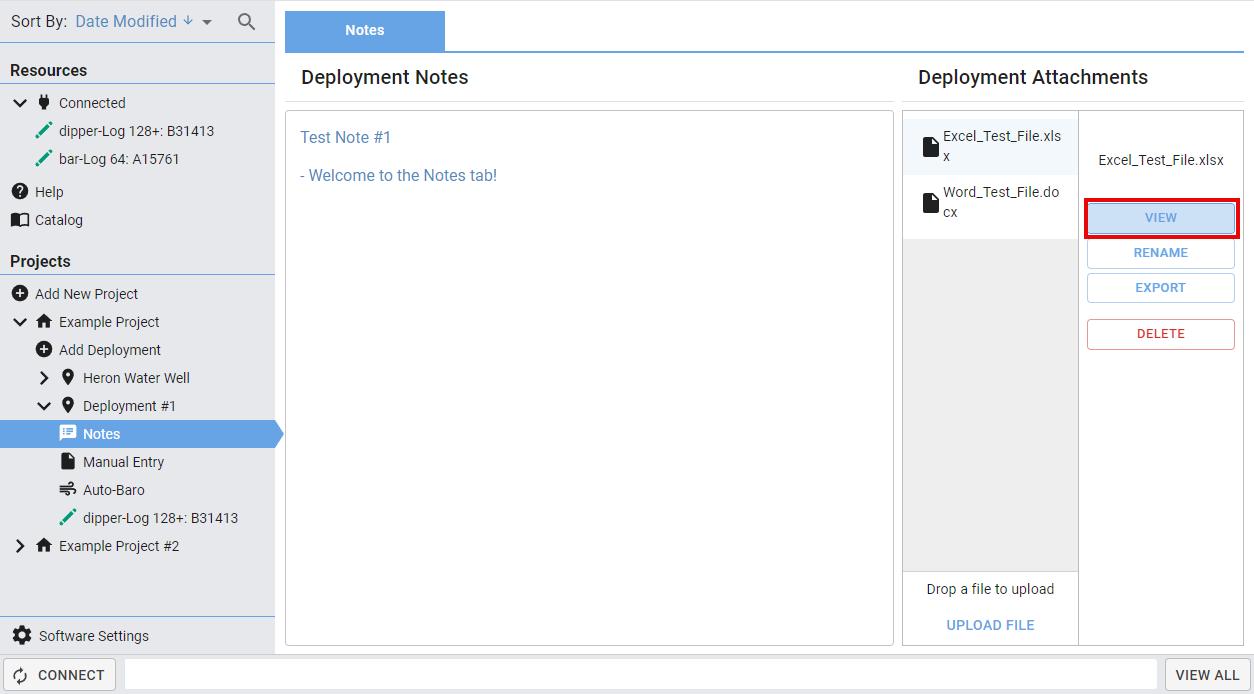
Renaming, Exporting and Deleting a File
Rename, export or delete a file by selecting it and clicking the applicable button.
Importing and Exporting the Database
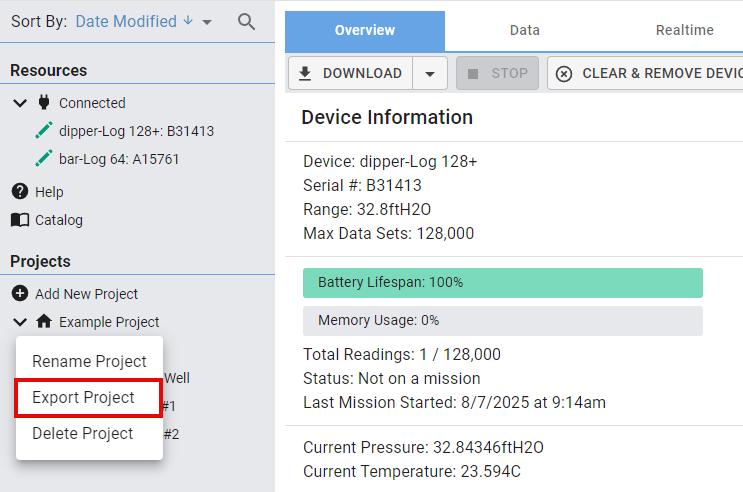
Exporting Projects and Deployments
In the data management panel, right-click on the project/deployment and click Export Project/Deployment. Name the file and save it to your computer.
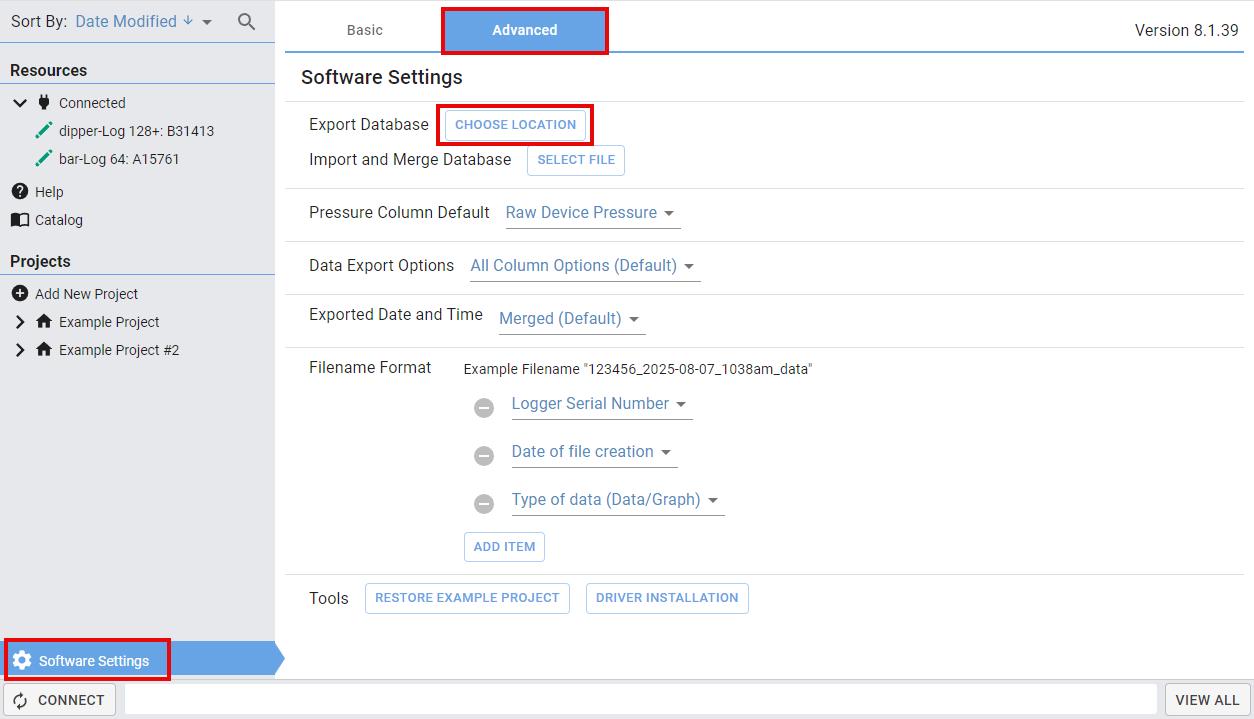
Exporting the Entire Database
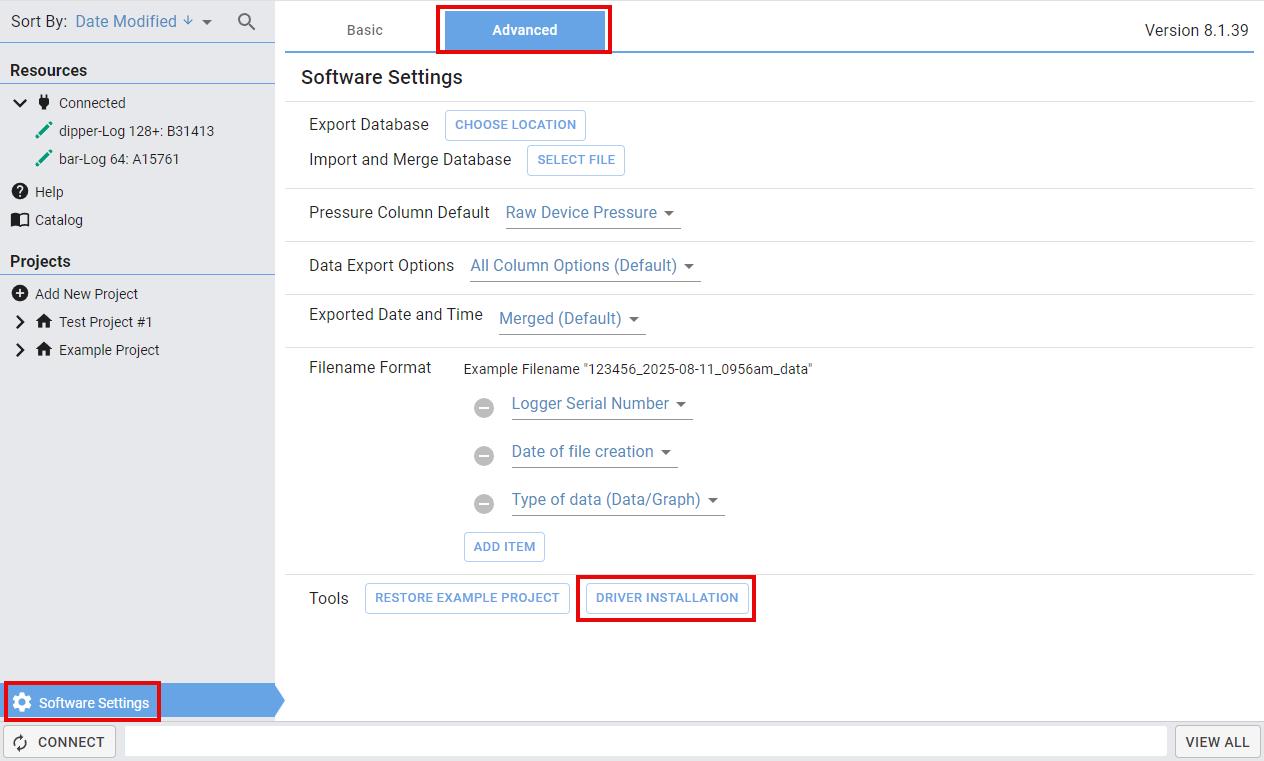
Click on Software Settings in the bottom left-hand corner of the screen. Click on the Advanced tab and beside Export Database click on the CHOOSE LOCATION button. Name the file and save it to your computer.
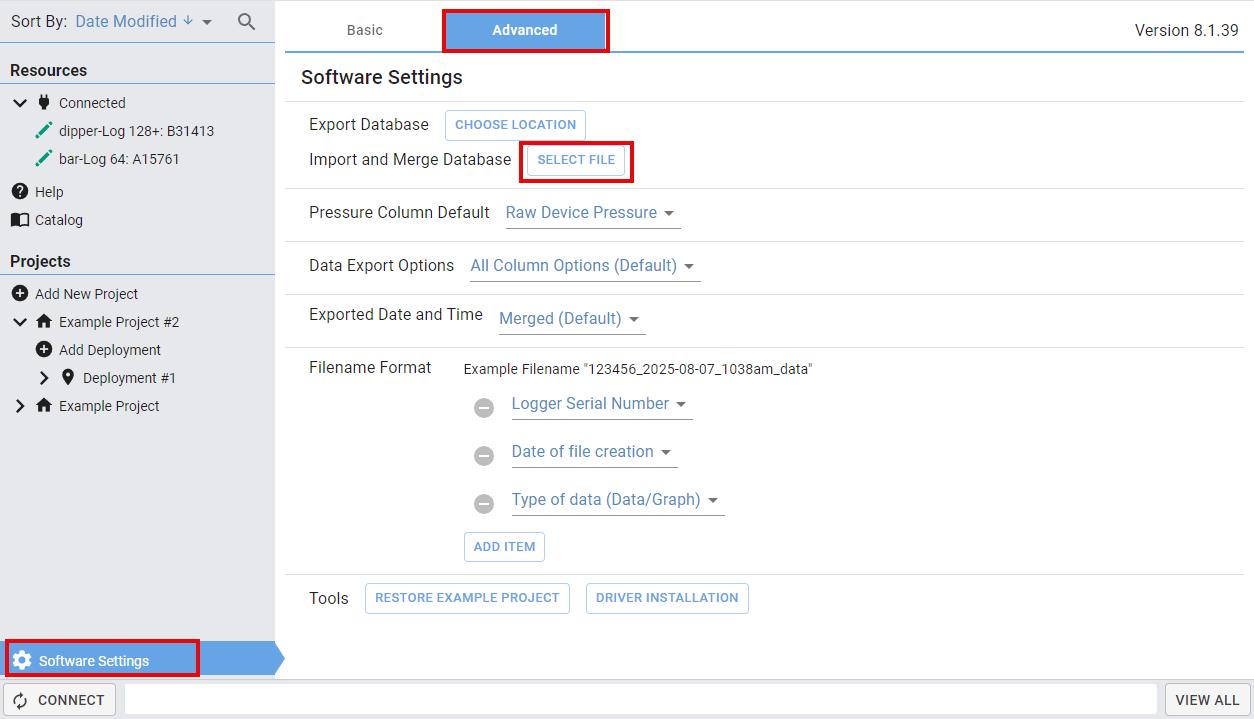
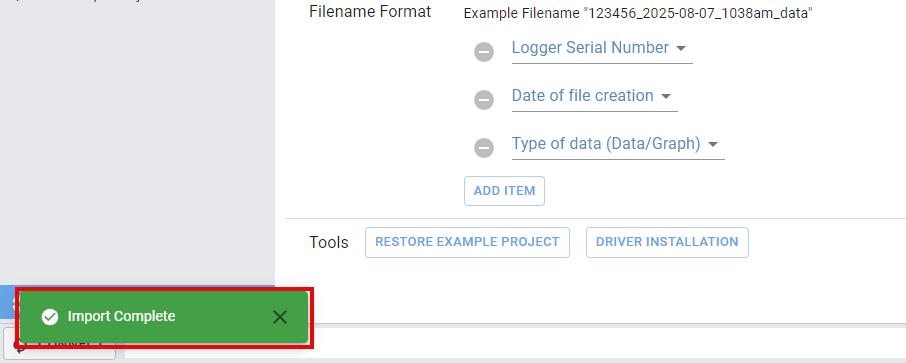
Importing Heron Database Files
In Software Settings, go to the Advanced tab. Beside Import and Merge Database, click on the SELECT FILE button. Choose your Heron Database file and it will be uploaded to the software. Once completed you will receive an “Import Complete” message, and your imported project/deployment will be visible in the data management panel.
Stopping a Mission and Clearing a Logger
Between missions, it is important to stop and clear the logger to conserve battery especially if storing for extended periods of time. This is also required if you would like to assign a logger to a different project.
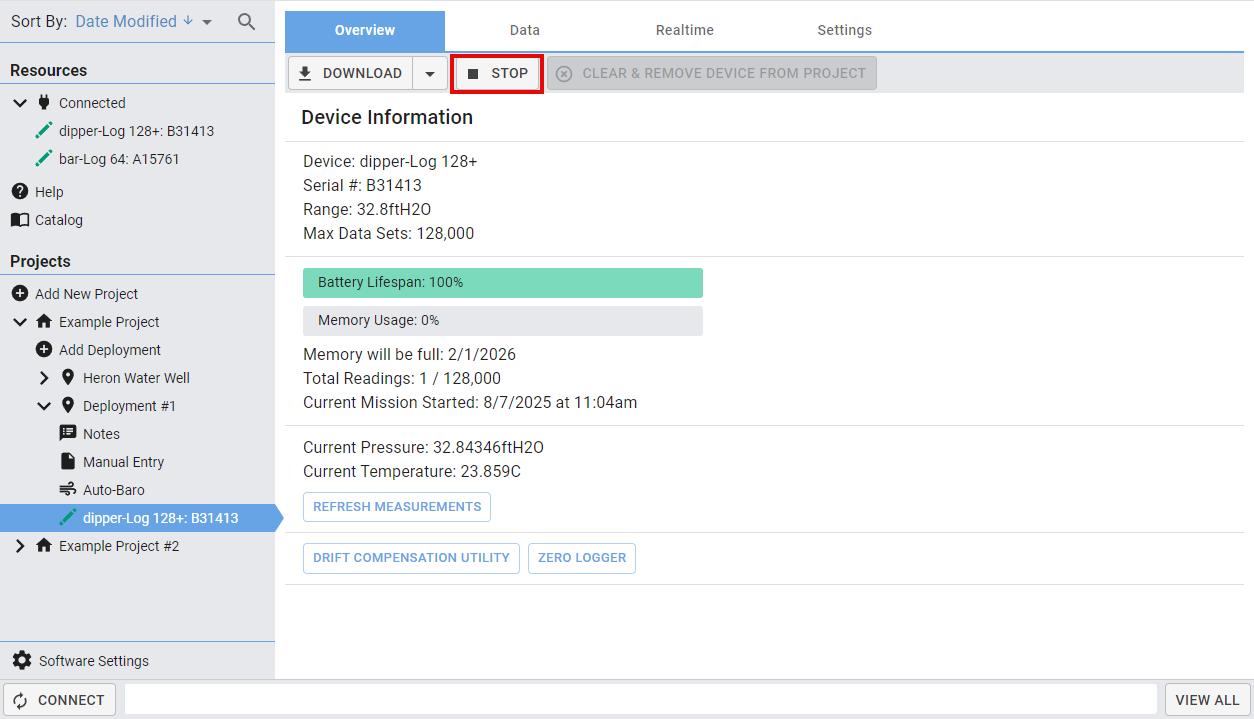
Stopping a Mission
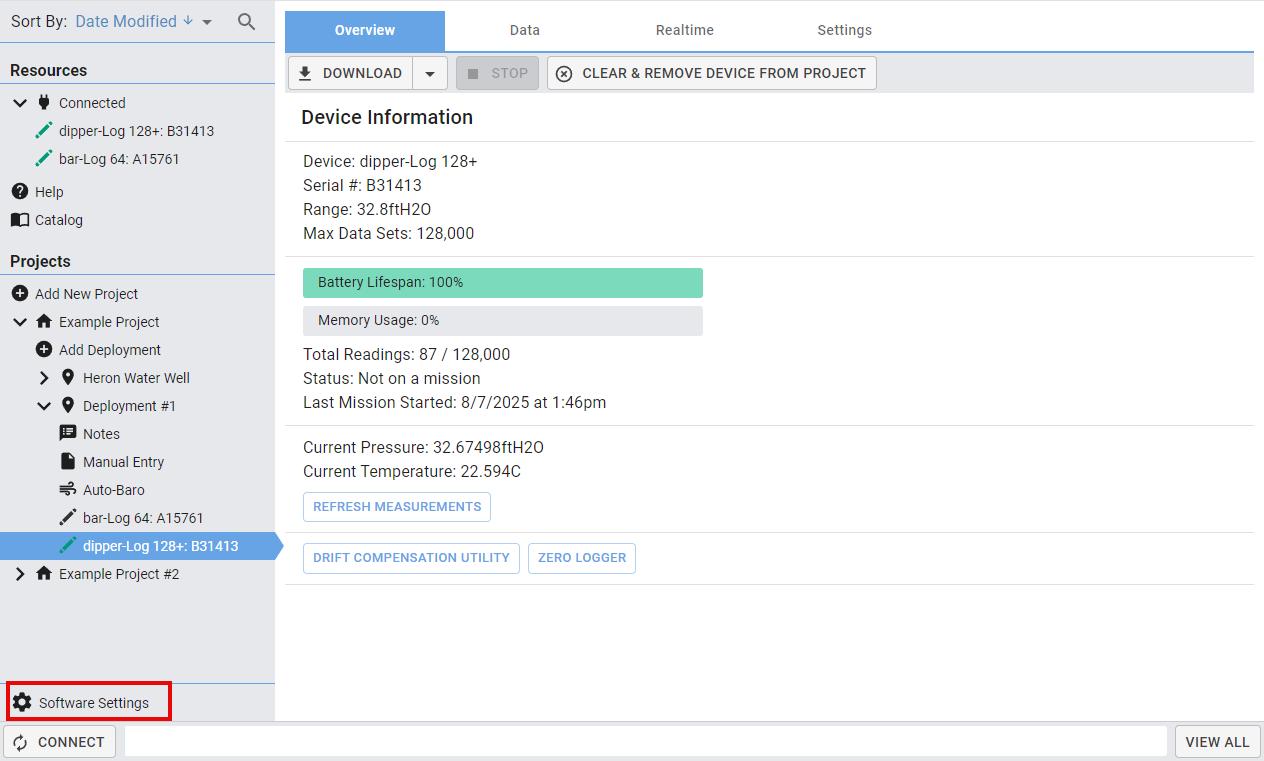
On the Overview tab of the device, click the STOP button. A confirmation window will appear, click STOP LOGGER.
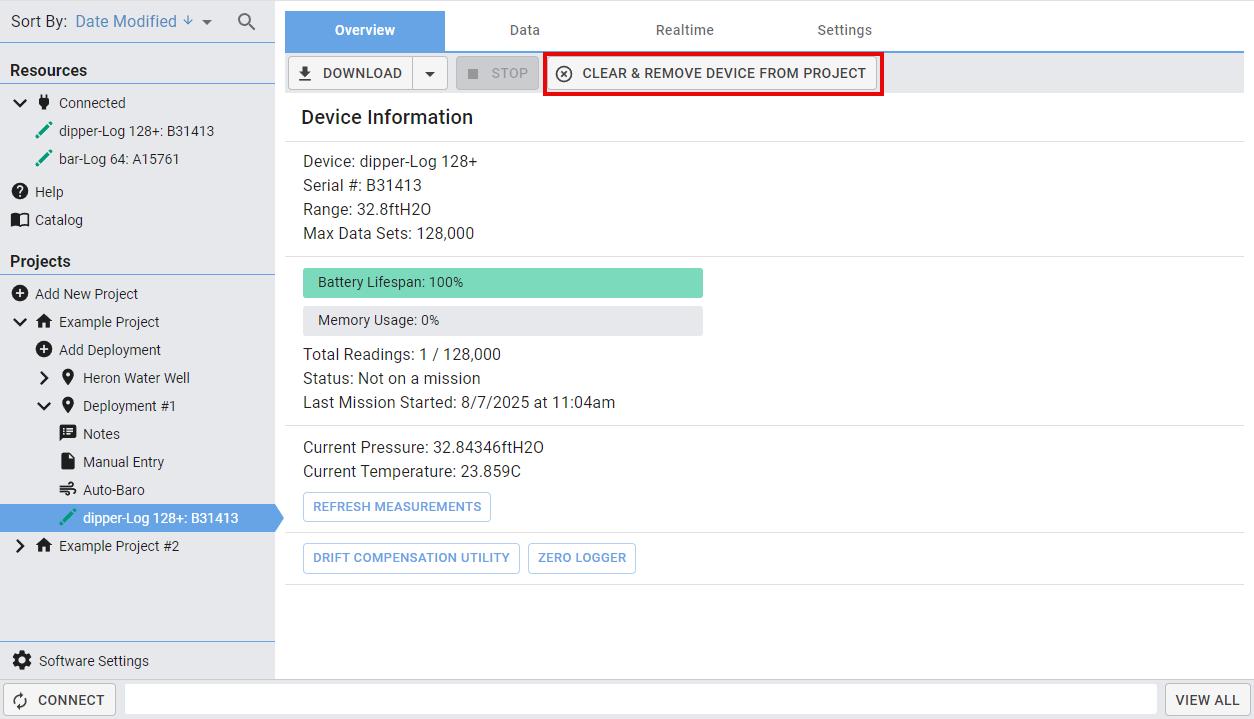
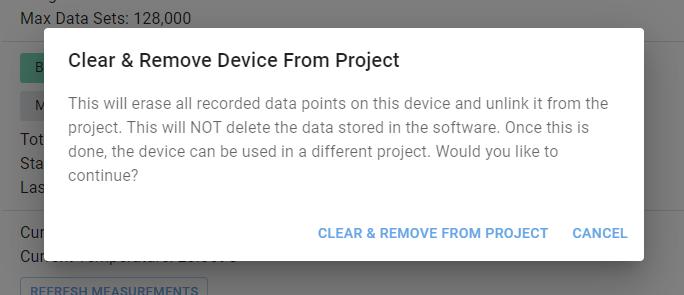
Clearing a Logger
Before clearing a logger, ensure you have downloaded the data to the software Data stored on the logger cannot be recovered after clearing.
Click the CLEAR & REMOVE DEVICE FROM PROJECT button. A confirmation window will pop up. Click on CLEAR & REMOVE FROM PROJECT
Auto-Baro
Auto-Baro is a free, internet-connected service that automatically collects barometric data from nearby weather stations. It uses barometric pressure datasets that best match your chosen location to adjust your dipperLog readings for barometric pressure. When reliable data is available, Auto-Baro can improve the accuracy of your measurements without the need for extra equipment or added effort. The AutoBaro data updates automatically whenever you're connected to the internet.
Selecting a Location
The Auto-Baro feature is specific to the deployment (i.e. you can have different Auto-Baro locations for different deployments). However, all devices in one deployment will have the same Auto-Baro location. If one device’s location is changed, the location of all other devices in that deployment will be updated.
Setting the Location When Starting a New Mission
Select your device and go to the Settings tab. Click on the SELECT LOCATION FOR AUTOMATIC BARO COMPENSATION button. Select one of your recent locations or click on NEW LOCATION
If selecting a new location, start typing the address of your deployment location and select an option from the dropdown menu. The coordinates will populate in the lower right-hand corner, then click SAVE. Select your recently added location and click SAVE. Your deployment location will now be displayed on the Settings tab.
Setting the Location After the Mission Has Started
In the data management panel, navigate to your desired deployment. Click on Auto-Baro and then the Settings tab.
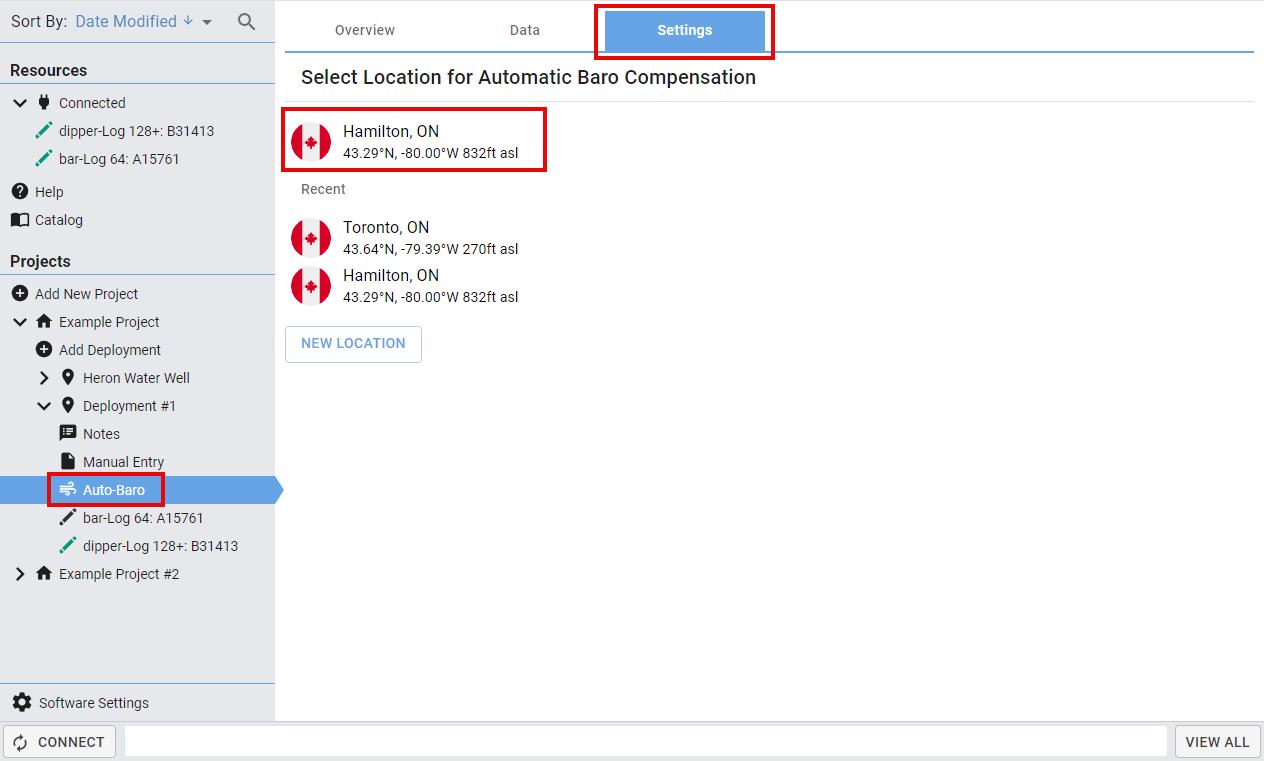
Select one of your recent locations or add a new location. The current location is the one at the top of the list (above the Recent header).
Auto-Baro Data Tab
The Auto-Baro Data tab is similar to the Data tab for any logger. It displays a chart and graph along with the same filter features and tools. For instructions on modifying and exporting the chart/graph, filtering, and more tools please see the Viewing and Refining the Data chapter.
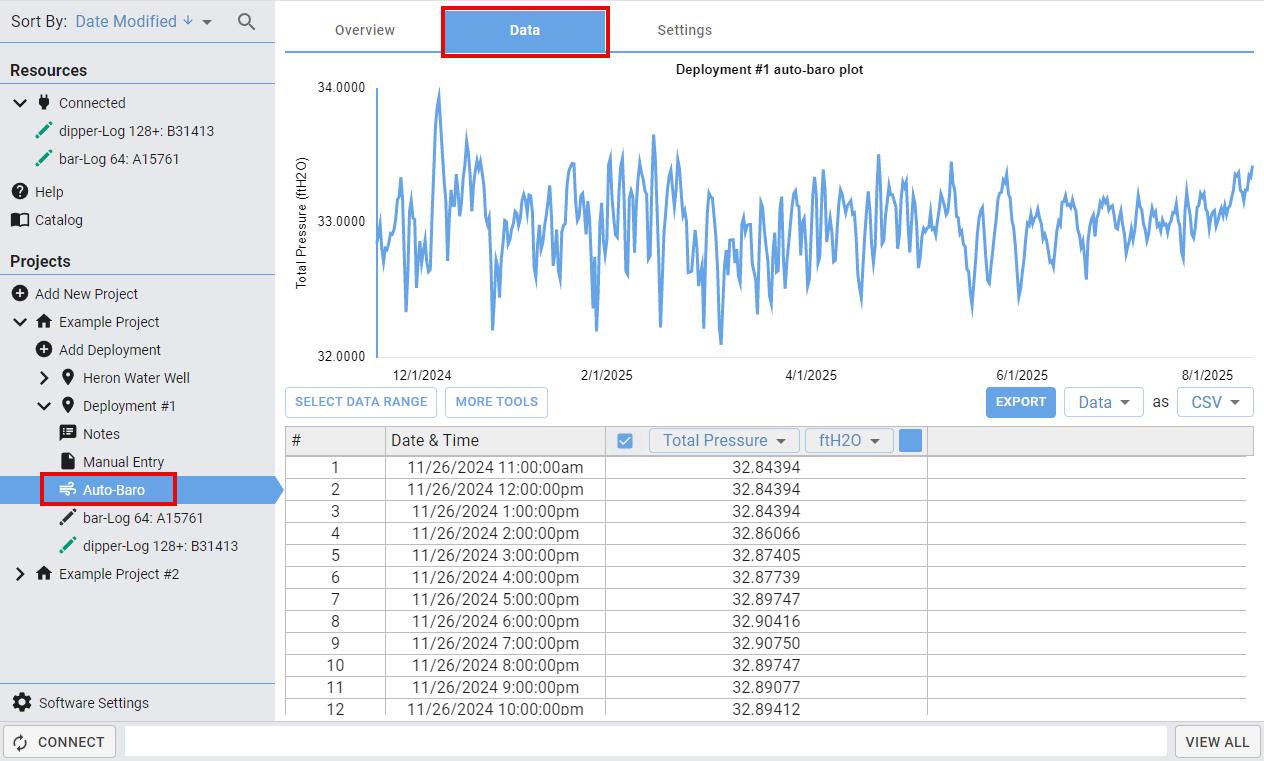
Upon initialization, Auto-Baro will download barometric data up to the oldest data point across all devices in the deployment. Auto-Baro takes one reading per hour and updates the Data tab every time it connects to the internet This data is stored in the software’s database
Applying Auto-Baro for Data Compensation
Select your device and open the Data tab. Click on the Select bar-Log button and choose Auto-Baro from the dropdown list.
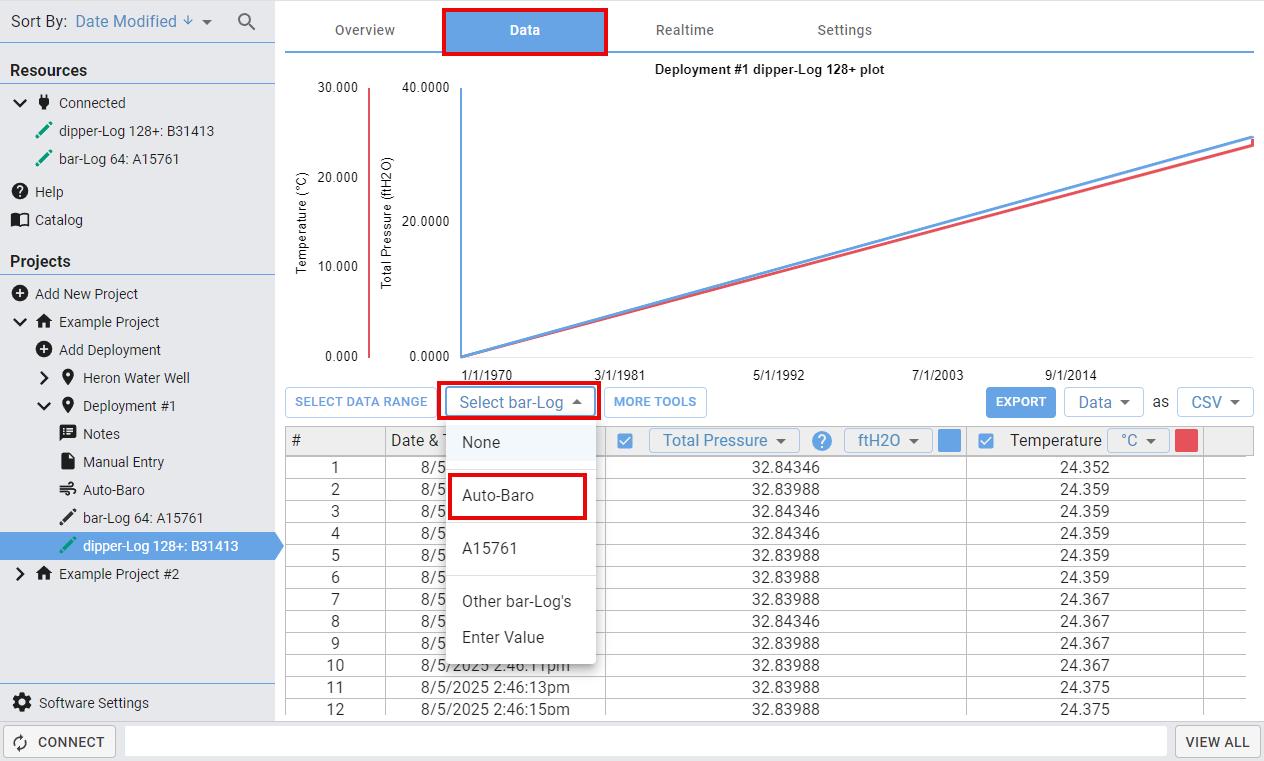
The field box will indicate that Auto-Baro is being used as a source for barometric pressure.
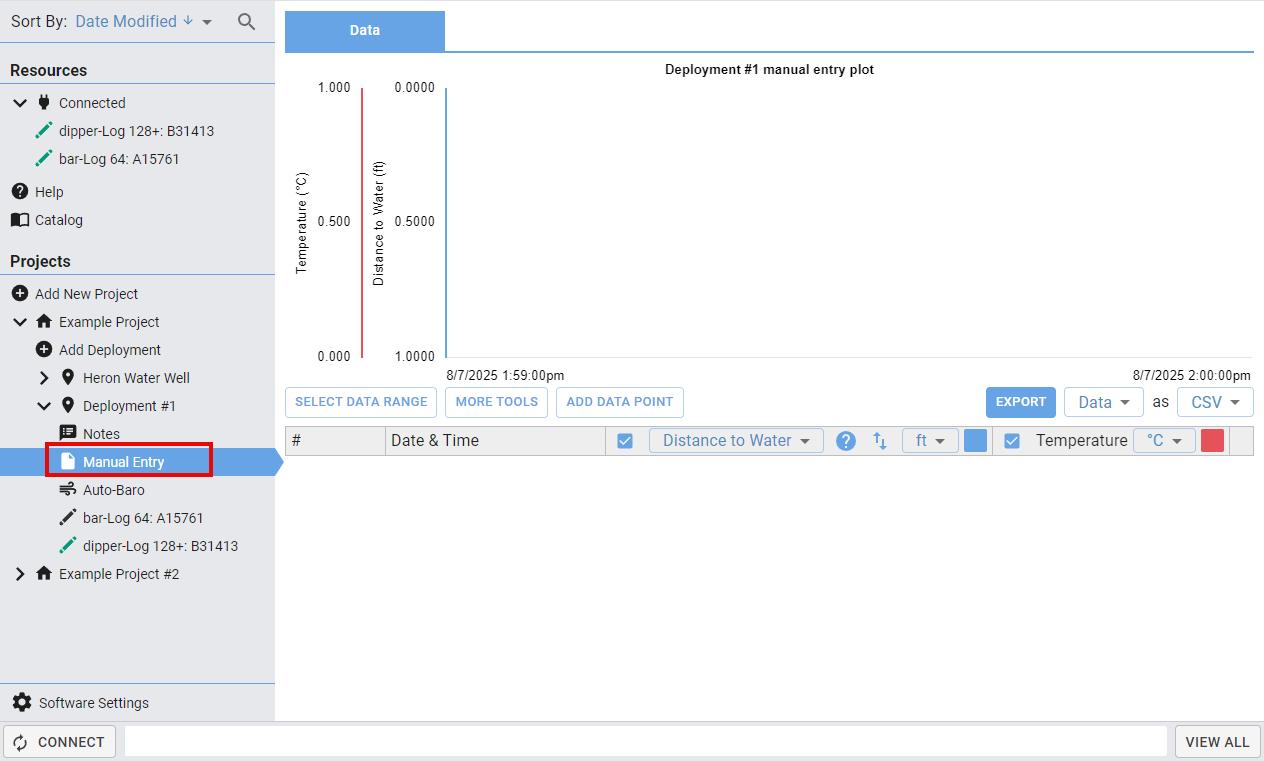
Manual Entry
Within every deployment there is a Manual Entry tab. It allows you to manually add data points collected using a water level meter. These can then be used to adjust logger readings in the Data tab.
For instructions on modifying and exporting the chart/graph, filtering, and more tools please see the Viewing and Refining the Data chapter.
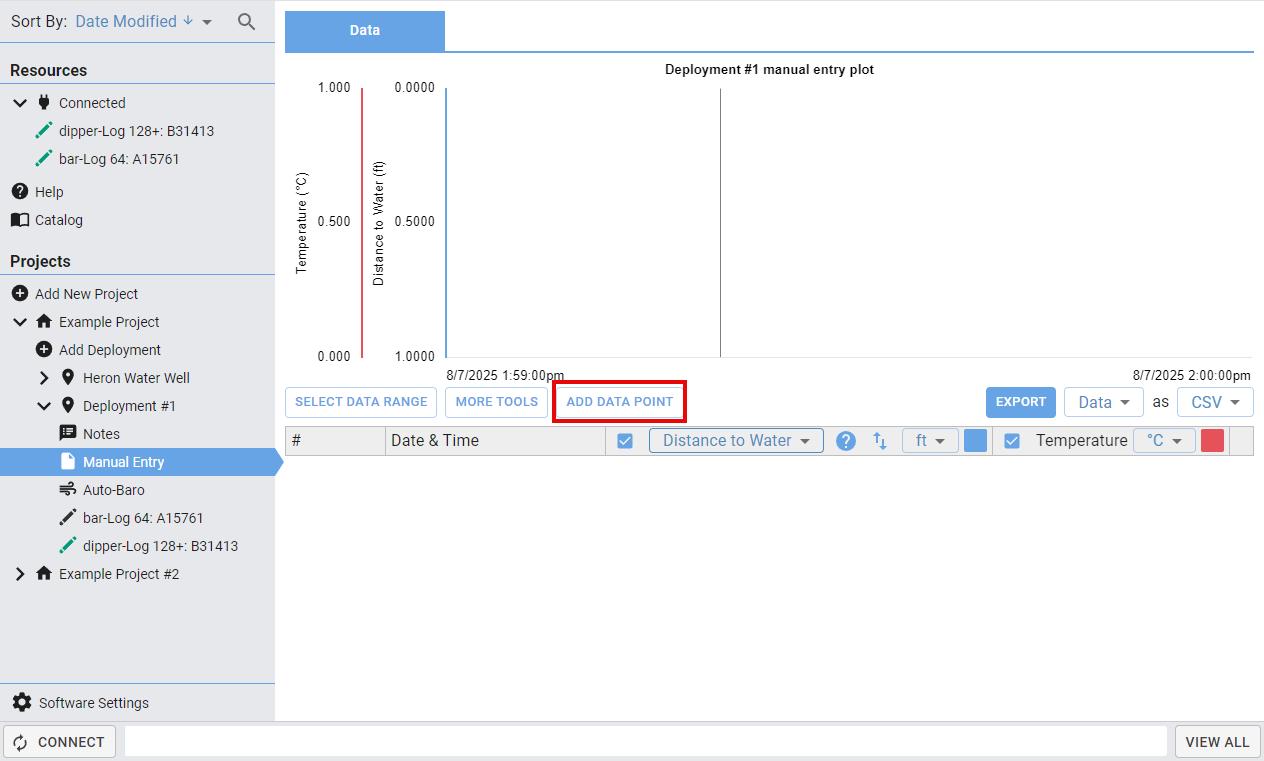
Adding Data Points
To add a data point, click on the ADD DATA POINT button Select the parameter (Distance to Water or Temperature), enter the value, and input the timestamp Press ADD DATA POINT to add it to the database.
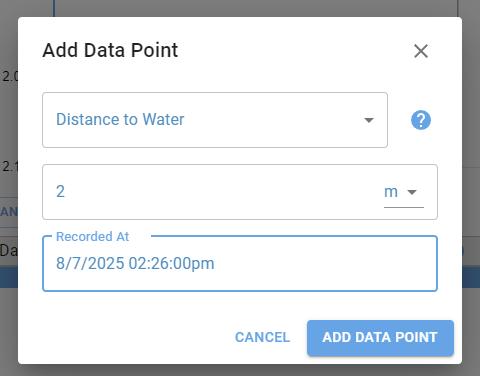
Note: Data can only be input for one parameter at a time. Therefore, to add a datapoint with both parameters, repeat the process – now selecting the other parameter. Ensure that the timestamps match to create one single datapoint.
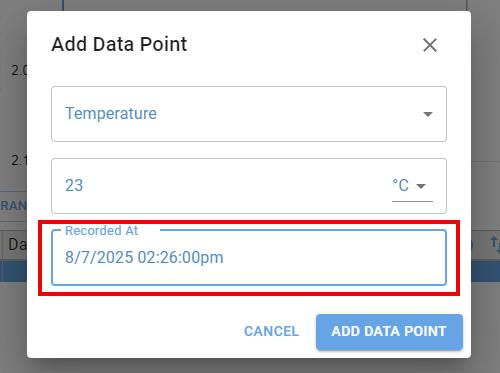
Note: Adding additional entries with the same timestamp will overwrite existing ones. Therefore, data points must be at least one minute apart (as you cannot edit the seconds in the timestamp).
Adjusting Logger Data to Match Manually Entered Data
Once you've entered your manual data, the software uses it to adjust the logger readings. It identifies the two closest data points in time one from the manual data and one from the logger. Then it calculates the difference between their values and applies that difference as a shift to all logger data. For example:
Timestamp
Logger
Distance to Water
8/7/2025 03:05:15pm 9m
Manual Entry 8/7/2025 03:05:00pm 8m
The software identified these two data points were the closest in time. Therefore, 1m would be subtracted from all the Distance to Water values in the logger dataset.
See the More Tools section on how to apply this adjustment.
Other Features and Tools
Drift Compensation
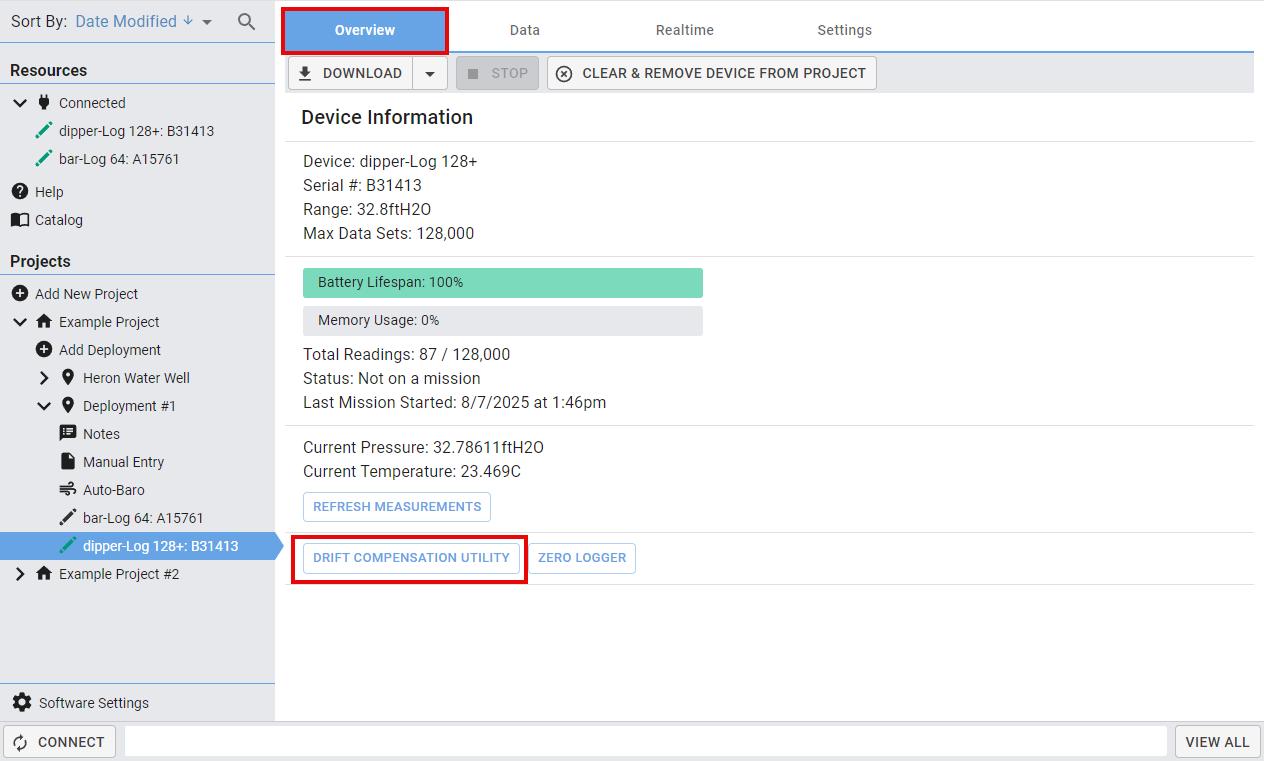
Drift Compensation is a basic correction tool for pressure transducers that may have experienced drift over time. It is also used for achieving higher accuracy in extremely low water level conditions. This feature is only available when the logger is connected.
Select the device and go to the Overview tab. Click on the DRIFT COMPENSATION UTILITY.
Configuring the Tool
To configure the tool, you will need two data points that you can accurately expose your logger to while taking a real-time reading. Both values must be in the logger’s original range.
In the Actual Value column, enter the values the logger is expected to provide. In the Device Value column, enter the values currently being recorded by the device. The graph will reflect the transformations needed. Press SYNC NOW to save your changes.
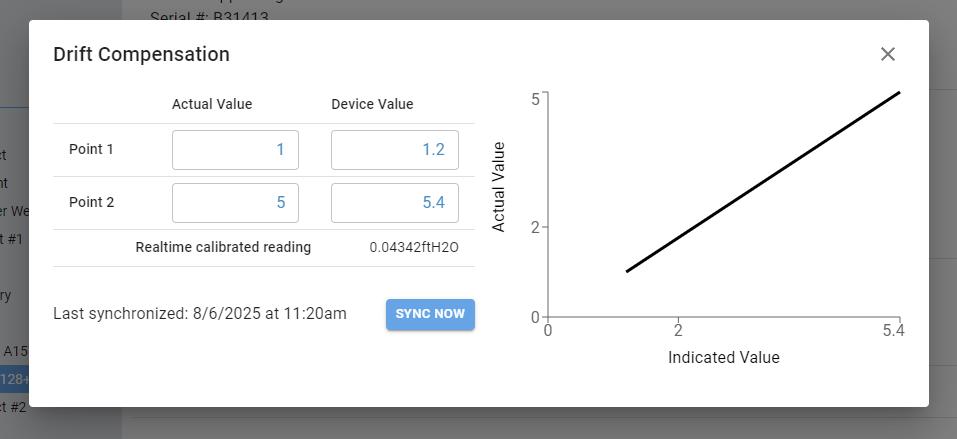
If you need to make changes to the tool, click on DRIFT COMPENSATION UTILITY; your previous values will still be displayed. Update them as necessary and press SYNC NOW.
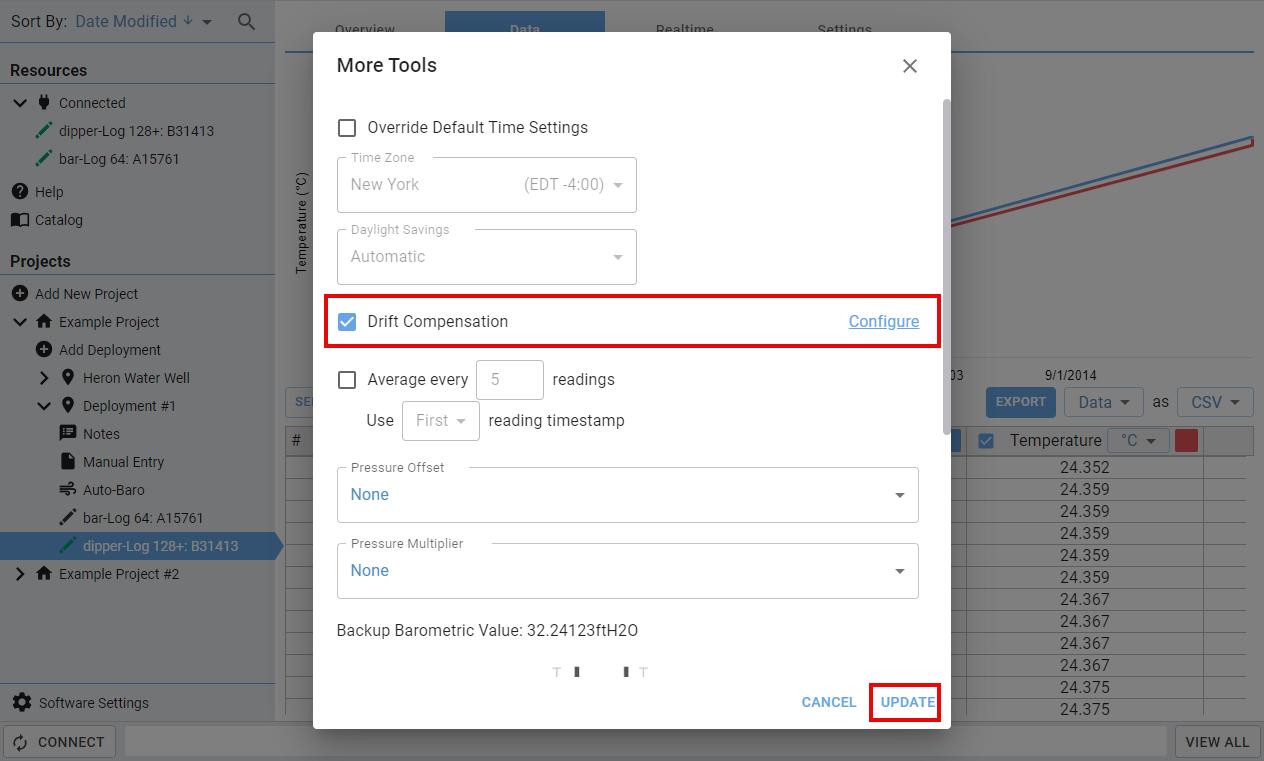
Applying the Drift Compensation to Your Data
Navigate to the Data tab and press MORE TOOLS. Check the Drift Compensation box and click UPDATE to apply it to your data. You can also configure the tool from the MORE TOOLS menu by clicking on Configure.
This tool is ideal to use for shallow deployment compensation. If you plan on using this feature regularly, we recommend purchasing a direct read cable to conveniently get readings from discrete levels.
Multi-Device Download
Multi-device download is available to help you save time especially if you have 100+ loggers in a project. A separate PC-communication cable is required for every device as well as a USB port to connect to your computer. Plug in all your devices and press the CONNECT button. Your devices should appear under Connected in the data management panel.
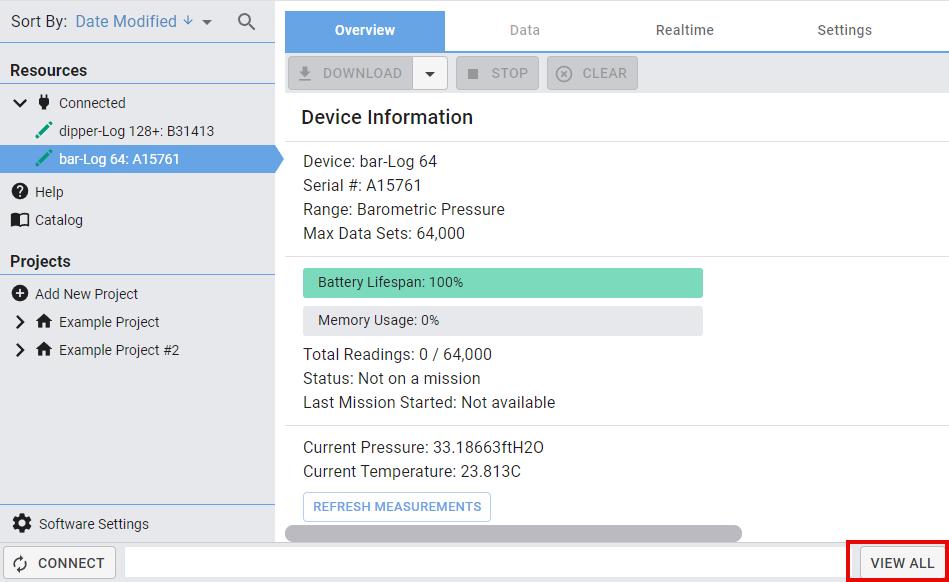
Click VIEW ALL in the bottom right-hand corner of the screen. This will display a window with all your devices and their statuses.
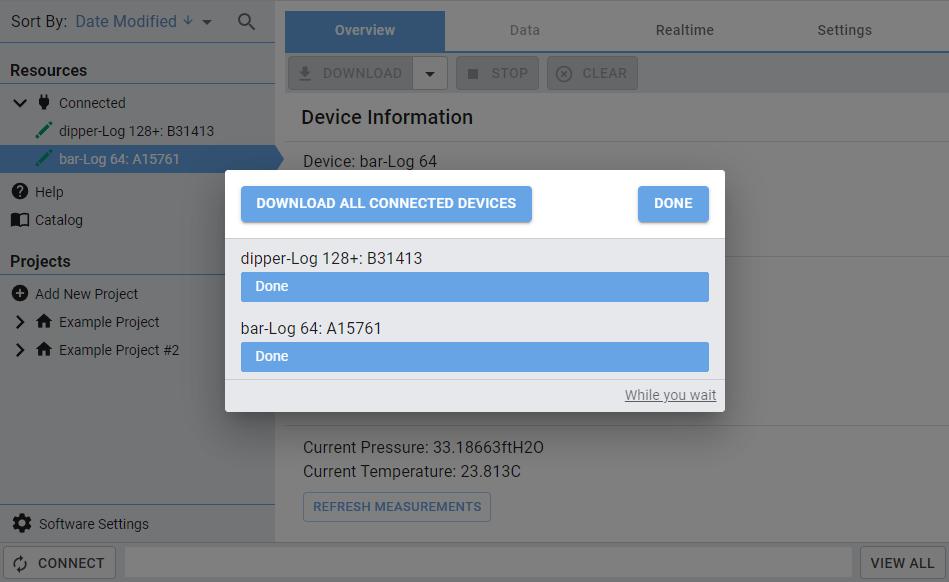
Click DOWNLOAD ALL CONNECTED DEVICES and your data will begin downloading from all your devices.
Zeroing the Logger
Zeroing a logger is a way to account for barometric pressure without a separate barometric pressure source, like a bar-Log. When zeroing a logger, a pressure reading is taken and stored in a separate section of the logger. This reading is called the back-up or programmed value. It can be used as the barometric pressure for data compensation or pressure offsets if no barometric pressure source is selected (e.g. Auto-Baro or a bar-Log) See Barometric Pressure Compensation for more information. It is always recommended to zero your logger as a back-up procedure.
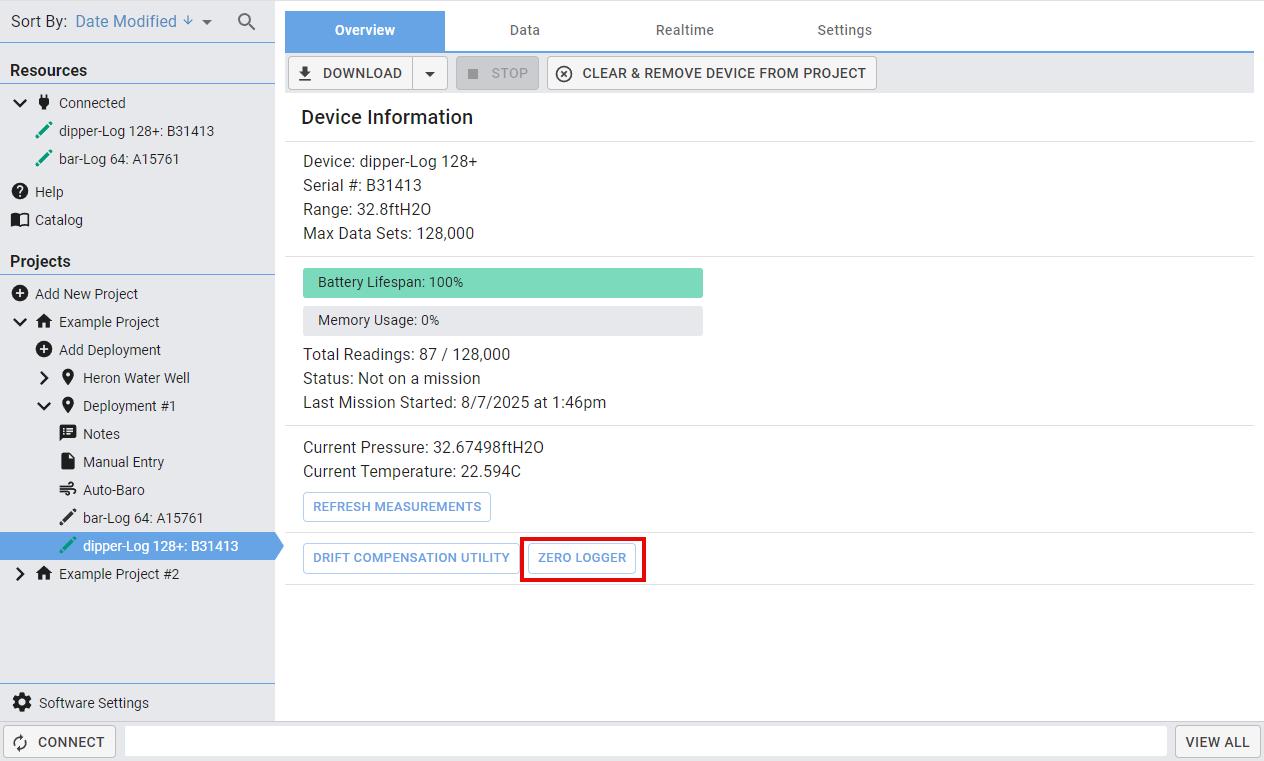
Ensure your logger is connected to the computer and not submerged underwater (must be in air only). Select your logger and go to the Overview tab. Click on ZERO LOGGER
The barometric pressure value stored from zeroing the logger can be viewed after your data has been downloaded. Go to the Data tab and click on MORE TOOLS. The value is named as the “Backup Barometric Value.”
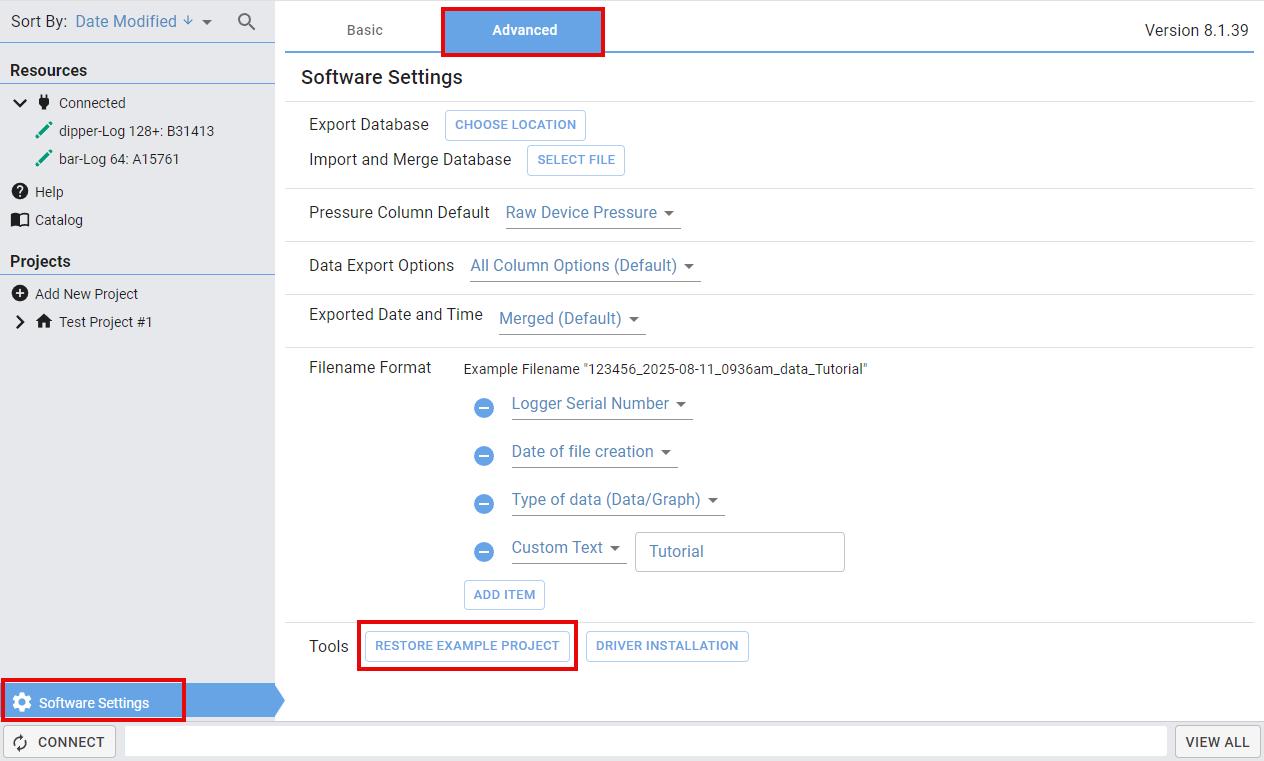
Restoring the Example Project
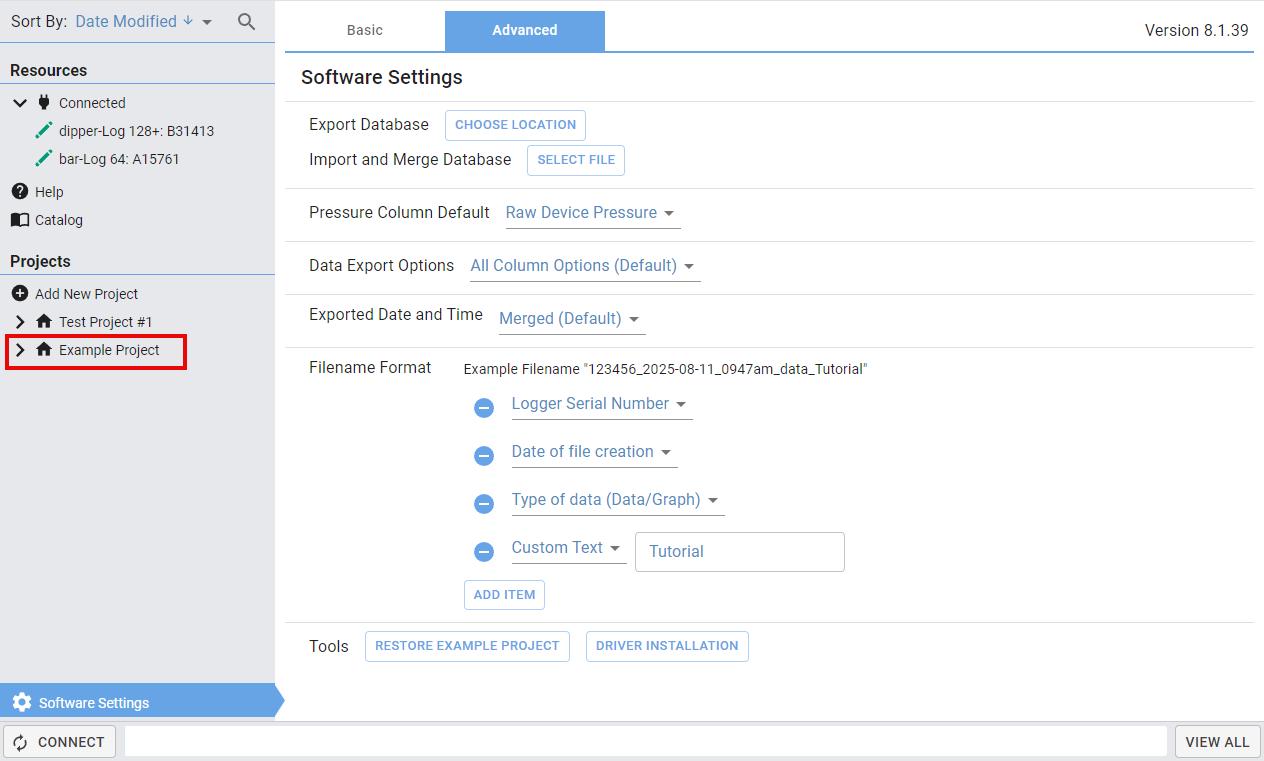
The Example Project included when the software is first downloaded can be restored or reset at any time Go to Software Settings, Advanced tab and then click on RESTORE EXAMPLE PROJECT Note: if you have added data to the Example Project, it will be deleted.
Once restored, the Example Project will be visible in the Data Management Panel.
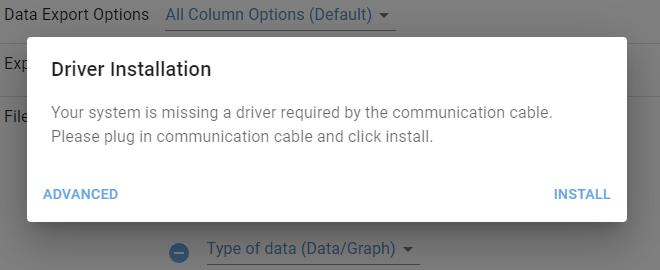
Driver Installation
To install drivers, go to Software Settings, Advanced tab and click on DRIVER INSTALLATION A window will appear indicating if you are missing any drivers. Click INSTALL and follow the on-screen steps similar to the initial software installation.
In the pop-up window you are also able to click on ADVANCED Follow the on-screen instructions. To install drivers with no internet connection, click on OFFLINE DRIVE INSTALLATION
Changing the Default Settings
To change the default software settings, click on Software Settings in the bottom left-hand corner of the screen.
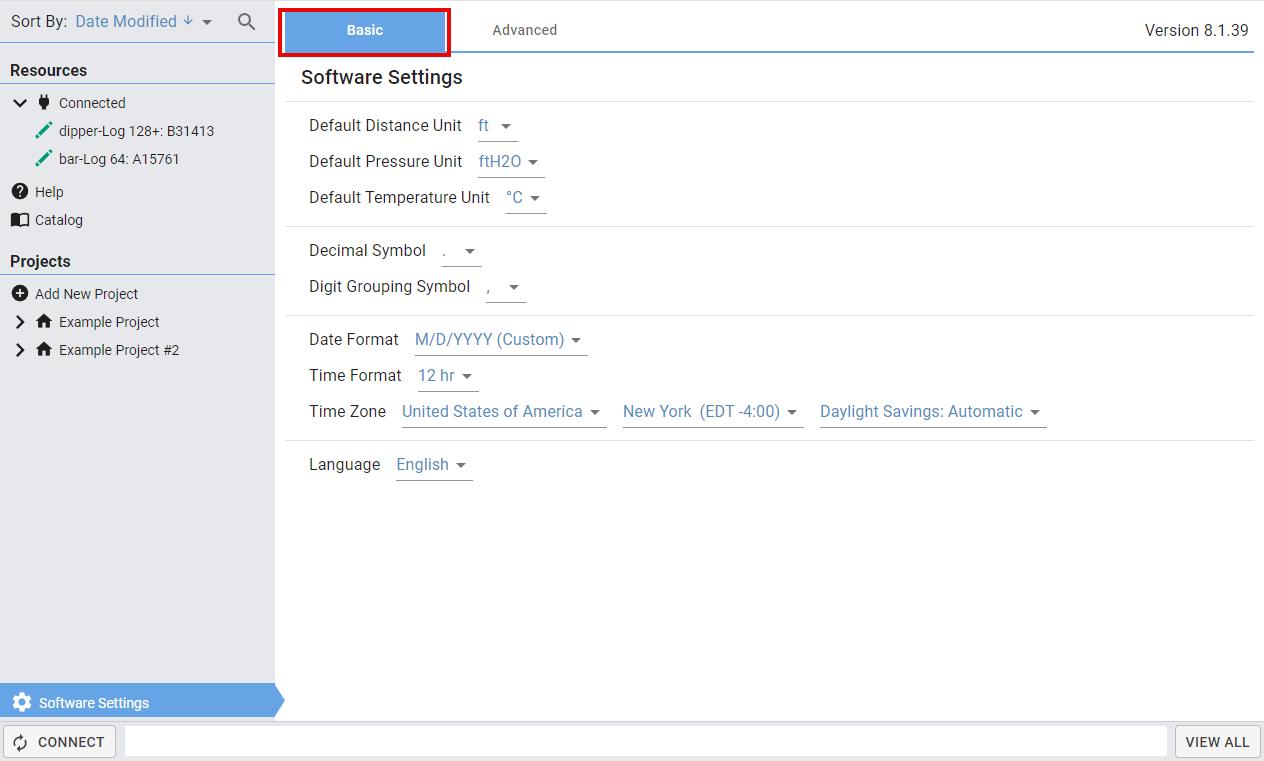
Basic Settings
In the Basic tab, you can change the default units, decimal symbol, digit group symbol, date and time formats, and the language, suitable for your region Use the dropdown arrows to view the options and make your selection.
Advanced Settings
In the Advanced tab, you can change the default:
Pressure Column Parameter
Use the dropdown to select the default pressure parameter that is displayed.
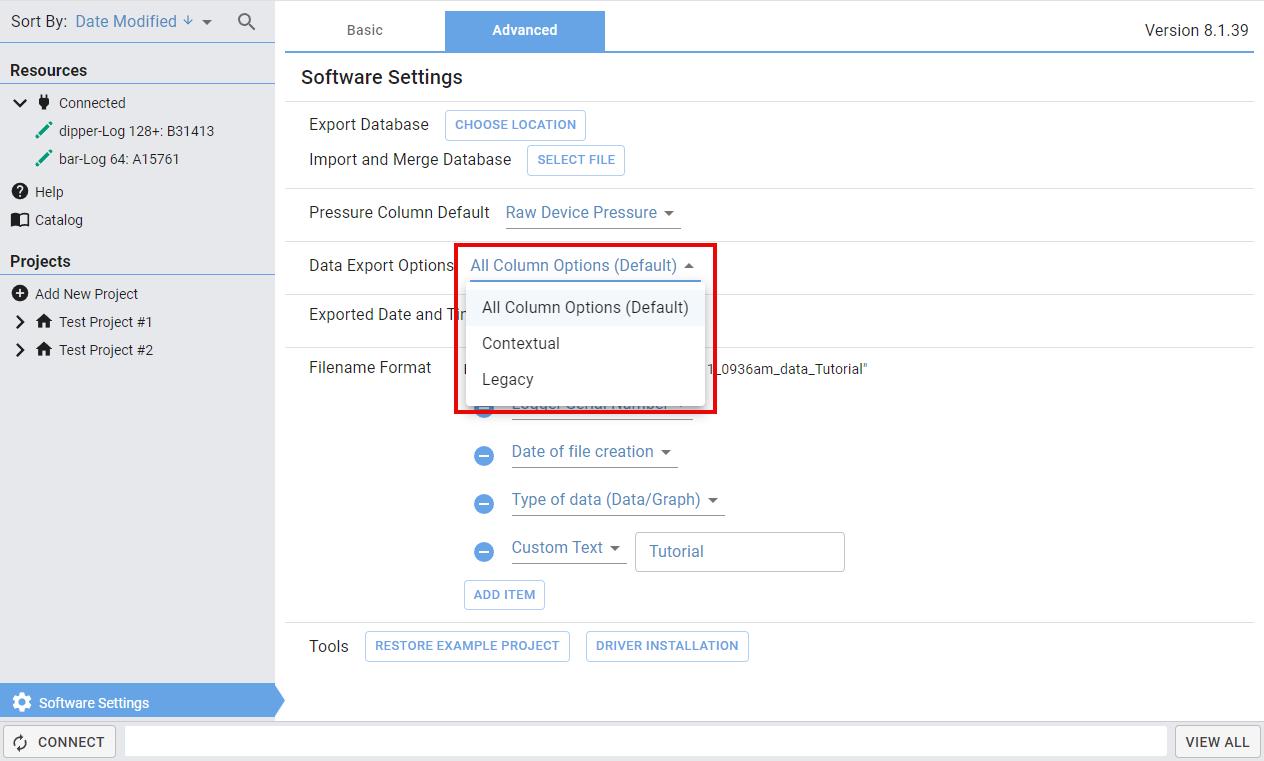
Data Export Mode
There are 3 options for how your data is exported:
• All Column Options (Default): Exports the data chart with additional columns for all dropdown options. E.g. the exported chart would include a column for all the pressure parameters (Total Pressure, Depth Submerged, Distance to Water, and Depth of Water).
• Contextual: Exports the chart with only the selected dropdown parameter.
• Legacy: Exports the data in the same format as the old software.
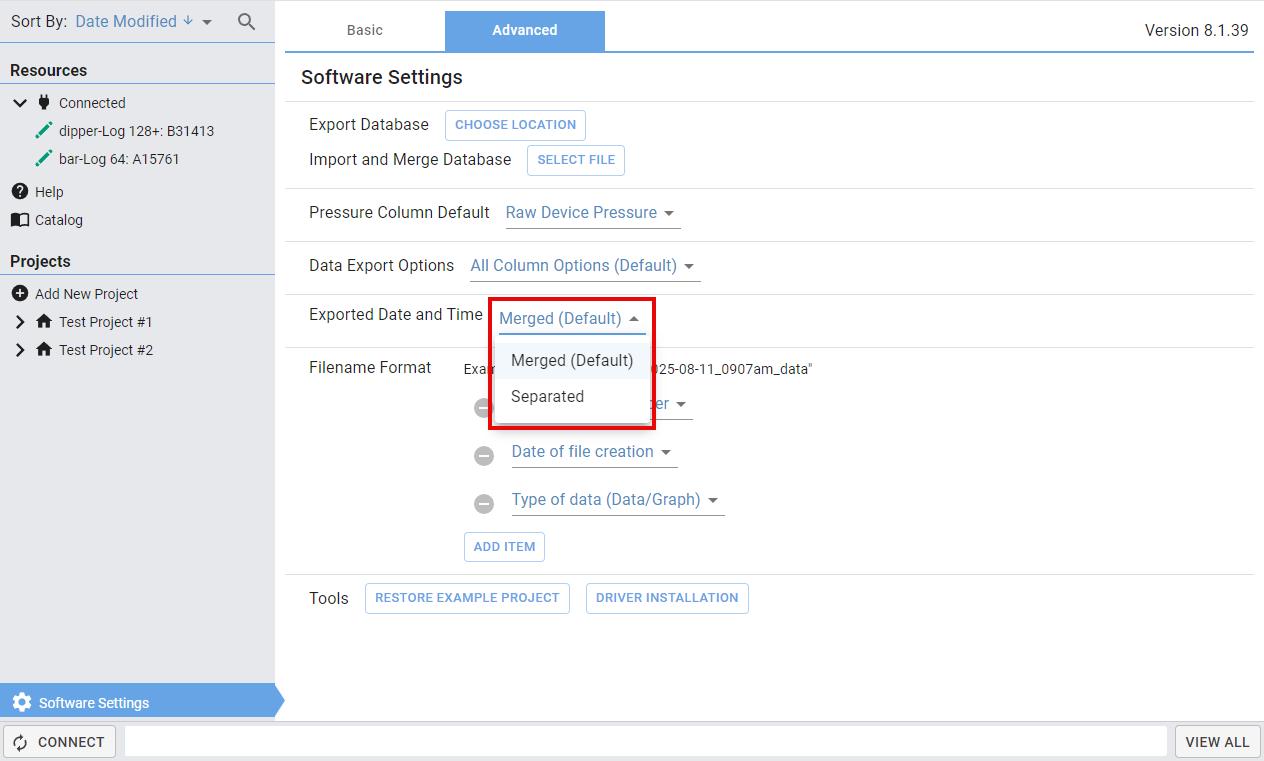
Exported Date and Time Format
There are 2 options for how the date and time are exported:
• Merged (Default): The date and time are combined and displayed in a single column.
• Separated: The date and time are split and displayed in two different columns.
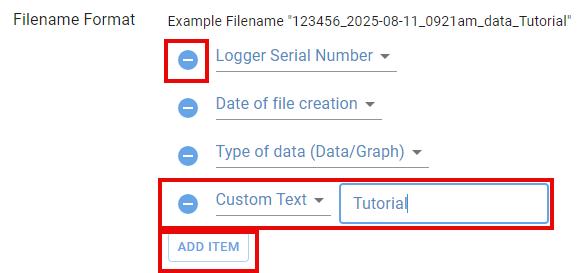
Changing the Default Filename Format
The default filename format is fully customizable. Use the dropdown arrows to select different items you want to include in the file name. The items will be displayed in the order you have selected them, separated by an underscore. The Example Filename is a preview line that will update as you make changes.
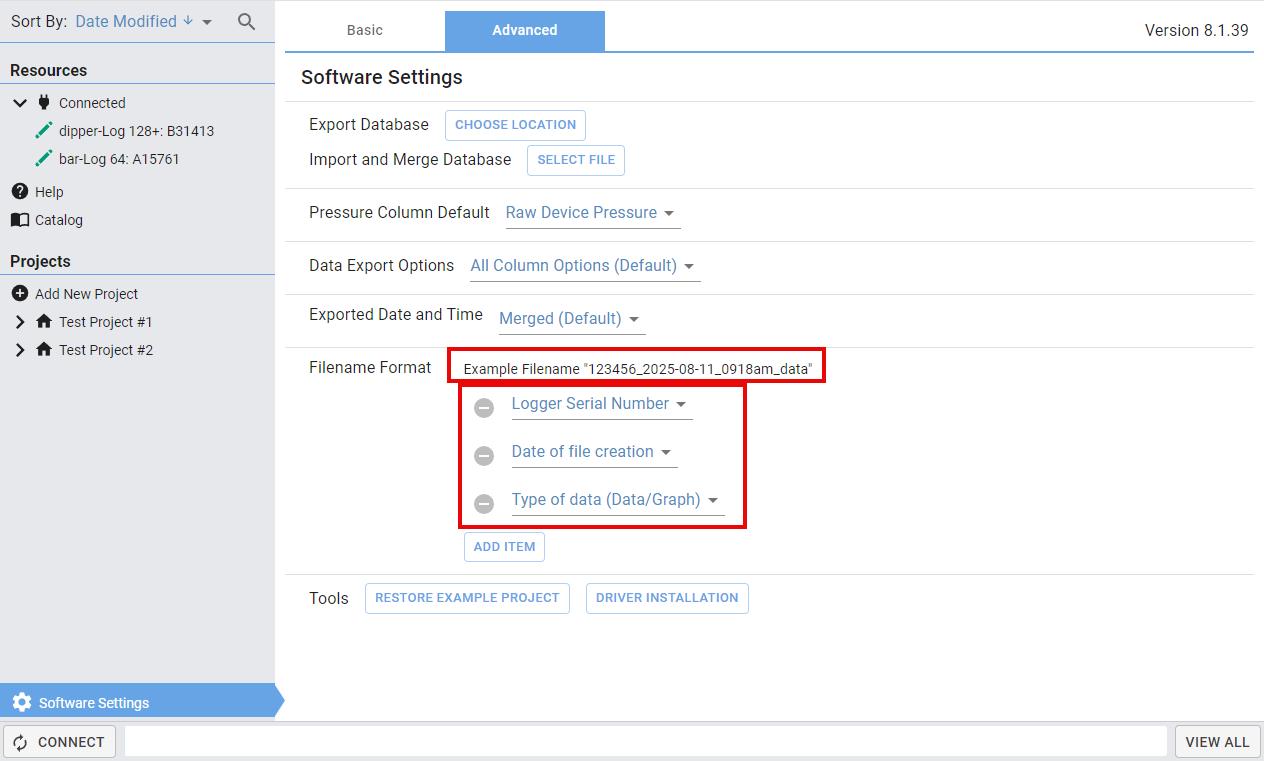
Add items using the ADD ITEM button and remove items by clicking on the (-) button. Note that a minimum of three items is required. To add custom text to the filename, click on the desired item dropdown and select Custom Text. In the field box type your desired text.