5 minute read
Viewing and compensating your data


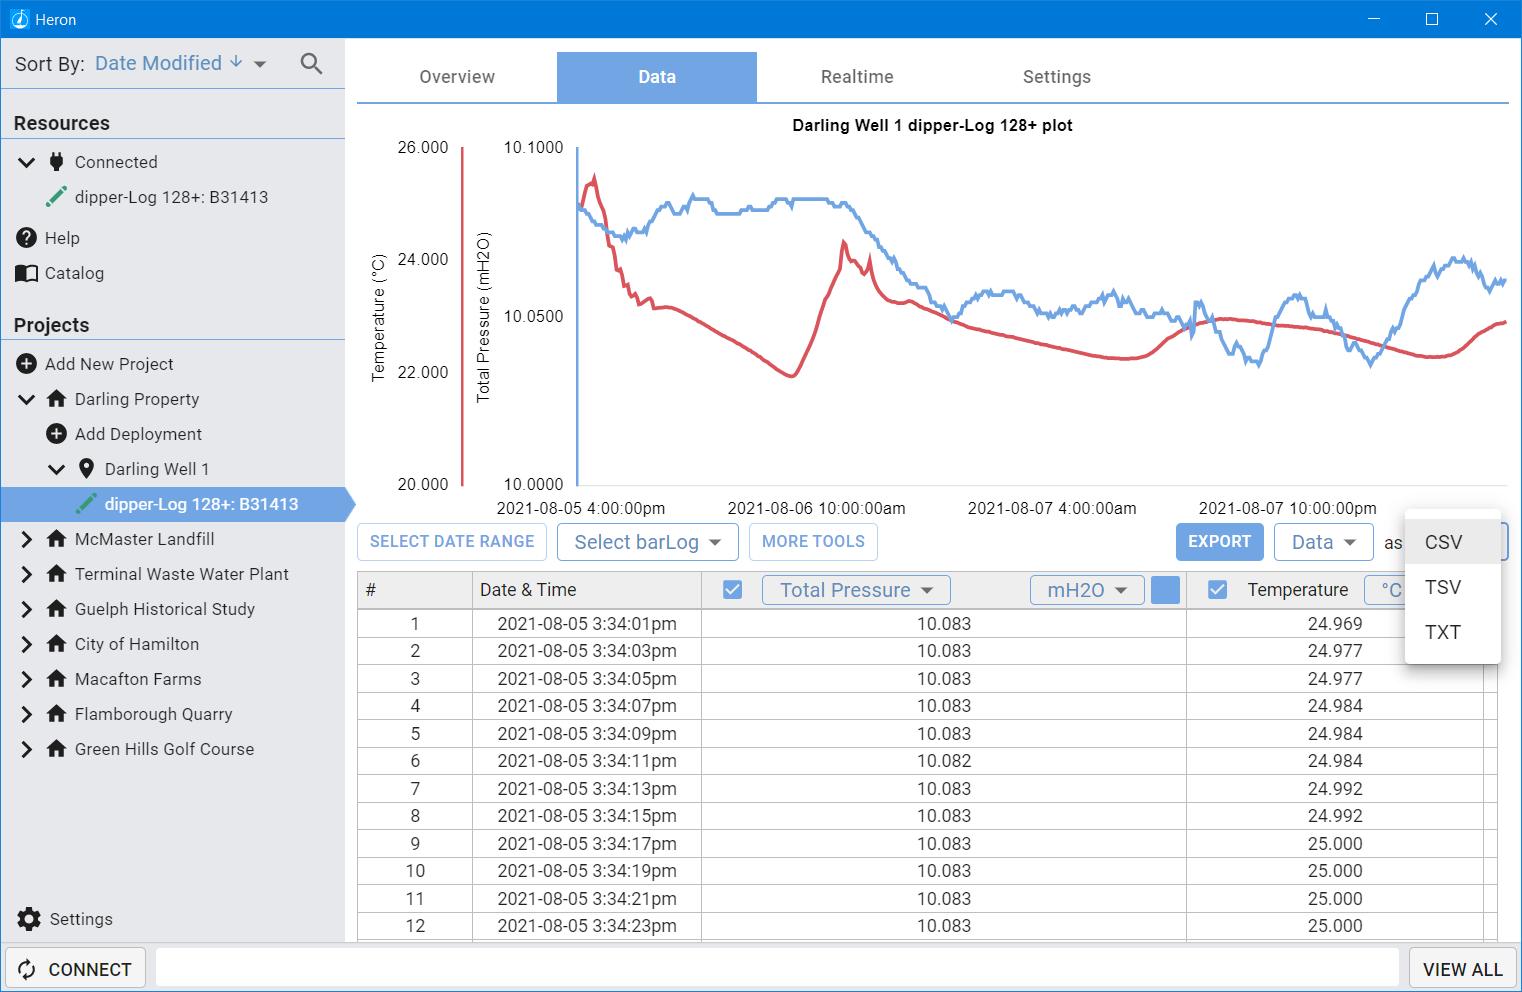
To view your downloaded data, you must navigate to where it is located, in the data management panel. Select the device that collected the data and then select the data tab. You will now be presented with a view of all of the data collected by this logger in the given deployment.
By default, all parameters will be visible on the graph. You can view more detail by hovering your mouse over the graph (or clicking and dragging across the graph on touch screen devices). The parameter and units are visible in the axis titles and the detail bubble.
2
1

You can deselect a parameter (like pressure, or temperature) by deselecting the column in the chart. This will update the graph to remove that parameter. You can re-select the parameter to bring it back.

The graph colour can be changed by selecting the colour swatch on the chart title. This will update the graph to reflect your new colour choice. Have some fun, be an artist and let the graph reflect your personal style!

Units can be changed by selecting from the dropdown in the chart. There are many unit options to choose from. Selecting a new one automatically updates all of your data points and the graph.

When using a pressure logger, the default heading will be “Total Pressure”. This is the raw pressure data measured from the transducer. No transformations have been applied to this data. You can select alternatives from the drop down.

- Total Pressure is your raw unaltered pressure readings. - Depth submerged is your raw pressure minus barometric pressure. If a bar-Log has been selected, this will be used to subtract from the Total Pressure. If no bar-Log has been selected, the software will use a single reading recorded at the start of the last mission to subtract from the rest of the data set. This is not as accurate as a bar-Log, however, provides a very good alternative (as a backup). - Distance to Water is the distance from your datum point to the top of the water. - Depth of Water is only available if Total Well Depth has been entered. This value will be the
Total Well Depth minus the Distance to Water.

You can refine your data to a select date range by clicking on “SELECT DATE RANGE”. A new tool panel will open that presents you with the ability to narrow in your data range. Select the calendar icon to set your date range. Click done when complete.


If you make a mistake or wish to start over, you have two options. “RESET” will set the date range to cover all data points available (the default setting) allowing you to make changes from there. “REMOVE FILTER” removes the date filter entirely.

“MORE TOOLS” allows you to perform basic data manipulation tasks. These include, changing time zone, applying offsets, and applying multipliers to the data. These tools can help to make changes to your data to account for elevation and/or density. The offset tools can also be used to correct for mistakes made during setup or deployment.

Offset:
- First Reading: In cases where no barLog data is available but your dipperLog was started before placement in well, this option allows you to use that first recorded barometric pressure reading to compensate all subsequent data points. This will not adjust your data for barometric influences over the time of the recordings, it will simply remove a constant value representing an approximate barometric pressure. - Last Reading: This option works the same way as the “First Reading” choice with the exception of using the last recorded data point for the calculations. If your dipperLog recorded the first data point when submerged because of a delayed start, this allows you to use the last reading as an alternate barometric pressure value. - Programmed Value: This selection will use the saved “barometric” value that the dipperLog stores when initially started. This is the same value that is used to calculate the Real Time reading value. This stored value will change every time the dipperLog is reprogrammed and restarted. - Custom Value: When this option is selected a new field becomes available which enables the user to enter a constant value by which to offset the recorded values in memory. This could be an average barometric pressure reading from a local weather station or news channel.
Multiplier:
- Low Level: This selection will multiply all downloaded readings by 0.9 - Custom Value: This option allows you to select a constant value by which to adjust your readings. Since 1 is the specific gravity of clean water, the software calculates the height of
water using 1 as the density. This option allows you to make the necessary adjustment when the fluid you are monitoring has a density of more or less than 1, i.e. seawater or brackish water. - "While density of pure water at 4 degrees Celsius is equal to 1, the density of seawater ranges over somewhat higher values, which vary with proximity to shores, rivers, etc., as well as with geographic location & depth. Representative average values are 1.026– 1.028," Van Nostrand's,
Scientific Encyclopedia 7th edition. Canada, 1989: 2046. - You could also adjust your data for altitude using this option. Simply define a factor based on the height above sea level of your job site and enter it in the custom value field.
Select a bar-Log allows you to select a bar-Log from the same project to use to compensate your data. bar-Logs must be in the same project for this to work.
If you have unwanted data points, you can delete them by selecting them and right clicking (click and hold on touch screen devices). Select to delete the rows. This action cannot be undone! We cannot recover data that has been deleted!