Aldehyde dehydrogenases in AML
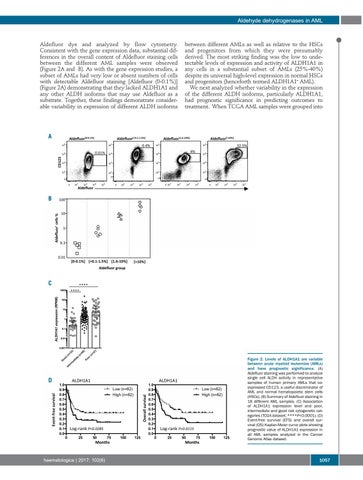
Aldefluor dye and analyzed by flow cytometry. Consistent with the gene expression data, substantial differences in the overall content of Aldefluor staining cells between the different AML samples were observed (Figure 2A and B). As with the gene expression studies, a subset of AMLs had very low or absent numbers of cells with detectable Aldefluor staining [Aldefluor (0-0.1%)] (Figure 2A) demonstrating that they lacked ALDH1A1 and any other ALDH isoforms that may use Aldefluor as a substrate. Together, these findings demonstrate considerable variability in expression of different ALDH isoforms
between different AMLs as well as relative to the HSCs and progenitors from which they were presumably derived. The most striking finding was the low to undetectable levels of expression and activity of ALDH1A1 in any cells in a substantial subset of AMLs (25%-40%) despite its universal high-level expression in normal HSCs and progenitors (henceforth termed ALDH1A1– AML). We next analyzed whether variability in the expression of the different ALDH isoforms, particularly ALDH1A1, had prognostic significance in predicting outcomes to treatment. When TCGA AML samples were grouped into
A
B
C
**** ****
D
haematologica | 2017; 102(6)
Figure 2. Levels of ALDH1A1 are variable between acute myeloid leukemias (AMLs) and have prognostic significance. (A) Aldefluor staining was performed to analyze single cell ALDH activity in representative samples of human primary AMLs that coexpressed CD123, a useful discriminator of AML and normal hematopoietic stem cells (HSCs). (B) Summary of Aldefluor staining in 18 different AML samples. (C) Association of ALDH1A1 expression level and poor, intermediate and good risk cytogenetic categories (TCGA dataset; ****P<0.0001). (D) Event-free survival (EFS) and overall survival (OS) Kaplan-Meier curve plots showing prognostic value of ALDH1A1 expression in all AML samples analyzed in the Cancer Genome Atlas dataset.
1057