
Have the original plans of “easy movement and access” in Milton Keynes been a success or failure, 50 years after the city was built?
And
How can we improve the way people move around Milton Keynes and ensure it withstands the next 50 years?


Have the original plans of “easy movement and access” in Milton Keynes been a success or failure, 50 years after the city was built?
And
How can we improve the way people move around Milton Keynes and ensure it withstands the next 50 years?
Contextual background, authors position and the scope of this study
Movement of people around cities is a key aspect in urban design, especially in Milton Keynes (MK) where the city is structured around its roads. In 2016, a study was conducted on reviewing mobility, where the (Milton Keynes Futures 2050 Commission, 2016) acknowledges that the city “has not addressed the mobility needs of the 20% of the households who do not own a car”. When you think about it, it’s shocking how a city that was initially designed and structured around movement (figure 3), now fails in providing 1/5 of its population a way to travel around the city. As a result, this study explores movement and access in MK through researching the original plans, assessing its success today and designing solutions to improve the way residents move around the city in 50 years time.

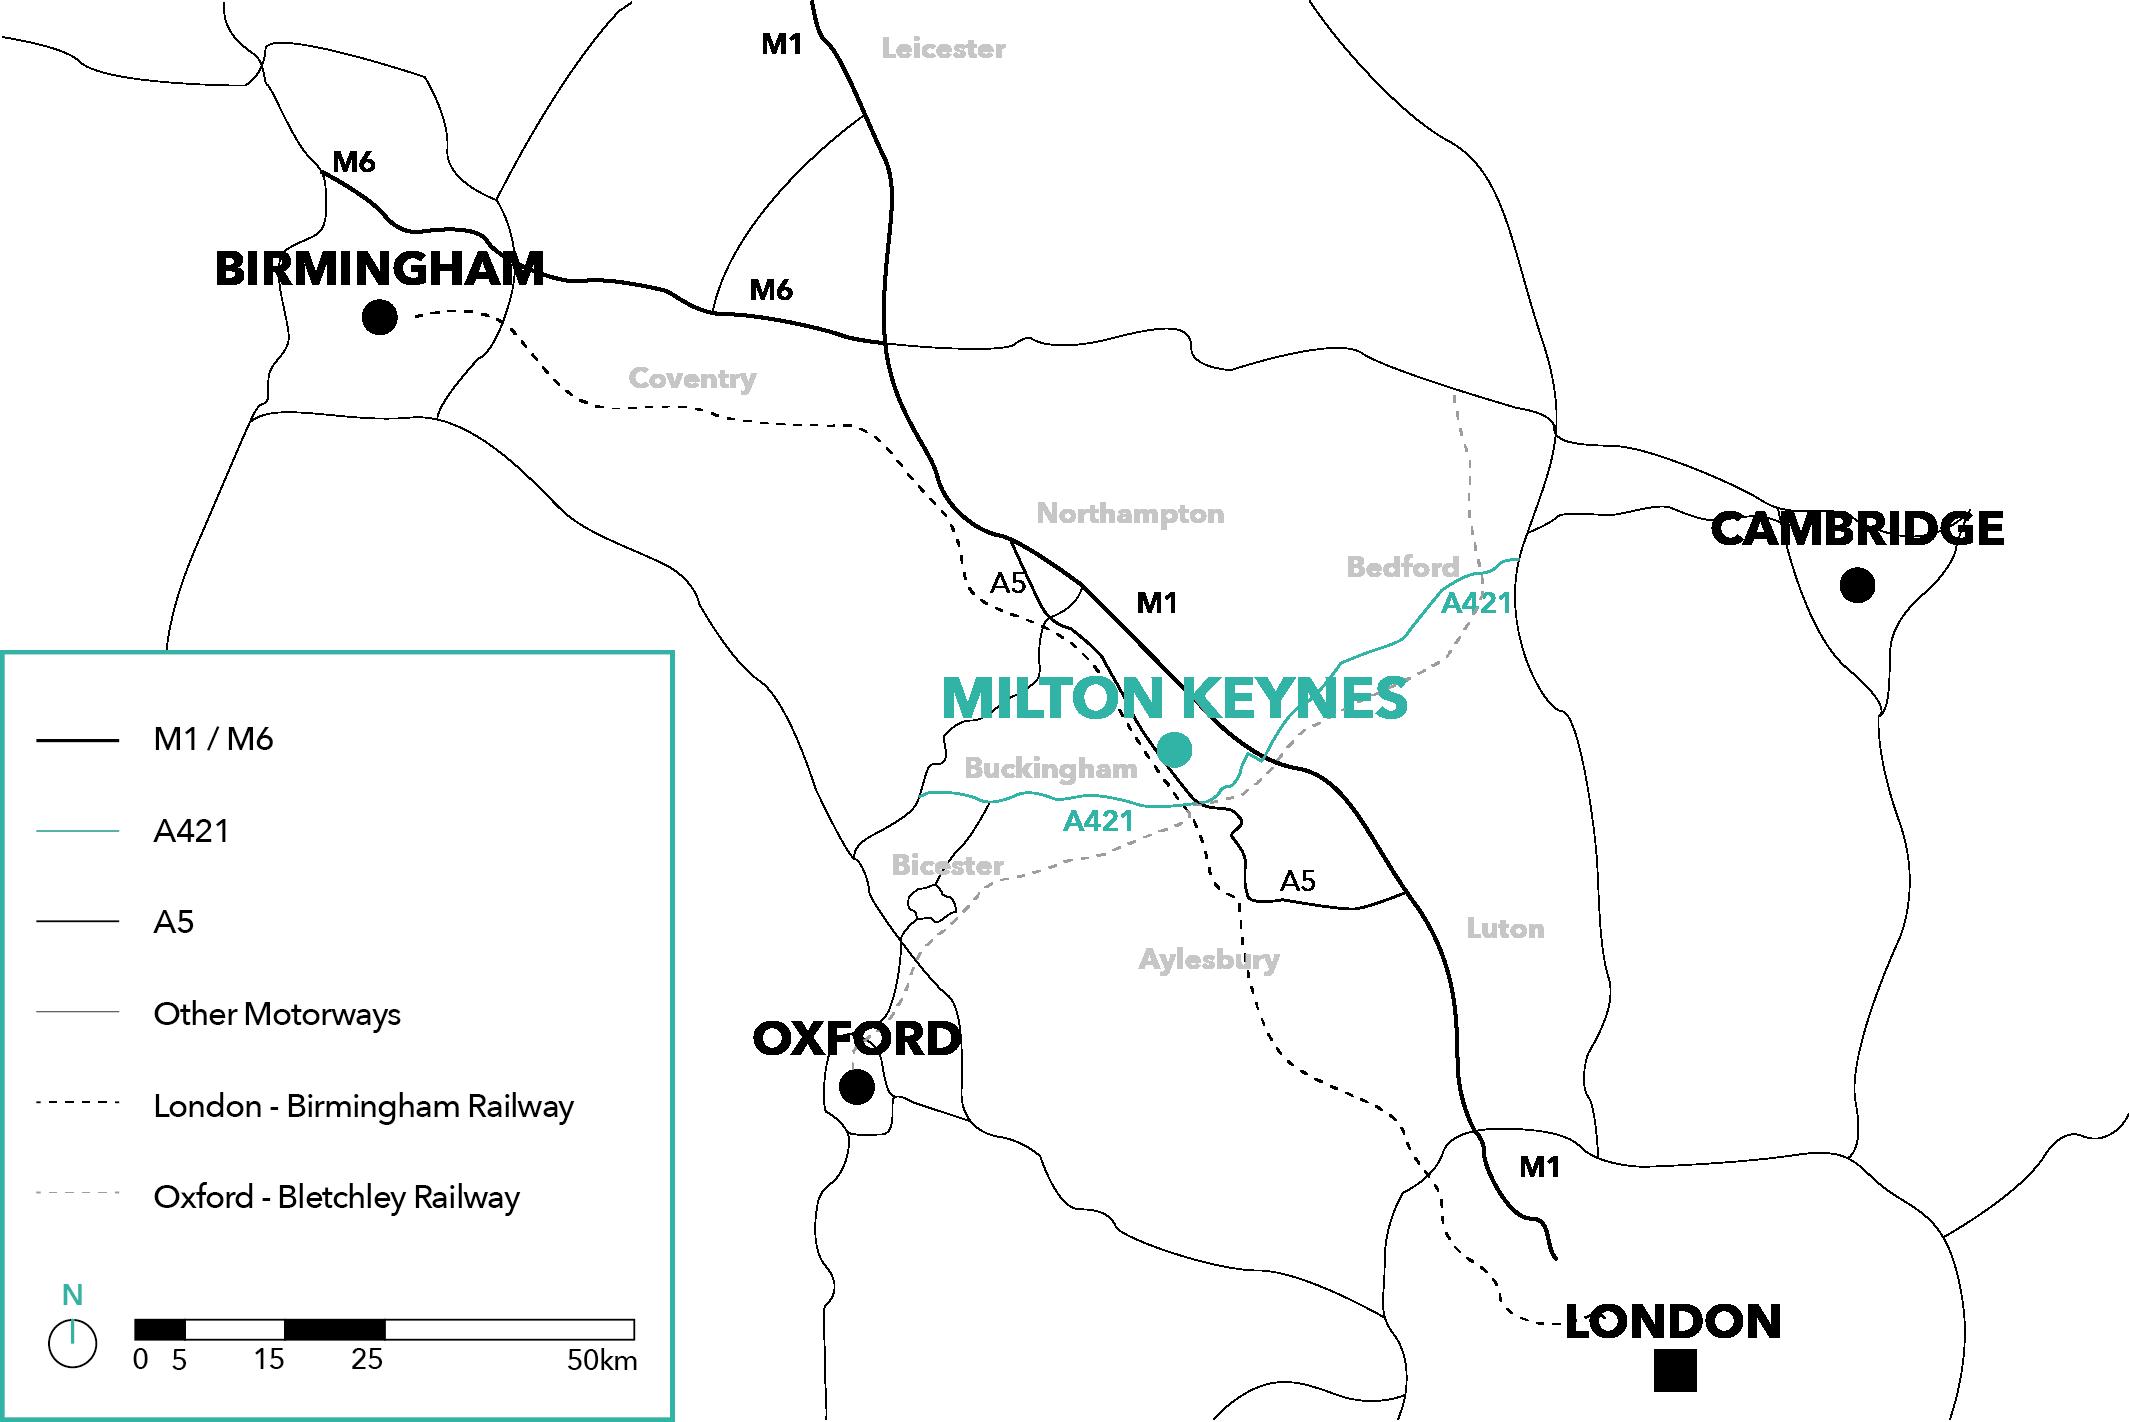
The city was designed and built in 1967 after the formation of the Milton Keynes development corporation (MKDC) (Llewelyn-Davies et al., Volume 1, 1970). As highlighted in figures 1 and 2, the city is located on the M1 between Junction 13 and 14, and is situated in the centre of 4 major cities in the UK; London, Birmingham, Oxford and Cambridge. The main connecting points to the city include the M1 and A5 (Motorways connecting London to the North), the A421 (single/dual carriageway from Cambridge and Oxford), the “Euston to Birmingham railway line (and, to a lesser extent, the Bletchley-Bedford and BletchleyOxford lines)” (The Milton Keynes planning manual, 1992). Although the Oxford-BletchleyBedford railway line closed in 1968 (Doyle, 2021), plans have been made to restore the Varsity line (East West Rail) to provide “new rail links to Oxford (due to open in 2024) and to Cambridge (due to open by 2030)” (Milton Keynes Future 2050, 2021).
Shortly after the Second World War and the aftermath on UK’s infrastructure, the government created the New Towns Act to rebuild, reconstruct and solve the country’s housing crises. Approximately 32 new towns (OpenLearn from The Open University, 1/2, 2017) were built during this time, with MK being one of the last, largest and arguably greatest cities designed, where it houses approximately 300,00 people today (Population Bulletin 2016/17, 2017).
Unlike many British cities, MK is purposely built and was heavily designed and masterplanned. Similar to other new towns (Letchworth and Welwyn), MK succeeded at adopting the Garden City Model (Walker and Rasmussen, 1982) that was created by Ebenezer Howard in 1898 (Howard, 1902), however, adopts a gird structure as highlighted in figure 3 to cater the increase in car popularity. The city was inspired by the “steep rise in motor-car ownership” (Bendixson and Platt, 1998) in the 1960s, and Malvin Webber’s ideology of the car offering “huge advantages over public transport - it gave door to door, no wait, no transfer, private and flexible route service” (Wray, 2016). The main purpose of the grid design was to enable residents to travel through the city quickly and easily using a car (Milton Keynes Futures 2050 Commission, 2016) (Llewelyn-Davies et al., Volume 1, 1970). This was a system that was inspired by American cities “hence Milton Keynes came to be known as the little Los Angeles of Buckinghamshire” (Clapson, 2004).

Over the past few decades, MK has been criticised in the media, being referred to as the city of “roundabouts, concrete cows and a city that is soulless with no history” (OpenLearn from The Open University, 1/2, 2017). However, when you ask residents about the city, they seem to love the way it is designed. Residents argue, as highlighted in (OpenLearn from The Open University, 1/2, 2017) that “they are able to experience nature in a way that you can’t necessarily do in other cities” with parks only a 10 minute walk away from any location.
One reason behind this negative attitude is due to its foreign and unique design, making the public confused when navigating around the city. Visitors “come with a preconceived idea of what clues and landmarks a city should offer and are then confused when such landmarks are not apparent” (Bishop, 1986) as they are blocked by the ‘tower like trees’ on the grid roads (Walker and Rasmussen, 1982). They “are expecting everything to be slow” (OpenLearn from The Open University, 1/2, 2017) once entering, like other British cities, however this isn’t apparent, which is what makes MK unique. “With very occasional exception, I can be from my home to my office in 15 minutes” where this resident describes travelling from one side of MK to another (OpenLearn from The Open University, 1/2, 2017).
My initial position is that the city was heavily designed through a masterplan perspective, looking at the city from an aerial view, rather than an urban design eye level perspective. When looking at the masterplan, the city is well structured and distribute, however, this system appears very foreign to the British (OpenLearn from The Open University, 1/2, 2017) as it adopts a different urban design style. By designing MK in a masterplan capacity, it doesn’t consider how users experience the city. For example, as a MK resident (Male, 23yrs) who has recently moved to the city, I find it hard to navigate as most roads look the same, with trees on either side blocking views of the city. I rely heavily on using applications like Google maps, to help way find and navigate. Furthermore, despite the vast number of pedestrian walkways, I would choose to drive to nearby destination than walk because it is faster and easier. However, this is just my view, and a thorough analysis will be completed to ensure an informed design is a result.
As mentioned earlier, MK was built in 1967 as part of the New Towns Act created by the Government. Because of this, the public feel the city has no history. Contrary to this, as highlighted in figure 4, the MK borough includes the towns “Bletchley, Stoney Stratford, Wolverton and New Bradwell, together with thirteen villages and the brickfields to the southwest of Bletchley” (The Milton Keynes planning manual, 1992) all of which contribute to history uniquely.
Bletchley is a town located on the north western rail in the south parts of MK and is commonly known for its help during the second world war “where Alan Turing and other agents of the Ultra intelligence project decoded the enemy’s secret messages” (Lewis, no date). Wolverton, also a stop on the north-western railway, was “founded in 1838 by the London and Birmingham railway company to house its workforce” (Our History - Wolverton and Greenleys Town Council, no date) to work in the “new engineering plant, in the era when rail was revolutionising the world” (A brief history of the Works at Wolverton, 2020). Stony Stratford capitalised due to its strategic location between London and Birmingham, where it acted as a resting stop for travellers. “The origins of the Cock & Bull story started in the
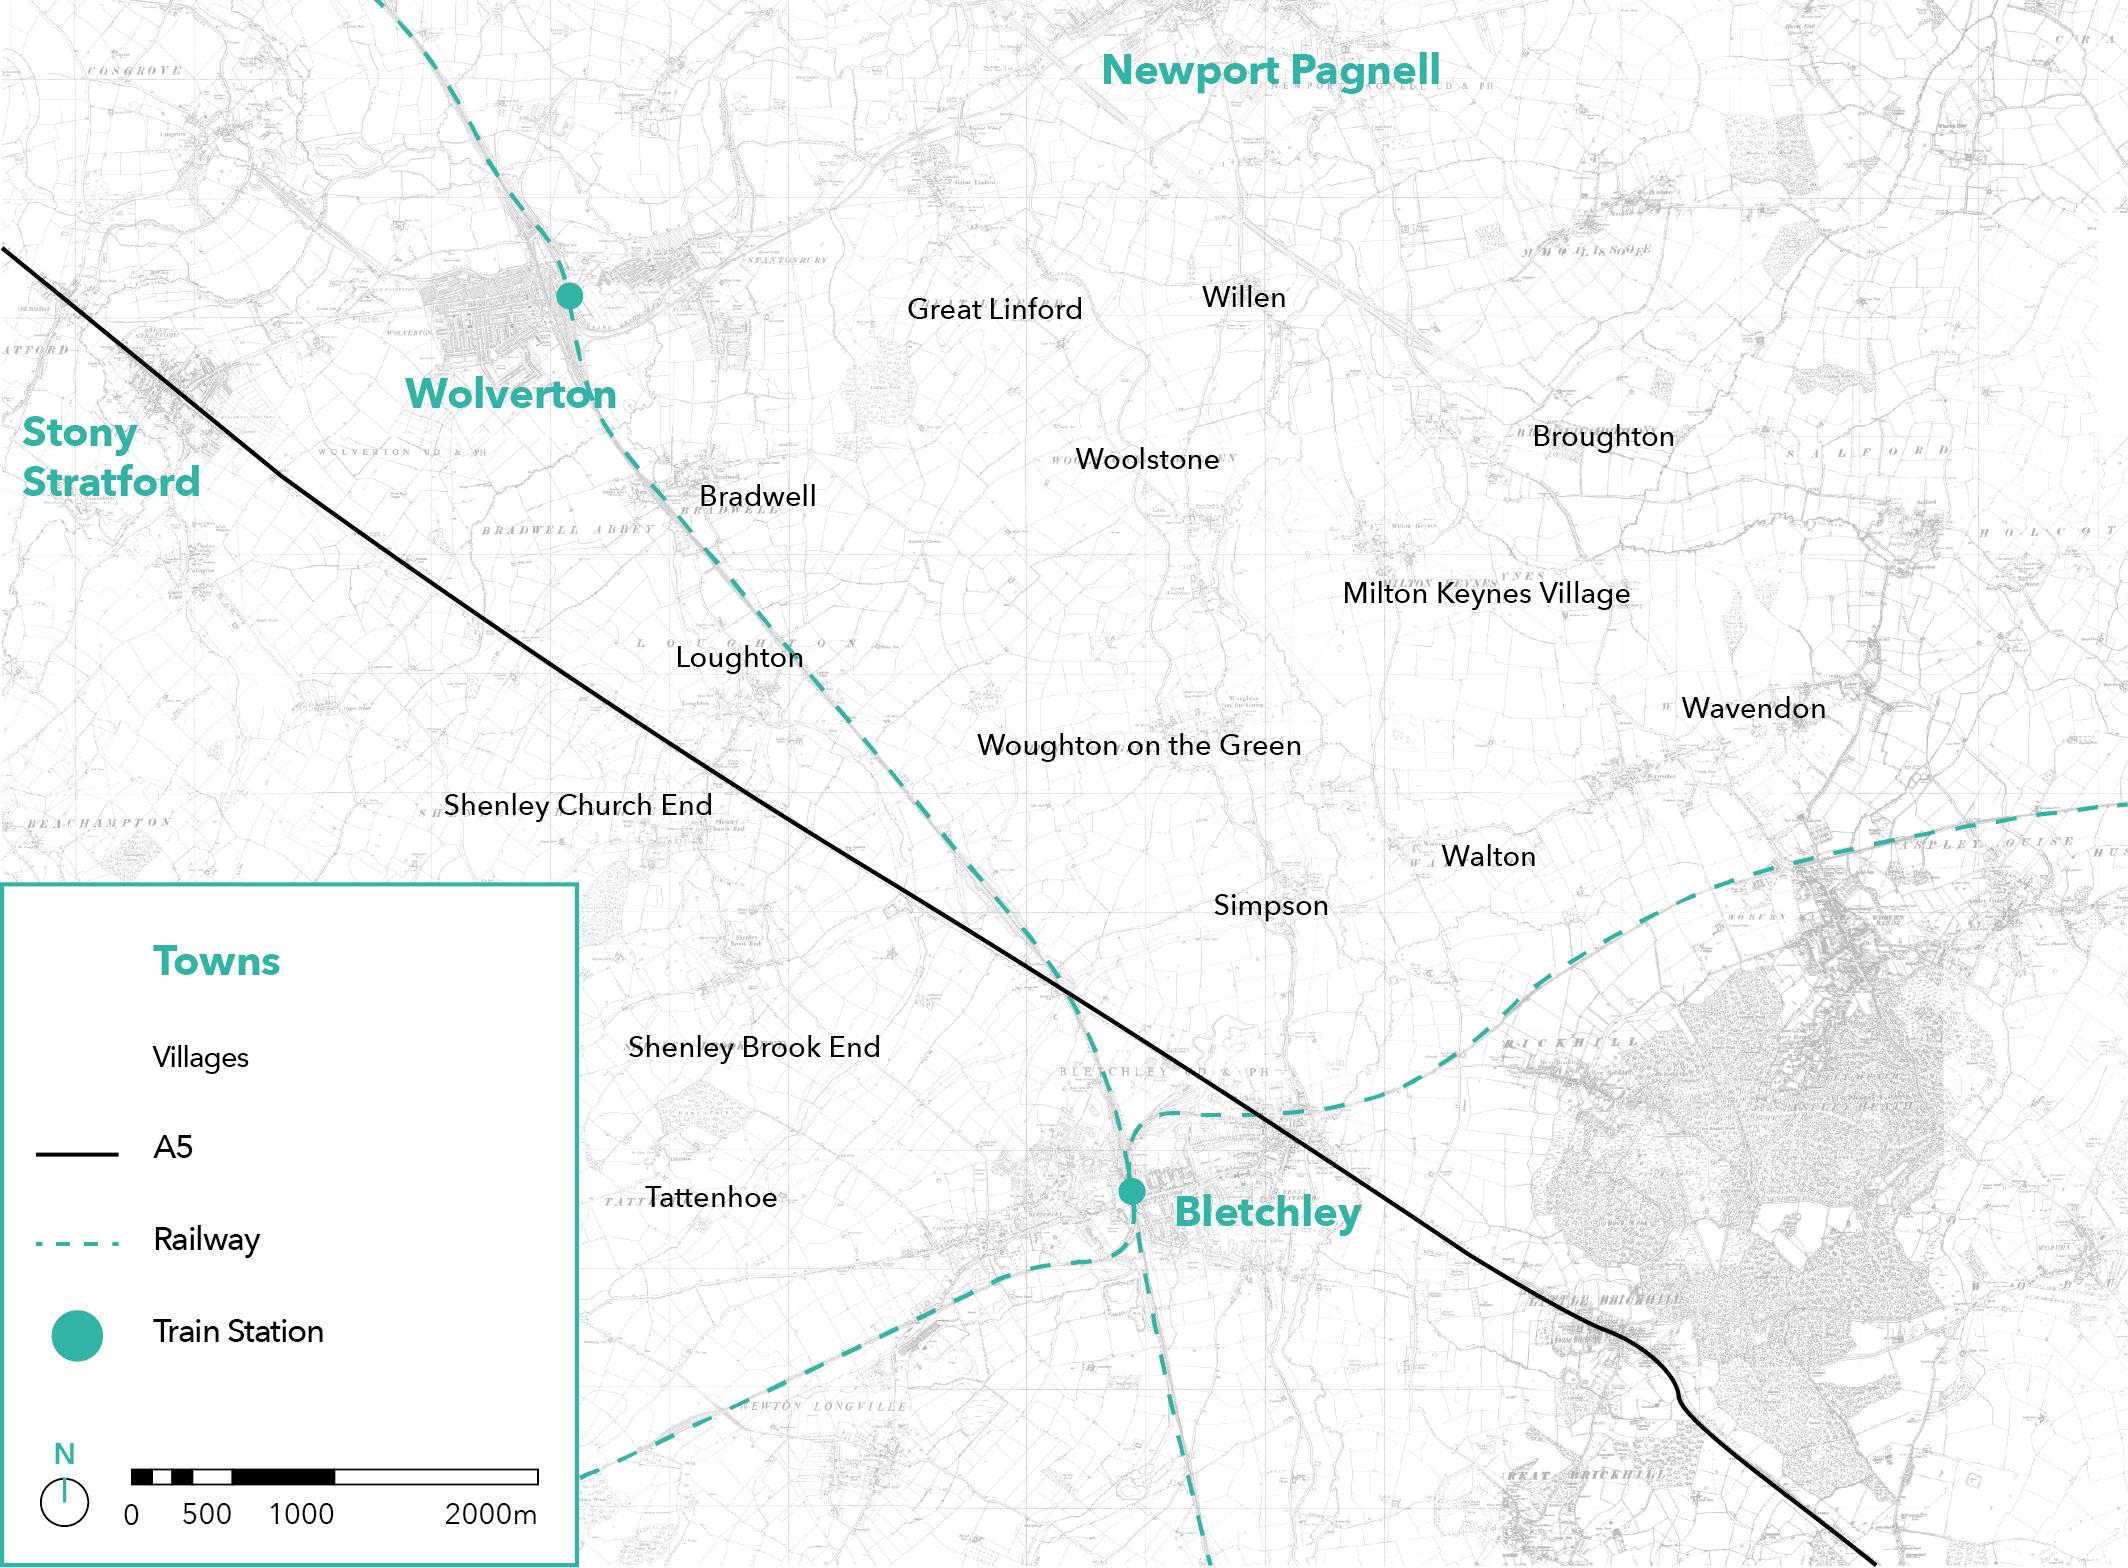
town with outlandish stories being told by travellers and highwaymen at the old coaching inns, The Cock and The Bull” (Towns & Villages in Stony Stratford, 2022). Newport Pagnell is a town north of Milton Keynes, also with rich history dating back to 1086 when it was known “as Neuport, Old English for ‘New Market Town’” (History of Newport PagnellNewport Pagnell Local Guide, no date) (History of Newport Pagnell, no date). It was a popular destination, being an “important stopping place for travellers in the age of horse and coach travel” (Towns & Villages in Newport Pagnell, no date).
(Llewelyn-Davies et al., Volume 2, 1970) discusses the importance for MK “To incorporate Bletchley, Wolverton and Stony Stratford in a way that preserves their individual sense of local community” and “not to sweep them away” hence why each existing town preserves their own individual identity and does not adopt the grid structure of MK’s masterplan. Additionally, the existing “thirteen villages and the brickfields to the southwest of Bletchley” (The Milton Keynes planning manual, 1992) have been incorporated within the grid structure where each village occupies a grid square.
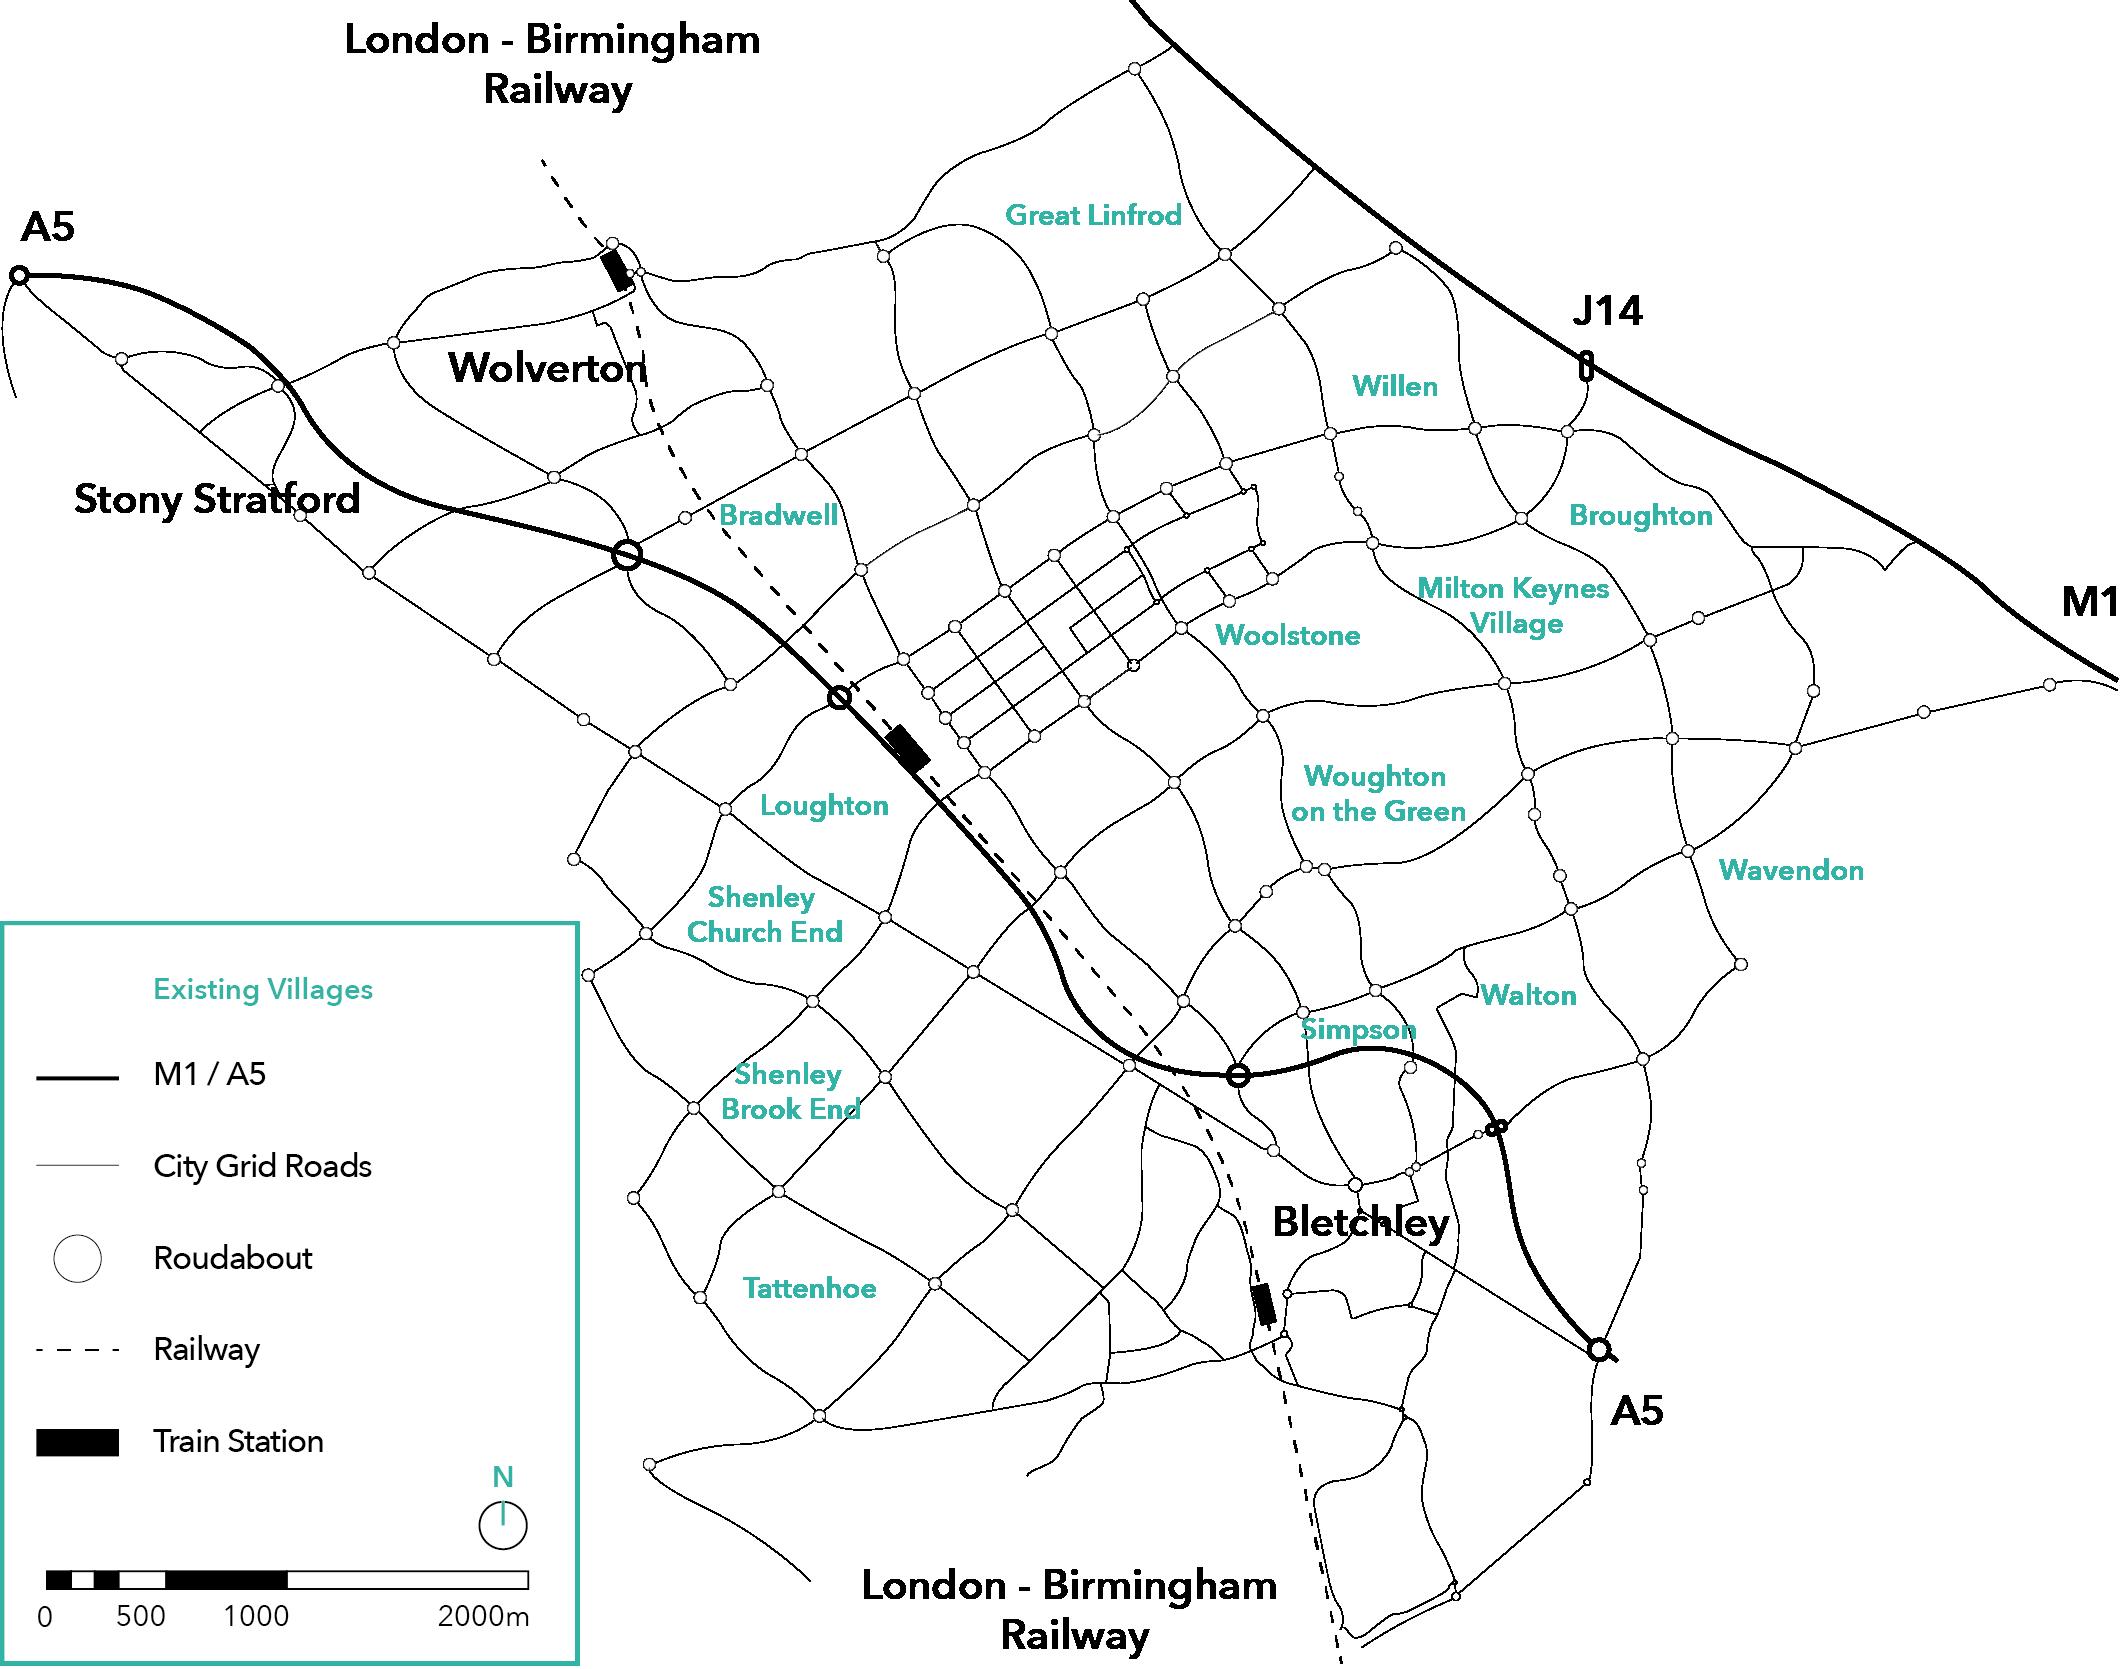

Figure 6 highlights key events in history that inspired and affected the design of MK. For example, the creation of the garden city model, the first and second World War, the rebuilding of infrastructure, the introduction of the New Towns Act, and the popularity in car travel, all played a key role in the urban design of the city. The timeline also displays key transport events such as the first motorway opening in the UK (M1) and the new bus station on Junction 14 (M1). Additionally, figure 6 highlights the privatisation of bus companies in 1980 after Margaret Thatcher was elected prime minister, which affected MK’s public transport system (Chapter 3). Furthermore, the timeline discusses important MK milestones and the re-opening of the Oxford - MK - Cambridge railway line, as mentioned in (Milton Keynes Future 2050, 2021). The design of MK was very much a product of the events that occurred prior to 1967, hence why the city adopts a unique structure.
After recently passing MK’s 50-year milestone in 2017, many documents were produced on reviewing the city against its original plans in 1970 (OpenLearn from The Open University, 2/2, 2017) (Milton Keynes Council, 2020) (Milton Keynes Futures 2050 Commission, 2016).
Following this, the council published a report in 2021 highlighting their strategy for 2050 (Milton Keynes Future 2050, 2021). In this report, mobility was heavily discussed as it is arguably the most important aspect of MK’s urban design. As mentioned previously the city was part of the New Towns Act and designed around the garden city model, however adopted a grid structure to cater to the increasing popularity in car travel. In 2016, we found that the city “has not addressed the mobility needs of the 20% of the households who do not own a car” (Milton Keynes Futures 2050 Commission, 2016). Therefore, it is imperative that transport in MK is studied to improve movement and access.
Although the report discusses ideas that improve the way residents move around the city such as introducing hireable e-bikes and e-scooters, the 2050 plans have completely gone against the original ideology of quick and easy movement around the city (Milton Keynes Futures 2050 Commission, 2016) (Llewelyn-Davies et al., Volume 1, 1970) and don’t consider the problems that residents face today. This will be discussed further in chapter 5, where a full analysis of the councils 2050 plans will be examined. In response, this study will focus primarily on how people move around the city and will explore solutions to the problems residents face today when travelling around the city.
As highlighted in figure 7, This dissertation has a 2-part structure. Part 1 focuses on answering the first part of the research question on assessing whether the original plans for easy movement and access is still successful today, 50 years after the city was built. It is structured chronologically to ensure a full analysis of the urban design of MK is conducted. Chapter 3 will explore the original plans set by the MKDC, where reasonings behind certain design decisions is uncovered. This is important especially when comparing the original plans with the reality of MK in 2022 to analyse if movement and access is successful (Chapter 4). In this chapter, we will start to realise problems residents face whilst moving around the city. Chapter 5 will then discuss the council’s current strategy for 2050 where the study will highlight problems that occur as a result of the new proposals. After completing a full analysis of MK in 1967, 2022 and 2050, Part 2 of this study will come into effect where the research question on improving the way people move around the city, will be explored. In this section, a variety of concepts and ideas will be developed and critically analysed to ensure the final outcome will solve current problems and improve movement in the future, when the city marks its 100-year milestone in 2067.

City grid roads, the masterplan, the RedWay and public transport
This study is structured using two parts to answer both research and design questions. Part 1 focuses on assessing whether the original plans for easy movement and access is still successful today and part 2 explores ways to improve the way people move around the city in the next 50 years. The first part is structured chronologically according to the literature introduced previously and examines MK in 1967, 2022 and 2050. In this chapter, the 1967 plans created by the MKDC will be discussed in detail, to ensure a full understanding of the thought process and reasonings behind each design idea is identified. This is done to set the basis in analysing whether the original plans of easy movement and access are still successful today in 2022.

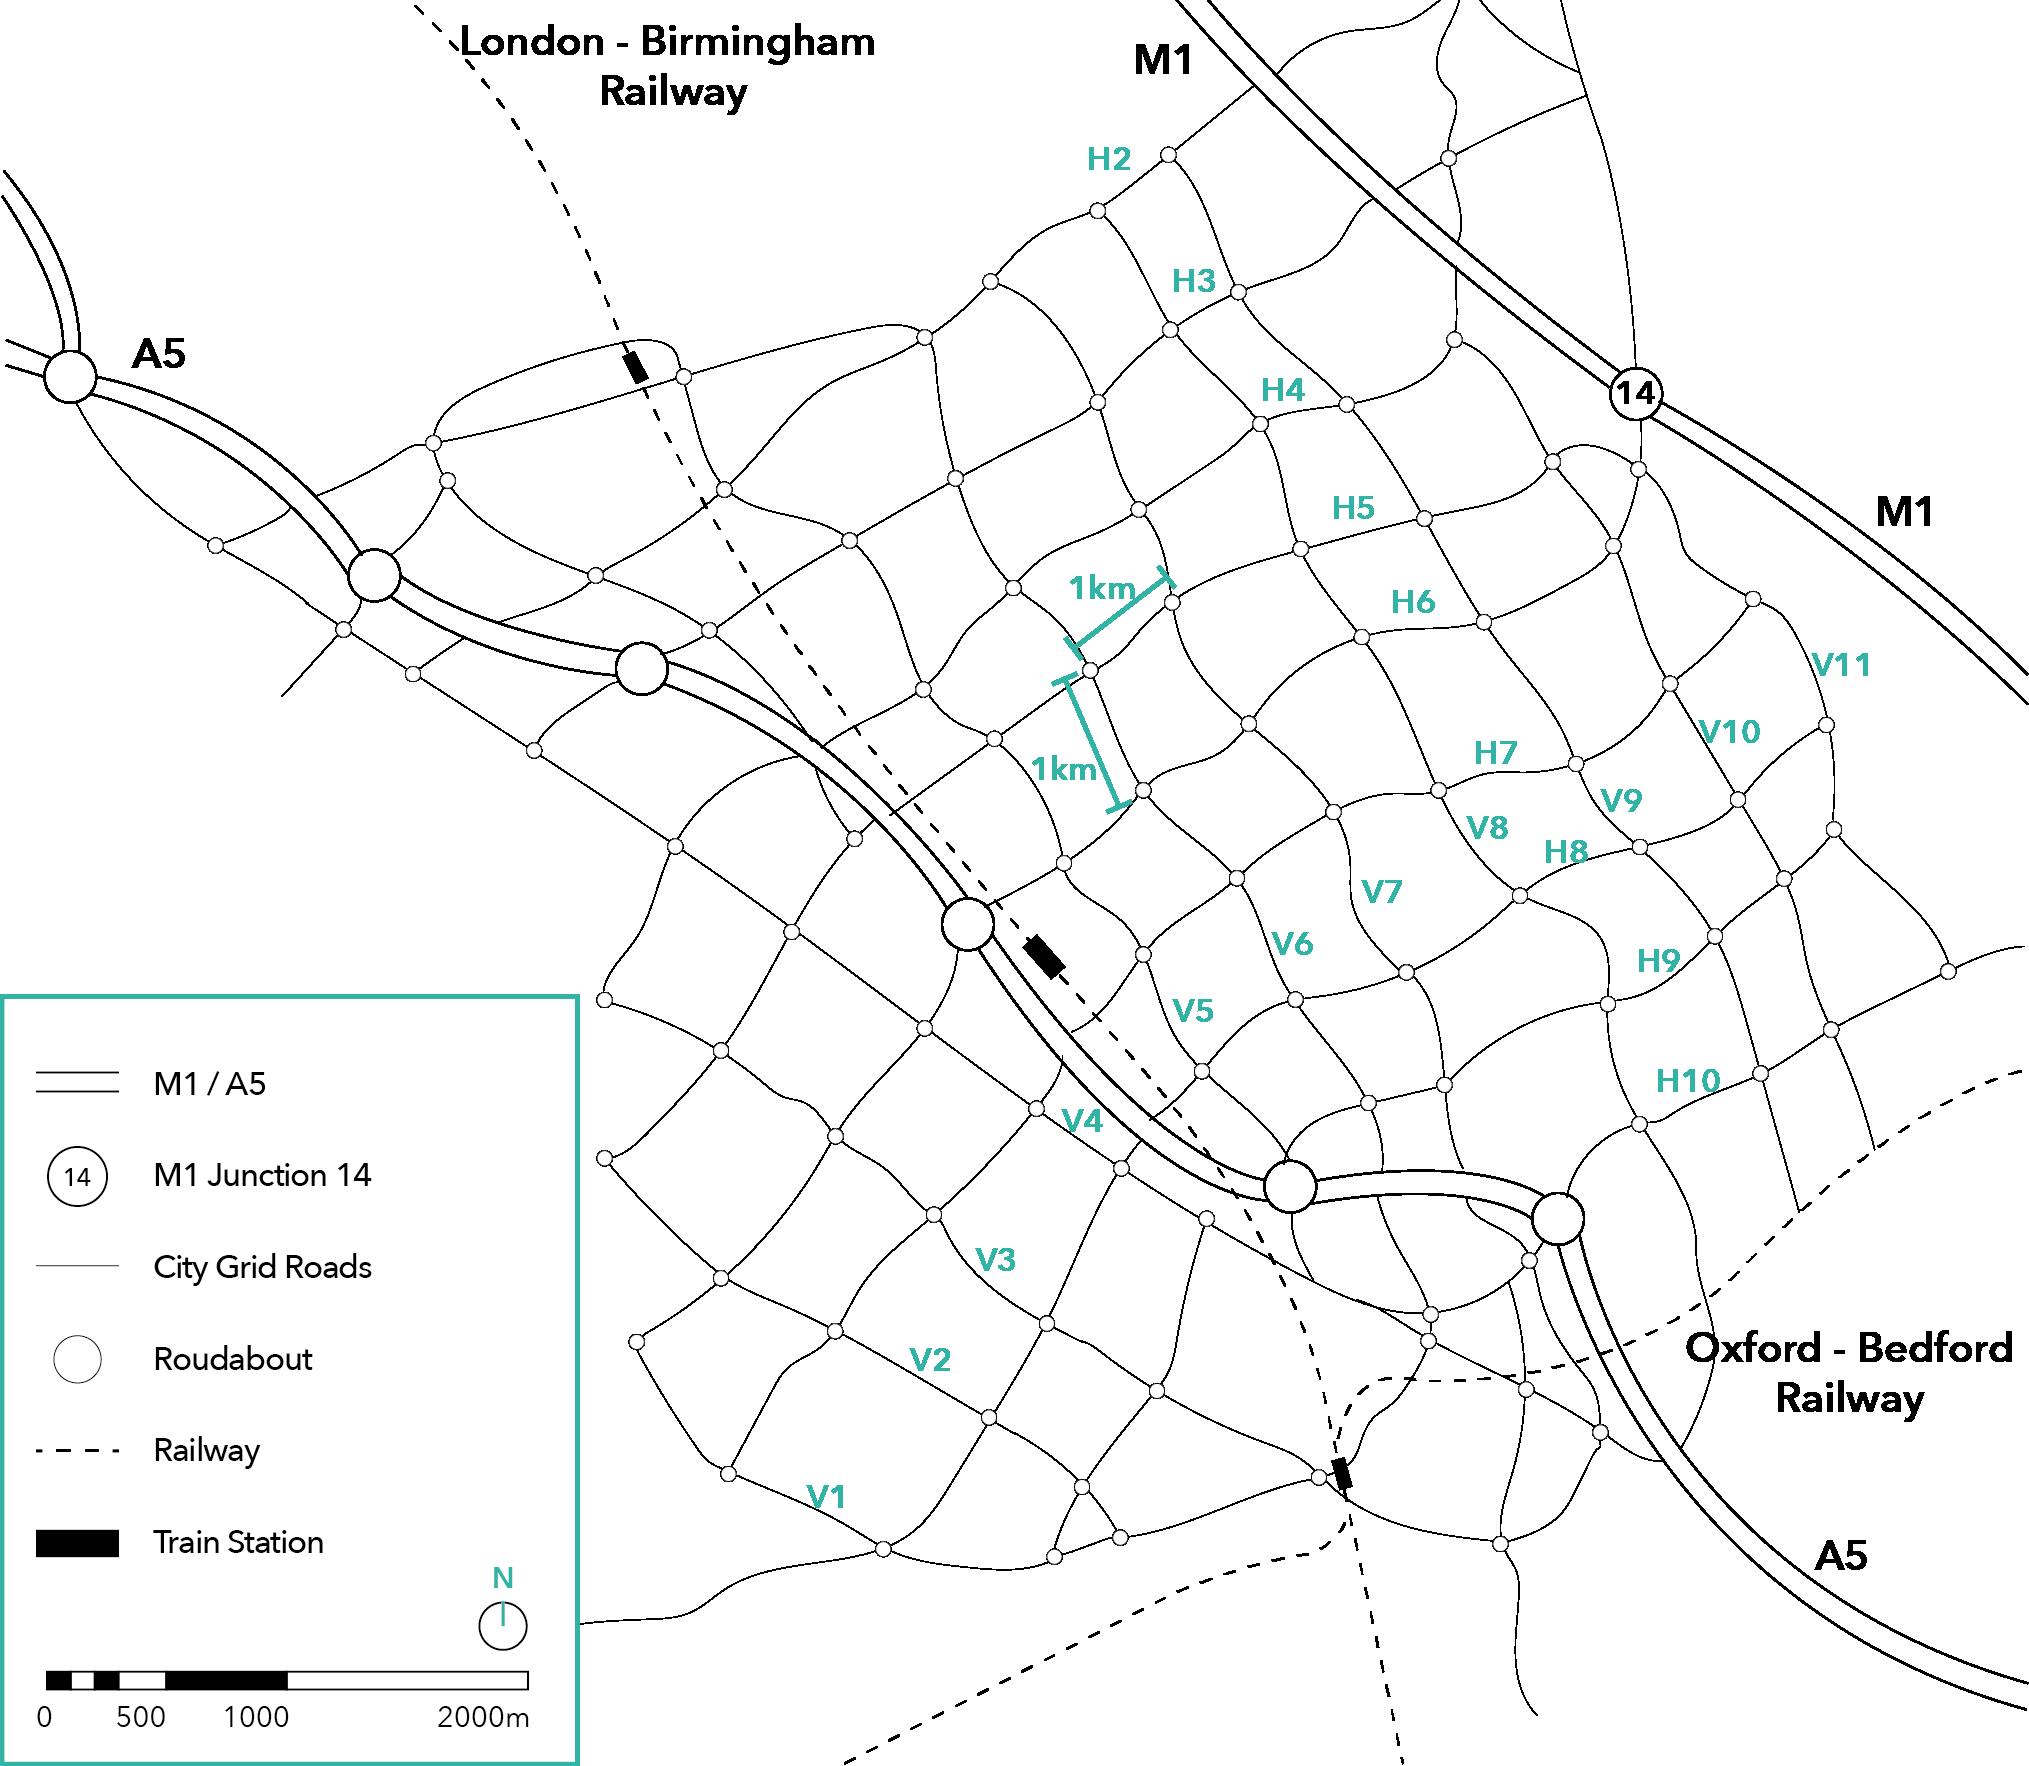
In 1967, the MKDC predicted that “Car ownership is expected to increase to 1-5 units per family during the time the city is being built” (Llewelyn-Davies et al., Volume 2, 1970), therefore the need to create a system to cater this was extremely necessary. MK was the only new town to consider car travel mainly because it was one of the last cities designed and built, when the automotive industry grew rapidly. Therefore, as highlighted in figure 10, MK is structured around the city grid roads, in the form of single and dual carriageways (Llewelyn-Davies et al., Volume 1, 1970), that would cater the high demands for vehicle infrastructure.
Each grid square was intended to be “spaced out at one kilometre (5/8 mile) intervals” (Llewelyn-Davies et al., Volume 1, 1970) with roundabouts at each intersection instead of traffic lights or bridges. This was because of the ideology of quick travel around the city, discouraging stand-still traffic on the grid roads and separating the “rat-running” around the city from local movement occurring in the grid squares (The Milton Keynes planning manual, 1992). The grid was designed to allow “a high degree of flexibility both in the choice of route for journeys within the city” (The Milton Keynes planning manual, 1992) giving residents many options to get from one place to another. To help residents navigate, the MKDC introduced a lettering and numbering system for the roads where “roads running roughly east-west (‘Ways’) are lettered H (for horizontal)” and “roads running north-south (‘Streets’) are lettered V (for vertical)” (The Milton Keynes planning manual, 1992). A combination of these ideas “provides for easy movement by private cars and their penetration to every point in the city” (Llewelyn-Davies et al., Volume 1, 1970) as was intended by the MKDC.
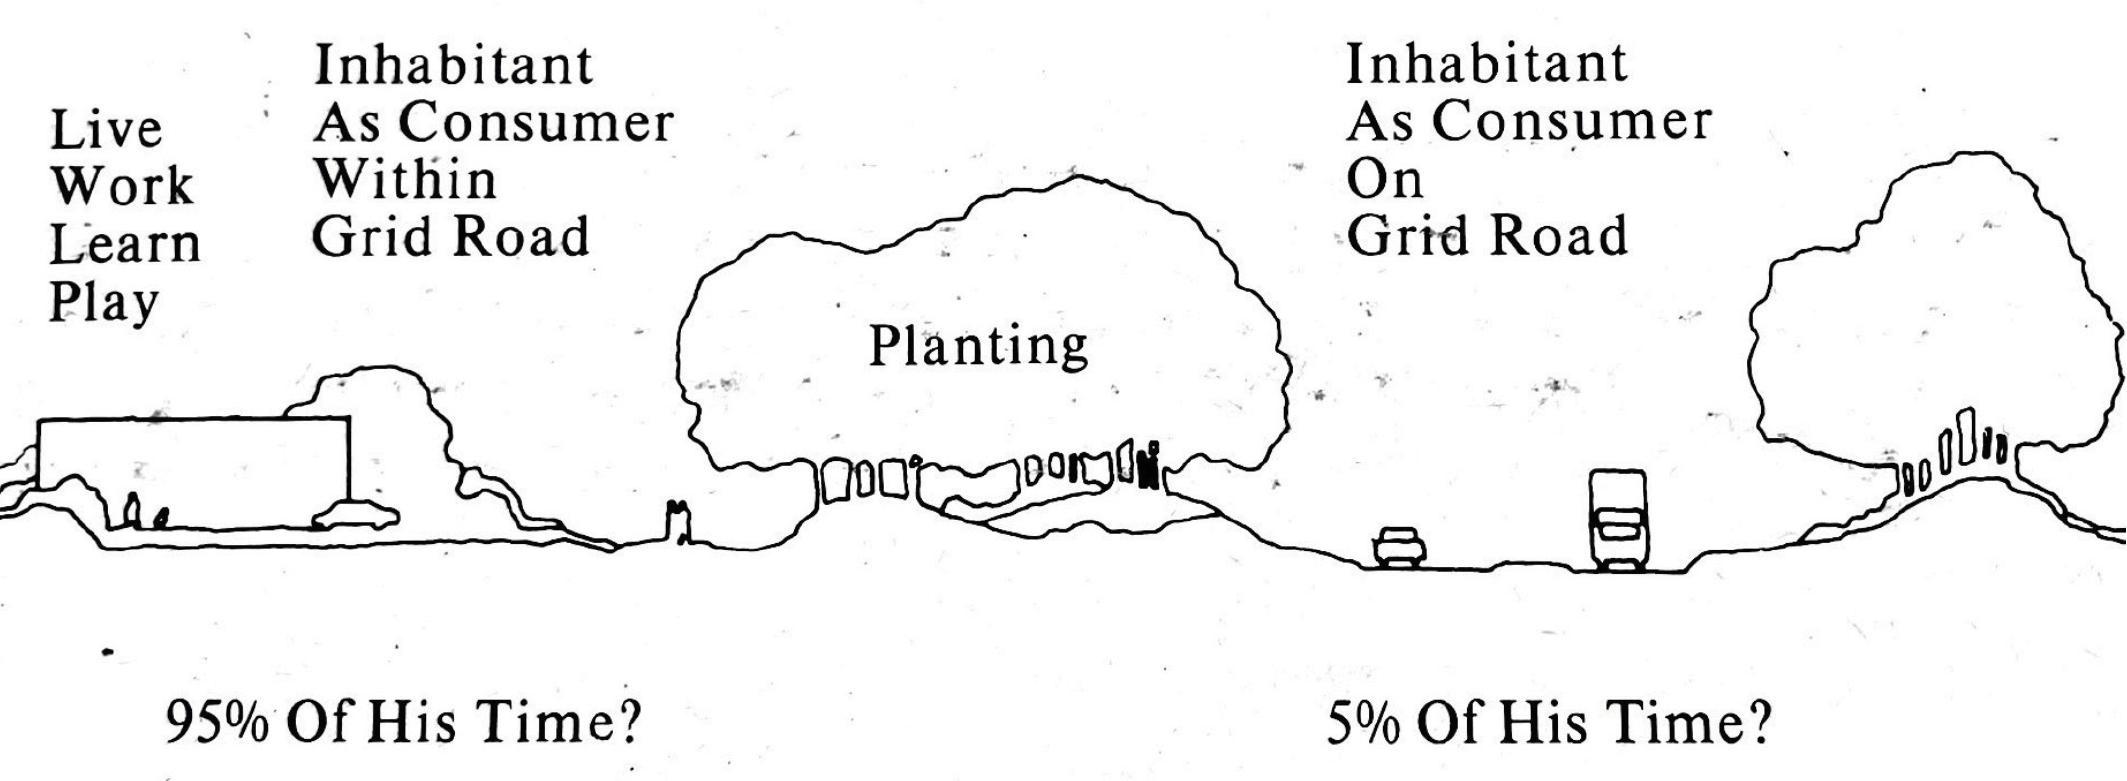
Looking at the grid roads at an eye level perspective, as highlighted in figure 11, vast amounts of landscape was added on either side in the form of vegetation and trees to add “Flexibility in the transport system to allow for expansion and change” (Llewelyn-Davies et al., Volume 2, 1970). There are no buildings in sight and therefore “there is nothing on the grid road network that would make you necessarily want to walk along it” (OpenLearn from The Open University, 1/2, 2017). This was specifically designed to shield living and working communities from the fast travel occurring on the grid roads. The trees act as a shield to protect the activities and daily life within the grid squares as it reduces car headlight glare, noise and air pollution (The Milton Keynes planning manual, 1992)) (Llewelyn-Davies et al., Volume 2, 1970) (OpenLearn from The Open University, 1/2, 2017). The chief architect, Derek Walker, intended that an average resident would spend only 5% of their time on the grid roads and the remainder 95% living life with the grid squares (Figure 12).

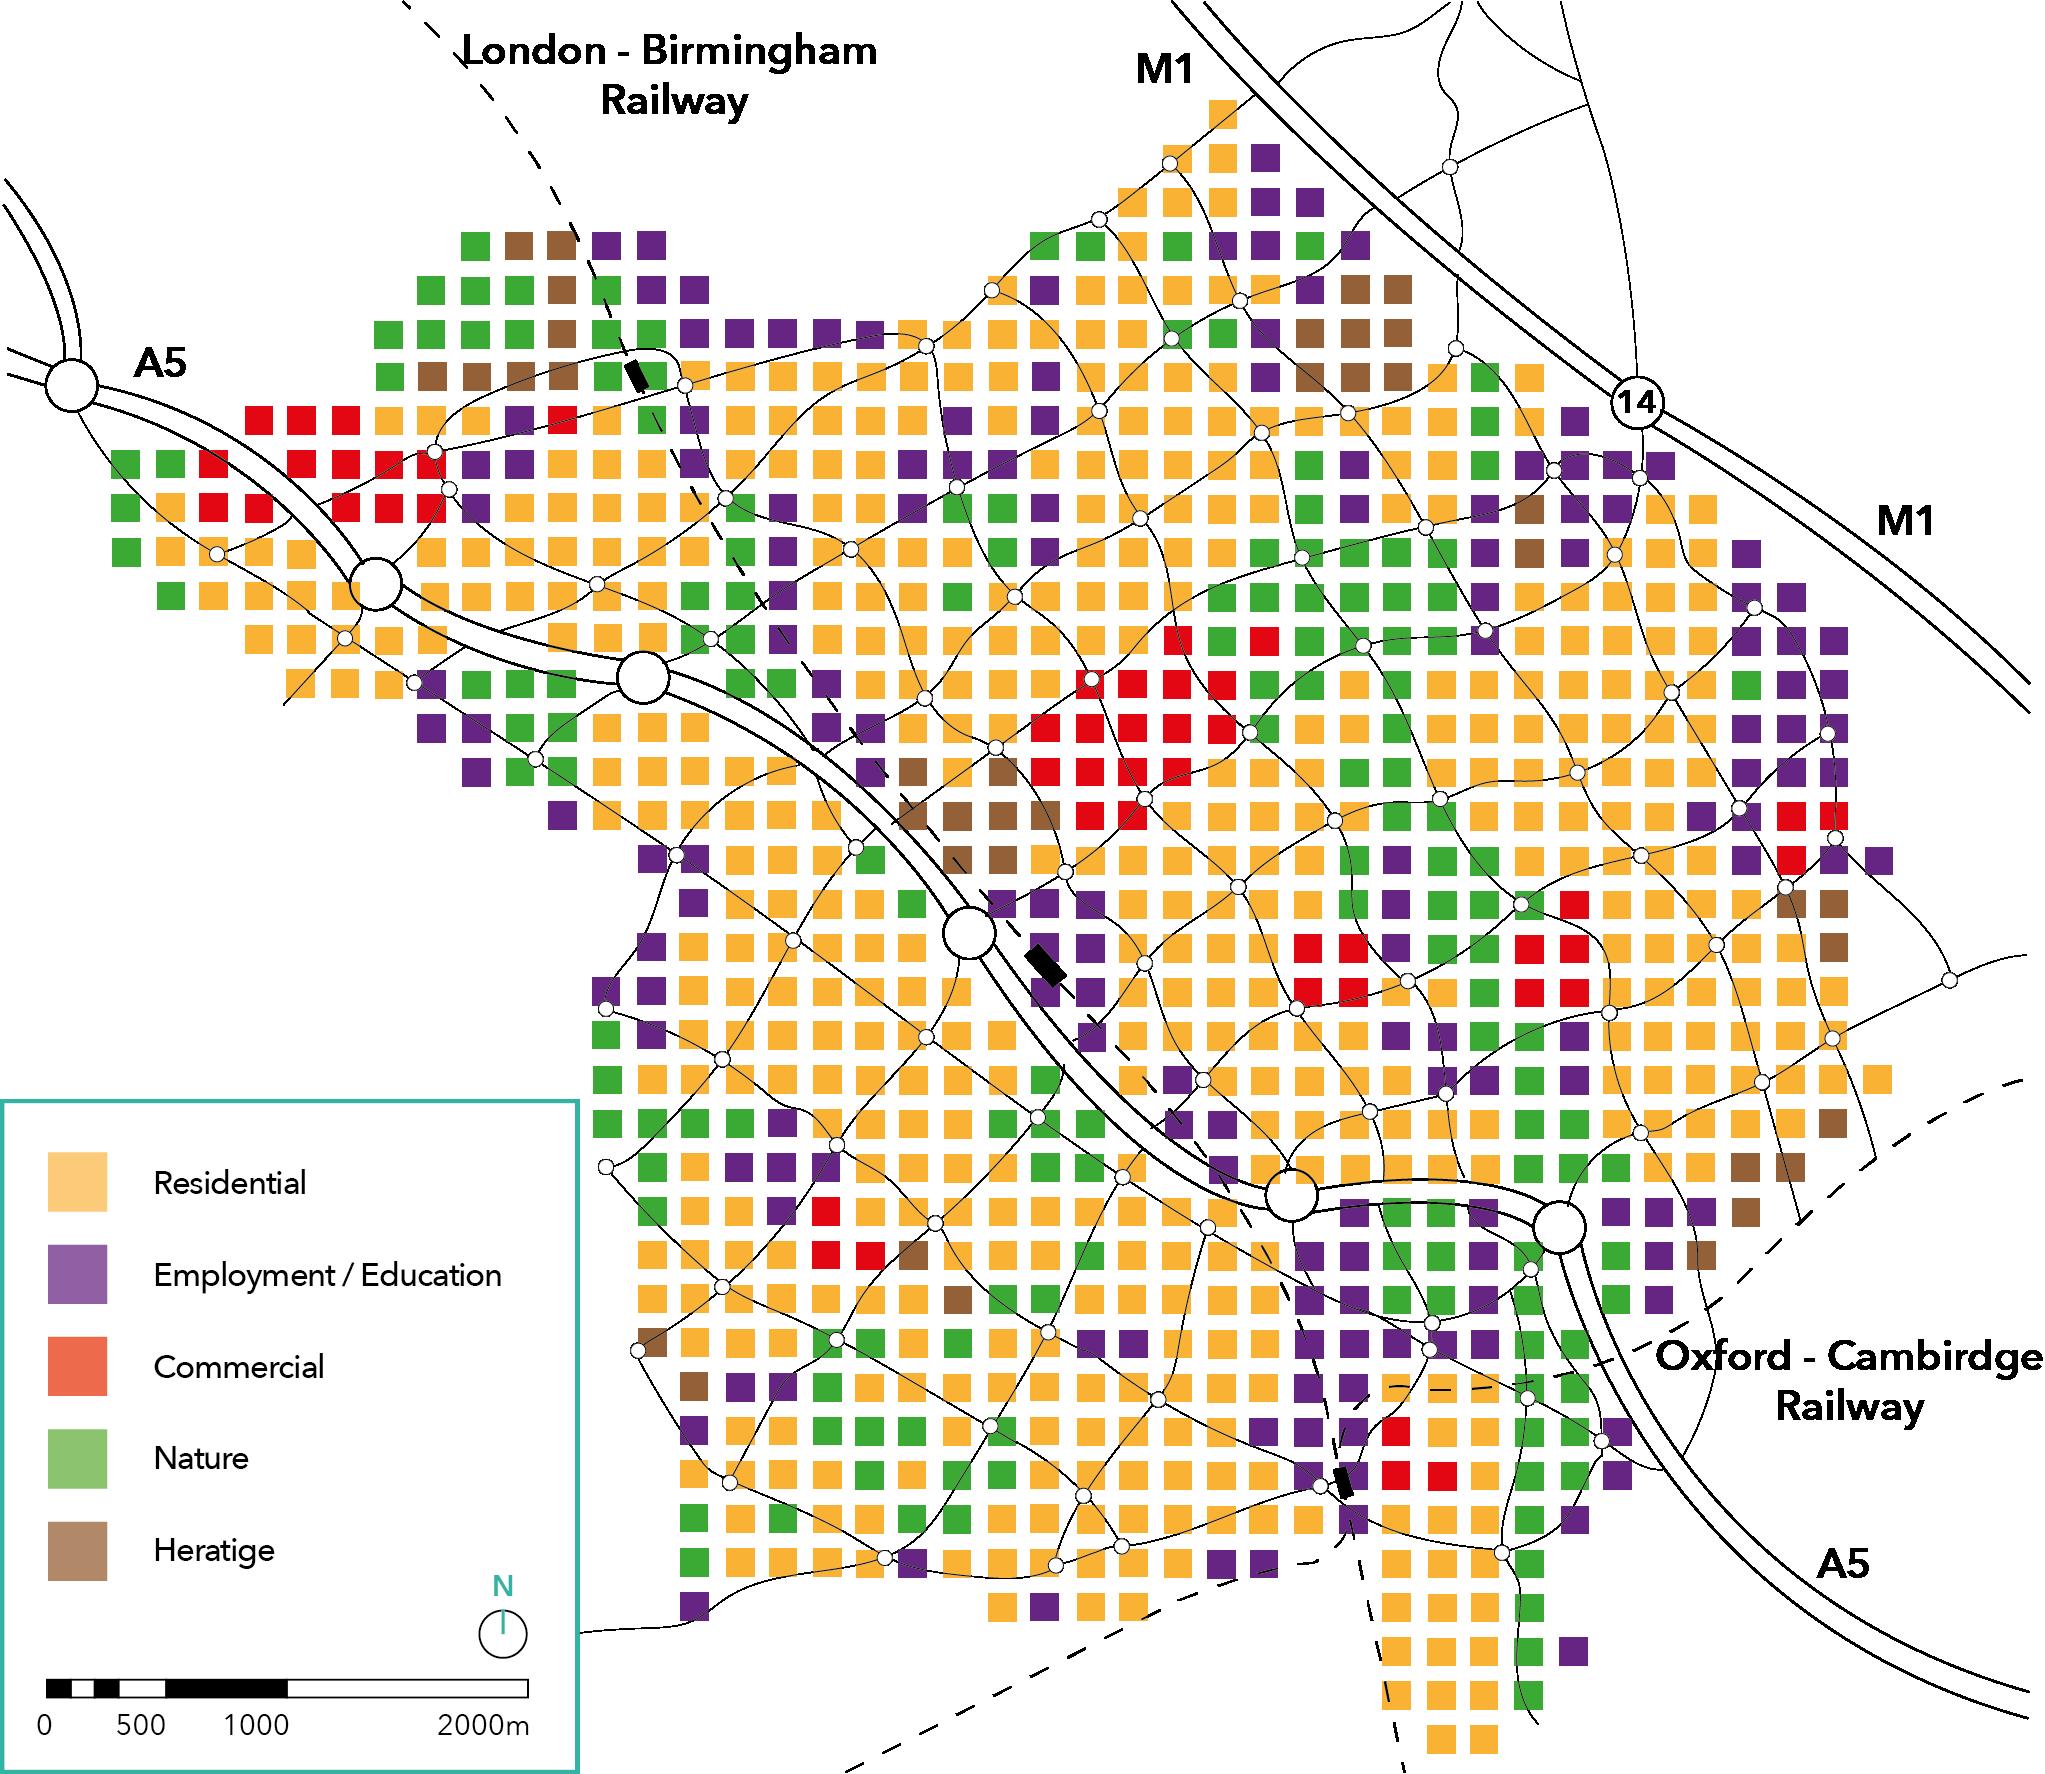
The positioning of facilities is a significant feature of MK’s urban design that differs from the ‘traditional city model’, where most of the activities such as business and shopping, takes place in the centre. The MKDC intended for the city to be fairly distributed in terms of the location of facilities, as highlighted in figure 13. Residential, employment, education, commercial, nature, and heritage zones are all scattered around the city “for an even distribution of traffic” (The Milton Keynes planning manual, 1992), where residents travel towards the outskirts of the city rather than the centre, hence, reducing congestion.


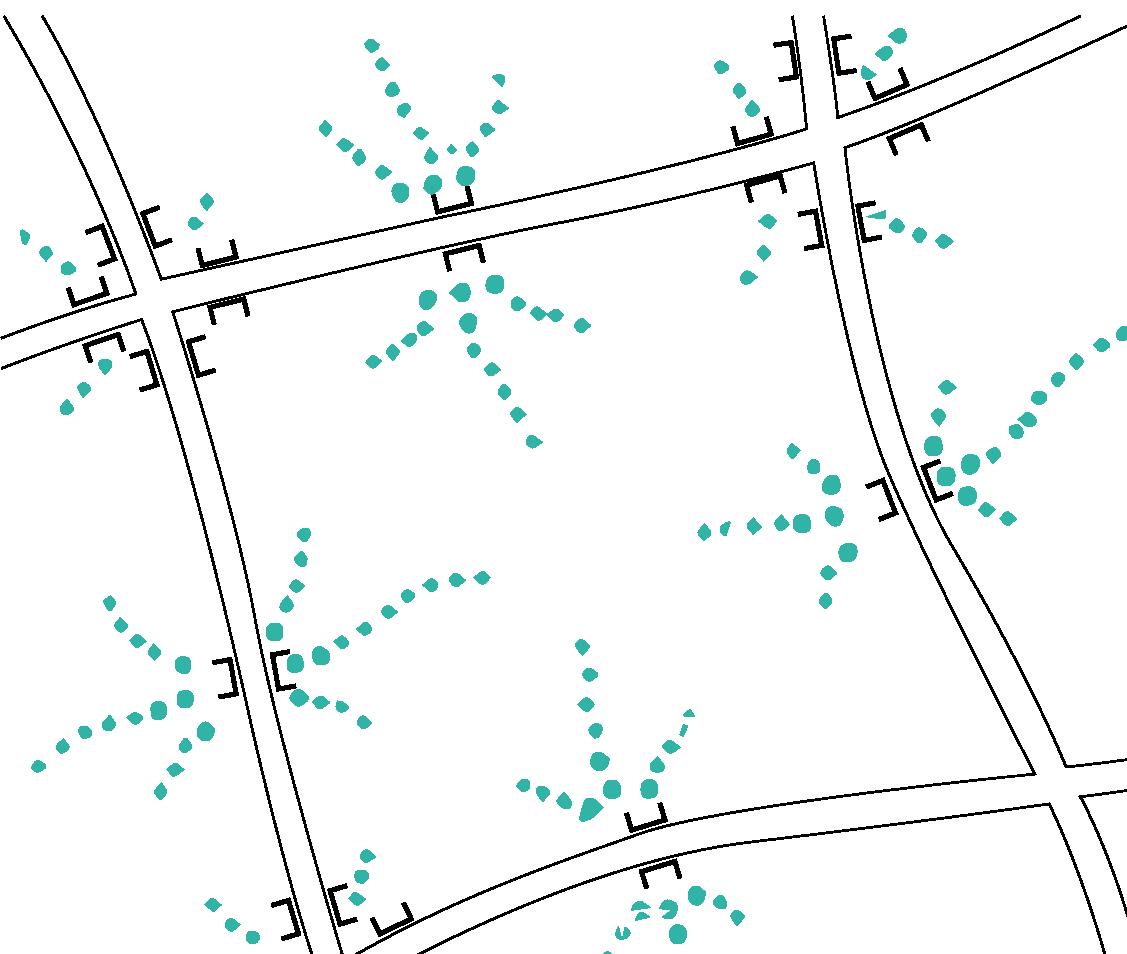
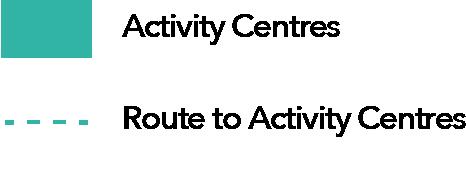

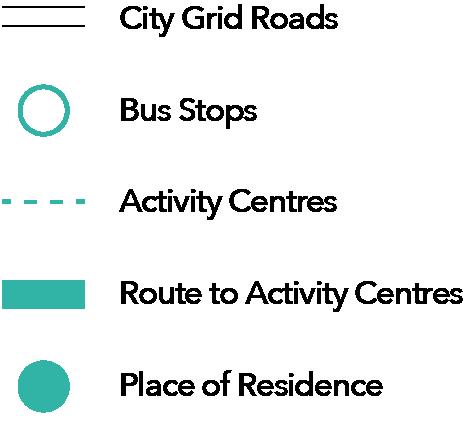


Additionally, the MKDC designed local facilities within the grid squares called activity centres, which would include day-to-day necessity stores, schools, clinics, and bus stops (Llewelyn-Davies et al., Volume 1, 1970) (The Milton Keynes planning manual, 1992). This is highlighted in figures 14 and 15 where these activity centres would be located at the “the mid-point of each length of city road, giving easy access to facilities for residents” (The Milton Keynes planning manual, 1992). These centres were intended to reduce travel on the city grid roads, where the average resident would use them to travel to work and occasional activities that were unavailable in local communities.
Due to the placement of these centres, the MKDC, created underpasses and bridges at strategic locations, depending on land topography, to enable pedestrian and cyclists to cross the grid roads. During the 1960s, underpasses were considered as “inhospitable and unfriendly places” (OpenLearn from The Open University, 1/2, 2017). However, this was overcome by designing these spaces to be “generous in width”… “for you to be able to see through them, from one side of the grid road to the other” and to allow “light to come through them” (OpenLearn from The Open University, 1/2, 2017) creating an airy and open atmosphere.
The addition of underpasses and bridges allowed pathways across the city to connect, creating an “extensive network of footpath-cycleways threaded through all areas of the city” (Walker and Rasmussen, 1982) as long at 320km today (Milton Keynes Future 2050, 2021). This pathway was called the “The RedWay” (The Milton Keynes planning manual, 1992) (Walker and Rasmussen, 1982) (Llewelyn-Davies et al., Volume 1, 1970) and allowed pedestrians and cyclists to travel around the city “Without ever having to cross a main road” (OpenLearn from The Open University, 1/2, 2017) creating a “convenient, safe and pleasant” (Walker and Rasmussen, 1982) environment. (The Milton Keynes planning manual, 1992) Displays the RedWay system to be “lit and located to be visible from nearby housing, roads or other activity areas” to create “The sense of being watched” ... “to offer a feeling of security to the lone pedestrian or cyclist”. The addition of the RedWay was intended by the MKDC, to be used by residents daily, as another form of travel for individuals who are unable to drive a car and to reduce the amount of traffic and congestion on the grid roads
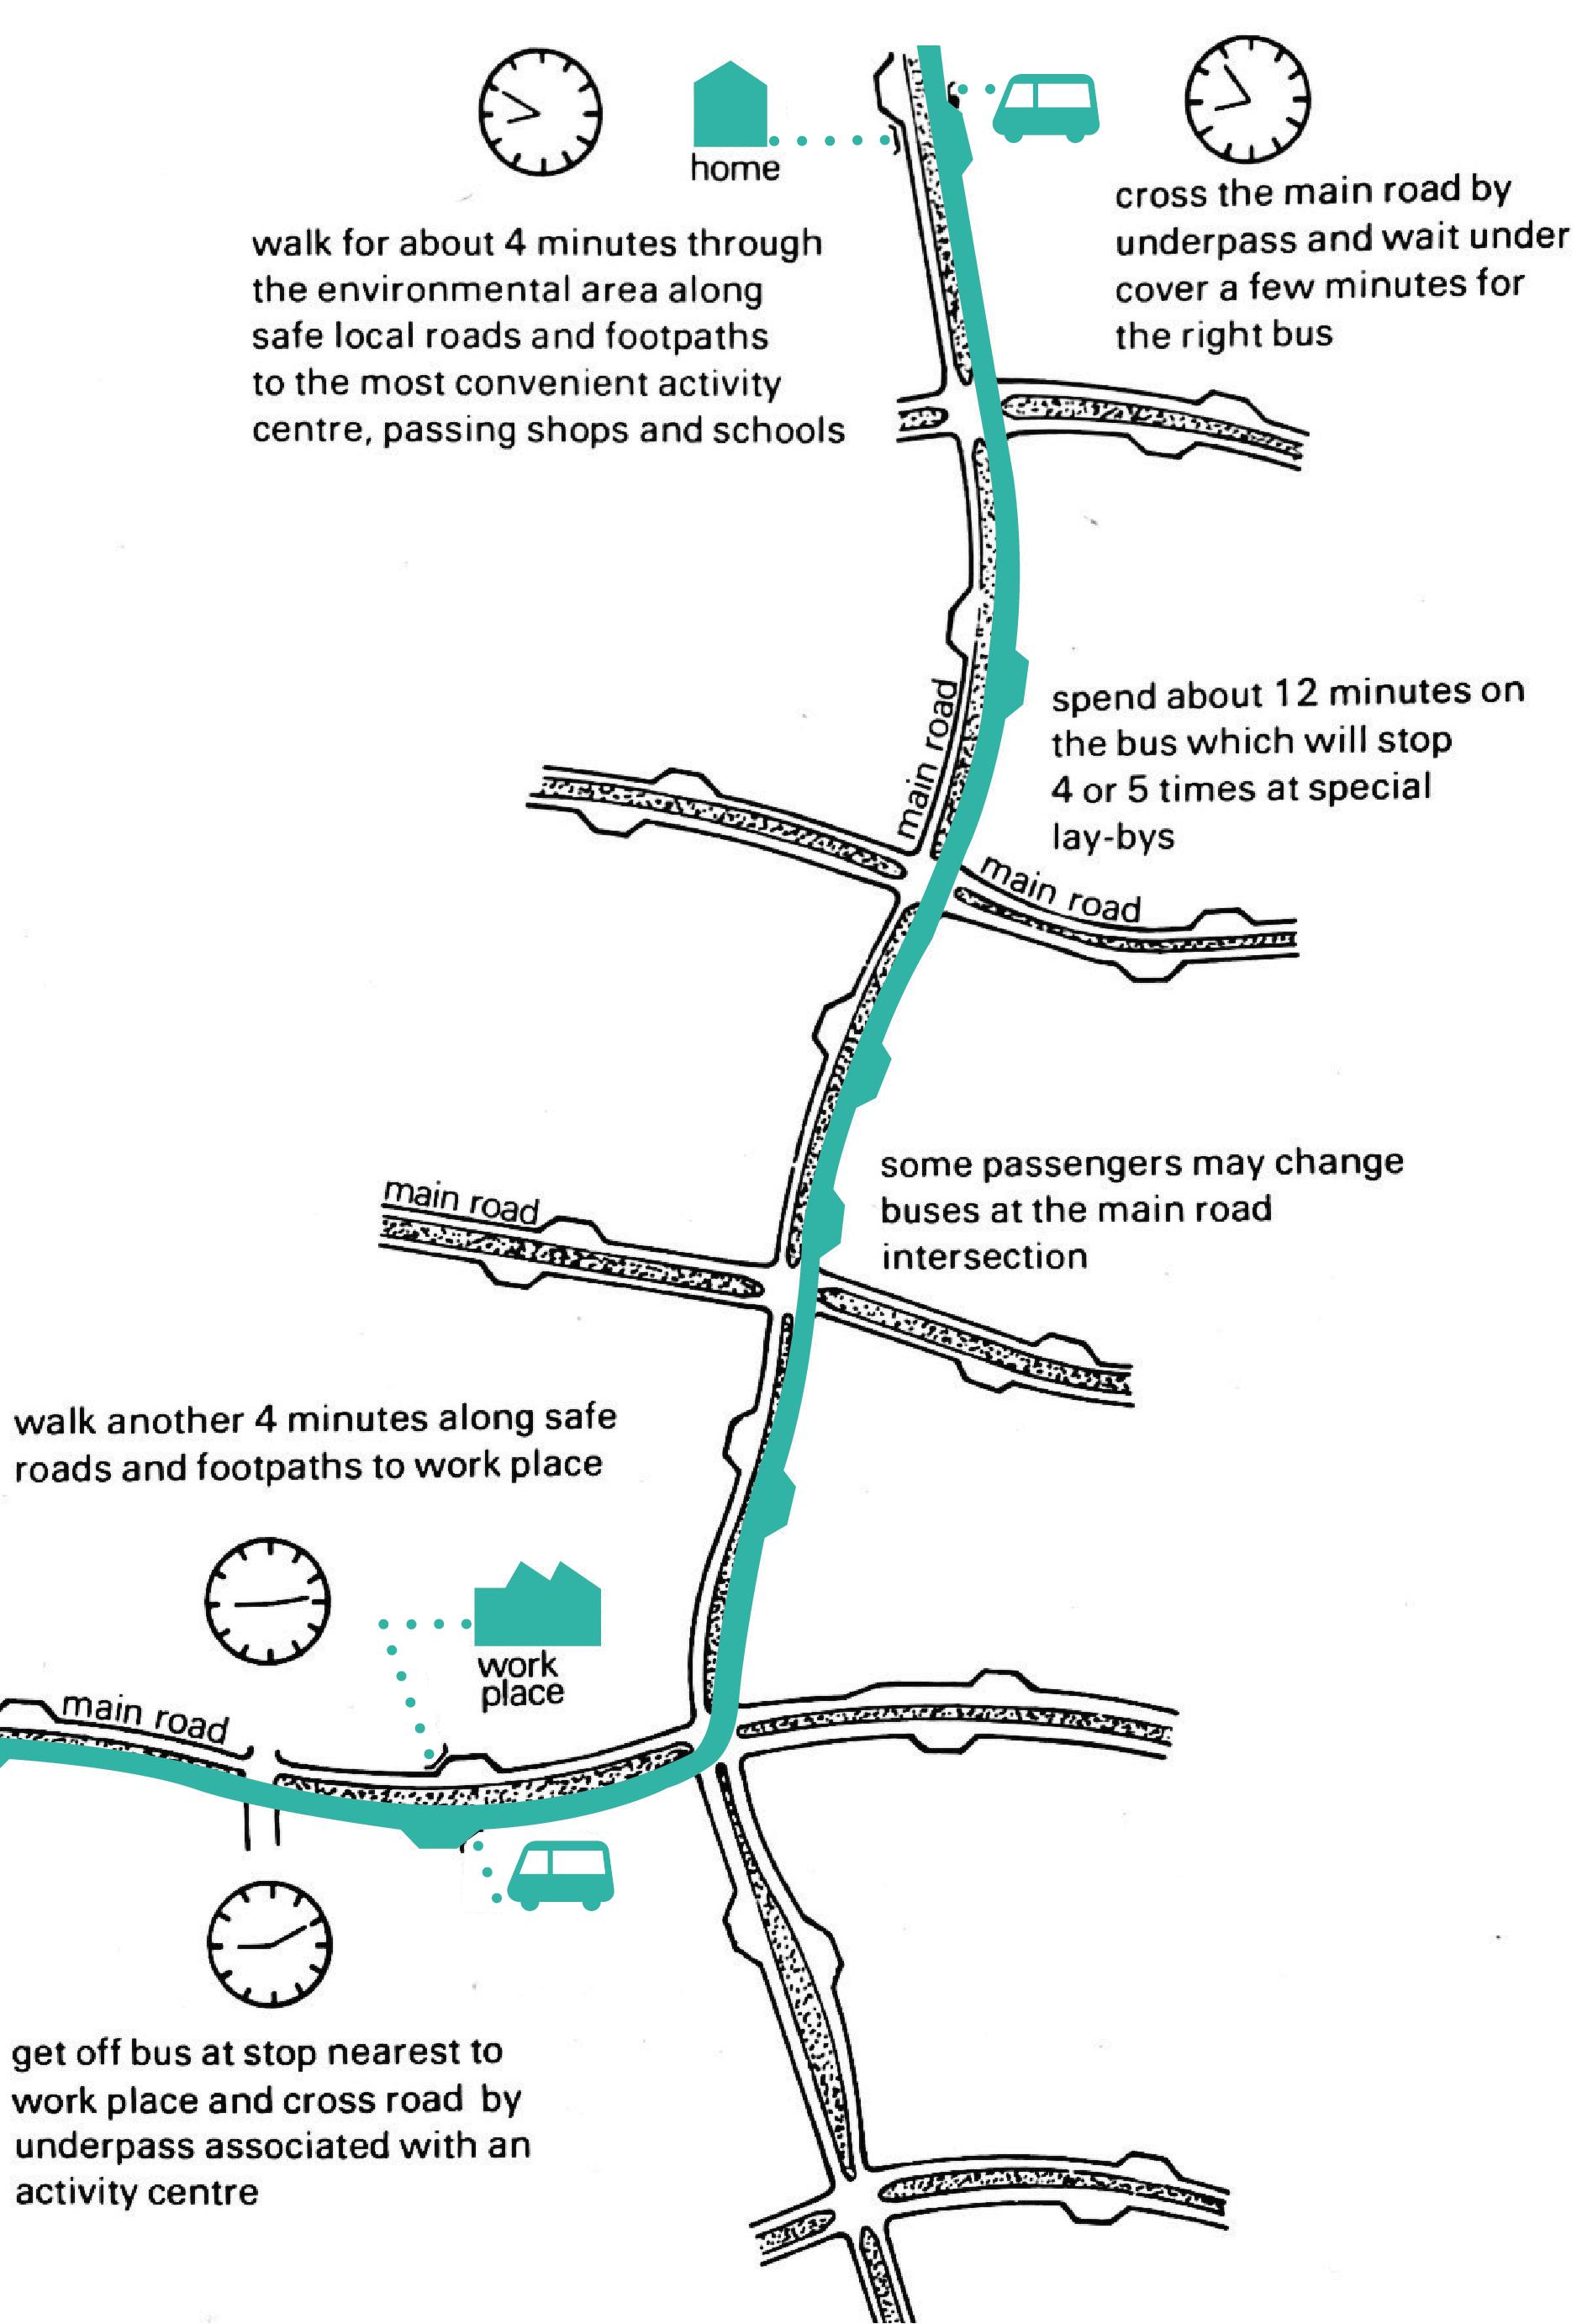
Another way the MKDC made travel accessible to all was the introduction of the public transport system (busses), to be used by residents travelling across the city to farther destinations. Bus routes and stops were intended to be located only on the city grid roads with a “six minutes’ walk at the most from any home” or workplace (Llewelyn-Davies et al., Volume 1, 1970). This is highlighted in figure 17, where the diagram shows how an average resident would travel to work.
(Llewelyn-Davies et al., Volume 1, 1970) highlights the “total time takes from door to door amounts to about 24 minutes” by bus, which was considerably “better than is presently available to people travelling by bus in cities of a similar size”. To ensure a maximum of a 6 minute walk to the bus stops was made, (The Milton Keynes planning manual, 1992) mentions that “bus routes should run within 500m of every house, therefore making travel accessible to all residents in MK.
According to the MKDC, the “easy movement and access” (Llewelyn-Davies et al., Volume 1, 1970) objective was met after implementing the following systems:
• Grid roads
• Distributions of facilities
• Placement of activity centres
• Redway
• Public Transport system, (Llewelyn-Davies et al., Volume 1, 1970) highlights “The corporations goal of giving equality of accessibility, by public and private transport to all parts of the city” allowing “Children, students, old people and those who for one reason or another are unable or disinclined to use private cars” able to travel around the city in a quick, easy and affordable way. The ideas laid out seem almost perfect, however, the 1967 strategy does not consider how the individual user would experience the city. Because of this, various problems have been identified since the building of MK, and is discussed in the next chapter.
Masterplan, Grid Roads, Public Transport, Redway
In chapter 3, the original plans created in 1967 by the MKDC were discussed, where several systems were implemented in the city’s design to ensure the easy movement and access objective was met. For example, the distribution of facilities, activity centres, the RedWay pathways across the city, the grid road design, and the strategy for public transport. All of these systems will be explored again in this chapter where a full examination on how MK resident’s interact with them on an eye level perspective.
Since the 1980s, shortly after phase 1 of the plans were completed, a wide range of literature was written on reviewing the design of MK. This chapter will discuss the 2022 reality of the city and compare it with original plans to examine whether the “easy movement and access” objective is still successful today.

As highlighted in chapter 3, the positioning of facilities was a key feature in the masterplan and the ‘easy movement and access’ objective, as it helped distribute traffic across the city rather than being focussed towards the centre. To analyse the original plans against today’s reality, a site map was created of MK in 2022 to display a side-by-side comparison with the 1967 concepts (figures 18 and 19).

Both diagrams are very similar in the way building types have been evenly distributed, apart from minor changes such as the demolition of the Oxford to Cambridge railway line and the layout of each local estate. Therefore the 1967 plans can be seen as a success in terms of constructing what the MKDC intended. However, this chapter will go into more depth about whether the intentions and ideas highlighted in chapter 3 are still successful today.

(Llewelyn-Davies et al., Volume 1, 1970) discusses “No large scale separation for different kinds of people”. However, due to the grid layout and plantings separating each grid square, every community has its own identity. To explore this in detail, an auto ethnographic study was conducted by driving around each estate in MK to analyse their status. The following criteria and questions were used to identify and determine the communities status.
• The structure and landscape of the community: Are the local roads and properties designed with a rigid or fluid structure?
• Space between each property: Are houses spread out, or is the area congested?
• Property Age: Is there a relationship between estate age and status?
• Property Size: How big is the property? Does it have a front garden, driveway, or gate?
• The Atmosphere and Ambiance of the area: Is the community attractive with a variety of nature? Does the community feel like an urban setting with a a lot of cars on the road?
• Type of houses and architecture: Are the houses detached, semi-detached or terraced? Did the area look like it was mass produced, or was considerable time taken to design the community?
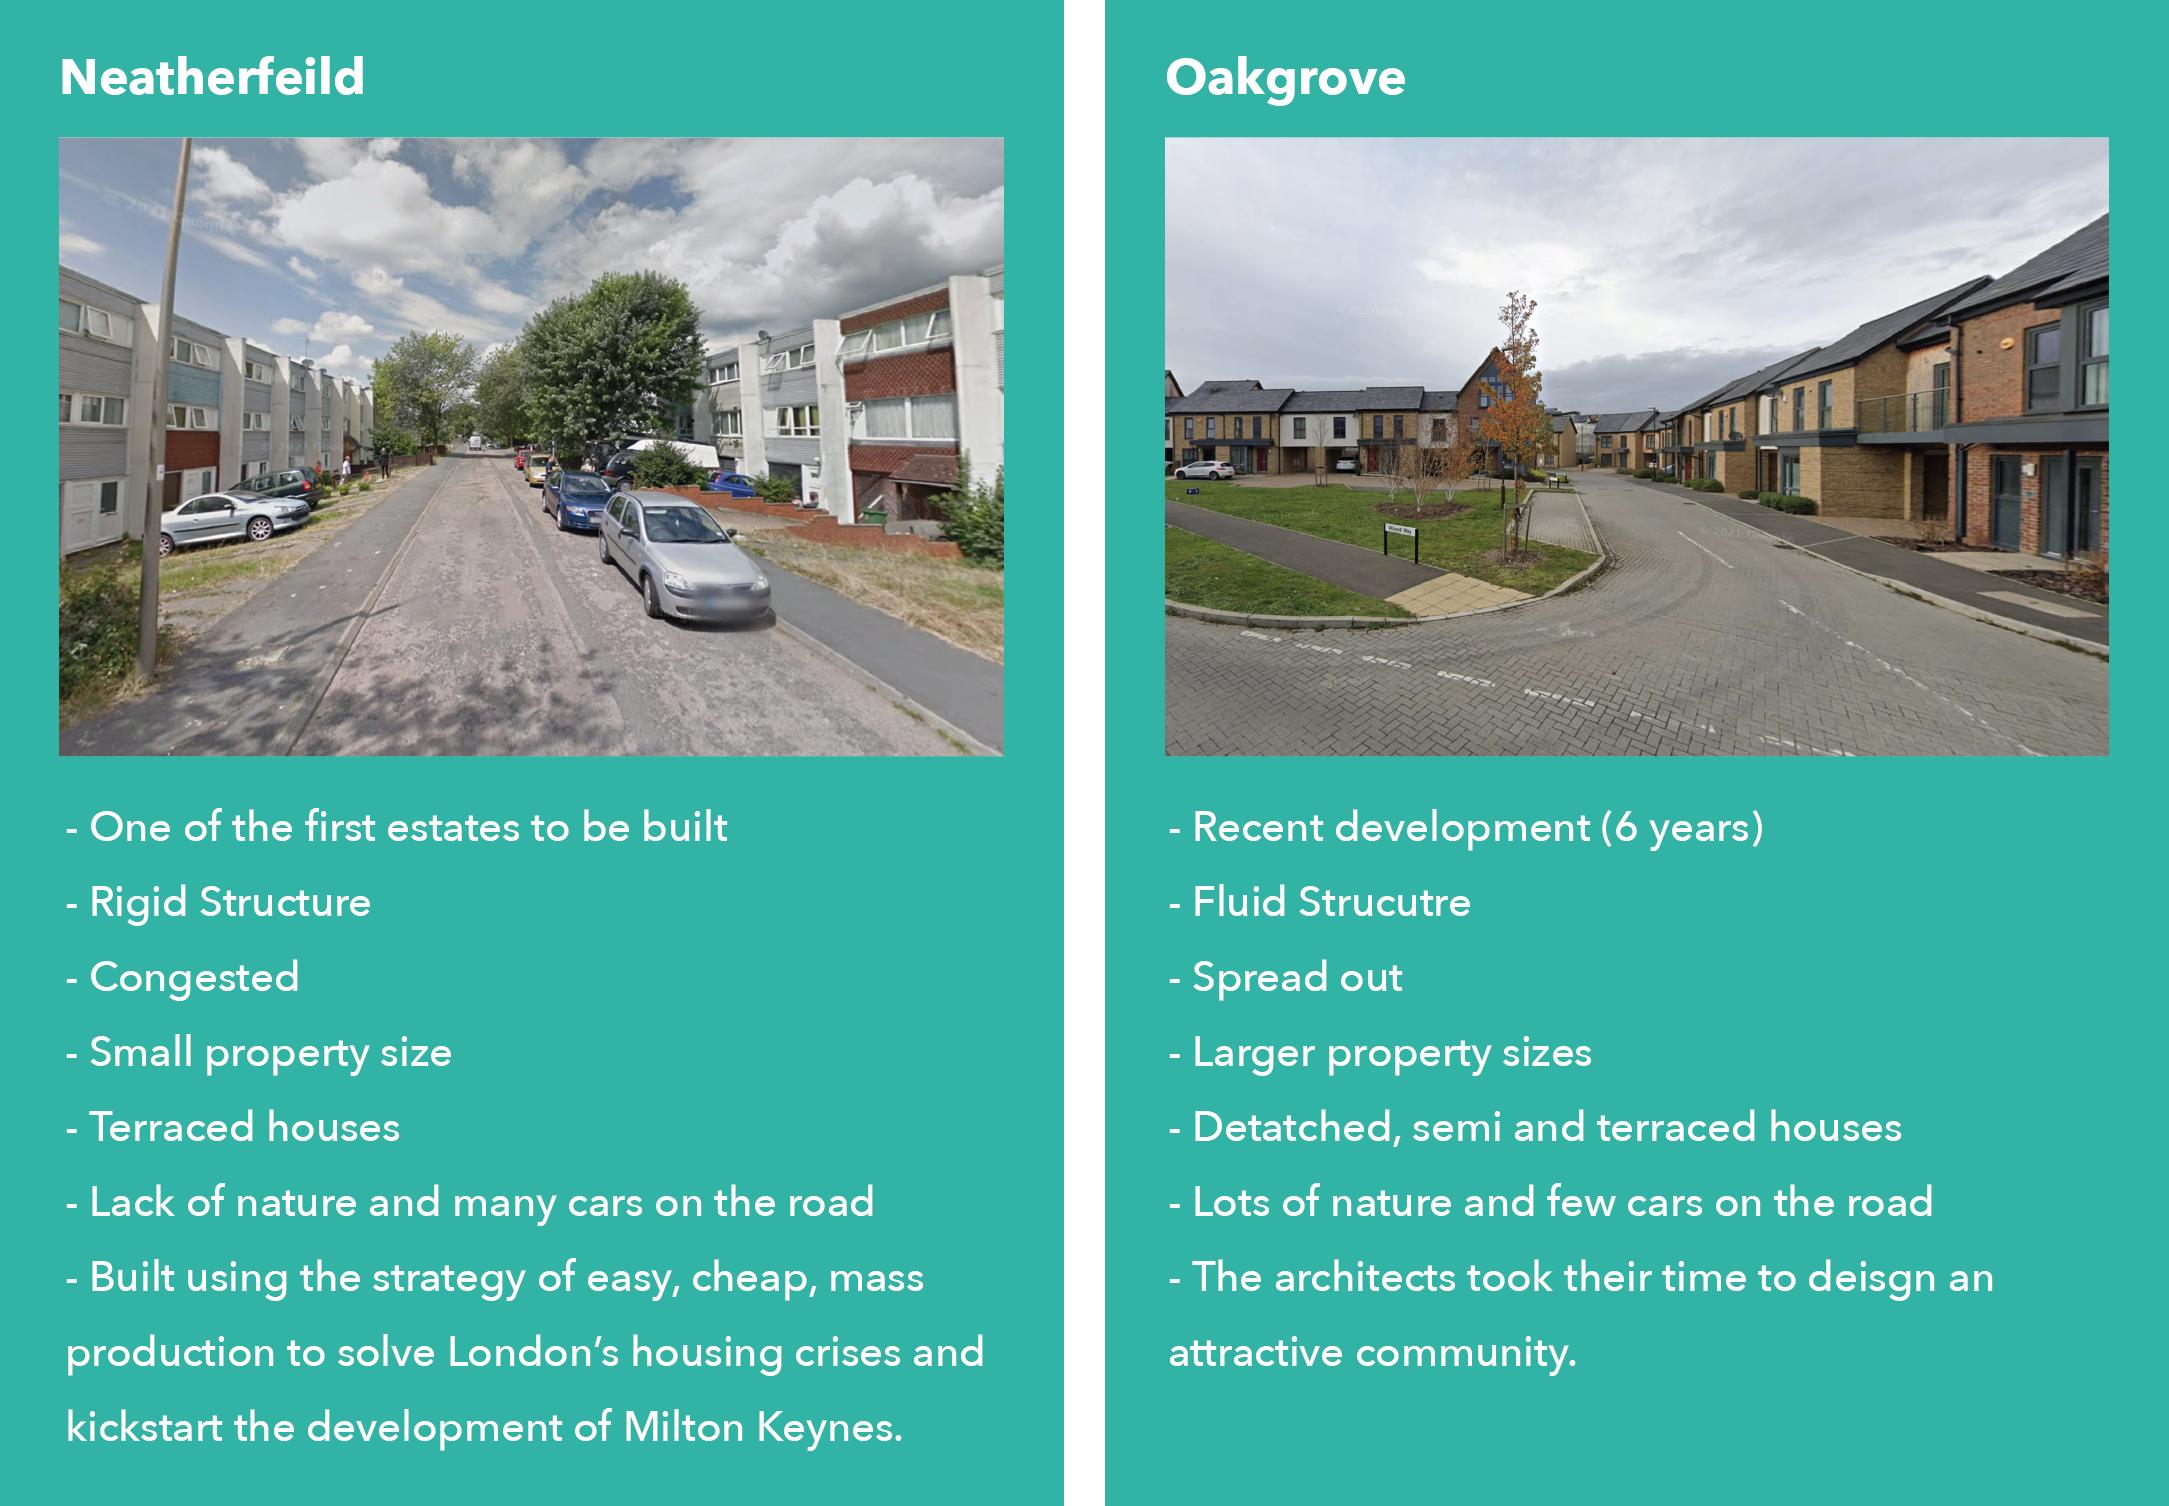
Using this criterion, Oakgrove and Neatherfeild were hand-picked to show examples of a low-end (inexpensive) and high-end (expensive) area in the city (Figure 20). After completing the auto ethnographic study, conclusions for each community were made as highlighted in figure 21. The diagram displays an enormous separation between good and bad regions in MK, with the better areas being located on the city’s east and west flanks, further away from the city centre. But why is that the case? The type of amenities available near communities could be one reason for the split; however, because MK is evenly distributed, this does not justify the divide. Another factor could be the grid road arrangement, which makes it simpler to reside on the outskirts of the city while still being close to the amenities the city offers. It begs the question on why residents would live closer to the city centre in compact and congested conditions, when they can live further away and have quick and easy access to the city’s amenities.
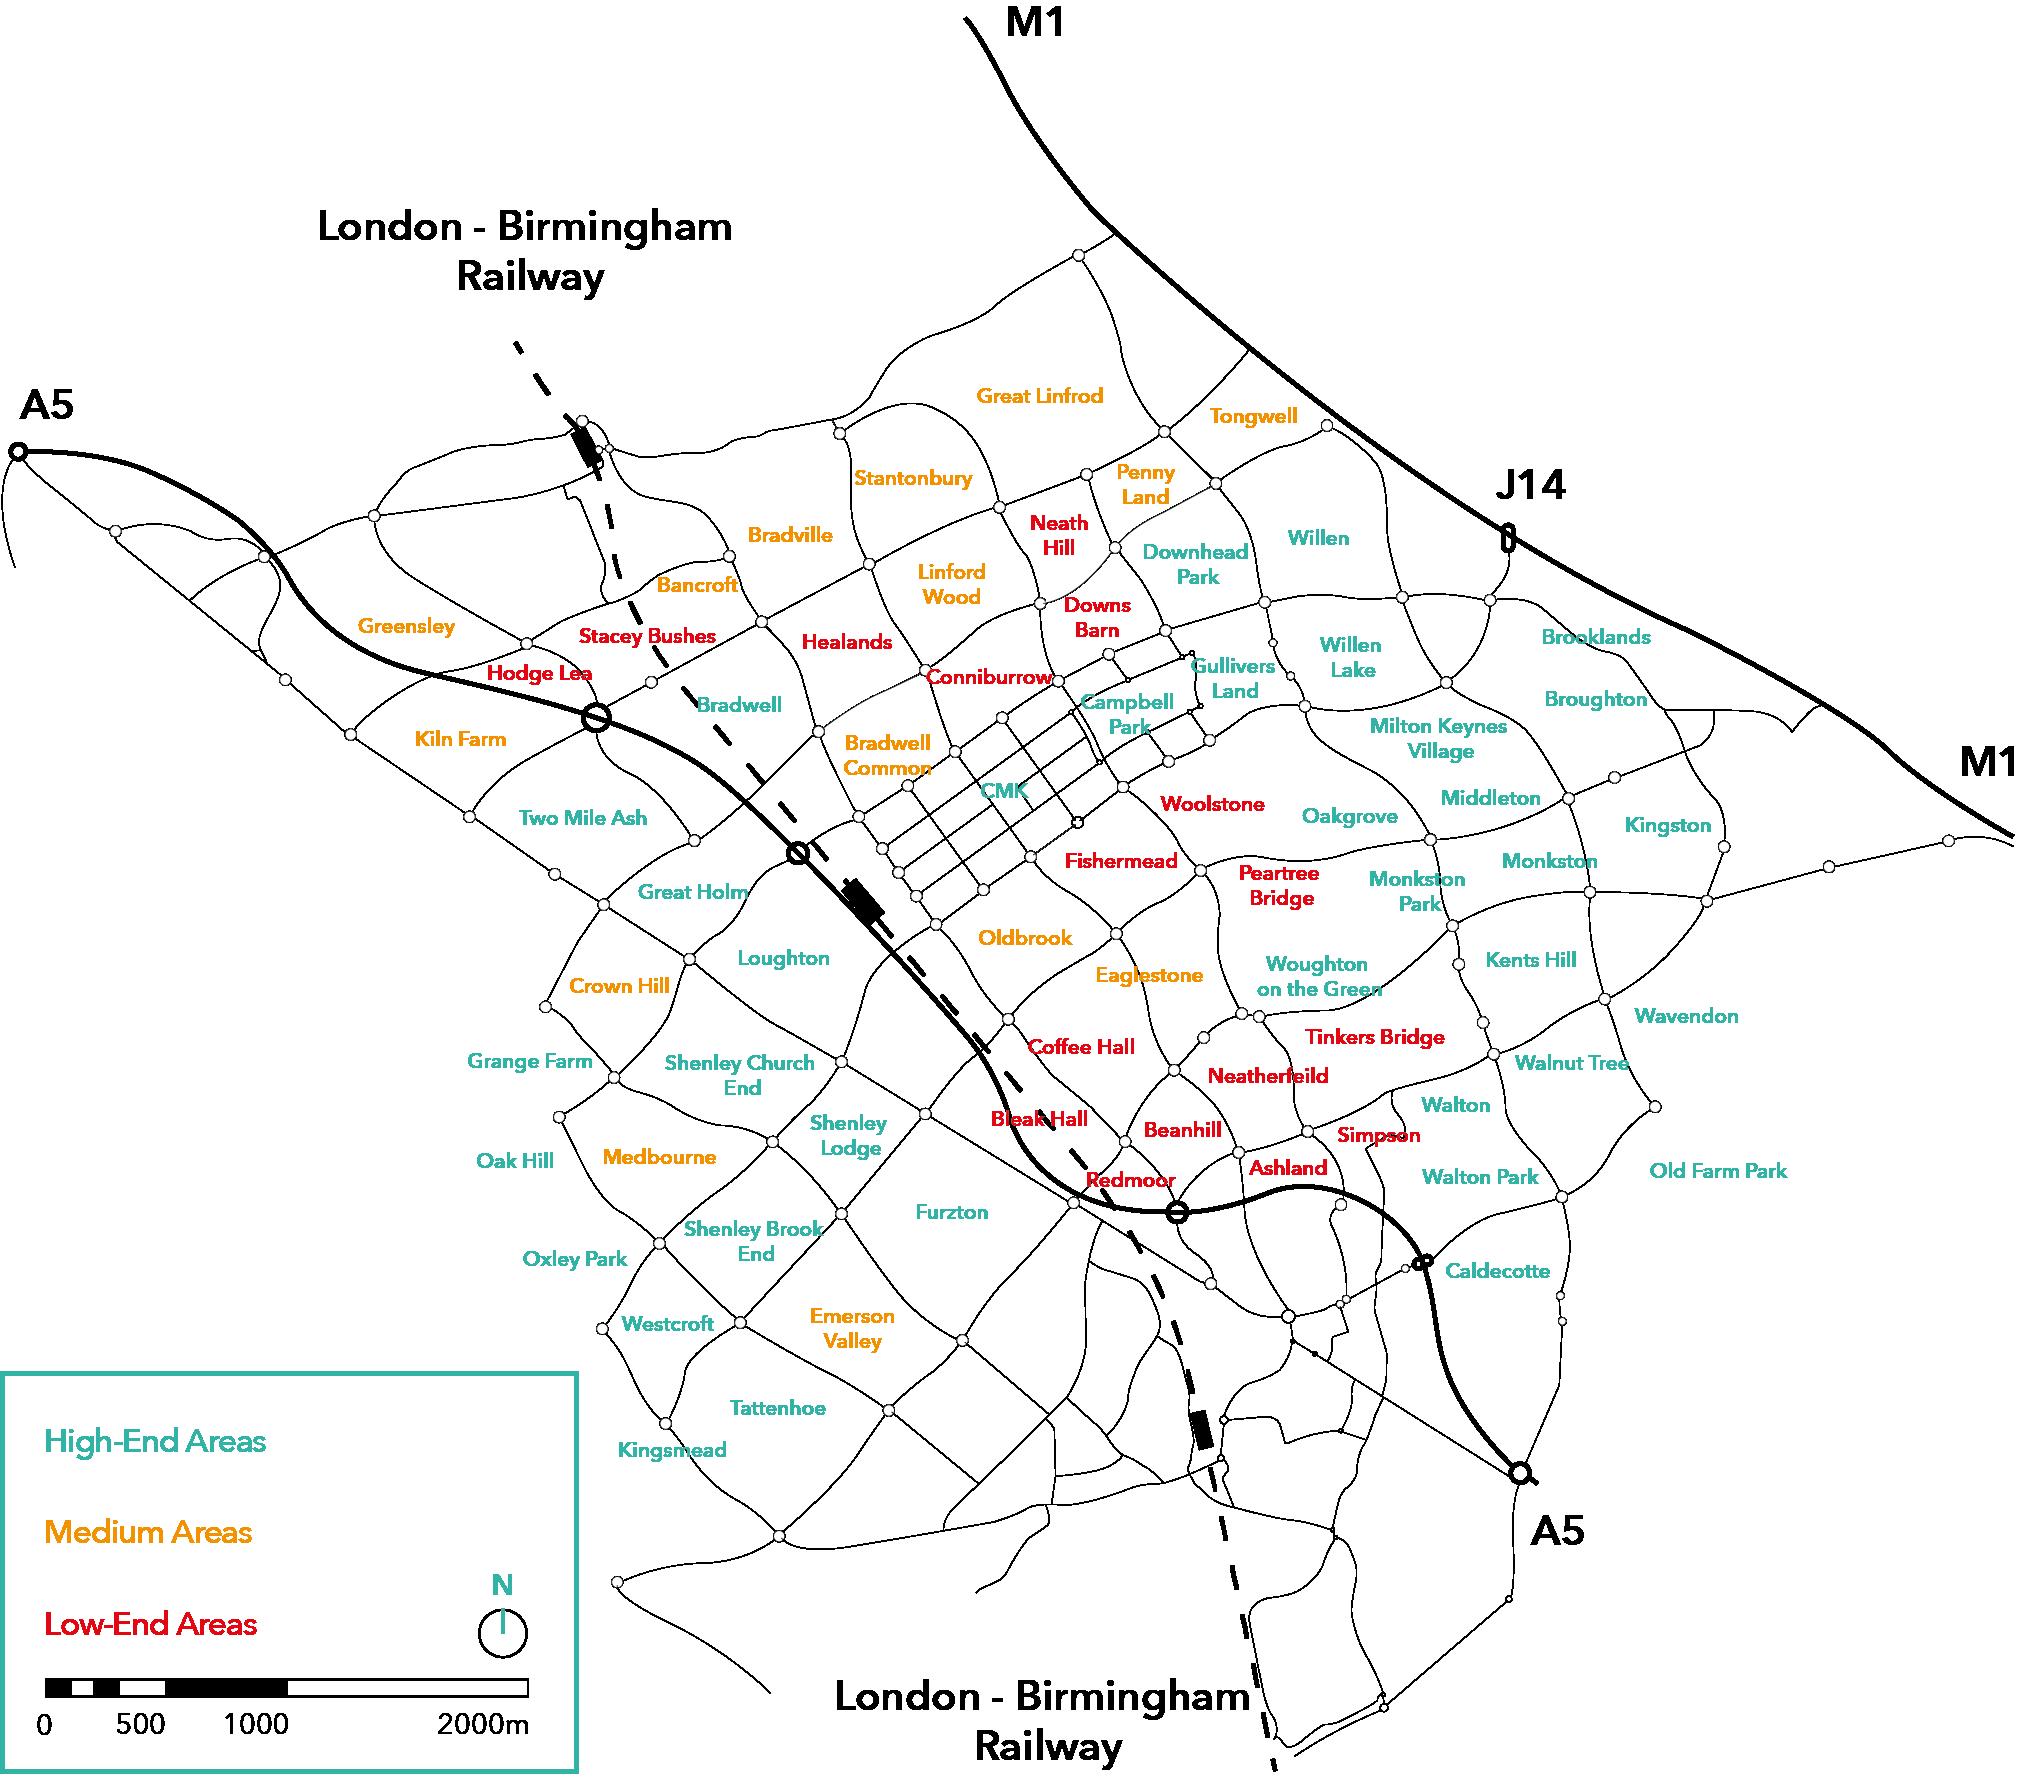

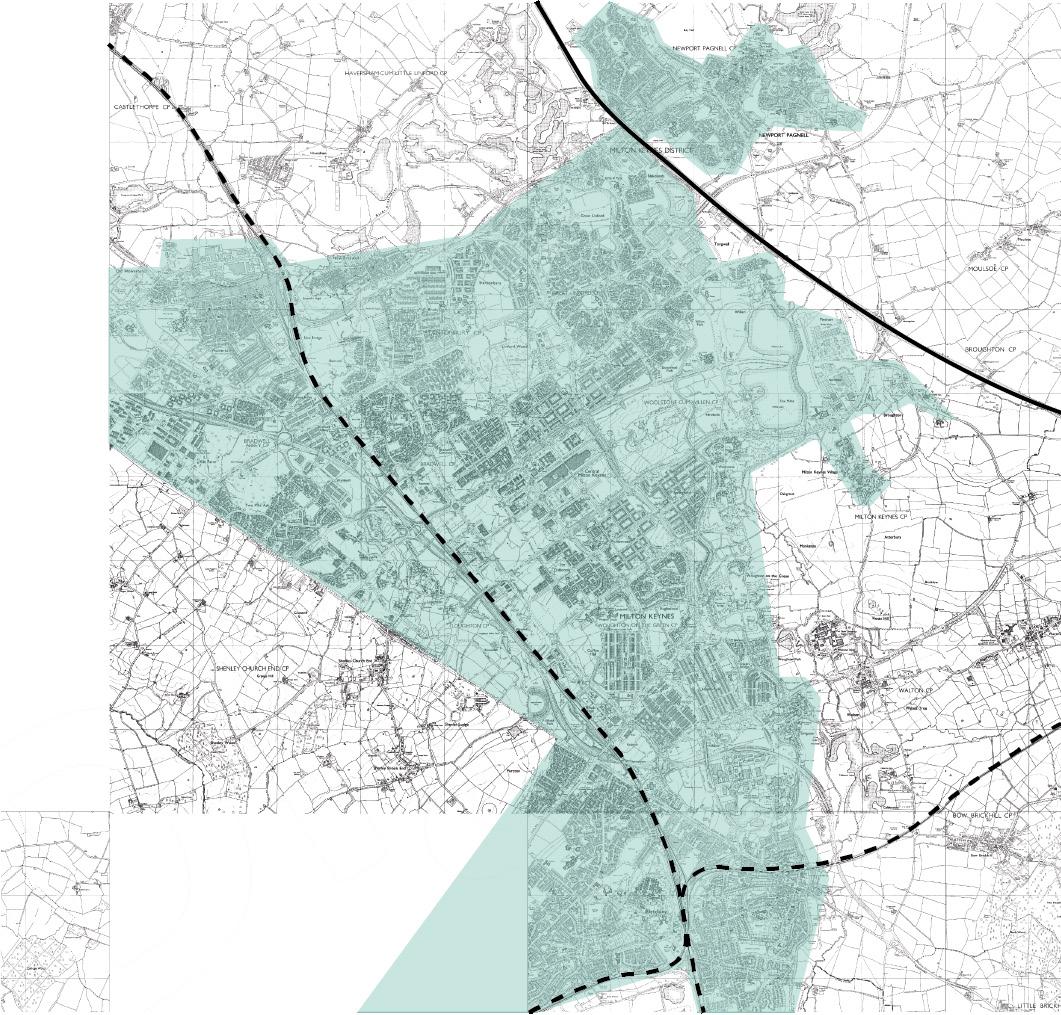


Figures 22, 23 and 24 highlight historic maps showing the development of MK overtime. We find the reason for this divide is due to the mass production of houses between the 1970s and 1980s to quickly solve London’s housing crises and construct MK. This resulted in congested low-end housing and rigid community layouts with little design thought.
As highlighted in chapter 2, the plantings on either side of the grid road play a massive role within the urban design of MK. (Walker and Rasmussen, 1982) portray the benefits of the grid road plantings, where it “increases privacy, reduces the glare from headlights, and the visual intrusion, of car movement”. This allows the average resident to “have a carefree walk following the nature paths” (Walker and Rasmussen, 1982) without being distracted by the busy grid road network. The implementation of the grid road system also makes it “easier and faster to journey around MK by car than in any other UK city of comparable size” (Milton Keynes Futures 2050 Commission, 2016).
However, there have been many negative views on the design of the grid roads. Steen Eiler Rasmussen, a danish architect and urban planner, argues that “You will feel locked up in a maze, lose your orientation, and suffer from claustrophobia” (The (Walker and Rasmussen, 1982). This is further elaborated in (OpenLearn from The Open University, 1/2, 2017) where interviews to residents were conducted and shared similar views. Residents discuss getting “lost, because everywhere just looks the same”, not understanding “where I was going because there was no landmarks” and the need for “satnav to get to places” (OpenLearn from The Open University, 1/2, 2017). These interviews essentially highlight the lack of way finding in MK making it hard to navigate from one place to another.

In the 1980s, after the publishing of (Walker and Rasmussen, 1982), the MKDC discussed a variety of solutions to solve the way finding problem, such as “using towers and spires as landmarks” (Bendixson and Platt, 1998) however were very costly, therefore did not take effect. In the end, the MKDC decided to solve this issue with “bolder planting that was later on introduced at roundabouts and in 1989 they were given names” (Bendixson and Platt, 1998). This option proved to be a cheap fix to the original issue and has not solved the issue as residents today still find it hard to navigate. To fully understand the issues residents face, an auto ethnographic study was completed on traveling to destinations around MK.
Figure 26 is a map of the areas I visit on a regular basis as a MK resident. If you asked me about neighbourhoods that I pass by daily, such as Fishermead, I would have no idea. This is because of the trees surrounding the grid roads and blocking views while driving around
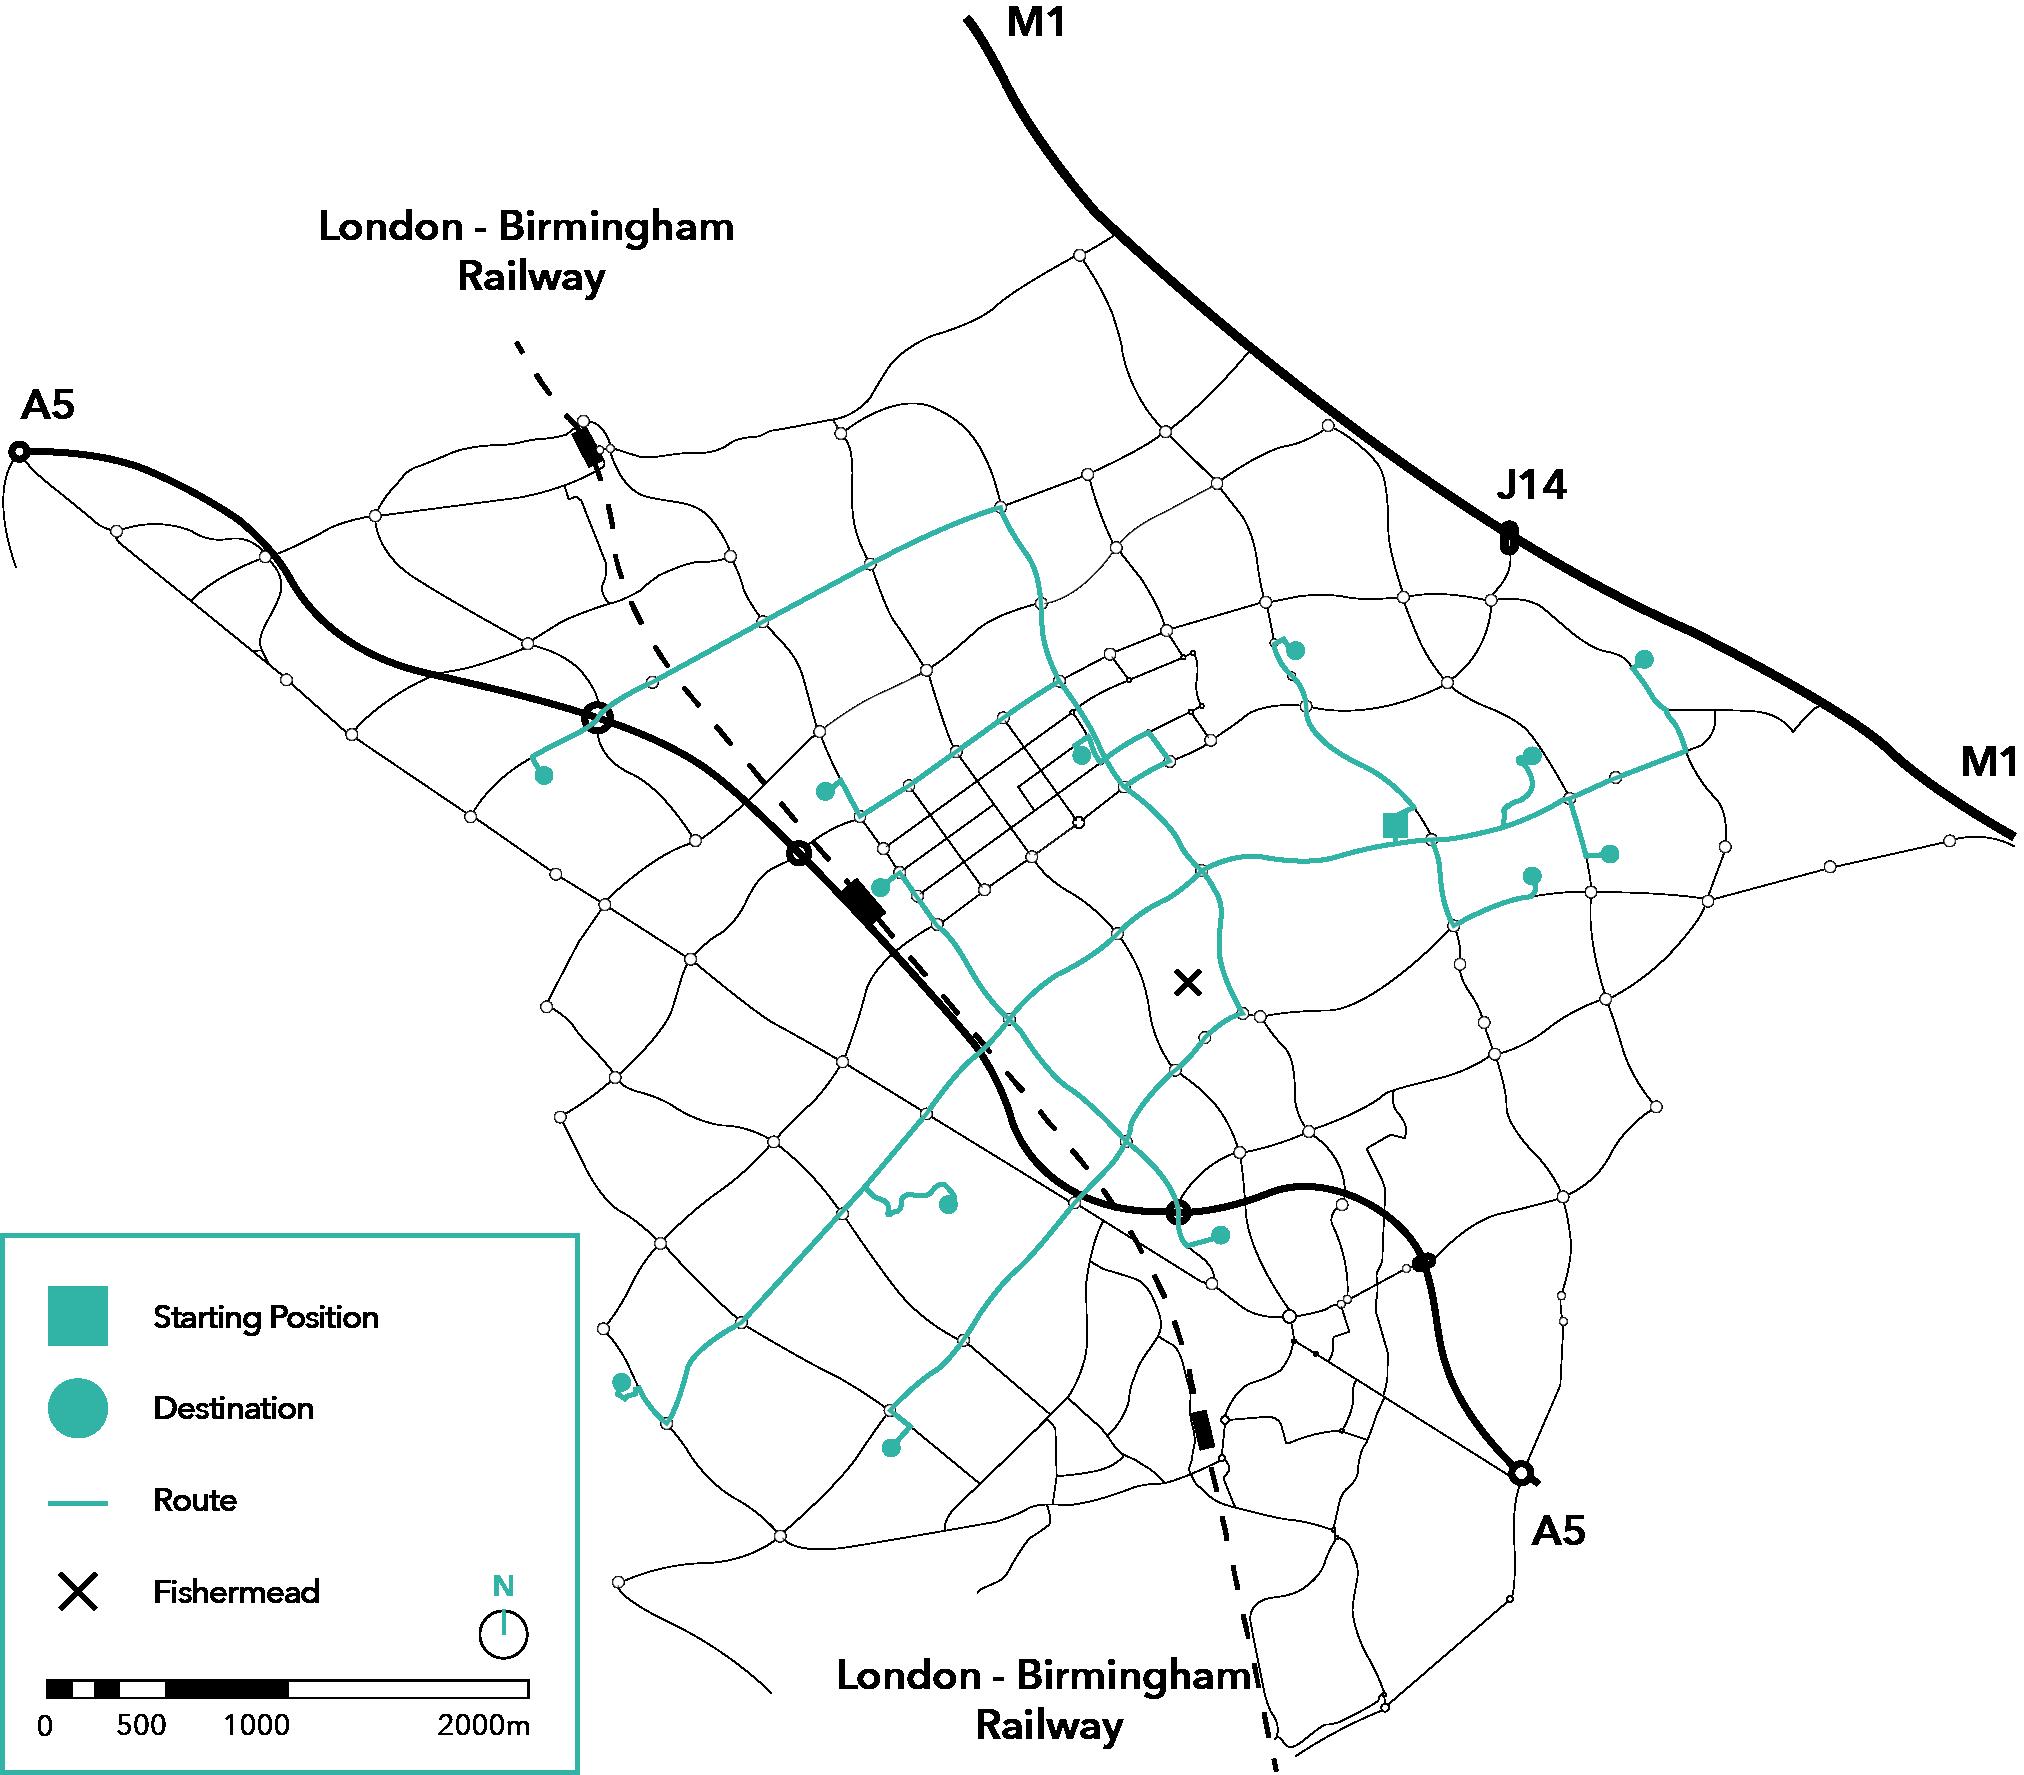
the city. With the lack of landmarks, that you would find in traditional cities, residents find it difficult to navigate in MK, making this a problem that is explored in the design development stages (Chapter 8).
The MKDC was correct in projecting that car travel will be the future of cities when MK was planned in 1967. However, by establishing such a dominant grid road system, these roads are getting congested, as the MK population continues to grow after exceeding the city’s intended population of 250,000 people. Additionally, with recent events of oil shortages and petrol prices rising, is the future of travel still car focussed? Will we start using alternative fuel sources like electric power? Or will we revert to the use of railways and public transportation?
After conducting an extensive survey with residents (Bendixson and Platt, 1998) highlights one of the problems with MK is “the inadequate level of public transport”. This is further repeated in (Milton Keynes Futures 2050 Commission, 2016) where the city in 2020 had “not addressed the mobility needs of the 20% of the households who do not own a car”.
As a result, “73% of journeys to work are made by car and 8.7% by public transport” (Milton Keynes Futures 2050 Commission, 2016) which is considerably less than the national average of “68% of workers typically travelled to work by car” and 17% by public transport (Transport Statistics: Great Britain 2019, 2022).
The original plans for public transport, as highlighted in (Llewelyn-Davies et al., Volume 2, 1970), was a desirable choice for residents who didn’t have access to a car because the “total time takes from door-to-door amounts to about 24 minutes” by bus. However, since the privatisation of public transportation in the 1980s after Margaret Tatcher was elected prime minister (Young, 2022), “the planning for public transport became impossible for the development corporation”. Bus companies were more interested in profits than improving movement around the city and therefore “tried to run them in local routes” (OpenLearn from The Open University, 2/2,2017). As a result, buses became a less desirable because it was costly and it increased the average travel time to more that 24 minutes. Because of the change in government, the new policies and the lack of planning made by the MK council, “If you don’t need to use public transport in MK, you probably wouldn’t choose to,
as it is almost always faster and cheaper to drive and park if you have the option” (Milton Keynes Council, 2020). Public Transport is also explored in chapter 8, when part 2 of the research question comes into effect.
The idea behind the RedWay, as highlighted in chapter 2, was to create a pathway specific to pedestrians and cyclists to travel around the city easily and safely. It was a system to “show for the first time on a city wide scale how travel for pedestrians and cyclists can be made convenient, safe and pleasant” (Walker and Rasmussen, 1982). This is especially apparent where residents “can cycle from one end of the city to another, without ever having to cross a main road” (OpenLearn from The Open University, 1/2, 2017) due to the implementation of bridges and underpasses at strategic locations.
However, as discussed in (Bendixson and Platt, 1998) and (Milton Keynes Futures 2050 Commission, 2016) there has been a lot of negative views on the RedWay for a variety of reasons. (Bendixson and Platt, 1998) Highlight that “routes were seldom thronged and at night, with even fewer people around, could be lonely and frightening” and “often too isolated to be used safely at night’ (they were not adequately overlooked)”. Additionally, due to British climate, where daylight only occurs between 8am and 4pm in the winter, residents prefer to travel using alternative transport methods as walking/cycling on the RedWay feels unsafe at night. Hence the pathway being “an underutilised resource, and seen as a leisure rather than commuting asset” (Milton Keynes Futures 2050 Commission, 2016). Furthermore, cyclists ride on the grid roads as they feel it offers more direct routes to destinations and therefore are quicker and easier to use. Because of this, approximately 10 cyclists deaths’ or injuries have been reported each year since 2005 (figure 27).
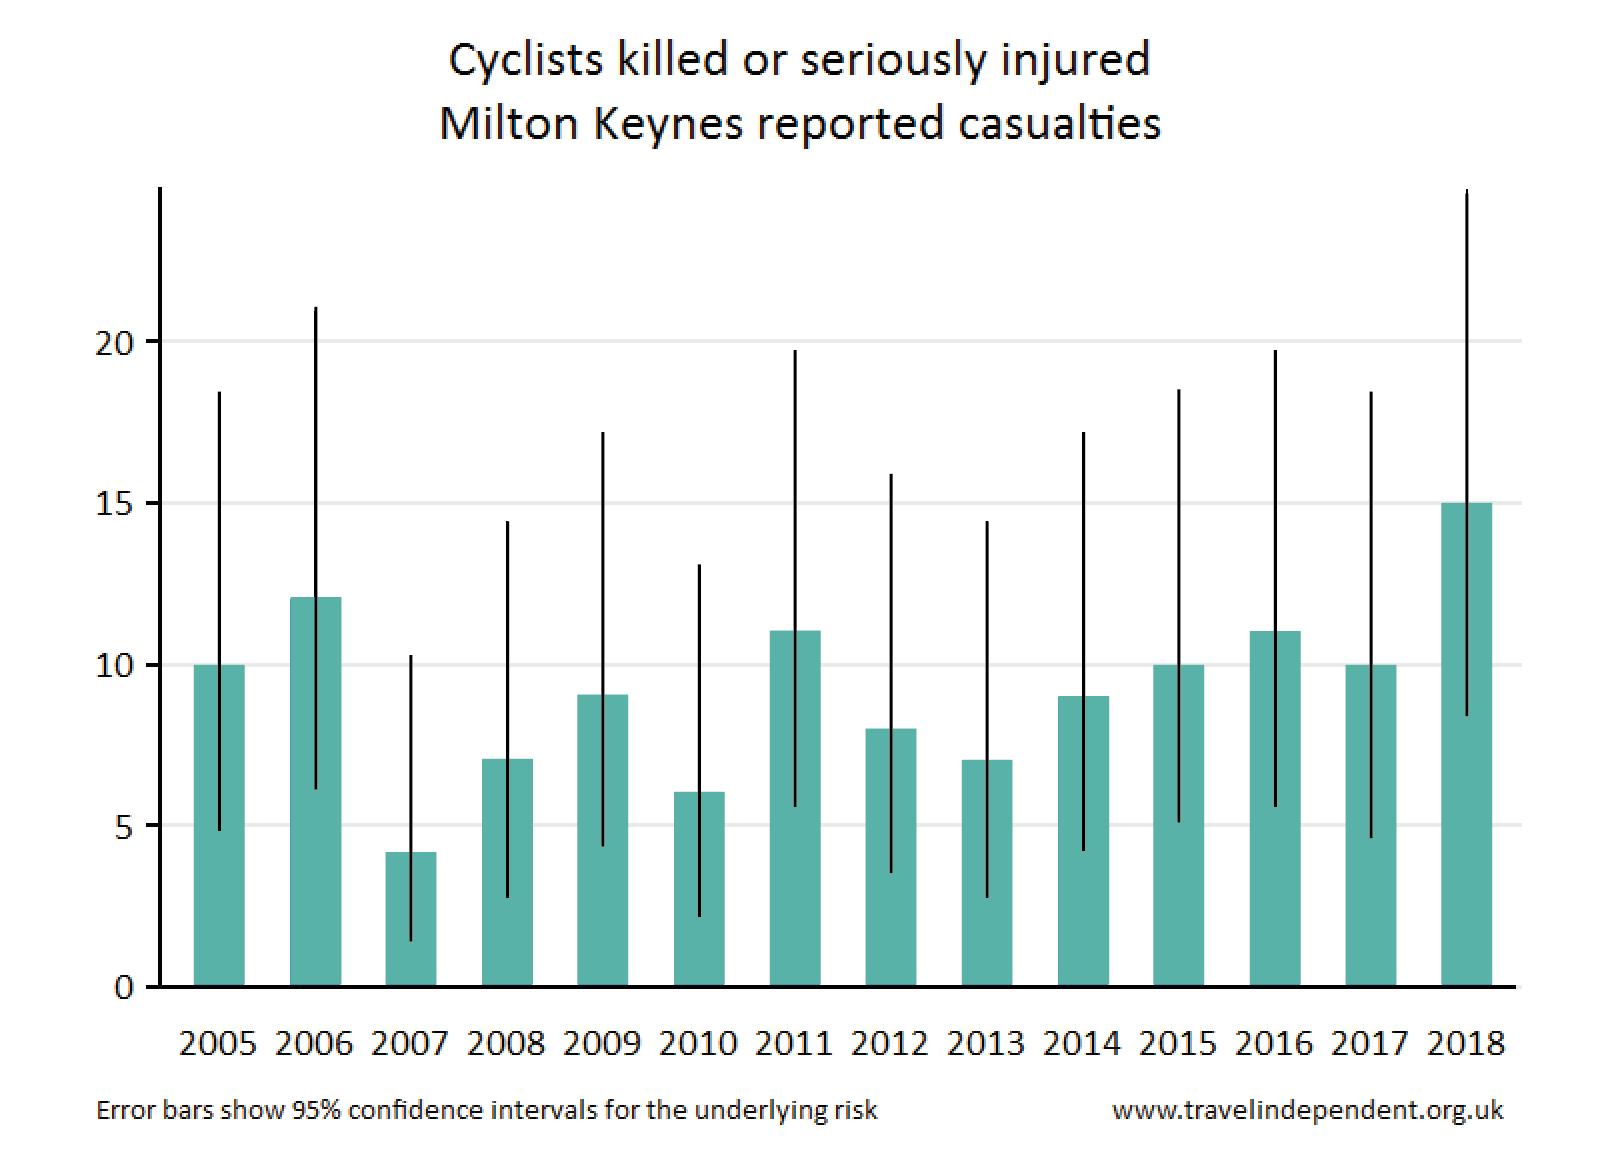
After completing a full analysis on the reality of the easy movement and access objective, we find many issues with the masterplan and implementation of infrastructure.
• Residents find it difficult to navigate and way-find whilst driving along the grid roads, due to the lack of landmarks and the nature blocking views of the city.
• Public transport journeys have become expensive, and routes have become longer after the privatisation of bus companies
• The Redway is unsafe to use at night and is used as a leisure route than a commuting asset.
Therefore, to answer part 1 of the research question, the original plans of easy movement and access has failed 50 years after the city was built in 2022. When exploring options to answer the second research question, it is important to work closely with residents to ensure current problems are solved, to design at a human eye level perspective, and to design multiple travel options equally to ensure one system is not overused.
How can we improve the way people move around Milton Keynes and ensure it withstands the next 50 years?
Research translation to design, the project, client & budget, city scale, local scale, design criteria, manifesto
After completing part one of the study on exploring movement and access through examining the original plans in 1967, the reality of those plans in 2022 and the councils plans for 2050, Part two is now in effect. In the next few chapters, a variety of concepts will be explored to improve the way residents more around the city in the next 50 years, when MK marks its 100 year milestone.
To ensure the same mistakes are not made, it is important to reflect on the lessons learnt in the first part of this study.
• The future must not solely be designed in a masterplan capacity, but at a local scale to ensure the average resident’s experience is considered (Chapter 4).
• Residents must be part of the design stages to ensure the future caters towards their needs and solves the current problems (Chapter 4).
• The final proposal should not only focus on 1 transport system, as in the future, there is a risk of the new system being redundant due to a change in society (Chapter 4).
• Before proposing ideas for improving how residents move around the city, it is important to fully exhaust every repercussion that the new system may make (Chapter 5).
As a result, the project must consider both the city and local scale whilst designing, and explore every side effect for each concept. Additionally, each concept should be designed at a masterplan and urban design capacity (exploring how the user interact with the proposals) to ensure we learn from past mistakes. In doing this, the question on improving the way people move around MK will be explored and answered in complete depth.
Whilst considering the 6 goals highlighted in the 1967 original plans (Llewelyn-Davies et al., Volume 1, 1970) and the 7 ambitions discussed in the 2050 council document (Milton Keynes Future 2050, 2021), design a system that will improve the way people move around the city, and ensure it withstands the next 50 years.
Opportunity and freedom of choice
Easy movement/access + good communication
Balance + Variety
An attractive city
Public awareness and participation
Efficient + imaginative use for resources
Strengthen the cities qualities
Make the city a leading green and cultural city
Ensure everyone can buy or rent a home
Safety + health and well-being
Provide job opportunities for everyone
Opportunities for higher education
Travel on foot, by bike + better public transport
Because the project revolves around the urban design and masterplan of MK, the council will act as the client, therefore costs must be considered carefully. In (Milton Keynes Futures 2050 Commission, 2016) the council state that “The city cannot meet the very high costs of rebuilding key road junctions and other network improvements that would be needed to avoid gridlock”, suggesting the need for low cost options to improve the way residents move around the city. Although, I will not have access to a quantity surveyor, the project cost is a key factor that should be thought of regularly throughout the design process. However, If one design concept costs a considerable amount, there must be evidence and justifiable reasoning for the improvement it will make on the city’s urban design.

Finding your way around MK can be difficult for many newcomers and residents mainly due to its unique design. Unlike other cities, MK was purposely built in 1967 where it took the form of a grid structure like American cities and garden cities after being inspired by the rise in car ownership. As highlighted in chapter 2, MK was structured around its grid road design which has resulted in many problems especially when navigating around the city. Steen Eiler Rasmussen summarises his experience whilst driving around the city as being “locked up in a maze, lose your orientation, and suffer from claustrophobia” (Walker and Rasmussen, 1982). These are still issues that the public face today and will be explored during the design stages (Chapter 8).
Congestion is another problem MK residents face daily, especially when traveling to school and work during peak hours. MK is a city that was designed with the intention of “bringing its total population to 250,000 people” (Llewelyn-Davies et al., Volume 1, 1970), however, with this exceeding more problems occur. In 2016/17, the MK council undertook a study to analyse the population growth and future population projections as highlighted in figure 31.
Figure 31 highlights that by 2026, the population projections reach approximately 308,500, which far exceed the original plans of 250,000 people. MK is foretasted “to grow by an average of 4,200 people per year” with “a growth rate of 18 percent” resulting in further congestion and future grid locks. (Milton Keynes Future 2050, 2021) stresses the need for “providing everyone with more options in how they move around” and the “need to make walking, cycling and scooting our first choice for shorter trips” (Milton Keynes Future 2050, 2021). This will be explored in chapter 8.
After a recent study on transport by (Milton Keynes Futures 2050 Commission, 2016), “73% of journeys to work are made by car and 8.7% by public transport” in MK. The percentage of public transport journeys is significantly low (less than half) compared to the average in Great Britain, where “68% of workers typically travelled to work by car” and 17% by public transport (Transport Statistics: Great Britain 2019, 2021). By making public transport more desirable in MK, car journeys will reduce significantly which will inevitably reduce the amount of congestion on the grid roads. Therefore, Public transport can be one solution for road congestion, and will be explored in the following chapters.
In addition to improving public transport, the RedWay is a system in MK that can be used to move people around the city. As highlighted in chapter 3 and in (Bendixson and Platt, 1998) the RedWay is “often too isolated to be used safely at night” and “is an underutilised resource and seen as a leisure rather than commuting asset” (Milton Keynes Futures 2050 Commission, 2016). By investing in the RedWay, and creating more direct routes to destinations, this pathway can be used as a commuting asset, therefore acting as another transport method, resulting in less congestion on the grid roads. Possible options for revitalising the RedWay will be explore in chapter 8.
Each community in MK, has its own unique identity, however can’t be seen whilst driving along the grid roads, hence, the whole issue of orientation and navigation arises. One way to solve this is by bringing local identity to the grid roads, whilst also maintaining a sense of privacy. This will be explored in chapter 8 to help solve the orientation issue, and create connections between communities.

In summary, the following factors, as highlighted in figure 32 should be considered during the design stages.
1. Create and promote alternative ways of moving around the city to solve the congestion and future gridlock issue. Aspects that will be explored will include:
• Improving the RedWay,
• Creating a new CycleWay dedicated specifically for cyclist commuters,
• Improving the city’s public transport, allowing people who don’t have access to a car to move around the city,
• This can be in the form of autonomous taxis, trams, SkyPods etc.
2. Improve the current grid road system by creating a sense of orientation, making it easier for residents to navigate.
• This will be explored in both a city scale and local scale where one specific roundabout (includes an activity centre) in MK will be redesigned.
3. Create a system that is safe for all residents to use whilst moving around the city.
• Improving the current isolated, unsafe RedWay,
• Create a system for cyclists to cycle safely around the city without having to ride on the single/dual carriage roads where cars pass at 60/70mph.
4. Enhance the current city’s qualities of being a garden city.
5. Create a system to improve the health and well-being of residents in
6. Considering low-cost options as indirectly stated by the MK Council.
The future of the city now begins with the MK 2067 urban masterplan. After having recently passed the 50-year birth milestone of MK, it is important to now look onto the future and devise a plan to improve the way we live and move around the city, and ensure it withstands the next 50 years. The plan is an updated and improved version of the MKDC’s original plans in 1967, to create better opportunities for generations to come.
The 2067 masterplan starts with creating a transport system for all demographics in MK to use, to travel between communities in a safe, easy, and affordable way. This will ensure everyone feels connected and has the freedom to move around the city without having to rely on driving a car. Whether it is through walking around the city, hiring e-scooters and e-bikes, driving a car, using public transport, or something completely different and unique, as MK is unique by design. We are committed to making sure that everyone can move around the city and not be disadvantaged for not driving a car.
To achieve this, we have created a list of criteria to follow:
• Improving the existing grid road system by creating a sense of orientation,
• Promoting different modes of transport to solve the anticipated gridlock crises,
• Creating a safe and comfortable way to travel around the city,
• Improving the health and well-being of all residents,
• Enhancing the cities qualities, and ensuring that they are preserved,
• Ensuring that cost is considered carefully during design development.
In response to the public’s view on the current grid road system, we will start to make certain areas more recognisable by removing existing nature along roads that currently block views of activity centres. This will create numerous landmarks around the city and will ensure that visitors and residents driving along the grid roads, will find it easier to navigate without having to rely on Google maps.
The masterplan will also look at enhancing the existing RedWay, to ensure it is safe at different times of the day. This will be done by increasing street lighting, renovating underpasses, regularly maintaining pathways, and adding activities nearby, to ensure the public can have a safe and enjoyable experience whilst walking around the city.
With cycling becoming a popular travel method, the masterplan will create a separate CycleWay, like the RedWay, to accommodate commuters and leisure cyclists. Cycle paths will be located on the grid roads at a safe distance away from cars, and beside the RedWay pathways in neighbourhoods. This will promote cycling further within communities in MK, which will reduce the number of cars on the road and increase the health and well-being of residents. The amount of hireable bikes and e-scooters in the city will also increase to keep up with demands.
As the market for electric cars increases, MK will invest in multiple charging stations around the city for residents to park and charge their car, e-scooter, and e-bikes. These will be in activity centres, shopping malls and parking lots that residents frequent daily. Furthermore, with the advancements of technology, self-driving cars will operate as taxi’s, shuttles, and deliveries. This will further benefit the public as these services can be used by individuals who are unable to drive a car.
The 2067 urban masterplan introduces an all new automated SkyPod tram system that will operate above the exiting grid roads. The decision to elevate the trams was made to enhance the public’s experience where they can enjoy the views of the MK forest skyline. Transport hubs and stations will be placed strategically across the city to ensure all residents are within a maximum of a 10-minute walk from home. This will improve public transport whilst also enabling residents to travel around MK in a quick, easy, and affordable way, without having to drive a car.
With the implementation of updating the current grid roads and RedWay, the addition of the CycleWay and the SkyPod tram system, the use of self-driving cars and an increase in charging stations for electric cars, e-bikes and e-scooters, residents in MK will find it easier to move around the city without having to rely on driving a car.
From the initial concepts, we found that the answer to improving the way people move around the city isn’t to create new transportation systems such as the SkyPod, but to make minor changes that make a bigger difference. We also found that 1 concept can’t meet all the criteria points that were created. Therefore, to answer second part of the research question, I will use concepts 4 and 5 which is to improve the existing RedWay by adding a CycleWay specific for cyclists, embedding colour within the city landscape and create a diagrammatical map for residents to use when navigating around the city. These concepts meet the following criterion:
• Promoting alternative transportation methods through the addition of the CycleWay and making the public aware of different transport methods around the city,
• Improving way-finding and navigation across the city by creating a simplistic diagrammatical map and embedding colour within the city landscape,
• Enhancing the cities qualities through embedding colour within the landscape,
• Improved the health and well-being of residents through promoting the CycleWay,
• Doesn’t involve the addition of new infrastructure making it an inexpensive option. Therefore, a combination of concepts 4 and 5 is used to answer the question on improving the way people move around the city.

Embedding colour in MK and the colour-coded diagramatical map of the city
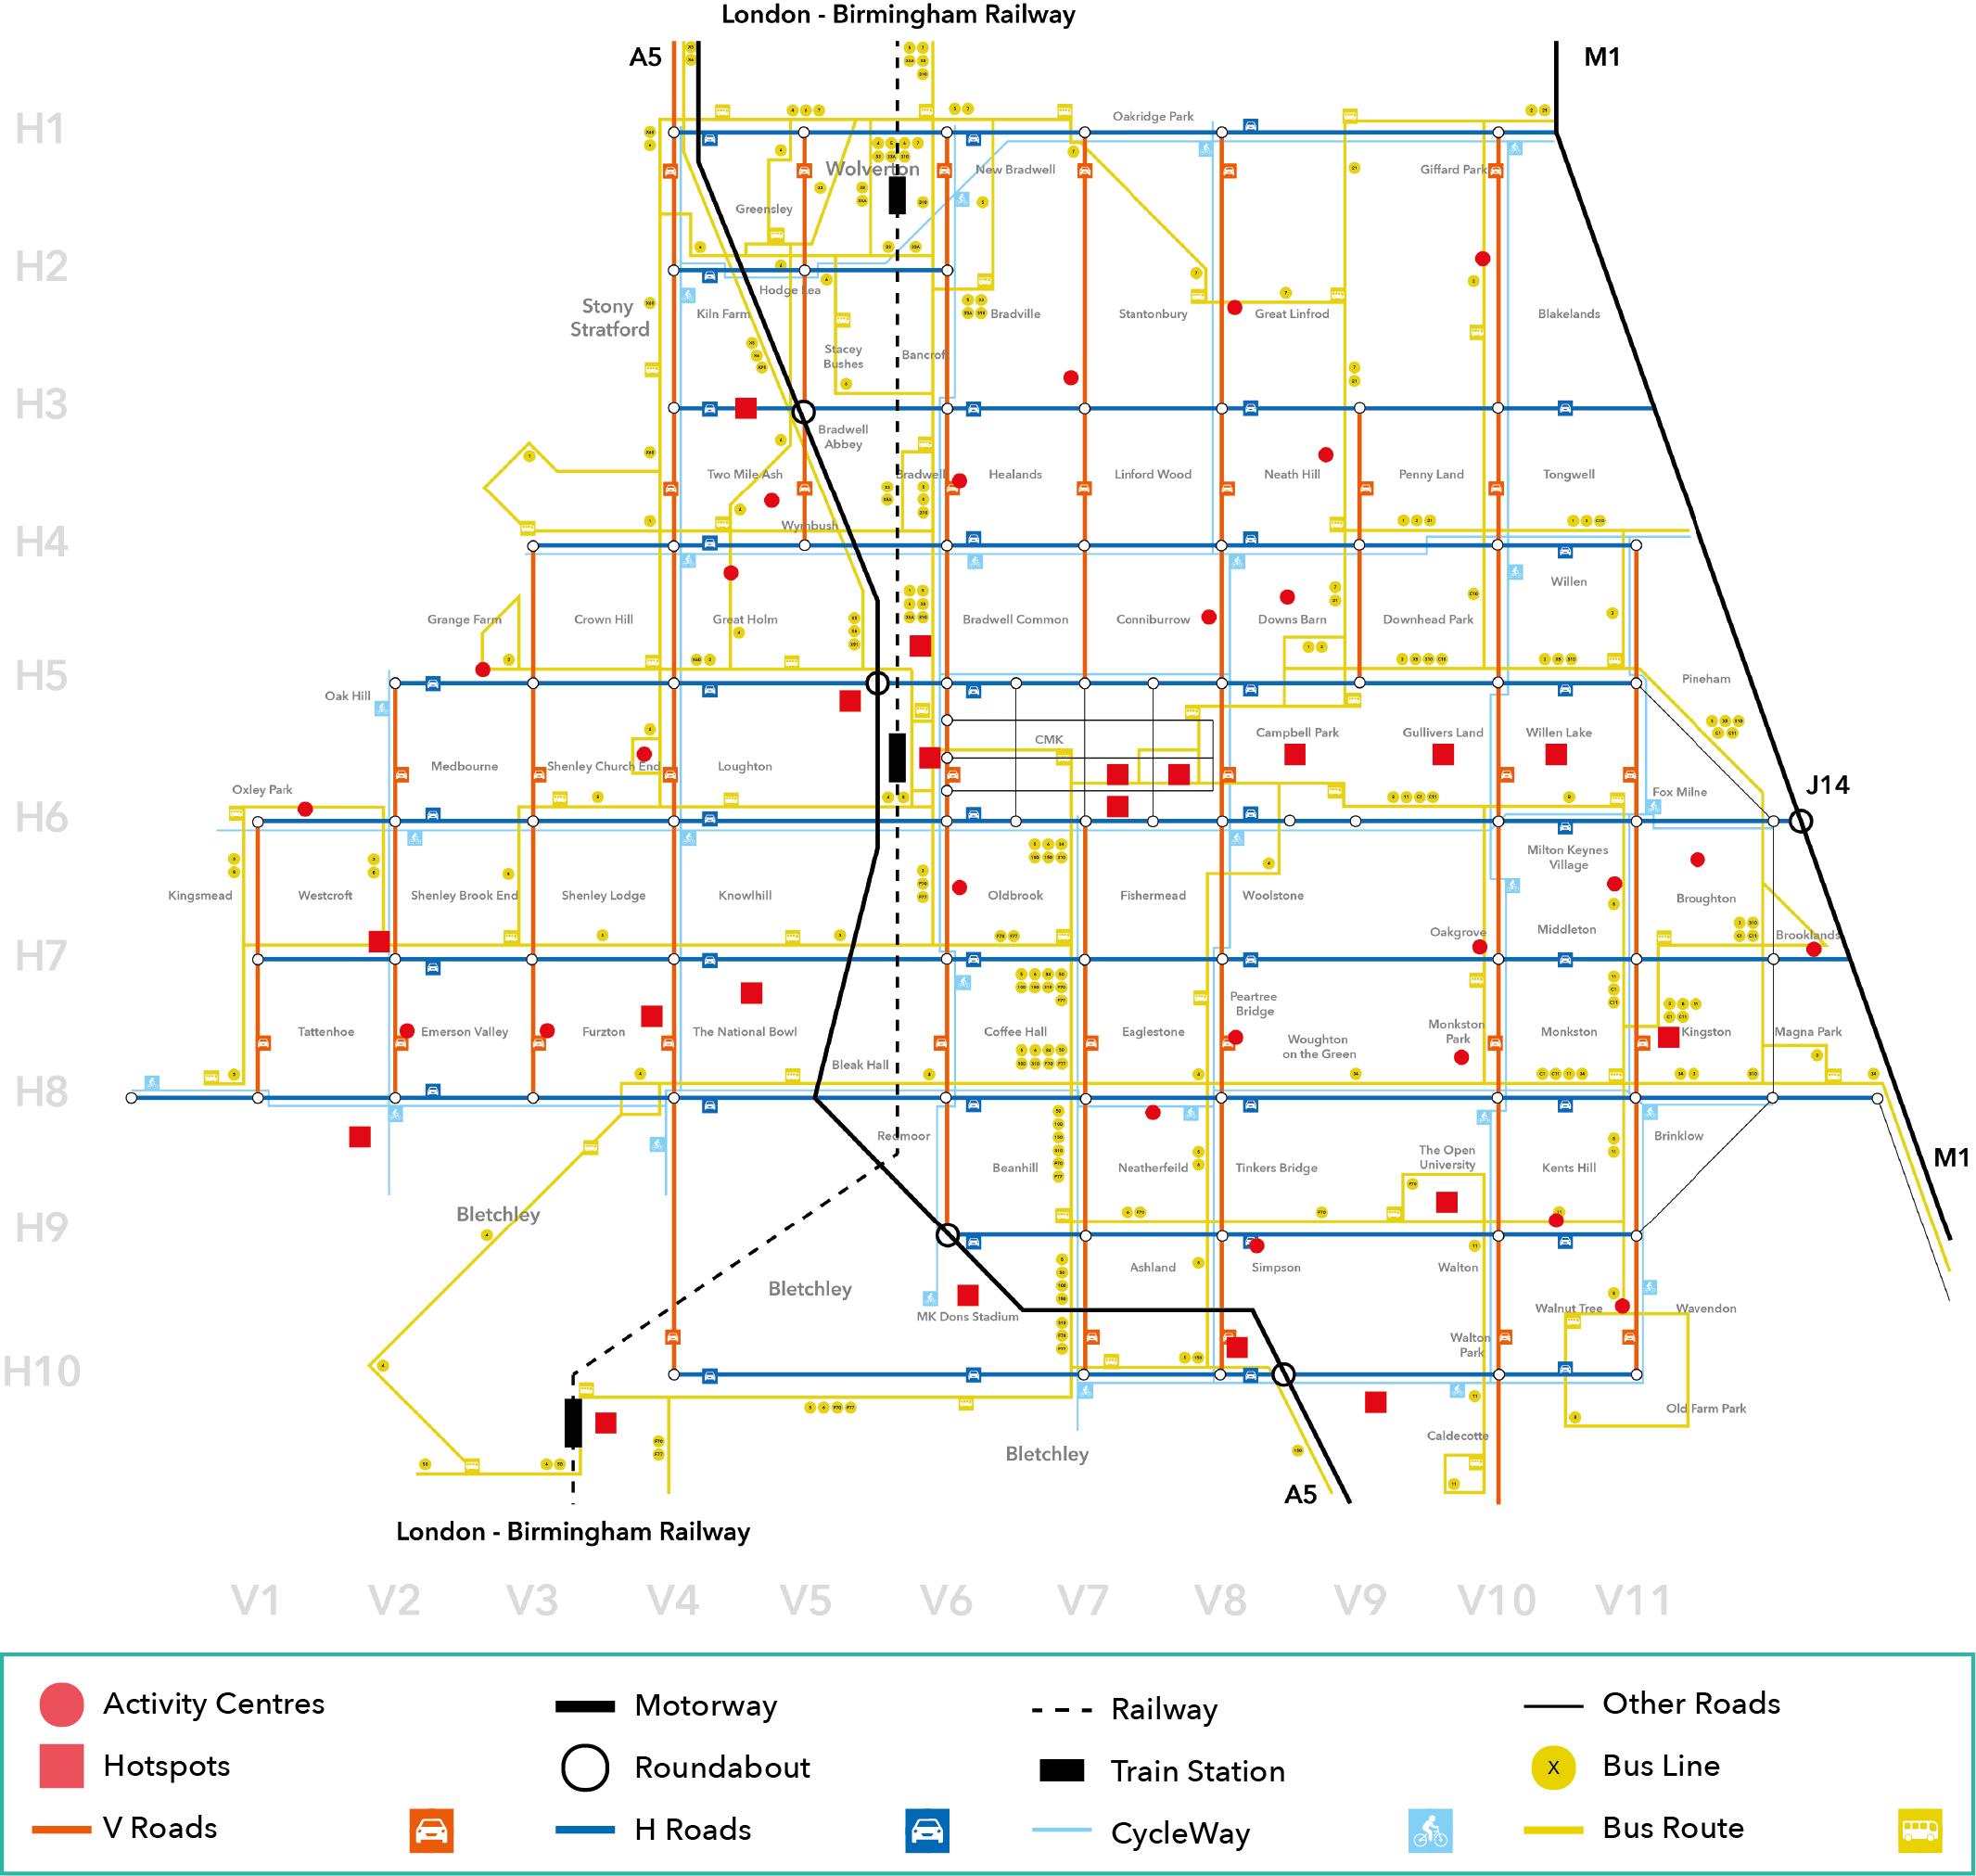
In chapter 8, a wide range of concepts were explored, developed, and critically analysed to determine the best possible option to improve the way residents move around the city in the next 50 years. We found that proposing larger infrastructure projects were problematic, therefore concepts 4 and 5 were chosen to answer part two of the research question. This chapter is a visual representation of the final design. The proposal involves modifying the existing RedWay by adding a CycleWay specific too commuter cyclists and creating a colour coded system that will be embedded around the city and illustrated diagrammatically.

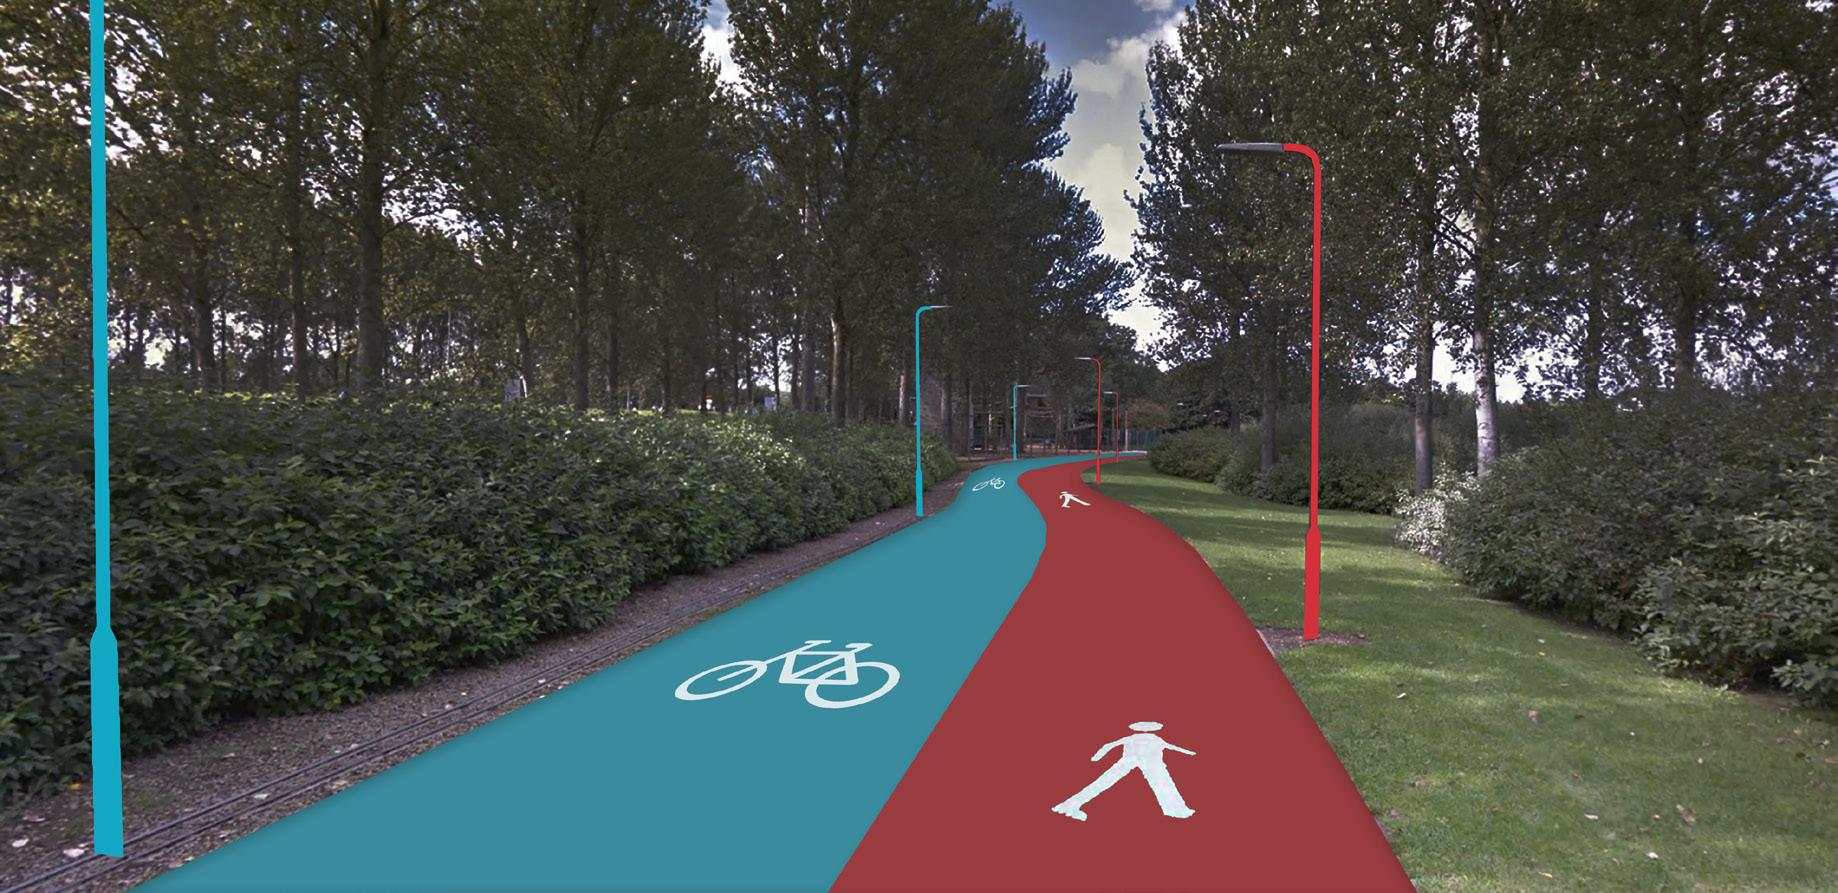
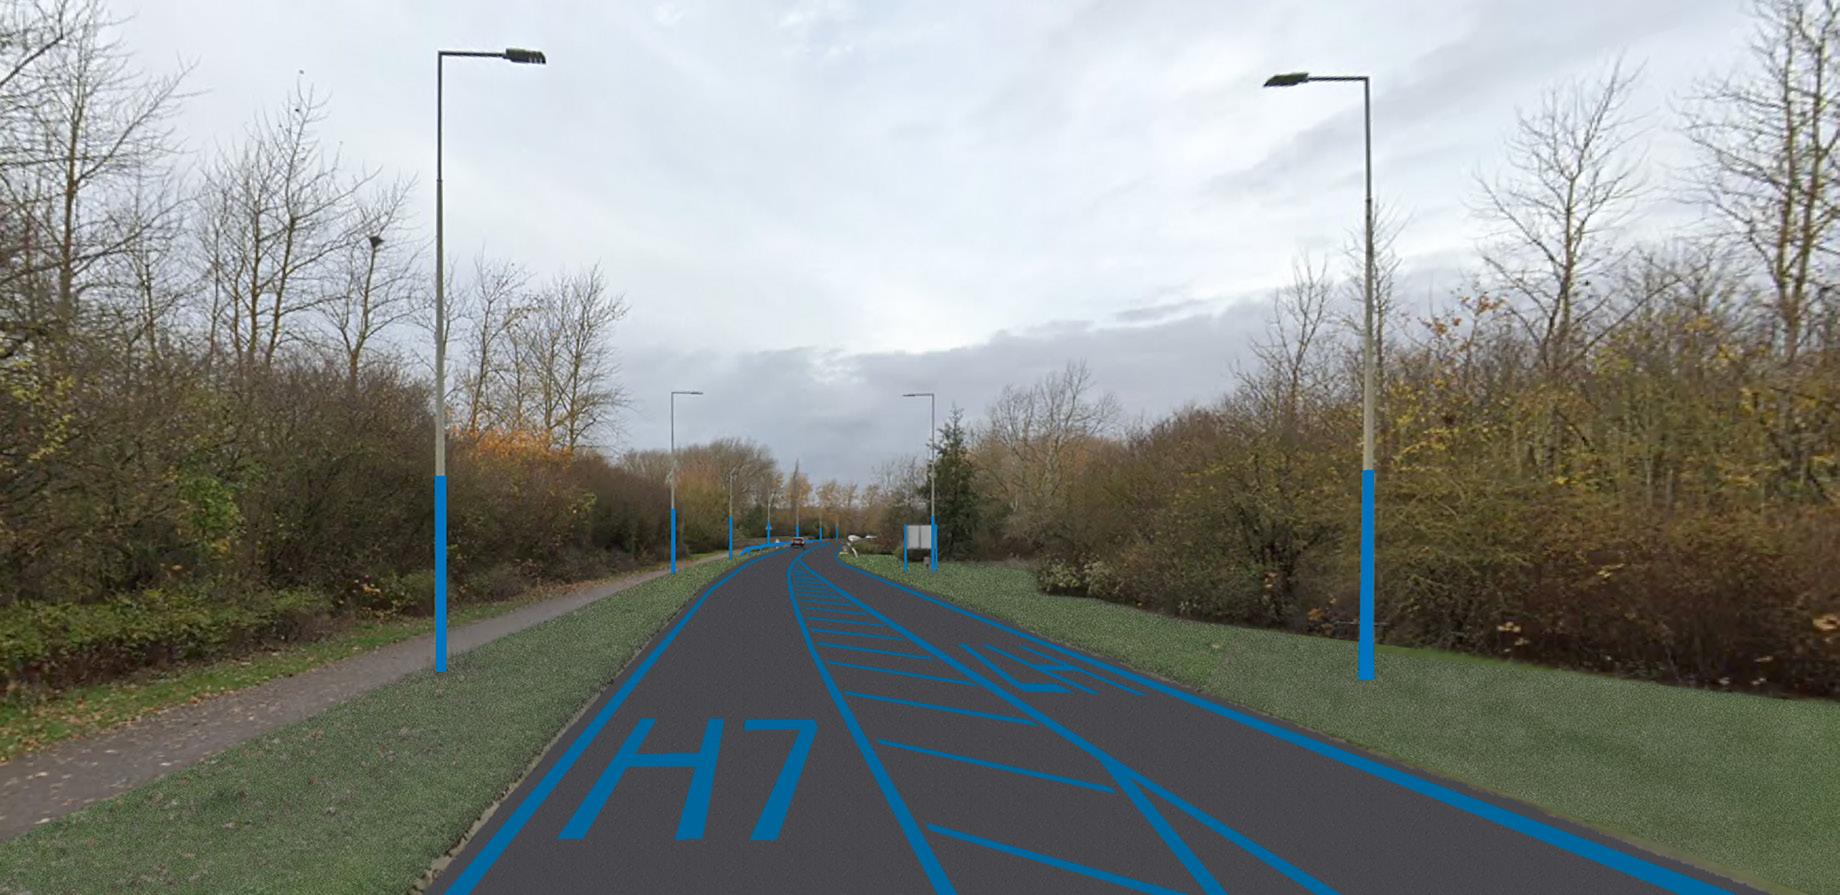
By embedding colour within the city’s street landscape according to the colours on the diagrammatical map, residents will find it easier to navigate and way-find around MK.
The H (orange) and V (blue) roads will include road markings as highlighted in figure 51, in the form of paint during the day, and stud lights at night. This will be apparent on lamp posts, road lanes, railings, and pavements. Additionally, every 250m and at key junctions (Slip Roads, T-Junctions and Roundabouts), there will be road markings in the form of large block letters stating the street name (H7). These features have been added to the existing landscape of the city to ensure all drivers, including the visually impaired, find it easier to navigate around MK.
Bus stop enclosures will be bright yellow and exposed to both the grid roads and the local communities, as highlighted in figure 52, to raise awareness of the city’s public transport network. By exposing these areas, residents who don’t have access to a car will find it easier to locate these hubs and be more enticed to use public transport.
The addition of a CycleWay beside the existing RedWay creates direct paths for commuter cyclists around the city. It gives residents another transportation methods to travel around the city easily and quickly. Like the grid roads interventions, colour will be embedded in pathways, lamp posts, benches, bins etc. along the RedWay (red) and CycleWay (light blue), as displayed in figure 53.
Additionally, constant markings (bike icon) will be painted on the Cycleway to help the visually impaired differentiate between the Redway and Cycleway. These pathways have also been designed for the blind, where the RedWay and CycleWay paths have different textures to ensure the blind can easily navigate across the city safely whist walking along local routes.
When creating a colour coded map for residents in MK, it is important to consider how minorities with different disabilities would interpret the map. For the colour blind, certain colour combinations such as red and green have been avoided, symbols have been used on each line to help the visually impaired differentiate between each transport line, and the diagrammatical map has a simplistic design to ensure it is easy to read and understand (Collinge, 2017). Additionally, for the blind, I propose a digitised audio map and a physical textured (Braille) map to be created to help them navigate around the city.
This study explored movement and access in MK, through researching the original plans in 1967, assessing its success today in 2022, analysing the council’s strategy for 2050 (Part 1) and designing solutions to improve the way residents move around the city in the next 50 years (Part 2).

As highlighted in part 1, a case study approach and auto ethnographic study was completed to assess whether the original plans for movement and access are still successful today. In completing this study, we found the original plans have failed 50 years after the city was built. Following this, as summarised in figure 59, multiple lessons were learnt and a design criteria was created to answer the second part of the research question.
In part 2, we explored multiple ideas to improve how residents move around the city. During the design process, we found that the answer isn’t to create new transportation systems such as the SkyPod (Concept 1), but to make minor changes that make a bigger difference. This was because these large-scale implementations created more problems within the urban design of the city than solutions. Therefore concepts 4 and 5 were chosen, which were to improve the existing RedWay by adding a CycleWay specific for cyclists, embed colour within the street landscape and creating a diagrammatical map of MK that includes the travel methods available. Figure 60 highlights the final proposals response to the design brief.
• The future plans must be designed at masterplan and local scale to ensure an average resident’s experience is considered
• The designer must fully exhaust every repercussion before proposing an idea
• Residents must be part of the design stages to ensure the future plans cater towards their needs and solve the current problems they face
• The final proposal should not only focus on 1 transport system, as in the future, there is a risk of the new system being redundant due to a change in society.
• Create and promote alternative ways of moving around the city to solve the congestion and future gridlock issue.
• Create a system that is safe for residents to use.
• Improve the current grid road by creating a sense of orientation and making it easier for residents to wayfind and navigate.
• Enhance the current cities qualities of being a garden city.
• Create a system to improve the health and well-being of residents in Milton Keynes
• Considering low cost options as indirectly stated by the MK Council
• Create and promote alternative ways of moving around the city to solve the congestion and future gridlock issue.
• Create a system that is safe for all residents to use whilst moving around the city.
• Improve the current grid road system by creating a sense of orientation, making it easier for residents to way-find and navigate.
• Enhance the city’s garden city qualities.
• Create a system to improve the health and well-being of residents in MK
• Considering low cost options as indirectly stated by the MK Council
• A cycle path was created across the city, specific to cyclists, to create another transport method.
• The diagrammatical map promotes alternative travel methods in a simplified way.
• By creating a separate cycle path, cyclists no longer ride on the grid roads, resulting in fewer accidents
• With the implementation go the colours and signage impeded with the city landscape, residents will find it easier to way-find and navigate.
• Both concepts don’t hinder with the garden city qualities therefore maintaining the current landscape.
• By creating and promoting the CycleWay, more residents will be inclined cycle around the city, which is not only environmental, but improves their health and well-being.
• Both concepts are fairly inexpensive proposals compared to large infrastructure projects like the SkyPod.
By implementing a new transport method (CycleWay), embedding colour within the city landscape, and creating a simplified diagrammatical map of MK that display the various transport methods available to the public, as highlighted in figure 58, the proposal meets the design criteria. Therefore, to an extent, the final proposal has answered the second part of the research question on improving movement and access in MK and ensuring it withstands the next 50 years. However, certain questions arise such as: Will the map really promote public transport? And, will the new cycle lane be enticing to residents? These are questions we won’t know the answer to, until the plans come into fruition. However, because the final proposal is inexpensive compared to the alternatives, it doesn’t put as much financial strain onto the council. Therefore, it is a step in the right direction to improving the way residents move around the city in the next 50 years.
As highlighted in previous chapters, accessibility is a key aspect of the proposal to ensure the public have access to the different travel methods provided. (Getting Around London, 2016) Highlights a variety of ways to ensure minorities with certain disabilities can interpret the London Underground map. For this project, like the tube map, i proposed a digitised audio map and a physical textured (Braille) map to be created for the blind, along with monotone and colour friendly maps for the colour blind. Additionally, to ensure these maps are accessible to all, I propose app developers to create a digital 3D augmented reality application, where residents can pick up their phone, and manipulate the 3D maps to navigate around the city. This will increase awareness about the various methods available to travel around the city, hence, improving the way people move around MK.
