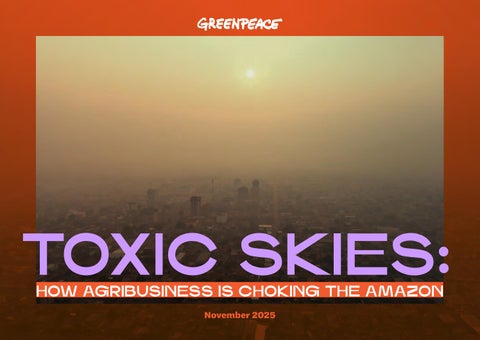
TOXIC SKIES:
HOW AGRIBUSINESS IS CHOKING THE AMAZON
November 2025
Acknowledgements
This report is published by Greenpeace International, drawing on data from monitors installed by Greenpeace Brazil among other data sources.
We extend our sincere appreciation to all those whose expertise, dedication, and support were crucial in bringing this report to completion. Their valuable contributions have significantly enriched the quality and depth of our work. We would particularly like to express our gratitude to the following people.
Authors and Contributors: Jeffrey AlbertsonKwok, Aidan Farrow, Ali Abbas, Lis Cunha, Rita Pelicano, Andrew Murchie, Kamila Craveira, Cristiane Mazzetti, Kathryn Miller, Caroline Haddad, Maik Marahrens, and Bamboo Zardetto
Reviewers: Our heartfelt thanks go to our peer reviewers for their insightful feedback, which were invaluable in refining this report. We are grateful for the time and expertise shared by: Dr. Jerry Jose and Dr. Phatchaploy Vongmahadlek
Design: Grande Circular design
A Message to Our Supporters: Finally, this work is powered by you. We are deeply grateful to our supporters and the wider community for their engagement with our research and their dedication to advancing our shared goals. Your commitment is instrumental in our pursuit of knowledge and positive change, and we thank you for making this report possible.
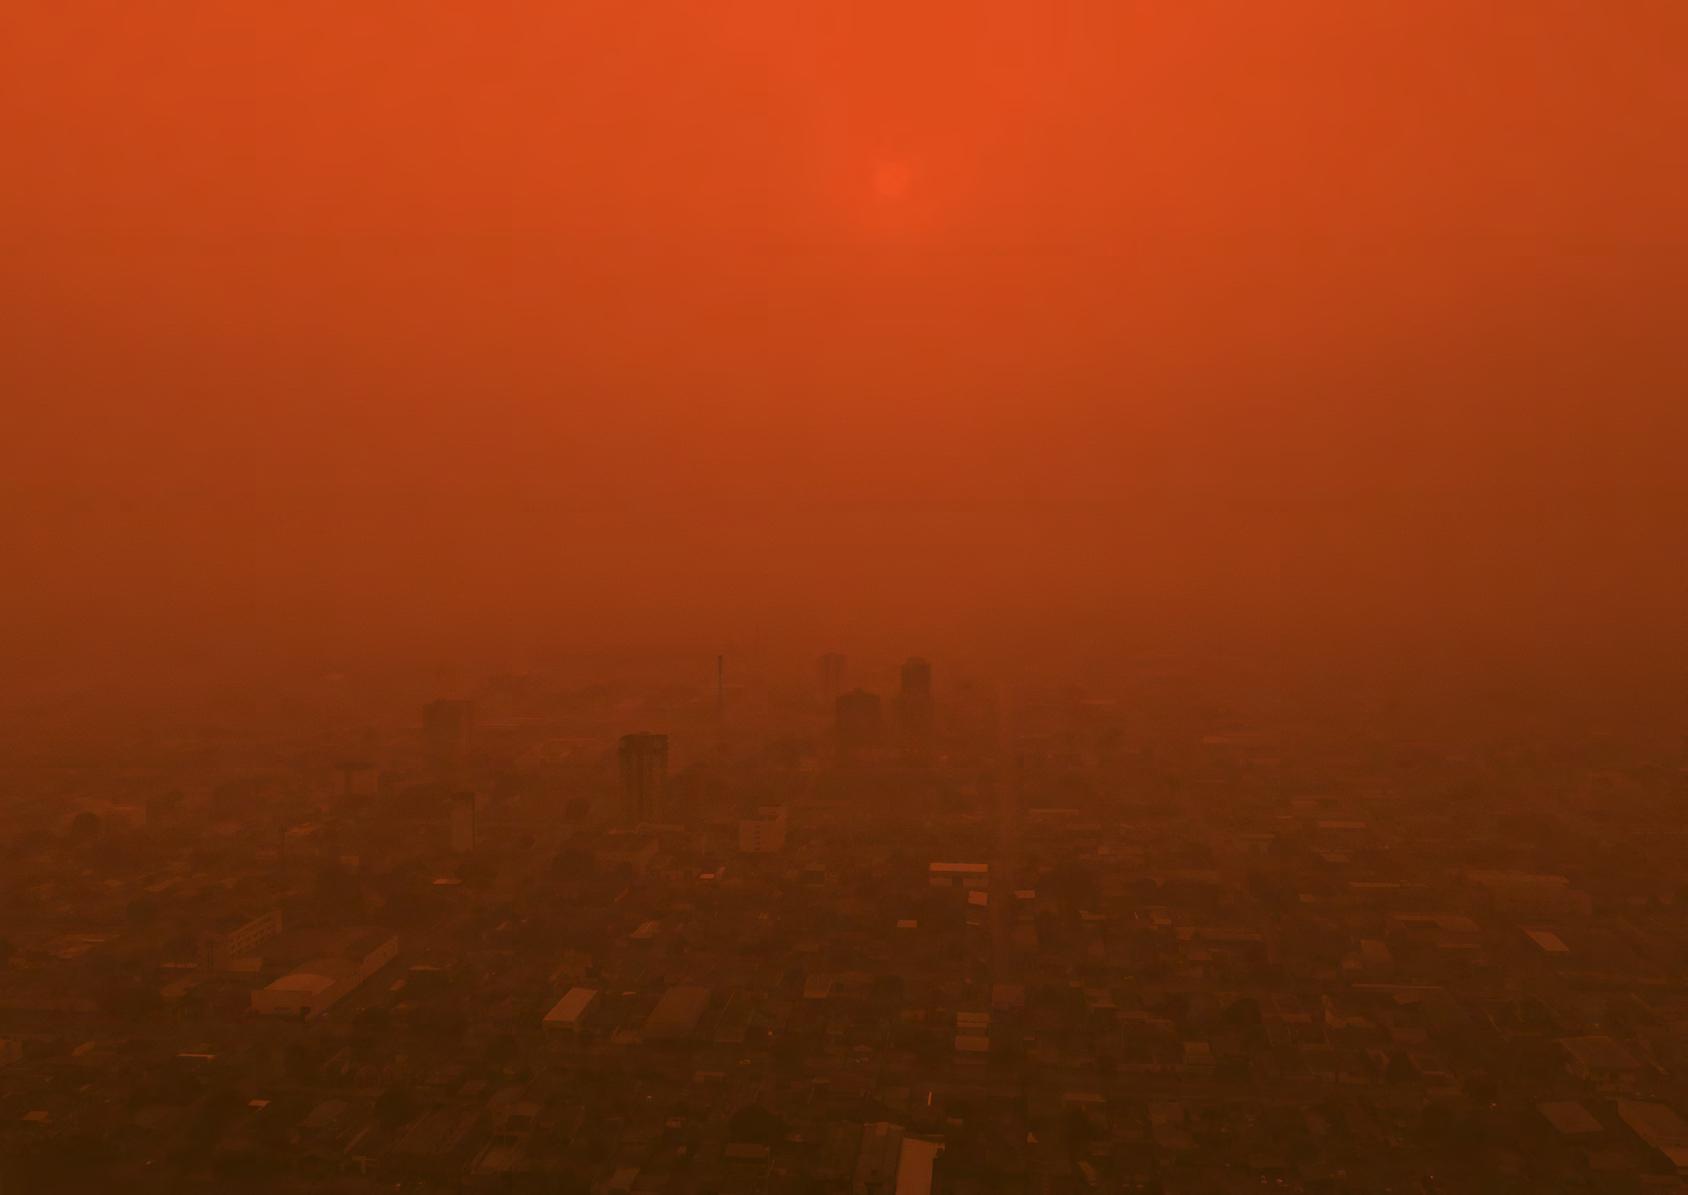
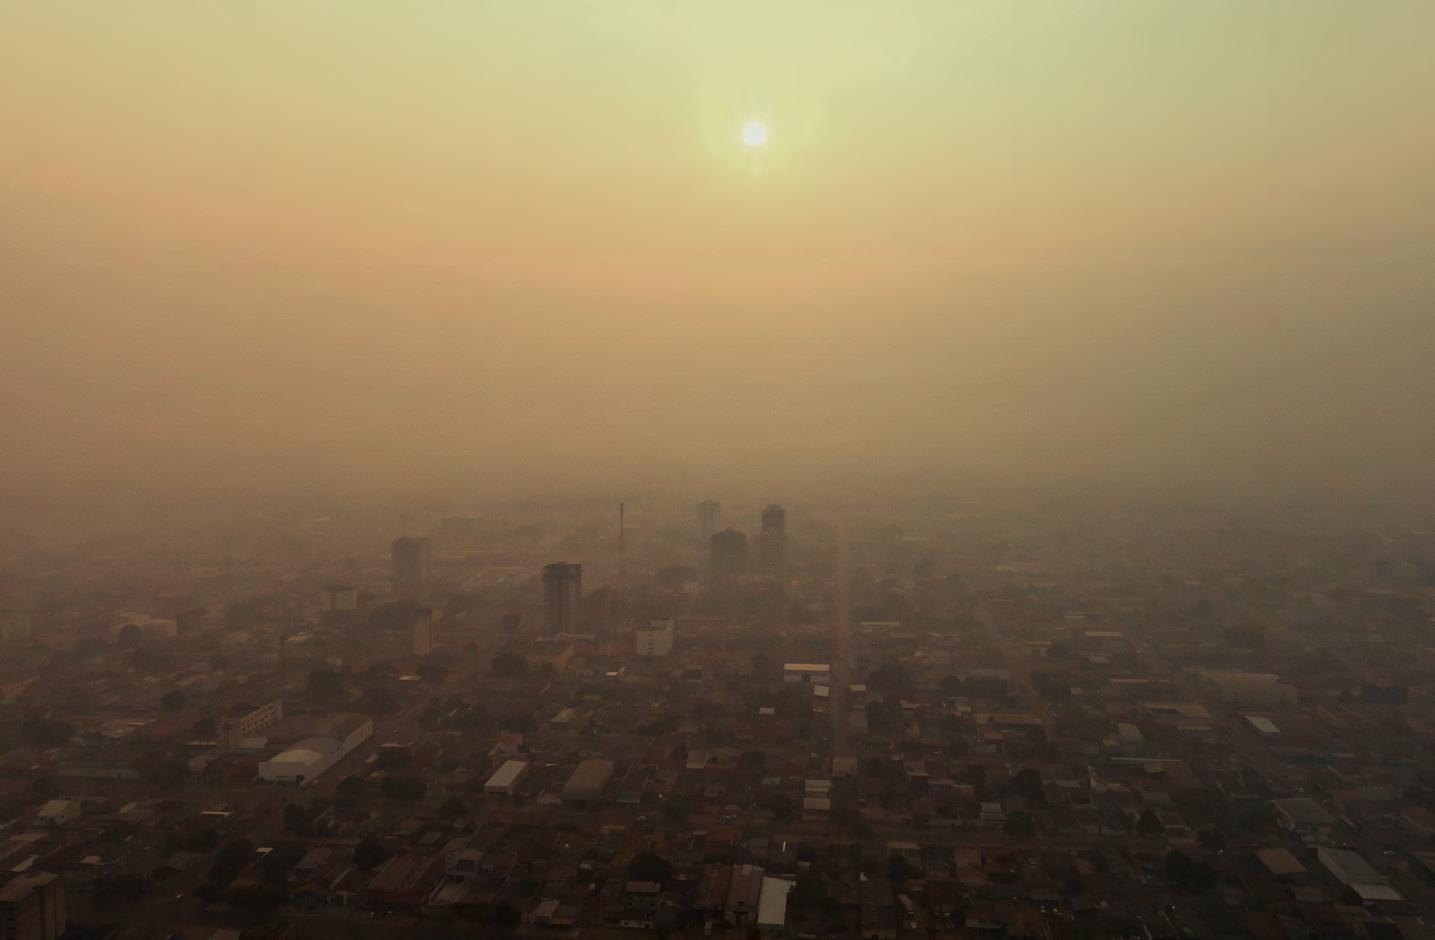
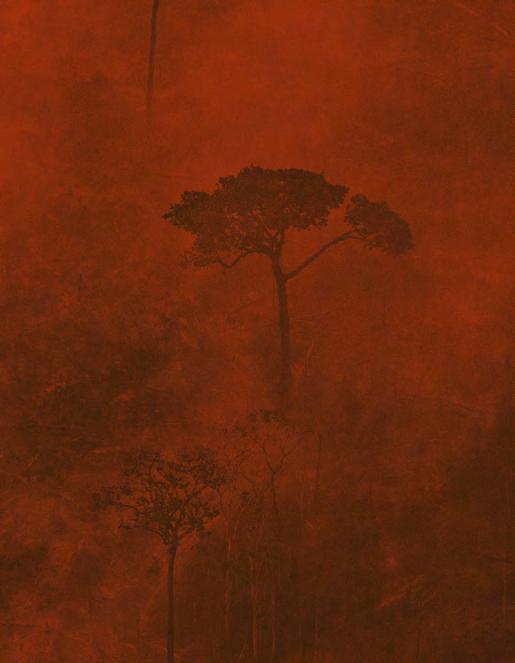
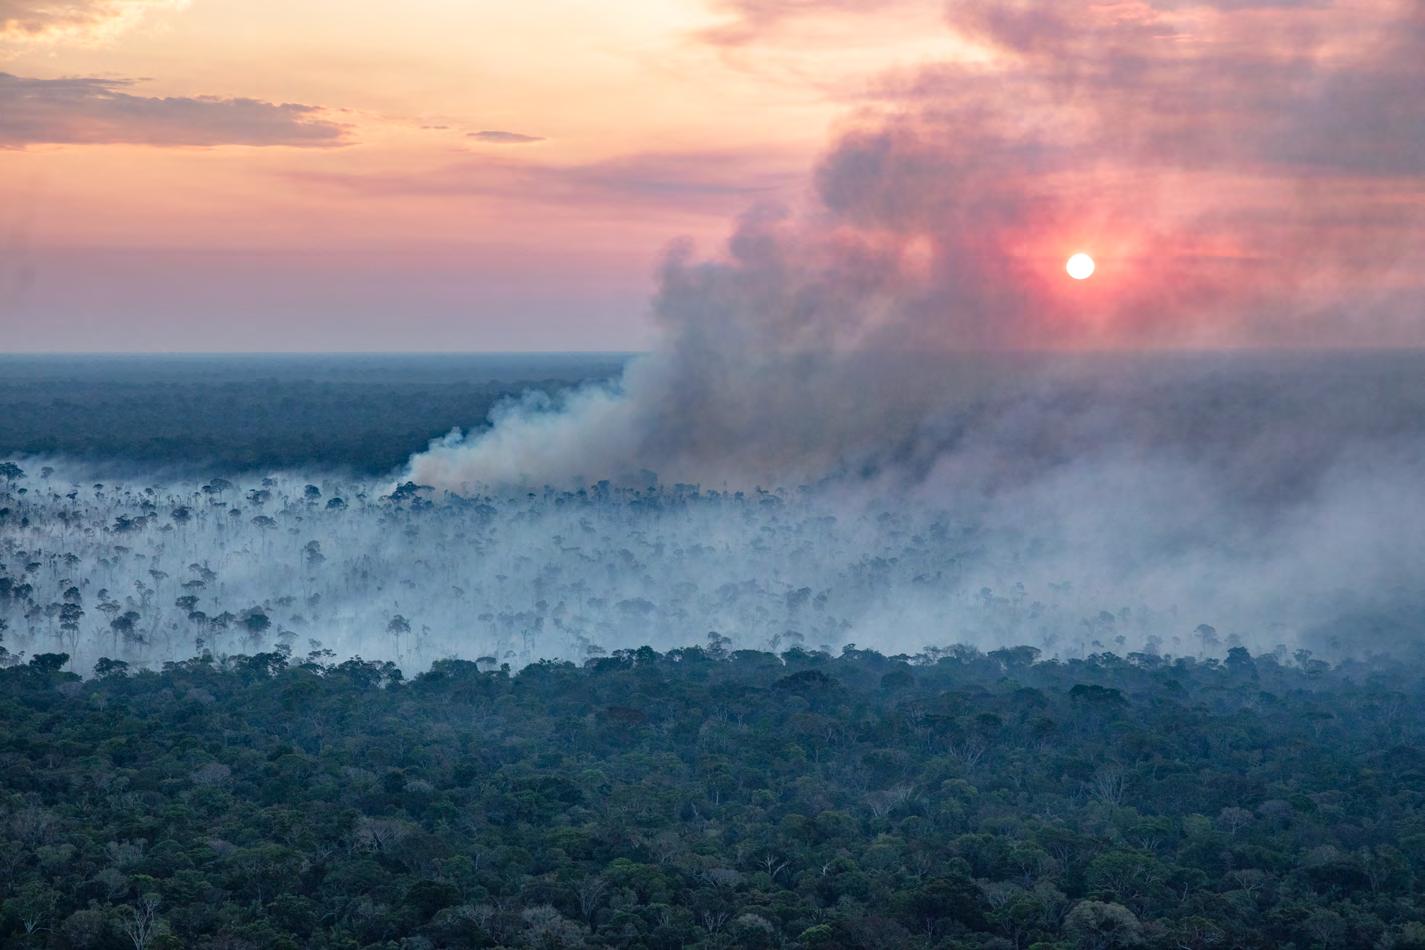
Cover page image: Urban haze in Porto Velho in 2024. Credit: © Fer Ligabue / Greenpeace

EXECUTIVE SUMMARY
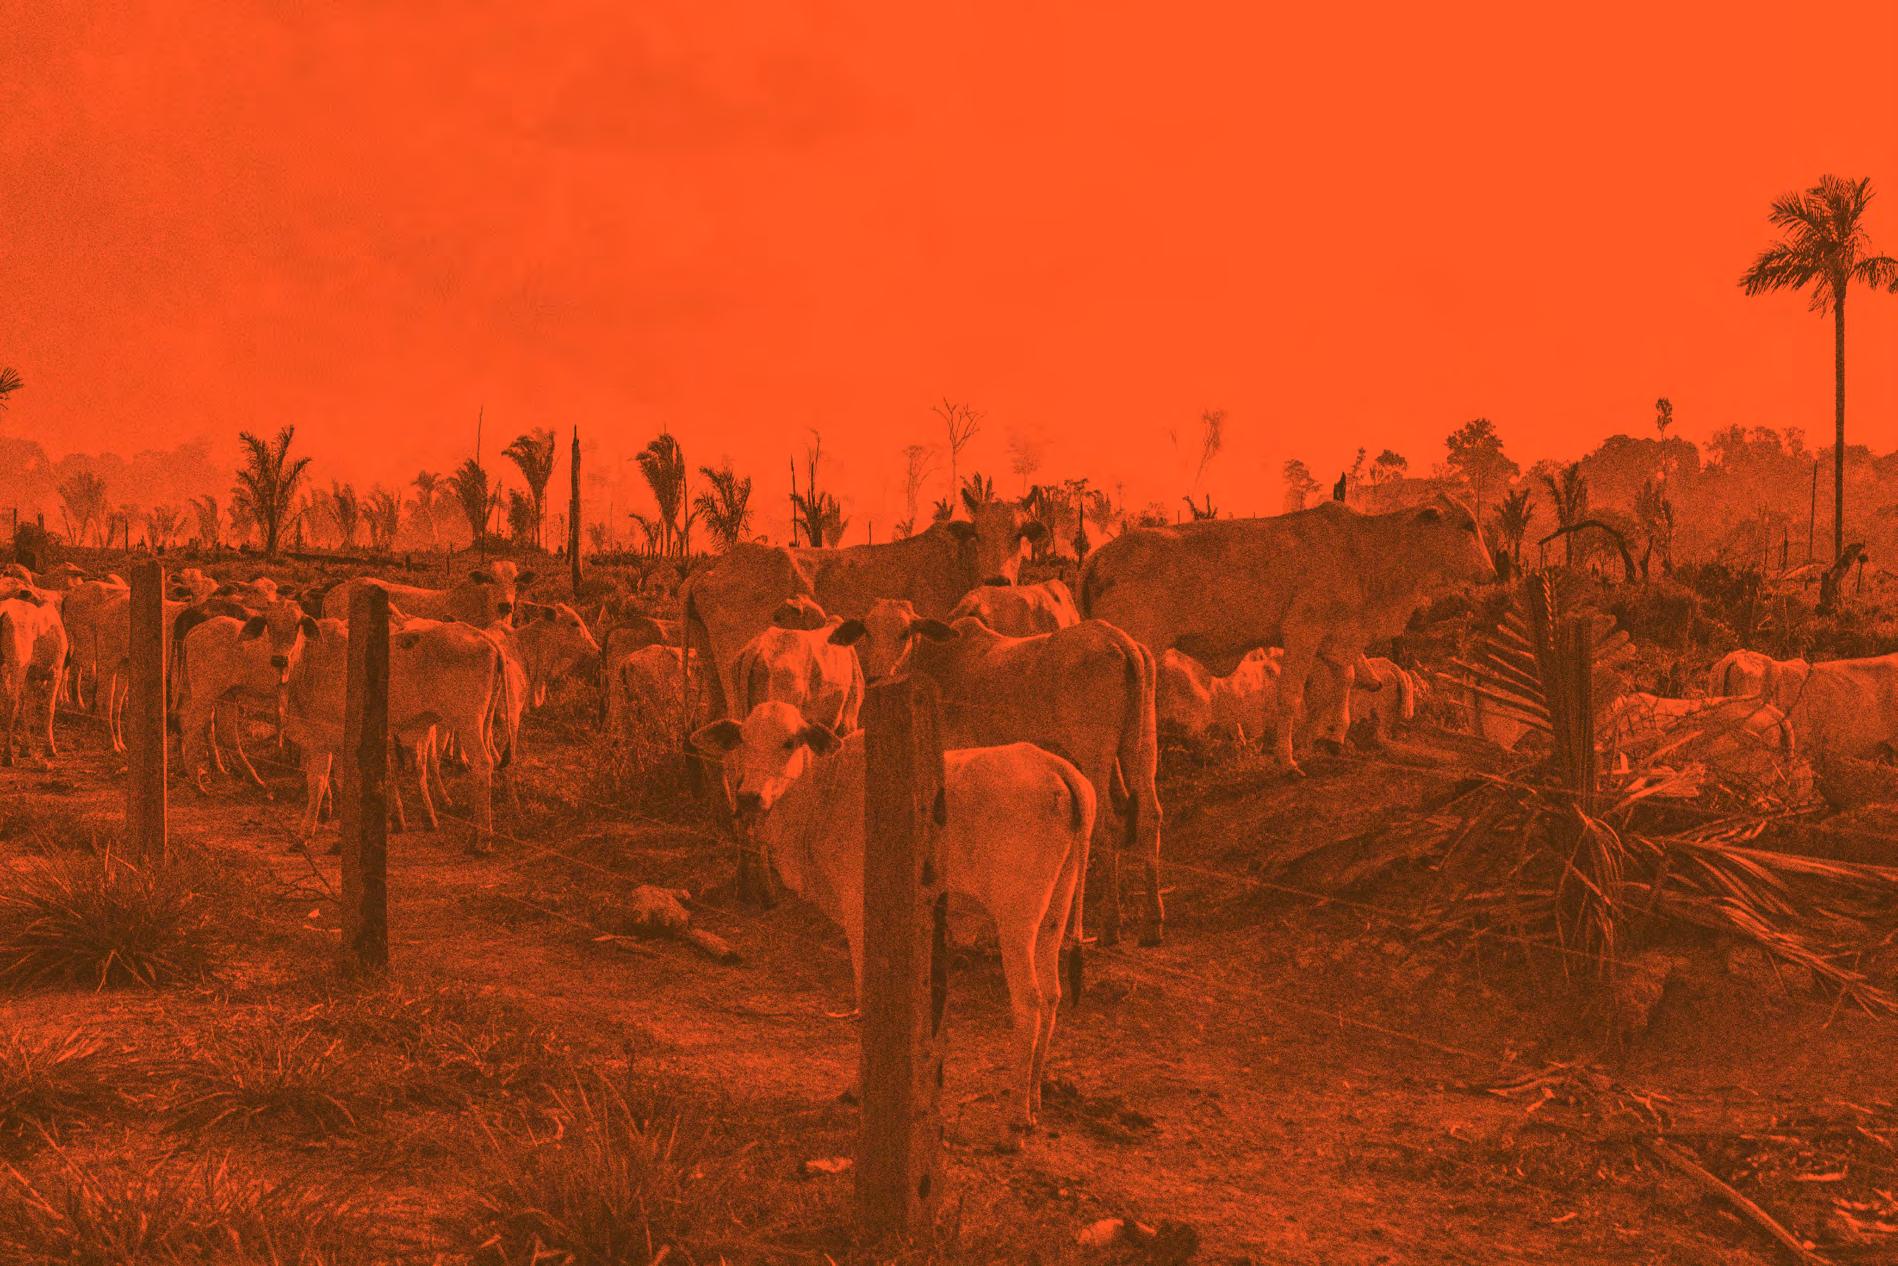
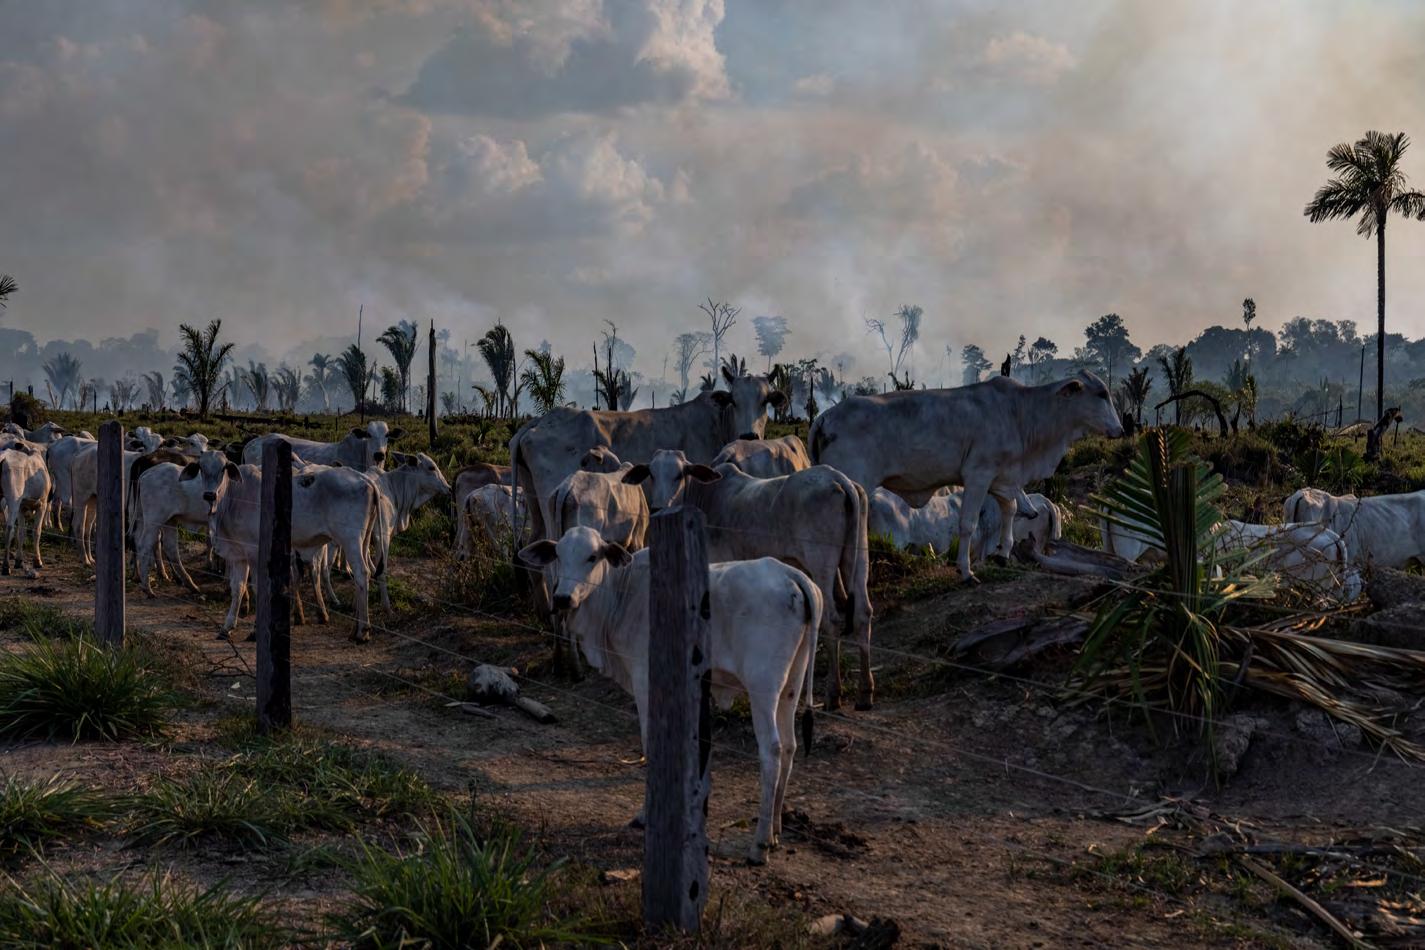
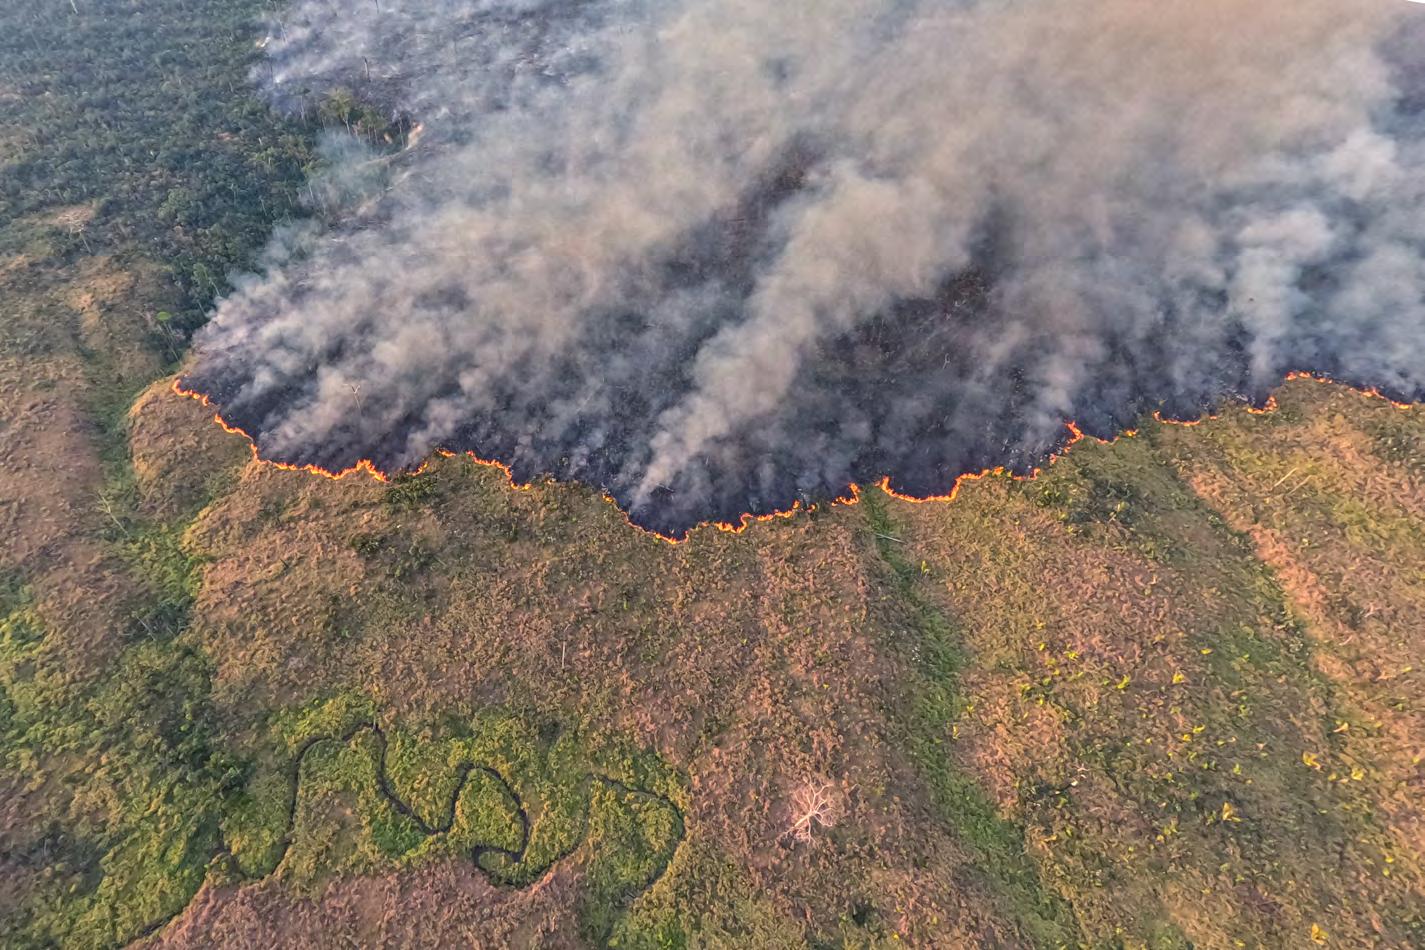
This report tracks air pollution across key regions of the Amazon, revealing how fires related to agricultural activity, in particular cattle pastures and deforestation, are degrading air quality, threatening public health, and accelerating climate and biodiversity crises.
Drawing on new publicly available air quality measurements from the Brazilian Amazon and using satellite monitoring, the report finds a clear rise in particulate matter air pollution (PM2.5), particularly near zones of intensive agriculture and forest burning. Communities living closest to these agricultural fronts are breathing hazardous air during several months of the year, with particulate matter levels exceeding major global cities and WHO health guidelines. This is a problem driven by human actions; fires in the Amazon region do not naturally occur, they tend to be intentionally set and are generally illegal.
The analysis shows that what was once considered a “clean air” region is now facing fire smoke contamination that contributes to air pollution worse than that reported for major urban areas. This pollution is not only damaging human health but also, through deforestation, it weakens the forest’s ability to store carbon and regulate rainfall, compounding global climate risks.
The findings confirm that agricultural activity and expansion in the Amazon is driving an air pollution crisis alongside deforestation. Current regulatory oversight and enforcement related to illegal fires remain weak, allowing companies to externalize pollution costs onto communities and ecosystems.
The implementation of global commitments to end deforestation is urgently needed, and actors linked to illegal fires must be held accountable. This is needed not only for the protection of forests themselves, but also for the protection of human health and to safeguard Indigenous Peoples and local communities who are on the frontlines of the impacts of the fires.
With concerted action, we can ensure thriving forests and a healthy environment for future generations.
SUMMARY OF FINDINGS
Extreme pollution peaks:
PM2.5 concentrations measured in Porto Velho and Lábrea exceeded WHO’s 24-hour guideline by more than 20 times during the 2024 fire season, reaching daily averages above 300 µg/m³. Even in 2025, the months of July, August and September had high PM2.5 measurements, including a daily average in excess of 100 µg/m³, which corresponded to a more than 6-fold exceedance over WHO’s 24-hour guideline.
Global pollution comparison:
Porto Velho’s annual PM2.5 levels surpassed those of megacities like Beijing, Santiago, and São Paulo despite its relatively small size and lack of industry, making it one of Brazil’s most polluted cities.
Corporate actors:
Many meatpackers operate in the Amazon region near burned areas. For instance, between 2019-2024, around 30.5 million hectares, equivalent to the size of Italy, burned in the Amazon biome in a 360km radius around the facilities of JBS, Brazil’s largest meatpacker. Meatpackers such as JBS do not effectively prohibit and monitor the deliberate use of fire in their supply chains - leaving meatpackers exposed to the risk of indirect or direct supply chain links, including through maintaining business relations, with farms in burned areas.
Human-driven fires:
Fires in the Amazon are overwhelmingly man-made. Ignited to clear forests and pastures for cattle production, not natural occurrences.
Pasture-driven destruction:
Nearly 75% of burned areas around Porto Velho were pastures, indicating that fire is a tool for livestock farming rather than natural fire cycles.
Annual Average: PM2.5 (2019 - 2023):
Porto Velho VS Global Cities
Annual average PM2.5 levels in Porto Velho and major regional and global cities between 2019 and 2023, compared to WHO guideline. Air pollution data excludes natural dust and sea-salt and is from AQLI/EPIC at the University of Chicago (92) based on data from the Atmospheric Composition Analysis Group (ACAG) at Washington University in St Louis (99).
Porto Velho
Beijing
Santiago
Bogotá D.C.
São Paulo
Buenos Aires (CABA)
Berlin
Greater London
New York City
WHO guideline (5µg/m³)
DEMANDS
Greenpeace International put forth the following demands:
Globally:
1. At COP30, world leaders should deliver an action plan to implement the UNFCCC’s 2030 target to halt and reverse deforestation and forest degradation. It’s time to turn commitments into action (27).
2. Governments must urgently regulate the agricultural and financial sectors to ensure their alignment with the Paris Agreement, the Kunming-Montreal Global Biodiversity Framework, and the UN Sustainable Development Goals.
3. Governments must ensure the transition to truly ecological and just food systems, an end to deforestation, and the reduction of emissions associated with agriculture, including methane.
4. Financial institutions must fulfill their duty of due-diligence and review their financing and investments into destructive stakeholders in the agricultural sector.
In Brazil:
1. State and federal governments must continue working to halt deforestation, which includes the demarcation of Indigenous lands and designating public lands to protection and sustainable use, thus avoiding that these lands are targeted by illegal land grabbing and fires.
2. State and federal governments must continue working to increase efforts to hold to account the people responsible for Amazon fires, and end the current impunity that allows those who commit environmental crimes to evade legal consequences and ignore imposed fines.
3. State and federal governments must continue implementing the decisions of the Federal Supreme Court in ADPF 743, which include: (i) gradually increasing their operational capacity to prevent and combat fires; (ii) improving intergovernmental governance capacity and allocating adequate public funding for fire
prevention and control policies; and (iii) carrying out the necessary administrative measures to expropriate, in the public interest, land affected by intentional and willful fire use and illegal deforestation, whenever landowners’ culpability for environmental violations is duly proven.
4. Farmers and ranchers that use fire illegally on their properties should be barred from accessing rural credits and other types of financing and prohibited from selling their agricultural products to agribusinesses.
5. Authorities should install reference grade air monitors in fire-affected municipalities in the Amazon region, with timely publication of the observed concentration data in an accessible, machine-readable format, to increase awareness for exposed populations and enable evidence-driven actions towards clean air.
1INTRODUCTION
© Victor Moriyama / Amazônia em Chamas
1.1 Research Objective
The severity of the fire and air pollution challenges in Brazil stands in stark contrast with its limited air monitoring capacity. While the country battles record-breaking fire episodes, without a comprehensive air quality monitoring network it remains difficult to come to grips with how fire events affect air quality. In 2021, it was reported that only 1.7% of Brazilian municipalities were part of an air pollution monitoring network, and that existing monitoring networks focus on large cities and state capitals (1,2,3). Around half of Brazil’s air pollution monitoring stations are located in just two of the country’s 26 states – São Paulo and Rio de Janeiro (3). Air quality deterioration in large swaths of the country, especially in less-resourced, Indigenous, poorer, and rural areas such as parts of the Amazon region, can go undetected unless air quality monitoring efforts are ramped up.
This research presents new air monitoring evidence for two areas in the Amazon region of Brazil: the city of Porto Velho (Porto Velho municipality, Rondônia) flanked by large-scale agricultural and livestock productions, and the Caititu Indigenous Territory (Lábrea municipality, Amazonas). Additionally, air quality data from four locations across the western region of the Amazon region, encompassing sites in Rondônia and Amazonas states, are compiled and analyzed to understand Amazon air pollution’s wider context. Global satellite observations are used to contextualise air quality in the Amazon region with cities in Brazil and internationally.
Scientific data about the air pollution and health impacts associated with agricultural and livestock
production in the Amazon can help to inform policymakers at COP30 and beyond about the need for action to halt forest destruction. The implementation of existing global commitments to end deforestation is urgently needed, and actors linked to illegal fires must be held accountable. This is needed not only for the protection of forests themselves, but also for the protection of human health and to safeguard Indigenous Peoples and local communities who are on the frontlines of the impacts of the fires.
1.2 Fires in the Amazon
Fires in the Amazon region do not naturally occur, yet the burning of the Amazon in Brazil has become a recurring yearly event. Unlike fire-adaptive ecosystems such as the coniferous forests of the Sierra Nevada (USA) or the Fynbos shrublands (South Africa) where natural fire regimes play an important role in regeneration and renewal (4), the Amazon rainforest is a fire-sensitive ecosystem that is not adapted to burning (5,6). While climate change exacerbates the prevalence of droughts that create favourable conditions for fires to flourish, Amazon fires in Brazil tend to be intentional, i.e., set by humans. Often, fires are lit as the last step of deforestation to clear forest remnants and to push the deforestation frontier farther into the Amazon forest (7). Fires are also lit to renew and prepare land for agriculture, predominantly pastures. These uses of fire, for vegetation removal from deforested areas and pasture maintenance, are associated with unsustainable agricultural practices (8).
Amazon fires and those who cause and enable them threaten public health, endanger communities,
and fuel climate change. Smoke from burning biomass contains potentially hazardous air pollutants that can contribute to poor air quality across the Amazon region and beyond. Even short-term exposure to the hazardous constituents of air pollution – including particulate matter (PM), nitrogen oxides (NOx), and volatile organic compounds (VOC) – has been associated with respiratory illnesses, cardiovascular complications, and a host of other negative health outcomes. Recent evidence on the health harms of exposure to wildfire smoke published by researchers based in Europe and North America indicates that the toxicity of PM emitted by wildfires can be up to ten times higher than from other sources such as road traffic (9,10,11). When forested areas are burned and converted to agricultural use, the amount of vegetation present to intercept and remove pollutants from the air is reduced (12,13,14). Biomass burning releases carbon dioxide, contributing to the acceleration of climate change, and leads to the loss of habitat and biodiversity. Amazon fires constitute both a public health and an environmental crisis.
Air pollution data are essential to understand environmental quality, highlight pollution hotspots, and inform mitigation strategies. Publishing data can be a ‘key catalytic step’ to encourage policy change and deliver improved air quality (15). A network of reference grade instruments1 reporting public data across a range of pollutants can help understand when, where and why air quality health thresholds are exceeded. There are no reference grade monitors reporting publicly accessible data in our study region (16). The installation of low-cost sensors is an important step to help understand local air quality, but low-cost monitors should be used as a
supplement, not a replacement for reference-grade instruments, the latter of which can be used to confirm whether thresholds have been exceeded (17). In the Amazon region, programmes and local actors have installed low-cost sensors that primarily report PM2.5 concentrations.
As part of a new air monitoring initiative, Greenpeace Brazil is deploying new low-cost sensors to provide air quality evidence in Porto Velho, Lábrea, and Médio Juruá in the Amazon region. This report presents the preliminary findings for the first two places. The sensors being deployed are low-cost sensors. All air quality sensors, even reference grade laboratory instruments, produce data with artefacts and error. This is true for the low-cost sensors deployed in this project. The sensors are intended to provide useful indicative information where currently no data is available at all. By contributing air monitoring capacity and addressing data gaps in these fire-affected regions of the Amazon, the initiative aims to enable evidence-driven actions towards clean air.
A Fight for Clean Air
Starting fires in the Amazon in Brazil is an environmental crime under Brazilian law (5). Even though using fire as a method of vegetation suppression is generally outlawed (18,5), illegal fires in the Amazon persist and they are often used to clear public lands or territories of Indigenous Peoples and traditional communities (19,20). The illegally seized and burned forests are often cleared to create more cattle pasture or produce animal feed to meet the demands of the global meat industry. Agriculture is the single biggest
1 Reference grade monitors are the highest tier air monitoring devices (after indicative and near-reference grade), with the sufficient accuracy and quality to meet established performance standards, e.g., the US EPA’s Federal Reference Method or Federal Equivalent Method (21).
driver of deforestation in the world (22,23,24); in Brazil, cattle ranchers and land-grabbers set the Amazon alight to illegally clear land (25).
The key to fighting fires in the Amazon is preventing them from being started in the first place. Once the burning has begun, the challenges of combatting active fires in the vast Amazon rainforest are monumental. Firefighting techniques that may work in other contexts such as creating fire breaks or dousing flames from above with planes become logistically complex or cost-prohibitive. Preventing intentionally-ignited fires in the Amazon means curbing deforestation and holding to account the people responsible for the fires (25), which in turn means confronting the highly expansionist and destructive activity of the agricultural sector primarily aiming to supply the growing global demands for meat, and biofuels (18,26).
Greenpeace has a history of acting in defence of the Amazon region and its peoples. This year (2025), when Brazil is hosting the 30th United Nations (UN) Climate Change Conference (COP) in the city of Belém do Pará in the heart of the Amazon, the world is turning its attention to global forest areas. The protection of forests and all other ecosystems is a key feature of the Paris Agreement, in which Article 5 requires that Parties take actions to conserve and enhance greenhouse gas sinks and reservoirs, including forests (27, 28). In 2023, at the 28th COP, world leaders agreed on a milestone to recognize the importance of enhanced efforts towards halting and reversing deforestation and forest degradation by 2030 (29). Yet two years later, plans to operationalise this commitment are still lacking –all while global forest losses continue (30).
CHIEF ZÉ BAJAGA APURIÑA
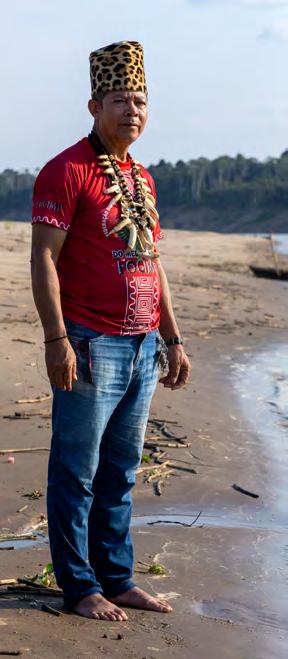
Testimonial from Chief Zé Bajaga Apurinã, leader of the Idecora village in the Caititu Indigenous Territory in Lábrea, August 2025
“Here in the Brazilian Amazon, we ‘ve been experiencing so much invasion, massive fires, so great devastation, trees being cut down for soybean plantations and cattle pastures. And it causes a lot of pollution; it’s caused by these big industries - and products to be sold abroad.
The richest countries - so as to not stop polluting - they want to pay compensation to the poorest countries. But what compensation is that, for what has already been lost? I don’t think it’s fair to pay for something that no longer exists, that has already died. They talk about a better life, a better climate, but how is the climate going to improve if all they do is pollute the planet?
At COP30 in Belém, we hope that there will be an agreement to truly improve the climate, to contribute to the less privileged, and to reduce the pollution they are causing on the planet. Doing this means achieving what is most difficult, which is to stop polluting, instead of paying a compensation.
What we ask for is more respect: respect for the planet, for Mother Earth. Those who are destroying our planet are the big corporations, the people who only care about money. And they should respect us all.”
© Marizilda Cruppe / Greenpeace
Amazon Region
Brazil’s vast landscape occupies six distinct terrestrial biomes, which are Amazon (Amazônia), Cerrado, Caatinga, Pantanal, Atlantic Forest (Mata Atlântica), and Pampa. Each of these biomes have distinct climatic zones and hydrological features. The Amazon biome of Brazil constitutes 60% of the Amazon rainforest that spans nine countries across the South American continent (31).
In Brazil, the Amazon biome largely overlaps with the geographical region designated ‘Brazil’s Legal Amazon’ (Amazônia Legal), which comprises the nine states that lie either partially or entirely within the biome. Brazil’s Amazon biome does not fully cover the same area as Brazil’s Legal Amazon (Figure 1). Parts of Brazil’s Legal Amazon lie in the Cerrado terrestrial biome – notably the southwestern corner of Mato Grosso state. Additionally, the Amazon biome is not just in Brazil, it also extends into Bolivia, Colombia, Ecuador, French Guiana, Guyana, Peru, Suriname, and Venezuela.
In this study, the ‘Amazon region’ will refer to part of the Amazon biome (ecological classification) that lies within the administrative zone of ‘Brazil’s Legal Amazon’.
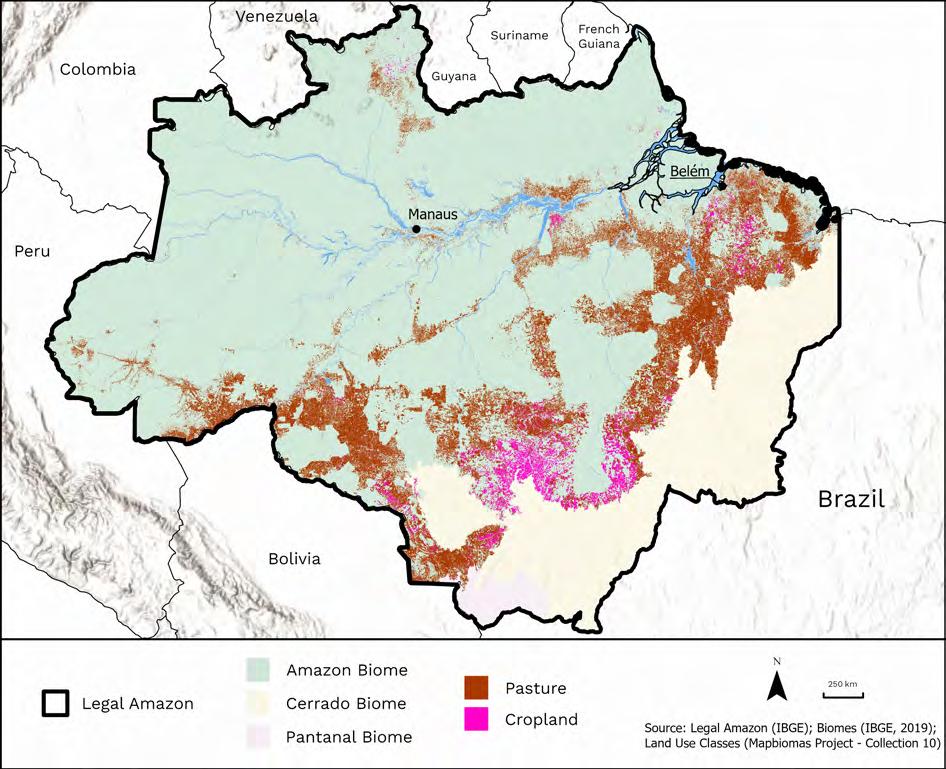
1. Map of the Amazon, Cerrado, and Pantanal biomes in Brazil’s Legal Amazon and the distribution of pastures and cropland in Amazon Biome in 2024.
Figure
Fire Types
Fires in the Amazon region can be classified into three interrelated categories (32):
Deforestation fires are the intentional burning of biomass remnants from clear-cutting as a method to convert the land for alternative land uses, hereunder agricultural and pastoral activities.
Maintenance fires, or biomass burning, are the intentional burning of pastoral or fallow plots with the purpose of pasture regeneration or vegetation clearing and readying the land for agricultural usage. These plots are generally previously deforested areas that have been converted for agricultural expansion.
Wildfires are accidental or malevolently set. These are uncontrolled fires that spread from controlled fires (e.g., deforestation and maintenance fires) and burn the standing forests. Repeated burning of forested areas increases the fire intensity as fires move from consuming understory growth to more vertical damage.
Climate change-driven droughts intensify the environmental conditions that increase the intensity and spread of wildfires. These droughts draw out the moisture content in Amazon soil and vegetation that is instrumental in the biome’s natural fire resistance.
An overview of fire governance legislations and policies is presented in the Appendix I.
1.3 The Agricultural Sector’s role in Amazon Fires
Between 1985 and 2024, an average of 7.2 million hectares burned annually in Brazil’s Amazon biome – an area roughly the size of Ireland, according to analysis by MapBiomas (33). The area that is burned by fire fluctuates from year to year. In most years, the land use type that undergoes the greatest area of burning are agricultural areas, including both pastures and cropland. MapBiomas data indicates that the vast majority of this burning is concentrated on pasture, making it the primary land cover type affected by fire ignition (Figure 2).
2. Annual burned areas in the Amazon Biome in Brazil from 1985 to 2024 by land cover type. The percentages shown correspond to the areas burned in pastures, in relation to the total burned area across all land cover types. Source: MapBiomas (33).
Forest Herbaceous and Shrubby Vegetation Other Pasture Crops
Figure
Amazon fires occur disproportionately on pastures, despite them only constituting a smaller portion of the Amazon biome. In the past decade (2014–2024), pastures made up between 11–13% of the Amazon biome’s total landmass as per MapBiomas data (Figure 3), and this land use type has gradually increased over the past four decades by degrading and converting native ecosystems such as old-growth forests for agricultural use. During the same period, almost half of the total burned areas in the Amazon were detected on pastures (Figure 2), underscoring the outsized negative impact of pastures and those who manage them on Amazon fire occurrence and likely, the ensuing health and environmental consequences. Fires on pastures can also serve as ignition sources from which fires escape and spread into native ecosystems.
Figure 3 visualizes the land cover and use changes over the past four decades in the Amazon biome in Brazil, based on MapBiomas data. The land use categories ‘forest plantation’ and ‘other’ are not visible in the graph because their percentages are too small compared to the other categories. The percentages shown correspond only to forest (dark brown) and pasture (purple), meaning that their sums do not total 100%.
The most severe fire event measured by the total burned area was recorded in 2024, when 15.6 million hectares were ravaged in the Amazon region according to MapBiomas data, which was more than double the yearly average of the past almost three decades. The 2024 Amazon fires also marked the first year on record where forest vegetation was the land use type with the largest burned area. However,
3. Land cover and land use distribution in the Amazon biome in Brazil from 1985 to 2024.
The percentages shown correspond to the land cover proportion of forests and pastures. Source: MapBiomas (46).
Figure
the trend over the past four decades shows with the exception of 2024, fire events are always concentrated on pastures (33,7). Many fires outside pastures are burning of native vegetation to clear land for pastures, and therefore they are also associated with pastures. The ways in which fires are fuelled by the expansionist ambitions of agribusinesses will be explored farther down in this section.
Severe droughts across the Amazon region in 2023 and 2024 created conditions that enabled fires in the Amazon biome to proliferate. The drought conditions exacerbated by climate change and worsened by a strong El Niño phenomenon contributed low humidity, flammable vegetation that was conducive to fire propagation, and exacerbated the scale and severity of the 2024 Amazon fires. However, even in drought conditions fires do not naturally occur in the Amazon biome and human-ignited vegetation burning was the root cause (34).
July to November is described as the main human-induced fire season in the Amazon biome, and will be termed the ‘fire season’ in this report. This period typically experiences the most severe fire events. According to data compiled by MapBiomas, between 1985 and 2024, 77% of the cumulative burned area of all recorded fire events that occurred in the Brazilian Amazon biome was observed during the fire season (Figure 4). Within the fire season, the months with the greatest burned area from highest to lowest were October (28%), September (25%), November (12%), and August (9%) (33). The fire season overlaps within the Amazon biome’s dry season (July–November), and is characterized by low rainfall and high temperature.
Figure 4. Monthly distribution of fires in Brazil’s Amazon biome by total area burned between 1985 and 2024. Source: MapBiomas (33).
Drivers of Fires
Across studies in the literature covering the Amazon region in Brazil from the past two decades, evidence consistently suggests that fire occurrences in the Amazon biome are entirely human-induced and are associated with land clearing for agriculture and livestock, and not ignited by natural climatic factors and drought conditions.
Evidence in the literature, described in the sections below, demonstrates that fire in the Amazon is not primarily a natural or drought-driven phenomenon. Rather, it is a direct outcome of agricultural expansion and pasture establishment, with far-reaching ecological and public health consequences (19,35,36,37,38,39,40).
An analysis covering 2003–2020 and using fire and land use data found that burned areas in the Amazon region were concentrated on agricultural lands (32% of the cumulative burned area) followed by natural grassland (29%) and old-growth forests (16%) (35). More recent assessments using satellite imagery data from the Sentinel-2 satellite corroborate this finding. Researchers at the Amazon Environmental Research Institute (IPAM) found that fires on agriculture lands dominated Amazon fires in June, July and August between 2019 and 2024 (36). The same pattern was observed by the same researchers between January and August, 2024; the land use type with the greatest burned area in the Amazon is agricultural lands at 62%, followed by old-growth forests at 26%. Similar to fires on agricultural lands, fires in old-growth forests also tend to
have agricultural origins, as the majority of deforestated areas eventually become pasturelands.
Additional analysis from MapBiomas on fire occurrence on pastures highlights the central role of livestock rearing in fire events in the Amazon biome (38). An estimated 36% of all pastures in Brazil are found in the Amazon, and pastures cover 14% of the Amazon biome by area. Between 1985 and 2023, 83% of all pastures in Brazil burned at least once, with some areas experiencing repeated fire events over the decades. During the same period, pastureland was the land type with the second-highest level of burning across Brazil. A quarter of all burned areas were pasture (181 million hectares), 68% of which took place in the Amazon biome. Between January and October of 2015–2023 (nine years), the total burned area on pastureland in the Amazon biome nearly equaled that of the preceding three decades, underscoring the sharp intensification of pasture fires post 2015. Fires in pastures that border the forest edge increase the likelihood of fire escaping into adjacent forested areas.
Satellite imagery using Sentinel-2 data to track the change in deforestation and burned areas in August 2019 suggest that the majority of fires occurred in areas that were recently cleared, with a high occurrence rate in the transitional zones between forest and agricultural lands (39). In contrast, fire events in the old-growth Amazon forest were comparatively rare (39). A 2016 study found that more than half of all forest fires were detected in the municipalities with the highest level of deforestation in the preceding 12 months, establishing that new
deforestation is one of the most important risk factors of Amazon forest fires (40). These fires are not incidental: they are closely linked to cycles of deforestation, land-grabbing, and expansion of the agricultural frontier – and the dominant final stage of this land use conversion is pasture (19).
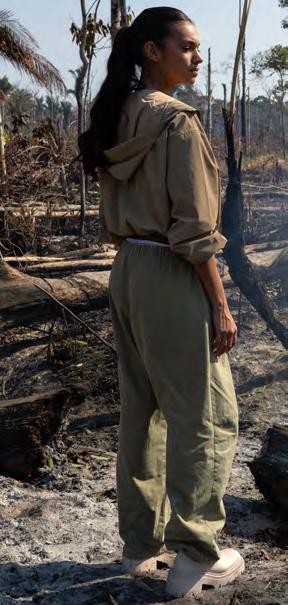
Testimonial from Alane Dias, Amazonian actress and ballerina, who visited areas affected by fires at the invitation of Greenpeace Brazil in August 2025
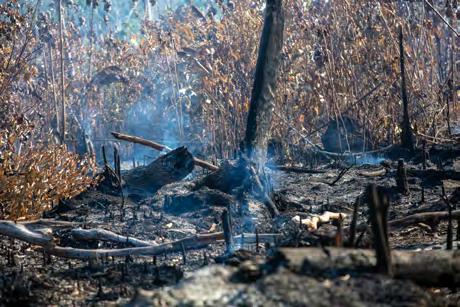
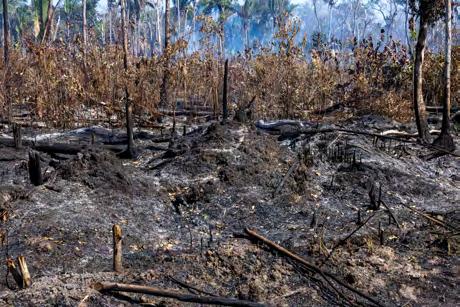
“I am witnessing one of the saddest scenes I have ever seen in my life. Although I was informed and knew I would be coming here, it is completely different to set foot on this ground and see that the black and white soil are not sand, but tree ashes.
It is very sad to witness all this and not think about the people who live here in the surrounding area and how long it will take for this land to regenerate. We hear a lot about deforestation and fires in the Amazon, but we have to talk not only about the solutions – which are extremely important – but also about who the villains are.
There is an absurd difference between the presence of big corporations and a land that is cared for by Indigenous Peoples. The relationship they have with this territory is completely different. And it is frightening that they are so close to each other. This is also a great disrespect to those who live here, to the history of this place.
The future of the Amazon is ancestral. The future of the Amazon lies with the Indigenous Peoples. This year we have COP30 in Belém do Pará, which is the COP for implementation, precisely to fulfil the agreements that were made in previous years. And it is time to demand that changes happen, because the Amazon deserves respect from all of us.”
ALANE DIAS
BUSTING MYTHS
X Fires in the Amazon biome occur naturaly and are good for the ecosystem.
✓ Fires in the Amazon biome are human-ignited and highly destructive for the ecosystem.
X Amazon fires occur because of logging.
✓ Vast areas in the Amazon biome are set ablaze to clear land for pastures used in livestock rearing.
© Marizilda Cruppe / Greenpeace
Corporate Actors
Evidence indicates that fire use remains central to the Brazilian agricultural sector’s clearing and pasture maintenance practices. During the 2020 fire moratorium (when the federal government placed a 120-day moratorium on burnings in the Amazon), a study found that 68% of properties with fires that occurred during the moratorium were cattle ranches, and 87% of the total burned area within the study area occurred on cattle farms (41).
In addition to its environmental and climate damage, use of fire by cattle ranchers is a compounding public health hazard. Fire use emits air pollutants into the atmosphere, while land conversion driven by pasture expansions reduces forest cover and its air filtering capacity. Deforestation-linked agricultural exports – destined for international markets, driven by a growth-at-all-costs corporate strategy, and frequently associated with fire use – have been attributed by Du et al. (2024) to an air pollution burden that resulted in more than 700,000 premature deaths in Brazil over the two decades ending in 2024 (42). Simply put, agricultural expansionism to satisfy an ever-growing corporate appetite for profits imposes a measurable and considerable health burden on the Brazilian population (41,42,43).
To demonstrate the potential exposure of the cattle sector to fires that occur in the territory, the present section draws on literature and provides a new calculation for deforestation and fire occurrence in the areas near JBS slaughterhouses in the Amazon biome. It’s important to note that JBS is not the only company operating in the region, as there are
several other meatpackers that also have facilities in the Amazon, and their potential cattle purchasing zones often overlap. For the purposes of this analysis, we are focusing on JBS as an example, as it is the world’s largest meat company and a key agricultural player in Brazil. While we acknowledge that the deforestation and fires cannot be attributed to JBS, and we reiterate that there are other meatpackers operating in the Amazon which are beyond the scope of this analysis, JBS has a high potential exposure to the risk of being linked to deforested or burned areas given that JBS is the company with the highest number of large slaughterhouse units in the Amazon (see figures 5 and 6), not to mention the high capacity to slaughter animals per day.
JBS has been linked to cattle raised in farms with fires or other environmental problems (137,138). JBS’ system for monitoring and eradicating deforestation from its supply chain has profound deficiencies, not least because of the failure to effectively prohibit and monitor the deliberate use of fire, as well as its continued lack of effectiveness to identify and monitor the entire supply chain (including indirect supply and third parties). According to Instituto do Homem e Meio Ambiente da Amazônia (IMAZON), JBS’ potential cattle-buying zone overlaps with 11.5 million hectares of land classified as exposed to deforestation risk: the largest exposure among all meatpackers assessed (43).
According to Imazon, slaughterhouses authorized for export, such as JBS meatpacking plants, have a radius of an average of 360 kilometers around them from which they potentially purchase cattle
(44). This buffer of 360 kilometers was applied by Greenpeace International to assess the deforestation and burned areas near JBS based on the geolocation of the company’s facilities, as shown in Figures 5 and 6. This 360km radius refers to the area surrounding slaughterhouses where Imazon estimates cattle could be sourced - not necessarily proven supply relationships.
Considering the time frame from July 22, 2008 –the landmark amnesty for deforesters – up to the most recent data on deforestation published by Brazil’s National Institute for Space Research (45), we find that:
• Whereas overall cumulative deforestation between 2008–2024 in the Amazon Biome amounted to 12.7 million hectares;
• Cumulative deforestation within a 360km radius around JBS facilities in the Amazon biome was 9.2 million hectares, equivalent to 72% of the total deforestation recorded in the biome during the period.
It must be noted that part of the slaughterhouses that purchase from rural properties in the Amazon are located in transition zones with other biomes such as the Cerrado and Pantanal; this analysis considers only deforestation within the Amazon Biome and only the risk of exposure of facilities located within the Amazon biome.
According to land-use and land-cover data provided by Collection 10 of the MapBiomas project
(46), pasture areas in a 360km radius around JBS’s facilities in the Amazon biome, on the other hand, grew by 16%, increasing from around 38 million hectares in 2008 to around 44 million hectares in 2024, representing the expansion of around 6 million ha, an area equivalent to 41 times the size of the city of São Paulo and 58 times the size of the city of Belém, capital of Pará and host of COP 30 in 2025.
Analyzing Mapbiomas spatial data on accumulated burned areas from the past six years, Greenpeace International verified that a large part of these areas was concentrated around JBS slaughterhouses (Table 1 and Figure 6). In total, between 2019 and 2024, around 30.5 million hectares were burned in a 360km radius around JBS’s facilities within the Amazon biome alone, and more than half of the area consumed by fire in the biome during 2024 occurred in this zone. That’s equivalent to 201 times the size of the city of São Paulo. It is important to note that correlation does not imply causation.
When asked for a comment, JBS criticised the application of a fixed 360km radius as overestimating the exposure and stated that cattle sourcing distances vary widely by state. JBS further stated that this methodology does not take into account JBS’s actual cattle buying process, policies, and supply chain monitoring capabilities.
Indeed, this Greenpeace International analysis does not indicate any direct nor indirect links between JBS and specific deforested and burned areas. However, the 360km radius, that Imazon estimates could be meatpackers’ potential cattle purchasing zone, provides a useful overview of the risks that meatpackers - of which JBS is the largest - could
be exposed to if they do not effectively prohibit and monitor the deliberate use of fire in their supply chains and other business relationships. JBS says it enforces a zero-tolerance policy for illegal deforestation, and that it monitors 100% of its direct suppliers, but analyses indicate that it does not monitor all its indirect suppliers nor effectively blocks indirect suppliers involved with deforestation, nor direct or indirect suppliers involved with use of fire.
Table 1: Analysis of burned areas within 360km radius of JBS’ facilities in the Amazon between 2019 and 2024.
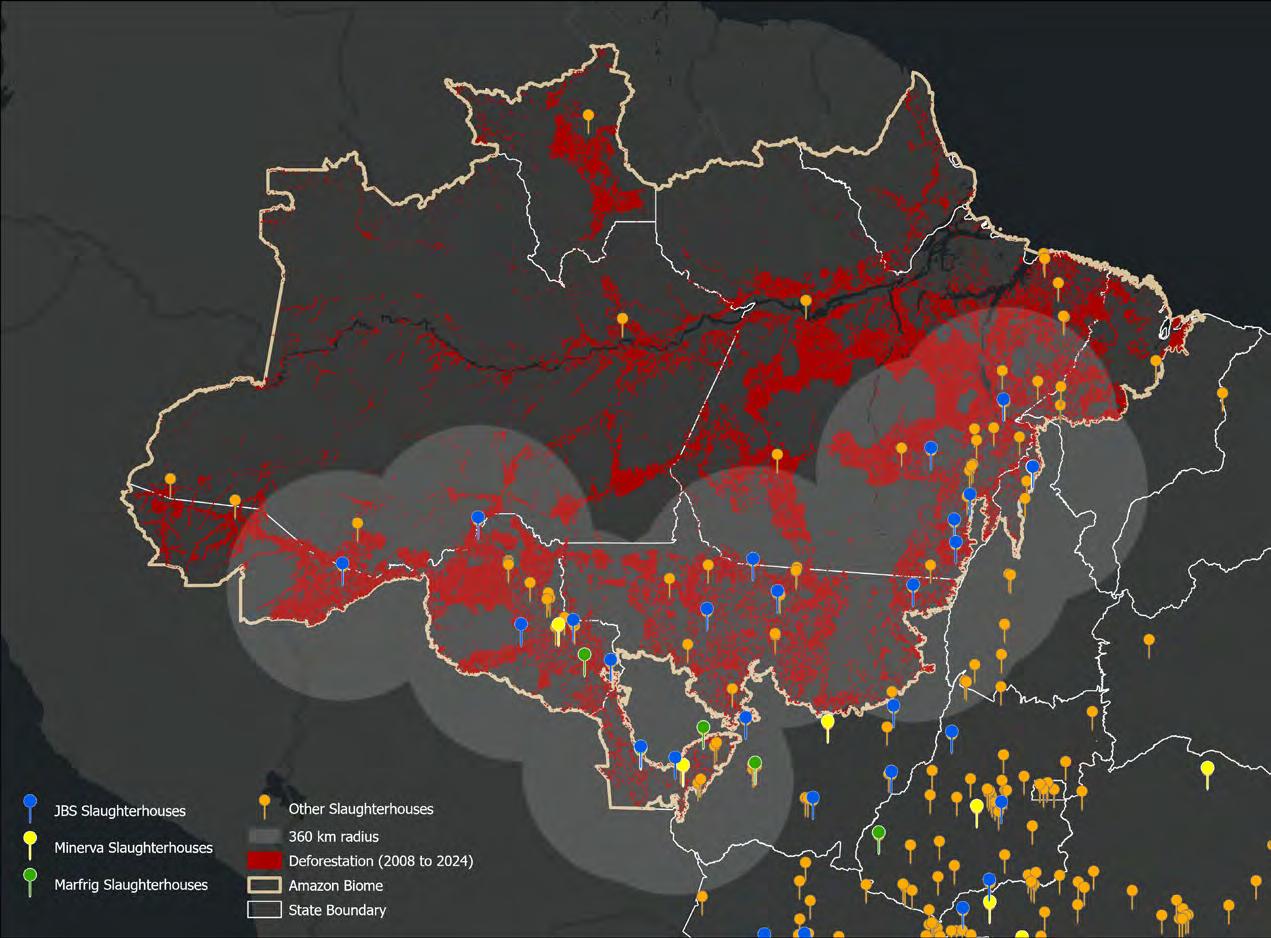
Figure 5. 360km radius around JBS slaughterhouses and cumulative deforestation 2008-2024.
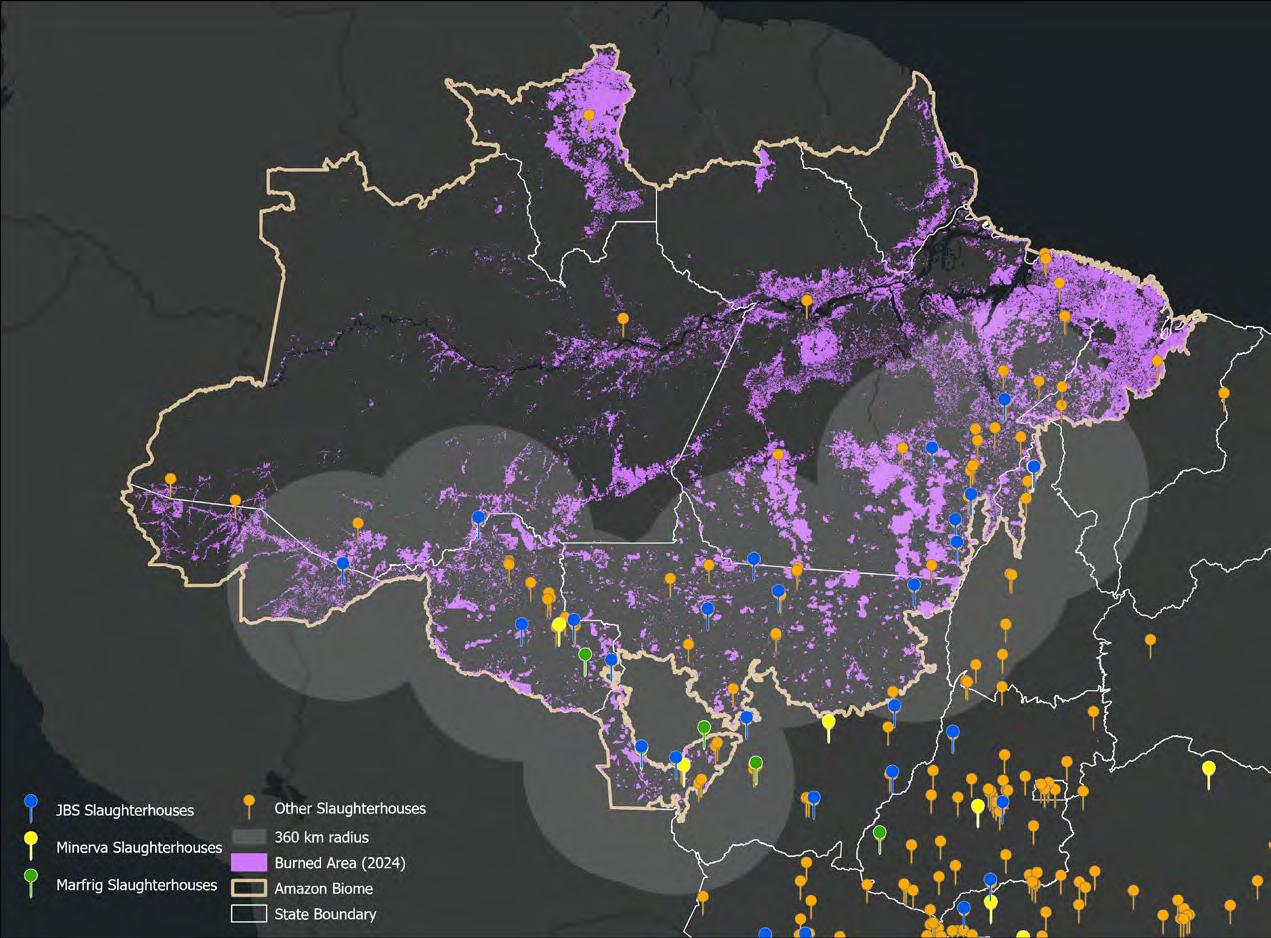
Figure 6. 360km radius around JBS slaughterhouses and burned area in 2024.
1.4 Impacts of Amazon
Fires on Air Pollution and Health
Air Pollution
Burning vegetation in the Amazon region reduces air quality because the fire smoke contains air pollutants that are hazardous to human health and that disrupt ecological processes.
These fires emit health-damaging pollutants that include particulate matter, nitrogen oxides (NOx), carbon monoxide (CO), polycyclic aromatic hydrocarbons (PAH), and volatile organic compounds such as benzene (47), which is a known carcinogen (48). Through chemical processes in the atmosphere these primary emissions contribute to the formation of secondary air pollutants such as secondary volatile organic compounds (VOC), secondary particles, and ozone (O3) (47).
The mixture of pollutants emitted by fire events can vary with different fuel types (vegetation), fire regimes (complete or incomplete combustion), and weather conditions (49,50). Literature on Amazon fire events suggests that smoke exhibits characteristics that pose elevated risks to human health. The particulate matter emissions in fire smoke have a high proportion of fine particulate matter (PM2.5) (~90%), which is small enough to penetrate the lungs (51,52), and high levels of PAHs and VOCs which include potential carcinogens such as benzene and formaldehyde (53).
Research suggests that wildfire smoke could produce particulates that are smaller than some urban particulate pollution, which in turn could mean that wildfire smoke pollution poses an even greater risk to health than urban particulate pollution. The smaller the particles, the deeper they can penetrate into the lungs – the smallest particles can even cross into the bloodstream (54).
Across the biomass burn cycle of Amazon fires, a controlled experiment by Costa et al. (61) in the state of Rondônia found that the initial phase (flaming phase) emits the highest quantity of PM2.5. These findings suggest that individuals and communities in close proximity to fire events are likely to be exposed to high amounts of small and potentially toxic airborne particles.
Amazon fire-derived emissions contain environmental contaminants that can have a destabilizing
effect on the Amazon biome ecosystem and beyond, and the contaminants can also reach inhabited areas. Biomass burning emits carbon dioxide (CO2) and methane (CH4) – both of which are greenhouse gases that fuel the pace of climate change – and other non-methane hydrocarbons (NMHC) (55). Black carbon from Amazon fires has been deposited onto Andean glaciers and Antarctic sea ice through transportation and dispersion processes in the atmosphere (56,57) and has the effect of accelerating the melting of ice (57). Modelling suggests that smoke emissions from Amazon fire events contribute more than 50% of the total ground-level ozone (O3) concentrations across parts of Brazil, including parts of the Amazon region (58). Ozone inhibits photosynthesis and disturbs the ecological processes in the Amazon biome (10,59). Other environmental contaminants in fire smoke can
Activists in a Overflight, in the Amazon in 2022. © Bruno Kelly / Greenpeace
affect the local climate by inhibiting rain patterns and acidifying the soil (60,61).
Documented regional biomass burning episodes between 2011 and 2024 have been associated with higher ambient air pollution concentration in the following cities: Porto Velho (Rondônia) (62,63), Sinop (Mato Grosso) (64), Manaus (Amazonas) (65), Rio Branco (Acre) (66), Boa Vista (Roraima) (67), Cuiabá (Mato Grosso) (68), Santarém (Pará) (69), São Paulo (São Paulo), and Brasília (Distrito Federal) (70). The recorded spikes in air pollution levels in these locations predominantly concern airborne particulate matter concentrations, but also ozone, black carbon, and nitrogen oxides.
Not all fine particulate matter and air pollution detected in the Amazon region originated from in or near the Amazon region. Just as emissions from Amazon fires can be transported across continents and detected in e.g., the Andean Glaciers and Antarctic sea ice (57,71), pollutants from fire activities outside the Amazon region can also reach the Amazon basin and affect regional air quality (35).
Health
Fire smoke is a major health risk for communities living in the Amazon region. Inhaling fire smoke – even in the short-term – can exacerbate symptoms of respiratory conditions such as lung inflammation, pneumonia, bronchitis, and asthma, and can contribute to the development of cardiovascular illnesses (54,72,73). Long-term exposure to contaminants such as PAHs and particulate matter that are in biomass fire smoke can increase
the risk of developing severe negative health outcomes such as cancer and stroke (49,74,75,76).
Persistent fires across the Amazon keep large swaths of the region above the WHO’s Air Quality Guideline for airborne particulate matter concentrations (77,78). An estimated 60% of residents in the Amazon and Central-West regions of Brazil were exposed to prolonged periods of high PM2.5 concentrations (>15 µg/m³) for approximately six months of each year between 2010 and 2019 (77). In Porto Velho’s urban area, one-half of the population are socially and economically vulnerable, making this population particularly susceptible to air pollution from forest fires (78).
Exposure to PM2.5 from biomass burning and wildfires is associated with higher levels of hospitalization related to respiratory, cardiovascular, and all-cause admissions than non-fire related PM2.5 emissions (79,54,80,73). Fire related air pollution can affect all age groups (72) but some people are at greater risk: younger and older age groups (≤19 years, ≥60 years) are more susceptible than other age groups to exposure to PM2.5 originating from wildfire smoke (81,73,54).
Studies estimating the health impact of fire smoke exposure in the Amazon region point in one direction – the health burden on people and communities is substantial. Ribeiro et al. (2024) analyzed data from 2009-2019, finding that a total of 1,438,322 wildfires were recorded in the Legal Amazon region, of which 85% were during the months of August–December; they also analysed hospitalisation data for the same period (2009–2019), reporting that the total number of hospital
admissions for respiratory diseases among children (0–14 years old) and the elderly (60 years and above) in the Legal Amazon was 566,707 (82). Admission rates for respiratory conditions showed pronounced increases during periods following deforestation fires and heavy smoke events – a pattern that indicates an association between fire activity and hospitalizations (78,83,84,85). In recent decades, fire smoke exposure has been identified as the predominant contributor to almost 50,000 hospitalizations2 annually across Brazil (73). Chronic exposure to fire smoke contributes to a reduction in life expectancy – regional modelling suggests that eliminating vegetation fires across South America in e.g., forests, croplands, and pastures could prevent up to 16,800 deaths every year, with nearly a quarter of this benefit concentrated in the Amazon Basin (139).
The health burden from fire smoke in the Amazon fluctuates annually, with severe fire years triggering sharp surges in respiratory admissions that can overwhelm healthcare systems (78,83,84,86,87,81). For example, long queues outside hospitals in Porto Velho were recorded during the intense fire events of August 2019 that saw the PM2.5 level skyrocketing (86). More generally, respiratory hospitalizations consistently peak during the Amazon fire season, when intensified fire activity coincides with higher admission rates (82,85,86). Studies that investigate
the association between deforestation-related biomass fires and diseases discuss widespread association of exposure with health problems (60). September is the worst affected month for wildfire smoke in the Brazilian Amazon, when an estimated 10% of municipalities can be exposed to PM2.5 at ≥75ug/m3 (81), and in the dry season, vegetation fires contribute >80% pollution across the southern Amazon (60).
Children face disproportionate harm from fire smoke exposure (85,82,72,81). Children are particularly affected when they breathe in polluted air because their lungs are not yet fully developed, and they often have a faster breathing rate than adults – one of the research studies that analyzed who is affected by air pollution from fires in the Amazon found that more than half of all respiratory admissions between 2000 and 2016 in Porto Velho were children aged 5 or younger (88). Respiratory hospitalizations spike during and in the aftermath of severe droughts and intense fires. Smith et al. (2014) reported that severe drought years (2010 and 2015) saw an up to 267% increase in admissions (of ≤5 year olds) (89), while children living near burning areas faced a 36% higher risk of hospitalization (≤ 10 year olds) according to Barcellos et al. (2019) (84) – underscoring the vulnerability of children to air quality deterioration in the Amazon region.
The fire and air pollution crises of 2019 and 2024 indicate that high intensity Amazon fire events escalate health impacts into public health emergencies. A modelling study by Butt et al. (2021) estimated that in the Amazon region in Brazil, air pollution contributed to 3,400 early deaths in 2019 due to exposure to PM2.5 from deforestation-related fire smoke (140) and thousands of excess hospitalizations, including a rise in mortality among hospitalized children (≤10 years) compared to the year before (84). A point of great concern, it is reported that infants less than 1 year of age accounted for every fifth hospitalization from respiratory conditions linked to deforestation fires and their ambient air pollution in 2019 – some of the most vulnerable individuals in the society (78). In 2024, record-breaking August fires again triggered reports about unusually high rates of paediatric cases in hospitals in Porto Velho (83) – from smoke emitted from fires that originated over 300 km, or around 200 miles away (86).
Evidence suggests that wildfire-specific PM2.5 is up to 10 times more harmful to respiratory health than PM2.5 from other sources, and particularly so for children under 5 years old (80). The biological mechanisms for the increased toxicity of wildfire PM2.5 are not yet fully understood by scientists, therefore more research is needed (54). In addition, researchers find that the PM2.5 and PAH compounds found in biomass smoke can
2 Hospitalization is defined as at least a 24-hour stay in hospital.
contribute to DNA damage and elevate the risk of developing some cancers (74,75,76).
Modelling suggests that doubling Brazil’s Protected Area3 coverage could decrease fire season PM2.5 levels by 10% and respiratory hospitalizations by 7%, with the greatest health improvements seen in children (≤15 years) (90). By eliminating deforestation-related fires, between 400–1,700 premature adult deaths annually across South America could be prevented, with major benefits concentrated in the Amazon (91).
If the Amazon region of Brazil achieved WHO’s 2021 guideline for the annual average PM2.5 level of 5 µg/m³, the potential increase in life expectancy in the region from removing PM2.5 air pollution related premature mortality factors could be considerable. The Air Quality Life Index (AQLI) by the University of Chicago estimates the potential gain in life expectancy from meeting the PM2.5 standard. It suggests life expectancy could increase by 2.9 years in Rondônia, 2.8 years in Amazonas, 2.5 years in Acre, 1.5 years in Mato Grosso, and between 0.4 and 0,9 years in the five Westernmost states, according to 2023 figures (92). The potential gain in life expectancy by meeting PM2.5 standards in the northeastern region of Brazil is among the highest in all of South America because of the region’s severe, persistent, and layered air pollution challenges.
An overview of air quality legislations is presented in the Appendix II.
3 Protected Areas in Brazil are defined in the National System of Protected Areas (Sistema Nacional de Unidades de Conservação da Natureza; SNUS) established through Law No. 9.985 in 2000 (93). In 2025, Protected Areas comprise 18.6% of Brazil’s land area (94).

ANDERSON TORRES
Testimonial from Anderson Torres, a health professional in Porto Velho, October 2024
“Here in our territory, we have a very dry climate, which, along with this issue of the haze, creates very alarming respiratory problems amongst our population. In every ten children, at least six experience coughing, and that number is still increasing by a lot.
We as doctors are left trying to correct something that’s beyond our means. It’s frustrating.
The immediate symptoms of haze are mainly neurological: headaches and dizziness. With prolonged exposure, we are prone to diseases like cancer, because haze interferes with the natural functioning of the body.”
2METHODOLOGY
© Marizilda Cruppe / Greenpeace
This study combines new field monitoring with analysis of existing data sources to produce an up to date picture of air quality across key regions of the Brazilian Amazon. The research focuses on two states, Rondônia and Amazonas where deforestation and fires are most concentrated. To help address major data gaps, Greenpeace Brazil deployed new stationary and mobile air quality sensors in 2025 to generate empirical PM2.5 measurements, complementing satellite-based datasets and publicly available information from existing monitoring networks.
Two stationary AirGradient OpenAir monitors were deployed in Porto Velho and the Caititu Indigenous Territory near Lábrea. These instruments record fine particulate matter (PM1, PM2.5, and PM10) and CO₂ concentrations hourly, providing continuous real-time readings of air quality in the immediate environment. The data were processed using manufacturer recommended correction algorithms to improve data accuracy. The first results from these sensors covering September 2025 form part of the new analysis presented in this report.
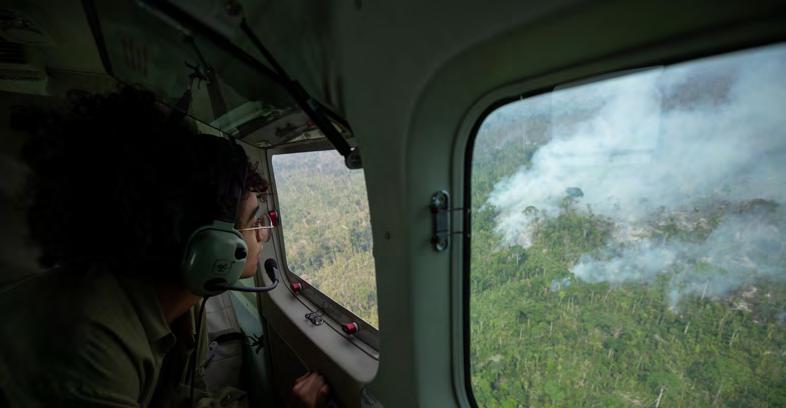
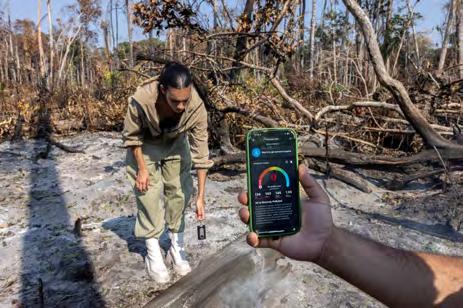
A second component involved mobile air quality monitoring using Atmotube personal sensors worn by field researchers. These devices capture the air individuals are actually exposed to as they move through different environments, measuring PM2.5 among others. The researchers carried these sensors in the cabin during aircraft
overflights through smoke affected regions as well as on ground based field trips. The sensors’ built-in GPS allows for georeferenced mapping of air pollution exposure across urban, rural, and forested areas in Porto Velho, Canutama, and Lábrea municipalities.
In addition to new field data, the study incorporates publicly available PM2.5 data from low-cost ‘PurpleAir’ sensors, as well as satellite-derived estimates of ground-level PM2.5 and burned-area data from the MapBiomas Fire Monitor. These sources enable comparisons between locations and over time, linking air quality trends to patterns of fire activity. All air quality monitoring datasets underwent quality screening to remove instrument errors and ensure the reliability of the analysis.
Together, these complementary datasets (ground-based, mobile, and satellite) form an integrated evidence base on air quality and fire-related pollution in the Amazon. The resulting findings provide policymakers, researchers, and public health experts with the most detailed and accessible air-quality data yet produced for this region, supporting evidence-based action at both domestic and international levels.
A thorough breakdown of the methodology and description of study locations can be found in the Appendix III.
3RESULTS
© Marizilda Cruppe / Greenpeace
3.1 Land use and fire
occurrence
The land use patterns around the locations of the study area – Porto Velho municipality and Lábrea municipalities (encompassing Lábrea city and the Caititu Indigenous Territory), were determined with the use of MapBiomas Collection 10 data data which tracks land usage and fire occurrence in Brazil (46). The distribution of land use types and burned areas from fire activity during the years 2024 and 2025 are mapped in Figures 7 and 8, which reveals a stark difference in land use types between the areas surrounding the two study locations.
Porto Velho city sits within a livestock zone. Large swaths of pastureland are located north of the city, towards the state border of Amazonas, and south into Rondônia state. Soybean cultivation represents only a minor share of agricultural land use in the area (Figures 7 and 8). Forest formations surround Lábrea city. Pastures are found in the immediate areas south of the city, as well as along the Trans-Amazonian Highway between Lábrea and Humaitá.
Land cover distribution data shows that 75% of the burned area within 50 km of Porto Velho consisted of pastures, followed by forests at 22% (Table 2). Soybean cultivation plots only comprised less than 1% of the land area. Within 50 km of Lábrea, forests made up 43% of the burned area and pastures were a close second, at 37%.
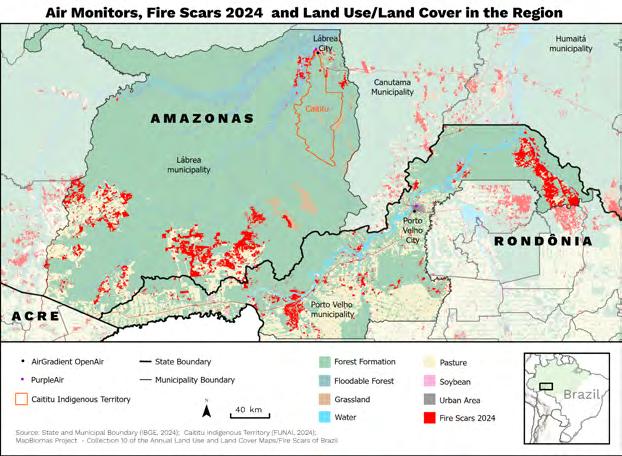
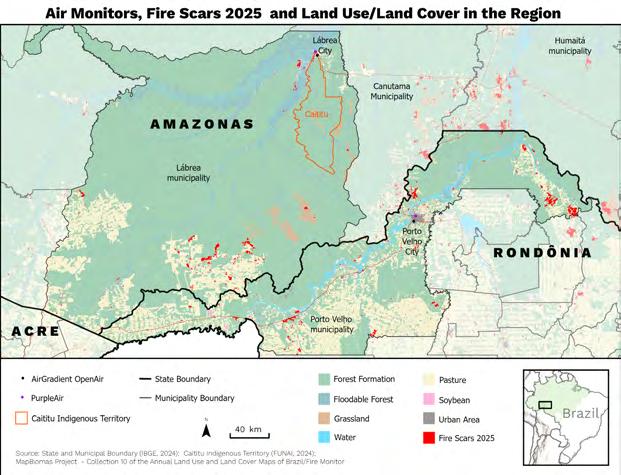
Figure 7–8. The location of air quality monitors and distribution of burned areas and land use types and covers around Porto Velho and Lábrea municipalities in 2024 (top) and Jan-Sep 2025 (down).
Table 2. Burned land cover/land use distribution within a 50 km radius from Porto Velho and Lábrea cities in 2024. Data from MapBiomas.
The regions around the study sites underwent fire events in both 2024 and 2025 indicated by the cumulative burned areas detected by MapBiomas - Collection 4 and Fire Monitor (Figures 9 and 10). The scale of burned area in 2024 is larger than 2025. Burned areas are predominantly observed in pastures, congruent with the agriculture-based fire use pattern observed in Brazil’s Amazon region. Fire use in grassland areas was also detected at a lower scale, measured by area burned, compared to pastures.
Fire on pastures is used for vegetation clearing, regeneration, and expanding the agricultural frontier by burning forest residues after clearance and converting the land for agricultural use. The spatial distribution of burned areas shows fire use both within and at the edge of the pastures. Burned areas in contiguous pasture areas are congruent with burning of pasture vegetation for clearing and regeneration. However, burned areas seemed to dominate at the edge of established pastures which indicates the use of fire to clear forested areas for pasture expansion. These burning events fit the pattern of fire use understood in the Amazon region – first, the degradation of native vegetation in forested areas through cutting and other non-burning methods, followed by the repeat burning of the degraded areas over a multi-year period to remove biomass remnants and regrowth, and eventually, the conversion of the degraded-then-burned areas for alternative uses, predominantly agricultural.

Figure 9. Burned areas (in red) in the region in Brazil around Porto Velho city (2024 - left; Jan-Sep 2025right) The circles show a 300 km radius. Green = forest formation. Yellow = pasture. Grey = grassland.
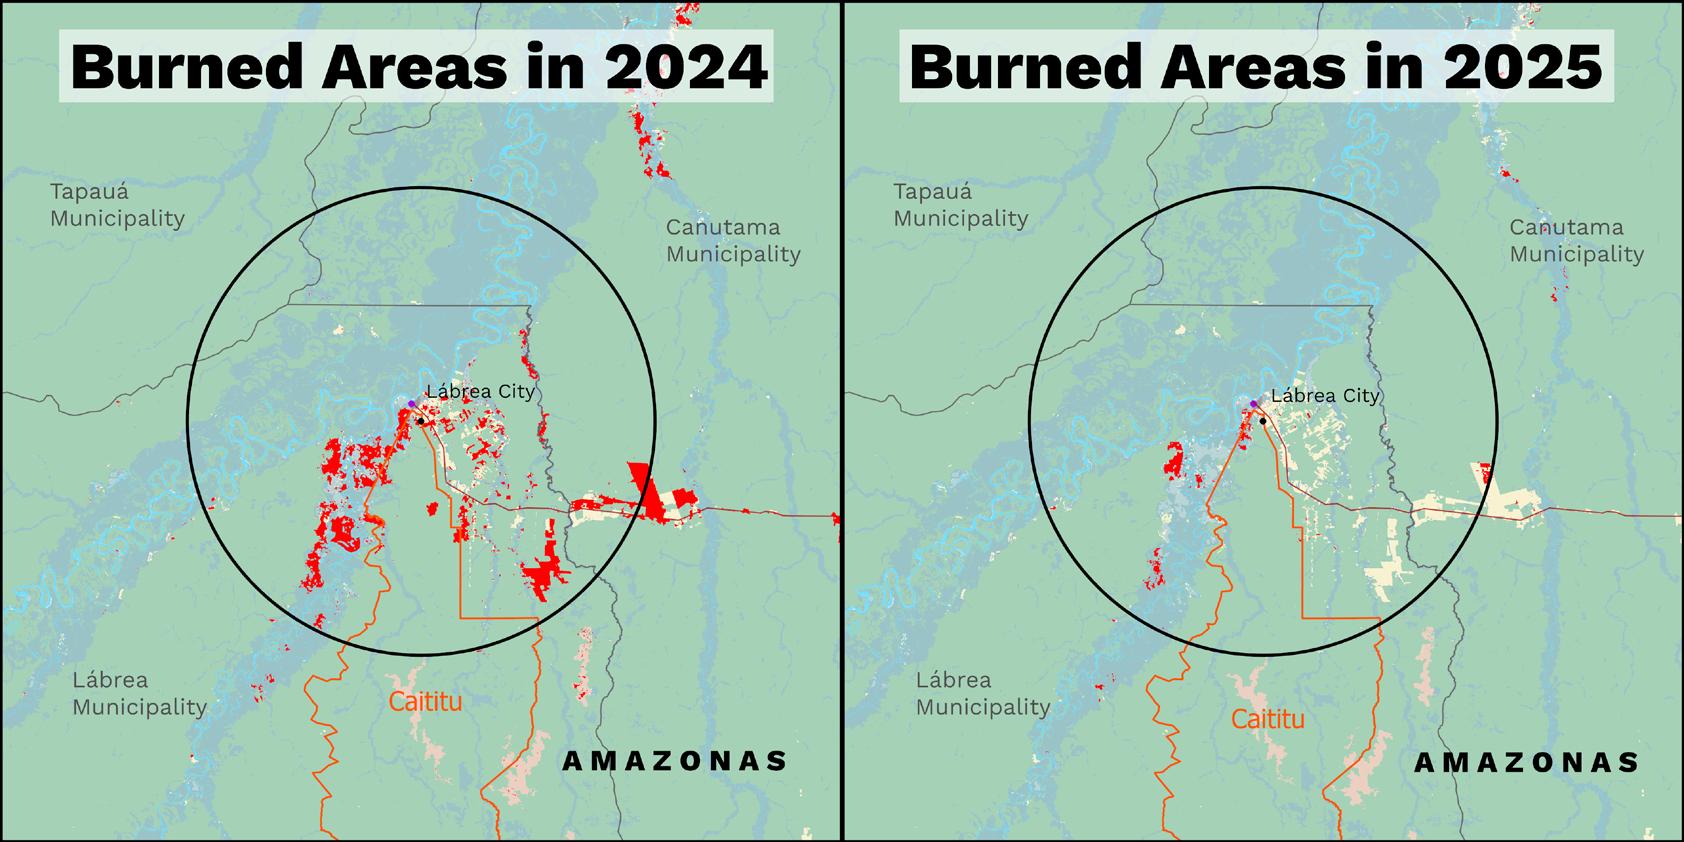
Figure 10. Burned areas (in red) in the region in Brazil around Lábrea city (2024 - left; Jan-Sep 2025right). The circles show a 300 km radius. Green = forest formation. Yellow = pasture. Grey = grassland.
3.2 2024-2025 air pollution (PurpleAir)
Indicative air quality observations from PurpleAir monitors in Porto Velho city and Lábrea city are analyzed over two study periods; January 1 to December 31, 2024, and January 1 to September 30, 2025.
In Porto Velho city, non-continuous data is available from June to December 2024 and February to September 2025. In Labréa city, non-continuous data is available from July to November 2024 and from late June to September 2025. Results for these monitoring periods are presented in Tables 3 and 4. The period averages are calculated
for the sampling period of each dataset; the sampling periods differ for each location and year, and the period averages are therefore not directly comparable. A sampling day is defined as a 24-hour period where there was at least 1 hour of data recorded by the sensor. Strong sampling days denote that at least 75% of hours of the day (18 hours or more) have recorded data.
Daily averages were calculated on strong sampling days where at least 75%4 of the 24 hourly measurements were recorded. The distribution
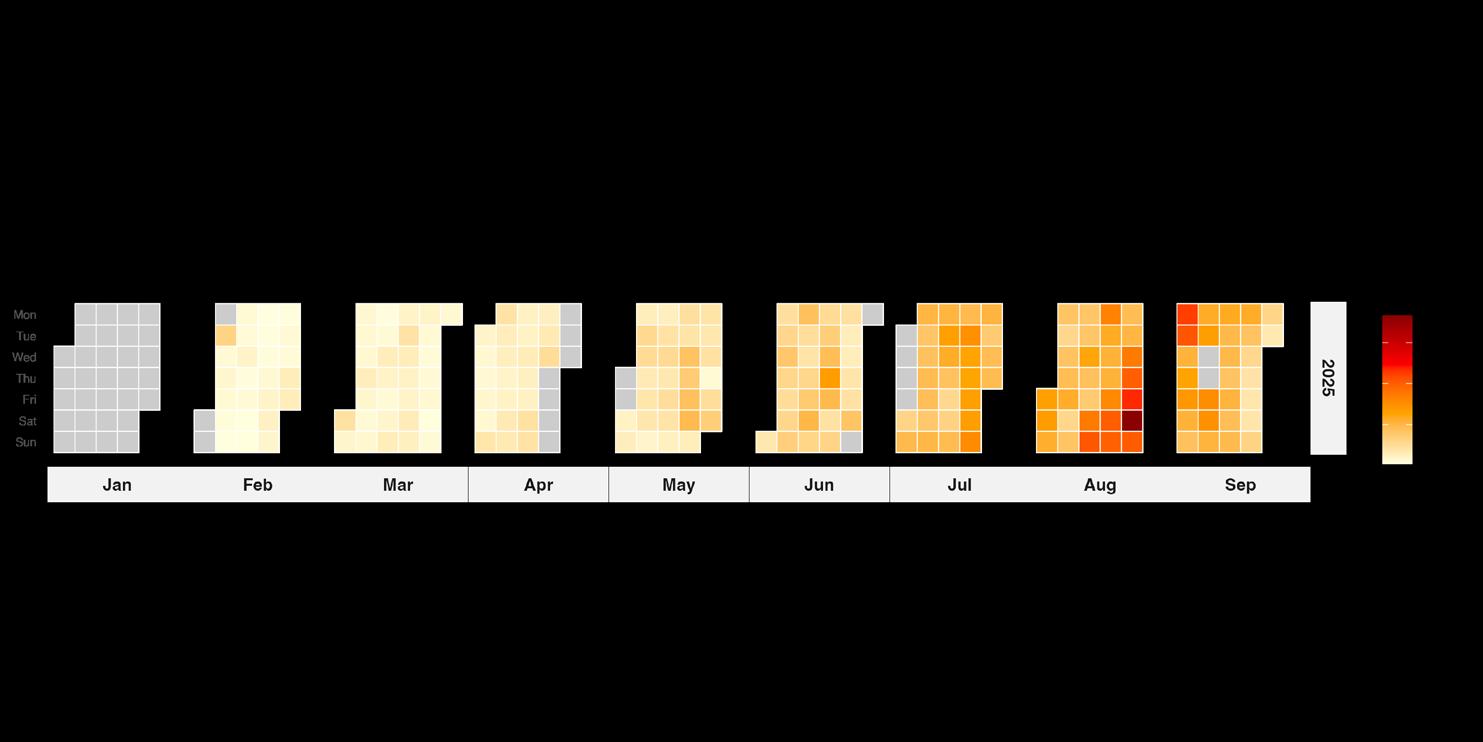
of daily averages across 2024 and 2025 is displayed in Figures 11 and 12 below.
The 2024 and 2025 data shows that the highest levels of PM2.5 are observed in July, August, and September. The timing of peak concentrations is consistent with the Amazon fire season and with reports of poor air quality around Porto Velho city during those months. The 2024 data also shows a gradual decrease in daily average PM2.5 levels in October and November as the fire season in the Amazon region came to an end.
4 In alignment with US EPA’s recommendations that a daily sample of air pollution data should be at the minimum 75% complete from sub-daily measurements, e.g., hourly measurements, to be considered valid (95). The US EPA practice applies to PM2.5 analyses (96).
Table 3. Period averages and sampling day count for Porto Velho city.
Table 4. Period averages and sampling day count for Lábrea city.
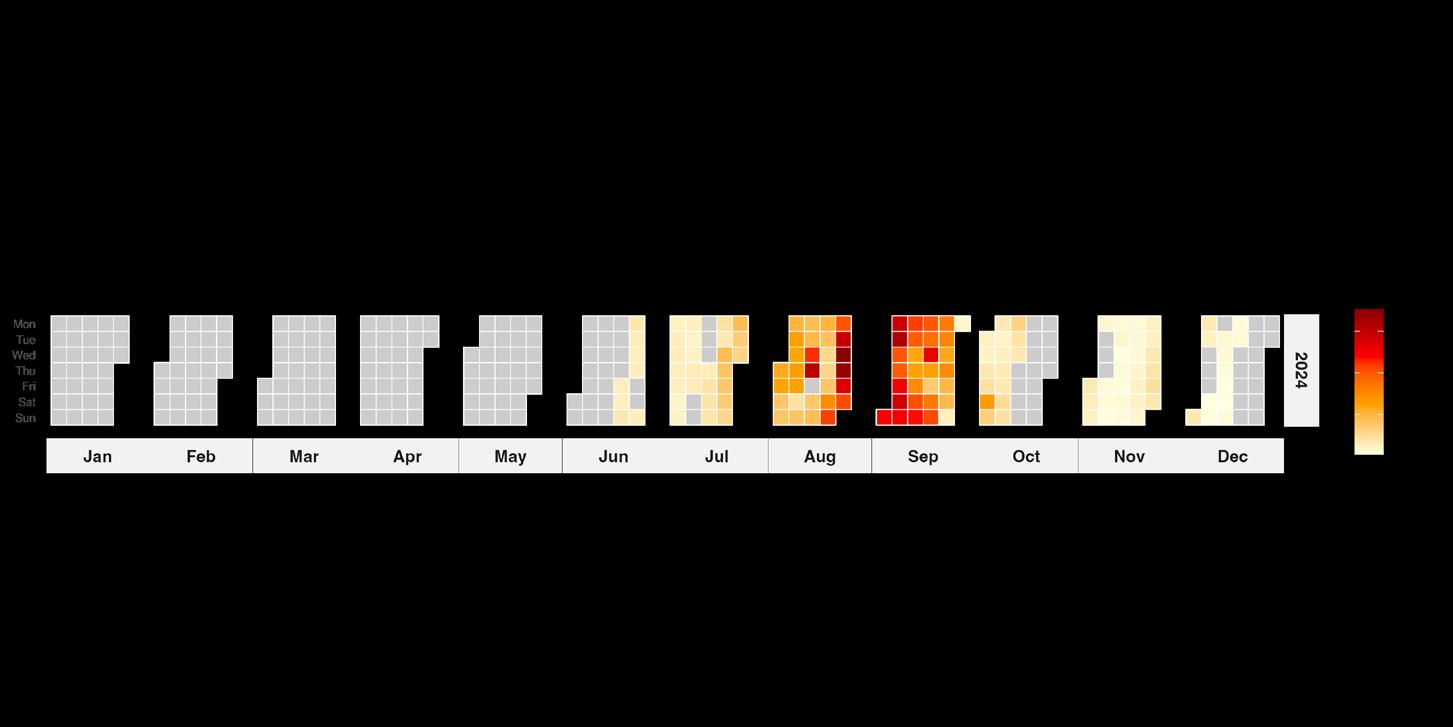
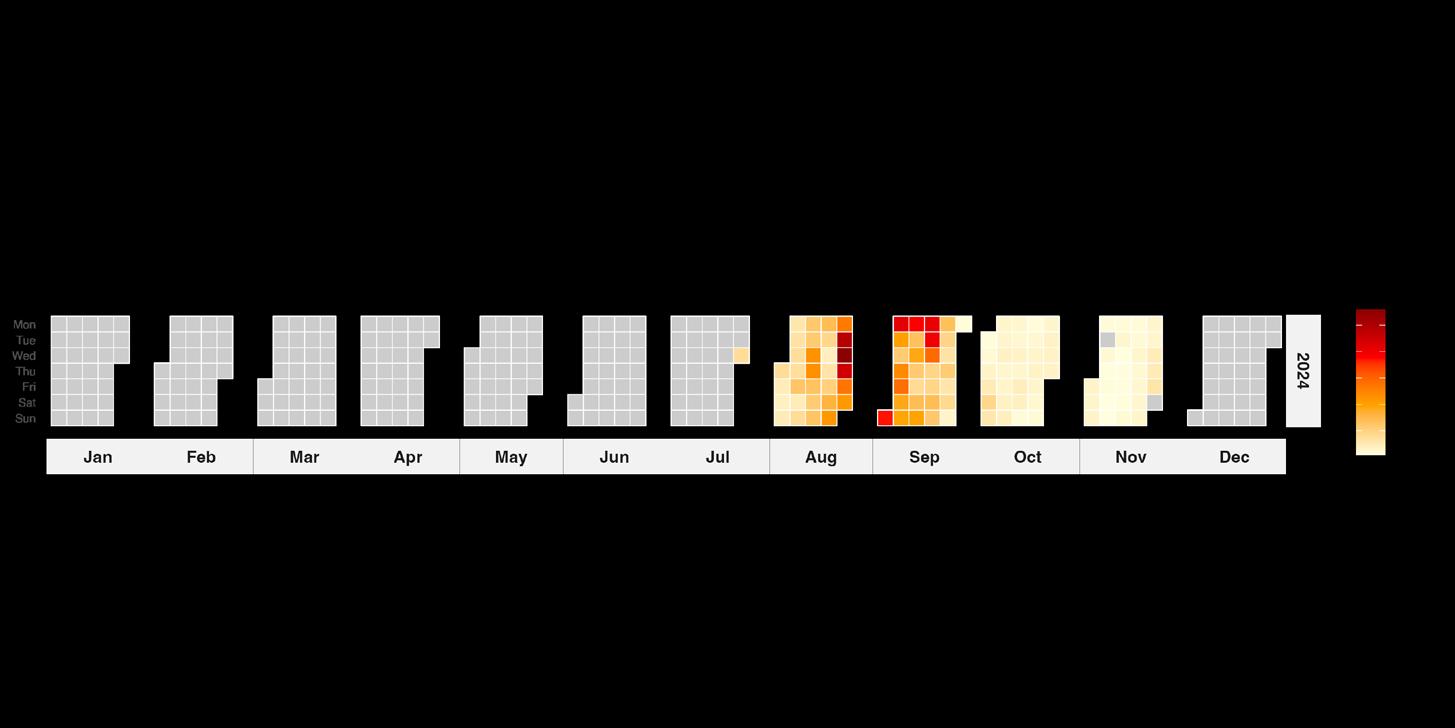
Calculated from PurpleAir data. Each tile is one day. Grey tile means no or insufficient data.
Each tile =a day; gray = no data

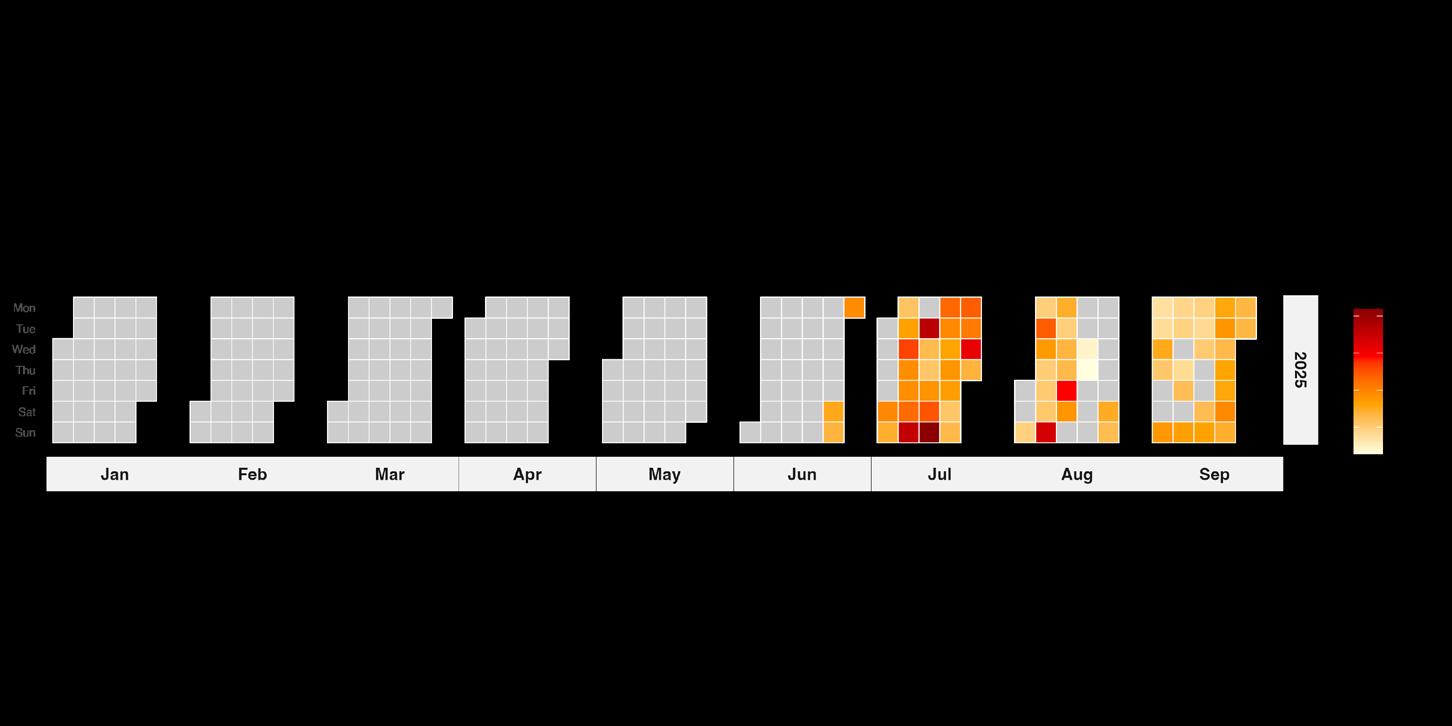
Each tile =a day; gray = no data
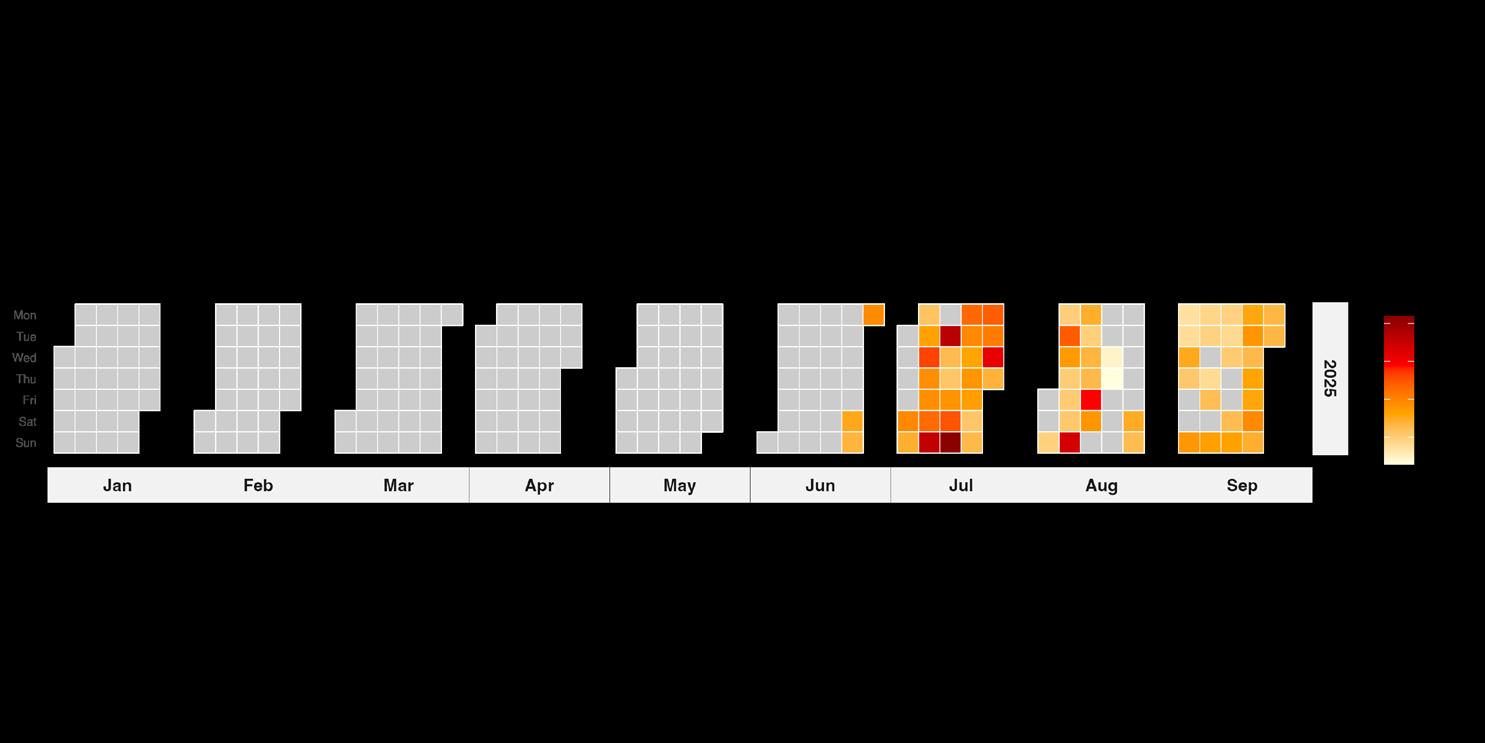
Figure 12. Daily average PM2.5 levels in Porto Velho city (top) and Lábrea city (bottom) in 2025. Calculated from PurpleAir data. Each tile is one day. Grey tile means no or insufficient data.
Porto Velho (2025)
Lábrea (2025)
Monthly average PM2.5 levels across the year in 2024 and 2025, displayed in Table 5, demonstrate the correlation between air quality deterioration and the Amazon fire season. Over the sampled months, August and September 2024 in Porto Velho city witnessed PM2.5 levels that were substantially higher than the preceding and subsequent months, and PurpleAir measured monthly averages during these months rose above 140 µg/m³. In 2025, the months with the highest PM2.5 concentrations were between June and September where average levels reached 27 µg/ m³ in Porto Velho city and 61 µg/m³ in Lábrea city, according to PurpleAir sensors.
Table 5. Monthly average PM2.5 recorded in Porto Velho city and Lábrea city in 2024 and 2025 by PurpleAir sensors. *=Fire season.
Figure 13 charts the monthly averages and the variation in daily average concentrations observed by PurpleAir sensors. The highest daily average PM2.5 levels was observed during the fire-plagued months of July, August, and September. The days with the worst ambient PM2.5 concentrations were experienced during these months, where the levels far exceeded the monthly averages.
Figure 13. Monthly average and minimum-maximum range of PM2.5 level in Porto Velho city and Lábrea city, 2024-2025 by PurpleAir sensors.
Consistent with the peaks in monthly averages, the 10 highest daily average PM2.5 concentrations observed by PurpleAir sensors in Porto Velho city and Lábrea city in 2024 and 2025 were recorded in July, August, and September5. These days, which are shown in Tables 6 and 7, saw measured ambient concentrations well above 200 µg/m³ in 2024, a year marked by unprecedentedly severe Amazon fires, and at least 35 µg/m³ in 2025, where fires across the Amazon region still occurred.
PurpleAir sensor data indicated that the worst daily PM2.5 pollution event during the sampling period in 2024 occurred on August 28 in Porto Velho city at 352 µg/m³ and August 276 in Lábrea city at 488 µg/m³. These levels were 6 and 8 times higher than the Brazilian PI-1 standard (24-hrs averaging time), and 23 and 33 times higher than the WHO guideline (24-hrs averaging time), respectively. These extreme levels of PM2.5 are the likely results of the 2024 fire season in the Amazon which was among the worst recorded.
In 2025, PurpleAir sensor data indicated that the worst daily PM2.5 levels during the sampling period were observed on August 30 in Porto Velho city at 73 µg/m³ and July 20 in Lábrea city at 104 µg/m³. These levels exceeded the Brazilian PI-2 standard (24-hrs averaging time) by 1.5 and 2.1, and the WHO guideline (24-hrs averaging time) 4.9 and 6.9 times, respectively.
5 Only strong sampling days were considered.
Table 6. The 10 highest daily PM2.5 averages in Porto Velho city (Jun–Dec) and Lábrea city (Jul–Nov) in 2024, and their extent of exceedance over PI-1 (60 µg/m³) and WHO (15 µg/m³) 24-hr averaging time standards as indicated by PurpleAir sensors.
6 On August 27, 2024, severe forest fires triggered the state government Rondônia to declare an emergency situation (97). On that day, Lábrea experienced the highest estimated daily average PM2.5 level of the sampling period – 488 µg/m³, more than 32 times higher than the WHO guideline. The two
days following the state-declared emergency situation recorded some of the highest daily average estimates during the study period; 352 and 388 µg/ m³ in Porto Velho city on August 28 and 29, and 450 µg/m³ in Lábrea city on August 29.
Table 7. The 10 highest daily PM2.5 averages in Porto Velho city (Feb–Sep) and Lábrea city (Jun–Sep) in 2025 and their extent of exceedance over PI-2 (50 µg/m³) and WHO (15 µg/ m³) 24-hr averaging time standards as indicated by PurpleAir sensors.
10 daily
The cumulative number of days during the sampled period where PurpleAir sensors indicated that air quality standards may have been exceeded are tallied in Table 8 below, using strong sampling days only.
In 2024, PurpleAir data indicates that of the days with sufficient data, a total of 65 and 56 days in Porto Velho city and Lábrea city respectively experienced daily average PM2.5 levels in excess of 60 µg/m³, which was the Brazilian PI-1 air quality standard applicable during that year. If compared with the WHO’s health based guideline, the numbers of days in exceedance are 128 and 110 for Porto Velho city and Lábrea city, respectively, on which the daily average PM2.5 levels rose above 15 µg/m³. That is 85% and 91% of days with sufficient monitoring data in Porto Velho city and Lábrea city respectively.
In 2025, PurpleAir sensors in Porto Velho city and Lábrea city indicate that 1 and 35 days respectively breached the Brazilian PI-2 standard, which took into effect on January 1 of that year. The data suggests that the WHO guideline was exceeded on 84 and 71 days in Porto Velho city and Lábrea city, respectively. That is 38% and 100% of days with sufficient monitoring data in Porto Velho city and Lábrea city respectively. This corresponds to communities experiencing poor air quality more than 2 months of the year (Table 8). Each of these days represent an elevated public health risk where communities were exposed to unhealthy air.
Table 8. Number of daily average exceedance over Brazil’s and WHO guidelines indicated by PurpleAir sensor data.
air quality standard
PI-1 (24-hr averaging
BARABADÁ KARITIANA
Testimonial from Hilda Barabadá Karitiana, community member of the Beijarana village in the Karitiana Indigenous Territory, 60 km from Porto Velho, in October 2024
“I used to live in the city, in Porto Velho, and then I came to live with my people here in the village. One of the reasons was the difficulties (of city life): the climate there is much hotter, and there is a lot of dust and smoke, which makes it difficult to breathe. Due to deforestation, it is getting hotter and hotter in Porto Velho, because there are no more forests or plants there; everything is disappearing. I came here because of that. Here, I can breathe better and I am close to the forest that I love.
But in the summer, during the dry season, there’s a lot of smoke here. When the wind blows, the smoke comes from far away and affects the village too, even if the fire isn’t nearby. We can feel it in the air. We start to get sore throats and noses, and we cough a lot.”
HILDA
3.3 August 2025 case study (Atmotubes)
Three Atmotube devices were used during fieldwork between August 23 and 30, 2025. Each Atmotube device was carried by a different member of the field team as they visited urban and rural locations including areas with active or recent burning. Some fieldwork included travel by aircraft in areas with fire smoke. The Atmotube sensors recorded air quality data over eight days. Fieldwork with the atmotube sensors is intended to illustrate the range of air quality conditions that can be encountered in the study region. The data do not attempt to be representative of typical exposure in any of the locations visited.
The devices were carried across Porto Velho city in Porto Velho municipality, Lábrea city and the Caititu Indigenous Territory in Lábrea municipality, and Canutama municipality (Figure 14).
Figure 14 also shows the location of fires detected by the Visible Infrared Imaging Radiometer Suite satellite based sensors and retrieved from the NASA Fire information for resource management system (98).
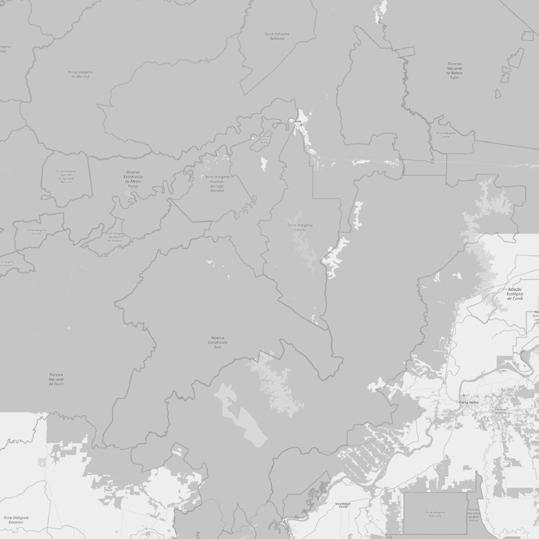
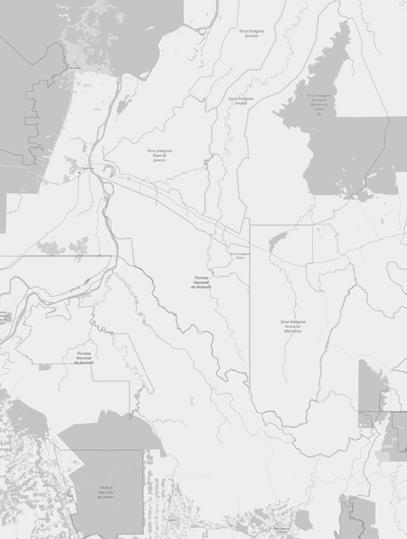
Figure 14. 5-minute average PM2.5 Atmotube observations (µg/m³) from ground (car symbol) or overflight (aircraft symbol) and the location of satellite-detected fires from August 23–30 (blue).
Over the study period, the average particulate matter concentration measured across the three devices was 14.3 µg/m³ for PM2.5. Average concentrations across individual ground level field trips ranged from 12.7 to 257.1 µg/m³. The sensors were taken on 3 overflights where outside air could enter the aircraft cabin. Average cabin concentrations were between 7 and 24 µg/m³. Maximum 1-minute and 15-minute PM2.5 concentrations reached 848 and 155 µg/m³ respectively. The high PM levels in the areas sampled by Atmotube indicate poor air quality in the study area.
It is important to note that during the field trips, Greenpeace Brazil moved through different environments while carrying the Atmotubes recording varying PM2.5 concentrations. The duration of the maximum values recorded varied considerably depending on the locations visited. In areas with very high concentrations, the team usually remained for only a short time, and even in these cases, brief but intense peaks could occur when smoke entered the device directly. Maximum values in the 15 minute average data reflect situations in which it was possible to stay longer in the same place, without necessarily corresponding to extreme pollution levels.
At certain times, the Atmotubes were deliberately brought closer to active fire spots to obtain specific measurements, which resulted in very high maximum values lasting only one minute. An individual may only be exposed to such extreme conditions when approaching the fire, for example while firefighting.
Table 9. PM2.5 statistics determined from Atmotube observations (µg/m³).
25/08/2025
Ground route:
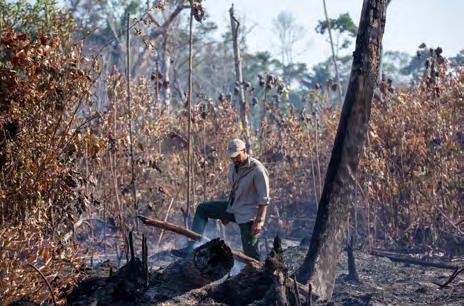
Photo: Fire burning during a field trip in Amazonas state in August 2025. Credits: Marizilda Cruppe
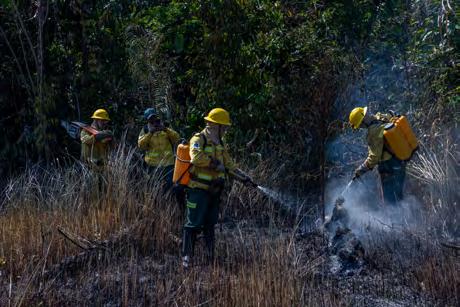
27/08/2025
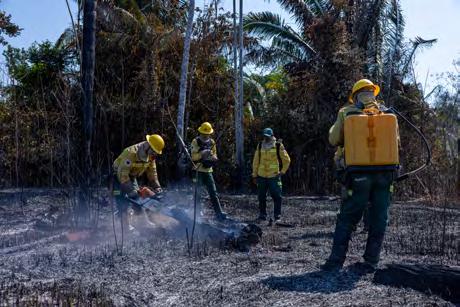
Ground route:
Photos: Fire brigade extinguishes fire before it becomes a big one. Credits: Marizilda Cruppe.
29/08/2025
Ground route:
Photos: Influencer Alane in the same place of burning from August 25, 2025. Credits: Marizilda Cruppe
Photo: Influencer Leo Moran in the area. Credits: Marizilda Cruppe.
Testimonial from Antônio Roberto, fire brigade chief in the Caititu Indigenous Territory in Lábrea, August 2025
“We’ve been in this fight since 2022, with a very difficult fight. We work to reforest, to fight fires, and do environmental education in the villages and Indigenous schools. We also make seedling donations to reforest areas affected by the fires.
We always make rounds in the communities, talk with the inhabitants of the land, and we have a lot of people from the Apurinã ethnic group inside the fire brigade, as well as from other ethnic groups; we have a couple of Paumari brigadiers too. Our indigenous identity influences us to have this courage, this determination, to protect our land.
Formerly, here inside the Caititu area, it was forest - and today there is a devastation of fires. For me, it’s been very rewarding to be protecting the area along with my colleagues. Last year, the fires were critical. This year, thank God, it was less.
The forest is our air, our forest is everything to us, because without her, the people, the community does not live. From the forests comes our fruit, our food too, that’s where we came from and where we want to stay. For me, it’s very important to protect our land, we have to fight for her, because if it’s not us, it won’t be anyone else.”
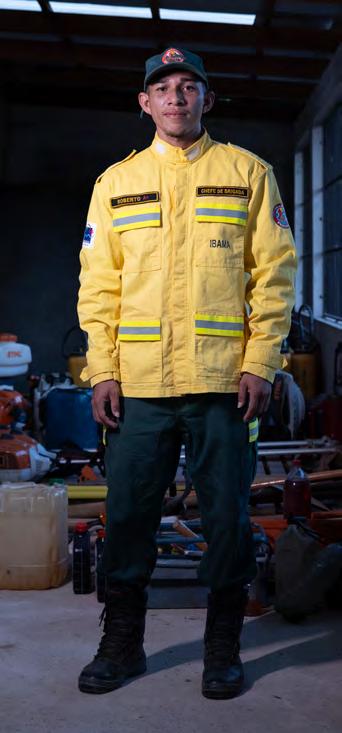
ANTÔNIO ROBERTO
3.4 September
2025 case study
(AirGradient OpenAir)
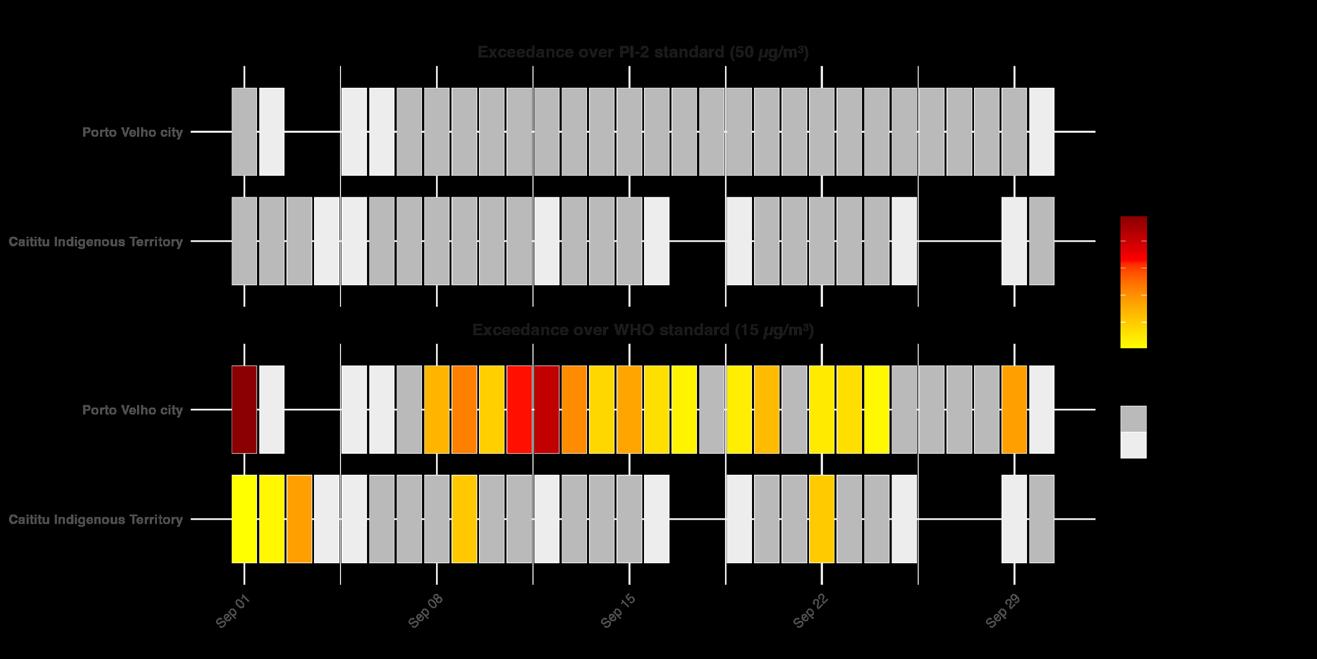
Hourly PM2.5 data from two AirGradient OpenAir sensors tracking air pollution levels in Porto Velho city and in the Caititu Indigenous Territory between September 1 – 30, 2025 were downloaded and analyzed. The daily averages were calculated for days where at least 75% of the hours had measurements (95,96). The daily averages are visualized in the Figure 15 below, which also shows whether the daily average levels exceeded Brazil’s PI-2 standard and the WHO guideline.
Despite a smaller cumulative burned area in the region around Porto Velho and Lábrea municipalities being recorded in 2025 compared to the year before, the AirGradient measurements indicate that PM2.5 levels still exceeded air quality standards. Results of the newly installed AirGradient sensors suggest that daily average PM2.5 levels in Porto Velho city and in the Caititu Indigenous Territory in September 2025 did not exceed Brazil’s PI-2 standard, which stipulates that average ambient concentration of PM2.5 should not exceed 50 µg/m³ over a 24-hr period. However, the observations do indicate that the WHO’s health based guideline level of 15 µg/m³ over a 24-hr period was breached in both locations.
The monthly average PM2.5 concentrations in Porto Velho city and the Caititu Indigenous Territory were 20 and 11 µg/m³, respectively (Table 10). In Porto Velho city, AirGradient PM2.5 results exceeding the WHO 24-hour guideline were recorded on 17 out of 30 days in September. In the Caititu Indigenous Territory, this number was 5 days. This indicates a risk to public health. There was no recorded exceedance over Brazil’s PI-2 standard.
Table 10. Monthly averages and exceedances over standards (24hr averaging time) in AirGradient data from Porto Velho city and the Caititu Indigenous Territory in September 2025.
Exceedance days over PI-2 (24-
Exceedance days over WHO
Did not exceed standarts
Insu cient data
Figure 15. AirGradient observations of daily average PM2.5 levels in Porto Velho city (top) and the Caititu Indigenous Territory (bottom) in September 2025, compared to PI-2 (50 µg/m³) and WHO guidelines (15 µg/m³). Each tile is one day. Light grey tile means insufficient data.
The 10 days when the AirGradient sensors observed highest daily average PM2.5 levels are ranked in Table 11. The worst air quality was recorded on September 1 and 12 in Porto Velho city, where PM2.5 levels reached 40 µg/m³ and 36 µg/m³, respectively, exceeding the WHO 24-hour guideline by 2.7x (Sep 1) and 2.4x (Sep 12). Noticeably, the daily average of 40 µg/m³
on September 1 matches the estimate derived from the PurpleAir dataset, which indicates a daily average of 45 µg/m³ on the same day (Table 7). Comparatively, the Caititu Indigenous Territory experienced better air quality. However, 3 days in September had daily PM2.5 levels at or above 20 µg/m³, on September 3, 9, and 22 – 1.3-1.6x higher than the WHO 24-hour guideline.
Table 11. The 10 highest daily PM2.5 averages in Porto Velho city and the Caititu Indigenous Territory in September 2025 and their extent of exceedance over PI-2 (50 µg/m³) and WHO (15 µg/m³) 24-hr averaging time standards. Calculated using AirGradient OpenAir sensor data.
Top 10 daily averages
Porto Velho city
Caititu Indigenous Territory
The two highest hourly AirGradient observations in Porto Velho city had an ambient PM2.5 concentration of 99 µg/m³ and 93 µg/m³ (Table 12). In the Caititu Indigenous Territory, a PM2.5 level of 250 µg/m³ was recorded in a single hour on September 3, 2025.
Table 12. The 10 highest hourly readings of PM2.5 in Porto Velho city and the Caititu Indigenous Territory in September 2025. Calculated using AirGradient OpenAir sensor data.
2nd
6th
3.5 Long-term PM2.5 trends and regional comparisons using satellite observations
Satellite-derived data across Brazil reveal large differences in PM2.5 concentrations and trends between areas affected by Amazon fire smoke and elsewhere. Using a single global satellite derived data product produced by the Atmospheric Composition Analysis Group (ACAG) at Washington University in St Louis (99) it is possible to make direct comparisons between air quality in different locations.
Comparison among Brazilian Cities
Major Brazilian cities outside the Amazon region – Brasília, Rio de Janeiro, and São Paulo – and Belém in the eastern region of the Amazon have lower PM2.5 levels than the cities of Porto Velho and Lábrea, according to air quality estimates using satellite-derived data (Figure 16). The annual average PM2.5 concentrations in an area 0.25° degrees around the centres of Brasília, Rio de Janeiro, São Paulo and Belém (Figure 16), have remained similar over recent decades.
In contrast, satellite-derived data for locations in the Amazon region that feature in this report, Porto Velho and Lábrea, together with Manaus, suggest higher surface-level PM2.5 . concentrations, and worsening trends over the same time period (Figure 16).
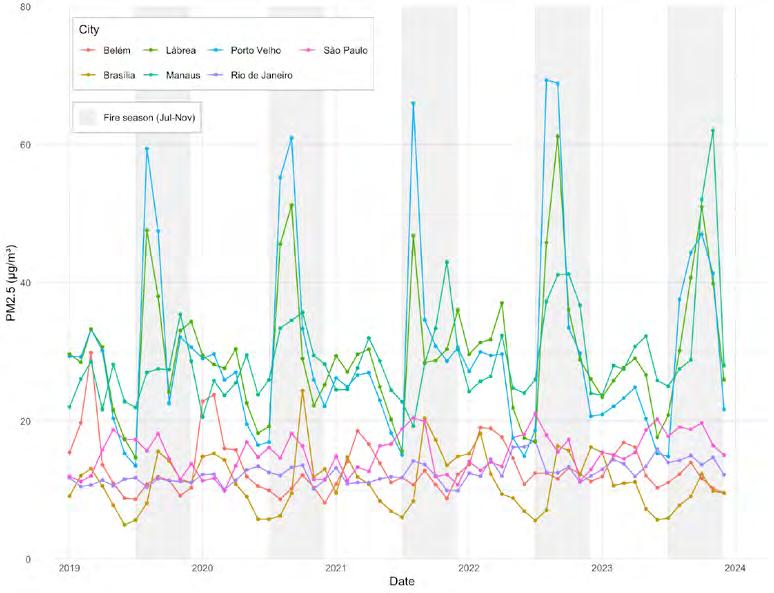
Monthly average fine particulate matter concentration estimates in these cities are presented in Figure 17, which demonstrates the seasonal variation in PM2.5 between 2019 and 2022. The two study sites in the Amazon – Porto Velho and Lábrea – show seasonal peaks in fine particulate matter during the fire season when agricultural burning intensifies. Outside the fire season, the monthly average estimated PM2.5 concentrations were also often higher than other Brazilian cities, albeit to a lesser extent. The monthly averages demonstrate that PM2.5 levels during the fire season push the annual average PM2.5 concentrations across the Amazon higher, even above cities that have considerable industry activity such as Rio de Janeiro and São Paulo.
A proportion of the PM2.5 in the Amazon region is from natural sources in the forest, however analysis of monthly data reveals that a large contribution to the annual PM2.5 burden is made during the fire season. In Porto Velho, Lábrea, and to a lesser extent, Manaus, recurrent spikes in monthly average PM2.5 coincides with the period between July and November when agricultural burning intensifies (Figure 17). These elevated fire season PM2.5 concentrations in the Amazon region are not seen in other Brazilian cities (Figure 17). PM2.5 ( µ g/m
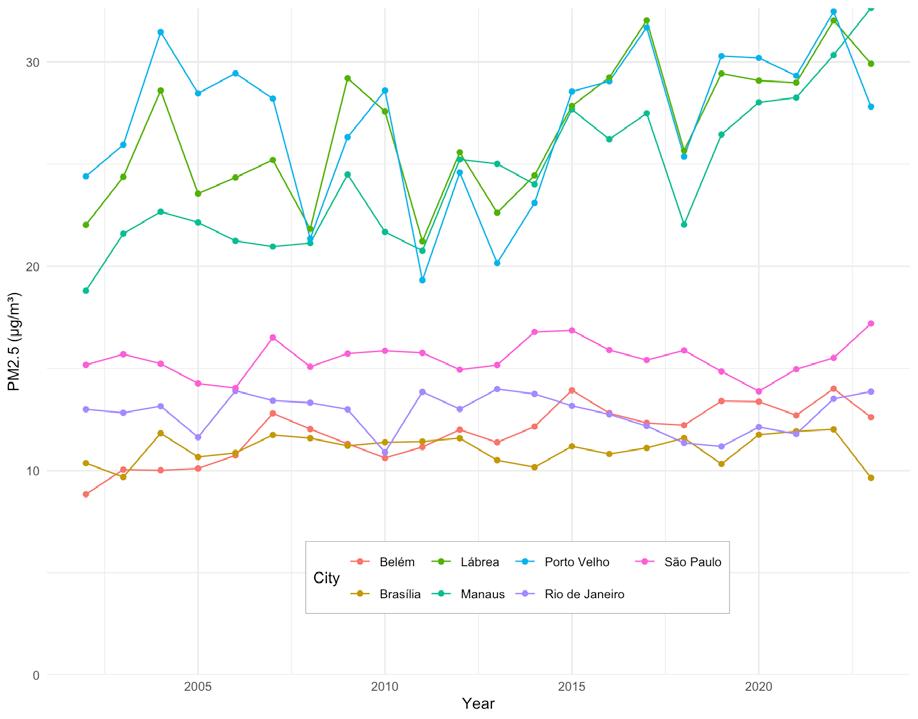
Figure 16. Average annual mean satellite derived PM2.5 concentrations from 2002-2023 within 0.25° (approximately 27 km) of named locations in Brazil (99).
Comparison among Brazilian States
Researchers from the University of Chicago’s Air Quality Life Index (AQLI) project also use satellite derived data from Washington University in St Louis (99) to assess air quality health impacts globally. They exclude natural dust and sea-salt from the PM2.5 data. Their analysis of this data (92) suggests that over the last five years, the state of Rondônia consistently had the highest PM2.5 annual averages in Brazil, with a five-year mean of 35.5 µg/m³ (Table 13 and Figure 18). This is more than seven times higher than the WHO annual guideline of 5 µg/m³. Acre and Amazonas states both had averages above 30 µg/m³, reflecting the severe air quality challenges across the Amazon region.
In comparison, the dataset indicates that more industrialized and urbanized states such as São Paulo and Rio de Janeiro had significantly lower annual averages (between 10–15 µg/m³ between 2019 and 2023), despite heavy traffic and industrial activity. This stark contrast indicates that biomass burning, deforestation, and fires in the Amazon region contribute to much higher particulate pollution than some of the biggest urban-industrial centres of Brazil. The findings underscore that air pollution in the Amazon is not just a local issue, but an interrelated national health and environmental crisis.
Figure 17. Average monthly mean satellite derived PM2.5 concentrations from 2019-2023 within 0.25° of named locations in the Amazon (99).
Rondônia
Acre
Amazonas
Mato Grosso
Mato Grosso do Sul
São Paulo
Rio de Janeiro
WHO guideline (5µg/m³)
Table 13. São Paulo and Rio de Janeiro states compared to the top 5 Brazilian States by PM2.5 annual averages (2019–2023), ranked by 5-year average.*
Figure 18. Annual average PM2.5 concentration in São Paulo, Rio de Janeiro, and Brazil’s top five states with highest PM2.5 between 2019 and 2023, compared to WHO guideline. Air pollution data excludes natural dust and sea-salt and is from AQLI/EPIC at the University of Chicago (92), based on data from the Atmospheric Composition Analysis Group (ACAG) at Washington University in St Louis (99).
Mato Grosso
*Air pollution data excludes natural dust and sea-salt and is from AQLI/EPIC at the University of Chicago (92) based on data from the Atmospheric Composition Analysis Group (ACAG) at Washington University in St Louis (99).
3.6 Global comparisons of
satellite-derived annual average PM2.5 levels
There is a striking contrast in annual average PM2.5 concentrations from 2019–2023 between Porto Velho municipality and some of the world’s major metropolitan centres. Despite being a relatively small city of under 500,000 residents, the data indicate that Porto Velho municipality had the highest annual average fine particulate matter concentrations, surpassing megacities like Beijing, São Paulo, and Santiago (Table 14). While fine particulate matter levels in many of these global cities reflect industrial activity, traffic, and urban density, Porto Velho municipality’s elevated levels are heavily influenced by biomass burning and deforestation fires in the Amazon.
Figure 19 demonstrates that while annual mean PM2.5 estimates in global megacities such as Beijing and Santiago are in the range of 20–33 µg/m³, Porto Velho municipality is above them, with annual averages exceeding 35–42 µg/m³ in recent years.
Table 14. Annual average PM2.5 levels in Porto Velho municipality and major
global cities between 2019 and 2023, with population count for 2023 (92).*
*Air pollution data excludes natural dust and sea-salt and is from AQLI/EPIC at the University of Chicago (92) based on data from the Atmospheric Composition Analysis Group (ACAG) at Washington University in St Louis (99). Data represent the smallest administrative area provided by AQLI for each city or region and these typically correspond to GADM Level 2 administrative areas as described at https://gadm.org/
**Population-weighted average calculated using separate PM2.5 data for each of the five boroughs
Figure 19. Annual average PM2.5 levels in Porto Velho and major regional and global cities between 2019 and 2023, compared to WHO guideline. Air pollution data excludes natural dust and sea-salt and is from AQLI/EPIC at the University of Chicago (92) based on data from the Atmospheric Composition Analysis Group (ACAG) at Washington University in St Louis (99).
Porto Velho
Beijing
Santiago
Bogotá D.C.
São Paulo
Buenos Aires (CABA)
Berlin
Greater London
New York City
WHO guideline (5µg/m³)
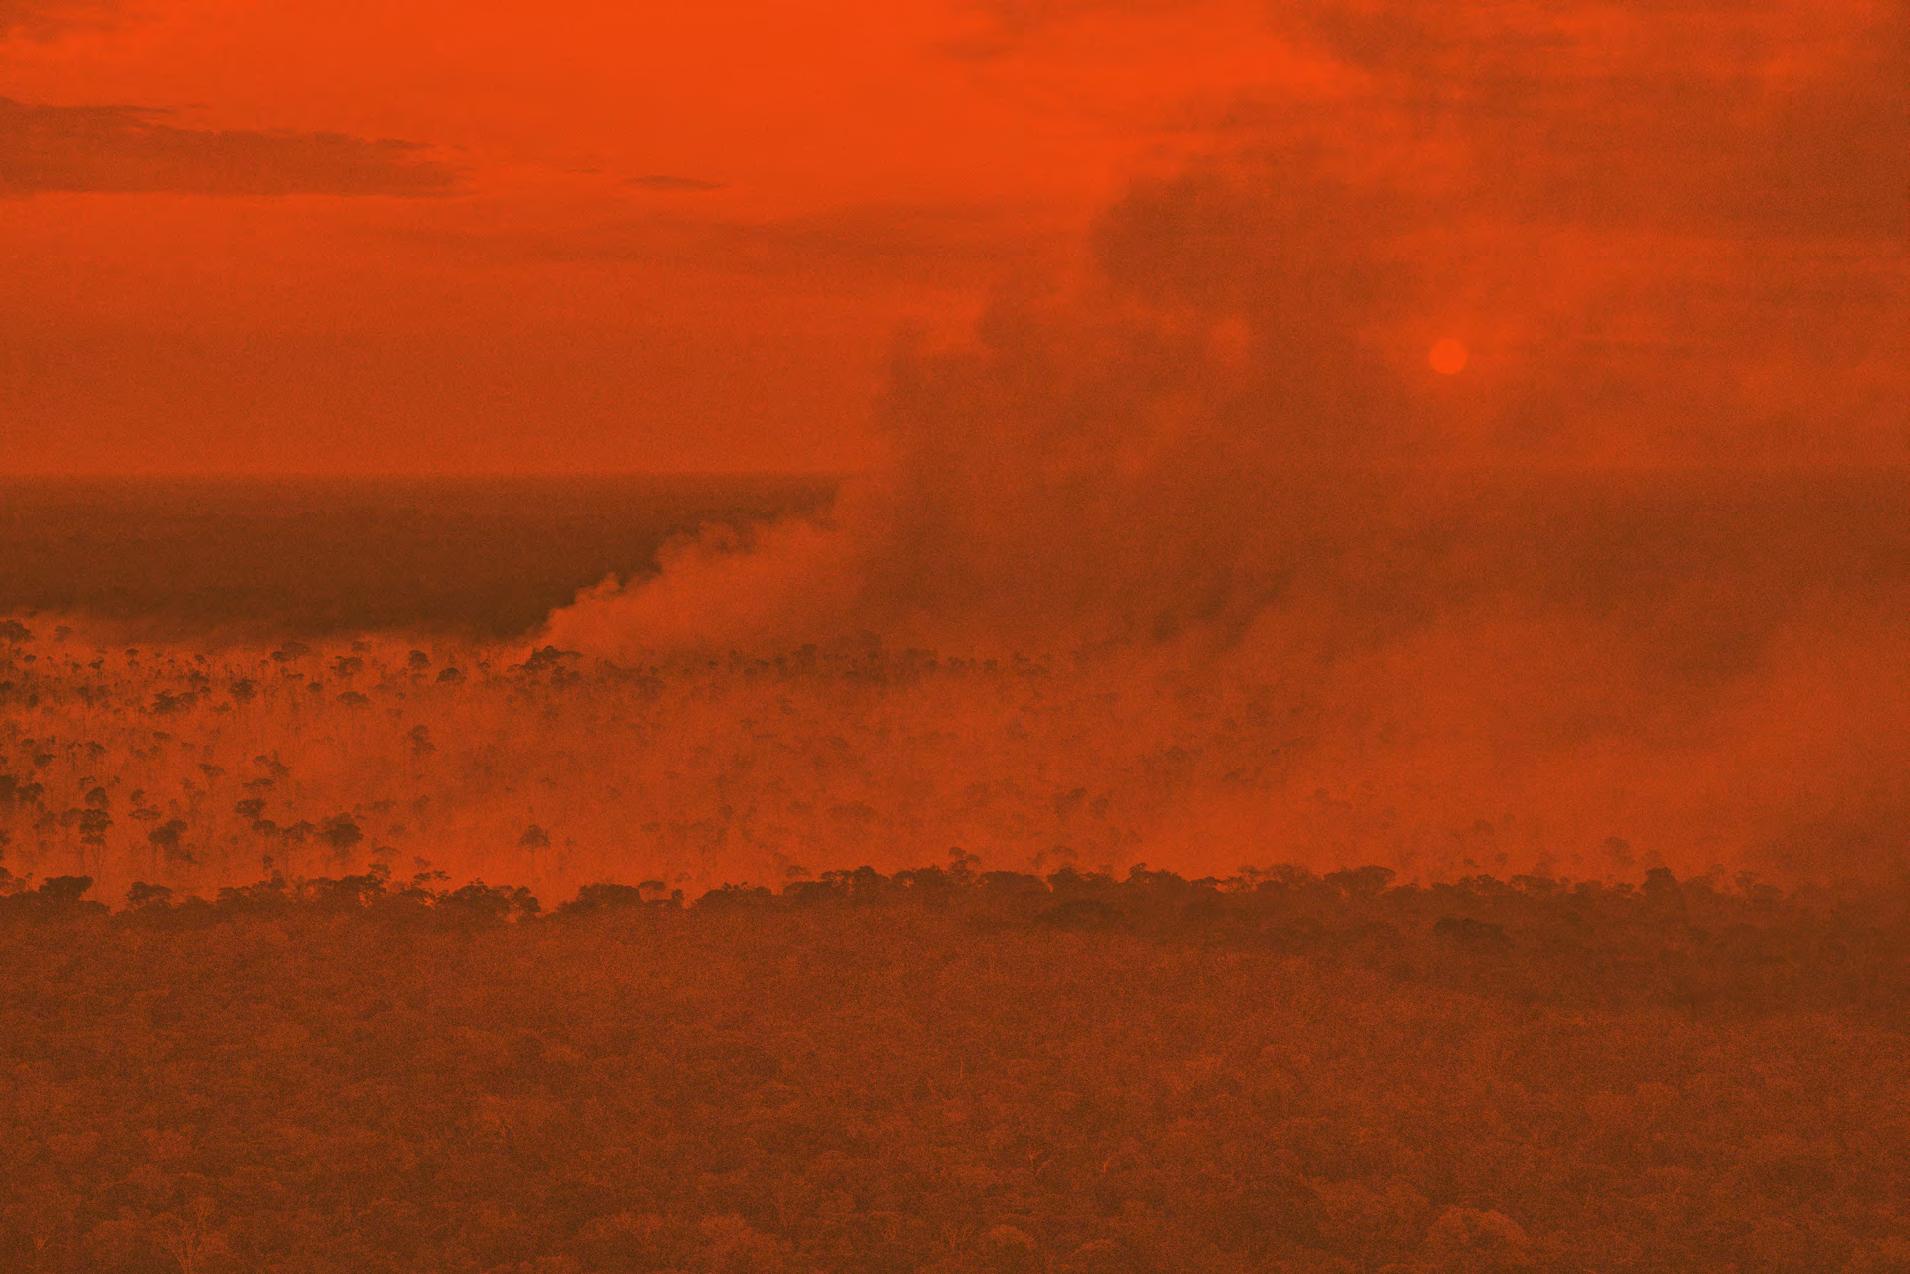
4KEY FINDINGS
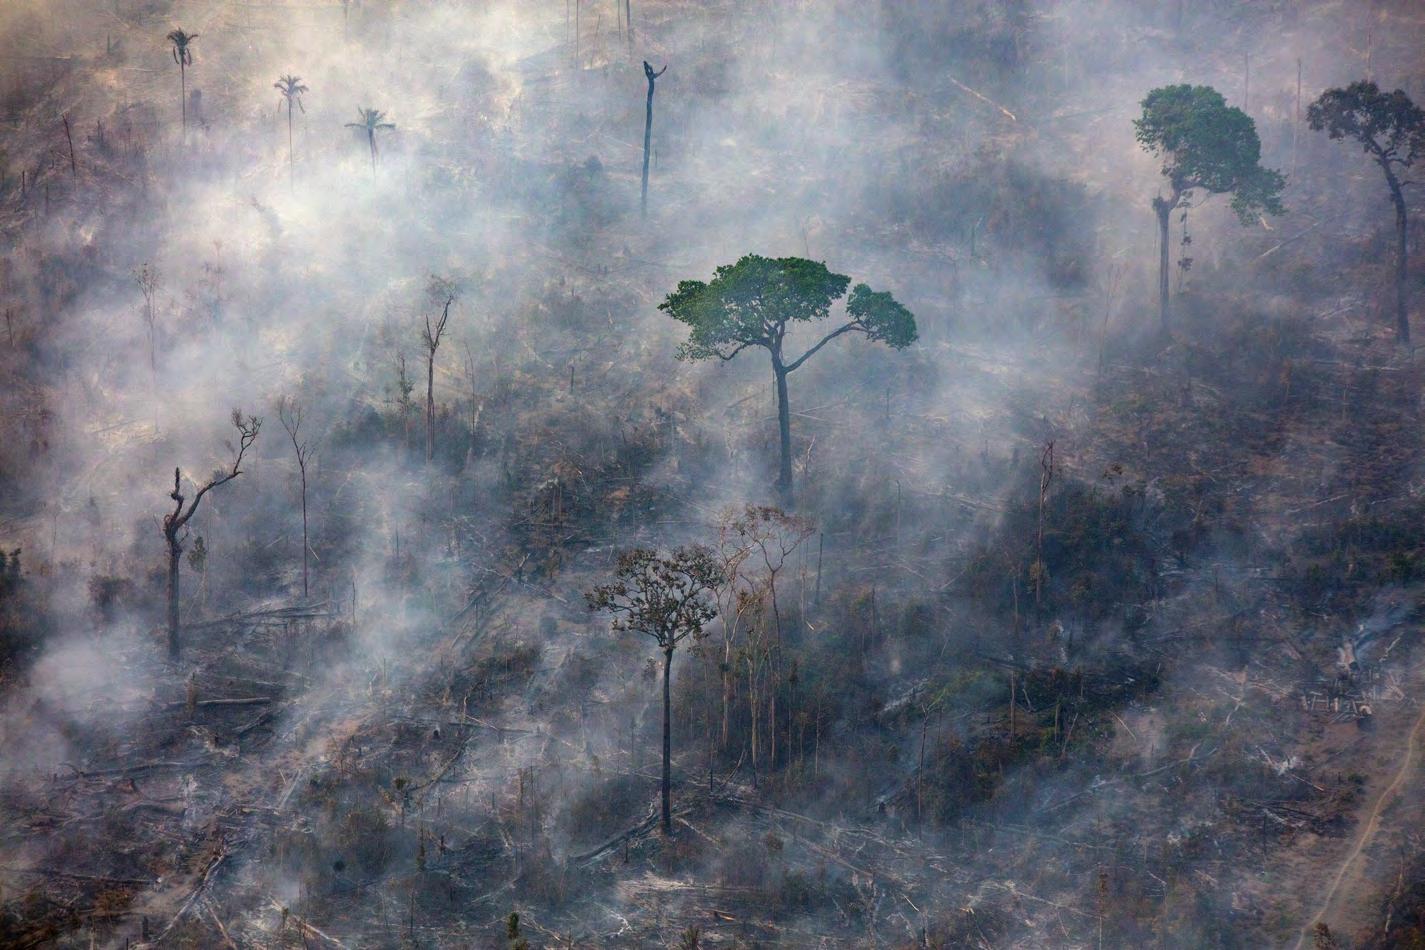
© Marizilda Cruppe / Greenpeace
PM2.5 pollution and fire use in the Amazon region are closely related. Evidence in the literature demonstrates that fire occurrence has become perennial in the Amazon region, with burning events ramping up between July and November –a period known as the Amazon fire season. A substantial body of evidence on fire use demonstrates that fires are not a natural phenomenon in the Amazon region, unlike in fire-dependent ecosystems, and Amazon fires are understood to be almost always intentionally ignited as a tool in agricultural practices.
Much like elsewhere in the Amazon region, fire use around Porto Velho and Lábrea municipalities is predominantly observed in pastures where fires are used for biomass removal and to promote regeneration, according to data from MapBiomas. Simultaneously, fire use detected at the edge of pastoral zones indicates the use of fire for forest destruction to expand the agricultural frontier. This fire use pattern is consistent with the literature, which has established pasture maintenance and expansion as the primary drivers of Amazon fires. While fire use in food systems has been traditionally practised in the Amazon region, the large-scale, ecologically-destructive and unsustainable use of fire in cattle ranching to meet the growing demand of meat production severely deteriorates regional air quality.
Agriculture-linked burning events emit fire smoke that contains a suite of air pollutants hazardous to human health. Exposure to fire smoke can lead to respiratory and cardiovascular illnesses, premature mortality, and cancer, with children and the elderly exhibiting increased vulnerability – underscoring the urgent need for
intervention. Our literature review found that high PM2.5 levels during severe fire events in the Amazon region coincide with a surge in respiratory-related hospitalizations that can overwhelm healthcare systems.
Brazil’s fire management policy outlaws the use of fire for vegetation removal and alternative land use conversion unless in authorized planned and controlled burnings, and it extends liability and penalty to those who fail to comply. Despite strict regulation on fire use in the country, fires persist in the Amazon region due to the lack of enforcement. The individuals responsible for Amazon fires commit an environmental crime that destroys forests, degrades ecosystems, deteriorates air quality, and damages health. AQLI estimated in 2023 that the average life expectancy would increase by 2.8 years in Amazonas and 2.9 years in Rondônia if the WHO PM2.5 guideline was met – underscoring that those who degrade the air are not committing a victimless crime.
Availability and access to air quality data can be a catalytic step towards clean air. The distribution and coverage of the air quality monitoring network in Brazil’s Amazon region are sparse, especially in fire affected areas, where reference grade monitors are needed. Low-cost sensors, despite their limitations, are a low-barrier approach to provide useful data and insights about the air quality of areas that suffer from poor air quality. Greenpeace Brazil is establishing a longer-term air quality monitoring initiative to provide new measurement evidence in fire-plagued and deforestation areas of Brazil’s Amazon region.
Greenpeace International measurements and data analysis found that:
• Data analysis from PurpleAir monitors indicates that PM2.5 levels in Porto Velho city and Lábrea city exceed both Brazil’s and the WHO 24-hr guidelines. During 2024 and 2025, the months of July, August, and September had some of the highest PM2.5 measurements, including daily averages in excess of 300 µg/m³, which corresponded to a more than 20-fold exceedance over WHO’s 24-hr guideline.
• During the first month of air quality monitoring with AirGradient OpenAir sensors (September 2025), a multi-day breach of the WHO 24-hr guideline was recorded at both sampling locations. The month-long measurements captured high hourly PM2.5 levels of nearly 99 and 250 µg/m³ in Porto Velho city and the Caititu Indigenous Territory, respectively. Even shortterm exposure to high PM2.5 levels can trigger or exacerbate negative health outcomes.
• With the use of Atmotube personal exposure monitoring devices, air pollution from smoke plumes associated with agricultural burning was detected when travelling through areas of active fire use. The average PM2.5 concentration was
14.3 µg/m³ and the maximum 1-min reading reached 848 µg/ m³, indicating extremely poor air quality.
• Long-term satellite data tracking region-wide changes in air quality shows the seasonal changes in ambient PM2.5 concentrations in the Amazon. PM2.5 levels surge during the Amazon fire season, leading to days with severe air pollution and lifting the annual average to levels associated with significant health risks. Other cities in Brazil do not share this pattern.
• The air of Porto Velho city and Lábrea city has higher annual average concentrations of fine particles than that of major cities, both in Brazil and globally. Even cities with heavy traffic and industry often have lower average PM2.5 levels.
• Surges in fine particulate levels during the Amazon fire season, when agricultural burning intensifies, push annual average PM2.5 estimates of Porto Velho municipalities higher than those of megacities such as Beijing, Santiago de Chile, Bogotá, and São Paulo.
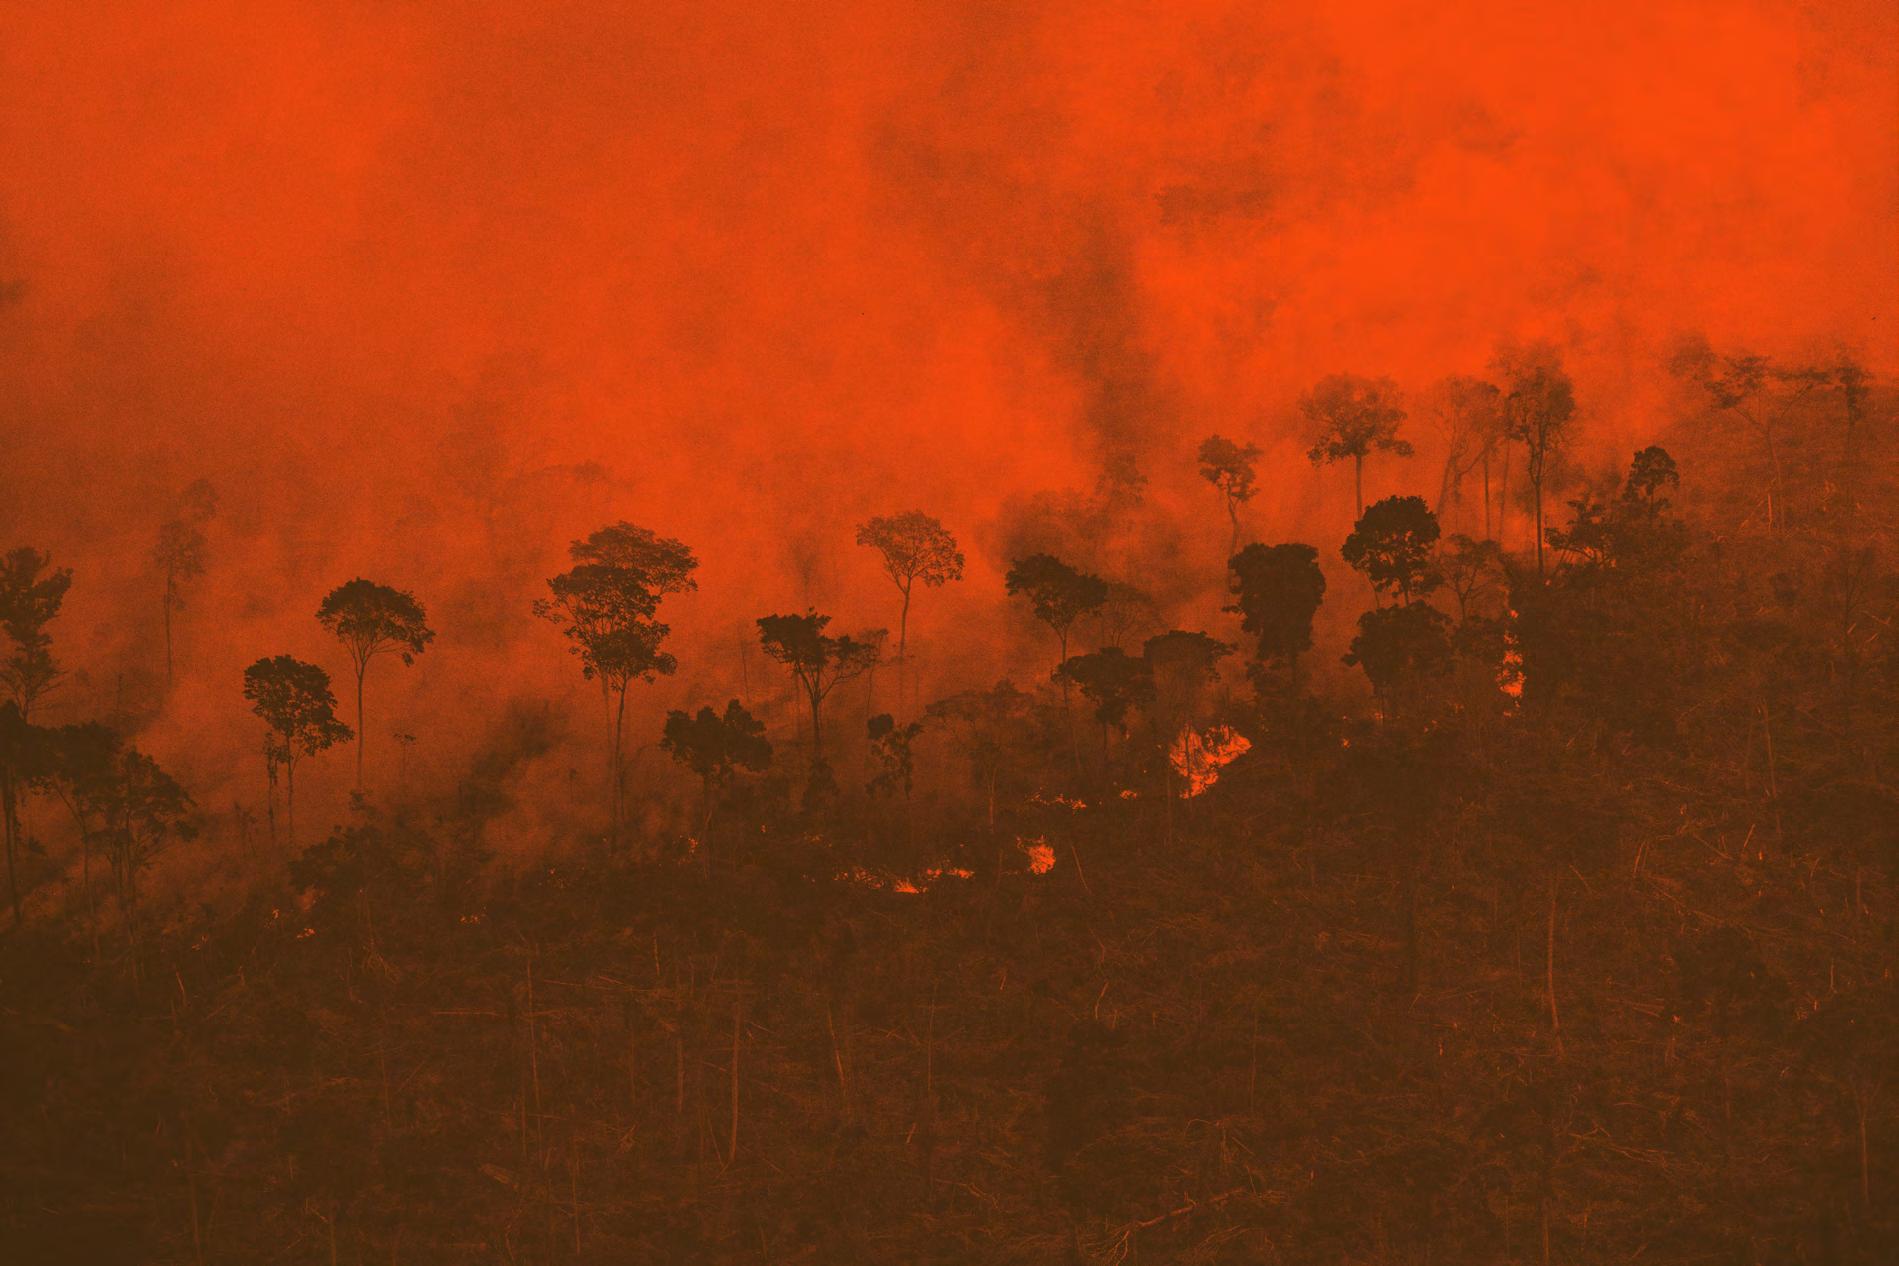
5CONCLUSIONS AND DEMANDS
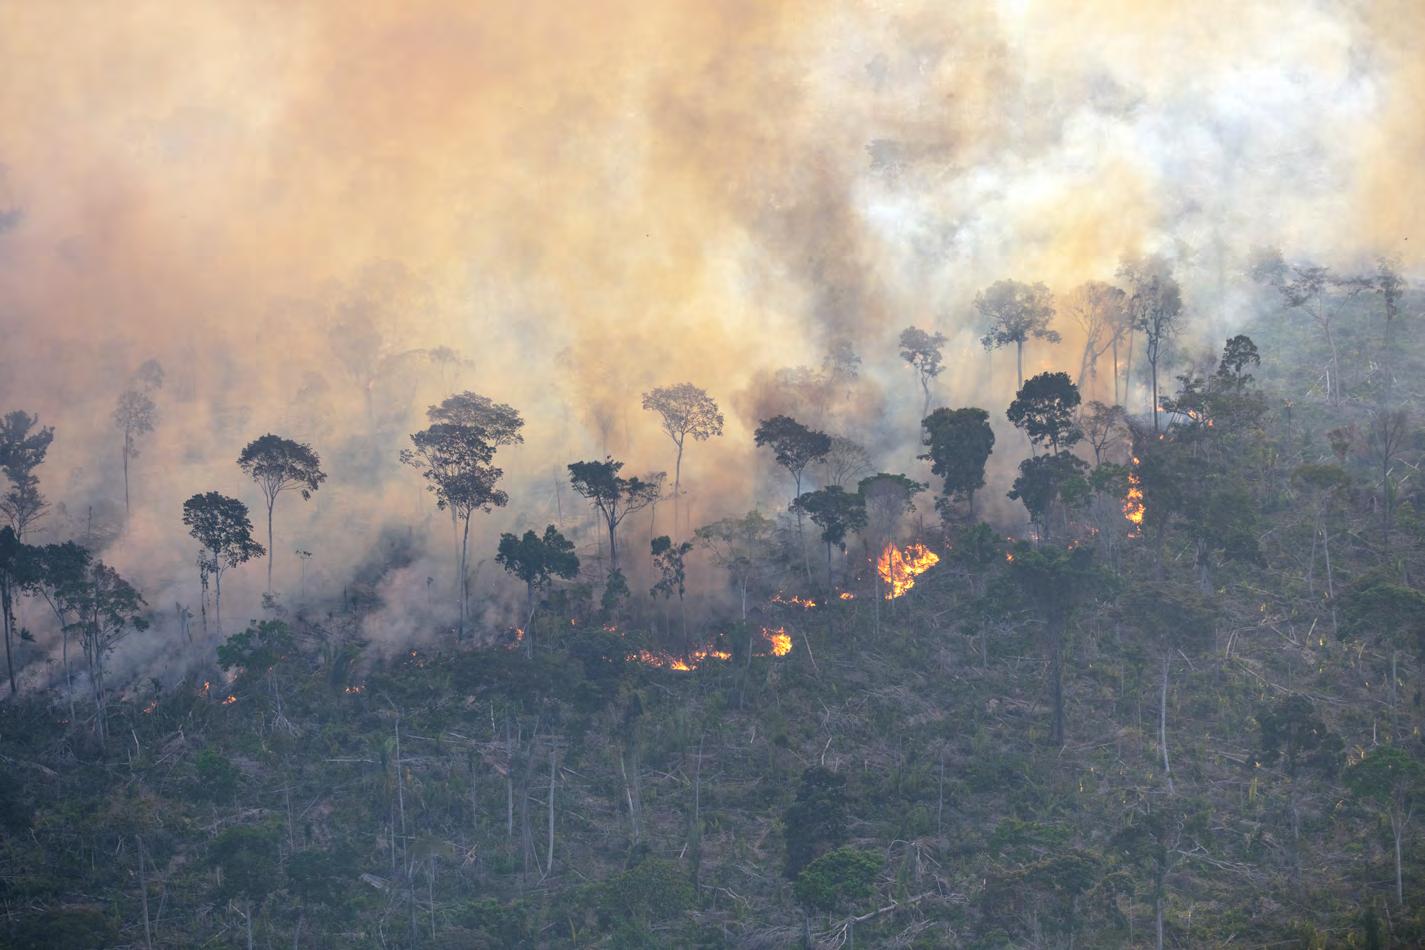
© Marizilda Cruppe / Greenpeace
Porto Velho and Lábrea municipalities suffer severe air pollution challenges. They recorded some of Brazil’s worst fine particulate matter air quality at levels associated with health hazards, surpassing even some of the world’s biggest cities in severity.
The data and evidence in the literature confirm a strong link between severe air pollution and the widespread use of fire for pasture conversion, maintenance, and expansion. Growing global meat demands create economic incentives for this destruction, enabled by the lack of enforcement of fire regulations. These factors contribute to air quality deterioration for Amazon residents. The perpetrators and enablers of Amazon fires must be held responsible for their role in this environmental and health crisis. Setting the Amazon ablaze is not a victimless crime.
Expanding air quality monitoring can strengthen the knowledge base for evidence-driven action and improve understanding of the Amazon region’s air quality challenges. Ground-level measurements help profile air pollution and identify who is most affected, which in turn can support targeted enforcement actions, direct public health responses, and inform environmental strategies. The current state of air monitoring in the Amazon is lacking in coverage and distribution. This report presents the first evidence from a new Greenpeace Brazil monitoring initiative that aims to contribute air quality data in the Amazon region.
The implementation of sustainable agricultural practices is pivotal to safeguarding environmental integrity and community health. Cross-sectoral efforts and strong government actions must be implemented to protect the Amazon ecosystem.
Greenpeace International put forth the following demands:
GLOBALLY:
• At COP30, world leaders should deliver an action plan to implement the UNFCCC’s 2030 target to halt and reverse deforestation and forest degradation. It’s time to turn commitments into action (27).
• Governments must urgently regulate the agricultural and financial sectors to ensure their alignment with the Paris Agreement, the Kunming-Montreal Global Biodiversity Framework, and the UN Sustainable Development Goals.
• Governments must ensure the transition to truly ecological and just food systems, an end to deforestation, and the reduction of emissions associated with agriculture, including methane.
• Financial institutions must fulfill their duty of due-diligence and review their financing and investments into destructive stakeholders in the agricultural sector.
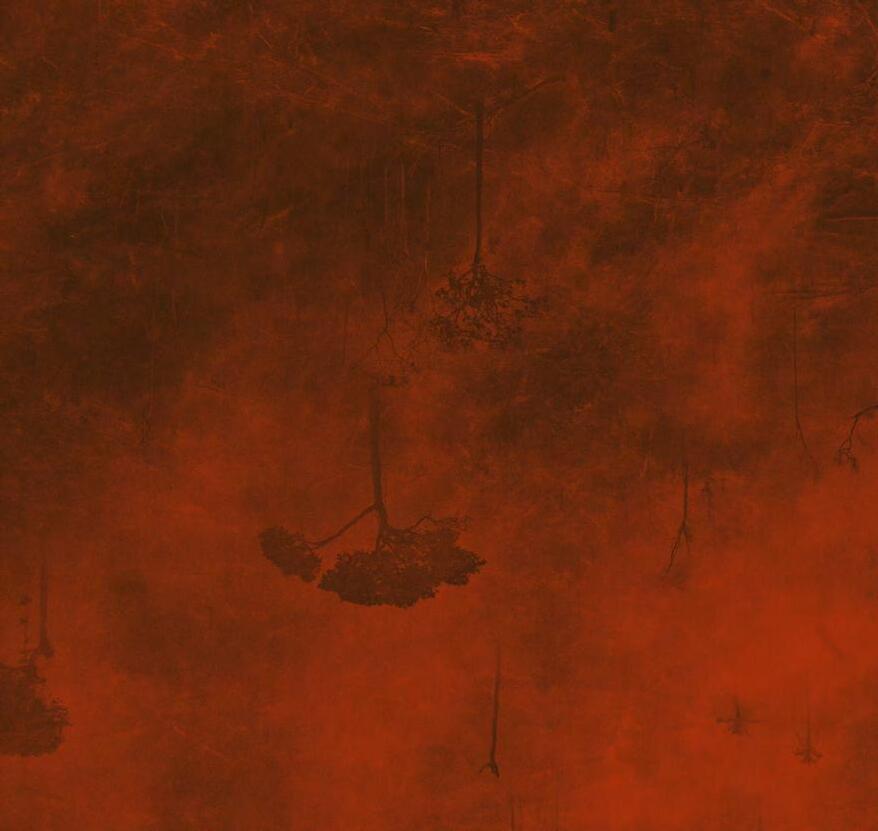
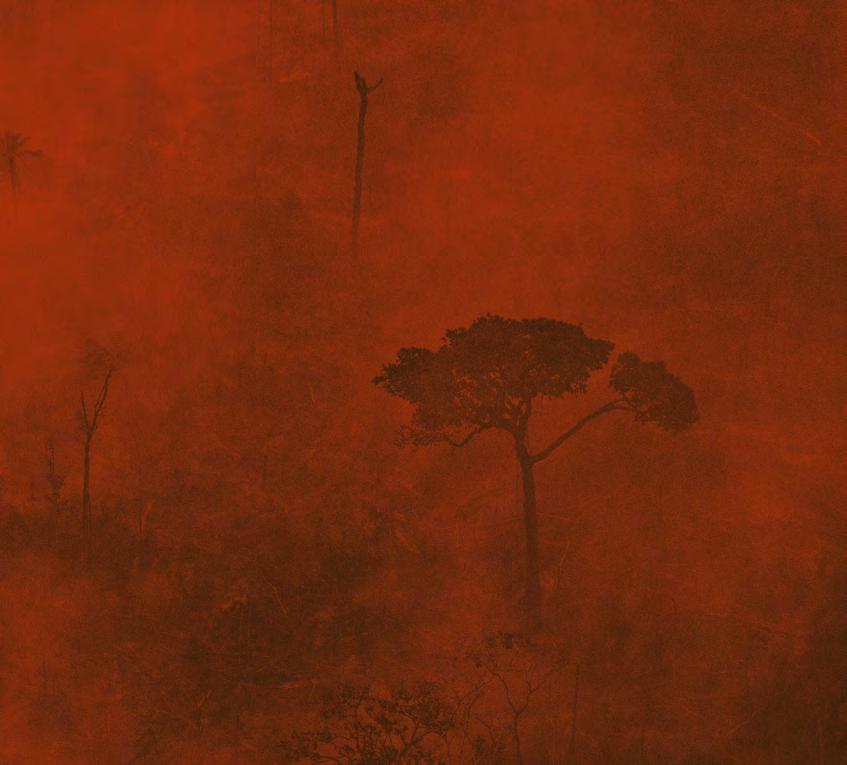
IN BRAZIL:
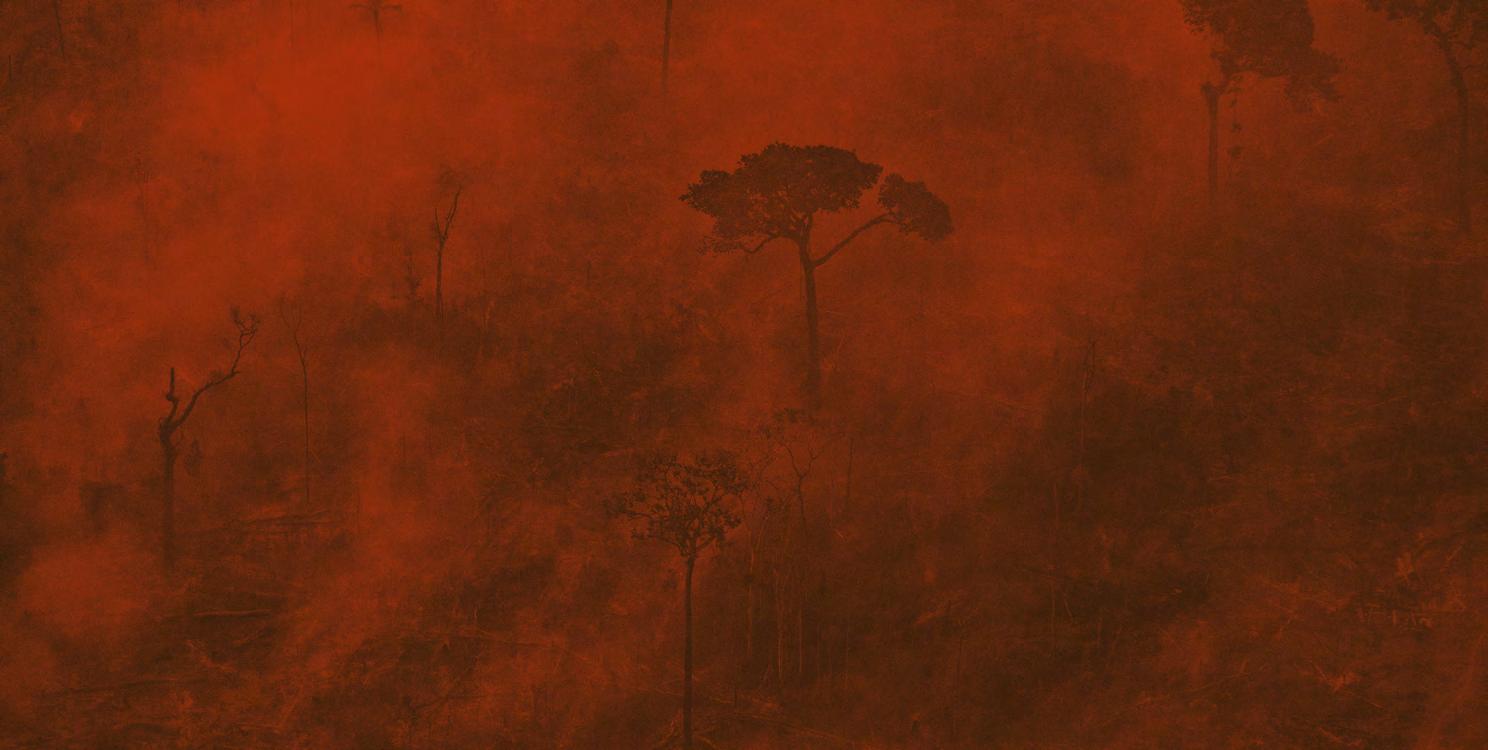
• State and federal governments must continue working to halt deforestation, which includes the demarcation of Indigenous lands and designating public lands to protection and sustainable use, thus avoiding that these lands are targeted by illegal land grabbing and fires.
• State and federal governments must continue working to increase efforts to hold to account the people responsible for Amazon fires, and end the current impunity that allows those who commit environmental crimes to evade legal consequences and ignore imposed fines.
• State and federal governments must continue implementing the decisions of the Federal Supreme Court in ADPF 743, which include: (i) gradually increasing their operational capacity to prevent and combat fires; (ii) improving intergovernmental governance capacity and allocating adequate public funding for fire prevention and control policies; and (iii) carrying out
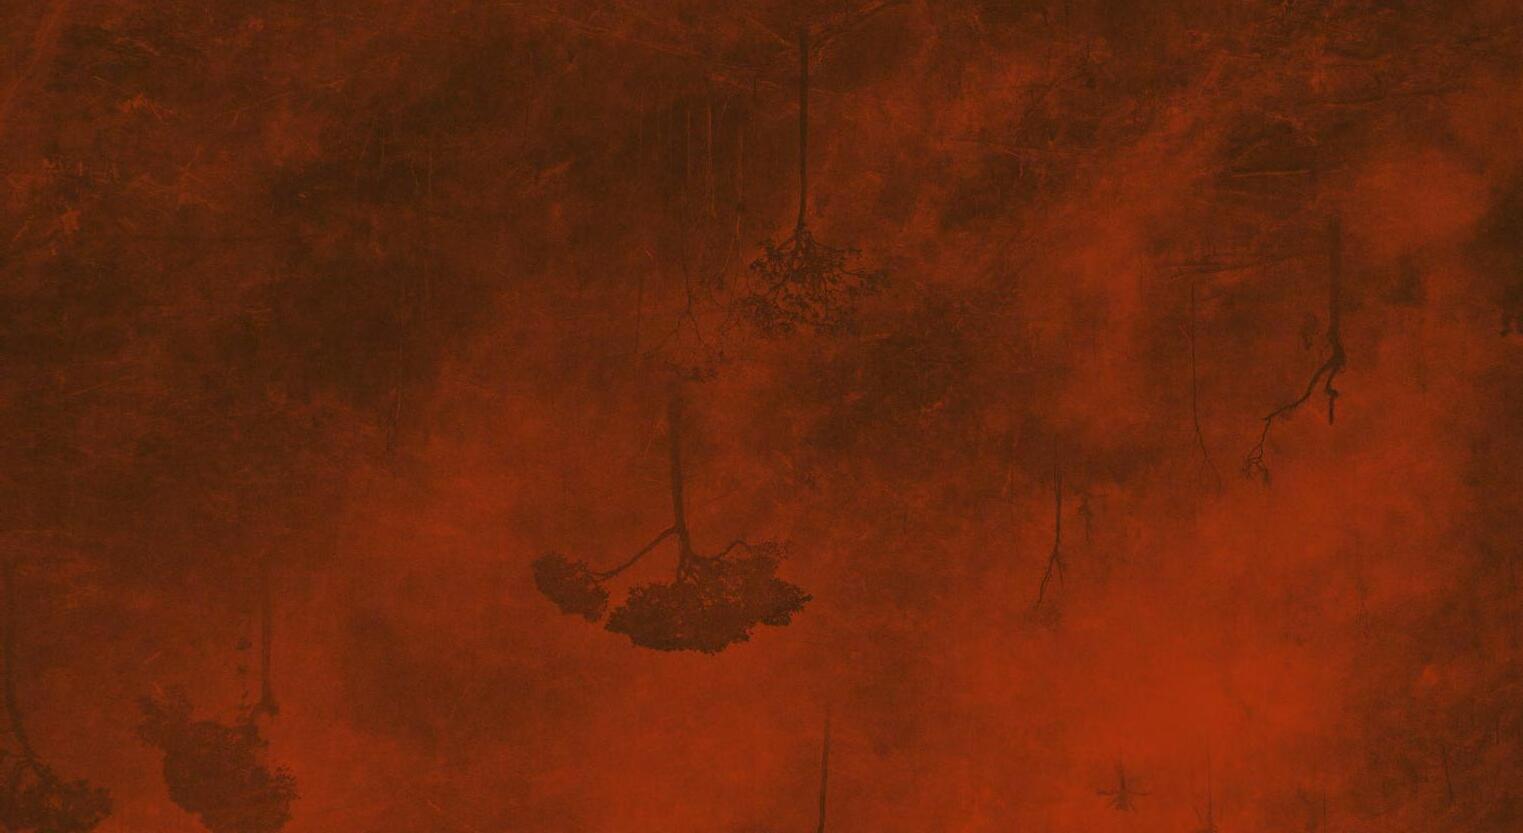
the necessary administrative measures to expropriate, in the public interest, land affected by intentional and willful fire use and illegal deforestation, whenever landowners’ culpability for environmental violations is duly proven.
• Farmers and ranchers that use fire illegally on their properties should be barred from accessing rural credits and other types of financing and prohibited from selling their agricultural products to agribusinesses.
• Authorities should install reference grade air monitors in fire-affected municipalities in the Amazon region, with timely publication of the observed concentration data in an accessible, machine-readable format, to increase awareness for exposed populations and enable evidence-driven actions towards clean air.
Appendix I: Fire Governance
The use of fire in Brazil is regulated and restricted.
On May 25, 2012, Law No. 12.651, also known as the ‘Forest Code’ (Código Florestal), enacted by the National Congress and sanctioned by the President of Brazil, introduced a prohibition on the unauthorized use of fire (100). The law also outlined the conditions for the use of controlled, prescribed, traditional, and adaptive fires. Controlled fires in agricultural and pasture areas, as well as forestry plots, must receive prior authorization from the competent environmental agency within SISNAMA, the National Environmental System. Within federally protected Conservation Units (Unidades de Conservação), regulated by Law No. 9.985 of July 18, 2000, controlled fires are only allowed for conservation purposes in fire-adaptive ecosystems, in accordance with the respective management plan and subject to prior approval by the managing authority of the protected area. These fire control measures do not fully apply to subsistence farming practised by traditional and Indigenous communities, whose cultural practices must also be respected.
Article 40 of the ‘Forest Code’ mandated that the federal government establish a ‘National Policy on Integrated Fire Management’ (Política Nacional de Manejo Integrado do Fogo; PNMIF), a fire management policy framework to regulate the use of fire in Brazil. However, this policy was not formally created until 2024, when Law No. 14.944 was published.
On July 31, 2024, President Luiz Inácio Lula da Silva put into effect Law No. 14.944 which formally established the long-awaited and necessary PNMIF (5). The provisions of this law established PNMIF
as the legal and institutional framework for coordinating and managing the integrated use of fire across all levels of government and the public and private spheres. The principles that informed the structure of PNMIF emphasized the pressing need to reduce fire occurrence, regularize fire use, integrate the ecological role of fire in fire-adaptive ecosystems7, and formalize traditional fire use regimes in e.g., Indigenous communities. Rather than declaring a blanket prohibition on fire use, PNMIF integrated controlled use and traditional users of fire into its fire management strategy.
The PNMIF is instituted through a set of tools and governance mechanisms. The tools comprise technical plans to inform fire use, brigade training to bolster fire-control capabilities, an inter-stakeholder data information platform to register and track fire application, and educational resources to support civic engagement in improved fire regime practices. These tools are leveraged by the National Committee on Integrated Fire Management (Comitê Nacional de Manejo Integrado do Fogo; COMIF), established as the governing and coordinating body responsible for creating guidelines, monitoring, and civic engagement. The data information platform is called the ‘National Fire Information System’ (Sistema Nacional de Informações sobre o Fogo; Sisfogo) which serves as the national database to contain fire-related data, with the goal of ensuring broad data dissemination and transparency.
The fire management policies in PNMIF amended two key aspects of the ‘Forest Code’ of 2012. First, in accordance with Article 30
7 The Cerrado is an example of a fire-adaptive ecosystem – an environment where the native plant and animal life has evolved to adapt to natural fire regimes The Amazon biome is a fire-sensitive ecosystem where fire can cause significant negative impacts on ecological processes (5,6).
§ 4º, Law No. 14.944 decreed an explicit prohibition on fire use to suppress native vegetation for the purpose of alternative land use transformation (5), with the only exception being the planned, monitored and controlled burning of residual vegetation (5). This provision reinforced the restrictions for authorized clearance for fire use in the ‘Forest Code’. Second, Law No. 14.944 established administrative, civil, and criminal liability for the irregular use of fire, as already provided for in Article 38, §3 of the ‘Forest Code’. To establish liability, a causal link between the conduct and the resulting damage must be proven. It is worth noting that the unauthorized use of fire had already been considered an environmental administrative offence since 2008 under Decree No. 6.514 (101). In 2024, penalties for such offenses were increased, and new violations were introduced, such as failing to implement wildfire prevention and response measures on one’s property in accordance with the standards set by the National Committee on Integrated Fire Management.
In 2020, cases ADPF 743, 746, and 857 brought before the Federal Supreme Court challenged the actions and omissions of the Federal Government and the States regarding the fires in the Amazon and Pantanal biomes (102,103,104). In 2024, the Supreme Court classified the matter as a structural litigation and ordered certain measures to be taken by the government to protect the environment in the Amazon (105). These included: (i) the development of a prevention and firefighting plan for the Pantanal and Amazon; and (ii) the presentation of a
plan to restore the operational capacity of the National System for the Prevention and Control of Forest Fires (PREVFOGO). The Supreme Court has been monitoring the government’s compliance with these measures and issuing further decisions to ensure the effectiveness of the actions, such as authorizing the release of public funds for the implementation of the planned measures (104).
On April 28, 2025, based on Articles 184 and 186 from the Federal Constitution and Article 9º, II, of Law No. 8.629 of 1993 (which provides for the regulation of constitutional provisions relating to agrarian and land reform), the Federal Supreme Court (Supremo Tribunal Federal; STF) ruled to summon the Federal Government to promote the necessary administrative measures related to the expropriation, by social interest, of land affected by willful use of fire (incêndios dolosos) or illegal deforestation, whenever the landowner’s responsibility for such environmental violations is duly proven (106). The ruling also required the Federal Government and the Federal States to adopt regulatory and operational instruments to prevent land regularization in areas where environmental violations are unequivocally verified and to take legal action seeking compensation from landowners held responsible for willful fires and illegal deforestation. This ruling may serve as an important measure to discourage willful illegal fires and illegal deforestation, although, as of now, there is no known evidence that the Union or the States have begun to implement the STF’s decision.
Appendix II: Air Quality Legislation
In 1989, the creation of the National Air Quality Control Program (PRONAR), established by CONAMA resolution no. 5/1989 marked a milestone for air quality in Brazil (107). Resolution 5/1989 provided for the establishment of an air quality monitoring network and laid the groundwork for future regulation, which was formalized the following year with CONAMA resolution no. 3/1990 (108), which established the first air quality standards in the country.
A series of subsequent changes recently created the updated air quality standards. In 2018, CONAMA resolution no. 491/2018 (109) established stricter standards that were updated by CONAMA resolution no. 506/2024 (110), aligning with the guidelines of the World Health Organization (WHO).
In 2022, the Brazilian Federal Supreme Court (Supremo Tribunal Federal; STF) deemed that the contemporary air quality standards applicable during that time were insufficient in safeguarding health, protecting the environment, and upholding society and citizens’ right to information (111). The STF mandated an updated CONAMA resolution to be articulated and issued within 24 months (by September, 2024), one with stricter air quality standards and a clear timeline.
On May 4, 2024, President Luiz Inácio Lula da Silva signed into law No. 14.850 establishing the National Air Quality Policy (Plano Nacional de Qualidade do Ar; PNQAr) (112). Federal Law No. 14.850 mandated the establishment of air quality standards and the integration of air quality standards and monitoring mechanisms into Brazil’s national air quality strategy. It assigned the MMA the responsibility of providing technical training to support the use of air quality monitoring data through the National Air Quality Control Program (Programa Nacional de Controle da Qualidade do Ar; PRONAR), and support broad dissemination of data and
information about the management and monitoring of air quality standards via MonitorAr (National Air Quality Management System). The purpose of MonitorAr is to integrate the National Environmental System (Sistema Nacional do Meio Ambiente; SISNAMA), Brazil’s national air quality monitoring network, with a platform designated to air quality information dissemination. Furthermore, PNQAr stipulated that individuals and legal entities responsible for emitting air pollutants must comply with its air quality provisions8.
On June 12, 2024, congruent with the aforereferenced 2022 STP mandate, CONAMA approved a resolution that would revise the air quality standards of resolution No. 491/2018 (113) and instructed the effecting of new air quality standards with implementation deadlines (111). Once signed into law, the CONAMA-approved resolution would become resolution nº 506/2024.
On July 9, 2024, Brazil updated its air quality standards when CONAMA resolution No. 506/2024 was signed into law and replaced CONAMA resolution No. 491/2018 (110). The air quality standards for particulate matter (PM), sulphur dioxide (SO2), nitrogen dioxide (NO2), ozone (O3), carbon monoxide (CO) will be rolled out in four interim stages between 2024 and 2044. These interim stages are referred to as PI-1, PI-2, PI-3, and PI-4 (PI: padrões de qualidade do ar intermediários). The final air quality standard, abbreviated PF (padrão de qualidade do ar final), will come into effect on a later date to be specified by CONAMA. The air quality standards of CONAMA resolution nº 506/2024 are described in Table 15.
To mark the 2025 Inter-American Air Quality Day, the MMA reaffirmed improving and safeguarding air quality as a federal priority on August 8, 2025 (114).
8 MonitorAr currently operates across 12 states: Bahia, the Federal District, Espírito Santo, Mato Grosso do Sul, Maranhão, Minas Gerais, Pará, Paraná, Pernambuco, Rio Grande do Sul, Santa Catarina, and São Paulo, as well as the city of Rio de Janeiro. The initiative is primarily focused on the coastal region of Brazil, with Maranhão and Pará being the only states in the Legal Amazon included.
Table 15. Interim and final air quality standards of CONAMA resolution No. 506/2024 (Brazil) with units and implementation dates (110).
Compared to the World Health Organization’s (WHO) 2021 (115) Global Air Quality Guideline (AQG) levels (Table 16), the interim targets (PI-1 to PI-4) for airborne particulate matter standards decreed by CONAMA resolution No. 506/2024 (110) in pursuance of health protection provisions in the National Air Quality Policy
(Law No. 14.850) (112) are generally less ambitious than the WHO recommendations, though the lack of a recommended timeline for the WHO interim targets makes it hard to compare the two. On the other hand, the final air quality standards for both PM2.5 and PM10 match the WHO’s guidelines.
Table 16. World Health Organization’s 2021 Global Air Quality Guidelines for PM2.5 and PM10, and the 2005 Global Air Quality Guidelines that have been superseded.
Brazilian Air Pollution Legislation Terminology
• CONAMA: National Council for the Environment – Conselho Nacional do Meio Ambiente
• MMA: Ministry of Environment and Climate – Ministério do Meio Ambiente e Mudança do Clima
• MonitorAr: National Air Quality Management System
• PNQAr: National Air Quality Policy – Plano Nacional de Qualidade do Ar
• PRONAR: National Air Quality Control Program – Programa Nacional de Controle da Qualidade do Ar
• STF: Federal Supreme Court – Supremo Tribunal Federal
• SISNAMA: National Environmental System
– Sistema Nacional do Meio Ambiente
Brazilian Fire Use Legislation Terminology
• COMIF: National Committee on Integrated Fire Management – Comitê Nacional de Manejo Integrado do Fogo
• PNMIF: National Policy on Integrated Fire Management – Política Nacional de Manejo Integrado do Fogo
• Sisfogo: National Fire Information System –Sistema Nacional de Informações sobre o Fogo
Appendix III: Full Methodology and Study Locations
This study introduces new air quality monitoring initiatives in the western region of Brazil’s Amazon region, as well as analysing data from existing initiatives. AirGradient OpenAir monitors that were newly installed by Greenpeace Brazil record the concentrations of pollutants in the immediate area where the monitors are deployed and measure changes in the air quality over time. They will provide longer-term air quality data with the purpose of supporting the network of empirical air quality measurements in the fire-plagued region. The first PM2.5 data from these sensors are presented in this report. Additional monitoring and data analysis are planned for 2026.
A short-term investigation by Greenpeace Brazil using personal PM2.5 air monitors – Atmotubes – are also presented in this report. Personal air monitors are mobile and worn on the body, they monitor pollution in the air that the wearer of the device is exposed to as they move around.
This study also analyzes PM2.5 air pollution data from the network of PurpleAir low-cost sensors.
Low-cost sensors are currently the only available source of air quality data in the study region. Like all other types of environmental instrumentation, even reference grade instruments, they produce data with artefacts and error. The performance of AirGradient, Atmotube and PurpleAir sensors has been extensively evaluated by their manufacturers and others. Each can provide useful air quality insights. However, low-cost sensor observations do include biases and error meaning that results are considered to be indicative of real-world concentrations. To improve accuracy we apply correction algorithms to the data to improve accuracy inline with manufacturers recommendations.
Additionally, satellite-derived surface PM2.5 estimates, and satellite-derived burned area data in the study areas from MapBiomas’ Fire Monitor are investigated. These datasets provide wider spatial and historical context to the observations made using lowcost air quality sensors.
AirGradient OpenAir
AirGradient OpenAir devices are low-cost, self-contained multi-pollutant air quality instruments, capable of making measurements of PM1, PM2.5, PM10, and CO2 (116). They provide data in real-time describing pollutant concentration in the immediate area of the monitor. Hourly recorded data retrieved from the AirGradient web portal was analyzed in this study.
Two AirGradient OpenAir devices measuring ambient concentrations of pollutants were installed by Greenpeace Brazil in the study area. One was installed in Porto Velho and one in the Caititu Indigenous Territory. Hourly PM2.5 data from these AirGradient sensors between September 1 – 30, 2025 were downloaded and analyzed. The daily averages were calculated for days where at least 75% of the hours had measurements (95,96).
AirGradient currently recommends that raw data from their OpenAir sensors is processed before analysis using a correction algorithm originally developed by the US Environmental Protection Agency for use with Purple Air Sensors (136). This correction algorithm was applied automatically within the AirGradient web portal to all raw AirGradient observations of PM2.5 before analysis.
Atmotubes
Mobile air quality data in the study areas was collected by Greenpeace Brazil using Atmotube Pro sensors (118). Atmotube devices are portable and wearable and are designed to provide real-time estimates of personal exposure to air pollutants. The devices quantify ambient concentrations of particulate matter (PM1, PM2.5, and PM10) using an optical particle counter, and detect gaseous CO and total volatile organic compounds (TVOC) through electrochemical and metal-oxide semiconductor sensors.
Atmotube devices integrate GPS functionality to enable the georeferencing of air quality data and mapping of personal exposure across space and time. The high temporal resolution of the data (up to one measurement per second) is suitable for analyses on spatiotemporal variations in air pollution not captured by stationary air monitoring systems.
Data from three Atmotube sensors are analysed in the study. Each sensor was worn by a different individual member of a group taking part in field trips in the municipalities of Porto Velho, Lábrea, and Canutama, between August 23 and August 30, 2025. The field trips comprised ground trips to visit burnt and burning areas as well as overflights in aircraft which passed through areas where it was possible that fire smoke would enter the aircraft cabin.
We present maximum 1-minute and 15-minute values, as wll as 5-minute averages and field trip averages. As the monitors were mobile data with longer averaging times may represent observations taken over a larger geographical area than data with shorter averaging times, this is also the case for observations made when the sensor was moving quickly, in a vehicle for example.
Fieldwork with the atmotube sensors is intended to illustrate the range of air quality conditions that can be encountered in the study region.
PurpleAir
The study also presents a new analysis of publicly accessible air quality data from PurpleAir sensors which have been installed in the Amazon region (119). PurpleAir sensors use optical particle counters to measure ambient concentrations of particulate matter (PM2.5 and PM10) along with temperature and relative humidity. The sensors provide hourly data via their web-based platform, which enables remote live monitoring of air pollution across locations.
In this study, ambient PM2.5 concentrations from two sensors in the PurpleAir network were analyzed (Table 17). PurpleAir data from 2023-2025 were downloaded from the PurpleAir web platform on October 1, 2025. These sensors are located outdoors, in Porto Velho city and Lábrea city.
PurpleAir data can be treated with different correction algorithms to improve accuracy. The analysis here uses PurpleAir’s ‘_atm’ data for PM2.5 which is appropriate for outdoor analysis. The ‘_atm’ correction algorithm is provided by the manufacturer of the MS 5003 sensor which is used in PurpleAir PA-II monitors and it is applied on PurpleAir’s web platform prior to analysis. The algorithm is proprietary and not publicly available (117). Compared to other correction algorithms for PurpleAir data, the ‘_atm’ data can underestimate PM2.5 levels during heavy pollution (>300 µg/m3). Therefore the sensors’ observations during severe fires could be underestimates of the true value (120).
The downloaded datasets contained a period of extreme PM2.5 readings above 1,000 µg/m³ between December 2024 and June 2025. Such results are not likely to be representative of air quality in the study area and after discussion with the local operator of the sensor it was confirmed that these data are the result of device or system malfunctioning. Therefore, all readings above 1,000 µg/m³ have been removed from the datasets prior to analysis.
IFRO calama (karolinska) 219595 Porto Velho city, Rondônia
UEA_ EducAIR_24 177609 Lábrea city,
Satellite-derived air quality data
In addition to the ground-based sensor data described above, this study also investigates satellite derived estimates of surface PM2.5 concentrations (99). This global dataset combines air quality monitoring station observations, satellite data, and modelling to generate monthly global maps of ground-level PM2.5 concentration. The maps analyzed here have a resolution of 0.1° × 0.1°, this is approximately 11 × 11 km in our study area. Local peaks in PM2.5 are likely to be missed at this resolution, but the dataset allows intercomparisons between locations and through time which can be interpreted together with ground-based data. This report analyses monthly average PM2.5 in a radius of 0.25° degrees around cities and places of interest (Table 18).
MapBiomas fire data
Fire events between 1985 and 2025 are described using the MapBiomas Fire Collection 4 dataset, which maps the monthly and annual burned areas, also known as fire scares, in Brazil. MapBiomas analyzes land use and cover classes from 30 meter resolution Landsat satellite imagery data, fire size and extent from 10 meter resolution Sentinel-2 multispectral satellite imagery data, and machine learning techniques to ascertain the spatiotemporal distribution of fire occurrence. MapBiomas data are publicly available and with open access mode.
Monitoring areas
AirGradient OpenAir sensors installed by Greenpeace Brazil collected air quality data in Porto Velho city (Rondônia state) and inside the Caititu Indigenous Territory, 2 km from the city of Lábrea (Amazonas state). Atmotubes collected personal exposure data across the contiguous Porto Velho municipality, (Rondônia state) and two municipalities in Amazon state – Lábrea municipality and Canutama municipality. PurpleAir datasets that were downloaded and analyzed in this study are from Porto Velho city (Rondônia state) and Lábrea city (Amazonas state). Table 19 summarizes the data collection areas, and Figure 20 shows their locations.
Table 17. Location of PurpleAir monitors analyzed.
Table 18. Locations included in the satellite data analysis.
Table 19. Data collection areas of AirGradient OpenAir sensors, Atmotubes, and PurpleAir datasets.
Data types
AirGradient OpenAir sensors* Atmotubes sensors* PurpleAir dataset
Rondônia state
Data collection area
Amazonas state
Porto Velho municipality
Porto Velho city
Canutama municipality
Lábrea municipality
Lábrea city
Local Caititu Indigenous Territory
*data resulting from new monitors installed by Greenpeace Brazil.
Stationary ground sensors installed by this project
Mobile personal sensors deployed by this project
Pre-existing stationary ground sensors
Together, the locations covered by different datasets cover a complex mosaic of ecosystems, land-use types, and built environments. They illustrate a range of air quality settings in the Amazon region.
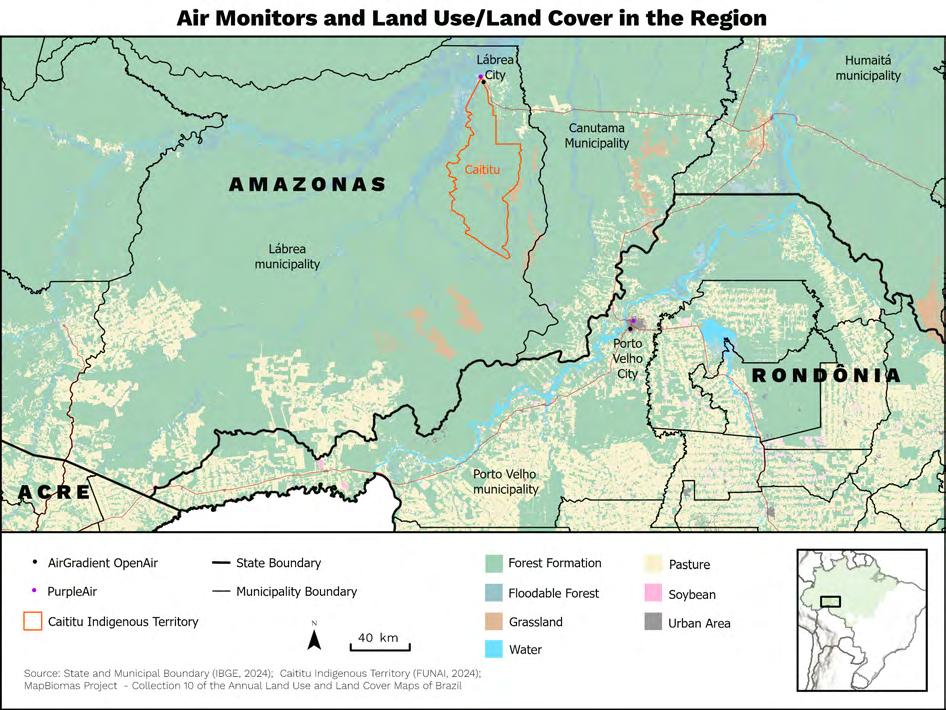
Figure 20. Map of Porto Velho, Lábrea, and Canutama municipalities, installation locations of the stationary air monitors, locations of PurpleAir monitors, and surveyed zone by Atmotubes.
AMACRO region
The AMACRO region comprises Porto Velho, Lábrea, Canutama, and 29 other municipalities in Amazonas, Acre, and Rondônia. It was created as a special zone for the implementation of government actions on economic and social development, through the establishment of infrastructure such as the construction of new roads, the revitalization of highways and bridges to facilitate the flow of people and raw materials within the region itself and to countries such as Peru, located on the border with the state of Acre (121,122).
The AMACRO region has become an epicentre of deforestation in the Amazon region. Deforestation and fire use are increasing along existing roads and from the opening of new dirt roads. This growth has been monitored by Greenpeace Brazil through the tracking of official data, institutional surveys using satellite and radar imagery, and numerous ground and aerial field activities carried out over the past years (123,124,125).
In addition to highlighting the destruction of native vegetation areas, the impacts on biodiversity, and the relationship between deforestation and the expansion of agriculture-linked economic activities, Greenpeace Brazil also recorded the testimonies of communities, local leaders, and populations directly affected, some of which are presented in this report. Among the main effects observed are land conflicts resulting from the advancement of deforestation, the disruption of daily activities, and health problems associated with smoke inhalation.
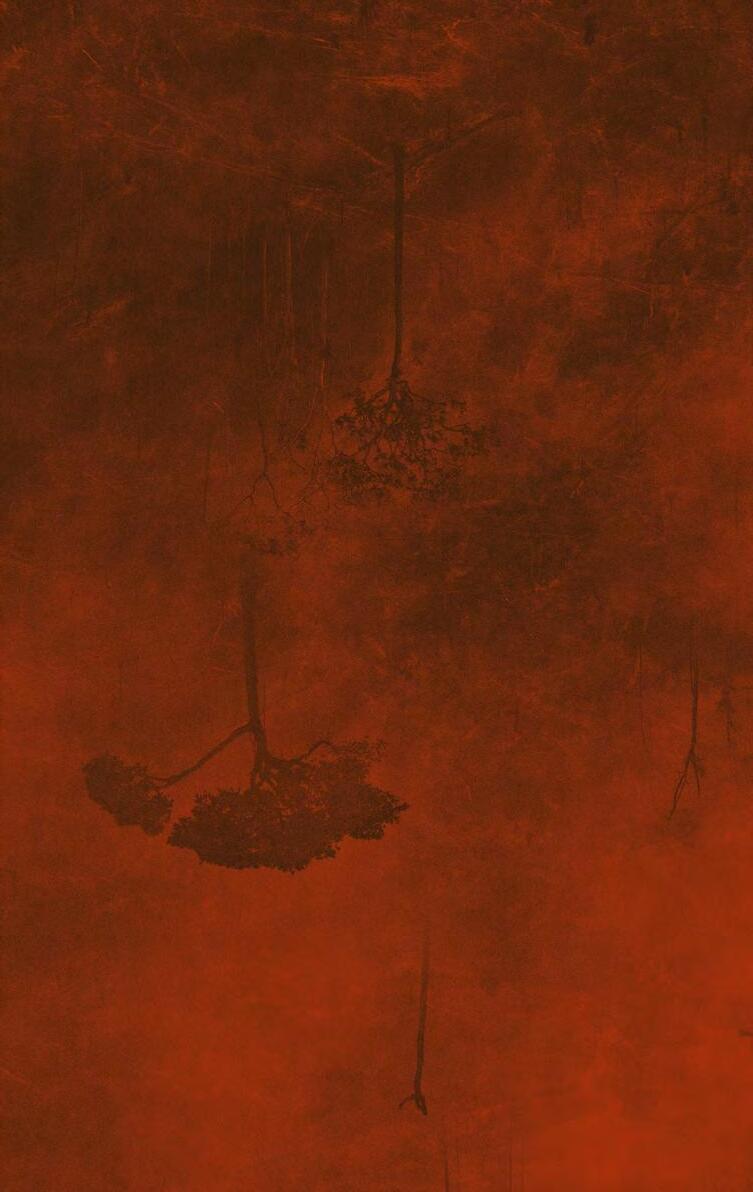
Rondônia state
Rondônia state, situated entirely within the Amazon biome, has suffered large-scale forest cover losses. Since 1988, more than onethird of the state’s forests have been deforested (45) and studies show that the vast majority (>90%) of these cleared areas were converted for agricultural land uses, primarily pastures (126,127). Most of the remaining rainforests in Rondônia state are located in conservation units (federally or state-held) or within Indigenous territories. These zones have historically acted as strongholds for the remaining Amazon forest cover and exhibited strong resilience to deforestation, but there have been reports that illegal land grabbing has begun to encroach on these areas (19).
Amazonas state
Amazonas state is the largest state in the Brazilian Amazon and entirely covered by the Amazon biome. Amazonas state is also one of the most well preserved, with more than 90% of its forests still intact. However, the southern part of the state which forms part of the deforestation arc has undergone high rates of in recent years, driven by the expansion of the agricultural frontier into forested areas. Deforestation pressures originating from the south, in the neighbouring state of Rondônia, have moved northward into Amazonas state.
City and municipality of Porto Velho (Rondônia state)
Porto Velho is the capital and largest city in the state of Rondônia. Geographically, it is located in the Amazon Basin, close to the border with Bolivia. The city serves as an important hub for river transport, agriculture, and mining in the western Amazon. Porto Velho has a resident population of 460,434 according to the latest census of 2022, of whom 125,257 (27.2%) are under the age of 18 (128). In recent years, Porto Velho (city) has been the epicentre of reported air quality deterioration in the Amazon region, e.g., 2019 and 2024 (129,130). Porto Velho (city) is located in the eponymous municipality, which is situated on the northern frontier of the vast agrarian zone that stretches south across large swaths
of the state. Porto Velho municipality shares a border with Lábrea municipality in the neighbouring state, Amazonas.
Municipality of Canutama (Amazonas state)
Adjoined to both Porto Velho and Lábrea municipalities, Canutama is another largely rural and sparsely populated municipality in Amazonas state. In 2022, the municipality had a population of 16,859 (IBGE, 2022). Canutama has suffered a sharp surge in deforestation, fires, the appearance of cattle pastures common across the Amazon region – a land use conversion that is aided by its remoteness yet catalyzed by the access enabled by the TransAmazonian Highway (131).
Municipality of Lábrea (Amazonas state)
Lábrea is one of the southernmost municipalities in Amazonas state. The municipality’s southern border adjoins Porto Velho municipality, where the state capital of Rondônia, Porto Velho is located. In the remote forested corner of the vast Amazonas state, reports in recent years indicate that the south of Lábrea municipality has been plagued by a rise in deforestation, fires, and land grabbing, coupled with the encroachment of agricultural and pastoral plots in what once was primary forest (132,133,134).
Lábrea marks the end of the Trans-Amazonian Highway (Rodovia Transamazônica) BR-230 that traverses east through Brazil’s Amazon region. The highway is often cited as the catalyst of deforestation in remote parts of the Amazon biome (131,135). As of 2022, the largely rural municipality’s population count stood at 45,448 (128).
Caititu Indigenous Territory (Amazonas state)
The Caititu Indigenous Territory is located in the municipality of Lábrea, in the state of Amazonas, within the Middle Purus region. The territory encompasses 34 villages of approximately 2,910 people total (141), where three Indigenous peoples live: the Apurinã majority,
the Paumarí, and the Jamamadí (142). The northernmost part of the Indigenous territory lies just 1.5 km from the urban centre of Lábrea, underscoring its relationship with and proximity to the city.
The history of the region is marked by the rubber boom, when Indigenous peoples were forcibly incorporated into labour on the rubber estates and subjected to regimes of exploitation and dependency (143). Many of the Apurinã who live in the Caititu Indigenous Territory today came from the Upper Purus region and for decades have depended on landowners of rubber estates and middlemen traders of Brazil nuts for their livelihoods. With the demarcation of the Caititu Indigenous Territory in 1991, these communities secured possession of their territory, strengthening their autonomy and allowing them to gain direct access to resources such as the Brazil nut groves.
Currently, the Apurinã are seeking to strengthen their production practices and territorial management. The people organize collectively in initiatives such as ethno-mapping and the implementation of agroforestry systems, which have been fundamental for the recovery of degraded areas, especially in the northern portion of the territory, where most villages are concentrated. The agroforestry systems are also where they gather forest fruits and harvest cassava (142). The rest of the Indigenous territory are predominantly intact forests that provide natural resources for the communities.
According to MapBiomas, more than 97% of the Caititu Indigenous Territory is composed of natural formations or areas undergoing regeneration, with 88% classified as forests (126). Among their most notable activities, the Apurinã have become a regional reference in Brazil nut collection, continuously improving management and value-adding practices to their production.
Thus, the Caititu Indigenous Territory represents both the memory of a past of exploitation and the affirmation of Indigenous resistance and protagonism in the Middle Purus region, with sustainable practices that reinforce forest conservation and the cultural valorization of its peoples.
References
1 Buralli, R. J., & Connerton, P. (2025). Air pollution, health and regulations in Brazil: Are we progressing? Cadernos de Saúde Pública, 41(3). https://doi. org/10.1590/0102-311XEN172924
2 Lima, R. C., Carvalho, M. N., & Mariano, G. L. (2023). Analysis of air quality in the metropolitan region of Recife, Pernambuco. Revista Brasileira de Geografia Física, 16(6), 3168–3188.
3 Requia, W. J., Roig, H. L., & Schwartz, J. D. (2021). Schools’ exposure to air pollution sources in Brazil: A nationwide assessment of more than 180 thousand schools. Science of the Total Environment, 763, 143027. https://doi.org/10.1016/j. scitotenv.2020.143027
4 Kraaij, T., Baard, J. & Schutte-Vlok, A. (2025). Plant response to the fire regime (1970–2023) in a fynbos World Heritage Site: Ecological indicators for fire management. Ecological Indicators, 170. https://doi. org/10.1016/j.ecolind.2024.113001
5 Lei no. 14.944. (2024, July 31). Retrieved from: https://www.planalto.gov.br/ccivil_03/_ato2023-2026/2024/lei/L14944.htm
6 Pivello, V. R., & Vieira, I., et al. (2021). Understanding Brazil’s catastrophic fires: Causes, consequences and policy needed to prevent future tragedies. Perspectives in Ecology and Conservation, 19(3), 233–255. https://doi.org/10.1016/j.pecon.2021.06.005
7 MapBiomas Fogo. (2025). RAF 2024Relatório Anual do Fogo no Brasil - Coleção 4 de mapas de áreas queimadas do MapBiomas Fogo (1985 a 2024). https://doi. org/10.58053/MapBiomas/JKWSW7
8 Greenpeace. (2024). A world on fire: How industrial agriculture and reckless financiers are driving destruction in Brazil. https://www.greenpeace.org/international/ story/69769/a-world-on-fire-how-industrial-agriculture-and-reckless-financiers-aredriving-destruction-in-brazil/
9 Qiu, M., et al. (2025). Wildfire smoke exposure and mortality burden in the US under climate change. Nature. https://doi. org/10.1038/s41586-025-09611-w
10 Pacifico, F. Folberth, G. A., Sitch, S, Haywood, J. M., Rizzo, L. V., Malavelle, F. F.. & Artaxo, P. (2015). Biomass burning related ozone damage on vegetation over the Amazon forest: a model sensitivity study. Atmos. Chem. Phys., 15, 2791–2804, https:// doi.org/10.5194/acp-15-2791-2015
11 Alari, A., Ballester, J., Milà, C., Benmarhnia, T., Sofiev, M., Uppstu, A., Hänninen, R., & Tonne, C. (2025). Quantifying the shortterm mortality effects of wildfire smoke in Europe: A multicountry epidemiological study in 654 contiguous regions. The Lancet Planetary Health, 9(8), 101296. https://doi. org/10.1016/j.lanplh.2025.101296
12 Liu, X., Yu, X., & Zhang, Z. (2015). PM2.5 concentration differences between various forest types and its correlation with forest structure. Atmosphere, 6(11), 1801–1815. https://doi.org/10.3390/atmos6111801
13 Prist, P. R., Sangermano, F., et al. (2023). Protecting Brazilian Amazon Indigenous territories reduces atmospheric particulates and avoids associated health impacts and costs. Communications Earth & Environment, 4, Article 34. https://doi. org/10.1038/s43247-023-00693-4
14 Ichikawa, Y., Mukai, S., Nishimoto, M., Mouri, H., & Hori, A. (2015). Analysis of air purification in a woodland by field observation and wind tunnel experiment. International Journal of Environmental Pollution and Remediation, 3, 33–41. https://doi.org/10.11159/ijepr.2015.005
15 Hasenkopf, C., Sharma, N., Kazi, F., Mukerjee, P., & Greenstone, M. (2023, December 12). The case for closing global air quality data gaps with local actors: A golden opportunity for the philanthropic community (EPIC White Paper).
16 Instituto de Energia e Meio Ambiente. (2024). Dimensionamento da rede básica de monitoramento da qualidade do ar no brasil - cenários iniciais. Plataforma da qualidade do ar. https://energiaeambiente.org. br/wp-content/uploads/2024/02/202402_ dimensionamentoqarIEMA.pdf
17 Requia, W. J., Saenger, C. C., Cicerelli, R. E., Abreu, L. M. de, & Cruvinel, V. R. N. (2022). Air quality around schools and school-level academic performance in Brazil. Atmospheric Environment, 279, 119125-119131, https://doi.org/10.1016/j. atmosenv.2022.119125
18 Greenpeace. (2022). Amazon rainforest fires 2022: Facts, causes, and climate impacts. https://www.greenpeace.org/ international/story/55533/amazon-rainforest-fires-2022-brazil-causes-climate/
19 Salomão, C. S. C., Stabile, M. C. C., Souza, L., Alencar, A., Castro, I., Guyot, C., & Moutinho, P. (2022, May 3). Amazon in flames 8 –Deforestation, fire and ranching on public lands. IPAM Amazônia. https://ipam.org.br/ bibliotecas/amazon-in-flames-8-deforestation-fire-and-ranching-on-public-lands/
20 Fellows, M., Alencar, A., Bandeira, M., Castro, I., & Guyot, C. (2021, April 1). Amazon on Fire 6: Deforestation and fire in Indigenous lands. IPAM Amazônia. https:// ipam.org.br/bibliotecas/amazon-on-fire6-deforestation-and-fire-in-indigenouslands/
21 Williams, R., Kilaru, V., Snyder, E., Kaufman, A., Dye, T., Rutter, A., Russell, A., & Hafner, H. (2014). Air sensor guidebook (EPA/600/R-14/159; NTIS PB2015-100610). U.S. Environmental Protection Agency.
22 Pendrill, F., & Gardner, T. A., et al. (2022). Disentangling the numbers behind agriculture-driven tropical deforestation. Science, 377(6611). https://doi.org/10.1126/science. abm9267
23 West, C., & Rabeschini, G., et al. (2025). The global deforestation footprint of agriculture and forestry. Nature Reviews Earth & Environment, 6(5). https://doi.org/10.1038/ s43017-025-00660-3
24 Ometto, J. P., Kalaba, K., et al. (2022). Cross-Chapter Paper 7: Tropical forests. In H.-O. Pörtner, D. C. Roberts, M. Tignor, E. S. Poloczanska, K. Mintenbeck, A. Alegría, M. Craig, S. Langsdorf, S. Löschke, V. Möller, A. Okem, & B. Rama (Eds.), Climate change 2022: Impacts, adaptation and vulnerability. Contribution of Working Group II to the Sixth Assessment Report of the Intergovernmental Panel on Climate Change (pp. 2369–2410). Cambridge University Press. https://doi. org/10.1017/9781009325844.024
25 Greenpeace Brazil. (2024). *Dia do Fogo completa cinco anos e propriedades que receberam financiamento seguem impunes*. https://www.greenpeace.org/ brasil/blog/dia-do-fogo-completa-cinco-anos-e-propriedades-que-receberam-financiamento-seguem-impunes
26 Marahrens, M. (2022, November 4). Fueling our crises. Transport & Environment. https://www.transportenvironment.org/ uploads/files/Soy_Study_TE_2022_final_ embargoed_Friday_4_Nov-1.pdf
27 Greenpeace. (2025). An Urgent Pre-2030 Action Plan to End Forest Destruction. https://www.greenpeace.org/static/planet4-international-stateless/2025/09/ b14aab9c-cop30-forest-action-plan-proposal-update.pdf
28 United Nations Framework Convention on Climate Change. (2015). Paris Agreement. https://unfccc.int/sites/default/files/ english_paris_agreement.pdf
29 United Nations Framework Convention on Climate Change. (2024, March 15). Report of the Conference of the Parties serving as the meeting of the Parties to the Paris Agreement on its fifth session, held in the United Arab Emirates from 30 November to 13 December 2023. Addendum: Part two: Action taken by the Conference of the Parties serving as the meeting of the Parties to the Paris Agreement at its fifth session. https://unfccc.int/sites/default/ files/resource/cma2023_16a01E.pdf
30 World Resources Institute. (2025, May 20). Global forest loss shatters records in 2024, fueled by massive fires. https://www.wri. org/news/release-global-forest-loss-shatters-records-2024-fueled-massive-fires
31 IBGE. (n.d.). Biome and Vegetation Map, Instituto Brasileiro de Geografia e Estatística, website, accessed March 28 2019 https://ww2.ibge.gov.br/home/presidencia/noticias/21052004biomashtml.shtm
32 Barlow, J., Berenguer, E., Carmenta, R., & França, F. (2019). Clarifying Amazonia’s burning crisis. Global Change Biology, 26(2), 319–321. https://doi.org/10.1111/gcb.14872
33 MapBiomas Project – Collection 4 of MapBiomas Fire, accessed on October 11 2025 through the link: https://plataforma. brasil.mapbiomas.org/en/
34 de Freitas Moura, B. (2024, September 20). Monitoramento mostra que 99% dos incêndios são por ação humana. Agência Brasil. https://agenciabrasil.ebc. com.br/geral/noticia/2024-09/monitoramento-mostra-que-99-dos-incendios-sao-por-acao-humana
35 Silveira, M. V. F., Silva-Junior, C. H. L., Anderson, L. O., & Aragão, L. E. O. C. (2022). Amazon fires in the 21st century: The year of 2020 in evidence. Global Ecology and Biogeography, 31(11), 2274–2286. https:// doi.org/10.1111/geb.13577
36 Alencar, A., Arruda, V., Martenexen, F., Monteiro, N., & Silva, W. (2024, December 9). Fire in the Amazon in 2024: a point off the curve? Technical note. IPAM Amazônia. https://ipam.org.br/wp-content/ uploads/2024/11/NT_Amazonia-Fogo-2024__ ENG.pdf
37 Fundação de Amparo à Pesquisa do Estado de São Paulo. (2025, September). Fire in the Amazon associated with agricultural burning and deforestation. Lab Manager. https:// www.labmanager.com/fire-in-the-amazon-associated-with-agricultural-burning-and-deforestation-29159
38 Alencar, A., Costa da Silva, B, et al. (2024). Panorama do Fogo em Pastagens plantadas no Brasil. Nota Téchnica . MapBiomas. https://brasil.mapbiomas.org/wp-content/ uploads/sites/4/2025/01/Nota_Tecnica_ Fogo-e-Pastagem_2024-1.pdf
39 Mendes, K. (2019, September 11). Brazilian Amazon fires scientifically linked to 2019 deforestation: Report. Mongabay. https:// news.mongabay.com/2019/09/brazilian-amazon-fires-scientifically-linked-to-2019-deforestation-report/
40 Souza Jr, C. (2019, September 2). After the Amazon Fires, What’s Next for Stopping Deforestation?. Skoll Foundation. https:// skoll.org/2019/09/02/after-the-amazonfires-whats-next-for-stopping-deforestation/
41 Schelly, I. H., Rausch, L. L., & Gibbs, H. K. (2021). Brazil’s cattle sector played large role in fires during 2020 moratorium. Frontiers in Forests and Global Change, 4, Article 760853. https://doi.org/10.3389/ ffgc.2021.760853
42 Du, X., Li, L., & Zou, E. (2024). Trade, trees, and lives: The health externalities of international trade-induced deforestation in Brazil. arXiv. https://doi.org/10.48550/ arXiv.2411.13516
43 Instituto do Homem e Meio Ambiente da Amazônia (IMAZON). (2024). Radar Verde Resultados Frigoríficos 2024. https://imazon.org.br/wp-content/uploads/2025/02/ Relatorio-Radar-Verde-Final-22.01-1_compressed-1.pdf
44 Barreto, P., Pereira, R., Brandão Jr., A., & Baima, S. (2017). Os frigoríficos vão ajudar a zerar o desmatamento da Amazônia? Instituto do Homem e Meio Ambiente da Amazônia (IMAZON). ISBN 978-85-86212-94-9
45 Assis, L. F. F. G., Ferreira, K. R., Vinhas, L., Maurano, L., Almeida, C., Carvalho, A., Rodrigues, J., Maciel, A., & Camargo, C. (2019). TerraBrasilis: A spatial data analytics infrastructure for large-scale thematic mapping. ISPRS International Journal of Geo-Information, 8(11), 513. https://doi. org/10.3390/ijgi8110513
46 MapBiomas Project - Collection 10 of the Annual Land Use and Land Cover Maps of Brazil, through the link: https://plataforma. brasil.mapbiomas.org
47 Rizzo, L. V., & Rizzo, M. C. F. V. (2025). Wildfire smoke and health impacts: A narrative review. Jornal de Pediatria, 101(Suppl. 1), S56–S64. https://doi.org/10.1016/j. jped.2024.11.006
48 National Toxicology Program. (2021, December 21). 15th report on carcinogens. U.S. Department of Health and Human Services. https://doi.org/10.22427/ NTP-OTHER-1003
49 Urrutia-Pereira, M., Varanda Rizzo, L., José Chong-Neto, H., & Solé, D. (2021). Impact of exposure to smoke from biomass burning in the amazon rain forest on human health. Jornal Brasileiro de Pneumologia, 47(5). https://doi.org/10.36416/1806-3756/ e20210219
50 Black, C., Tesfaigzi, Y., Bassein, J. A., & Miller, L. A. (2017). Wildfire smoke exposure and human health: Significant gaps in research for a growing public health issue. Environmental Toxicology and Pharmacology, 55, 186–195. https://doi. org/10.1016/j.etap.2017.08.022
51 Vicente, A., Alves, C., Calvo, A. I., Fernandes, A. P., Nunes, T., Monteiro, C., Almeida, S. M., & Pio, C. (2013). Emission factors and detailed chemical composition of smoke particles from the 2010 wildfire season. Atmospheric Environment, 71, 295–303. https://doi.org/10.1016/j. atmosenv.2013.02.026
52 Bazina, L., Deloid, G., Fritzky, L., Lizonova, D., Vaze, N., & Demokritou, P. (2025). Impact of Canadian wildfireemitted particulate matter on THP1 lung macrophage health and function. Environmental Science & Technology, 59(8). https://doi.org/10.1021/ acs.est.4c10304
53 Alves, N. de O., Brito, J., Caumo, S., Arana, A., Hacon, S. de S., Artaxo, P., Hillamo, R., Teinilä, K., Medeiros, S. R. B. de, & Vasconcellos, P. de C. (2015). Biomass burning in the Amazon region: Aerosol source apportionment and associated health risk assessment. Atmospheric Environment, 120, 277–285. https://doi.org/10.1016/j. atmosenv.2015.08.059
54 Zhang, Y., Xu, R., et al. (2025). Respiratory risks from wildfire-specific PM2.5 across multiple countries and territories. Nature Sustainability, 8(5), 474–484. https://doi. org/10.1038/s41893-025-01533-9
55 Amaral, S. S., Costa, M. A. M., Soares Neto, T. G., Costa, M. P., Dias, F. F., Anselmo, E., Dos Santos, J. C., & Carvalho Jr, J. A. de. (2019). CO2, CO, hydrocarbon gases and PM2.5 emissions on dry season by deforestation fires in the Brazilian Amazonia. Environmental Pollution, 249, 311–320. https://doi.org/10.1016/j.envpol.2019.03.023
56 Magalhães, N. d., Evangelista, H., Condom, T., et al. (2019). Amazonian biomass burning enhances tropical Andean glaciers melting. Scientific Reports, 9, 16914. https://doi. org/10.1038/s41598-019-53284-1
57 Chakraborty, S., Devnath, M. K., Jabeli, A., Kulkarni, C., Boteju, G., Wang, J., & Janeja, V. P. (2025). Impact of increased anthropogenic Amazon wildfires on Antarctic sea ice melt via albedo reduction. Environmental Data Science, 4, e18. https://doi.org/10.1017/ eds.2025.1
58 Pope, R. J., Arnold, S. R., Chipperfield, M. P., Reddington, C. L. S., Butt, E. W., Keslake, T. D., Feng, W., Latter, B. G., Kerridge, B. J., Siddans, R., Rizzo, L., Artaxo, P., Sadiq, M., & Tai, A. P. K. (2019). Substantial increases in eastern Amazon and Cerrado biomass burning-sourced tropospheric ozone. Geophysical Research Letters, 47(3), https://doi.org/10.1029/2019GL084143
59 Freire, L. S., Gerken, T., Ruiz-Plancarte, J., Wei, D., Fuentes, J. D., Katul, G. G., Dias, N. L., Acevedo, O. C., & Chamecki, M. (2017). Turbulent mixing and removal of ozone within an Amazon rainforest canopy. Journal of Geophysical Research: Atmospheres, 122(5), 2791–2811. https:// doi.org/10.1002/2016JD026009
60 Butt, E. W., Conibear, L., Smith, C., Baker, J. C. A., Rigby, R., Knote, C., & Spracklen, D. V. (2022). Achieving Brazil’s deforestation target will reduce fire and deliver air quality and public health benefits. Earth’s Future, 10, e2022EF003048. https://doi. org/10.1029/2022EF003048
61 Costa, M. A. M., et al. (2023). Forest fires in the Brazilian Amazon and their effects on particulate matter concentration, size distribution, and chemical composition. Combustion Science & Technology, 195. https://doi.org/10.1080/00102202.2021.201 9229
62 Jang, Y.-W., & Jung, G.-W. (2023). Temporal characteristics and sources of PM2.5 in Porto Velho of Amazon region in Brazil from 2020 to 2022. Sustainability, 15(18), 14012. https://doi.org/10.3390/su151814012
63 Brito, J., Rizzo, L. V., Morgan, W. T., Coe, H., Johnson, B., Haywood, J., Longo, K., Freitas, S., Andreae, M. O., & Artaxo, P. (2014). Ground-based aerosol characterization during the South American Biomass Burning Analysis (SAMBBA) field experiment. Atmospheric Chemistry and Physics, 14, 12069–12083. https://doi.org/10.5194/ acp-14-12069-2014
64 de Moura, F. R., & Machado, P. D. W., et al. (2024). In the line of fire: Analyzing burning impacts on air pollution and air quality in an Amazonian city, Brazil. Atmospheric Pollution Research, 15(4), 102033. https:// doi.org/10.1016/j.apr.2023.102033
65 Fernandes, K. S., Machado, C., Martin, S. T., & Godoi, R. H. M. (2024). Amazon fires are linked to increased respiratory hospitalizations in Manaus: Using artificial neural networks to predict health risks from fire smoke. Chemosphere, 367, Article 143688. https://doi.org/10.1016/j. chemosphere.2024.143688
66 Coker, E. S., Buralli, R., Manrique, A. F., Kanai, C. M., Amegah, A. K., & Gouveia, N. (2022). Association between PM2.5 and respiratory hospitalization in Rio Branco, Brazil: Demonstrating the potential of low-cost air quality sensor for epidemiologic research. Environmental Research, 214(Part 1), 113738. https://doi.org/10.1016/j. envres.2022.113738
67 Instituto Nacional de Pesquisas da Amazônia. (2024, September 11). Núcleo de pesquisa do Inpa em Roraima lança relatório sobre qualidade do ar em Boa Vista. https://www.gov.br/inpa/pt-br/assuntos/noticias/nucleo-de-pesquisa-do-inpaem-roraima-lanca-relatorio-sobre-qualidade-do-ar-em-boa-vista
68 Santos, M., Fagundes Mendes, E., Caumo, S., & Oliveira Junior, E. (2025). Análise da qualidade do ar em 15 municípios de Mato Grosso: Impactos potenciais na saúde humana [Analysis of air quality in 15 municipalities of Mato Grosso: Potential impacts on human health]. Revista Brasileira de Climatologia, 36, 728–749. https://doi. org/10.55761/abclima.v36i21.18693
69 Almeida, D., Gomes, A., Batalha, S., Silva, G., Junior, L., Martins, E., & Raiol, A. (2023). Monitoring atmospheric pollution in Central Amazon: Case study carried out in Santarém City – PA. Journal of Hyperspectral Remote Sensing, 13, 187–201. https://doi.org/10.29150/jhrs.v13.2.p187-201
70 Phillips, T. (2024, August 26). Brazil minister declares ‘war’ with fire as smoke cloaks Brasília and São Paulo. The Guardian. https://www.theguardian.com/world/article/2024/aug/26/brazil-minister-declareswar-with-fire-as-smoke-cloaks-brasiliaand-sao-paulo
71 Magalhães Neto, N. de, Evangelista, H., Condom, T., Rabatel, A., & Ginot, P. (2019). Amazonian biomass burning enhances tropical Andean glaciers melting. Scientific Reports, 9, Article 16914. https://doi. org/10.1038/s41598-019-53284-1
72 Campanharo, W. A., Morello, T., Christofoletti, M. A. M., & Anderson, L. O. (2022). Hospitalization due to fire-induced pollution in the Brazilian Legal Amazon from 2005 to 2018. Remote Sensing, 14(1), 69. https://doi.org/10.3390/rs14010069
73 Ye, T., Guo, Y., Chen, G., Yue, X., Xu, R., Zanotti Stagliorio Coêlho, M. de S., et al. (2021). Risk and burden of hospital admissions associated with wildfire-related PM2.5 in Brazil, 2000–15: a nationwide time-series study. The Lancet Planetary Health, 5(9), e599–e607. https://doi. org/10.1016/S2542-5196(21)00215-9
74 Galvão, M. F. de O., Alves, N. de O., et al. (2018). Biomass burning particles in the Brazilian Amazon region: Mutagenic effects of nitro and oxy-PAHs and assessment of health risks. Environmental Pollution, 233, 960–970. https://doi.org/10.1016/j. envpol.2017.09.068
75 Alves, N. O., Vessoni, A. T., et al. (2017). Biomass burning in the Amazon region causes DNA damage and cell death in human lung cells. Scientific Reports, 7(1), 10937. https://doi.org/10.1038/ s41598-017-11024-3
76 nternational Agency for Research on Cancer. (2016). IARC monographs on the evaluation of carcinogenic risks to humans: Outdoor air pollution (Vol. 109).
77 Oliveira, I. N. de, Oliveira, B. F. A. de, Silveira, I. H. da, Machado, L. M. G., Villardi, J. W. R., & Ignotti, E. (2023). Air pollution from forest burning as environmental risk for millions of inhabitants of the Brazilian Amazon: An exposure indicator for human health. Cadernos de Saúde Pública, 39(6). https://doi.org/10.1590/0102-311XEN131422
78 dos Santos Gonçalves, K., Siqueira, A. S. P., Albuquerque de Castro, H. & de Souza Hacon, S. (2014). Indicador de vulnerabilidade socioambiental na Amazônia Ocidental: O caso do município de Porto Velho, Rondônia, Brasil. Ciência & Saúde Coletiva, 19(9). https://doi. org/10.1590/1413-81232014199.14272013
79 Albuquerque Sant’Anna, A. A., & Rocha, R. (2020). Health impacts of deforestationrelated fires in the Brazilian Amazon (Nota Técnica No. 11). Instituto de Estudos para Políticas de Saúde (IEPS). https://dataservercoids.inpe.br/queimadas/queimadas/ Publicacoes-Impacto/material3os/2020_ Santana_etal_Deforestation_Related_ IEPS_DE3os.pdf
80 Aguilera, R., Corringham, T., Gershunov, A., Leibel, S., & Benmarhnia, T. (2021). Fine particles in wildfire smoke and pediatric respiratory health in California. Pediatrics, 147(4), e2020027128. https:// doi.org/10.1542/peds.2020-027128
81 Rocha, R., Albuquerque Sant’Anna, A. A. (2022). Winds of fire and smoke: Air pollution and health in the Brazilian Amazon. World Development, 151, 105722. https:// doi.org/10.1016/j.worlddev.2021.105722
82 Ribeiro, M. R., Lima, M. V. M., Ilacqua, R. C., Savoia, E. J. L., Alvarenga, R., Vittor, A. Y., Raimundo, R. D., & Laporta, G. Z. (2024). Amazon wildfires and respiratory health: Impacts during the forest fire season from 2009 to 2019. International Journal of Environmental Research and Public Health, 21(6), 675. https://doi.org/10.3390/ ijerph21060675
83 Requia, W. J. (2024). Fires in Brazil: health crises and the failure of government action. The Lancet Regional Health - Americas, 39100913. https://doi.org/10.1016/j. lana.2024.100913
84 Barcellos, C., Xavier, D. et al. (2019). Queimadas na Amazônia e seus impactos na saúde: A incidência de doenças respiratórias no sul da Amazônia aumentou significativamente nos últimos meses3º Informe técnico do Observatório de Clima e Saúde. Instituto de Comunicação e Informação Científica e Tecnológica em Saúde (ICICT), Fundação Oswaldo Cruz (Fiocruz). https://climaesaude.icict.fiocruz. br/sites/climaesaude.icict.fiocruz.br/files/ informe_observatorio_queimadas.pdf
85 Alves, L. (2020). Amazon fires coincide with increased respiratory illnesses in indigenous populations. The Lancet Respiratory Medicine, 8(11), e84. https://doi.org/10.1016/ S2213-2600(20)30421-5
86 Teixeira, F. (2019, September 2). Children struggle to breathe as smoke chokes Amazon city. Thomson Reuters Foundation. https://news.trust.org/ item/20190902192659-y8bp5
87 Nawaz, M. O., Henze, D. K., et al. (2020). Premature deaths in Brazil associated with long-term exposure to PM2.5 from Amazon fires between 2016 and 2019. GeoHealth. https://doi.org/10.1029/2020GH000268
88 Machado-Silva, F., Libonati, R., et al. (2020). Drought and fires influence the respiratory diseases hospitalizations in the Amazon. Ecological Indicators, 109, 105817. https:// doi.org/10.1016/j.ecolind.2019.105817
89 Smith, L. T., Aragão, L. E. O. C., Sabel, C. E., & Nakaya, T. (2014). Drought impacts on children’s respiratory health in the Brazilian Amazon. Scientific Reports, 4, Article 3726. https://doi.org/10.1038/srep03726
90 Sheehan, D., Mullan, K., West, T. A. P., & Semmens, E. O. (2024). Protecting life and lung: Protected areas affect fine particulate matter and respiratory hospitalizations in the Brazilian Amazon biome. Environmental and Resource Economics, 87(1), 45–87. https://doi.org/10.1007/ s10640-023-00823-5
91 Reddington, C. L., Butt, E. W., Ridley, D. A., Artaxo, P., Morgan, W. T., Coe, H., & Spracklen, D. V. (2015). Air quality and human health improvements from reductions in deforestation-related fire in Brazil. Nature Geoscience, 8(10), 768–771. https:// doi.org/10.1038/ngeo2535
92 University of Chicago. (2023). Air Quality Life Index. Energy Policy Institute at the University of Chicago. https://aqli.epic.uchicago.edu/
93 Lei no. 9.985. (2020, July 18). Retrieved from: https://www.planalto.gov.br/ccivil_03/ leis/l9985.htm
94 Sinimbú, F. (2025, July 27). Brazilian system of Nature Conservation Units marks 25 years. Agência Brasil. https://agenciabrasil.ebc.com.br/en/meio-ambiente/noticia/2025-07/brazilian-system-nature-conservation-units-marks-25-years
95 U.S. Environmental Protection Agency. (2025). Air Monitoring Station HAP Data Rules and Calculations. ECHO. https://echo.epa.gov/help/ecatt/ air-monitoring-station-data-calculations
96 U.S. Environmental Protection Agency. (n.d.). Explanation of data handling requirements and forms of the national ambient air quality standards for particulate matter. Technology Transfer Network. https:// archive.epa.gov/ttn/naaqsimp/web/html/ fs122398.html
97 Laboissière, P. (2024, August 27). Rondônia state declares emergency over forest fires. Agência Brasil. https://agenciabrasil.ebc. com.br/en/geral/noticia/2024-08/rondonia-state-declares-emergency-over-forest-fires
98 NASA. (n.d.). Fire Information for Resource Management System (FIRMS) web services. NASA Earth Observing System Data and Information System (EOSDIS). Retrieved October 7, 2025, from https://firms.modaps. eosdis.nasa.gov/web-services
99 Shen, S., Li, C., van Donkelaar, A., Jacobs, N., Wang, C., & Martin, R. V. (2024). Enhancing global estimation of fine particulate matter concentrations by including geophysical a priori information in deep learning. ACS ES&T Air, 1(5), 332–345. https://doi. org/10.1021/acsestair.3c00054
100 Lei no. 12.651. (2012, May 25). Retrieved from: https://www.gov.br/mj/pt-br/acesso-a-informacao/atuacao-internacional/ legislacao-traduzida/lei-no-12-651-de-25de-maio-de-2012-senasp_eng-docx.pdf
101 Decreto no. 6.514. (2008, July 2). Retrieved from: https://www.planalto.gov.br/ccivil_03/_ato2007-2010/2008/decreto/d6514. htm
102 Supremo Tribunal Federal. ADPF 857, judgement July 10, 2025. https://portal.stf.jus.br/ processos/detalhe.asp?incidente=6205663
103 Supremo Tribunal Federal. ADPF 746, judgement July 10, 2025. https://portal.stf.jus.br/ processos/detalhe.asp?incidente=6013147
104 Supremo Tribunal Federal. ADPF 743, judgement November 14, 2025. https:// portal.stf.jus.br/processos/detalhe. asp?incidente=6007933
105 Supremo Tribunal Federal. (2024, November 12). Referendo na medida cautelar na arguição de descumprimento de preceito fundamental 743 distrito federal. https:// portal.stf.jus.br/processos/downloadPeca. asp?id=15373478360&ext=.pdf
106 Supremo Tribunal Federal. (2025, April 28). STF determina que União desaproprie terras alvo de incêndio ou desmatamento ilegal. https://noticias.stf.jus.br/ postsnoticias/stf-determina-que-uniao-desaproprie-terras-alvo-de-incendio-ou-desmatamento-ilegal/
107 Resolução no. 5 (1989, June 15). Retrived from: https://www.ibama.gov.br/sophia/ cnia/legislacao/MMA/RE0005-150689.PDF
108 Resolução no. 3 (1990, June 28). Retrived from: https://www.ibram.df.gov.br/images/ resol_03.pdf
109 Secretaria Nacional de Meio Ambiente Urbano e Qualidade Ambiental. (n.d.). Revisão da Resolução Conama n° 491/2018. https://www.gov. br/mma/pt-br/assuntos/noticias/conama-aprova-prazos-para-novos-padroes-de-qualidade-do-ar/copy_of_ ApresentaonoConamaAdalbertoMaluf.pdf
110 Resolução no. 506 (2024, July 5). Retrived from: https://conama.mma.gov.br/?option=com_sisconama&task=arquivo. download&id=827
111 Ministério do Meio Ambiente e Mudança do Clima. (2025, May 29). Conama aprova prazos para novos padrões de qualidade do ar. https://www.gov.br/mma/pt-br/assuntos/ noticias/conama-aprova-prazos-para-novos-padroes-de-qualidade-do-ar
112 Lei no. 14.850. (2024, May 2). Retrieved from: https://www.planalto.gov.br/ccivil_03/_ato2023-2026/2024/lei/L14850.htm
113 Maluf, A. (2024, n.d.). Revisão da Resolução Conama n° 491/2018, Padrões Nacionais de Qualidade do Ar Texto Aprovado CTQA e validado pela CTAJ. [PowerPoint slides]. Secretaria Nacional de Meio Ambiente Urbano e Qualidade Ambiental. https:// www.gov.br/mma/pt-br/assuntos/noticias/conama-aprova-prazos-para-novospadroes-de-qualidade-do-ar/copy_of_ ApresentaonoConamaAdalbertoMaluf.pdf
114 Ministério do Meio Ambiente e Mudança do Clima. (2025, August 8). No Dia Interamericano da Qualidade do Ar, MMA reforça compromisso com medidas para garantir ar limpo à população. https://www. gov.br/mma/pt-br/noticias/no-dia-interamericano-da-qualidade-do-ar-mma-reforca-compromisso-com-medidas-para-garantir-ar-limpo-a-populacao
115 World Health Organization. (2021). WHO global air quality guidelines: Particulate matter (PM2.5 and PM10), ozone, nitrogen dioxide, sulfur dioxide and carbon monoxide (ISBN 978-92-4-003443-3). https://iris. who.int/handle/10665/345329
116 AirGradient. 2025. https://www.airgradient. com/outdoor/ . Accessed 16/10/2025
117 PurpleAir. (n.d.). PurpleAir Classic - Air Quality Monitor. https://www2.purpleair. com/products/purpleair-pa-ii?srsltid=AfmBOooa-s0In7wRQZV2inZyYHR-erWAY_5prl4g74Eshp_9WO0v1gUM
118 AtmoTube. 2025. https://atmotube.com/ atmotube-pro . Accessed 16/10/2025
119 PurpleAir. 2025. https://www2.purpleair. com/products/list Accessed 16/10/2025
120 Barkjohn, K. K., Holder, A. L., Frederick, S. G., & Clements, A. L. (2022). Correction and accuracy of PurpleAir PM2.5 measurements for extreme wildfire smoke. Sensors, 22(24), 9669. https://doi.org/10.3390/ s22249669
121 Ministério do Desenvolvimento Regional. (2025, April 8). Release Amacro. Superintendência do Desenvolvimento da Amazônia. https://www.gov.br/sudam/pt-br/ release-amacro
122 Craveira, K. de O., & da Silva, F. B. A. (2024). Amacro e frentes pioneiras na Amazônia: Desmatamento, psicosfera e questão fundiária. Revista Geopolítica Transfronteiriça, 8(2).
123 Craveira, K., Rodrigues, J. A., Lemos, F., & Libonati, R. (2023). AMACRO: Estimativas de desmatamento e área queimada (20122022) – Nota técnica 01/2023. https://doi. org/10.13140/RG.2.2.18018.91846
124 Jornal Nacional. (2023, August 5). Missão do Greenpeace no Amazonas flagra queimadas perto de reservas indígenas. G1 – Jornal Nacional. https://g1.globo.com/jornal-nacional/noticia/2023/08/05/missao-do-greenpeace-no-amazonas-flagra-queimadas-perto-de-reservas-indigenas.ghtml
125 Butler, R. A. (2019, August 28). Greenpeace divulga fotos impactantes dos incêndios na Amazônia. Mongabay Brasil. https://brasil.mongabay.com/2019/08/greenpeace-divulga-fotos-impactantes-dos-incendios-na-amazonia/
126 MapBiomas Amazonía Project – Collection 10 of annual land cover and land use maps, accessed on October 11 2025 via link: https://plataforma.brasil.mapbiomas.org/
127 Skidmore, M. E., Moffette, F., Rausch, L., Christie, M., Munger, J., & Gibbs, H. K. (2021). Cattle ranchers and deforestation in the Brazilian Amazon: Production, location, and policies. Global Environmental Change, 68, 102280. https://doi.org/10.1016/j. gloenvcha.2021.102280
128 IBGE. (2025). Cidades e Estados, Instituto Brasileiro de Geografia e Estatística, website, accessed Sep 12 2025. https://www. ibge.gov.br/cidades-e-estados/
129 Agence France-Presse. (2024, August 21). Brazilians ‘struggling to breathe’ as Amazon burns. Le Monde. https://www.lemonde.fr/ en/international/article/2024/08/21/brazilians-struggling-to-breathe-as-amazonburns_6719069_4.html
130 Agence France-Presse. (2019, August 25). Thick smoke chokes Brazil’s north as Amazon fires rage. France 24. https://www. france24.com/en/20190825-thick-smokechokes-brazil-s-north-as-amazon-firesrage
131 Hofmeister, N. (2022, May 4). Surge in deforestation as Brazil pushes to pave a forgotten Amazon road. Mongabay. https:// news.mongabay.com/2022/05/surge-in-deforestation-as-brazil-pushes-to-pave-a-forgotten-amazon-road/
132 Kimbrough, L. (2021, June 9). New areas of primary forest cleared in Brazil’s ‘lawless’ Lábrea. Mongabay. https://news.mongabay. com/2021/06/new-areas-of-primary-forestcleared-in-brazils-lawless-labrea/
133 Meyerfeld, B. (2022, September 30). Labrea, the end of the road for the Amazon forest. Le Monde. https://www.lemonde.fr/en/ summer-reads/article/2022/09/30/labreathe-end-of-the-road-for-the-amazon-forest_5998722_183.html
134 Ionova, A. (2023, July 27). In Brazil’s Amazon, a ‘new agricultural frontier’ threatens protected lands. Mongabay. https://news.mongabay.com/2023/07/ in-brazils-amazon-a-new-deforestation-frontier-threatens-protected-lands/
135 Berg, R. C. (2023, June 22). Cattle supply chains and deforestation of the Amazon. Center for Strategic and International Studies. https://www.csis.org/analysis/cattle-supply-chains-and-deforestation-amazon
136 AirGradient. (n.d.). Calibration Algorithms. https://www.airgradient.com/ documentation/calibration-algorithms/
137 Greenpeace Brazil. (2025). JBS cooking the planet. https://cozinhandooplaneta.org.br/ en/
138 Greenpeace International (2021). Making mincemeat of the pantanal. https://www.greenpeace.org/ international/publication/46577/ pantanal-brazil-fires-jbs-meat-cattle/
139 Butt, E. W., Conibear, L., Reddington, C. L., Darbyshire, E., Morgan, W. T., Coe, H., Artaxo, P., Brito, J., Knote, C., & Spracklen, D. V. (2020). Large air quality and human health impacts due to Amazon forest and vegetation fires. Environmental Research Communications, 2(9), 095001. https://doi. org/10.1088/2515-7620/abaf86
140 Butt, E. W., Conibear, L., Knote, C., & Spracklen, D. V. (2021). Large air quality and public health impacts due to Amazonian deforestation fires in 2019. GeoHealth, 5(7), e2021GH000429. https:// doi.org/10.1029/2021GH000429
141 Secretaria Especial de Saúde Indígena (SESAI). (n.d.). População indígena. Ministério da Saúde. Accessed on October 29, 2025, from https://infoms.saude.gov.br/ extensions/sesai_pop_indigena/sesai_pop_ indigena.html
142 Operação Amazônia Nativa (OPAN). (n.d.). Relatório Institucional 2023. https:// amazonianativa.org.br/wp-content/ uploads/2024/11/AF-OPAN-relatorio-2023digital.pdf
143 Costa, W. D. (2017, August). Os patrões do Purus: elites fundiárias, poder e novas dinâmicas territoriais no sul do Amazonas (Tese de Doutorado – Programa de Pósgraduação em Antropologia Social, Universidade Federal do Amazonas, Manaus). https://tede.ufam.edu.br/bitstream/tede/7230/10/Tese_WillasCosta_ PPGAS.pdf
Glossary
Air pollutant An unwanted substance found in the air in the form of a solid particle, a liquid droplet or a gas. The substance may be hazardous, harmful to human health if inhaled or damaging to the environment. Prominent examples are PM2.5, the NOx group and SO2.
COMIF EN: National Committee on Integrated Fire Management
PT: Comitê Nacional de Manejo Integrado do Fogo
CONAMA EN: National Council for the Environment
PT: Conselho Nacional do Meio Ambiente
MMA EN: Ministry of Environment and Climate
PT: Ministério do Meio Ambiente e Mudança do Clima
MonitorAr National Air Quality Management System
NO2 Nitrogen dioxide. A trace gas that is produced in all combustion processes. It converts from and to NO. The amount of NO2 in the atmosphere is commonly used as a proxy to assess the health impact of the whole NO x group.
NO x Nitrogen oxides. A generic term for NO and NO2, a group of trace gases that are harmful to human health.
PNQAr
EN: National Air Quality Policy
PT: Plano Nacional de Qualidade do Ar
Fine particulate matter / fine particles.
PM1: Solid particles with an aerodynamic diameter of less than 1µm (i. e. small dust particles).
PM2.5: Solid particles with an aerodynamic diameter of less than 2.5µm (i. e. small dust particles). They are so small that they can pass from the lungs into the bloodstream, affecting the entire cardiovascular system and causing a range of health impacts.
PM10: Solid particles with an aerodynamic diameter of less than 10µm (i. e. small dust particles).
Due to their small size, the particles stay airborne for a long time and can travel hundreds or thousands of kilometres. Fossil fuel combustion emits PM2.5 directly, as fly ash and other unburned particles, and contributes to PM2.5 indirectly through emissions of gaseous pollutants (particularly SO2 and NOx), which form PM2.5 in the atmosphere. PM2.5 is harmful to human health and thus an air pollutant.
PM1
PM2.5
PM10
PNMIF EN: National Policy on Integrated Fire Management
PT: Política Nacional de Manejo Integrado do Fogo
PRONAR EN: National Air Quality Control Program
PT: Programa Nacional de Controle da Qualidade do Ar
SO x Sulfur oxides, a group of chemical compounds containing sulfur and oxygen, including Sulfur Dioxide (SO2) and Sulfur Trioxide (SO3). These compounds are trace gases produced naturally and by industrial processing of materials that contain sulfur, including burning coal in power stations and processing of some mineral ores. Human sources of SO2 far exceed all natural sources even when accounting for volcanic activity. SOx gases react with other substances to form harmful compounds, such as sulfuric acid (H2SO4), sulfurous acid (H2SO3) and sulfate particles and it is therefore a cause of acid rain and particulate matter pollution.
Sisfogo EN: National Fire Information System
PT: Sistema Nacional de Informações sobre o Fogo
SISNAMA EN: National Environmental System
PT: Sistema Nacional do Meio Ambiente
STP EN: Federal Supreme Court
PT: Supremo Tribunal Federal