power shift
w A’s electrified future
Published: October 2025
Author: Springmount Advisory (ABN: 11 678 767 363)
Contact: info@springmountadvisory.com.au
Special thanks to: Sustainable Energy Now for their assistance and advice, in particular Fraser Maywood, Chair, and Paul Caston, Committee Member.
This document is intended for general informational purposes only. The analysis in this report was commissioned by and based on a WA 1.5°C aligned emission reduction model provided by Greenpeace Australia Pacific (GPAP), and was prepared by Springmount Advisory. The modelling on which this report relies was commissioned by Greenpeace Australia Pacific and was prepared by an independent third party with specialist expertise in energy system modelling.
Greenpeace is a global environmental network dedicated to fostering a world that can sustain life in all its magnificent diversity. We are fully independent, accepting no funding from governments, businesses, or political parties worldwide. Greenpeace Australia Pacific, headquartered in Sydney and with offices in Melbourne and Perth, is an autonomous entity with more than 1.2 million people engaged in our network.
Springmount Advisory is a specialist policy and research company that analyses the economic opportunities for Australia from building a clean and just economy. Our research provides insight reports to drive policy change that are underpinned by strong analysis of financial, job and community benefits of driving rapid shifts to a more sustainable future. Analysis and recommendations expressed in this report are prepared in good faith and based on Springmount Advisory’s expertise in transition pathways.
Springmount Advisory and Greenpeace Australia Pacific Limited acknowledge the Traditional Owners of Country throughout Australia and the Indigenous peoples of the Pacific Islands, and recognises their continuing connection to land, waters, and culture. We pay our respects to their Elders past and present.
e xecutive s umm A ry
western Australia (wA) has the skills, industrial know-how and resourcing to slash emissions and set itself up to become a major exporter of green commodities. in the global effort to limit temperature rise to 1.5°C and in order to meet the Australian Government’s emissions reduction commitments, wA has a leading role to play.
WA can achieve a 90% emissions reduction across four major sectors of the economy by 2050 (from 2024 levels) before factoring in additional reductions from land use, land use change and forestry (LULUCF). This can be done through a comprehensive program to tackle state wide emissions with deployment of proven technology already being rolled out globally - as shown by Greenpeace Australia Pacific’s (GPAP’s) new, WA specific, 1.5°C reduction model.
Setting science-backed emissions reduction targets for WA will cut the cost of energy for households and industry through a program of large-scale renewable energy deployment and electrification, while phasing out first coal then
wA’s emissions can be rapidly cut with existing technology
SourCe: GPAP Model -1.5 degree scenario; LULUCF from SERS 2050 estimate + NGGI historic emissions
gas generation. Sending a clear policy signal that expensive and polluting fossil fuels are being phased out will in turn attract investment into new, clean industries that will drive WA’s economy forward in the decades to come.
WA’s emissions reduction potential is grounded in the exceptional renewable energy resources that the state can harness and the industrial and workforce experience in building resource projects at speed and scale. These will be essential in accelerating the renewable build out, calculated by the model, of a total of 35GW of renewables (25GW utility scale plus 10GW rooftop solar) and 10GW of storage capacity to meet a predicted 88TWh of demand by 2050.
The increase in total energy demand in WA out to 2050 reflects the strength of the economy, and new demand for clean energy created by the electrification of industry and transport. In parallel, a dedicated policy suite will support emissions reduction in the agriculture sector. The GPAP model shows that the four major sectors of WA’s economy have opportunities to decarbonise over time, when supported with the right incentives and an enabling policy framework.
WA has technology and knowhow WA’s emissions can be rapidly cut with existing technology
An inve S tment in w A’ S future
The model calculates that driving renewable energy and storage growth to deliver emissions cuts of this scale will require an investment of $74.3 billion over the next 25 years. This is roughly a third of the investment that has flowed to developing WA’s LNG export facilities in recent decades.
wA’s lnG build cost is triple the projected renewable build out cost to 2050
WA’s LNG build cost 3x more than RE build out
GPAP Model (1.5 degree scenario) and ACCR LNG report (2023) and OGJ (Nov 16, 2021) $250 $200
$150
$100
$50
$0
Setting high ambition targets for emissions reduction, and renewable energy build-out, and introducing the policies to make it a reality is an investment in the state’s future success. The model estimates 74TWh of electricity generation will be needed by 2042 (en route to 88TWh by 2050), which broadly aligns to the SWIS Demand Assessment base case1
Successful growing economies will increasingly be defined by high levels of renewable deployment and rapid cuts to emissions. Over 84% of global GDP is covered by net zero commitments, with demand for emissions-intensive products expected to contract accordingly.2 If WA exploits its advantages to take on this opportunity, it can
not only decarbonise existing industries but also set itself up to grow the clean industries of the future and become the foundation of Australia’s renewable and export powerhouse.
This will enable the state to capture an outsized share of the green commodity export opportunity calculated to be as much as $333 billion by 20503 and $987 billion by 2060. This transition will generate six to eight times more revenues than those typical from Australian fossil fuel exports while supporting up to a 9.6% reduction in global emissions.4
t he ri S k S of del Ay
The WA Government has yet to decide on the key policy infrastructure it will put in place to reach net zero, and because of this indecision, coupled with the rapid expansion of the LNG sector, the state’s emissions have been increasing rather than declining.
The state is currently out of step with the rest of the country, with WA being the only state to increase emissions between 2005 (baseline) and 2023. Despite the commendable plan to exit coal-fired power generation by 2030, the build-out of largescale renewable energy projects has been lagging, although recent announcements suggest that a course correction on this front is now underway.
With a new national emissions reduction target now locked in, now is the perfect time for WA to set a clear new direction that positions WA for increased prosperity in a decarbonising world.
An ambitious emissions reduction strategy will help mitigate the state’s dependence on high-cost fossil fuels and defuse the major risk facing the state from the rapid changes in global demand and supply for WA’s two major exports, iron ore and LNG.
Major LNG consumers like China and Japan are importing less LNG for domestic consumption, while new markets like Pakistan have pivoted hard
1 Ex E cutiv E Summary
to renewable energy due to the high cost of LNG. The risk is being realised already with Federal Treasury predicting a $16 billion (4%) decline in national resource and energy export earnings between 2024–25 and 2025-265, and a forecast that the value of Australia’s coal and gas exports will plummet by 50% over the next five years to 20306
Concurrently, the dependence on China as the primary buyer of Australian iron ore is a growing risk, as demonstrated by the consolidation of iron purchasing by China Mineral Resources Group and the development of competitor iron ore regions, most notably the Simandou iron ore project in Guinea.
d iver S ify A nd de CA r B oni S e to S e C ure P ro SP erity
Diversification and decarbonisation will set the course for the State’s future prosperity and environmental legacy. Key decisions being made now on energy and investment priorities will set in train where investment dollars and skilled workers flow, and whether key infrastructure and trade relationships are established that either benefit incumbent, emission-heavy industries that have a limited life or embrace new opportunities in renewable-based commodities and products.
This report outlines a clear and viable pathway to transition the WA economy. It shows how to do so in alignment with international climate commitments to keep global temperature rise within 1.5°C. It maps a trajectory that does not rely on opening new gas fields or other fossil fuel developments, in line with calls from the International Energy Agency7 and many more.
This is the plan for how WA can avoid the risks of energy insecurity and stranded assets, and build a prosperous, resilient and clean future as Australia’s renewable energy powerhouse.
k ey re C ommend Ation S
wA needs to drive ongoing investment and set strong policy settings to decarbonise its electricity, industry, transport and agriculture sectors:
• Establish clear and ambitious emissions reduction targets that align with national targets
• Implement policies to accelerate the build out of renewable energy at speed and scale to meet existing needs and fully cover forecast industrial growth
• Set an industrial electrification and decarbonisation strategy to drive rapid emissions reductions across industry, including:
an electrification plan and staged phase out for LNG facilities
an electrification schedule for alumina refineries
production targets for green ammonia, green iron and clean mineral processing
• Introduce supportive policies to drive rapid decarbonisation of transport and agriculture.
b A ckground 2
Australia has an abundance of resources, from sunshine to ores, which means with the right support this decade - it can emerge from the global energy transition as a low-emission, renewable energy powerhouse.8 western Australia (wA) has exceptional renewable energy resources, a history of building resource projects at scale and is home to many of the industries that will power this green future. wA is perfectly positioned to seize the opportunities created by the global energy transition - but realising that success means wA must invest in decarbonising its economy at speed and scale.
w A i S the only S tAte with in C re AS in G emi SS ion S
Australia has pledged to decrease greenhouse gas emissions by 43% (below 2005 levels) by 2030, 62 to 70% by 2035 and to reach net zero by 2050. To achieve this, all states need to work together. National emissions peaked in 2006 and by 2023 had reduced by ~21%9
wA emissions are an exception with increases from a 2005 baseline
SourCe: Australia’s National Greenhouse Accounts | State and Territory Greenhouse Gas Inventories 2023
However, the story in WA is different, while WA sits in the middle of the pack in terms of contribution to Australia’s overall greenhouse gas emissions, it is the only state heading in the wrong direction, with emissions growing 17% from 2005 to 2023. This is compounded if ‘offsets’ from the less reliable and more variable Land Use, Land Use Change and Forestry (LULUCF) sources are removed, with WA recording ~49% increase in emissions from 2005 (compared to -8.6% for the rest of Australia).
w h At i S drivin G emi SS ion S G rowth?
Across the five sectors reported by the Federal Government, energy production is clearly the primary driver of emission growth in WA - with a 64% increase in emissions between 2004-05 and 2022-23.10 Agriculture, industrial processes and waste emissions, meanwhile, are largely flat. LULUCF is a variable contributor; however, this data is less reliable and often changes with definitions and methodology11 .
WA emissions are an exception with increases from a 2005 baseline
2004-05 2022-23
2 background
Energy use is WA’s largest source of emissions
energy use is wA largest source
SourCe:
Australia’s National Greenhouse Accounts | State and Territory Greenhouse Gas
Inventories 2023
WA’s energy emissions are produced by fossil fuel combustion for:
• energy industries - this includes coal-fired power stations and gas-powered generation (GPG) supplying electricity for the grid, and off-grid/self supply, e.g. for mining and LNG: increasing 54% 2004-05 to 2022-23
• transportation - across road, rail, air and sea: increasing 47% 2004-05 to 2022-23
• manufacturing industries and construction - primarily for processing and industrial heat: this has remained a significant contributor but with little change from 2004-05 to 2022-23.
Fugitive emissions are also part of energy emissions - there is a clear bump in these over the last 10 years in particular.
Energy industries dwarf emissions from other energy emitting sources
energy industries dwarf emissions from other energy emitting sources
SourCe:
Australia’s National Greenhouse Accounts | State and Territory Greenhouse Gas
Inventories 2023
lnG production is the biggest single contributor to emissions in wA
LNG export facilities are the largest users of gas in Australia. In 2024, WA LNG production emitted around 25Mt CO2-e12 - that’s 55% of WA industrial emissions, 25% of WA total emissions and just under 8% of Australia’s emissions. This has grown from roughly 6% of WA’s emissions in 2005,13 an increase of 467% to 2024 that is undermining progress in other sectors and states.
w A CA n tA ke A m ASS ive S h A re of Au S tr A li A’ S G reen future o PP ortunity
Australia has a huge opportunity to be a frontrunner in the low-carbon trading economies of the future, but it needs to act fast to build green industries at scale to compete. Rapid and targeted action now will enable Australia to capture a green commodity export opportunity of up to $333 billion by 205014 and $987 billion by 2060 - generating six to eight times larger revenues than those typical from Australian fossil fuel exports while also supporting up to 9.6% reduction in global emissions.15
Green iron is a key export opportunity for WA. With support, the state could produce 122 million tonnes of green iron per year by 2040 to deliver $380 billion in GDP, $350 billion in real income and $167 billion in Commonwealth and WA state taxation.16 In a low-carbon trading economy, processing of ores close to mine sites is key and WA has both rich reserves and high-quality renewable resources to be harnessed.
In parallel, tariffs are driving trade wars and WA is increasingly exposed to demand fluctuations for two of its major exports: iron ore and LNG. Markets are also shifting as trade partners commit to net zero climate targets and mechanisms such as Carbon Border Adjustment Mechanisms are being
introduced. These will wipe hundreds of billions off export values with Government estimates forecasting a 4% decline in resource and energy export earnings nationally, from $385 billion (2024–25) to $369 billion (2025–26), and still further to $352 billion (2026–27)17. In late 2025, the Federal Treasury predicted the value of Australia’s coal and gas exports plummeting by 50% to 203018
w here i S w A At ri G ht now?
While it remains the only state without any legislated emissions reduction target, WA is acting on the renewables opportunity and already has solar panels on more than one in three households, generating up to 64% of the state’s electricity needs in the middle of the day19
In 2022, the WA Government committed to cutting emissions from its own operations by 80% and to retire state-owned coal-fired electricity generation by 2030. This was backed by a $3.8 billion investment in new green power infrastructure. In the same year, the government announced a $22.5 million Green Energy Approvals Initiative to accelerate renewable energy and critical minerals projects. It also released the SWIS Demand Assessment (SWISDA) outlining electricity demand on the South West Interconnect System (SWIS) in a green future20, with $126 million to deliver the first stage of network investments.
In 2023 the WA Government created Sectoral Emissions Reduction Strategies (SERS) for electricity, industry, transport, agriculture and land, buildings and waste to outline how it will transition to net zero by 2050.21 Shortly after, WA made an agreement with the Federal Government to add 1.1 GW of new energy storage under the Capacity Investment Scheme (CIS), alongside 6.5 TWh of wind and solar projects. It also announced - but is yet to expend - a $3 billion Rewiring the Nation deal with concessional finance from Clean Energy Finance Corporation to facilitate major grid upgrades and unlock future renewable energy projects, particularly for the North West Interconnected System (NWIS) and broader Pilbara region.
2 background
In 2025, Made in WA22 outlined the government’s clean energy plan for WA to “enable it to become a renewable energy powerhouse”. The budget included measures to decarbonise transport (e.g. electric bus fleets), invest in green industry (e.g. manufacturing buses, ferries, batteries, poles and wires), grid upgrades (with renewables-expanding transmission projects) and electrification (e.g. residential battery schemenow available as one-off rebates and no interest loans). At the same time, the EPA was stripped of its power to assess greenhouse gas emissions on big polluting projects - instead leaving this regulation to the Federal Safeguard Mechanism. Investment is being used to drive local manufacturing as well as creating an Investment Attraction Fund to support critical minerals, hydrogen and carbon capture and storage
projects. Building from the SWISDA, the WA Government also released a SWIS Transmission Plan outlining upgrades to the State’s main power grid and boosting local content.
Clim Ate w A rmin G i S A lre A dy im PAC tin G w A, C o S tin G live S A nd the e C onomy
Record-high emissions are linked to unprecedented extreme land and sea heat and heatwaves, increases in the frequency of vector-borne diseases and natural disasters23 WA is on the frontline of serious climate impacts in a warming world, already one of the most fire-prone regions on the planet, its fire seasons have lengthened and rainfall decreased over the last four decades24
WA is one of the most fire-prone regions on earth and its fire seasons have become more intense – the last three years have seen record blazes threatening property and life. In 2025: in Narrikup; Perth and Albany; Ledge Point25 and Arthur River26 (north of Perth); Windy Harbour27 and Yellanup (south of Perth). In 2024 Waroona, Chittering and Shire of Dandaragan28 (north of Perth). In 2023: Mandurah, Ravensthorpe, Toodyay, Wanneroo29; Jacob’s Ladder at Kings Park in Perth.
April 2024 south west WA experienced its driest six-month spell on record leading to fears of forest collapse. This ecological event (like coral bleaching on land) spanned ~1,000 km (Zuytdorp Cliffs near Shark Bay to Albany) impacting forest and shrubland leading to terminal loss of biodiversity and breeding habitats. The first forest collapse in the world was recorded in WA in 2010/11.30
January 2023 WA experienced its worst flood event on record. Record amounts of rain fell in the Fitzroy River catchment and flooded Fitzroy Crossing, pastoral stations and Aboriginal communities - 240 properties damaged (homes and businesses), 1,500+ people evacuated, trade routes impacted.
2024/25 marine heatwave was the longest, largest and most intense on record, resulting in the most widespread coral bleaching event ever recorded for WA.31
The World Economic Forum estimates that by 2050 the global cost of climate change will be $1.7 to $3.1 trillion per year - including the cost of damage to infrastructure, property, agriculture, fisheries, tourism and human health32. In June 2025 the Federal Treasury estimated the immediate loss of economic activity from natural disasters in just the first half of the year to be $2.2 billion33 In September 2025, the Australian Climate Risk assessment outlined various economic costs amounting to hundreds of billions by 2050, including property value losses, increased disaster costs, reduced productivity and loss of wealth.
m odellin G in thi S re P ort
The data presented in this report, unless otherwise referenced, is from Greenpeace Australia Pacific’s (GPAP’s) WA specific 1.5°C aligned emission reduction model created in 2025. This comprehensive model draws from over 25 publicly available data sources and is based on the 1.5°C aligned AEMO Green Exports scenario34, where trade partners accelerate agreements that lower emissions. The model assesses emissions reduction from decarbonising current activities using existing proven and effective technologies, it does not rely on CCS or offsets to achieve emissions reductions.
electricity
Coal-fired power stations and GPG for electricity production in WA, including SWIS, NWIS, regional energy systems and self-supply / onsite generation for mining
industry lnG: gas use for production; mining: diesel use (electricity generation see above); manufacturing and mineral processing: gas use for process heat and processing
transport Vehicles: passenger, light commercial, rigid + articulated trucks, buses
Wind, solar and batteries
lnG: electrification and plant closures; mining: electrification of haulage / machinery; manufacturing: electrification and process changes
Battery electric vehicles (including low percent hybrids)
Agriculture Animal and crop agricultureVarious
Demand assumes existing activities with 1.5% annual growth, building electricity is included here but building electrification not factored in nor household batteries
Decarbonisation of existing industries only, new industries not included (eg. green iron or hydrogen) Carbon capture and storage not included
Air, rail and sea transport not included (4.18Mt CO2-e)
Electrification not included
other Not included: LULUCF (-9.4 Mt CO2-e 2023), waste (1.8Mt CO2-e 2023), building gas use (0.8 Mt CO2-e 2023)
The table above outlines model inclusions and exclusions - for further detail, an appendix is available on request. Main input sources include: CSIRO/AEMO EV projects35, 2025 Wholesale Electricity Market Electricity Statement of Opportunities36, NGERS facilities data37, Australia’s Emissions projects38, Australian Energy Statistics39, SERS40, Aluminium Council41, EPA assessments of industrial facilities (for example baseline emissions data42).
electricity 3
o verview
the electricity sector is the second largest contributor to emissions in wA and has reduced 3.4% since 2005. it emitted 16.3mt Co2-e 2022-23,43 18.3% of wA emissions and according to the model can get to less than 0.17mt Co2-e per annum by 2050, aligned with 1.5°C climate science.
WA can achieve this with the rapid roll out of renewables and storage within its electricity system (the SWIS and NWIS grids and self-supply/onsite generation).
As the population grows and the industry and transport sectors electrify, according to the model overall electricity demand in WA will increase from 9.2TWh at present to 49.9TWh by 2030, 65.5TWh by 2035 and 88TWh by 2050.
This increasing demand will need to be met in parallel with the closure of coal fired power stations (all closures complete by 2030) and
firmed renewables can replace coal and gas electricity generation
SourCe: GPAP Model -1.5 degree scenario
phase down of gas powered generation (GPG). Again, according to the model, to deliver the 88TWh required by 2050, WA will need a total of 35GW of operational renewables (25GW utility scale plus 10GW rooftop solar - included in the model but not report) and 10GW of storage capacity. While this needs to occur at speed, care needs to be taken to engage with communities, ensure benefit sharing and balance an efficient rollout with nature protection.
The table on page 11 outlines the rate at which utility scale solar, wind and storage needs to be deployed. Meeting these targets by 2050 will be challenging but achievable with the correct policy settings and support. Based on the annual rate of deployment 2020-2024, renewables need to roll out at 9.6x current annual rate (on average) between 2025-2029, 9.4x between 2030-2035, and 2.3x between 2035-2050. In parallel, WA needs to install storage at 6.7x its current rate 2025-2029 (or 4.2x once planned big batteries come online), 5.3x between 2030-2034, and 1.2x between 2035-2050.
renewables can replace coal and gas electricity generation
If WA wishes to grasp green commodity export opportunities, for example in green iron, energy demand in the state will increase significantly in addition to what is described in this report.
w A h AS C om P lex ener Gy infr AS tru C ture
WA electricity networks generate 55% of electricity in the state.45 They are dispersed and complex, and while the State Government is planning expansions to support transition, it is not at a fast enough rate and still does not include plans to connect to some of the most reliable wind and solar zones to the north of the grid or further south or east. The grids46 47 include:
• the South West Interconnected System (SWIS) -WA’s primary system with over 7,800 km of transmission lines and over one million electricity customers. Delivers 40% of grid electricity, it has added 1.2GW of large renewables over the last 20 years and currently has 37% renewables penetration.
• the North West Interconnected System (NWIS) in the Pilbara - smaller system currently at ~15,000 electricity customers. Rewiring the Nation investment will expand this system to connect large mining operations and proposed large-scale renewable energy projects like the
Australian Renewable Energy Hub. It delivers 40% of grid electricity and currently has 2% renewables penetration.
• a number of isolated regional energy systems -including three interconnected systems in Kununurra, Wyndham and Lake Argyle and 34 microgrids across regional WA. They deliver 20% of grid electricity and currently have 4% renewables penetration.
Mining and manufacturing generate 36% of WA electricity,48 this self-supply, primarily by large extractive industries accounts for almost half of WA’s electricity emissions49 and sits outside the above grids.
WA also has substantial gas infrastructure, including the 1,500km Dampier to Bunbury Natural Gas Pipeline which transports gas from the north to the south-west, serving gas power generation, industrial users, residential and small businesses. As sectors decarbonise and electrify, gas use will decrease and this infrastructure will require coordinated retirement and worker retraining and / or redeploying.
3 electricity
o ut with the old A nd in with the (re)new( AB le S )
WA has the largest proportion of fossil fuel energy generation of all Australian states. In 2024 renewable energy accounted for just 20% of WA’s generation. This is well below the national average of 36%50 and short of the 82% national target for 2030.
Energy sources and systems hold the key to emission reduction. Tackling and transforming WA’s emission-heavy energy mix will underpin the State’s future economic security and growth. In addition, integrated network planning for the grid’s transmission and distribution infrastructure will play a vital role. Ultimately, using renewables (through the grid or behind the meter) will unlock decarbonisation of almost all sectors of the economy when paired with electrification.
fossil fuel phase out
Coal-fired power stations generated 17% of WA electricity in 202451 (7,694 GWh 20232452) and contributed 6-8% of emissions53. The WA Government has committed to retire all state-owned coal-fired power stations by 2030the future of the privately owned Bluewaters coalfired power station however remains uncertain.
WA has the highest proportion of gas powered electricity generation in Australia. GPG supplied
wA has the largest share of fossil fuel electricity generation by state (2024)
SourCe: Australian Energy Statistics | Australian Energy Update 2025
59% of WA electricity in 202454 (26,943 GWh 202324 excluding LNG onsite electricity generation) and contributed 9% of emissions (7.7Mt CO2-e in 2023-24). A number of GPGs are struggling to adjust to the changing dynamics of the grid - in June 2025 Newgen Kwinana (with a capacity of more than 310MW and one of the largest units in the SWIS) was discussing bankruptcy or bailout to maintain service.55 Others, like the ageing Pinjar gas powered turbines (576MW) are scheduled to retire - half in 2029 and the remainder by 2032 according to AEMO.
GPG will remain in the system for longer than coal as it currently makes a greater contribution to WA’s electricity supply and the facilities are younger. Closed cycle gas turbines (CCGT) provide generation capacity in the short term as coal exits, but will be the first to exit the system due to their lack of flexibility. Open-cycle gas turbines (OCGT) are more responsive and have the ability to rapidly ramp up and down to meet demand as required. These will use less and less gas over time as they are primarily used to meet periods of high demand, a function that batteries will increasingly perform in future, facilitating their eventual phase out.
WA has the largest share of fossil fuel electricity generation by state (2024)
The model shows that gas will only be required to supply 1% of WA’s electricity by 2035 with the last GPG facility exiting in 2046. Importantly, the model demonstrates that no new GPG facilities are needed to power WA’s future.
renewable deployment
Zero emission grid solutions exist and these proven technologies need to be deployed across WA, in association with energy efficiency and demand management measures, to replace fossil fuel generation and meet future energy needs:
• Solar (utility scale or as distributed energy resources on rooftops)
• Wind farms (utility scale offshore and onshore)
• Batteries (utility scale, neighbourhood, businesses and households and vehicles).
Batteries reduce the need for gas in a grid 56
In a fossil fuel based electricity grid, stability is provided by the physical rotating mass of synchronous generators like coal and gas power plants, acting like a shock absorber to maintain balance between supply and demand. As grids transition to renewables, stability comes from a combination of battery energy storage systems for rapid response and balancing supply and demand, advanced grid-forming inverters that act like spinning generators, large-scale synchronous condensers for inertia and stability, and enhanced forecasting to manage renewable output fluctuations. As more grids reach higher levels of renewables, technologies are evolving to manage and maximise stability.
California has rapidly expanded its battery storage capacity to ~10 GW (8GW connected to the grid and the remainder installed in homes and businesses). These batteries play a crucial role in reducing nighttime electricity generation demand and are displacing GPG, especially during periods when solar generation drops. A similar pattern is being seen in South Australia and even the NEM as more batteries come online.
California plans to further increase its battery storage to over 48 GW, along with 4 GW of longduration storage, to meet its goal of 100% clean electricity by 2045 (some sources have California on track for this milestone by 203357). It has shown in real time that battery storage can effectively address the “duck curve” challenge— where solar energy generation peaks during the day but demand peaks in the evening. Australia shares similar characteristics with California, including high rooftop solar adoption, comparable climate conditions, and the need to manage renewable energy integration into the grid.
Batteries reduce the need for gas in a grid
0:003:006:009:0012:0015:0018:0021:00
SourCe: Average daily April gas and battery generation. Recreated from: ABC / gridstatus.io
Batteries kick in to supply night-time demand when the sun goes down.
3 electricity
h ow mu C h i S needed?
The model shows that by 2050 WA’s existing electricity demand will have increased from 29TWh (2024) to 43TWh. Adding further demand from electrification of transport and industry sectors more than doubles this, with an additional 45TWh by 2050, totalling 88TWh. Sector contributions include:
• Electrification of manufacturing and mineral processing: 18 TWh
• LNG electrification (ahead of phase out): 12.2 TWh
• EV uptake: 8.2 TWh
• Mining electrification 6.5 TWh.
To meet the models predicted 88TWh of demand, 25GW of utility scale renewables need to be operational in WA by 2050, alongside 10GW of rooftop solar and 10GW of storage.
Residential and commercial buildings electricity demand was included in model baseline demand with 1.5% growth annually, increased demand due to electrification of this sector was not included nor was increased energy efficiency. 10GW of rooftop solar (total) by 2050 was included as an assumption in the model, we note there is potential for behind the meter renewables to make a greater contribution58
A renewable powered grid that is designed to meet peak demand
Peak demand in the SWIS has reached record levels in recent years particularly as longer, hotter summers begin to impact. This is leading to both summer and winter peaks occurring for the WA grid, with a new maximum operational demand record of 4,486 MW59 set in January 2025 and a record winter demand of 3,977 MW60 in July the same year. With a 100% renewable grid, the importance of reserve capacity to meet peak demand periods becomes more apparent. Such provisions are already required under AEMO system management rules to ensure sufficient supply and stability. If there are sustained peaks over multiple days and they happen to coincide with low supply days (cloud cover, low wind) there are mitigation measures that will need to be built into the system, including longer duration battery storage and a broadly distributed renewable energy supply network. This would increase the resilience of the system by sourcing from areas with differing weather conditions.
California’s electricity grid faces similar conditions to the SWIS and has demonstrated that a high penetration of renewable energy is increasingly able to meet demand. “California experiences its 100th day of renewable energy sources meeting 100% of electricity demand” in 202461, with 2025 having nearly 6 months of 100% of RE part of day.62 The State aims to be 100% renewable power by 204563, with some sources claiming this may happen in the 2030’s.
Buildin G firmed renew AB le S from A n exi S tin G BAS e
WA had 4.3 GW of renewables in place in 2024 contributing 20% of its energy. To achieve a decarbonised electricity sector in WA by 2050, 25GW of additional utility scale renewable generation is required, increasing:
• utility scale solar from 260MW to 9.5GW
• utility scale wind from 1GW to 15.4GW
Alongside rooftop solar increasing from 3GW to 10.4GW (not covered in this report) and battery storage from 280MW to 9.2GW.
While these figures may appear daunting, Texas, known for its oil and gas dominance and with a historically gas-reliant, isolated power grid similar to WA, has rapidly become a U.S. leader in renewable energy. In 2024 alone, Texas added 9.7 GW of solar (tripling capacity from ~8.5GW in 2020 to 26.7GW64) and 4.3 GW of battery storage65 (increasing from less than 0.1GW in 2020 to ~4.8GW66). Renewables are setting generation records for Texas as coal fleets shut down, this offers an interesting model for WA.67
rate of build out
Between 2020 to 2024, WA deployed just 45.6MW of utility scale solar and 94MW of utility scale wind68 on average each year - a particularly slow period for deployment. To build out the 25GW of renewables needed to replace coal-fired power stations and GPG as they close and meet growing demand, these rates need to increase:
• 9.6x 2025-2029 (635MW of solar and 1008MW of wind annually) = 9.4GW total by 2030
• 9.4x 2030-2034 (697MW of solar and 1071MW of wind annually) = 18.3GW total by 2035
• 2.3x 2035-2049 (161MW of solar and 248MW of wind annually) = 24.9GW total by 2050.
Between 2020 and 2024 WA deployed 108MW69 of storage on average each year, using this as a baseline roll out rate, the state needs to increase installation:
• 6.7x 2025-2029 (or 4.2x once 1,350MW big batteries come online in 2025/2026): to deliver 733MW of storage annually = 4.2 GW total by 2030
• 5.3x 2030-2034: to deliver 577MW of storage annually = 7.1 GW total by 2035
• 1.2x 2035-2049: to deliver 136MW of storage annually = 9.3 GW total by 2050.
This significant roll out of renewables can be achieved in WA, however it will require strong commitment from the WA Government alongside investment in transmission, streamlined approvals that retain rigorous environmental assessments, available workforce and land access (as outlined in the WA Sectoral Emissions Reduction strategy). The recent announcement of the SWIS Transmission Plan brings important clarity but it is vital that accompanying processes to enable connections are improved and that Phase Three extensions to the highest yield wind and solar resources in the north, south and east are brought forward.
renewable energy builds in Australia have been consistently getting faster
From 2010-2020, renewable energy build times reduced by over half70. Solar projects on average between 2016-2020 took 3 and half years71 and in 2023, Western Downs Green Power Hub was opened in NSW, with a construction time of less than 2 years:
• Scale: 460 MW solar farm + 540 MW / 1,080 MWh big battery
• Investment: $600 million
3 electricity
WA currently has enough renewable energy generation capacity in its pipeline (mostly at early stages) to meet 43.5 TWh of demand72 - half of what’s required by 2050. On the storage front, Collie will have the largest battery in Australia by the end of 2025, however the state has an estimated 0.82GW / 2.85GWh capacity in the pipeline which is less than a tenth of what’s required by 2050 (ibid).
i nve S tin G in A C le
A n future for w A
The model shows that building a 100% decarbonised electricity system in WA will require $74.3 billion of strategic investment over the next 25 years, with the bulk of the spend in the next decade:
• 2025-29: $26 billion
• 2030-34: $27.3 billion
• 2035-50: $21 billion
Deploying this level of infrastructure investment will create a strong stream of jobs and local economic opportunities. This will stimulate new economic activity and investment at a time when Federal Treasury is predicting a 50% drop in the value of gas exports to 203073.
A build of this scale is well within WA’s capacity to deliver. For context, WA deployed more than $200 billion in CAPEX for the construction of WA’s LNG export facilities, wells and pipelines over a similar timeframe.
However, just as the LNG industry didn’t happen by chance, instead being underpinned by long term government support, offtake agreements and direct investment, so too will this major build out of renewable energy require clear targets, supportive policy settings and direct government investment. This is also the key that will unlock large investments by the private sector into WA renewables.
wA’s lnG build cost is triple the projected renewable build out cost to 2050
WA’s LNG build cost 3x more than RE build out
GPAP Model (1.5 degree scenario) and ACCR LNG report (2023) and OGJ (Nov 16, 2021)
In 2010, the WA Treasury estimated the cost of its commitments to assist the NWS project (through payment of subsidies to the State’s power utility to help cover losses incurred under ‘take or pay’ gas contracts) to be around $8 billion in 2010 net cost, which calculates to $11.5 billion in 2024. This includes $1.1 billion in finance obtained by the WA Government in 1980 to establish the NWS project and its accompanying infrastructure such as the Dampier to Bunbury gas pipeline.
Building out clean grid infrastructure now is essential to be part of the next economic boom, underpinning the economic future of WA - in much the same way as the State’s forward looking investment in the 1970/80s for the NWS and other projects underpinned the LNG boom of the past two decades. Securing the development of low carbon industries and establishing WA as a desirable location and trade partner on a global green stage is key. Given the high quality solar and wind resources in the state, and the opportunities that will flow from plentiful cheap, green electricity, renewable energy has the potential to become a major future industry for WA in and of itself. It will also deliver cheap electricity for all users, tackling the cost of living crisis.
G AS i S on the w Ay out
Renewables are now the cheapest form of new energy generation, with CSIRO GenCost data showing a 90% renewable mix (including storage and new transmission) costing at least 50% less than GPG by levelised cost of electricity.74
Investing in solar, wind and batteries is more economical than in old technologies such as gas. This is particularly the case for WA’s aging GPGs. In addition, gas turbines are currently in high demand and low supply, meaning costs are soaring and the waitlist is around five years.75
WA needs to decide whether it will continue to invest in old technology and undermine the roll out of renewables, or commit to a green future with all associated benefits.
e nvironmentA l A nd C ommunity C on S ider Ation S
The energy transition offers an opportunity to tackle the twin crises of climate change and biodiversity loss. Significant areas of land will be required for clean energy projects and infrastructure, but this can be targeted to brownfield sites, and otherwise to minimising impacts on biodiversity in greenfields. The total area required for the build out of renewables to decarbonise the WA economy is 3,700 km2,
Gas is the most expensive form of available electricity generation
SourCe: CSIRO GenCost 2024-2025
Table B.10
equivalent to 0.0015% of WA’s total area (2,529,880 square kilometre76). Renewables, unlike fossil fuels, can be co-located with other activities for example the land around wind turbines can also be used for agriculture or grazing77, and solar PV has been shown to have co-benefits for grazing and crop production.78 79
Working with Traditional Owners and other communities affected by the transition is essential to embed fairness and social good as central tenets to WA’s shift to a net-zero economy, during each stage of development, operations and decommissioning. This will be key to ensuring an orderly and positive economic transformation that is grounded in genuine community engagement and benefit sharing from clean energy and clean industry developments. Part of this is requiring projects to provide local community funding and in June 2025 the WA Government set trial guidelines for wind projects to deliver $500–$1,500 per MW per annum in community funding, and solar projects $150–$800 per MW per annum.
Gas is the most expensive form of new electricity generation
Investment will be required to support communities with transition planning, worker retraining, common use infrastructure, remote energy infrastructure, and necessary social investments. In the long term, this will ensure a strong social licence for the transition is established to speed up transmission projects, new energy and industrial developments.

3 electricity
the SwiS could reach 82% renewable energy by 2030
If WA keeps coal retirement on track and rapidly builds solar, wind and storage with a focus on the SWIS, WA’s main grid can reach 82% renewables penetration in just five years.
According to the WA Treasury Corporation the SWIS could reach between 80-90% renewable generation by 2030.80
A scenario was created within the GPAP model to look at the SWIS in isolation. This indicated that WA must add 5.9 GW of renewables to the system by 2030, backed by 1.5 GW of batteries to align the SWIS with a 1.5°C pathway. This requires annual investment of $2.86 billion, or $14.3 billion by 2030, from governments and industry.
The SWIS faces a looming supply crunch as coal and some gas generators close. Collie (320 MW) and Bluewaters (440 MW) coal stations are expected to shut by 2027, followed by Muja coal (414 MW) and Pinjar gas (177 MW) in 2029 In total, 1,350 MW of coal and gas generation will exit the system by the end of the decade.81 If fully replaced by renewable energy and batteries WA’s electricity supply can become one of the cleanest in the nation
SwiS electricity Generation
SWIS Electricity Generation
SourCe: GPAP Model -1.5 degree scenario (SWIS only)


r edu C in G ele C tri C ity S e C tor emi SS ion S : P oli C y re C ommend Ation S
• Establish a WA Renewable Energy Target for the SWIS of at least 82% by 2030.
• Investigate the implementation of a statewide Renewable Energy Target to encourage broader investment in renewable energy and position the state to become a green commodity exporter.
• Accelerate renewable energy and battery storage build out to ensure no new gas generation facilities are required.
• Bring forward phase three extensions of the SWIS Transmission Plan, remove disincentives to new connections like the proposed $100,000 per MW transmission connection fee, and reform system processes to optimise the rapid assessment and connection of renewable energy and transmission infrastructure projects.
• Establish Renewable Energy Zones associated with each of the Strategic Industrial Areas, sized to meet future industry demand, to increase investor confidence and develop the renewable energy pipeline.
• Embed community benefit requirements and environmental protections for renewable energy and green commodity projects, including for First Nations groups.
• Invest in training a skilled workforce, retraining the transitioning workforce, and attracting skilled workers to support rapid deployment of renewable energy projects.
industry
o verview
the industry sector is the largest contributor to emissions in wA and has grown 57% since 2005.82 the industry sector, covered by the model, emitted 41.3mt Co2-e in 2024 and can get to less than 1.4mt Co2-e per annum by 2050 (97% drop), aligned with 1.5°C climate science.
Decarbonisation of the industrial sector can be primarily driven through electrification (and the use of 100% renewable power) and using green
industry emissions can be almost entirely eliminated
SourCe: GPAP Model -1.5 degree scenario
hydrogen as a chemical feedstock alongside other changes to key manufacturing processes. As a major source of WA industrial emissions, the LNG sector must also electrify alongside a planned phase out of operations.
LNG, mining and manufacturing are contributors to WA’s industry emissions. The model shows that electricity demand in the sector will grow from roughly 2.0TWh (at present) to 17.3TWh by 2030, 29.0TWh by 2035 and 36.8TWh by 2050 as existing industries grow at the current rate and electrify. This will require 18.6GW of renewables and storage for this sector alone.
Industry emissions can be almost entirely eliminated


A targeted industrial decarbonisation and productivity package, and creation of renewable energy zones alongside clean manufacturing precincts in Strategic Industrial Areas will be important supports to address emissions in the industrial sector. Additional investment now in production of green iron and other green metals and mineral processing, while transitioning away from LNG exports, would lay the foundation for supercharging the WA economy in the future green economy.83
• Mining: 10.5Mt CO2-e (25% of WAs current industrial emissions) can reduce to 0.58Mt CO2-e by 2050
• Manufacturing and mineral processing: 8Mt CO2-e (19% of WAs current industrial emissions) can reduce to 0.17Mt CO2-e by 2050, this includes alumina refining, lithium processing, chemical production (primarily ammonia for fertiliser and mining explosives), cement, pulp and paper, and food and beverages.
WA’s industrial sector can achieve significant emissions reductions through the use of electrification, using green hydrogen as a chemical feedstock alongside other changes to manufacturing processes, and a planned phase down in LNG production. Each of WA’s industrial sectors will require a unique decarbonisation pathway to tackle emissions (outlined in the following sections) but the model outlines the following emissions reductions are possible:
• LNG: 22.8Mt CO2-e (55% of WAs current industrial emissions) can reduce to 0.59Mt CO2-e by 2050
Many of these industrial facilities are covered by the Federal Government’s Safeguard Mechanism, which from 2023 imposed a declining baseline on emitters over 0.1Mt CO2-e per year. The mechanism is aimed at significantly driving down emissions from 2030 onwards but in its current format is insufficient to align WA’s facilities with a 1.5°C emissions reduction pathway.
Cuttin G ln G emi SS ion S
LNG onsite gas usage is equivalent to ~10% of the gas export volume (AES, 2025). Emissions result from the large volumes of gas consumed onsite to power facilities and run chillers at -161°C, as well as methane leaks during processing, flaring and other operational activities.
LNG emissions can be cut by eliminating fugitive emissions, electrification and planned phase out

4 industry
The LNG industry is WA’s largest consumer of gas and the largest carbon polluter. It contributes more emissions than any other sector and has grown significantly since 2005, driving state emissions growth and undoing gains made in national emissions reductions in other jurisdictions. In 2024, LNG production emitted around 25Mt CO2-e84 - that’s 55% of WA industrial emissions and over a quarter of those produced by all facilities covered by the safeguard mechanism85
Addressing climate change will necessitate the phase out of all fossil fuels, including gas, and wealthy nations like Australia alongside trading partners like Japan, should set an example. Indeed, Australia and Japan have committed to a decrease in gas use for electricity to reach net zero and we should be working together, with trading partners to make it a reality.
The model shows that the WA LNG sector can reduce emissions down to 0.59Mt CO2-e by 2050. A simple first step is elimination of flaring (venting and flaring contributed 10Mt CO2-e in 202386
alone) by committing to the World Bank’s Zero Routine Flaring Commitment87, this would bring WA into line with Norway which phased out all non-routine flaring in 1970.88
WA should also enact an electrification and phase down plan for LNG export facilities to:
• switch from onsite GPG to renewables with storage (used to power other industries after LNG closures)
• repower refrigeration compressors from gas turbines to more efficient electric drive solutions, the Freeport LNG facility in Texas, USA, is a working example of an electrified LNG terminal
• deliver staged closure of facilities, aligned with the end of life of feeder gas fields and/or publicly stated facility lifespans. This is similar to how coal units are being decommissioned over time - and ensures a planned transition for the LNG workforce.
This staged approach allows for existing fields to be utilised but does not allow for the opening of new fields or field expansions in alignment with the IEA and IPCC recommendations. It also allows existing contracts to be met and presents an opportunity to coordinate the phase down through multilateral decarbonisation and trading agreements, which respect the emissions reductions pathways of the region. Electrification of refrigeration compressor drive
lnG
is a major export but does not deliver on taxes for Australia, nor assist trade partners
Australia is the world’s second largest exporter of LNG - with 60% of exports generated in WA. WA delivers a total LNG export capacity of 50 million tonnes a year.89
revenue And tAx: Australia’s mostly foreignowned LNG exporters made $100 billion in 2022-2490. While export volumes remained at ~80 million tonnes per year, revenues leapt due to war in the Ukraine, with virtually no increase in the cost of production91. Little of this profit was ever taxed for the benefit of Australians:
• the Petroleum Resource Rent Tax was designed for oil but liquid-natural gas now dominates - Federal Treasurer, Mr Chalmers has previously acknowledged that “from 1980s to 2024, not a cent of PRRT had been paid on LNG facilities”92
• Company tax captured a small part of this revenue; a detailed estimate of LNGrelated tax payments is not available but it is estimated that at best, $20 billion was collected93.
GAS And renewABleS: Once exported LNG is regasified and burnt as a fuel - generating significant off shore (scope 3) emissions. In the
trains is only expected for the longer running facilities in acknowledgement of the likely payback period. However, due to the relatively low cost of renewable energy and the extra value of gas obtainable at export (rather than through consumption in processing), electrification investment could also be considered for other facilities. As a floating facility, Prelude has extra challenges to renewable electrification so has not been included in electrification expectations.
past LNG exports have been touted as reducing trading partner emissions94, but this is inaccurate as WA gas is displacing renewable energy in Asia, more than its displacing coal.95 In addition, research in the US has shown gas has ~33% higher emissions than coal over a 20 year period96 - which is likely to apply more broadly.
major global lnG exporters: 2023
Mt = Million tonnes
Note: GIIGNL measures the volume of LNG trade from the importing country’s point of view, which is generally lower than the volume reported by the exporting country as some LNG is boiled off during the shipping. As such, the volume of Australia’s LNG exports as reported by the ABS is lower than that reported by GIIGNL.
Major global LNG exporters: 2023
SourCe: International Group of LNG Importers (GIIGNL) and WA Department of Jobs, Tourism, Science and Innovation.
4 industry
d e CA r B oni S in G minin G
Mining is a major industry which makes a huge contribution to the WA economy. While efforts are being made, for example Fortescue has set a goal to achieve zero terrestrial emissions by 2030, the industry remains largely dependent on fossil fuels and in 2024 contributed a quarter of the state’s industrial emissions (8.2Mt CO2-e).
The model shows that mining operations in WA can reduce emissions down to 0.58Mt by 2050 by shifting to on-site renewable electricity and/or grid connection and electrification of machinery and haulage, including battery-electric trucks. Implementing efficiency measures will also reduce emissions as will replacing diesel-based trains (noting that rail transport emissions were not included in the model), however trains may take longer as seen with recent setbacks to Fortescue’s infinity train.97

the diesel fuel tax Credit (dftC) scheme and Safeguard mechanism need change
Phasing out the DFTC scheme for its largest beneficiaries and replacing it with a Transition Tax Incentive could be used to shift mining capital into decarbonisation and electrification.98,99 The incentive could work by returning fuel tax credit receipts above a given cap to be spent on defined investment classes that enable phase-out of diesel in operations.
The current scheme acts as a disincentive, it provides 50.8 cents per litre credit, making it more favorable to maintain reliance on fossil fuels than making investments in decarbonisation. For example, a mine
consuming 150 million litres of diesel/year receives ~$75 million in DFTC annually; if the mine invested $1.5 billion to eliminate diesel consumption, the payback period would be 2.5 years longer than without the subsidy, meaning the firm essentially incurs a cost of $75 million/ year in addition to the investment outlay.
Reforming the DFTC and the Safeguard Mechanism to tighten the rules on polluters and cap the number of offsets being used is an essential first step to incentivise the shift to cleaner alternatives and better reflect true environmental costs of carbon. An adequate price on carbon can be of economic benefit to the mining industry as it will drive the switch to green metals and critical minerals needed for the transition.100
export commodities opportunities: focus on green iron
WA’s proximity to Asian markets and world-class renewable resources, positions the state to capture significant market share in the rapidly expanding green commodity trade - not only green iron, but green ammonia, alumina and critical minerals too.
WA is the world’s largest iron ore producer, mining more than 920 million tonnes of iron ore in 2024 equivalent to 38% of global supply101. Royalties from the iron ore industry account for 88% of WA’s royalty revenue (ibid) and for a quarter of the WA Government’s general revenue. One of the key future export opportunities for WA is value adding to this ore to create green iron.
With support, WA could produce 122 million tonnes of green iron per year by 2040 to deliver $380 billion in GDP, $350 billion in real income and $167 billion in Commonwealth and WA state taxation. In addition, WA could create a new export industry worth $340.2 billion and 24,000 ongoing jobs in WA.102 This modelling from 2024 focused on 2040, Federal Treasury modelling released in 2025 suggested Australia would have a similar volume (120 million tonnes) of green iron export by 2050, with the bulk of that coming from WA.103
wA green iron needs to move fast to stay ahead of competition: Global steelmaking accounts for between seven and nine per cent of global carbon emissions.104 WA’s hematite ore exports are converted into steel via blast furnace-basic oxygen furnace (BF-BOF) technology which generates average emissions of 2.33 t CO2-e/t, this is compared to:
• 1.37 t CO2-e/t for gas-fired direct reduced iron–electric arc furnace (DRI-EAF)
• 0.68 t CO2-e/t for scrap-to-electric arc furnace production
• new processes, like Swedish steelmaker H2 Green Steel’s Boden plant, will produce steel with emissions of only 0.04t CO2-e/t from magnetite ore.105
More than half of new global investments in steel plants over the next three years will be in EAF technology, while 42% are in BF-BOF plants106 - an industry-wide shift in favour of green iron and steel production methods will create a structural decline in the West Coast iron ore export market. A clear government focus on attracting emissions-free iron-making technology that favours the Pilbara’s predominantly hematite ores is required to ensure WA makes the most of its opportunity.
Green iron making uses a lot of electricity: to deliver ~120 million ton green iron opportunity described in the Forging the Future139 report will require build out of 129 GW of utility scale renewables by 2040, the WA sectoral emissions reduction strategies (SERS) estimate a similar level of renewables to support new green industries by 2050. These are both roughly four fold higher than the 35GW (total) described in this report for converting existing industries and indicate the magnitude required.
new industries such as green iron will require ~100Gw or renewables capacity
New industries such as green iron will require ~100GW or renewables capacity
SourCe: GPAP Model, Forging our Future report, WA SERS
4 industry
d e CA r B oni S in G m A nufAC turin G A nd miner A l P ro C e SS in G
The model shows that emissions from manufacturing can be reduced from 9.5Mt CO2-e currently to 0.17Mt CO2-e by 2050 (decreasing 8% annually). Specific approaches are required for each subsector as detailed below.
manufacturing and mineral processing emissions can be cut through electrificaiton and process changes
SourCe: GPAP Model -1.5 degree scenario

Electrifying alumina refining
Three of the nation’s five operational alumina refineries are located in WA with the remainder in Queensland. Alumina production is responsible for 62% of manufacturing emissions in the state. Approximately 70% of alumina refining emissions are produced in the low temperature Bayer process and 24% from high temperature calcination.107
Research commissioned by ARENA, has shown that onsite emissions can be reduced by up to 98%108 through the deployment of five key technologies including Mechanical Vapour Recompression, electric boilers, electric calcination, hydrogen calcination, and thermal storage powered by 100% renewable energy. Alongside a clear electrification schedule for alumina refineries, impacts of bauxite mining in the Northern Jarrah Forest need to be considered as a primary limitation on the future of the alumina industry in Western Australia.
Greening ammonia production
Ammonia production for the resources and agriculture sector is another major source of emissions in WA, responsible for 15% of manufacturing emissions. The two main sites considered in the model are the currently operating Yara Pilbara Fertilisers, and Perdamen Urea Project (opening 2026). Currently, almost all ammonia production is via the conversion of fossil gas however green hydrogen can be utilised as a feedstock to eliminate >95% of these emissions109
The Yuri Renewable Hydrogen to Ammonia Project110 (a project within Yara Pilbara fertilisers) in Karratha, WA, is an important first step in this direction, but the small scale of the plant will deliver relatively small emissions reductions. The next priority for WA should be to support the development of a full scale green ammonia plant underpinned by mixing mandates for explosives (ammonium nitrate) use in the mining sector and
Lithium refining
Electricity demand from electrification
Ammonia Cement Food & beverage Pulp & paper
Alumina
broader production targets. Producing green ammonia for fertilisers and explosives will require significant capital investment in both infrastructure (eg electrolysers, water supply) and renewable energy, however, exports stand to increase due to their green credentials and eventually lower-cost energy inputs.
As with all renewable based projects, consideration needs to be given to the associated environmental impacts. Overall these are drastically smaller than the polluting nature of gas based processes, however care still needs to be taken. A key pressure that is likely to emerge and is already an issue in WA is water use. In a hot and drying climate, investment in renewable powered desalination facilities is likely to be an essential requirement to meet the water needs of green ammonia projects and other green hydrogen based industries to avoid impacting local watersheds.
tackling cement emissions
Cement production is responsible for 7% of WA’s manufacturing emissions. The industry uses the Portland cement process created in the early 1800’s with kilns heated to over 1,450°C to produce clinker. Production is broken up into a few categories: quarrying, crushing, grinding/ blending, preheating, firing to form clinker, and pulverising - with the majority of emissions coming from process heat and chemical transformation of limestone to clinker.
New generation (electric or hydrogen) kilns and substituting clinker with other cementitious materials (such as fly ash) can reduce cement production emissions by 22-51%111 - these relatively new technologies are at lower readiness levels. Other parts of the process are already electrified and drawing from renewable energy sources will also reduce emissions.
electrifying pulp and paper, and food and beverage
Pulp and paper production is responsible for 6% of WA’s manufacturing emissions. The industry is heat-intensive, primarily because of the significant water evaporation required during pulp and paper drying. Emissions are mainly released in the creation of process heat (40 to 240°C) for drying, boiling, bleaching and deinking.
Heat pumps and electric boilers can be used for drying paper, de-inking and bleaching processes. Mechanical vapour recompression is a heat pump variant technology that assists with the evaporation process and provides a temperature lift up to 250°C - this can specifically assist with wood pulping processes. Heat pumps can also capture latent heat to increase efficiency and generate steam for further drying processes.
Roughly 10% of WAs manufacturing emissions or 2.5% of WA’s industrial emissions come from the food and beverage sector. Sites range from largescale food and beverage manufacturing to smaller facilities like microbreweries. As with paper and pulp, most emissions come from the creation of process heating, generally between 70 to 160°C to generate hot water and lower-temperature steam for processes like cleaning and sterilisation.
Industrial heat pumps are a key technology for decarbonising the industry, leveraging renewable electricity from solar PV and transferring waste heat. Other technologies include solar thermal and anaerobic digestion. Trials have been successfully run by ARENA and Australian Alliance for Energy Productivity to replace gas boilers with heat pumps in breweries, hot water units at meat processes facilities.
These sectors are poised to benefit significantly from industrial heat process adoption, offering energy savings of over 80% and the potential for zero emissions when powered by renewable energy.
4 industry
mineral processing
Positioning mineral processors to succeed in a low carbon world will provide WA a competitive edge and will capitalise on support being provided by the Future Made in Australia Act and recent investment signals from the WA Government against a background of growing global demand.
Targeted support for the WA lithium industry to navigate the current challenging market for producers while enabling the low carbon production investments today will position the industry for a strong future. Pioneering firms such as Calix are demonstrating how emissions can be reduced through innovative technologies, including electrification of lithium processing via spodumene calcining to deliver a vast reduction in carbon emission intensity of the lithium product.
Current emissions are not included in the baseline, but production is scheduled for 2026 for three lithium processing facilities, estimated to release 0.75Mt CO2-e per year (these are included in the model).
e le C trifi CAtion in C re AS e S indu S tri A l ele C tri C ity dem A nd
Decarbonising WAs mining, manufacturing and LNG industries will increase the state’s electricity demand - adding an additional 36.8TWh that will require 18.6 GW of renewable generation:
• Mining electrification: additional 6.5TWh requirement
• Manufacturing electrification: additional 18.1TWh requirement
• LNG electrification: additional 12.2TWh requirement
Creation of renewable energy corridors or zones alongside clean manufacturing precincts in Strategic Industrial Areas will be important to ensure the industrial sector can access adequate, clean and reliable energy as they electrify.
r edu C in G indu S try S e C tor emi SS ion S : Poli C y re C ommend Ation S
• Legislate net zero target legislation with interim targets to align with a 1.5°C pathway and incentivise renewable energy and green commodity investments.
• Establish a state industrial electrification and productivity package, funded in part by a dedicated levy of LNG exports, that prioritises:
A program to achieve 100% green ammonia production in WA by 2035.
An accelerated timetable for the upgrade and electrification of the state’s alumina refineries, commencing with a small-scale MVR demonstration in the alumina sector to build expertise and reduce investment risk.
Priority investment streams for investment into green iron and clean mineral processing facilities.
A program to support 60% of food and beverage producers to install high-quality electric heating solutions by 2035, starting with large-scale pilot programs in the food and beverage industry.
A clear program that supports the businesses to upgrade to high quality electric heating solutions for the paper industry.
Support for the cement industry to electrify some operations and research to test further decarbonisation technologies.
• Establish an electrification and staged phase out plan for the state’s LNG export plants as outlined.
• Implement a managed phase-out of LNG exports aligned with trading partners’ decarbonisation pathways by:
Publishing a WA roadmap that phases down LNG exports as existing gas fields deplete and facilities come to their end of life in accordance with a 1.5°C pathway.
Conduct a comprehensive review of the LNG royalty system to ensure WA captures fair value from its gas resources and enables them to be redirected into building out renewables to transition away from fossil fuels.
• Instruct “Invest and Trade Western Australia” to leverage its trade promotion network to facilitate decarbonisation partnerships in green commodities, positioning WA as a global leader through Future Energy trade missions, embedding a decarbonisation narrative into all promotional materials and through brokering green commodity deals with major trading partners.
tr A nsport
o verview
the transport sector is the third largest contributor to emissions in wA and has grown 47% since 2005.112 the transport sector, covered by the model, emitted 10.8mt Co2-e in 2024 and can get to 0.4mt Co2-e per annum by 2050 (96% drop), aligned with 1.5°C climate science.
Decarbonisation of the transport sector can be primarily driven by rolling out battery-electric or zero emission vehicles (EVs) alongside use of 100% renewable power to recharge, while phasing out Internal Combustion Engine (ICE) vehicles. Additional measures to minimise private vehicle use and increase use of public and active transport will help to achieve deep emissions reductions in line with limiting warming to 1.5°C.
Mass transport electrification will increase electricity demand, growing from 0.6TWh in 2030, to 2.1TWh in 2035 and 8.2TWh by 2050, which will require an additional 4.1GW of renewables.
emission reduction in the transport sector requires the majority of iCe vehicles to be off wA roads by 2050
e le C tri C vehi C le S A re the key to de CA r B oni S in G the tr A n SP ort S e C tor
The Federal New Vehicle Emission Standards came into effect in January 2025 setting mandatory carbon dioxide emissions targets for new passenger cars and light commercial vehicles imported into the country. While this will help to increase the overall proportion of fuel-efficient options available to consumers, decarbonisation of the sector is universally challenging due to large stocks of existing vehicles compared to the amount of new vehicles purchased each year.
In 2024, in Australia as whole there were 21.74 million vehicles113 and 1.2 million new vehicles being purchased annually114. In the same year in WA, there were 2.36 million vehicles115, and 130,000 new vehicles sold116. Even if all new vehicle purchases today were zero emission, it would take 18 years to replace the existing stock and have a fully decarbonised vehicle fleet on the road - both in WA and Australia as a whole.
Emission reduction in the transport sector requires the majority of ICE vehicles to be off WA roads by 2050


EV uptake rate for WA has been slow but it is increasing, especially in areas around Perth. In the second quarter of 2025, 7.6% of new light vehicles were electric (with Perth metro purchasing 90% of new EVs). Nationally 10% of new vehicles were electric in Q4 2024.117
To reduce emissions in line with 1.5°C by 2050, the model shows that WA needs to increase EV uptake by 3.8% on average each year, reaching 99% of total vehicles being electric by 2049. Each vehicle type has slightly different annual increase in electric uptake required:
• passenger vehicles: 3.8% /year
• light commercial vehicles: 3.94% /year
• rigid trucks: 3.96% /year
• articulated trucks: 3.59% /year
• buses: 3.96% /year.
Electric light commercial vehicles and buses are well established, electric rigid trucks are more advanced than articulated counterparts - but there are an increasing number of all of these coming onto the market.
local manufacturing of trains, ferries, buses and rail cars
The Made in WA plan, announced in the 2025 WA election118, has plans to support the local manufacturing of four vehicles:
• buses - for metropolitan Perth and regional operations
• trains -258 railcars to be delivered over the next ten years
• ferries - five new electric ferries as part of an expanded Swan River ferry service
• iron ore rail cars - 240
Expenditure on the plan should be fast tracked with a priority focus on electrification of WA’s transport fleet while creating local content and manufacturing opportunities.
SourCe:
A fleet in transition - change in road vehicles in WA
A fleet in transitionchange in road vehicles in wA
5 transport
Beyond
ele C tri
C vehi C le S
Climatework’s 2024 report, Decarbonising Australia’s Transport Sector, outlines a credible plan to decarbonise the transport sector that goes beyond electric vehicles.119 It offers a multiplier solution that uses global best practices and focuses on three key elements:
• Avoid - minimising the need for travel and transport activity by promoting efficient urban planning and logistics.
• Shift - encouraging a move from high-emission to lower-emission modes of transport, such as using public transport, active transport (walking, cycling), and rail for passengers and freight.
• Improve - enhancing the energy efficiency and carbon performance of vehicles and fuels, primarily through increased adoption of zeroemission vehicles.
d e CA r B oni S in G tr A n SP ort will in C re AS e dem A nd for ele C tri C ity
Replacing the WA vehicle stock will dramatically reduce emissions by removing combustion of petrol and diesel - but will increase electricity demand. Currently the demand for the sector is low, just 30,000 MWh electricity - with electrification this demand will increase to 0.6 TWh in 2030, 2.1TWh in 2035 and 8.2TWh by 2050.
how and when vehicles are charged - matters
The International Council on Clean Transportation found that Smart charging can reduce peak load on electricity grids (and related system costs) by 6% in 2040 compared with unmanaged charging, and bidirectional charging can add an even greater reduction of 9% compared with unmanaged charging in 2040.120
r edu C in G tr A n SP ort S e C tor emi SS ion S : Poli C y re C ommend Ation S
• Expand and accelerate the State Electric Vehicle Strategy to convert all public transport and fleet vehicles to be electric across WA Government and its entities by 2035
• Create an EV infrastructure master-plan for the state, with identified policies and incentives in place to facilitate charging coverage at street level, long-distance regional and private sector locations.
• Advocate to the Federal Government for strengthening of the New Vehicle Efficiency Standard to accelerate take up of electric vehicles.
• Set targets for mode-shift of travellers to zero emissions active transport options, and for lower emissions options like public transport and carpooling.
• Support Freight Decarbonisation: Shift more freight from road to rail, develop policies and programs to support market innovations in freight decarbonisation, and create incentives for zero-emission trucks and trains.
A griculture
o verview
the agriculture sector is the fourth largest contributor to emissions in wA and has decreased 10% since 2005.121 the agriculture sector, covered by the model, emitted 10mt Co2-e in 2024 and can get to 6.5mt Co2-e per annum by 2050, aligned with 1.5°C climate science.
Fuel and electricity contribute only 5-6% of emissions in this sector (0.77Mt CO2-e for fuel use and 0.15Mt CO2-e for electricity in 2024122) and within the model are captured in the electricity and transport sectors; electrification and renewable energy offers only a small reduction to emissions.
Decarbonisation of the agriculture sector can be primarily driven through feedstock (where viable) to tackle enteric fermentation, and reducing beef livestock numbers. Reductions can also be made through manure management, soil management, field burning, liming and urea application.
l ive S to C k A nd C ro PP in G drive w A AG ri C ulture emi
SS ion S
The majority of WA agricultural emissions come from livestock (including enteric fermentation and manure management) and cropping (including agricultural soils, field burning of agricultural residues, liming and urea application).
More than 40% of agricultural emissions come from livestock digestion (enteric fermentation).123
The last 20 years have seen an overall reduction in sector emissions driven by a 40% decline in livestock emissions alongside a 26% increase in cropping emissions124
Around 80% of WA’s emission intensive beef production is exported125. However, by value, WA’s main agricultural export is wheat with 46% of wheat going overseas delivering $5.5 Billion in 2022.126 Export volumes have been consistently growing over the last 30 years to a record high in 2022.127
6 agriculture
Climate is costing farmers
Estimates suggest that changes in seasonal conditions have reduced annual average farm profits by 23%, or around $29,200 per farm, when considering the period 2001 to 2020 relative to 1950 to 2000.128
r edu C in G AG ri C ultur A l
emi SS ion S i S A C h A llen G e
Agricultural emissions are hard to reduce using technology, most require change of practice as outlined below. Most other sectors can electrify processes and power with renewables, however emissions from fuel and electricity generation in WA account for just 5-6% of total agricultural emissions.129 Aside from transitioning vehicle fleets to electric tractors, headers and harvesters (with the additional benefit of reducing expensive diesel costs), there are few such options available to the agriculture sector.
As cropping emissions grow, addressing pre-farm industrial emissions (from the manufacturing of agronomic inputs like fertilizers and lime, as well as pesticides, herbicides and animal feed) will be important to WA agriculture’s mitigation efforts.130 However, significant emission reduction for this sector is likely to be from a decreasing size rather than technological abatement.
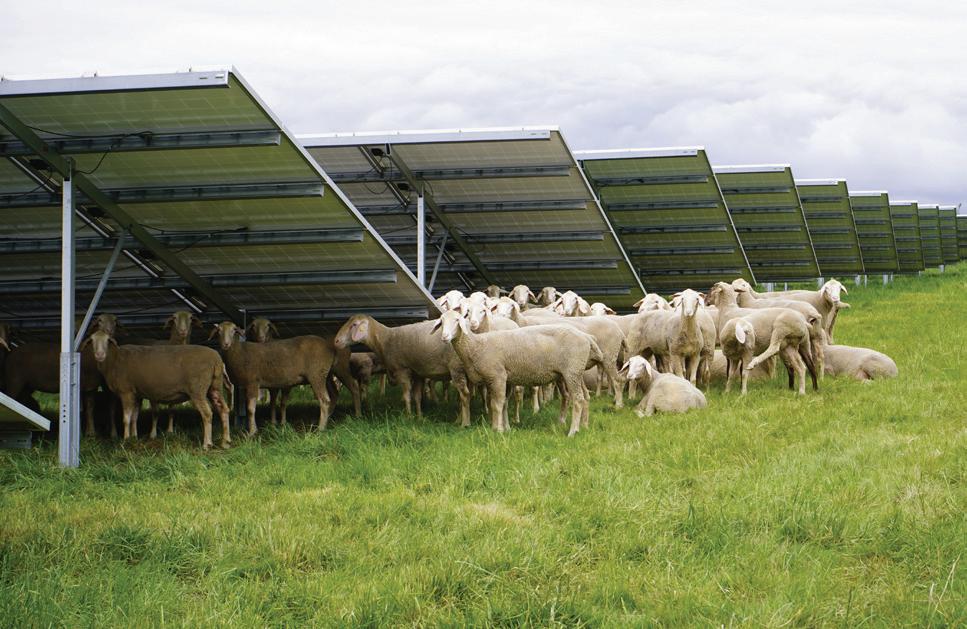
tackling livestock emissions
There have been a few promising approaches to reducing livestock emission, including feed supplements, genetic improvements and waste management.
Dairy emissions make up 6% of WA’s agricultural emissions,131 feeding supplements such as seaweed to these cattle could be used to reduce emissions from enteric fermentation.132 However the same approach cannot be used for beef cattle as only 40,000 of the two million in WA are fed in feedlots each year and the rest are free range.133 Feed lotting is used during export, so supplements could be used during this part of the lifecycle, but would only have a marginal impact on overall cattle emissions.
Breeding programs to select animals that produce less methane, and work to identify genetic markers could reduce emissions 1.45% annually134. This possess is slow but cumulative, and needs to ensure it doesn’t compromise other economic traits such as productivity and yield.
There are three key stages of manure management in livestock production, each with emissions reduction strategies that show promise135. These could be used in combination according to technical feasibility, local regulations, climate conditions, and scalability. They include:
• animal housing: frequent manure removal and air scrubbing
• manure storage and treatment: solid-liquid separation, manure covers, acidification, anaerobic digestion and composting
• manure land application with appropriate timing and shallow injection.
Additionally, behavioural change programs such as dietary meat reduction or switching programs could reduce domestic consumption of livestock.136 However, given the high portion of exports, this would again only make a marginal difference to WA emissions.
Better cropping practices, and tree planting, can reduce emissions
Soil management can enable soil to store more carbon than it releases. The NSW Government estimates that managing carbon in soils could lead to 20Mt CO2-e of carbon sequestration.137
There are many approaches including minimising tillage, management of fertiliser use, irrigation and drainage and managing livestock movement to help avoid compacting and waterlogging. Rotating crops and maintaining continuous plant cover or retaining crop residues to provide active root material and reduce erosion, including avoiding burning and overgrazing.
Using protected urea (which contains urease inhibitors) or adopting enhanced efficiency fertilizers like coated urea, can reduce the conversion of nitrogen to gaseous form and lower the environmental impact of fertilizer application. Similarly liming can reduce emissions by increasing nitrogen use efficiency.
Permanent tree and shrub plantings is another approach that supports long-term carbon sequestration. Establishing appropriate species on previously cleared land can support cobenefits including shade and shelter for livestock, windbreaks, groundcover, and reduced erosion, management of water table and salinity, and enhanced habitat for biodiversity.
lA nd diver S ifi CAtion
Agricultural land can be used to house renewable energy technology, creating new revenue streams and reducing operational costs. Agri-photovoltaics allow for dual use of the land, integrating solar panels above crops or livestock provides benefits such as shade and reduced heat stress, studies have shown they can even increase production, for example a 15% increase in wool.138 Farmers can use on-farm energy to power their operations and export excess.
• Increase funding for research and innovation for the electrification of farming equipment to reduce expensive diesel costs
• Subsidise and promote methane-reducing feed supplements to dairy and feedlot cattle and support innovations to assist administering to other ruminant sectors.
• Support for research and implementation of improved manure management practices that reduce carbon emissions.
• Comprehensive education and funding to support farming land practice. improvements, including incorporating trees and shrubs into farms.
• Collaboration with other states and Federal Governments on long-term research for agriculture and land emissions reduction.
7 reference list
1. https://www.wa.gov.au/system/files/2023-05/ swisda_report.pdf
2. https://www.dcceew.gov.au/sites/default/ files/documents/net-zero-report.pdf
3. https://www.bze.org.au/research/report/ export-powerhouse
4. https://www.superpowerinstitute.com.au/ work/the-new-energy-trade
5. https://www.industry.gov.au/publications/ resources-and-energy-quarterly-june-2025
6. https://treasury.gov.au/publication/p202570092phase-outAn2
7. https://www.iea.org/reports/global-energyand-climate-model/net-zero-emissions-by2050-scenario-nze
8. https://www.superpowerinstitute.com.au/ work/the-new-energy-trade
9. https://www.dcceew.gov.au/climate-change/ publications/national-greenhouse-accounts2023/state-and-territory-greenhouse-gasinventories-2023-emission
10. https://www.dcceew.gov.au/climate-change/ publications/national-greenhouse-accounts2022/state-and-territory-greenhouse-gasinventories-data-tables-methodology
11. https://reneweconomy.com.au/australiasland-use-emissions-data-revisions-are-anengine-of-climate-delay/
12. https://australiainstitute.org.au/wp-content/ uploads/2025/05/P1533-Emissions-from-WAgas-exports-WEB.pdf
13. https://climateanalytics.org/publications/ impact-of-burrup-hub-on-westernaustralias-paris-agreement-carbonbudget#:~:text=The%20fast%20ramping%20 up%20of,again%20by%20the%20early%20 2030s.
14. https://www.bze.org.au/research/report/ export-powerhouse#:~:text=In%20 Exports%20Powerhouse%2C%20we%20 explore,%2C%20technologies%20and%20 up%2Dskilling.
15. https://www.superpowerinstitute.com.au/ work/the-new-energy-tradfrontrunnere
16. https://static1.squarespace.com/ static/65cd4a36dc81661957e4757f/t/675 b60fbafaecf0ab784eb08/1734041907060/ Forging+our+Future+-+December+2024.pdf
17. https://www.industry.gov.au/publications/ resources-and-energy-quarterly-june-2025
18. https://treasury.gov.au/publication/p2025700922
19. https://www.wa.gov.au/system/files/2022-06/ Solar%20energy%20generation.pdf
20. https://www.wa.gov.au/system/files/202305/swisda_report.pdf?trk=public_p,ost_ comment-text
21. https://www.wa.gov.au/government/ publications/sectoral-emissions-reductionstrategy-western-australia
22. https://www.rogercook.com.au/documents/ madeinwaplan.pdf
23. https://www.acs.gov.au/pages/nationalclimate-risk-assessment
24. https://www.watercorporation.com. au/our-water/climate-change-andwa#:~:text=Because%20Western%20 Australia%20has%20large,a%20great%20 place%20to%20live.
25. https://www.abc.net.au/news/2025-03-17/ emergency-warning-for-ledge-point-bushfirenorth-of-perth/105059768
26. https://www.theguardian.com/australianews/2025/jan/25/western-australiabushfires-homes-reportedly-lost-andthousands-told-it-is-too-late-to-leave
27. https://www.abc.net.au/news/2025-03-11/ windy-harbour-bushfire-one-month-southcoast-wa/105031902
28. https://www.abc.net.au/news/2024-11-28/ cervantes-bushfire-emergency-warningremains-north-of-perth/104656392
29. https://www.abc.net.au/news/2023-11-24/ perth-bushfire-updates-live-wanneroo-firesemergency/103147486
30. https://www.abc.net.au/news/2024-04-11/ ecologists-warn-potential-forest-collapseevent-wa/103682304
31. https://www.aims.gov.au/information-centre/ news-and-stories/worst-bleaching-eventrecord-wa-coral-reefs-following-long-lastingand-widespread-marine-heatwave
32. https://www.weforum.org/stories/2023/10/ climate-loss-and-damage-cost-16million-per-hour/#:~:text=Writer%2C%20 EcoWatch-,The%20global%20cost%20of%20 climate%20change%20damage%20is%20 estimated%20to,climate%20change%20 become%20more%20severe
33. https://www.theguardian.com/ business/2025/jun/01/natural-disasters-costaustralias-economy-22bn-in-first-half-of2025-new-treasury-analysis-shows
34. https://www.aemo.com.au/-/media/files/ electricity/wem/planning_and_forecasting/ esoo/2023/2023-wholesale-electricitymarket-electricity-statement-of-opportunitieswem-esoo.pdf
35. https://aemo.com.au/-/media/files/electricity/ nem/planning_and_forecasting/nem_ esoo/2024/CSIRO-2023-Electric-VehicleForecast-Report
36. https://www.aemo.com.au/energy-systems/ electricity/wholesale-electricity-marketwem/wem-forecasting-and-planning/wemelectricity-statement-of-opportunities-wemesoo
37. https://cer.gov.au/markets/reports-and-data/ nger-reporting-data-and-registers/2022-23published-data-highlights
38. https://www.dcceew.gov.au/climate-change/ publications/australias-emissions-projections2023
39. Australian Energy Statistics | energy.gov.au
40. https://www.wa.gov.au/system/files/2024-07/ sers-final-report-20240702.pdf
41. https://aluminium.org.au/wp-content/ uploads/2022/07/220719-PATHWAY-FACTSHEET-03-ALUMINA.pdf
42. https://www.epa.wa.gov.au/sites/default/ files/EPA_Report/EPA%20Report%20 1705%20-%20Perdaman%20Urea%20 Project%20-%20assessment%20report%20 %281%29.pdf
43. https://www.dcceew.gov.au/climate-change/ publications/national-greenhouse-accounts2023/national-inventory-by-economic-sector
44. https://explore.openelectricity.org.au/
45. Department of Climate Change, Energy, the Environment and Water, Australian Energy Statistics, Table O, August 2025
46. https://www.wa.gov.au/organisation/energypolicy-wa/electricity-industry#:~:text=In%20 Western%20Australia%2C%20the%20 majority,by%20the%20Western%20 Australian%20Government.
47. https://sen.asn.au/wp-content/uploads/ Meeting-Summary-and-Learnings-_-WA-RETRoundtable-3rd-July-2025_final-GoogleDocs.pdf
48. Department of Climate Change, Energy, the Environment and Water, Australian Energy Statistics, Table O, August 2025
49. https://www.wa.gov.au/system/files/2024-07/ sers-final-report-20240702.pdf
50. https://www.energy.gov.au/publications/ australian-energy-statistics-table-o-electricitygeneration-fuel-type-2023-24-and-2024table O
51. https://www.energy.gov.au/publications/ australian-energy-statistics-table-o-electricitygeneration-fuel-type-2023-24-and-2024
52. https://aemo.com.au/-/media/files/ electricity/wem/planning_and_forecasting/ esoo/2025/2025-wem-electricity-statementof-opportunities.pdf?la=en
53. Hansard Daily: Legislative CouncilWednesday, August 20 2025: https:// www.parliament.wa.gov.au/hansard/daily/ uh/2025-08-20/17#:~:text=(1)%20Based%20 on%20data%20published,based%20on%20 2023%20global%20emissions
54. https://www.energy.gov.au/sites/default/ files/2025-06/Australian%20Energy%20 Statistics%202025%20Table%20O.xlsx
55. https://www.abc.net.au/news/2025-06-18/ newgen-gas-plant-bailout-bid-rejected-bywa-government/105426230
56. https://www.abc.net.au/news/2024-08-06/ what-australia-can-learn-from-californias-bigbattery-boom/104137012
57. https://theprogressplaybook. com/2025/08/20/in-numbers-solar-andbatteries-are-rapidly-displacing-gas-incalifornia
58. https://sen.asn.au/wp-content/uploads/ WA-Rooftop-Solar-and-Storage-OptimisationReport_A.pdf
59. https://www.aemo.com.au/-/media/files/ major-publications/qed/2025/qed-q1-2025. pdf
60. https://reneweconomy.com.au/wa-shatterspeak-winter-electricity-demand-records-aswind-and-batteries-power-up/.
61. https://environmentamerica.org/california/ media-center/release-100-days-renewable/
62. https://singularityhub.com/2025/07/18/ california-says-66-of-its-power-is-now-fromrenewable-or-zero-carbon-sources/
63. https://www.energy.ca.gov/sb100
64. https://electrek.co/2024/09/09/texas-no-1us-utility-scale-solar/
65. https://businessintexas.com/blog/texasleads-us-renewable-energy-growth/
66. https://www.wired.com/story/grid-scalebattery-storage-is-quietly-revolutionizing-theenergy-system/
67. https://reneweconomy.com.au/solar-windand-batteries-set-records-in-texas-as-thermalplants-the-size-of-australias-entire-coal-fleetsit-idle/
68. https://explore.openelectricity.org.au/ energy/wem/
69. https://explore.openelectricity.org.au/ energy/wem/
70. https://iceds.anu.edu.au/news-events/news/ renewable-projects-are-getting-built-faster%E2%80%93-there%E2%80%99s-even-moreneed-speed
71. https://westerndownsgreenpowerhub.com. au/
72. https://commoncapital.com.au/wp-content/ uploads/2025/06/States-of-Transition_ Common-Capital_June2025.pdf
73. https://treasury.gov.au/publication/p2025700922
74. 2024-25 GenCost report
75. https://reneweconomy.com.au/you-want-tobuild-a-gas-fired-power-station-before-2030good-luck-with-that/
76. https://www.abs.gov.au/AUSSTATS/abs@.n sf/3d68c56307742d8fca257090002029cd /7f414deb0e4165adca256e3000025c0b/$ FILE/Western%20Australia%20-%20A%20 Small%20Area%20Perspective_1.pdf
77. https://www.energyandclimate.qld.gov.au/ energy/types-of-renewables/wind-energy/ about-wind-energy#:~:text=national%20 environmental%20significance.-,Onshore%20 wind%20farms,including%20farming%20 and%20livestock%20activities.
78. https://cleanenergycouncil.org.au/newsresources/new-guide-showcases-thepotential-of-agrisolar
79. https://www.theguardian.com/australianews/article/2024/jun/13/farmers-who-grazesheep-under-solar-panels-say-it-improvesproductivity-so-why-dont-we-do-it-more
80. https://www.watc.wa.gov.au/media/qr5jfb5z/ decarbonising-western-australian-and-ourtrading-partners.pdf
81. https://www.aemo.com.au/-/media/files/ electricity/wem/planning_and_forecasting/ esoo/2025/2025-wem-electricity-statementof-opportunities.pdf
82. https://www.dcceew.gov.au/climate-change/ publications/national-greenhouse-accounts2023/national-inventory-by-economic-sector
83. https://static1.squarespace.com/ static/65cd4a36dc81661957e4757f/t/675 b60fbafaecf0ab784eb08/1734041907060/ Forging+our+Future+-+December+2024.pdf
84. https://australiainstitute.org.au/wp-content/ uploads/2025/05/P1533-Emissions-from-WAgas-exports-WEB.pdf
85. https://www.fenex.org.au/report/ short-and-long-term-options-for-lngplant-decarbonisation-identifiedincluding-electrification-emissions-captureand-offsets/?
86. https://www.greenhouseaccounts. climatechange.gov.au/
87. https://www.worldbank.org/en/programs/ zero-routine-flaring-by-2030
88. https://flaringventingregulations.worldbank. org/norway
89. https://www.wa.gov.au/system/files/2024-07/ walngprofilejune2024.docx
90. https://australiainstitute.org.au/report/wargains-windfall-profits-on-liquified-natural-gasexports-2022-24/
91. Australian Energy Producers (2024) https:// energyproducers.au/all_news/australian-oiland-gas-sectordelivers-record-contributionto-government-revenues-in-2023-24/; APPEA (2023) Key Statistics 2023, https://www. appea.com.au/wp-content/uploads/2023/06/ APPEA_KS23_Final_low-res.pdf
92. https://www.abc.net.au/news/2025-06-05/ offshore-gas-profit-tax-raising-less-thanforecast/105365962
93. https://australiainstitute.org.au/report/wargains-windfall-profits-on-liquified-natural-gasexports-2022-24/
94. https://energyproducers.au/wp-content/ uploads/2020/06/LNG_national-globalbenefits_WEB.pdf
95. https://www.smh.com.au/business/ banking-and-finance/woodside-contradictscsiro-report-debunking-key-climate-claims20220307-p5a2d5.html
96. https://www.abc.net.au/news/202410-19/gas-emissions-worse-than-coalstudy-finds/104481570#:~:text=The%20 peer%2Dreviewed%20study%20by,over%20 a%2020%2Dyear%20timeline.
97. https://www.boilingcold.com.au/ fortescue-slashes-electric-trainprogram-but-insists-zero-emissions-ontrack/#:~:text=Success%20now%20 depends%20on%20Fortescue,%2D%20 cars%20and%20locomotives%20%2D%20 brake.
98. https://climateenergyfinance.org/wpcontent/uploads/2025/08/CEF_TransitionTax-Incentive-Report-FINAL_20August2025. pdf
99. https://content.fortescue.com/ fortescue17114-fortescueeb60productionbbdb-8be5/media/project/ fortescueportal/shared/documents/ publications/reports/250902-incentivisingdiesel-decarbonisation.pdf
100. https://www.nature.com/articles/s43247-02200346-4
101. https://www.watc.wa.gov.au/media/ wwtbi5xn/waironoreprofilemay2025.pdf
102. https://static1.squarespace.com/ static/65cd4a36dc81661957e4757f/t/675 b60fbafaecf0ab784eb08/1734041907060/ Forging+our+Future+-+December+2024.pdf
103. https://treasury.gov.au/publication/p2025700922
104. https://worldsteel.org/publications/policypapers/climate-change-policy-paper/ 105. https://www.hydrogeninsight.com/industrial/ h2-green-steel-secures-4-5bn-of-additionalfunding-for-world-s-first-large-scale-greenhydrogen-based-steel-plant/2-1-1586810
106. https://one.oecd.org/document/DSTI/ SC(2024)3/FINAL/en/pdf
107. https://arena.gov.au/news/world-first-pilotto-electrify-calcination-in-alumina-refining/
108. https://arena.gov.au/knowledge-bank/aroadmap-for-decarbonising-australianalumina-refining/
109. https://www.c-thru.org/wp-content/ uploads/2022/12/Ammonia-Technical-BriefJune2022.pdf
110. https://arena.gov.au/projects/yuri-renewablehydrogen-to-ammonia-project/
111. https://www.sciencedirect. com/science/article/abs/pii/ S001393512301383X#:~:text=The%20 global%20warming%20potential%20 of,different%20types%20of%20fly%20ash.
112. https://www.greenhouseaccounts. climatechange.gov.au/
113. https://www.bitre.gov.au/sites/default/files/ documents/bitre-road-vehicles-australia-january2024.pdf
114. https://www.fcai.com.au/about-fcai/ annual-reports/#:~:text=Australia%20is%20 one%20of%20the,available%20at%20very% 20competitive%20prices.
115. https://annualreports.mainroads.wa.gov.au/ AR-2023/downloads-and-appendices/roadfacts-summary-sheet.html
116. https://www.carexpert.com.au/car-news/ vfacts-2024-new-vehicle-sales-hit-recordhigh-but-slump-expected-soon
117. https://www.aaa.asn.au/library/q4-2024hybrid-sales-cool-off-but-still-leading-evs-q42024/
118. https://www.rogercook.com.au/documents/ madeinwaplan.pdf
119. https://www.climateworkscentre.org/wpcontent/uploads/2024/06/DecarbonisingAustralias-transport-sector-ReportClimateworks-Centre-June-2024.pdf
120. https://theicct.org/publication/smartcharging-cars-trucks-europe-mar25/
121. https://www.greenhouseaccounts. climatechange.gov.au/
122. https://library.dpird.wa.gov.au/cgi/ viewcontentcgiarticle%3D1005% 26context%3Dc_ publishedrpts&sa=D&source =docs&ust=1759463278909453&usg=AOvV aw3AvuMyLVqw38M3DDKmq6Nh
123. https://www.agric.wa.gov.au/climate-change/ greenhouse-gas-emissions-wa-agriculture#: ~:text=Western%20Australia’s%20emissions %20from%20agriculture%20over%20time& text=Livestock%20contribute%20the%20 largest%20portion,nitrous%20oxide%20 (N02).
124. https://www.agric.wa.gov.au/climatechange/greenhouse-gas-emissionswa-agriculture#:~:text=Western%20 Australia’s%20emissions%20 from%20agriculture%20over%20 time&text=Livestock%20contribute%20the%20largest%20portion,nitrous%20 oxide%20(N02).
125. https://library.dpird.wa.gov.au/cgi/ viewcontent.cgi?article=1005&context=cs_ publishedrpts
126. https://www.agriculture.gov.au/sites/ default/files/documents/western-australiaagricultural-export-snapshot-2022.pdf
127. https://library.dpird.wa.gov.au/cgi/ viewcontent.cgi?article=1005&context=cs_ publishedrpts
128. https://link.springer.com/article/10.1007/ s10584-022-03356-5
129. https://library.dpird.wa.gov.au/cgi/ viewcontent.cgi?article=1005&context=cs_ publishedrpts
130. Greenhouse gas accounting for Western Australian agriculture 2022, PDF (library.dpird.wa.gov.au)
131. https://www.wa.gov.au/system/files/2024-07/ sers-final-report-20240702.pdf
132. https://www.csiro.au/en/research/animals/ livestock/futurefeed
133. https://library.dpird.wa.gov.au/cgi/ viewcontent.cgi?article=1005&context=cs_ publishedrpts
134. https://www.mla.com.au/research-anddevelopment/reports/2015/genetictechnologies-to-reduce-methane-emissionsfrom-australian-beef-cattle/
135. https://www.sciencedirect. com/science/article/abs/pii/ S0301479724000148#:~:text=The%20 results%20indicated%20several%20 promising,%2C%20scalability%20and%20 cost%2Deffectiveness.
136. https://reporter.anu.edu.au/all-stories/ kangaroos-the-solution-to-lingering-livestockgas-challenge.
137. https://www.dpi.nsw.gov.au/__data/assets/ pdf_file/0006/1314564/NSW-Carbonemissions-brochure-Final.pdf
138. https://www.theguardian.com/australianews/article/2024/jun/13/farmers-who-grazesheep-under-solar-panels-say-it-improvesproductivity-so-why-dont-we-do-it-more
139. https://www.greenpeace.org.au/greenpeacereports/report-forging-our-future/