Energy WITH SPOTLIGHT LESSONS ON Earth and Space
TEXAS
TEACHER EDITION LE VEL
2
4 MODULE
Level 4 Module 2: Energy
WITH SPOTLIGHT LESSONS ON Earth and Space
Teacher Edition
TEXAS
Great Minds® is the creator of Eureka Math® , Eureka Math2® , Wit & Wisdom®, and PhD Science® .
Published by Great Minds PBC. greatminds.org
© 2024 Great Minds PBC. Except where otherwise noted, this content is published under a limited public license with the Texas Education Agency. Use limited to noncommercial educational purposes. Where indicated, teachers may copy pages for use by students in their classrooms. For more information, visit https://gm.greatminds.org/texas.
ISBN 979-8-88588-528-7
2 3 4 5 6 7 8 9 10 XXX 28 27 26 25 24
Printed in the USA A-Print 1
© Great Minds PBC iii LEVEL 4 MODULE 2 Contents Energy Energy Overview 2 �������������������������������������������������������������������������������������������������������������������������������������������������������������������������������������������������������������������������������������������������������������������������������������� Concept 1: Energy Classification and Transfer (Lessons 1–11) 17 ����������������������������������������������������������������������������������������������������������������������������������������������������������������������������������������������� Concept 2: Energy Transformation (Lessons 12–20) 123 �������������������������������������������������������������������������������������������������������������������������������������������������������������������������������������������������������������� Application of Concepts: Engineering Challenge (Lessons 21–26) 203 ���������������������������������������������������������������������������������������������������������������������������������������������������������������������������������� Application of Concepts: Socratic Seminar and End-of-Module Assessment (Lessons 27–29) 241 ���������������������������������������������������������������������������������������������������������������������������� Student End-of-Module Assessment, Sample Responses, and Rubric 259 ������������������������������������������������������������������������������������������������������������������������������������������������������������������������� Energy Resources 271 ������������������������������������������������������������������������������������������������������������������������������������������������������������������������������������������������������������������������������������������������������������������������������� Appendix A: Energy Storyline 338 �������������������������������������������������������������������������������������������������������������������������������������������������������������������������������������������������������������������������������������������������������� Appendix B: Energy Glossary 354 Appendix C: Energy Content-Specific Words, General Academic Words, and Spanish Cognates 356
Level 4 ▸ Energy | Earth and Space ▸ Contents PhD SCIENCE® TEXAS iv Earth and Space Earth and Space Overview 360 Spotlight Lessons on Earth and Space (Lessons 1–7) 367 Student End-of-Spotlight Assessment, Sample Responses, and Rubric 423 Earth and Space Resources 434 Appendix D: Earth and Space Glossary Appendix E: Earth and Space Content-Specific Words, General Academic Words, and Spanish Cognates End Matter Works Cited Credits ���������������������������������������������������������������������������������������������������������������������������������������������������������������������������������������������������������������������������������������������������������������������������������������������������� Acknowledgments ����������������������������������������������������������������������������������������������������������������������������������������������������������������������������������������������������������������������������������������������������������������������������� © Great Minds PBC 482 483 486 488 490
Energy T E XA S
Energy Overview
ESSENTIAL QUESTION
How do windmills change wind to light?
Introduction
All the life of the universe may be regarded as manifestations of energy masquerading in various forms, and all the changes in the universe as energy running about from one of these forms to the other, but always without altering the total amount.
—Sir James Jeans, 1929 (1945, 104)
The module begins and ends with students observing the anchor phenomenon—windmills that harness the wind to generate electricity. Throughout the module, students explore the Essential Question, How do windmills change wind to light?, and apply key conceptual understandings to build and refine an anchor model to explain the anchor phenomenon. At the end of the module, students use their knowledge of energy classification, transfer, and transformation to explain the windmill phenomenon and apply these concepts in new contexts during an Engineering Challenge and the End-of-Module Assessment. Through these experiences, students begin to develop the enduring understanding
that energy cannot be created or destroyed, but it can be transferred and transformed to be more useful.
Lessons 1 through 11 address the Concept 1 Focus Question: What is energy and how does it transfer from place to place? Students begin to grasp that energy is why things happen in the world around them. They observe different phenomena that indicate energy is present and classify those energy phenomena in categories. They then develop the understanding that energy can transfer (or move) from one object to another through collisions. Lessons 1 through 3 introduce the anchor phenomenon through
2 © Great Minds PBC
paintings and photographs of windmills as well as through hands-on activities in which students build physical windmill models. Students are also introduced to William Kamkwamba, a real student from Malawi and the subject of The Boy Who Harnessed the Wind (Kamkwamba and Mealer 2012), who built a windmill to generate electricity for his family. In doing so, he helped bring electricity to his community. Reflecting on William’s story, students organize their questions on a driving question board and draw a class consensus model of a windmill. Students revisit the driving question board and an anchor model throughout the module to build a coherent understanding of energy. Engaging in these practices from the very first lesson allows students to take an active role in the educational process and gives teachers insight into students’ background knowledge and current understanding of energy. In Lessons 4 and 5, students observe energy through a series of hands-on energy stations. Students classify the energy phenomena that indicate the presence of energy in categories such as sound, light, heat, electricity, water waves, and the motion of objects. In Lessons 6 and 7, students plan and conduct investigations to study the relationship between energy and speed. They observe that the amount of energy transferred to an object affects its speed—transferring more energy to an object causes it to move faster. Lessons 8 and 9 focus on collisions. Students conduct an investigation and develop a model to explain how energy can be transferred by moving objects. In observing a moving object colliding with a stationary object, they note that an object traveling at greater speed transfers more energy to the stationary object and pushes it farther than the same object traveling at a slower speed. They apply their understanding of energy transfer to the anchor phenomenon, updating the anchor model to show that energy is transferred from the windmill’s blades to its wires and then to the light bulb. In Lesson 10, students conduct an investigation to find out what causes an object to slow down and stop as the object moves across different materials. In Lesson 11, students analyze and interpret their investigation data to explain that friction causes the forces acting on a moving object to be unbalanced, which causes the object to slow down and eventually stop.
Lessons 12 through 20 address the Concept 2 Focus Question: How does energy transform? Students learn that energy transforms when one energy
phenomenon changes into any other energy phenomenon. In Lessons 12 and 13, students identify energy transfers and transformations by observing changes in energy indicators as energy moves through systems. Students then focus on a heat lamp system to model the energy transfers and transformations that allow the heat lamp to use electrical energy to produce thermal and light energy. In Lessons 14 and 15, students explore circuits, conductors, and insulators. In Lesson 14, students work in groups to supply energy to a light bulb by creating an electrical circuit. In Lesson 15, students investigate various materials to determine which are conductors of electrical energy and which are not. They then examine photographs of conductors and insulators of thermal energy. By building a simple generator in Lessons 16–18, students observe how a windmill generates electricity by transforming mechanical energy. In Lesson 19, students apply their knowledge of energy transformation to the anchor phenomenon for a final revision of the anchor model. In Lesson 20, students revisit The Boy Who Harnessed the Wind. This real-world story leads to the next lessons, in which students harness energy to solve a problem in an Engineering Challenge.
Lessons 21 through 29 allow students to apply their knowledge of energy classification, transfer, and transformation in an Engineering Challenge and End-of-Module Assessment, further building on their understanding of the Essential Question: How do windmills change wind to light? The story of William Kamkwamba shows students that anyone can be an engineer and solve problems in their own community. In Lessons 21 through 26, students participate in an Engineering Challenge. Students imagine people are without power after a devastating flood in their town. They build a device to harness energy by using materials from the classroom. In Lesson 26, student groups present their devices to the class and summarize their design processes, including their struggles and successes. Students then participate in a Socratic Seminar on energy in Lesson 27, revisiting the module questions and synthesizing their understanding. In Lesson 28, students reflect on their study of energy and apply their conceptual understandings in an End-of-Module Assessment. Finally, the class debriefs the End-of-Module Assessment in Lesson 29, giving the teacher and students an opportunity to revisit concepts that need further explanation and clarify misconceptions.
PhD SCIENCE® TEXAS Level 4 ▸ Energy ▸ Overview © Great Minds PBC 3
Module Map
Anchor Phenomenon: Windmills at Work
Essential Question: How do windmills change wind to light? Energy can be neither created nor destroyed, but it can be transferred and transformed to be more useful.
Concept 1: Energy Classification and Transfer
Focus Question: What is energy and how does it transfer from place to place? Energy is why things happen. Energy can transfer between objects through collisions and from place to place through water waves, electric currents, sound, thermal energy, and light.
Phenomenon
Windmills at Work
Phenomenon Question: How do windmills harness the wind?
Everything that happens in a system is caused by energy.
▪ Lesson 1: Make observations to generate questions about how windmills harness the wind.
▪ Lesson 2: Create a model windmill that generates electricity.
▪ Lesson 3: Ask questions about energy.
Level 4 ▸ Energy ▸ Overview PhD SCIENCE® TEXAS 4 © Great Minds PBC
Texas Essential Knowledge and Skills for Science English Language Proficiency Standards
Student Learning
4.1A 4.1C 4.1D 4.1E 4.1G 4.3A 4.3B 4.5B 4.5D 4.5E 4.8C 4.11A 3D 3E 4D
Phenomenon
Energy Indicators
Phenomenon Question: How do we know energy is present?
Light, sound, temperature change, and motion indicate the presence of energy in a system.
▪ Lesson 4: Observe indicators of the presence of energy.
▪ Lesson 5: Classify indicators of the presence of energy.
Effect of Energy on Speed
Phenomenon Question: What is the relationship between energy and speed?
The speed of an object is related to the energy of the object.
▪ Lesson 6: Describe the relationship between energy and speed.
▪ Lesson 7: Interpret data showing that greater energy input enables greater speed.
PhD SCIENCE® TEXAS Level 4 ▸ Energy ▸ Overview © Great Minds PBC 5
Student
Texas Essential Knowledge and Skills for Science English Language Proficiency Standards
Learning
4.1C 4.1D 4.1E 4.2B 4.3A 4.5A 4.5B 4.5E 4.8A 4.8C 3B
4.1A 4.1B 4.1D 4.1E 4.1F 4.2B 4.3A 4.3B 4.5A 4.5B 4.5E 4.8A 2I 3B
Phenomenon Student Learning
Energy Changes During a Collision
Phenomenon Question: What happens to energy when objects collide?
Energy in a system can transfer between objects through collisions, causing changes in the objects’ motion.
▪ Lesson 8: Predict the transfer of motion energy between objects during a collision.
▪ Lesson 9: Explain the transfer of motion energy between objects through forces in a collision.
Slowing Motion
Phenomenon Question: What causes a moving object to slow down and stop?
Friction can cause a moving object to slow down and stop.
▪ Lesson 10: Plan and conduct an investigation to gather evidence of a force that can cause a moving object to slow down and stop.
▪ Lesson 11: Analyze and interpret data to explain that friction can cause a moving object to slow down and stop.
Level 4 ▸ Energy ▸ Overview 6 © Great Minds PBC
Texas Essential Knowledge and Skills for Science English Language Proficiency Standards
4.1B 4.1D 4.1E 4.1F 4.1G 4.2B 4.3A 4.5B 4.5E 4.7 4.8A 3F
4.1A 4.1B 4.1C 4.1D 4.1E 4.1F 4.2B 4.3A 4.3B 4.5A 4.5B 4.5E 4.7 4.8A 3F PhD SCIENCE® TEXAS
Concept 2: Energy Transformation
Focus Question: How does energy transform?
Energy transformation occurs when one phenomenon indicating the presence of energy changes into any other energy phenomenon.
Phenomenon Student Learning
Changes in Energy Indicators
Phenomenon Question: What do we observe when energy moves through a system?
Energy is transferred and transformed as it moves through a system.
▪ Lesson 12: Observe transfers of energy that produce motion, light, sound, and thermal energy.
▪ Lesson 13: Explain that energy may transform to produce new phenomena, such as light and temperature change.
Conductors, Insulators, and Circuits
Phenomenon Question: What do we observe when energy flows through materials?
In an electrical circuit, electrical energy travels through conductors in a closed loop.
▪ Lesson 14: Demonstrate that in an electrical circuit electrical energy must travel in a closed loop.
▪ Lesson 15: Differentiate between conductors and insulators of electrical and thermal energy.
PhD SCIENCE® TEXAS Level 4 ▸ Energy ▸ Overview © Great Minds PBC 7
Texas Essential Knowledge and Skills for Science English Language Proficiency Standards
4.1C 4.1D 4.1E 4.1G 4.3A 4.3B 4.3C 4.5B 4.5E 4.8A 4.8C 3D
4.1C 4.1D 4.1E 4.1G 4.2B 4.3A 4.5A 4.5B 4.5D 4.5E 4.8B 4.8C 4A
Phenomenon Student Learning
Generating Electricity
Phenomenon Question: How do windmills generate electricity?
A generator can be used to transform mechanical energy into electrical energy.
▪ Lesson 16: Plan to build generators to transform mechanical energy into electrical energy.
▪ Lesson 17: Start building generators to transform mechanical energy into electrical energy.
▪ Lesson 18: Finish building generators to transform mechanical energy into electrical energy.
Windmills at Work
Essential Question: How do windmills change wind to light?
Everything that happens can be explained by the transfer and transformation of energy.
▪ Lesson 19: Model how windmills transfer and transform energy.
▪ Lesson 20: Explain that energy makes things happen when it is transferred and transformed.
Level 4 ▸ Energy ▸ Overview 8 © Great Minds PBC
Texas Essential Knowledge and Skills for Science English Language Proficiency Standards
4.1B 4.1C 4.1D 4.1E 4.1G 4.2B 4.3A 4.3B 4.5B 4.5D 4.5E 4.8A 4.8B 4.8C 3E 3H
4.1G 4.2B 4.3A 4.4A 4.5B 4.5D 4.5E 4.8A 4.8B 4.8C 2E PhD SCIENCE® TEXAS
Application of Concepts Task Student Learning
Engineering Challenge
Phenomenon Question: How can we apply our knowledge of energy to solve a problem?
The engineering design process can be used to create a device to transfer energy and transform it from an available form into the desired form.
▪ Lessons 21–26: Apply the engineering design process to build and improve a device that transfers and transforms energy.
PhD SCIENCE® TEXAS Level 4 ▸ Energy ▸ Overview © Great Minds PBC 9
Texas Essential Knowledge and Skills for Science English Language Proficiency Standards
4.1A 4.1B 4.1C 4.1D 4.1F 4.1G 4.2D 4.3A 4.3B 4.3C 4.4A 4.4B 4.5B 4.5D 4.5E 4.5F 4.7 4.8A 4.8B 4.8C 4.11A 4.11B 3E
End-of-Module Socratic Seminar, Assessment, and Debrief
Essential Question: How do windmills change wind to light?
In a system, specific indicators of energy can be produced through energy transfers and transformations.
▪ Lesson 27: Explain changes in a system as the transfer and transformation of energy.
(Socratic Seminar)
▪ Lesson 28: Explain changes in a system as the transfer and transformation of energy.
(End-of-Module Assessment)
▪ Lesson 29: Explain changes in a system as the transfer and transformation of energy.
(End-of-Module Assessment Debrief)
Level 4 ▸ Energy ▸ Overview 10 © Great Minds PBC
Student Learning Texas Essential Knowledge and Skills for Science English Language Proficiency Standards
Task
4.1G 4.2B 4.3A 4.3B 4.3C 4.5A 4.5B 4.5D 4.5E 4.7 4.8A 4.8B 4.8C 3F PhD SCIENCE® TEXAS
Focus Standards*
Texas Essential Knowledge and Skills for Science
4.1 Scientific and engineering practices. The student asks questions, identifies problems, and plans and safely conducts classroom, laboratory, and field investigations to answer questions, explain phenomena, or design solutions using appropriate tools and models. The student is expected to
4.1A ask questions and define problems based on observations or information from text, phenomena, models, or investigations;
4.1B use scientific practices to plan and conduct descriptive investigations and use engineering practices to design solutions to problems;
4.1C demonstrate safe practices and the use of safety equipment during classroom and field investigations as outlined in Texas Education Agency–approved safety standards;
4.1D use tools, including hand lenses; metric rulers; Celsius thermometers; calculators; laser pointers; mirrors; digital scales; balances; graduated cylinders; beakers; hot plates; meter sticks; magnets; notebooks; timing devices; sieves; materials for building circuits; materials to support observation of habitats of organisms such as terrariums, aquariums, and collecting nets; and materials to support digital data collection such as computers, tablets, and cameras, to observe, measure, test, and analyze information;
4.1E collect observations and measurements as evidence;
4.1F construct appropriate graphic organizers used to collect data, including tables, bar graphs, line graphs, tree maps, concept maps, Venn diagrams, flow charts or sequence maps, and input-output tables that show cause and effect; and
4.1G develop and use models to represent phenomena, objects, and processes or design a prototype for a solution to a problem.
4.2 Scientific and engineering practices. The student analyzes and interprets data to derive meaning, identify features and patterns, and discover relationships or correlations to develop evidence-based arguments or evaluate designs. The student is expected to
4.2B analyze data by identifying any significant features, patterns, or sources of error; and
4.2D evaluate a design or object using criteria
4.3 Scientific and engineering practices. The student develops evidence-based explanations and communicates findings, conclusions, and proposed solutions. The student is expected to
4.3A develop explanations and propose solutions supported by data and models,
4.3B communicate explanations and solutions individually and collaboratively in a variety of settings and formats, and
4.3C listen actively to others’ explanations to identify relevant evidence and engage respectfully in scientific discussion
* The bold text identifies standards that students should master in this module. The italicized text identifies standards that students will develop knowledge of throughout the year or will master in later modules. Italicized standards may appear as part of the assessments in this module.
PhD SCIENCE® TEXAS Level 4 ▸ Energy ▸ Overview © Great Minds PBC 11
4.4 Scientific and engineering practices. The student knows the contributions of scientists and recognizes the importance of scientific research and innovation for society. The student is expected to
4.4A explain how scientific discoveries and innovative solutions to problems impact science and society; and
4.4B research and explore resources such as museums, libraries, professional organizations, private companies, online platforms, and mentors employed in a science, technology, engineering, and mathematics (STEM) field to investigate STEM careers.
4.5 Recurring themes and concepts. The student understands that recurring themes and concepts provide a framework for making connections across disciplines. The student is expected to
4.5A identify and use patterns to explain scientific phenomena or to design solutions;
4.5B identify and investigate cause-and-effect relationships to explain scientific phenomena or analyze problems;
4.5D examine and model the parts of a system and their interdependence in the function of the system;
4.5E investigate how energy flows and matter cycles through systems and how matter is conserved; and
4.5F explain the relationship between the structure and function of objects, organisms, and systems.
English Language Proficiency Standards
2E Use visual, contextual, and linguistic support to enhance and confirm understanding of increasingly complex and elaborated spoken language
2I Demonstrate listening comprehension of increasingly complex spoken English by following directions, retelling or summarizing spoken messages, responding to questions and requests, collaborating with peers, and taking notes commensurate with content and grade-level needs.
4.7 Force, motion, and energy. The student knows the nature of forces and the patterns of their interactions. The student is expected to
4.7 plan and conduct descriptive investigations to explore the patterns of forces such as gravity, friction, or magnetism in contact or at a distance on an object.
4.8 Force, motion, and energy. The student knows that energy is everywhere and can be observed in cycles, patterns, and systems. The student is expected to
4.8A investigate and identify the transfer of energy by objects in motion, waves in water, and sound;
4.8B identify conductors and insulators of thermal and electrical energy; and
4.8C demonstrate and describe how electrical energy travels in a closed path that can produce light and thermal energy.
4.11 Earth and space. The student understands how natural resources are important and can be managed. The student is expected to
4.11A identify and explain advantages and disadvantages of using Earth’s renewable and nonrenewable natural resources such as wind, water, sunlight, plants, animals, coal, oil, and natural gas; and
4.11B explain the critical role of energy resources to modern life and how conservation, disposal, and recycling of natural resources impact the environment.
3B Expand and internalize initial English vocabulary by learning and using high-frequency English words necessary for identifying and describing people, places, and objects, by retelling simple stories and basic information represented or supported by pictures, and by learning and using routine language needed for classroom communication.
3D Speak using grade-level content area vocabulary in context to internalize new English words and build academic language proficiency.
Level 4 ▸ Energy ▸ Overview 12 © Great Minds PBC
PhD SCIENCE® TEXAS
3E Share information in cooperative learning interactions
3F Ask and give information ranging from using a very limited bank of high-frequency, high-need, concrete vocabulary, including key words and expressions needed for basic communication in academic and social contexts, to using abstract and contentbased vocabulary during extended speaking assignments
3H Narrate, describe, and explain with increasing specificity and detail as more English is acquired.
Building Content Knowledge
Kindergarten through Level 2 lay the foundation for understanding force, motion, and energy as students observe and record ways that objects can move and then compare patterns of movement. In Level 3, students demonstrate and observe how pushing and pulling on objects can change their position and motion, and students observe forces acting on objects.
In Level 4, students build on their knowledge of force, motion, and energy as they investigate energy indicators, transfer, and transformation and determine the relationship between speed and energy. Students begin the Energy Module by making observations to generate questions about how windmills harness the wind. Students are introduced to the book The Boy Who Harnessed the Wind (Kamkwamba and Mealer 2012), and they create a model windmill. Students use the model windmill to create an anchor model that is used throughout the module to apply their learning of energy and electricity. Students ask questions about the windmill phenomenon and the concept of energy that drive their learning throughout the module.
Throughout Concept 1, students explore the Concept 1 Focus Question: What is energy and how does it transfer from place to place? They first observe indicators of the presence of different forms of energy, and then they use their observations to classify indicators of energy into categories, such as sound, light, temperature change, and motion (4.8A). Then students design an investigation to describe the relationship between
4A Learn relationships between sounds and letters of the English language and decode (sound out) words using a combination of skills such as recognizing sound-letter relationships and identifying cognates, affixes, roots, and base words.
4D Use prereading supports such as graphic organizers, illustrations, and pretaught topic-related vocabulary and other prereading activities to enhance comprehension of written text.
energy and speed (4.8A). Through analysis of their data and interpretation of patterns, students find that transferring more energy to an object allows it to move with more speed. Students then build on their understanding by investigating how energy can transfer between objects through collisions, causing changes in the objects’ motion (4.7). Students then conduct an investigation to gather evidence of a force that can cause a moving object to slow down and stop. Through this investigation, students make connections between mechanical energy and forces acting on an object (4.7).
In Concept 2, students observe how energy moves through systems, and develop a model to show how energy transfers and transforms (4.8C). They identify patterns and relationships in their observations to understand that energy that is transferred by light, sound, and heat may transform to produce new energy phenomena, such as motion, light, sound, and temperature change. Students build on their understanding of energy transfer and transformation as they demonstrate that in an electrical circuit electrical energy must travel in a closed loop (4.8C). Students investigate various materials to determine which are conductors of electrical energy and which are not. Next, students examine photographs of conductors and insulators of thermal energy, and then discuss the relationship between conductors and insulators
PhD SCIENCE® TEXAS Level 4 ▸ Energy ▸ Overview © Great Minds PBC 13
of electrical and thermal energy (4.8B). Students then plan and build generators to transform mechanical energy into electrical energy (4.8A, 4.8B, 4.8C). Students revise the class anchor model to show how windmills transfer and transform energy and explain that energy makes things happen when it is transferred and transformed. Students revisit
the story of William Kamkwamba in preparation for the Engineering Challenge, during which they design a device that transforms energy from an available form into the desired form (4.8A, 4.8C). Students then reflect on their learning about energy and apply their understanding of energy to a new context in the End-of-Module Assessment.
Key Terms
In this module, students learn the following terms through investigations, models, explanations, class discussions, and other experiences.
▪ Circuit
▪ Collision
▪ Conductor
▪ Contact force
▪ Electrical energy
▪ Energy
▪ Energy transfer
▪ Energy transformation
▪ Generator
▪ Indicators of energy
▪ Insulator
▪ Mechanical energy
▪ Speed
▪ System
Level 4 ▸ Energy ▸ Overview 14 © Great Minds PBC
PhD SCIENCE® TEXAS
Safety Considerations
The safety and well-being of students are of utmost importance in all classrooms, and educators must act responsibly and prudently to safeguard students. Science investigations frequently include activities, demonstrations, and experiments that require extra attention regarding safety measures. Educators must do their best to ensure a safe classroom environment.
The hands-on, minds-on activities of this module focus on energy. Students use various materials to investigate aspects of energy when visiting energy stations, building a windmill model by using Snap Circuits® by Elenco®, conducting experiments, constructing a generator, and designing and building their own device. Some of the more important safety measures to implement in this module follow:
1. Teachers must explain and review safety expectations to students before each activity.
2. Students must listen carefully to and follow all teacher instructions. Instructions may be verbal, on classroom postings, or written in the Science Logbook or other handouts.
3. Students must demonstrate appropriate classroom behavior (e.g., no running, jumping, pushing) during science investigations. Students must handle all supplies and equipment carefully and respectfully.
4. Students and adults must wear personal protective equipment (e.g., safety goggles) during investigations that require the use of such equipment. In this module, anyone working with wires, ball bearings, and spinning fan or windmill blades must wear goggles.
5. Debris must be cleaned up immediately. During investigations, items can fall to the floor even when everyone is careful. Immediate removal of debris from the floor is essential to help prevent slips and falls.
6. Students must never place any materials in their mouth during a science investigation.
7. Put away all food and drinks during science investigations. Food and drinks can be easily contaminated by investigation materials. Additionally, spilled food or drinks can disrupt investigations.
8. Monitor student activity on the internet. If students are permitted access to the internet for science research purposes, their activity must be monitored to ensure that it conforms with school and district policies.
More information on safety in the elementary science classroom appears in the Implementation Guide. Teachers should always follow their school’s or district’s health and safety guidelines. For additional information on safety in the science classroom, consult the Texas Education Agency–approved safety standards (4.1C).
PhD SCIENCE® TEXAS Level 4 ▸ Energy ▸ Overview © Great Minds PBC 15
Additional Reading for Teachers
Energy: Stop Faking It! Finally Understanding Science So You Can Teach It
by William C. Robertson and Brian Diskin
Teaching Energy across the Sciences, K–12 by Jeffrey
Nordine
Additional Reading for Students
Energy Island: How One Community Harnessed the Wind and Changed Their World by
Allan Drummond
Level 4 ▸ Energy ▸ Overview 16 © Great Minds PBC
PhD SCIENCE® TEXAS
Lessons 1–3 Windmills at Work Prepare
Lesson 1 begins with a discussion of students’ experiences with wind. Students look at paintings and photographs of windmills and share their observations of how windmills might work. In Lesson 2, students are introduced to the story of William Kamkwamba, a boy who built a windmill to harness the wind and help provide his community with electricity and water. To see the power of wind for themselves, students build their own windmills and observe the transfer of energy. In Lesson 3, students create an anchor model to record their initial understanding of how windmills work. They then develop a driving question board that will guide student learning throughout the module.
Student Learning
Knowledge Statement
Everything that happens in a system is caused by energy.
Objectives
▪ Lesson 1: Make observations to generate questions about how windmills harness the wind.
▪ Lesson 2: Create a model windmill that generates electricity.
▪ Lesson 3: Ask questions about energy.
Concept 1: Energy Classification and Transfer
Focus Question
What is energy and how does it transfer from place to place?
Phenomenon Question
How do windmills harness the wind?
PhD SCIENCE® TEXAS Level 4 ▸ Energy ▸ Lessons 1–3 © Great Minds PBC 17
Standards Addressed
Texas Essential Knowledge and Skills
Content Standards
4.8C Demonstrate and describe how electrical energy travels in a closed path that can produce light and thermal energy. (Introduced)
4.11A Identify and explain advantages and disadvantages of using Earth’s renewable and nonrenewable natural resources such as wind, water, sunlight, plants, animals, coal, oil, and natural gas. (Addressed)
Scientific and Engineering Practices
4.1A Ask questions and define problems based on observations or information from text, phenomena, models, or investigations.
4.1C Demonstrate safe practices and the use of safety equipment during classroom and field investigations as outlined in Texas Education Agency–approved safety standards.
4.1D
Use tools, including hand lenses; metric rulers; Celsius thermometers; calculators; laser pointers; mirrors; digital scales; balances; graduated cylinders; beakers; hot plates; meter sticks; magnets; notebooks; timing devices; sieves; materials for building circuits; materials to support observation of habitats of organisms such as terrariums, aquariums, and collecting nets; and materials to support digital data collection such as computers, tablets, and cameras, to observe, measure, test, and analyze information.
4.1E Collect observations and measurements as evidence.
4.1G Develop and use models to represent phenomena, objects, and processes or design a prototype for a solution to a problem.
4.3A Develop explanations and propose solutions supported by data and models.
4.3B Communicate explanations and solutions individually and collaboratively in a variety of settings and formats.
Level 4 ▸ Energy ▸ Lessons 1–3 18 © Great Minds PBC
Standard Student Expectation Lesson(s)
2, 3
1
Standard Student Expectation Lesson(s)
1,
3
1
1, 2
1
1, 2, 3
1, 3
1, 2, 3 PhD SCIENCE® TEXAS
Recurring Themes and Concepts
English Language Proficiency Standards
PhD SCIENCE® TEXAS Level 4 ▸ Energy ▸ Lessons 1–3 © Great Minds PBC 19
Standard Student Expectation Lesson(s) 4.5B Identify and investigate cause-and-effect relationships to explain scientific phenomena or analyze problems. 1, 3 4.5D Examine and model the parts of a system and their interdependence in the function of the system. 2 4.5E Investigate how energy flows and matter cycles through systems and how matter is conserved. 2, 3
Standard Student Expectation Lesson(s) 3D Speak using grade-level content area vocabulary in context to internalize new English words and build academic language proficiency. 1, 3 3E Share information in cooperative learning interactions. 1, 2 4D Use prereading supports such as graphic organizers, illustrations, and pretaught topic-related vocabulary and other prereading activities to enhance comprehension of written text. 2 Materials Student Materials Lesson(s) Science Logbook (Lesson 1 Activity Guide) 1, 2 Pinwheel investigation: pencil (1), paper plate (1), pushpin (1), scissors (1), handheld balloon pump (1 per group), safety goggles (1 per student) 1 Windmill model investigation (1 set per group): base grid (1), fan (1), generator (1), pivot stand base (1), pivot post (1), pivot top (1), black jumper wire (1), red jumper wire (1), red LED (1), handheld balloon pump (1) 2 Science Logbook (Lesson 2 Activity Guide) 2, 3 Science Logbook (Lesson 3 Activity Guide) 3 Sticky note (1) 3
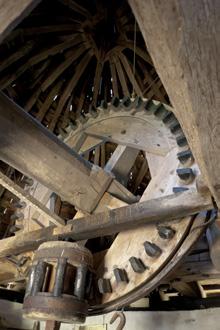
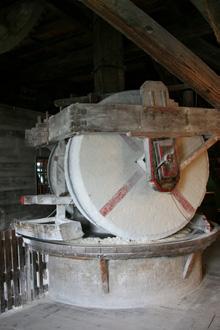
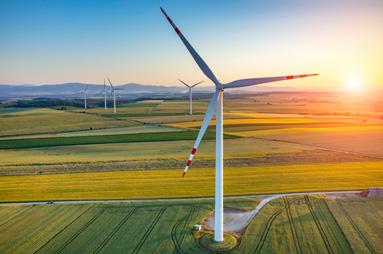
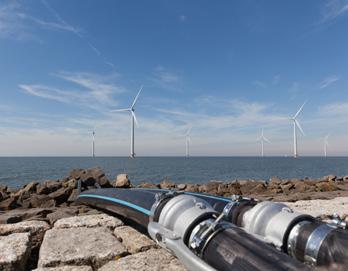
Level 4 ▸ Energy ▸ Lessons 1–3 20 © Great Minds PBC Teacher Materials Lesson(s) Windmill Paintings (Lesson 1 Resource A) 1 Windmill Gears Photograph (Lesson 1 Resource B) 1 Windmill Grinding Photograph (Lesson 1 Resource C) 1 The Boy Who Harnessed the Wind by William Kamkwamba and Bryan Mealer (2012) 2 Modern Wind Turbine Photograph (Lesson 3 Resource A) 3 Wind Farm Photograph (Lesson 3 Resource B) 3 Wind Farm Diagram (Lesson 3 Resource C) 3 Chart paper (2 sheets), marker (1) 3 Teacher Preparation Lesson(s) Cue windmill gears video (http://phdsci.link/2425). 1 Prepare materials for the windmill model investigation. (See Lesson 2 Resource.) 2 Cue wind turbine video (http://phdsci.link/2426). 3 PhD SCIENCE® TEXAS
Lesson 1
Objective: Make observations to generate questions about how windmills harness the wind.
Agenda
Launch (5 minutes)
Learn (35 minutes)
▪ Notice and Wonder about Windmills (15 minutes)
▪ Construct Miniature Windmill Models (20 minutes)
Land (5 minutes)
Launch
Tells students they will share some of their experiences with wind.
► What do you think of when you think about wind?
▪ I think of wind keeping me cool on a hot day.
▪ I think of a windy day outside when everything is blowing around.
▪ I think of wind blowing my hair as I go fast!
► What was the most powerful wind you have ever experienced?
▪ I saw a tornado. It had strong winds that swirled.
▪ I was in a hurricane and the wind was knocking over trees.
▪ The wind knocked my trash can over once and made stuff fly all over the place.
► What was the weakest wind you have ever experienced?
▪ Some days it feels like there is no wind at all.
▪ A ceiling fan set on the lowest power blows just a little wind.
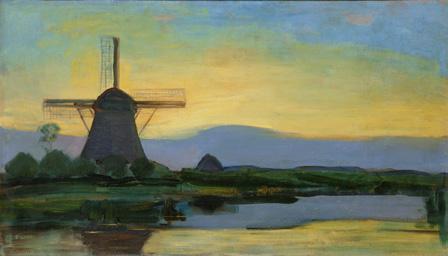
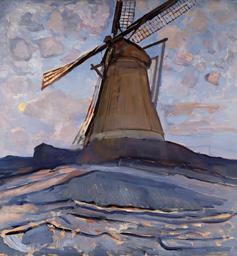
Draw attention to student responses about wind moving objects. Then display the two Piet Mondrian paintings (Lesson 1 Resource A) and ask students what type of structure is depicted in these paintings.
English Language Development
Understanding the term wind is essential to this module. English learners may benefit from seeing photographs or videos that show the effects of wind. Encourage students to use content-based vocabulary during discussions and peer interactions (3D).
PhD SCIENCE® TEXAS Level 4 ▸ Energy ▸ Lesson 1 © Great Minds PBC 21
5 minutes
Inform students that, in this lesson, they will explore the Phenomenon Question How do windmills harness the wind? Ask students to record the question in the Module Question Log of their Science Logbook.
English Language Development
Harness is a verb that is used repeatedly in this module. Take this opportunity to introduce the term explicitly, using a process such as this:
▪ Pronounce harness and have students repeat. Say har-ness in syllables, and then repeat the full word.
▪ Provide a student-friendly explanation. For example, “If you harness something, you bring it under your control and use it.”
▪ Discuss examples using harness in different contexts. For example, “The farmer harnessed her horse to a cart,” or, “People built a dam to harness the power of the Colorado River.”
Note that harness does not have word parts or Spanish cognates that will help students understand its meaning. In Spanish, the verb aprovechar is used when speaking of using sources of natural energy.
English learners may benefit from explicit introduction of other words, such as windmill, in this lesson set. After introducing these and other important words, provide scaffolds for English learners as they use the words in speaking, writing, and investigating. For more information on language scaffolds, see the English Language Development section of the Implementation Guide (3D).
Teacher Note
In subsequent lessons, continue directing students to record new Phenomenon Questions in their Module Question Log.
Content Area Connection: English
Introduce the phenomenon of wind with a poem such as “Who Has Seen the Wind” by Christina Rossetti or “The Wind” by James Reeves. Present the poem as a riddle, replacing the word wind with a blank space. Read and discuss the poem. Ask students to infer the poem’s topic and explain their reasoning with evidence from the text.
Level 4 ▸ Energy ▸ Lesson 1 22 © Great Minds PBC
PhD SCIENCE® TEXAS
Learn
35 minutes
Notice and Wonder about Windmills 15 minutes Spotlight on Knowledge and Skills
Continue to display the two Piet Mondrian paintings. Tell students to use the notice and wonder chart in their Science Logbook (Lesson 1 Activity Guide) to record what they notice and wonder as they look at the windmills.
Invite students to share their observations and questions. While students listen to their peers, they can use nonverbal signals to indicate whether they recorded a similar thought. Write students’ observations and questions on a class notice and wonder chart as they share.
Sample student responses:
I Notice
▪ Windmills are really big. That one is taller than the trees.
▪ They look like a house with a fan on top.
▪ The windmill fans have holes in them. They also have some kind of stick that connects to the house.
▪ The windmills in the paintings look very similar.
▪ Both windmills look like they are near water.
I Wonder
▪ What’s inside the house part of the windmill?
▪ What do people use windmills for? How do they work?
▪ How does the windmill spin if the fans have holes in them?
▪ Are these paintings of the same windmill? Do all windmills look like this?
▪ Why don’t these windmills look like the tall, skinny ones that I have seen before?
By sharing their initial thoughts and questions, students improve their abilities to observe evidence, ask questions, and notice patterns about windmills, such as cause-and-effect relationships. These abilities lay the foundation for developing the windmill anchor model in Lesson 3 (4.1A).
Content Area Connection: English
During science discussions, remind students of classroom expectations for speaking and listening. For example, remind students to ask each other to clarify questions and link their ideas to others’ remarks. See Speaking and Listening Supports in the Implementation Guide for resources to promote respectful, productive discourse (3D).
Teacher Note
These activities are designed to elicit students’ prior understanding. Rather than correct students, listen to how they respond and make sense of what they see and hear.
PhD SCIENCE® TEXAS Level 4 ▸ Energy ▸ Lesson 1 © Great Minds PBC 23
Refer to students’ questions about how windmills work. Tell students they will view photographs and a video from inside the body of a real windmill.
Display the windmill gears photograph (Lesson 1 Resource B) and the windmill grinding photograph (Lesson 1 Resource C).
Teacher Note
Student responses during the notice and wonder activity will vary significantly across classrooms. The primary responses to look for in the wonder column are those that relate to how windmills work and what they do. These questions lead into the activities that follow. If students do not ask these questions, show one of the paintings again and ask questions to draw students’ attention to the body beneath the windmill blades.
Additionally, students who are familiar with windmills that generate electricity may mention them here. If so, these ideas may be leveraged in the Lesson 2 Launch to motivate the investigation of modern windmills.
►
How
do you think these windmills work?
▪ I think the wooden wheel turns.
▪ The different pieces might make each other spin, like gears.
▪ It looks like the white wheel rolls over the dust. I wonder why?
Play the windmill gears video (http://phdsci.link/2425), which shows a windmill’s millstones grinding grain. Ask students to share new ideas about how the windmill might work.
If students do not infer that the wind causes the mill’s internal movements, ask them to think about what the video shows.
► What causes the wheel inside to move?
▪ I think the wind spins the fan, and the fan turns the wheel.
▪ The fan must connect to the wheels. Maybe that’s what the sticks in the paintings do.
▪ When the windmill blades spin, the stone wheel rolls and crushes the powder.
English Language Development
The following line of questioning involves using vocabulary such as windmills. English learners may benefit from additional scaffolding in the form of sentence frames to aid in language proficiency. Consider using sentence frames such as these to scaffold this conversation:
▪ Windmills might work by
▪ I think windmills work with
▪ In the windmill picture, I see . That makes me think
For more information about how to construct sentence frames, refer to the English Language Development section of the Implementation Guide (3D).
Level 4 ▸ Energy ▸ Lesson 1 24 © Great Minds PBC
PhD SCIENCE® TEXAS
Refer to the paintings and video students viewed, and explain that wind pushes the blades of the windmill, causing the blades to spin. The spinning blades turn the gears, causing the millstones to roll. The millstones grind coarse substances (e.g., wheat grain) into powder (e.g., flour). Ask students to Think–Pair–Share to answer the following questions. Teacher Note
► What are the advantages of using wind and a windmill to make flour for people to use?
▪ If the wind is blowing hard, you could grind a lot of flour!
▪ You don’t have to grind all the flour yourself, because the windmill does a lot of the work!
► What are the disadvantages of using wind and a windmill to make flour for people to use?
▪ The windmill would not make much flour if the wind was not blowing very hard.
▪ You need to have a lot of space to build a windmill to grind the flour.
After students have shared their ideas about the advantages and disadvantages of using wind and a windmill to grind flour, ask them to explain in their Science Logbook (Lesson 1 Activity Guide) how the strength of the wind affects how much flour a windmill can grind. Once students are finished, ask them to share their answers as a class. Focus on the idea that when the wind blows hard, the windmill blades turn faster, which causes the gears to turn faster and grind more flour.
Check for Understanding
Students identify the advantages and disadvantages of using a windmill to grind flour and explain how the effectiveness of the windmill depends on the strength of the wind.
TEKS Assessed
4.3A Develop explanations and propose solutions supported by data and models.
4.5B Identify and investigate cause-and-effect relationships to explain scientific phenomena or analyze problems.
4.11A Identify and explain advantages and disadvantages of using Earth’s renewable and nonrenewable natural resources such as wind, water, sunlight, plants, animals, coal, oil, and natural gas.
Many students will only know of flour as something that is bought at a store. Explain the harvesting of wheat or grains in the field and the subsequent grinding for use as needed.
Differentiation
During this discussion, post a picture of a windmill and label the parts that students mention, such as the fan, blades, gears, and millstone. Students may benefit from repeating each new term aloud after it is introduced and labeled.
PhD SCIENCE® TEXAS Level 4 ▸ Energy ▸ Lesson 1 © Great Minds PBC 25
Check for Understanding (continued) Evidence
Students share their ideas and identify the advantages and disadvantages of using a windmill to grind flour (4.11A). Students write an explanation supported by their understanding of a windmill system (4.3A) for how the effectiveness of the windmill depends on the strength of the wind (4.5B).
Next Steps
If students need support understanding how a windmill uses wind to grind flour, review the parts of the windmill with the students. Review that wind turns the large blades on the windmill, the turning blades rotate the millstones, and the rotating millstones roll over the grain to grind it into flour. Show the video and point out the parts of the system.
Construct Miniature Windmill Models 20 minutes
Explain that people have used windmills throughout history to use the wind to do work, such as grinding wheat into flour for bread. When people use the wind in this way, they are harnessing it to do something useful. Tell students they will construct their own miniature windmill model to explore the power of wind. To begin, students will design small windmill models out of paper plates.
Safety Note
In this investigation, students work with sharp objects. To minimize the risk, review these safety measures and look for evidence that students are following them (4.1C):
▪ Handle pushpins and other sharp objects with care.
▪ Wear goggles at all times during the activity.
Spotlight on Knowledge and Skills
Science impacts people’s lives in many ways each day. Throughout this module, students learn that energy is needed to make everything happen and that people can develop tools, such as windmills, to harness energy and transform it into a desired form to do work (4.11B).
English Language Development and Differentiation
When forming groups, consider the needs of each student to develop groups with a variety of abilities and interests. Also, consider the student’s English proficiency level. Grouping students with other speakers of their native language who are at different levels may be beneficial (3E).
Consider providing precut materials for the paper plate windmill for students who need support with fine motor skills.
Teacher Note
Split the class into groups and distribute the pinwheel materials to each student.
Instruct students to use the materials however they wish to construct a working miniature windmill model. Tell students that they should use the balloon pump to blow air on their windmill model after they have constructed the model. Ask students to work independently on their windmill models but share ideas with their groups as they work. Allow time for productive struggle, and encourage students to share designs that work and designs that do not. Continue to circulate to support students and refer to the windmill images as needed.
These small windmills are typically called pinwheels. The key to creating a successful pinwheel is to have blades that bend enough to be pushed when students use the balloon pump to blow air on them. Some students may need encouragement to bend the blades of their pinwheel more drastically to get the pinwheel to spin.
If some groups are finding success while others need support, it may help to have the class stop and allow students to share why they are stuck. Other students can share what modifications they made to create a pinwheel that spins (3E).
Level 4 ▸ Energy ▸ Lesson 1 26 © Great Minds PBC
PhD SCIENCE® TEXAS
Call the class together and debrief as a group.
► What happens when you use your balloon pump to blow air on your windmill model?
▪ When I pump hard, the windmill spins fast.
▪ When I walk around holding my windmill, it spins a little.
▪ If I only pump a little, sometimes it does not move at all.
► What did you notice helped the windmill model work better?
▪ The blades need to be curved to spin.
▪ At first the pushpin hole is tight, but as I spin the windmill, it gets looser and my windmill spins better.
Teacher Note
Save students’ pinwheels for use in the Engineering Challenge in Lessons 21 through 26.
Land5 minutes
After students finish discussing their designs, ask them to think again about the windmills in the paintings.
► How does your windmill model compare to the windmills in the paintings?
▪ Our windmill models spin just like the ones in the pictures.
▪ Our windmill models are much smaller and simpler.
▪ Our windmill models don’t have a house attached.
▪ The other windmills can grind wheat. Ours just spin.
Share that the miniature windmill models are a great way to demonstrate how wind can move objects. Explain to students that engineers have designed other structures similar to windmills that harness the wind to do other useful things besides grinding wheat into flour. Ask students to respond to the following question in their Science Logbook (Lesson 1 Activity Guide).
Teacher Note
Energy is commonly referred to as the ability to do work, and this idea may arise during classroom discussions. However, during this module, students develop a basic understanding of energy without defining work
Work is defined as the energy transferred when a force moves an object over a distance in the same direction as the force (3D).
PhD SCIENCE® TEXAS Level 4 ▸ Energy ▸ Lesson 1 © Great Minds PBC 27
► What could you do if you harnessed the wind?
▪ Maybe I could harness wind to sweep the floor. Could the wind do my chores?
▪ I could harness the wind to push a sailboat to an island.
Optional Homework
Ask students to look for examples of where people have harnessed the wind to do something useful in their neighborhood or home.
Level 4 ▸ Energy ▸ Lesson 1 28 © Great Minds PBC
PhD SCIENCE® TEXAS
Agenda
Launch (5 minutes)
Lesson 2
Objective: Create a model windmill that generates electricity.
Invite students to use a collaborative conversation routine, such as a Whip Around, to share their responses to the question, What could you do if you harnessed the wind? from their Science Logbook (Lesson 1 Activity Guide). Ask several students to elaborate by sharing why it might help to harness the wind in their chosen scenario; the goal is to reveal that harnessing the wind means to use wind power to make life easier.
Share with students that people had the idea that wind could make life easier hundreds of years ago when they designed the first windmills. Some early examples of such windmills were depicted in the Mondrian paintings students examined. Explain that people later learned how to use windmills to save lives. To learn how this is possible, students will continue exploring the Phenomenon Question How do windmills harness the wind?
Learn (30 minutes)
▪ Introduce and Discuss The Boy Who Harnessed the Wind (10 minutes)
▪ Construct Physical Models (20 minutes)
Land (10 minutes)
Extension
If students completed the Optional Homework from the previous lesson, consider opening this Launch by asking students to share any examples they found. This will create a natural bridge from the previous day’s learning to the next.
Teacher Note
The Whip Around collaborative conversation routine gives each student an opportunity to share their response to a question. Consider having all students stand until they share. As students share, any students with similar responses can sit down or use another signal to indicate their response. For more information, see the Instructional Routines section of the Implementation Guide (3E).
PhD SCIENCE® TEXAS Level 4 ▸ Energy ▸ Lesson 2 © Great Minds PBC 29
Launch 5 minutes
Learn
30 minutes
Introduce and Discuss The Boy Who Harnessed the Wind 10 minutes
Introduce students to The Boy Who Harnessed the Wind (Kamkwamba and Mealer 2012). Before reading, display the back and front covers of the book. Give students a few moments to observe the covers silently, and then ask the following questions.
► What do you think the book is about? Why do you think that?
Then invite students to share ideas about how the book relates to the Phenomenon Question. Build on student responses to inform students they will be learning about Malawi, a country in Southeastern Africa where the climate is generally tropical with warm days and cooler nights. Explain that most of the people in Malawi live in rural villages and are farmers, growing crops such as corn, sugar, tea, cotton, and nuts. Tell students that many villages in Malawi cannot easily access electricity or water.
Read aloud the first part of the book through page 11. Stop reading after the sentence, “Windmills can produce electricity and pump water.”
Lead a discussion with text-dependent questions such as the one that follows. As needed, reread relevant pages as students discuss their responses with a partner in a Think–Pair–Share.
► What did William dream of doing in the book?
▪ William dreamed of building things and taking them apart.
► What did William do to learn more about what he was interested in? What did he learn?
▪ William went to the library to do research.
▪ William learned about windmills from books.
▪ William learned that windmills can produce electricity and pumps can get water out of the ground.
Confirm that William researched windmills at a library and learned that windmills can produce electricity and that pumps can get water out of the ground. Point out that electricity and water would be very useful for the people of his village.
Teacher Note
Observing front and back covers of a book helps students formulate ideas about the book’s content. Provide additional prereading supports and activities as needed to enhance student comprehension of the text (4D).
Teacher Note
The Boy Who Harnessed the Wind does not contain page numbers. Pages 1 and 2 referenced in this module show the illustration of William holding a tool over his shoulder and text that begins, “In a small village in Malawi …” Consider writing small page numbers in the text for reference.
Teacher Note
Think–Pair–Share is a collaborative conversation routine that allows students to share their response with a peer before sharing with the class (3E).
Level 4 ▸ Energy ▸ Lesson 2 30 © Great Minds PBC
PhD SCIENCE® TEXAS
Construct Physical Models 20 minutes
Tell students that after William learned about windmills, he gathered materials from his village and built a large working windmill on his own that generated electricity for the people of the village to use. Tell students that William also later built a pump to get water out of the ground for the people of the village to drink and use to water their crops. Ask students to brainstorm the types of materials they would need to construct a windmill that generates electricity. Prompt them to think about what they know about electricity and what components electrical objects usually have. Students can record their ideas on personal whiteboards before sharing with the class.
Sample student responses:
▪ We need fan blades and something tall for the base, like in the pictures.
▪ We need something to connect to the windmill, like a light or something that we can plug in to see if we have electricity.
▪ We might need wires or cords to connect the electricity.
Explain that students will have access to kits that contain many of the materials mentioned, and they will work in groups to build physical models of windmills that generate electricity. Tell students that each group should use their balloon pump to blow air on their windmill model once the windmill is constructed.
Pass out windmill model materials to each group and explain that the goal is to make the light-emitting diode (LED) light up. Encourage students to assemble the materials in different configurations to achieve this goal. See Windmill Model Setup Instructions (Lesson 2 Resource) for photographs of materials and proper windmill configuration.
Teacher Note
The size of these small groups will vary depending on class size. During materials preparation, determine how many groups you can support, and use that to select a grouping method that works best for your classoom (3E).
Spotlight on Knowledge and Skills
Students may need the following guidance when constructing their models:
▪ The generator is a necessary part of the model. Allow students time to problem solve, but if they don’t use the generator, guide them to use it.
▪ Explain that LEDs must be connected to the generator in a specific orientation (because of polarity). If the wires are reversed or do not form a complete circuit, the LED will not light up (4.8C).
PhD SCIENCE® TEXAS Level 4 ▸ Energy ▸ Lesson 2 © Great Minds PBC 31
As students work, guide them to discuss and explore how and where the different components and wires connect.
► What do you think the arrows on the LED mean?
▪ I think this is the path the electricity moves.
Have students use their fingers to trace the path of electricity around the windmill system.
Remind students of the Phenomenon Question How do windmills harness the wind? Ask students to individually draw a model in their Science Logbook (Lesson 2 Activity Guide) to show how their physical model windmill harnessed the wind to generate electricity. Tell students to be sure to include and label all of the parts of the windmill system. Drawing individual models will give students time to process their knowledge.
When students finish their diagrams, ask students to share their diagrams with a partner. Students should discuss similarities and differences between their models and record them in their Science Logbook (Lesson 2 Activity Guide). Students may revise their models with any key components their partner shared with them.
To conclude the lesson, revisit the story of The Boy Who Harnessed the Wind and discuss how a windmill might help William.
► How do you think William’s windmill was able to generate electricity?
▪ In our windmill models we used a balloon pump to blow the blades and make them spin, but William must have used the wind.
▪ We used wires to connect the windmill to the LED for light, so William must have used something like wires to connect the windmill to a light.
Tell students that they will continue to learn how windmills can harness the wind and do useful things for people.
Teacher Note
To prepare students to investigate speed in a later lesson, check that students notice the correlation between the LED’s brightness and the strength of the wind applied or the speed of the moving blades. If needed, follow up by asking more specific questions, such as What changes when the wind blows harder?
Differentiation
For students with graphomotor difficulties, consider providing pictures of different windmill parts and allowing students to glue them in their Science Logbook, add labels, and explain their work.
Level 4 ▸ Energy ▸ Lesson 2 32 © Great Minds PBC
Land 10 minutes
PhD SCIENCE® TEXAS
Check for Understanding
Students draw a model to show how their physical windmill model harnessed wind to light the LED.
TEKS Assessed
4.1G Develop and use models to represent phenomena, objects, and processes or design a prototype for a solution to a problem.
4.5D Examine and model the parts of a system and their interdependence in the function of the system.
4.8C Demonstrate and describe how electrical energy travels in a closed path that can produce light and thermal energy.
Evidence
Students individually draw a model of their windmill (4.1G) labeling all the parts of the system (4.5D) to illustrate how to harness the wind to light the LED (4.8C). Students then explain their system diagram to a partner and record similarities and differences in their models.
Next Steps
If students need support drawing their model, review each part of the windmill and ask students what they think the purpose of each part is and how it should connect to the other parts in the windmill system to allow for the circuit to light up the LED. Then guide students to add each part to their windmill model.
PhD SCIENCE® TEXAS Level 4 ▸ Energy ▸ Lesson 2 © Great Minds PBC 33
Lesson 3
Objective: Ask questions about energy.
Agenda
Launch (5 minutes)
Learn (35 minutes)
▪ Notice and Wonder About Wind Farms (5 minutes)
▪ Develop an Anchor Model (10 minutes)
▪ Build a Driving Question Board (20 minutes)
Launch 5 minutes
Share the modern wind turbine photograph (Lesson 3 Resource A).
Land (5 minutes)
► Have any of you seen a machine like this in real life? If you have, how tall do you think it was?
Allow students to share their responses and then tell them that the machine in the photograph is called a wind turbine. Tell students they will watch a video to observe a working wind turbine, and play the wind turbine video (http://phdsci.link/2426). Explain that wind turbines work just like windmills—they use the wind to make something happen. Tells students that wind turbines in the United States are about 100 meters (or 328 feet) tall on average, which is the height of a 30-story building. Compare the height of the wind turbine to the height of their school building.
Content Area Connection: Mathematics
Use this opportunity to apply metric unit conversions learned in mathematics. Consider asking students to convert 100 meters to centimeters or kilometers.
Level 4 ▸ Energy ▸ Lesson 3 34 © Great Minds PBC
PhD SCIENCE® TEXAS
Review the Phenomenon Question How do windmills harness the wind?
► What do you think this wind turbine is designed to do?
▪ The old-fashioned windmills harness the wind to grind wheat, but I don’t think this wind turbine does that.
▪ We made a model windmill that turned on a light. Maybe this wind turbine is sending electricity to the farm in the picture.
To better understand how wind turbines work, explain that students will gather information about wind farms to help them add details to the windmill models they drew.
35 minutes
Notice and Wonder About Wind Farms 5
minutes
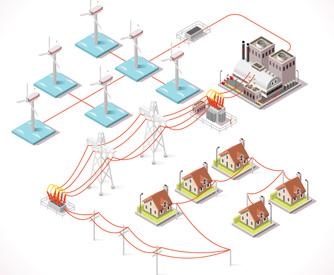
Display the wind farm photograph (Lesson 3 Resource B) and wind farm diagram (Lesson 3 Resource C).
Ask students to notice and wonder about what they see in the two images and record their thoughts in their Science Logbook (Lesson 3 Activity Guide) before sharing with the class.
Teacher Note
Encourage students to use words such as transfer, transport, carry, travel, flow, and path to describe how energy or electricity gets from the wind turbines to the houses. Use of scientific terminology will help students accurately describe their findings as they explore electricity in future lessons (3D).
PhD SCIENCE® TEXAS Level 4 ▸ Energy ▸ Lesson 3 © Great Minds PBC 35
Learn
► What do you notice about the photograph of the wind farm?
▪ There are a lot of wind turbines out in the water.
▪ The wind turbines are tall and skinny in both pictures. Even the blades are skinny.
▪ Two cords or pipes are coming out of the water. Or maybe they are going in.
► What do you notice about the diagram of the wind farm?
▪
The red lines connect the wind farm to houses. They go through other things in the middle.
▪ I think those are power lines. We have power lines where I live. When they stop working, our lights go off
► What do you wonder about these two pictures?
▪ In the diagram, does electricity flow through all the wires?
▪ What are those black cords in the photograph?
▪ Why don’t they have houses attached to them like those paintings we looked at?
▪ What do these wind turbines do? How do they make electricity?
Tell students that the black cord in the photograph connects the wind farm, or group of wind turbines, to other places. In the diagram, the wind farm connects to houses. Students will use what they noticed about the wires as they use the models they drew in Lesson 2 to develop a class anchor model.
Develop an Anchor Model 10 minutes
Invite students to review their windmill models (Lesson 2 Activity Guide) and consider the wind farm images to develop a class anchor model. Ask students to share their models by naming the specific parts they drew, and encourage them to identify common components across models. As students agree on certain components, draw them on chart paper to develop a class anchor model. Title the model and include an explanation.
Teacher Note
This initial anchor model serves as a point of reference throughout the module. As students uncover more about energy and how it behaves, they will update this model to reflect their deepening understanding. Ask students to consider whether anything is missing from the anchor model.
Sample student responses:
▪ My partner and I both drew the windmill with a stick and a fan on top.
▪ I drew a light.
Level 4 ▸ Energy ▸ Lesson 3 36 © Great Minds PBC
PhD SCIENCE® TEXAS
▪ We had a light, too, with wires going into it.
▪ My partner showed the wind, but I forgot. So, I added it to my model.
Sample student responses:
▪ I agree with drawing an arrow from the windmill blades to the lights. I think electricity for the light comes from the wind. In the physical model, the light only came on when the wind blew and the blades turned.
▪ I disagree with drawing that arrow because I think it should go along the wires. The bulb didn’t light up without wires, so I think the electricity is moving through the wires.
As students share new components to add to the anchor model, ask the rest of the class to use nonverbal signals to indicate whether they agree that the new component accurately shows how the windmill works. Call on students to justify their agreement or disagreement with evidence from their observations of the physical model. As needed, ask additional questions to help students build on the ideas of others and express their own ideas clearly. Content Area Connection: English In discussions, use additional questions and sentence frames to help students meet grade-level expectations for speaking and listening. For example, the sentence frame “I agree (or disagree) with because ” can help students link their comments to others’ ideas. In addition, students can ask the follow-up question “What evidence supports that idea?” to help peers explicitly cite and interpret evidence relevant to the topic of discussion (3D).
If most students agree with adding a component and can justify its inclusion, draw it on the anchor model. As the anchor model develops, encourage students to revise the drawing in their Science Logbook.
Check for Understanding
This task is a preassessment. Use student responses to assess students’ developing understanding of how energy flows through the windmill system to produce light.
TEKS Assessed
4.1G Develop and use models to represent phenomena, objects, and processes or design a prototype for a solution to a problem.
4.3B Communicate explanations and solutions individually and collaboratively in a variety of settings and formats.
4.5E Investigate how energy flows and matter cycles through systems and how matter is conserved.
4.8C Demonstrate and describe how electrical energy travels in a closed path that can produce light and thermal energy.
PhD SCIENCE® TEXAS Level 4 ▸ Energy ▸ Lesson 3 © Great Minds PBC 37
Check for Understanding (continued)
Evidence
In a class anchor model discussion, students use their windmill model diagrams (4.1G) to help support their explanation (4.3B) for how they built a windmill model that uses the power of the wind to cause electrical energy to flow (4.5E) through a circuit and turn on a light (4.8C).
Next Steps
Throughout the module, students will work to deepen their understanding of how energy flows through systems and use this knowledge to update the anchor model. Use this initial discussion about the anchor model to reflect informally on students’ growing understanding about energy.
Anchor models will vary for each class, but most should include these components: windmill blades, wind, a light, and wires.
Depending on the conversation, anchor models may also include these other components:
▪ A generator (shown as an unidentified box)
▪ Arrows or other indicators to show the spinning motion of the blades
▪ Arrows or lines in or around the wires to represent the movement of energy or electricity
▪ A representation of sound coming from the blades
Level 4 ▸ Energy ▸ Lesson 3 38 © Great Minds PBC
PhD SCIENCE® TEXAS
Sample anchor model:
How a Windmill Harnesses the Wind Energy?
Electricity?
Wind moves the blades of the windmill, which are attached to something that looks like a box. Energy moves through the wires and turns on the light.
If the anchor model does not include the word energy, ask the following question:
► What could be moving through the wires?
▪ Electricity. Lights need electricity to turn on.
▪ Power. The wind has power that moves through the blades and the wires to the light.
Tell students they can also use the term energy. Explain that energy is necessary to make something happen. Students will explore energy throughout the module to explain phenomena such as windmills turning on lights or grinding wheat into flour.
English Language Development
Introduce the term energy explicitly. Providing the Spanish cognate energía and related English words such as energetic may be helpful. Some students may benefit from explicit instruction of the term place in this lesson as well (3D).
Teacher Note
Students may use the word power during discussion, but power and energy are not the same. Power is the rate at which work is done or energy is transferred. Power is not discussed in this module. Encourage students to use the word energy (3D).
Teacher Note
If students need support to identify the presence of energy as the common factor, press students to share why the wind helps in each of their examples. Discuss how each example demonstrates how wind can help make people’s lives easier by doing work for them. Draw this back to the usefulness of wind by asking, Where did that extra energy come from?
PhD SCIENCE® TEXAS Level 4 ▸ Energy ▸ Lesson 3 © Great Minds PBC 39
whenLEDlightsupbladesspin.
Wires Wind
Blades moving Looks like a box.
Build a Driving Question Board 20 minutes
Acknowledge that students may have many questions about the windmill phenomenon and the concept of energy. Invite them to write their questions about energy in their Science Logbook (Lesson 3 Activity Guide). Next, have students choose at least one question they are most interested in and write it on a sticky note.
Tell the class they will use their questions to develop a driving question board. Explain that this driving question board will serve as a point of reference throughout the module as they seek to answer their questions about windmills and energy.
Display the driving question board and write (or reveal) the Essential Question How do windmills change wind to light? on the board. Explain that this question will help students focus their studies of wind and energy.
Have students share the questions on their sticky notes. After one student reads a question and places it on the driving question board, invite students who think they have a related question to read theirs and place it next to that question on the driving question board. Throughout the discussion, ask follow-up questions or make suggestions to guide students to group their questions to mirror the focus questions for Concepts 1 and 2. When students have finished posting their questions, work together to develop and post the Focus Question for each category on the driving question board.
Concept 1 Focus Question: What is energy and how does it transfer from place to place?
Related student questions may include the following:
▪ What is electricity?
▪ What does energy look like?
▪ What do the wires do?
▪ How do people get energy when there is no wind?
Concept 2 Focus Question: How does energy transform?
Related student questions may include the following:
▪ How does a windmill make electricity?
▪ How can wind change to light?
Teacher Note
As students record these questions, encourage students to mark any particularly revealing questions with a star. Students will later draw from these questions to develop the driving question board for the module.
Differentiation
Some students may need support to come up with questions about energy. If needed, post pictures around the classroom of windmills and models from previous lessons as a visual reminder of students’ experiences with energy thus far.
Differentiation
If needed, differentiate how students share or group their questions. In smaller classes, students may write more than one question to provide enough questions. With English learners or students who need support to write, consider writing students’ questions for them as the class shares. For groups reluctant to share questions, students may read each other’s questions anonymously.
Teacher Note
Write down the focus questions and keep the list available for reference during this discussion. As students post their questions, offer occasional guidance to ensure that students group the questions in a way that can later be summarized under each focus question.
Teacher Note
Each category on the driving question board relates to the Focus Questions that guide upcoming lessons. In Lessons 1 through 11, students explore the Focus Question: What is energy and how does it transfer from place to place? In Lessons 12 through 20, students explore the final Focus Question: How does energy transform?
Level 4 ▸ Energy ▸ Lesson 3 40 © Great Minds PBC
PhD SCIENCE® TEXAS
Keep the driving question board posted in a public place that makes it easy to update and revisit throughout the module. It may also help to allow for space to post associated sample student products along the way.
Sample driving question board:

Essential Question: How do windmills change wind to light?
What is energy and how does it transfer from place to place?
Where does wind come from?
Why does William need to have the windmill?
Does William use the electricity to cook?
Why don’t they have electricity in Malawi?
Related Phenomena:
Will the windmill keep going after the wind is gone?
How is electricity made?
What else did he use the windmill to power?
How can you get electricity to your house with no windmills?
Where does our electricity come from?
How did William connect the windmill to the light bulb?
How does the energy go from the windmill to the light bulb?
How did he connect electricity to his house?
How does energy transform?
How did the windmill make electricity? How many windmills would you need to power a whole city?
How does wind turn into electricity?
How much wind does the windmill need to power one light bulb?
Spotlight on Knowledge and Skills
As students continue to practice asking questions for investigation, the focus and relevance of their questions should improve. Be sure to discuss which questions will lead to a deeper understanding of how a phenomenon works and provide suggestions to further refine the focus and relevance of students’ questions (4.1A).
PhD SCIENCE® TEXAS Level 4 ▸ Energy ▸ Lesson 3 © Great Minds PBC 41
To get students to think more deeply about the anchor phenomenon, ask students to share related, familiar phenomena. Use the following question to draw out student knowledge.
► When have you experienced or heard of something harnessing the wind?
▪ When it is hot outside, I can make a paper fan and use it to cool myself.
▪ I can fold paper and throw it to make a paper airplane.
▪ I have a fan in my bedroom at home, and it blows air to cool me down.
Summarize relevant student responses at the bottom of the driving question board in a section labeled Related Phenomena. As students describe related phenomena throughout the module, add them here.
Land
Instruct students to record the Essential Question in the Module Question Log of their Science Logbook.
Draw students’ attention to the driving question board and ask them to consider which category would be the best place to begin. If necessary, guide students to choose the Concept 1 Focus Question: What is energy and how does it transfer from place to place?
Have students summarize what they have learned so far about windmills by building their own. Review the anchor model for extra support as needed.
Sample student response:
▪ Wind moves the blades, something that looks like a box sends energy through the wires to a light, and the light comes on.
Tell students that over the next few lessons they will explore the Focus Question for the first concept: What is energy and how does it transfer from place to place?
Teacher Note
If students were assigned the Optional Homework in Lesson 1, ask students to consider their responses as they generate related phenomena.
Level 4 ▸ Energy ▸ Lesson 3 42 © Great Minds PBC
5 minutes
PhD SCIENCE® TEXAS
Lessons 4–5 Energy Indicators
Prepare
To begin investigating their questions from Lessons 1 through 3, students explore the Concept 1 Focus Question: What is energy and how does it transfer from place to place? Students then visit energy stations to explore energy-related phenomena, including light, sound, thermal, motion, electrical, and water wave energy. In these stations, students observe patterns and identify indicators of the presence of energy. They use these indicators as evidence that energy is present.
Student Learning
Knowledge Statement
Light, sound, temperature change, and motion indicate the presence of energy in a system.
Objectives
▪ Lesson 4: Observe indicators of the presence of energy.
▪ Lesson 5: Classify indicators of the presence of energy.
Concept 1: Energy Classification and Transfer
Focus Question
What is energy and how does it transfer from place to place?
Phenomenon Question
How do we know energy is present?
PhD SCIENCE® TEXAS Level 4 ▸ Energy ▸ Lessons 4–5 © Great Minds PBC 43
Standards Addressed
Texas Essential Knowledge and Skills
Content Standards Standard
4.8A Investigate and identify the transfer of energy by objects in motion, waves in water, and sound. (Introduced)
4.8C Demonstrate and describe how electrical energy travels in a closed path that can produce light and thermal energy. (Addressed)
Scientific and Engineering Practices
4.1C Demonstrate safe practices and the use of safety equipment during classroom and field investigations as outlined in Texas Education Agency–approved safety standards.
Use tools, including hand lenses; metric rulers; Celsius thermometers; calculators; laser pointers; mirrors; digital scales; balances; graduated cylinders; beakers; hot plates; meter sticks; magnets; notebooks; timing devices; sieves; materials for building circuits; materials to support observation of habitats of organisms such as terrariums, aquariums, and collecting nets; and materials to support digital data collection such as computers, tablets, and cameras, to observe, measure, test, and analyze information.
Level 4 ▸ Energy ▸ Lessons 4–5 44 © Great Minds PBC
Student
Lesson(s)
Expectation
4,
5
4,
5
Lesson(s)
Standard Student Expectation
4
4.1D
4 4.1E Collect observations and measurements as evidence. 4 4.2B Analyze data by identifying any significant features, patterns, or sources of error. 5 4.3A Develop explanations and propose solutions supported by data and models. 5 PhD SCIENCE® TEXAS
Recurring Themes and Concepts
4.5A
English Language Proficiency Standards
Expand and internalize initial English vocabulary by learning and using high-frequency English words necessary for identifying and describing people, places, and objects, by retelling simple stories and basic information represented or supported by pictures, and by learning and using routine language needed for classroom communication.
PhD SCIENCE® TEXAS Level 4 ▸ Energy ▸ Lessons 4–5 © Great Minds PBC 45
Standard Student Expectation Lesson(s)
Identify and use patterns to explain scientific
or to
5
Identify and investigate cause-and-effect relationships to
scientific phenomena or analyze problems. 4, 5
Investigate how energy flows and matter cycles through systems and how matter is conserved. 4, 5
phenomena
design solutions.
4.5B
explain
4.5E
Standard Student Expectation Lesson(s)
3B
4, 5
Energy stations: 6 qt clear plastic bins (2), hand-crank flashlights (2), pull back toy cars (2), handheld radios with batteries (2), assembled Snap Circuits® windmills from Lesson 2 (2), handheld balloon pumps (2), heat lamps with reflectors (2), heat light bulbs (2), small blocks of wood (2), sandpaper (enough to create two 4″ × 5″ sheets), scissors (1 per class), thin plastic cutting board (enough to create two 5″ × 5″ sheets), toy boats (2), access
Level 4 ▸ Energy ▸ Lessons 4–5 46 © Great Minds PBC
Student Materials Lesson(s) Science Logbook (Lesson 4 Activity Guide) 4, 5 Teacher Materials Lesson(s)
Materials
to
4, 5 Sentence strips (at least 7), marker (1) 5 Chart paper (1 sheet), marker (1) 5 Teacher Preparation Lesson(s) Set up energy stations. (See Lesson 4 Resource.) 4, 5 PhD SCIENCE® TEXAS
water
Lesson 4
Objective: Observe indicators of the presence of energy.
Launch
4 minutes
Remind students of the Concept 1 Focus Question: What is energy and how does it transfer from place to place? Explain that, in this lesson, they will visit several stations to learn more about the nature of energy. Reveal the Lessons 4 and 5 Phenomenon Question: How do we know energy is present?
► How might you know when energy is present?
▪ Energy is what people and other things need in order to move.
▪ If we see something move or we see something causing something to move, energy is present.
▪ A phone screen has energy when it lights up. If something is making light, it has energy.
▪ Energy comes from electrical outlets and batteries. Electricity can make things move or turn on.
Use students’ ideas to post a short description of how people know when energy is present.
Sample description:
We think energy is present when something moves or happens.
Ask students to keep this description in mind as they visit different energy stations to see if it accurately describes what they observe.
Agenda
Launch (4 minutes)
Learn (37 minutes)
▪ Visit Energy Stations (37 minutes)
Land (4 minutes)
Differentiation
The word present has multiple meanings. Discuss the meaning of the word in the context of its use here. Challenge students to come up with other ways to ask the Phenomenon Question (e.g., How might we know when energy is in a particular place?) (3B).
PhD SCIENCE® TEXAS Level 4 ▸ Energy ▸ Lesson 4 © Great Minds PBC 47
Learn
37 minutes
Visit Energy Stations 37 minutes
Divide the class into seven groups. Groups will rotate through each of seven energy stations. The order of the stations does not matter, but students should spend about 5 minutes at each station. Set a timer to maintain an appropriate pace. Students should explore the materials at each station, look for evidence of the presence of energy, and record observations in their Science Logbook (Lesson 4 Activity Guide). Remind students to record observations that can help them answer the question in their logbook: What do you observe at each station that indicates (or shows) the presence of energy?
Students visit the following energy stations:
▪ Station 1: Hand-crank flashlight
▪ Station 2: Pull back cars
▪ Station 3: Handheld radio with batteries (Remove batteries from the radio as students change stations. Students should put in the batteries to make the radio work when they get to the station.)
▪ Station 4: Snap Circuits® windmill (assembled)
▪ Station 5: Heat lamp (Disconnect plug as students change stations. Plug the lamp back in each time students arrive at the station.)
▪ Station 6: Wood block with sandpaper
▪ Station 7: Water waves and boat
Safety Note
The Heat Lamp Station poses potential hazards. Explain that heat lamps may cause burns or eye damage and electrical outlets and cords may cause electric shock. To minimize the risk, review these safety measures and look for evidence that students are following them (4.1C):
▪ Do not touch any part of the heat lamp.
▪ Do not look directly into the lamp when it is turned on.
▪ Do not stick fingers or other objects in the electrical outlet.
Teacher Note
Students should not be given directions on what to do at each energy station. Instead, allow students to explore energy on their own. Each station should include two of each of the listed materials. No other setup is required.
Differentiation
The time at each station is limited to 5 minutes, but some students may need extra time. Adjust time as needed to ensure that students build an understanding of indicators of energy.
Level 4 ▸ Energy ▸ Lesson 4 48 © Great Minds PBC
PhD SCIENCE® TEXAS
Students work at each station for 5 minutes to explore energy and record observations.
As students work, circulate to support teamwork and promote detailed recording in their Science Logbook (Lesson 4 Activity Guide) with prompts such as these: Where did you observe evidence of energy? What senses did you use? What patterns did you observe?
Sample student responses:
▪ (Station 1: Hand-crank flashlight) When I spin the crank on the flashlight, the light comes on. I noticed a pattern: the faster I turned the crank, the brighter the light was.
▪ (Station 2: Pull back cars) Sometimes the cars moved slowly, and sometimes they moved quickly. When I pulled the car back far, it rolled far. When the two cars crashed, they made a noise. The second car moved when the first car hit it.
▪ (Station 3: Handheld radio with batteries) When I put the batteries in and pushed the power button, sound came out of the radio. When I pushed the button again, sound stopped. It’s a pattern. When I took the batteries out, the pattern changed. The radio didn’t turn on at all.
▪ (Station 4: Snap Circuits® windmill) The light turned on when the windmill blades moved and turned off when the spinning stopped. When the balloon pump blew wind harder, the light got brighter.
▪ (Station 5: Heat lamp) The lamp started to get hot when the teacher put the plug into the outlet. The air around the lamp got hot, even though I wasn’t touching it. When the teacher unplugged the lamp, the air started to cool.
▪ (Station 6: Wood block and sandpaper) After I rubbed the sandpaper on the block, the block was hot. The faster I moved the sandpaper, the hotter the block got.
▪ (Station 7: Water waves and boat) When I pushed the water with the paddle the boat moved up and down.
Content Area Connection: Mathematics
As students record observations, guide them to use specific language and estimation. Listen and look for complex comparative phrases (e.g., “twice as much as … ”) and for units of measurement (e.g., centimeters, inches). For example, a student might notice that a car that is pulled back 10 centimeters travels twice as far as a car pulled back 5 centimeters (3B).
Differentiation
Consider providing premade drawings of the stations for students who need additional support. Students can identify what they observe and add their own explanations.
PhD SCIENCE® TEXAS Level 4 ▸ Energy ▸ Lesson 4 © Great Minds PBC 49
Check for Understanding
Students record their observations from energy stations to describe evidence of energy at each station.
TEKS Assessed
4.1E Collect observations and measurements as evidence.
4.5B Identify and investigate cause-and-effect relationships to explain scientific phenomena or analyze problems.
4.8A Investigate and identify the transfer of energy by objects in motion, waves in water and sound.
Evidence
Students record their observations as evidence (4.1E) while investigating energy at stations. Students manipulate objects and observe the effects (4.5B) to identify how they know energy is present in each of the energy stations (4.8A).
Next Steps
If students need support in recording their observations and identifying energy at the stations, use one of the stations as a demonstration, manipulating the objects and then identifying evidence of energy.
Remind students that throughout the lesson, they have investigated the Phenomenon Question How do we know energy is present?
Ask students to revisit the observations they recorded in their Science Logbook (Lesson 4 Activity Guide) and circle or highlight anything that they believe indicates the presence of energy in each system. Model this process with a student sample to clarify.
Differentiation
Students may not be familiar with the terms indicate or indicator. Discuss some other common indicators in everyday life, such as a car's fuel light as an indicator of low fuel, snow as an indicator that it is cold outside, or a snake's bright colors as an indicator that it may be venomous. Allow students multiple opportunities to use these terms and other content area vocabulary during discussions and in their writing (3B).
Level 4 ▸ Energy ▸ Lesson 4 50 © Great Minds PBC
Land
4 minutes
PhD SCIENCE® TEXAS
Sample student response:
▪ When I spin the crank on the flashlight, the light comes on.
Explain that when identifying energy in a system, students should try to limit their ideas to a single word or a short phrase that shows evidence of energy. If needed, coach students to correctly identify evidence of energy with prompts such as these: Why did you write this observation? What made you think that energy was present? In what you circled, where is the energy? Can you summarize your description in a word or two? Students share their observations in the next lesson.
PhD SCIENCE® TEXAS Level 4 ▸ Energy ▸ Lesson 4 © Great Minds PBC 51
Lesson 5
Objective: Classify indicators of the presence of energy.
Launch
5 minutes
Review the Phenomenon Question How do we know energy is present?
Ask students to discuss the following questions with a partner, drawing on their observations in the previous lesson (Lesson 4 Activity Guide).
► What examples of energy did you observe?
▪ The pull back cars had energy. When I pulled them back, they moved fast.
▪ When I turned the flashlight crank and the light came on, I was using energy to turn the crank. I think the light was energy, too.
► What patterns did you notice across different examples?
▪ I used my senses at all the stations. I saw light, heard sound, and felt hot air.
▪ Things moved at most stations. The cars, flashlight crank, windmill blades, boat, and sandpaper all moved.
Tell students that because they observed so many differences in examples of energy, they will look for more patterns across their observations in this lesson.
Agenda
Launch (5 minutes)
Learn (33 minutes)
▪ Identify Examples of Energy (15 minutes)
▪ Classify Energy Indicators (18 minutes)
Land (7 minutes)
Level 4 ▸ Energy ▸ Lesson 5 52 © Great Minds PBC
PhD SCIENCE® TEXAS
Learn
33 minutes
Identify Examples of Energy
15 minutes
Ask students to share their observations of energy within the systems at each energy station and to explain, using evidence, why they thought energy was present. Remind students that energy is present when something happens (e.g., when an object moves, gets hotter, lights up, or makes a sound) and when something is required (e.g., electricity, muscles, batteries) to make something else happen.
As students provide examples and evidence, record each statement on a sentence strip.
Sample student responses:
▪ Station 1: Hand-crank flashlight
– When I turned the handle on the flashlight, the light turned on.
▪ Station 2: Pull back cars
– When I pulled back on the car, it moved and made a sound.
▪ Station 3: Handheld radio with batteries
– When I put in the batteries and turned on the radio, music played.
▪ Station 4: Windmill model
– When the balloon pump blew on the windmill blades, the light turned on.
▪ Station 5: Heat lamp
– When the teacher plugged in the heat lamp, the air around it got warmer.
▪ Station 6: Wood block and sandpaper
– The faster I rubbed the sandpaper across the wood block, the warmer the block got.
▪ Station 7: Water waves and boat
– When I pushed the water with the plastic paddle, the water moved and made waves that made the boat move.
Spotlight on Knowledge and Skills
Although naming the forms of energy may help students discuss the concepts of energy transfer and transformation with more confidence in later lessons, their use of precise terminology at this point is not the goal of instruction (4.8A).
Teacher Note
It is likely that students will use the word heat to discuss the presence of thermal energy at stations 5 and 6. Heat has many meanings in everyday language, but in science, heat has a very specific meaning: Heat is the transfer of energy from something warmer to something cooler.
If students overlook important examples of energy, prompt with questions such as these: You observed sound with the radio; did you observe sound at any other stations? What happened when you removed the radio batteries?
Classify Energy Indicators 18 minutes
After students share all of their examples of energy indicators, begin to classify the examples by the type of energy that they indicate.
Through classroom discussions, model appropriate terminology and allow students time to internalize academic language. For example, students feel a temperature change at stations 5 and 6; they do not feel heat (3B).
Differentiation
As needed, demonstrate how the objects from the stations work, or invite students to revisit the stations to gather their own evidence.
PhD SCIENCE® TEXAS Level 4 ▸ Energy ▸ Lesson 5 © Great Minds PBC 53
► Which examples have something in common?
► What patterns do you notice that connect some examples?
► What could we call each group?
As students share their ideas, arrange the sentence strips with their responses into categories and label each category.
Sample categories:
▪ Light: flashlight shines, LED lights up, light gets brighter
▪ Motion of objects: crank moves, car moves, blades spin, sandpaper rubs, boat moves, object moves faster
▪ Temperature change: object gets hot, heats up, cools down
▪ Sound: music plays, wheels turn, cars crash
▪ Other: electricity, outlet, batteries, muscles
Explain that it can be useful to classify indicators of energy into categories, such as sound, light, temperature change, motion of objects, and other indicators. Use these categories to update the description developed in Lesson 4 of how people know when energy is present.
English Language Development
Introduce the term indicators of energy explicitly. Providing the Spanish cognate indicadores de energía may also be helpful. Consider breaking indicator into the verb indicate and suffix -or and explore the Latin roots indic- and -ate. Discuss the meanings of indicator in different contexts, such as an indicator light on a dashboard.
Additionally, English learners may benefit from explicit introduction of other words in this lesson, such as object, temperature, light, sound, and electricity. Some students may also benefit from explicit introduction of the verb move. Consider highlighting opportunities for students to use content-based vocabulary in their speaking and writing throughout the module (3B).
Begin an anchor chart to record students’ knowledge of energy. Leave space for the class to add new knowledge in future lessons. Post the chart near the driving question board and anchor model so students can refer to all three visuals throughout the module. Have students add the indicators of energy to the anchor chart.
Differentiation
Some students may benefit from arranging their own sentence strips with energy examples, rather than watching someone else arrange sentence strips. Ask these students to copy the examples from sentence strips onto sticky notes, with one example per sticky note. Students can then manipulate the sticky notes to develop their own categories.
Teacher Note
Although students cannot observe the presence of energy in electricity, batteries, and muscles, they should intrinsically know that energy is present.
At this point, students may not understand that electric current flows in wires from the wall, through the cord, and to the heat lamp, or that batteries and muscles store potential energy until it is needed. Students should not be expected to understand potential (or stored) energy, but they should see batteries as a source of energy.
Teacher Note
Consider recording information for the anchor chart in a way that is easy to reposition so that the class can revise and reorganize the chart as students’ thinking develops throughout the module. Some options are writing on sentence strips taped to the chart, writing on papers that stick to the chart with removable glue, or creating a digital chart.
Level 4 ▸ Energy ▸ Lesson 5 54 © Great Minds PBC
PhD SCIENCE® TEXAS
Sample anchor chart: Energy Energy Classification and Transfer
• Energy is present when we observe something happening (moving objects, light, temperature change, sound) or when something helps make something happen (electricity, batteries).
Ask students to use their observations of energy to reflect on the Concept 1 Focus Question: What is energy and how does it transfer from place to place? Work with students to develop a description and add it to the top of the anchor chart. Acknowledge that energy is difficult to define, but it helps people understand how things happen.
Sample anchor chart:
Energy Energy Classification and Transfer
• Energy is why things happen.
• Energy is present when we observe something happening (moving objects, light, temperature change, sound) or when something helps make something happen (electricity, batteries).
Check for Understanding
Students identify examples of energy and classify indicators of energy within energy systems.
TEKS Assessed
4.2B Analyze data by identifying any significant features, patterns, or sources of error.
4.5A Identify and use patterns to explain scientific phenomena or to design solutions.
4.8A Investigate and identify the transfer of energy by objects in motion, waves in water, and sound.
Teacher Note
Using a different color for each addition to the anchor chart helps students keep track of new information.
PhD SCIENCE® TEXAS Level 4 ▸ Energy ▸ Lesson 5 © Great Minds PBC 55
Check for Understanding (continued)
Evidence
Students analyze data from the energy station investigation to look for patterns (4.2B) in their observations and identify energy indicators such as objects in motion (4.8A). Students then classify those indicators according to the patterns they observed (4.5A).
Next Steps
If students need support identifying and classifying indicators of energy, have the students revisit an energy station and help them use their observations to identify energy indicators. Give the students copies of the indicator sentence strips and work with them to classify the strips by the type of energy indicated.
minutes
Ask students whether their new understanding of energy indicators helps answer any of their questions under the Concept 1 Focus Question: What is energy and how does it transfer from place to place?
While students listen to their peers, they can use nonverbal signals to indicate if they agree or disagree.
Revisit the list of related phenomena at the bottom of the driving question board. Ask students to Think–Pair–Share how their new learning about energy may explain these phenomena. Lead a discussion to help students make appropriate connections.
► At the energy stations, when did things seem to have more energy or less energy?
▪ The radio didn’t make any sound without the battery, so I don’t think it had energy without the battery.
▪ I think the faster pull back cars had more energy than the slower ones.
▪ When I cranked the flashlight quickly, the light was brighter. And when the balloon pump blew hard on the windmill, the blades moved faster and the light was brighter. I think a brighter light has more energy than a dim light.
Call attention to student responses that relate to speed, such as the speed of the windmill blades spinning, flashlight crank turning, cars moving, and sandpaper rubbing. Tell students that they
Teacher Note
Keep energy station materials on hand during this discussion to support student use of specific evidence related to speed and energy.
Level 4 ▸ Energy ▸ Lesson 5 56 © Great Minds PBC
Land 7
PhD SCIENCE® TEXAS
may have found a pattern connecting speed and energy. Explain that if they can understand this relationship better, they may be able to harness more energy in certain situations.
In the next lesson, students will investigate the Phenomenon Question What is the relationship between energy and speed?
Optional Homework
Students find household objects to set up energy stations at home. Students ask someone at home to visit the stations, and then students discuss the energy indicators at the stations.
PhD SCIENCE® TEXAS Level 4 ▸ Energy ▸ Lesson 5 © Great Minds PBC 57
Lessons 6–7 Effect of Energy on Speed Prepare
In previous lessons, students developed a description of energy and identified indicators of its presence. In Lesson 6, students make a prediction about the relationship between energy and speed. They then explore this relationship with a range of classroom objects. In Lesson 7, students design a fair test investigation to manipulate the energy input of a system and take quantitative measurements to observe the cause and effect relationship between energy and speed.
Student Learning
Knowledge Statement
The speed of an object is related to the energy of the object.
Objectives
▪ Lesson 6: Describe the relationship between energy and speed.
▪ Lesson 7: Interpret data showing that greater energy input enables greater speed.
Concept 1: Energy Classification and Transfer
Focus Question
What is energy and how does it transfer from place to place?
Phenomenon Question
What is the relationship between energy and speed?
Level 4 ▸ Energy ▸ Lessons 6–7 58 © Great Minds PBC
PhD SCIENCE® TEXAS
Standards Addressed
Texas Essential Knowledge and Skills
tools, including hand lenses; metric rulers; Celsius thermometers; calculators; laser pointers; mirrors; digital scales; balances; graduated cylinders; beakers; hot plates; meter sticks; magnets; notebooks; timing devices; sieves; materials for building circuits; materials to support observation of habitats of organisms such as terrariums, aquariums, and collecting nets; and materials to support digital data collection such as computers, tablets, and cameras, to observe, measure, test, and analyze information.
appropriate graphic organizers used to collect data, including tables, bar graphs, line graphs, tree maps, concept maps, Venn diagrams, flow charts or sequence maps, and input-output tables that show cause and effect.
PhD SCIENCE® TEXAS Level 4 ▸ Energy ▸ Lessons 6–7 © Great Minds PBC 59
Standard Student Expectation Lesson(s) 4.8A Investigate and identify the transfer of energy
in motion, waves in water,
(Addressed) 6, 7 Scientific and Engineering Practices Standard Student Expectation Lesson(s) 4.1A Ask questions and define problems based on observations or information from text, phenomena, models, or investigations. 7 4.1B Use scientific
to
and
descriptive
and
problems. 6, 7 4.1D
6, 7 4.1E Collect observations and measurements
6, 7 4.1F
6 4.2B Analyze
7 4.3A Develop explanations
6, 7 4.3B Communicate
6, 7
Content Standards
by objects
and sound.
practices
plan
conduct
investigations
use engineering practices to design solutions to
Use
as evidence.
Construct
data by identifying any significant features, patterns, or sources of error.
and propose solutions supported by data and models.
explanations and solutions individually and collaboratively in a variety of settings and formats.
Recurring Themes and Concepts
Standard Student Expectation Lesson(s)
4.5A Identify and use patterns to explain scientific phenomena or to design solutions.
4.5B Identify and investigate cause-and-effect relationships to explain scientific phenomena or analyze problems.
4.5E Investigate how energy flows and matter cycles through systems and how matter is conserved.
English Language Proficiency Standards
2I Demonstrate listening comprehension of increasingly complex spoken English by following directions, retelling or summarizing spoken messages, responding to questions and requests, collaborating with peers, and taking notes commensurate with content and grade-level needs.
3B Expand and internalize initial English vocabulary by learning and using high-frequency English words necessary for identifying and describing people, places, and objects, by retelling simple stories and basic information represented or supported by pictures, and by learning and using routine language needed for classroom communication.
7
7
Speed Investigation (1 set per group): 1″ ball bearing, textbook (at least 1″ thick, same type or size for each group), grooved ruler (1), stopwatch (1), meter stick (1), tape
Level 4 ▸ Energy ▸ Lessons 6–7 60 © Great Minds PBC
7
6,
6,
Standard Student Expectation Lesson(s)
6,
7
6,
Student Materials Lesson(s) Science Logbook
6 Activity Guide) 6, 7 Sticky
per student pair) 6 Science Logbook (Lesson 7 Activity Guide) 7
7 Materials
(Lesson
note (1
7 PhD SCIENCE® TEXAS
Speed stations: pull back cars (2); assembled Snap Circuits® windmills from Lesson 2 (2); handheld balloon pumps (2); soccer ball, kickball, or other objects depending on class suggestion (2)
PhD SCIENCE® TEXAS Level 4 ▸ Energy ▸ Lessons 6–7 © Great Minds PBC 61 Teacher Materials Lesson(s)
6 Chart paper (1 sheet), marker (1) 7 Teacher Preparation Lesson(s) Ensure that all stopwatches work properly. 7
Lesson 6
Objective: Describe the relationship between energy and speed.
Launch 10 minutes
Pose the following scenario to the class, and allow students to share and discuss their questions.
► Cars usually move at a speed of 60 miles per hour on the highway, but race cars move at speeds up to 200 miles per hour. So a trip that would take 20 minutes in a regular car may take only 6 minutes in a race car. What are two questions you have about the difference in speed between a regular car and a race car?
▪ Why can race cars move faster than regular cars?
▪ Do race cars use more energy than regular cars?
Highlight students’ questions about what causes the difference in speed between regular cars and race cars. Remind students that at the energy stations in the previous lesson, they noticed that there might be a relationship between energy and speed. For example, when students turned the crank on the flashlight faster and when the windmill blades turned faster, there was more light. Tell students that they will investigate the relationship between energy and speed in this lesson. Instruct students to write the Phenomenon Question What is the relationship between energy and speed? in their Science Logbook (Lesson 6 Activity Guide). Review student understanding of energy from previous lessons.
► What do we know so far about energy?
▪ Energy helps make things happen.
▪ Energy can look different and do different things. Sometimes it is movement, a light shining, or even music playing.
Agenda
Launch (10 minutes)
Learn (25 minutes)
▪ Investigate Energy (20 minutes)
▪ Draw Initial Conclusions (5 minutes)
Land (10 minutes)
Differentiation
Students may benefit from a discussion of the word relationship in other contexts to help them apply it to energy and speed. Have students practice describing the relationships between other pairs of words, such as predator and prey, parent and child, or temperature and weather (3B).
Have students who need support with written language draw a picture to illustrate the relationship between energy and speed.
Level 4 ▸ Energy ▸ Lesson 6 62 © Great Minds PBC
PhD SCIENCE® TEXAS
Ask students to work with a partner to make a prediction about the relationship between speed and energy and write it on a sticky note or individual whiteboard to share with the class.
Sample student responses:
▪ If I throw something hard, it will fly really fast and go really far.
▪ The more energy I give something, the faster it will move.
▪ An object that moves quickly has more energy than an object that moves slowly.
Use student responses to record a class prediction on the board. Keep this prediction posted to revisit later in the lesson, and ask students to record it in their Science Logbook (Lesson 6 Activity Guide).
Sample class prediction:
When we give an object more energy, it will move faster.
► How do you know when an object has more energy or less energy?
▪ When I’m running around really fast, my mom says I have too much energy. Is that the same?
▪ I think we have to do more of something to give more energy to an object. Like at the hand-crank flashlight energy station, I had to spin the crank really fast to make the light brighter. I felt like I was doing a lot of work.
Ask students to think about ways they could test the class prediction with the materials available to the class. Encourage students to consider the materials they used in previous lessons as well as other materials available to them inside the classroom. As a class, brainstorm a list of possible objects to test, and write the ideas on the board. Work with students to select three objects they can use to test the class prediction, and then develop a class investigation plan. Have students record the investigation plan, which objects they will test, and a prediction for how each object will respond to more or less energy in their Science Logbook (Lesson 6 Activity Guide).
Teacher Note
In this lesson, students should deepen their understanding of how the amount of energy put into a system affects the speed of components in the system. Students may respond that faster-moving objects possess more energy. While these responses are valid, highlight those that focus on greater energy causing an object to move with more speed. The reverse relationship is studied in more detail in later levels.
Spotlight on Knowledge and Skills
At this point in the module, students may think that energy is “given” to an object. In Lesson 8, students clarify this understanding as they investigate transfer of energy. Students learn that energy moves through moving objects or through sound, light, heat, and electric currents (4.8A).
Teacher Note
As students share ideas of objects to test, keep quantity in mind. Depending on class size, at least two sets of materials for each test (e.g., two sets of pull back cars, two windmills, and two soccer balls) may be required.
PhD SCIENCE® TEXAS Level 4 ▸ Energy ▸ Lesson 6 © Great Minds PBC 63
Sample investigation table:
Investigation Plan
Use a small amount of energy or a lot of energy to make the objects move and see how fast they go.
Object 1 Pull back car Object 2 Windmill
Prediction
When we put more energy into the pull back cars by pulling them back more, they will move faster.
Prediction
When we put more energy into the windmill by pumping the balloon pump harder, the windmill blades will spin faster.
Object 3 Soccer ball
Prediction
When we put more energy into the soccer ball by kicking it harder, it will move faster.
Investigate Energy 20 minutes
Set up stations to test the chosen objects, and then divide the class into groups for the investigation. Explain the importance of each member having a turn to conduct each test. Students should then work in their groups to test the class prediction and determine whether a relationship exists between energy and speed. Have students fill out the Observations columns in their Science Logbook (Lesson 6 Activity Guide) as they investigate at each station.
Teacher Note
Ensure that the number of stations are adequate for each group to visit each station once in 15 minutes.
For example, in a class with 24 students, divide the class into six groups of four and set up two stations for each test (e.g., two pull back car stations, two windmill stations, two soccer ball stations). Allow students to spend about 5 minutes at each station.
Content Area Connection: English
As students record observations, reinforce the skill of taking notes to help recall relevant information. Students can write phrases or complete sentences and should use precise language to objectively describe their observations (2I).
Level 4 ▸ Energy ▸ Lesson 6 64 © Great Minds PBC
Observations Observations Observations
25
Learn
minutes
PhD SCIENCE® TEXAS
Sample investigation plan:
Investigation Plan
Use a small amount of energy or a lot of energy to make the objects move and see how fast they go.
Object 1
Pull back car
Prediction
When we put more energy into the pull back cars by pulling them back more, they will move faster.
Observations
When we pull the car back more, it goes faster (more speed). When we pull it back less, it moves slowly (less speed). When we pull the car back more, we are giving it more energy because we are using our muscles to pull it back.
Object 2
Windmill
Object 3 Soccer ball
Prediction
When we put more energy into the windmill by pumping the balloon pump harder, the windmill blades will spin faster.
Observations
When we pump the balloon pump softly, the windmill blades spin slowly (less speed). When we pump the balloon pump harder, the windmill blades spin faster (more speed). When we pump more, we are giving the windmill blades more energy and working harder to make them spin faster.
Draw Initial Conclusions 5 minutes
Prediction
When we put more energy into the soccer ball by kicking it harder, it will move faster.
Observations
When we kick the ball hard, it goes faster (more speed). When we kick it softly, it rolls pretty slowly (less speed). When we kick the ball hard, we are giving it more energy because we are working harder to make it go.
Teacher Note
Students may not use the term speed at this point in the lesson set as they write in their Science Logbook. Instead, they may describe how fast or slowly something moves. In the next lesson, students study this term in more detail and learn that speed describes the distance an object travels over a specific time (2I).
Spotlight on Knowledge and Skills
Ask students to work with their groups to write a response to the Phenomenon Question What is the relationship between energy and speed? in their Science Logbook (Lesson 6 Activity Guide) by using their observations as evidence. Debrief students’ initial conclusions as a class.
Sample student responses:
▪ When something is given more energy, it moves faster. It took more of my energy to make the soccer ball move faster, but the harder I kicked it, the more energy I put in and the faster the ball moved.
The goal of this lesson is for students to describe the relationship between energy and speed. Students may suggest that motion energy (kinetic energy) is a type of energy, so moving faster indicates more motion energy. If necessary, facilitate a discussion to explore cause and effect. Note that, as shown by what students observed in the investigation, putting more energy into a system causes the objects in the system to move faster (4.5B, 4.8A).
PhD SCIENCE® TEXAS Level 4 ▸ Energy ▸ Lesson 6 © Great Minds PBC 65
▪ Our group found that the more energy we added to try to move an object, the faster the object seemed to move. At the pull back car station, when we put in more energy by pulling the cars back farther, they moved faster.
Check for Understanding
Students answer the Phenomenon Question by using their observations as evidence to explain the relationship between speed and energy.
TEKS Assessed
4.3A Develop explanations and propose solutions supported by data and models.
4.5B Identify and investigate cause-and-effect relationships to explain scientific phenomena or analyze problems.
4.8A Investigate and identify the transfer of energy by objects in motion, waves in water, and sound.
Evidence
Students identify the cause-and-effect relationship between speed and energy by explaining how adding more energy to an object causes it to move faster (4.5B). Students support their explanation with data (4.3A) including the observations that transferring more energy to the car, windmill, and soccer ball caused them to move faster (4.8A).
Next Steps
If students need support with drawing a connection between energy input and speed, repeat the investigations in a small group or one-on-one. Ask students how they can make the objects move quickly or make them move slowly. Point out the relationship between how much energy they give to an object and how quickly it moves.
Level 4 ▸ Energy ▸ Lesson 6 66 © Great Minds PBC
PhD SCIENCE® TEXAS
Land
10 minutes
Lead a discussion with students to clarify where energy comes from.
► Where do you think the energy came from at the stations?
▪ At each station, the energy came from us. We pulled the cars back, we pumped the balloon pumps to make wind, and we kicked the soccer ball.
▪ The energy came from us because we used our energy to move the objects at each station.
► If the energy comes from us, where do we get the energy?
▪ The energy that we give the objects comes from our muscles.
▪ Our bodies get energy from the food we eat.
After students share, revisit the class prediction about the relationship between energy and speed.
► Were your results what you expected? What evidence did you gather to evaluate our prediction?
▪ Yes, the evidence we gathered agrees with our prediction because we saw the same result at every station. Giving an object more energy made it move faster.
Explain that scientists must design fair tests and be very precise in testing a prediction and collecting data as evidence.
► Why might the tests you conducted not be fair? Did each group test the objects in the same way?
▪ Some groups rolled the ball while others kicked it hard. So, maybe it wasn’t fair.
▪ Some groups had the pull back cars travel across the classroom, and others had them travel just across the desk.
Tell students that in the next lesson they will design a fair test investigation to further test the class prediction and answer the Phenomenon Question with more confidence.
Teacher Note
To avoid a common misconception about conservation of energy, it is important to discuss that the energy possessed by something is neither created nor destroyed (e.g., a windmill does not create energy or destroy it). If needed, expand on this idea by leading a discussion about energy in humans. The question can be asked as a follow-up to student responses or as a new question. To check for understanding that energy is neither created nor destroyed, listen for students to acknowledge that humans do not make their own energy; rather, they get energy from sources such as food (2I, 3B).
Teacher Note
Students should be familiar with fair test investigations from their experiences in Level 3. If any students are unfamiliar with fair test investigations, consider explaining what a fair test investigation is in more detail.
PhD SCIENCE® TEXAS Level 4 ▸ Energy ▸ Lesson 6 © Great Minds PBC 67
Optional Homework
Students make connections about wind, speed, and windmills to decide on a good location for a windmill in their area. Students list other factors they might need to consider to determine a good location for the windmill.
Level 4 ▸ Energy ▸ Lesson 6 68 © Great Minds PBC
PhD SCIENCE® TEXAS
Lesson 7
Objective: Interpret data showing that greater energy input enables greater speed.
Agenda
Launch (3 minutes)
Learn (38 minutes)
▪ Design a Fair Test Investigation (13 minutes)
▪ Conduct the Investigation (15 minutes)
▪ Analyze and Interpret Data (10 minutes)
Land (4 minutes)
Begin by reviewing the Phenomenon Question What is the relationship between energy and speed?
Ask students to recap their current understanding of this question.
Sample student responses:
▪ We think that when we give something more energy, it moves more quickly. For example, when we gave the cars more energy by pulling them back more, they went faster and farther. They moved more. Also, when we put more energy into the soccer ball by kicking it harder, it rolled faster and farther.
▪ When we don’t give something as much energy, it moves less quickly. When we kicked the ball softly, we were putting less energy into it, and it didn’t seem to go as fast or as far.
Tell students they will design a fair test investigation to test the class prediction they made in the previous lesson.
Sample class prediction:
▪ When we give an object more energy, it will move faster.
PhD SCIENCE® TEXAS Level 4 ▸ Energy ▸ Lesson 7 © Great Minds PBC 69
Launch 3 minutes
Tell students they must use the following materials to design their investigation: a ball bearing, a ruler, and a textbook. To test the class prediction, students must find a way to give different amounts of energy to the ball bearing and then determine which amount of energy causes the ball bearing to move fastest.
Tell students the investigation question: How can giving an object more energy affect its speed? Ask students to record the question in their Science Logbook (Lesson 7 Activity Guide).
Learn
38 minutes
Design a Fair Test Investigation 1
3 minutes
Before students design their investigations, demonstrate a race between two students to clarify how to quantify speed. Stand at one end of the classroom and explain that when you say “go,” Student A will run to you quickly (and safely) while Student B will walk to you slowly. Allow the students to demonstrate.
► Why did Student A win?
▪ Student A ran, and the other student walked. Student A used more energy.
▪ Student A was faster.
► What does faster mean?
▪ It means Student A had more speed.
▪ It means it took Student A less time to get to you.
► What was the same for both students? What was different?
▪ The distance they raced was the same.
▪ They both started at the same time when you said “go.”
▪ The time it took Student B to reach you was different. It took more time. That means Student B had a slower speed.
Level 4 ▸ Energy ▸ Lesson 7 70 © Great Minds PBC
PhD SCIENCE® TEXAS
Tell students that speed is the distance an object moves in a certain amount of time. When measuring and comparing speeds, the distance an object moves (i.e., across the room during the race) as well as the time it takes to travel that distance (i.e., how long it took the student to cross the room) must be considered. To quantify an object’s speed, students can mark a start line and a finish line and use a stopwatch to measure how long it takes an object to travel from the start line to the finish line.
English Language Development
Introduce the term speed explicitly. Discuss meanings of speed in different contexts, such as a jet moving at a faster speed than a car. English learners may also benefit from explicit introduction of other words in this lesson, such as data, distance (with Spanish cognate distancia), and time
Divide the class into groups to begin exploring the materials. Remind students that their goal is to plan an investigation in which they vary the amounts of energy (variable) given to a ball bearing and compare the ball bearing’s speeds. Give each group a ruler, a 1” ball bearing, a meter stick, and a 1” or thicker textbook. As students work in their groups to explore and brainstorm investigation plans, ask them to explain why their test will be fair and how they can guarantee reliable results with precise measurements. Ask students to record this information in their Science Logbook (Lesson 7 Activity Guide).
As they plan with their group, students should consider that changing even one other variable, such as a slight push from their hand on the ball bearing, will change the outcome and result in an unfair test.
Ask students to review the data table in their Science Logbook. Point out that an extra column is available for an additional trial if they notice any inconsistencies in their data.
Reconvene the class for students to share ideas.
► How can you give different amounts of energy to the ball bearing?
▪ We could push the ball bearing softly and then push it hard. But that might not be a fair test because people might use different amounts of energy when they try to push hard or softly.
▪ We could lift the ball bearing up a little and then a lot.
Guide students to make a ramp by leaning the end of the ruler against the textbook. Consider demonstrating how to vary the release point by releasing the ball bearing from different heights on the ruler. Ensure that students understand that lifting the ball higher on the ruler (releasing from a greater
Content Area Connection: Mathematics
Students are not expected to calculate or study rates. Either the distance an object travels or the time it spends traveling must be constant to make this investigation appropriate for students at this level and allow them to compare speeds. Allow students time to discuss which is better for this investigation.
Differentiation
Consider grouping students homogenously by academic level for this investigation. Homogenous grouping in this setting gives students an opportunity to develop social and leadership skills in addition to conceptual understanding (2I).
Teacher Note
Each group should use a textbook with the same thickness for consistency in data between groups (2I).
Teacher Note
Students may benefit from examples of investigations that do not provide a fair test. Have students think back to the investigation in Lesson 6 and discuss why those trials were not fair tests and how they could be improved. For example, when students kicked the soccer ball, the ball was given more energy or less energy depending on the student kicking it. In a fair test, the ball would need to be given the same amount of energy in each trial.
PhD SCIENCE® TEXAS Level 4 ▸ Energy ▸ Lesson 7 © Great Minds PBC 71
height) means more energy input. Demonstrate this concept by placing a classroom object, such as a book, on the floor. Lift the object slightly off the floor, and then lift the object high in the air. Ask students to reflect on which action requires more energy to perform.
► In which position does the object have more energy?
Confirm that the object has more energy when it is lifted high in the air than when it is lifted slightly off the floor. Allow groups to share their investigation plans. As students share, use a whiteboard or chart paper to develop a class investigation plan. Guide students to determine which variables must be controlled to ensure a fair test. Be sure to include the following key ideas in the class plan:
▪ All groups must conduct their investigation on a flat surface, such as the floor or a long table.
▪ All groups must set up their ramps the same way (e.g., same textbook set at the same point under the ruler, books oriented the same way) to ensure that the distance is the same from the start line to the finish line (e.g., 2 m).
▪ All groups must test the same ball bearing release heights to generate different speeds (e.g., 7 cm, 14 cm, 21 cm, and 28 cm marks).
▪ All groups must complete the same minimum number of trials.
▪ All groups must use a stopwatch to measure the time it takes for the bearing to travel from the start line to the finish line.
Spotlight on Knowledge and Skills
Highlight the importance of multiple trials in performing a fair test. Guide students toward the understanding that if they perform the same test several times, they should get similar data. Data that vary significantly may indicate a problem with the investigation plan (4.1B).
Display the investigation plan so students can refer to it throughout the lesson.
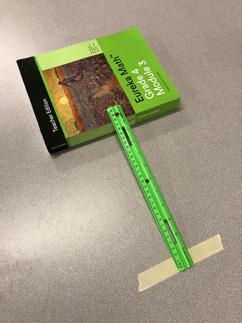
Level 4 ▸ Energy ▸ Lesson 7 72 © Great Minds PBC
PhD SCIENCE® TEXAS
Sample class investigation plan:
1. Conduct the investigation on a flat surface.
2. Choose a textbook that has a thickness of at least 1 inch. Position the book flat on the surface. Lean the ruler flat-side down on the book to create a ramp. Line up the ruler’s 28 cm mark with the edge of the book.
3. Place a piece of tape on the work surface so that the edge lines up with the end of the ruler. This edge of the tape will be the start line. Measure 2 m from the start line and place another piece of tape to mark the finish line.
4. Release the ball bearing from the ruler’s 7 cm mark. Start timing when the ball bearing leaves the ruler, and stop timing when it reaches the finish line. Perform three more trials at the 7 cm mark.
5. Repeat the investigation, releasing the ball bearing from the ruler’s 14 cm, 21 cm, and 28 cm marks.
Emphasize the importance of timing and accuracy in collecting data. Tell students that they may need to run some practice trials to familiarize themselves with using the stopwatch. Ask students when they should start the stopwatch and when they should stop it. Remind students that the release distance on the ruler will change, but the ball bearing will leave the ramp at the same place in each trial. Ensure that the class agrees to start the stopwatch when the ball bearing reaches the bottom of the ramp (i.e., the start line) and stop the stopwatch when the ball bearing crosses the finish line.
Ask students to complete the Release Point on Ramp and Distance Ball Bearing Travels columns of the data table in their Science Logbook.
Conduct the Investigation 15 minutes
After students have set up the investigation and are comfortable and confident using the stopwatch, they may begin collecting and recording data in their Science Logbook (Lesson 7 Activity Guide).
PhD SCIENCE® TEXAS Level 4 ▸ Energy ▸ Lesson 7 © Great Minds PBC 73
Encourage students to divide responsibilities among members of the group. The following group roles are suggested:
▪ Ball Bearing Keeper: places the ball bearing on the correct starting point on the ruler
▪ Timer: times the trial with the stopwatch
▪ Observer: observes the investigation to ensure a fair test; for example, ensures that the ramp is correctly placed and no factors affect the accuracy of the data collection (e.g., distractions, talking)
▪ Data Recorder: records data from each trial in the Science Logbook
Analyze and Interpret Data 10 minutes
After conducting all trials, groups complete the Typical Time Value column on their data table. Explain that students should use this column to record the typical time values they observe. Discuss what a typical time value means in this situation. Although typical value has a specific meaning in statistics, in this case, students should record the time value that they think best represents the data set.
Sample data table:
Content Area Connection:
Mathematics
Students may be unfamiliar with decimals. Briefly explain the first decimal place (tenths of a second) is related to the fraction tenths. To ensure accurate data collection, instruct students to round their data to the nearest tenth, using the digit in the hundredths column to determine whether they should round up or down.
Content Area Connection:
Mathematics
For students who need support determining a typical time value, provide help for them to analyze their data. Help students look at the four trials at each release point and pick a time value that best represents their data. If their data points are between 5.3 seconds and 5.8 seconds, encourage them to pick a number near the midway point. Avoid teaching students to average the measurements.
Level 4 ▸ Energy ▸ Lesson 7 74 © Great Minds PBC
Ball Bearing Release Point and Travel Time to Finish Line Release Point on Ramp (centimeters from bottom) Distance Ball Bearing Travels (meters) Trial 1 Time (seconds) Trial 2 Time (seconds) Trial 3 Time (seconds) Trial 4 Time (seconds) Typical Time Value (seconds) 7 2 7.5 6.5 6.6 6.7 6.6 14 2 4.3 4.2 4.0 4.2 4.2 21 2 3.5 3.6 3.5 3.5 3.5 28 2 3.1 2.9 2.9 3.0 3.0 PhD SCIENCE® TEXAS
Have student groups begin analyzing the data by working through the Reflection Questions section in their Science Logbook (Lesson 7 Activity Guide). While groups discuss and record their responses to these questions, visit each group to guide reflection as necessary.
Come together as a class and ask groups to share their patterns.
► What patterns do you notice in your data?
▪ The ball with the most energy (28 cm mark) took the least time to reach the finish line, and the ball with the least energy (7 cm mark) took the most time.
▪ The more energy we gave a ball, the faster it moved.
► Which trials did not follow the patterns, if any? What could have caused differences in the data?
▪ In Trial 1 for the 7 cm ball, the time was 7.5 seconds, and the other times were 6.5, 6.6, and 6.7 seconds. We may have pressed the button on the stopwatch too late.
Have students reflect on the data they collected.
► Can we use our set of data as evidence to support our prediction? Why?
▪ Our set of data is accurate because we did four trials and the times were almost the same each time, so we know our measurements weren’t a mistake.
▪ All the groups followed the same plan and got similar data. This means our investigation plan is good and we can use the evidence to support our prediction.
Direct students to write a response to the Final Reflection question in their Science Logbook.
► Look at the class prediction from Lesson 6. Does today’s investigation support or challenge our prediction? Why?
▪ We predicted that giving an object more energy would cause it to move faster. When we gave a ball bearing the most energy by lifting it highest on the ruler, it rolled fastest. When we gave a ball the least energy by lifting it to the lowest mark, it rolled slowest. So our evidence supported our prediction.
Teacher Note
During this discussion, students may need to revisit their data tables to understand that a shorter time indicates a higher speed. If necessary, revisit the classroom racing example, where running at a higher speed meant finishing the race in shorter (faster) time (3B).
Content Area Connection: English
In science, data must meet specific standards to be used as evidence. For example, results should be replicable by other scientists under the same test conditions.
In English, students also evaluate evidence.
Help students draw connections between their experiences evaluating evidence across disciplines.
English Language Development
As they respond to this question, some English learners may benefit from a sentence frame such as the following (3B):
▪ Our prediction was This investigation (does/does not) support our prediction because .
PhD SCIENCE® TEXAS Level 4 ▸ Energy ▸ Lesson 7 © Great Minds PBC 75
Check for Understanding
Students analyze data to determine whether it supports their prediction for the relationship of energy and speed.
TEKS Assessed
4.2B Analyze data by identifying any significant features, patterns, or sources of error.
4.3A Develop explanations and propose solutions supported by data and models.
4.5B Identify and investigate cause-and-effect relationships to explain scientific phenomena or analyze problems.
4.8A Investigate and identify the transfer of energy by objects in motion, waves in water, and sound.
Evidence
Students analyze data by identifying the pattern (4.2B) that when the ball is released from a higher point on the ruler, the ball has more energy and moves with greater speed when it leaves the ruler (4.8A).
Students explain that their data supports the prediction (4.3A) that transferring more energy to an object causes to it move faster (4.5B, 4.8A).
Next Steps
If students need support with identifying patterns in the data, prompt them by asking questions such as these: When did the ball have the most energy? When did the ball move fastest?
If students need support with identifying how their data show the cause-and-effect relationship between energy and speed, revisit the investigation set up. Demonstrate releasing the ball from the lowest height. Then ask students what should be changed to make the ball move faster. Prompt them to explain how they know the ball needs to be released higher.
Level 4 ▸ Energy ▸ Lesson 7 76 © Great Minds PBC
PhD SCIENCE® TEXAS
Land4 minutes
Revisit the racing demonstration from the Learn. Have two students act out another racing scenario: Student A runs quickly across the room, and Student B walks slowly. Stand at the finish line and have students imagine Student A and Student B both accidentally bump into you.
► What would happen if Student A bumped into me?
▪ You would probably get knocked down and get hurt.
► What would happen if Student B bumped into me?
▪ Nothing would really happen. You might move a little bit, but you wouldn’t get hurt.
► Why would I get hurt in the first scenario but not in the second?
▪ Student A is moving fast, so you’d get hit with more energy.
Explain that the relationship between energy and speed could have important implications in a collision, which is when two objects hit, and exert a force on, each other.
English Language Development
Introduce the term collision explicitly. Explore the Latin root col-, which often means “together.” Pointing out related words, such as collide, may be beneficial. Discuss meanings of collision in different contexts, such as the collision between a baseball and a bat when a batter swings and hits the ball (3B).
► What questions do you have about collisions after imagining Students A and B bumping into me?
▪ Would Student A really make you move, or would he just be stopped from moving forward?
▪ Is there always a sound when two objects collide?
▪ Why is it that sometimes after two objects collide, one or both objects move the other way, like when two toy cars crash?
▪ Sometimes a moving object stops after a crash. What happens to that object’s energy?
Tell students that to explore their questions, in the next lesson they will investigate the Phenomenon Question What happens to energy when objects collide?
Spotlight on Knowledge and Skills
In upcoming lessons, students will build on their prior knowledge of forces. In Level 3, students explored forces that can act on objects which are in contact or at a distance, including magnetism, gravity, and pushes and pulls (3.7A).
PhD SCIENCE® TEXAS Level 4 ▸ Energy ▸ Lesson 7 © Great Minds PBC 77
Lessons 8–9 Energy Changes During a Collision Prepare
In Lessons 6 and 7, students concluded that transferring more energy to an object allows it to move with more speed. In Lesson 8, students build on the investigation from Lesson 7 by investigating how far objects moving at various speeds can move a second object after a collision. Students then graph their data to identify patterns in the transfer of energy between colliding objects in the ball bearing and catch system. In Lesson 9, students make sense of their investigations by developing a model to explain what happens to energy during a collision. Because energy transfer and transformations occur before, during, and after a collision, students model each stage to track the presence of energy phenomena.
Student Learning
Knowledge Statement
Energy in a system can transfer between objects through collisions, causing changes in the objects’ motion.
Concept 1: Energy Classification and Transfer
Focus Question
What is energy and how does it transfer from place to place?
Phenomenon Question
What happens to energy when objects collide?
Level 4 ▸ Energy ▸ Lessons 8–9 78 © Great Minds PBC
PhD SCIENCE® TEXAS
Objectives
▪ Lesson 8: Predict the transfer of motion energy between objects during a collision.
▪ Lesson 9: Explain the transfer of motion energy between objects through forces in a collision.
Standards Addressed
Texas Essential Knowledge and Skills
Use tools, including hand lenses; metric rulers; Celsius thermometers; calculators; laser pointers; mirrors; digital scales; balances; graduated cylinders; beakers; hot plates; meter sticks; magnets; notebooks; timing devices; sieves; materials for building circuits; materials to support observation of habitats of organisms such as terrariums, aquariums, and collecting nets; and materials to support digital data collection such as computers, tablets, and cameras, to observe, measure, test, and analyze information.
4.1F Construct appropriate graphic organizers used to collect data, including tables, bar graphs, line graphs, tree maps, concept maps, Venn diagrams, flow charts or sequence maps, and input-output tables that show cause and effect.
PhD SCIENCE® TEXAS Level 4 ▸ Energy ▸ Lessons 8–9 © Great Minds PBC 79
Content Standards Standard Student Expectation Lesson(s) 4.7 Plan and conduct descriptive investigations to explore the patterns of forces such as gravity, friction, or magnetism in contact or at a distance on an object. (Introduced) 9 4.8A Investigate and identify the transfer of energy by objects in motion, waves in water, and sound. (Addressed) 8, 9
and Engineering Practices Standard Student Expectation Lesson(s) 4.1B Use scientific practices to plan and conduct descriptive investigations and use engineering practices to design solutions to problems. 8
Scientific
4.1D
8
Collect observations and measurements as evidence. 8
8
4.1E
Scientific and Engineering Practices (continued)
Recurring Themes and Concepts
English Language Proficiency Standards
Ask and give information ranging from using a very limited bank of high-frequency, high-need, concrete vocabulary, including key words and expressions needed for basic communication in academic and social contexts, to using abstract and content-based vocabulary during extended speaking assignments.
Level 4 ▸ Energy ▸ Lessons 8–9 80 © Great Minds PBC
Standard Student Expectation Lesson(s) 4.1G Develop and use models to represent phenomena, objects, and processes or design a prototype for a solution to a problem. 9 4.2B Analyze data by identifying any significant features, patterns, or sources of error. 8 4.3A Develop explanations and propose solutions supported by data and models. 8, 9
Standard Student Expectation Lesson(s) 4.5B Identify and investigate cause-and-effect relationships to explain scientific phenomena or analyze problems. 8, 9 4.5E Investigate how energy flows and matter cycles through systems and how matter is conserved. 8, 9
Student Expectation Lesson(s)
Standard
3F
8, 9 PhD SCIENCE® TEXAS
PhD SCIENCE® TEXAS Level 4 ▸ Energy ▸ Lessons 8–9 © Great Minds PBC 81 * This lesson set requires no teacher preparation. Materials* Student Materials Lesson(s) Science Logbook (Lesson 8 Activity Guide) 8 Collision Investigation (1 set per group): 1″ ball bearing (1), ball bearing catch (1), grooved metric rulers (2), textbook (at least 1″ thick, same type or size for each group) (1), tape 8 Science Logbook (Lesson 9 Activity Guide) 9 Teacher Materials Lesson(s) Chart paper (1 sheet), marker (1) 8
Lesson 8
Objective: Predict the transfer of motion energy between objects during a collision.
Launch
Teacher Note
In Lessons 8 and 9, students build a foundation to understand how energy changes forms. Help students understand how energy transfers to other objects by giving examples, such as energy transfer from electrical wires to a speaker. Transfer of energy will be further developed in later grades.
Remind students of the collision discussion at the end of Lesson 7.
► Can you name some things that collide?
▪ A foot and a soccer ball
▪ Cars, if they get into an accident
▪ Football players
Ask students if they have any questions about collisions and add these questions to the driving question board. Remind students that in this lesson, they will explore the Phenomenon Question What happens to energy when objects collide?
Explain that investigating collisions will help students develop a better understanding of what happens to energy when two objects collide.
Agenda
Launch (3 minutes)
Learn (38 minutes)
▪ Plan the Investigation (7 minutes)
▪ Conduct the Investigation (13 minutes)
▪ Analyze and Interpret Data (18 minutes)
Land (4 minutes)
English Language Development
Students were introduced to the term collision at the end of Lesson 7. It may be beneficial to revisit this term as students begin to use it in this lesson.
Level 4 ▸ Energy ▸ Lesson 8 82 © Great Minds PBC
3 minutes
PhD SCIENCE® TEXAS
Tell students they will design an investigation in which a ball bearing collides with another object. The second object is called a catch. Their goals are to find out whether a faster-moving ball bearing has more energy than a slower-moving ball bearing and what happens to that energy during a collision. They will compare how much energy the ball bearings have by observing how far the ball bearings push the catch.
Share the investigation question: Does an object’s speed affect energy during a collision? Direct students to record the investigation question in their Science Logbook (Lesson 8 Activity Guide).
► How could we vary the ball bearing’s speed?
▪ We could throw the ball into the catch. But that might not be a fair test since you might throw it harder than me.
▪ We could put more energy into the ball bearing by lifting it higher on the ruler ramp. Our last investigation showed that will make different speeds, so it’s a fair test.
Confirm that students can set up a fair test by varying the release points of the ball bearing again to change its speed and build on the results from the last lesson.
Teacher Note
Have the investigation materials out and visible to students as they consider this question. Doing so may help remind them of their last investigation, in which they learned to vary the speed of the ball bearing by placing it at different points on the ruler ramp.
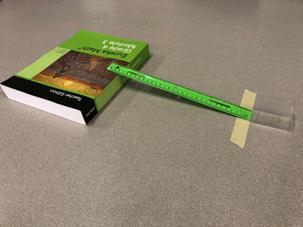
Plan the Investigation
Perform a quick demonstration to show students how the catch works by rolling the ball bearing down the ramp directly into the catch. Then demonstrate measuring the distance the catch travels when the ball bearing collides with it.
Differentiation
During the investigation, the catch only moves a short distance. To make sure all students are prepared to measure this distance, review or remediate measurement concepts. Have students practice measuring and choosing appropriate units of measurement before the investigation.
PhD SCIENCE® TEXAS Level 4 ▸ Energy ▸ Lesson 8 © Great Minds PBC 83
Learn
38 minutes
7 minutes
Work with students to modify the class investigation plan from Lesson 7 to incorporate the catch. Emphasize the importance of measuring distance traveled by using consistent reference points, such as the front of the catch. Record the investigation plan, and display it so students can refer to it throughout the lesson.
Sample class investigation plan:
1. Conduct the investigation on a flat surface.
2. Choose a textbook that has a thickness of at least 1 inch. Position the book flat on the surface. Lean the ruler flat-side down on the book to create a ramp. Line up the ruler's 28 cm mark with the edge of the book.
3. Place a piece of tape on the work surface so that the edge lines up with the end of the ruler. This edge of the tape will be the start line.
4. Place the ball bearing catch against the end of the ruler so that the front (open side) of the catch lines up with the start line.
5. Release the ball bearing from the ruler's 7 cm mark, and then measure how far the front of the catch slides from the start line. Reset the catch and perform three more trials at the 7 cm mark.
6. Repeat the investigation, releasing the ball bearing from the ruler's 14 cm, 21 cm, and 28 cm marks.
Ask students to use this investigation plan to fill in the blank headings in the data table in their Science Logbook (Lesson 8 Activity Guide). As they prepare the data table, work with students to determine that the best unit of measurement to use is centimeters (cm).
Level 4 ▸ Energy ▸ Lesson 8 84 © Great Minds PBC
PhD SCIENCE® TEXAS
Sample data table: Distance Ball Bearing Catch Travels (centimeters)
bottom) Trial 1 Trial 2 Trial 3 Trial 4
Conduct the Investigation 13 minutes
As students work with their groups to carry out the investigation, circulate to ensure that groups are adhering to the investigation plan. Students may need to perform an additional trial if they notice any inconsistencies in their data.
Teacher Note
Consider taping a piece of paper to the desk or floor so students can mark the starting and stopping points of the catch for each trial. The catch will then slide on the paper instead of the surface, and students can more easily and accurately measure the distances between the points.
PhD SCIENCE® TEXAS Level 4 ▸ Energy ▸ Lesson 8 ©
Minds PBC
Release
(centimeters from
Typical
7 14 21 28
Great
85
Point on Ramp
Distance Value
Analyze and Interpret Data 18 minutes
After students complete their investigation, ask teams to identify a typical distance value, or the value that best represents the data set, for each release point on the ruler. Sample data table:
Explain that scientists often organize their data for ease of analysis, and one of the ways they do this is by graphing data to reveal patterns. Work with students to determine the appropriate use of the blank bar graph in their Science Logbook (Lesson 8 Activity Guide). As they agree on how to create the graph (e.g., agree to graph the typical distance for each release point, agree to use a ruler to mark centimeters as the vertical scale), have them fill in the blank headings and choose an appropriate scale. Assist students as needed as they graph their values.
Differentiation
To support students with varying graphing abilities, it may help to record one group’s data on the board and then model how to represent these data on the graph. Some students will benefit from working in a small group or one-on-one with teacher support to complete the graph, including adding labels for the axes.
Level 4 ▸ Energy ▸ Lesson 8 86 © Great Minds PBC
Distance Ball Bearing Catch Travels (centimeters) Release Point on Ramp (centimeters from bottom) Trial 1 Trial 2 Trial 3 Trial 4 Typical Distance Value 7 1.0 1.0 1.0 1.0 1.0 14 2.8 3.0 3.1 3.1 3.0 21 4.2 4.2 4.2 4.3 4.2 28 5.3 5.5 5.8 5.3 5.5
PhD SCIENCE® TEXAS
Sample blank and complete graphs:
To help students interpret the relationship between the energy of the first object, speed, and the energy of the second object, discuss the following questions.
► How do the increasingly higher release points relate to energy? How do they relate to speed?
▪ The higher the release point, the more energy we give to the ball bearing.
▪ From the investigation yesterday, we know that putting in more energy causes the ball bearing to move faster.
When students agree that the higher release points mean more energy input and greater speed than lower release points, have them add the label More energy input, more speed → to the bottom of their graphs.
► How does the distance the catch travels relate to energy?
▪ I think it takes more energy to push the catch farther.
▪ The catch doesn’t have any energy before we start the investigation, and then after the collision, it has energy because it moves. The catch that travels the farthest must have the most energy.
English Language Development
English learners may benefit from having sentence frames such as the following to make sense of the data and the relationship between energy and speed (3F):
▪ The (higher or lower) the release point height, the (more or less) energy the ball bearing has.
▪ (More or Less) energy causes the ball bearing to move with (more or less) speed.
▪ Giving (more or less) energy to the ball bearing causes the catch to move a (longer or shorter) distance.
PhD SCIENCE® TEXAS Level 4 ▸ Energy ▸ Lesson 8 © Great Minds PBC 87
7 cm 8 7 6 5 4 3 2 1 14 cm21 cm Distance Catch Travels at Each Release Point Ramp Release Point Dis ta nce Cat ch Tr avels (cm ) 28 cm
Draw students’ attention to the relationship between increased energy and increased force as demonstrated by the catch traveling a greater distance. Ensure that students understand that the ball bearing with the most energy pushes the catch farthest, and the catch with the most energy travels farthest. If needed, ask students to push a classroom object a short distance and a long distance and then reflect on which action requires more energy. Explain that energy entering the system, the energy input, comes from the students. Explain that the catch and ball bearing can be thought of as a system, or a group of objects that interact, and the distance traveled is one indicator of energy in that system. Have students add the label More energy output → along the vertical side of their graphs.
English Language Development
Introduce the term system explicitly. Providing the Spanish cognate sistema may be helpful. Discuss the meanings of system in different contexts, such as solar system, highway system, and body system.
As with other important words, scaffolds such as oral rehearsal and sentence frames may benefit some English learners throughout the module as they use the term system in speaking and writing. English learners may also benefit from explicit introduction of other terms in this lesson set, such as electric current
Differentiation
Engage students with a variety of learning styles by using different examples to demonstrate the concept of energy input and output within a system. In the example of a student pushing a classroom object, the energy input came from the student, and the energy output was shown by the distance the classroom object moved.
Teacher Note
To help students better understand the new term system, consider using a terminology instructional routine such as a Frayer model.
Level 4 ▸ Energy ▸ Lesson 8 88 © Great Minds PBC
Sample graph with analysis: 7 cm 8 7 6 5 4 3 2 1 14 cm21 cm 28 cm Distance Catch Travels at Each Release Point Ramp Release Point More energy input, more speed More energy output Dis ta nce Cat ch Tr avels (cm ) PhD SCIENCE® TEXAS
► Does the ball bearing have more energy when it moves quickly or slowly? How do you know?
▪ I think the ball bearing has more energy when it moves quickly because we gave it more energy by lifting it to the highest point, 28 cm. But I’m not sure if it keeps all the energy we give it.
▪ The fastest ball bearing has the most energy because it moves the catch farthest, and it takes energy to move the catch.
Check for Understanding
Students describe the flow of energy from the ball bearing to the catch to explain when the ball bearing has the most energy.
TEKS Assessed
4.1F Construct appropriate graphic organizers used to collect data, including tables, bar graphs, line graphs, tree maps, concept maps, Venn diagrams, flow charts or sequence maps, and input-output tables that show cause and effect.
4.3A Develop explanations and propose solutions supported by data and models.
4.5E Investigate how energy flows and matter cycles through systems and how matter is conserved.
4.8A Investigate and identify the transfer of energy by objects in motion, waves in water, and sound.
Evidence
Students organize their data by constructing a bar graph (4.1F) and then using it to support their explanation (4.3A). Students explain that the ball bearing has more energy when it moves quickly because the catch moves farther when quick ball bearings collide with it. The distance the catch moves shows that more energy is transferred from a quick ball bearing to the catch than from a slow ball bearing (4.5E, 4.8A).
Next Steps
If students need support to make the connection between energy and the ability to move the catch, discuss how energy makes things happen. Have students give a single push to move an object such as a chair across the floor. Ask them to imagine they are the ball bearing pushing the catch. Reflect on whether it takes more effort (energy) to give a push that moves the object a short distance or a long distance.
PhD SCIENCE® TEXAS Level 4 ▸ Energy ▸ Lesson 8 © Great Minds PBC 89
Land
4 minutes
Highlight the idea that the fastest-moving ball bearing possesses the most energy. Point out that the cause and effect relationship between speed and energy works both ways: (1) the more energy given to an object (e.g., lifting the ball bearing), the greater the speed of that object (e.g., ball bearing rolling); and (2) the greater the speed of the object (e.g., ball bearing rolling), the more motion energy that object has available to transfer, or move, to other parts of the system (e.g., catch). Tell students that the movement of energy from one part of a system to another is called energy transfer.
English Language Development
Introduce the term transfer explicitly. Break transfer, which can be a noun or a verb, into the word parts trans- (often means “across”) and -fer (often means “carry”) and explore their meanings. Discuss meanings of transfer in different contexts, such as a student who moves and transfers to a different school or the transfer from one bus line to another. Providing the Spanish cognates for the verb transferir and the noun transferencia may also be helpful (3F).
Tell students that in the next lesson they will continue to build their understanding of the Phenomenon Question What happens to energy when objects collide?
Optional Homework
Challenge students to look for examples of the relationship between energy and speed outside of the classroom. Have them explain the relationship to a family member by using a system in their home as an example. Remind students that it often helps to use a model or a graph to explain relationships.
Teacher Note
In previous lessons, students likely used words such as give to describe the transfer of energy. From this point forward, encourage students to use the precise term energy transfer (3F).
Level 4 ▸ Energy ▸ Lesson 8 90 © Great Minds PBC
PhD SCIENCE® TEXAS
Lesson 9
Objective: Explain the transfer of motion energy between objects through forces in a collision.
Agenda
Launch (5 minutes)
Learn (35 minutes)
▪ Model Energy Before a Collision (11 minutes)
▪ Model Energy During a Collision (11 minutes)
▪ Model Energy After a Collision (13 minutes)
Launch
Land (5 minutes)
5 minutes
Ask students to compare the investigations from Lessons 7 and 8.
► What differences did you notice between the two investigations and their results?
▪ In the second investigation, the ball bearing collided with the catch. In the first, the ball bearing didn’t bump into anything.
▪ In the first investigation, the ball bearing kept rolling for a while. In the second investigation, the ball bearing moved with the catch for a second and then stopped.
▪ In the first investigation, the ball bearing just rolled and there was hardly any sound. In the second investigation, the ball bearing hit the container and made a louder sound.
► Why do you think the ball bearing in the catch did not travel as far as the ball bearing by itself?
▪ The container was heavy and stopped the ball from rolling.
▪ The catch is flat on the bottom and doesn’t roll, so it stopped the ball bearing.
Point out that students explored two situations in which the same amounts of energy were transferred to the ball bearing, but the ball bearing moved different distances. Because energy does not disappear, there must be an explanation for why the ball bearing moved a shorter distance when it collided with the catch. In this lesson, students will develop an explanation as they continue exploring the Phenomenon Question What happens to energy when objects collide?
Differentiation
Use investigation materials from the previous lesson as a visual support for students as they share their responses to these questions.
PhD SCIENCE® TEXAS Level 4 ▸ Energy ▸ Lesson 9 © Great Minds PBC 91
Tell students that modeling the second investigation may help develop an explanation. Explain that students will model each stage of the collision to track the energy efficiently:
▪ Before the collision (when students place the ball bearing on the ramp)
▪ During the collision (when the ball bearing collides with the catch)
▪ After the collision (when the catch slides to a stop)
Remind students that during their investigation, they tested four different release point heights, which produced four different ball bearing speeds. Ask them to discuss which collision would be the most helpful to model. As students share and challenge one another’s thinking, prompt discussion with the following questions as necessary: What is the purpose of our models? Which collision would have the most obvious changes in energy for us to model?
When students agree on which speed to model, have them record it in their Science Logbook (Lesson 9 Activity Guide).
Teacher Note
Although it may be most revealing to model the collision of the bearing with the fastest speed, modeling any of the four test groups will reveal the same principles.
Differentiation
Some students may need access to the materials from the investigation to help them think through their models. To provide this support, separate students into the same groups from the collision investigation in Lesson 8, and provide each group with the investigation materials (textbook, rulers, ball bearing, tape, ball bearing catch). If providing these supports, allocate additional time for the Learn portion of the lesson.
Model Energy Before a Collision
Ask students to work with a partner to develop a model in their Science Logbook (Lesson 9 Activity Guide) that explains what happened before the collision. Before students begin, ask them to reiterate the purpose of this model: to find out what happens to energy when objects collide. Explain the importance of showing where energy is present in their models so that they can accurately track energy at each stage.
Allow students up to 5 minutes to work with their partners to develop their initial models and label where energy is present. When students complete their models, reconvene and develop a class model. Record the model on chart paper or a whiteboard. Students should note that the energy comes from placing the ball bearing on the ramp. If necessary, guide students by asking one or more of the following questions: How did the ball bearing get energy? Where did that energy come from? What did the energy allow it to do?
Teacher Note
It may be necessary to explain how to approach these models in the Science Logbook. Space is provided to model energy before, during, and after the collision. Ask students to reflect on which components of the system should be included in each section of the model (3F).
Differentiation
Consider providing unlabeled collision models for students who need additional support. Ask students to label and provide an explanation for each drawing. This will allow these students to focus on developing understanding rather than on drawing.
Level 4 ▸ Energy ▸ Lesson 9 92 © Great Minds PBC
Learn 35
minutes
11 minutes
PhD SCIENCE® TEXAS
Sample class model: Before the Collision
We transferred energy to the ball by placing it high on the ramp.
Model Energy During a Collision 11 minutes
Repeat the process from the previous section by asking students to work with a partner to develop a model in their Science Logbook (Lesson 9 Activity Guide) that explains what happened during the collision. Before students begin, ask them to reiterate the purpose of this model: to find out what happens to energy when objects collide. Explain the importance of modeling the moment of the collision between the ball bearing and the catch to identify what is happening to the energy.
Allow students up to 5 minutes to work with their partners to develop their model. When students complete their models, reconvene and develop a class model. Students should note that during the collision, there was a sound, and the force applied to the catch by the ball bearing caused the catch to move. To guide students to this idea, ask questions such as these:
► What caused the catch to move?
▪ When the ball bearing hit the catch, a force was applied and it pushed the catch.
▪ The force applied by the ball bearing transferred some energy to the catch, which made it move.
► How did the catch get energy to move?
▪ The motion energy of the ball bearing transferred to the catch when they collided. That’s why the catch moved.
Spotlight on Knowledge and Skills
The connection between forces and collisions builds on Level 3 understanding that forces on an object that do not sum to zero can change the object’s speed or direction of motion (3.7B). Ask students to recall their previous understandings of balanced and unbalanced forces to help make the connection that whenever unbalanced forces act on an object, the object must change its speed, direction, or both (4.7, 3F).
PhD SCIENCE® TEXAS Level 4 ▸ Energy ▸ Lesson 9 © Great Minds PBC 93
Ensure that students understand that during a collision, the contact forces, or forces that result when two objects touch, cause the transfer of energy to change each object’s motion. Students should also note in their initial models that there was a sound as the ball bearing was rolling down the ruler and during the collision. Note this on the class model as a reference for when students model what happened after the collision. Teacher Note
English Language Development
Introduce the term contact force explicitly. Providing the Spanish cognate fuerza de contacto may be helpful.
Sample class model:
We noticed a sound.
We transferred energy to the ball by placing it high on the ramp.
The force from the collision pushed the catch, transferring energy from the ball bearing to the catch.
Model Energy After a Collision 13 minutes
To finish modeling the collision, repeat the process from the previous sections by asking students to work with a partner to develop a model in their Science Logbook (Lesson 9 Activity Guide) that explains what happened after the collision. Explain the importance of modeling where they notice energy after the collision.
To help students identify the presence of other energy indicators during the collision, it may be necessary to revisit the anchor chart from Lesson 5. To guide students to identify the presence of sound, ask them to consider whether any of the other energy indicators on the anchor chart were present during the collision.
Level 4 ▸ Energy ▸ Lesson 9 94 © Great Minds PBC
Before the Collision
During the Collision
PhD SCIENCE® TEXAS
Allow students up to 5 minutes to work with their partners to develop their model. When students complete their models, reconvene and develop a class model. Students should note that after the collision, the catch slid across the surface while making a noise and then came to a stop.
Ask students to share their thinking with the following prompts. Allow students to challenge one another’s thinking using the evidence they saw after the collision. Guide students to notice that indicators of energy other than motion are present after the collision.
► What happens to the energy from the ball bearing? Why does it stop moving? Where does the energy go?
▪ The energy from the ball bearing gets used up moving the catch across the floor.
▪ There was a lot of sound during and after the collision. Sound is an indicator of energy, so maybe some of the energy made sound.
Ask students to rub their hands together to mimic the catch sliding on the ground. Have students share what they notice: They hear a sound, and their hands get warmer, which both indicate the presence of energy.
► Why do you think the ball bearing and catch didn’t travel as far as the ball bearing by itself, even though you put in the same amount of energy? What differences did you observe between the investigations?
▪ The ball bearing had to transfer some energy to move the catch.
▪ Things that are flat on the bottom (like the catch) don’t roll because they slide across the ground. Some of the energy might change to sound or cause a temperature change, like when we rub our hands.
▪ There was a sound during the collision and then some more noise when the catch slid on the floor. The ball bearing by itself didn’t make that much noise. Maybe some of the energy changed to sound.
Connect the apparent changes from motion energy to sound and temperature variation to students’ questions on the driving question board, and agree to revisit this mystery in a later lesson.
Teacher Note
Students may express misconceptions about energy being used up rather than transferred. Students will further develop their understanding about transfer of energy throughout this module.
PhD SCIENCE® TEXAS Level 4 ▸ Energy ▸ Lesson 9 © Great Minds PBC 95
Sample class model:
Before the Collision
During the CollisionAfter the Collision
We noticed a sound.
We noticed sound when the catch was sliding. Stop!
Teacher Note
These diagrams help students understand energy relationships without the use of equations, setting the foundation for deeper understanding in high school.
Before the Collision represents potential energy:
potential energy = mass · gravity · height During the Collision represents kinetic energy:
We transferred energy to the ball by placing it high on the ramp.
The force from the collision pushed the catch, transferring energy from the ball bearing to the catch.
The catch slid, then stopped. We noticed there was motion, then a sound and less motion.
Check for Understanding
Students develop and use a model to represent energy transfer before, during, and after a ball bearing collides with a catch.
TEKS Assessed
4.1G Develop and use models to represent phenomena, objects, and processes or design a prototype for a solution to a problem.
4.5E Investigate how energy flows and matter cycles through systems and how matter is conserved.
4.8A Investigate and identify the transfer of energy by objects in motion, waves in water, and sound
Evidence
Students develop and use models (4.1G) to represent how energy flows (4.5E) from students’ hands to the ball bearing before the collision and from the ball bearing to both the catch and air as motion, sound, and thermal energy during and after the collision (4.8A).
Next Steps
If students need support with representing the flow of energy in their model, revisit the indicators of energy in the anchor chart from Lesson 5. Demonstrate the collision again and ask students what indicators of energy they observe before, during, and after the collision.
kinetic energy = 1 (mass)(velocity)2 2
After the Collision represents work: work = force · distance.
For lower grades, work is usually explained only as the special case where the force and the resulting motion are in the same direction. The actual expression applies more generally and is more complex. It is the dot product of the force and motion vectors.
Level 4 ▸ Energy ▸ Lesson 9 96 © Great Minds PBC
PhD SCIENCE® TEXAS
Land
5 minutes
As a class, discuss how the ball bearing collision investigation helps answer the Concept 1 Focus Question: What is energy and how does it transfer from place to place? Add key conceptual understandings to the anchor chart.
Sample anchor chart:
Energy Energy Classification and Transfer
• Energy is why things happen.
• Energy is present when we observe something happening (moving objects, light, temperature change, sound) or when something helps make something happen (electricity, batteries).
• Energy can transfer between objects through collisions, causing changes in their motion.
• Transferring more energy to an object can make it move faster.
• Faster-moving objects can transfer more energy to other objects.
Revisit the anchor model to apply this new knowledge about transfer of energy to the windmill phenomenon. Ask students to identify where energy transfer takes place in the anchor model.
Sample student responses:
▪ The wind is pushing the blades of the windmill. This is like when the ball bearing pushes the catch.
▪ The wires connect the blades to the light. So maybe the energy moves through the wires?
Explain that energy must move from the windmill to the light through the wires and electric currents transfer this energy through the wires. Explain that the term electrical energy is used to describe this
Teacher Note
If students begin to discuss why the blades stop turning by sharing ideas about energy transformations, you may add these to the model as well. However, because additional factors cause the blades to stop turning, this depth of understanding goes beyond grade-level expectations (3F).
English Language Development
Allow students to write or draw their ideas about energy transfer in the windmill model on a whiteboard. This can be used as a check for understanding as well as an opportunity for students to gain ideas and clarify misconceptions using other students’ ideas before revising their model.
For more information on using whiteboards as a response technique, refer to the Instructional Routines section of the Implementation Guide.
PhD SCIENCE® TEXAS Level 4 ▸ Energy ▸ Lesson 9 © Great Minds PBC 97
type of energy. Update the anchor chart to include that energy can also transfer from place to place through electric currents in wires.
English Language Development
Introduce the term electrical energy explicitly. Providing the Spanish cognate energía eléctrica may be helpful. Consider asking students to share examples of electrical energy such as the output of solar cells or batteries, or the energy used by electrical appliances (3F).
Sample anchor model:
How a Windmill Harnesses the Wind
Wind collides with the blades, transferring energy. Looks like a box.
Electric current transfers energy through wires.
In the windmill system, wind collides with the blades, which transfers energy to something that looks like a box. An electric current transfers energy through the wires and turns on the light. When the wind blows harder, more energy is transferred to the blades.
Teacher Note
Students may use the terms electricity and electrical energy interchangeably. The term electricity in everyday language is often used to describe what makes a light turn on; however, in science, the more precise term is electrical energy. The term electric current refers to the flow of particles that transfers electrical energy. Although each form of energy is not explicitly named in this module, teachers may encourage students to use more precise language to discuss energy (3F).
Level 4 ▸ Energy ▸ Lesson 9 98 © Great Minds PBC
whenLEDlightsup
bladesspin.
PhD SCIENCE® TEXAS
Sample anchor chart addition: Teacher Note
Energy
Energy Classification and Transfer
• Energy is why things happen.
• Energy is present when we observe something happening (moving objects, light, temperature change, sound) or when something helps make something happen (electricity, batteries).
• Energy can transfer between objects through collisions, causing changes in their motion.
• Transferring more energy to an object can make it move faster.
• Faster-moving objects can transfer more energy to other objects.
• Energy can also transfer from place to place through electric currents.
Revisit the class model of the ball bearing colliding with the catch. Focus student attention on the part of the model that describes what happens to the catch after the collision. Highlight the catch’s change in motion as it slides forward, slows down, and stops.
► What do you think causes the catch to slow down and stop, rather than continue to move at the same speed?
▪ Maybe all the energy transfers from the catch to the ground.
▪ A force from the ground might cause the catch to slow down and stop.
Elicit student ideas to develop the next lesson’s Phenomenon Question What causes a moving object to slow down and stop?
In the upcoming lessons, students learn that energy can be transferred in other ways as well—by light, sound, and heat. Leave room on the anchor chart to add these concepts.
PhD SCIENCE® TEXAS Level 4 ▸ Energy ▸ Lesson 9 © Great Minds PBC 99
Lessons 10–11 Slowing Motion Prepare
In Lessons 10 and 11, students investigate the Phenomenon Question What causes a moving object to slow down and stop? In Lesson 10, students plan and conduct an investigation to find out what causes an object to slow down and stop as the object moves across different materials. In Lesson 11, students analyze and interpret their investigation data to explain that friction can cause the forces acting on a moving object to be unbalanced, which can cause the object to slow down and stop.
Student Learning
Knowledge Statement
Friction can cause a moving object to slow down and stop.
Objectives
▪ Lesson 10: Plan and conduct an investigation to gather evidence of a force that can cause a moving object to slow down and stop.
▪ Lesson 11: Analyze and interpret data to explain that friction can cause a moving object to slow down and stop.
Concept 1: Energy Classification and Transfer
Focus Question
What is energy and how does it transfer from place to place?
Phenomenon Question
What causes a moving object to slow down and stop?
Level 4 ▸ Energy ▸ Lessons 10–11 100 © Great Minds PBC
PhD SCIENCE® TEXAS
Standards Addressed
Texas Essential Knowledge and Skills
Content Standards
4.7 Plan and conduct descriptive investigations to explore the patterns of forces such as gravity, friction, or magnetism in contact or at a distance on an object. (Addressed)
4.8A Investigate and identify the transfer of energy by objects in motion, waves in water, and sound. (Addressed)
Scientific and Engineering Practices
4.1A Ask questions and define problems based on observations or information from text, phenomena, models, or investigations. 10
4.1B Use scientific practices to plan and conduct descriptive investigations and use engineering practices to design solutions to problems.
4.1C Demonstrate safe practices and the use of safety equipment during classroom and field investigations as outlined in Texas Education Agency–approved safety standards.
Use tools, including hand lenses; metric rulers; Celsius thermometers; calculators; laser pointers; mirrors; digital scales; balances; graduated cylinders; beakers; hot plates; meter sticks; magnets; notebooks; timing devices; sieves; materials for building circuits; materials to support observation of habitats of organisms such as terrariums, aquariums, and collecting nets; and materials to support digital data collection such as computers, tablets, and cameras, to observe, measure, test, and analyze information.
4.1F Construct appropriate graphic organizers used to collect data, including tables, bar graphs, line graphs, tree maps, concept maps, Venn diagrams, flow charts or sequence maps, and input-output tables that show cause and effect.
10
11
10, 11
10, 11
11
PhD SCIENCE® TEXAS Level 4 ▸ Energy ▸ Lessons 10–11 © Great Minds PBC 101
Standard Student
Lesson(s)
Expectation
10,
11
11
Student
Lesson(s)
Standard
Expectation
10, 11
10
4.1D 10
4.1E Collect observations and measurements as evidence.
4.2B Analyze data by identifying any significant features, patterns, or sources of error.
4.3A Develop explanations and propose solutions supported by data and models.
4.3B Communicate explanations and solutions individually and collaboratively in a variety of settings and formats.
Recurring Themes and Concepts
4.5A
4.5B
4.5E
English Language Proficiency Standards
Ask and give information ranging from using a very limited bank of high-frequency, high-need, concrete vocabulary, including key words and expressions needed for basic communication in academic and social contexts, to using abstract and content-based vocabulary during extended speaking assignments.
Level 4 ▸ Energy ▸ Lessons 10–11 102 © Great Minds PBC
Standard Student Expectation Lesson(s)
Identify and
10
use patterns to explain scientific phenomena or to design solutions.
Identify and
10, 11
investigate cause-and-effect relationships to explain scientific phenomena or analyze problems.
Investigate
energy
and
11
how
flows
matter cycles through systems and how matter is conserved.
Standard Student Expectation Lesson(s)
3F
10, 11 Materials Student Materials Lesson(s) Science Logbook (Lesson 10 Activity Guide) 10, 11 1 oup 5 Slowing motion investigation (1 set per gr): ″ diameter marble (1), 1″ × 2″ × 0.5″ wooden block (1), 12″ × 24″ piece of f 16 ″ thickoam rubber 8 padding (1), 12″ × 24″ piece of burlap (1), 12″ × 24″ piece of artificial grass (1), safety goggles (1 per student), sticky note (1 per student pair), grooved ruler (1), meter stick (1), tape 10 Science Logbook (Lesson 11 Activity Guides A and B) 11 Conceptual Checkpoint (Lesson 11 Resource B) 11 PhD SCIENCE® TEXAS
PhD SCIENCE® TEXAS Level 4 ▸ Energy ▸ Lessons 10–11 © Great Minds PBC 103 Teacher Materials Lesson(s) Chart paper (2 pieces), marker (1) 10 Safety goggles (1) 10 Golf Course Photograph (Lesson 11 Resource A) 11 Teacher Preparation Lesson(s) Cue golfer hitting golf ball video (http://phdsci.link/1396). Cue video “Trouble at the Postage Stamp” (Golf Channel 2016) (http://phdsci.link/2434). 10 Cue motorboat on a river video (http://phdsci.link/2435). 11 Cue water wave and shoreline video (http://phdsci.link/2436). 11 Prepare to distribute a copy of Lesson 11 Resource B to each student. 11 10, 11
Lesson 10
Objective: Plan and conduct an investigation to gather evidence of a force that can cause a moving object to slow down and stop.
Agenda
Launch (6 minutes)
Learn (36 minutes)
▪ Develop an Investigation Plan (16 minutes)
▪ Conduct an Investigation (20 minutes)
Land (3 minutes)
Launch 6 minutes
Explain to students that golf is a sport where a player uses a club, which is a specialized stick, to hit a ball into a series of holes. Play the golfer hitting a golf ball video (http://phdsci.link/1396) from 0:00 to 0:10. Ask students to share their observations of energy, motion, and forces.
► What indicators of energy do you observe?
▪ The golf club is moving and causes the ball to move after they collide.
▪ The ball is moving. It has motion energy.
► What changes in motion do you notice? What forces are acting on the golf ball to cause its motion to change?
▪ The golf ball is at rest. Then it moves quickly in a straight line because the golf club pushes it with a force that changes its speed and direction.
▪ When the ball is at rest, it doesn’t move because the forces acting on it are balanced.
▪ The ball moves forward because the force from the golf club pushing it is stronger than the force pushing on the opposite side.
Level 4 ▸ Energy ▸ Lesson 10 104 © Great Minds PBC
PhD SCIENCE® TEXAS
Play the video from 0:10 to the end.
► What changes in motion do you notice?
▪ The ball slows down, and then it stops.
▪ When the golf ball stops, it stays at rest. It doesn’t move anymore.
► Think about what you know about forces. Why do you think the ball slows down and stops? Spotlight on Knowledge and Skills
▪ There must be a force acting on the ball to change its motion and slow it down.
▪ A force pushing on one side of the ball must be stronger than the force pushing on the opposite side. Otherwise, there would be no change in motion.
Build on student responses to conclude that there must be another force acting on the golf ball after it is hit because its motion changes as it slows down and stops. Remind students that in the previous lesson they observed that the catch moved and then slowed down and stopped after the ball bearing collided with it. Tell students that in this lesson they will explore the forces involved in a ball’s motion as they plan and conduct a fair test investigation to answer the Phenomenon Question What causes a moving object to slow down and stop?
Develop an Investigation Plan
Play the video “Trouble at the Postage Stamp” (Golf Channel 2016) (http://phdsci.link/2434) from 0:00 to 0:14. Tell students that the surface of a golf course is usually made up of different materials designed to challenge players.
► What do you notice about the materials the golf ball travels across after the golfer hits it?
▪ The height of the grass is different in different areas.
▪ The golf ball is sitting in tall grass when it is hit. It travels across short grass and then stops in tall grass.
In Level 3, students conducted a fair test investigation to gather evidence that balanced and unbalanced forces result in changes in an object’s position and motion (3.7B). Students build on their understanding in the fair test investigation in this lesson as they make connections between forces and mechanical energy (4.7).
Consider asking students to recall their previous understandings of balanced and unbalanced forces to help make the following connection: Whenever unbalanced forces are applied to an object, it must change its speed and/or direction (3F).
English Language Development
Students will encounter the term surface throughout the lesson set. Consider providing a student-friendly explanation such as “The surface of a table is its outside layer. A table’s surface is flat and hard.”
PhD SCIENCE® TEXAS Level 4 ▸ Energy ▸ Lesson 10 © Great Minds PBC 105
Learn 36
minutes
16 minutes
► How do the different types of grass affect the golf ball’s motion?
▪ The ball rolls quickly on the short grass.
▪ When the ball rolls into the tall grass, it slows down and stops.
Confirm that the material a ball rolls on affects the motion of the ball. Show the class the materials available for the investigation (i.e., grooved rulers, marbles, meter sticks, tape, wooden blocks, pieces of burlap, pieces of foam rubber padding, and pieces of artificial grass). Tell students that they will use these materials as they work in groups to plan and conduct their investigations. Discuss safety rules and expectations for working in groups.
Safety Note
This investigation poses potential hazards. To minimize the risk, review these safety measures and look for evidence that students are following them (4.1C):
▪ Only roll the marbles. Never throw them or place them in mouths.
▪ Watch for objects on the floor, such as marbles, rulers, and other testing materials, to prevent slips and falls.
▪ Wear safety goggles at all times to prevent eye injury from moving objects.
Divide the class into groups and distribute a set of investigation materials to each group. Then ask students to work with a partner in their group and distribute a sticky note to each student pair. Tell students to work with their partner to record an investigation question on their sticky note. Explain that they should be able to use their investigation question and the materials to investigate the force that causes a moving marble to slow down and stop. As students work, circulate to support teamwork and question development.
Provide time for students to examine the investigation materials and record their questions. Then invite students to share their questions with the class. As they share, ask them to post their sticky notes in a location that is easily visible to all students. Students should stack sticky notes with similar questions on top of one another.
Extension
Students may have ideas for additional materials to test. Consider allowing students to test these materials as an extension. For example, students could go outside and measure the distance the marble rolls on playground surfacing, grass, sand, concrete, and asphalt. Students could also measure how far the marble rolls on a classroom rug, linoleum hallway, and gym floor.
Spotlight on Knowledge and Skills
In Levels 3 through 5, students work collaboratively to plan and conduct fair test investigations (4.1B). To aid student growth, circulate among groups and ask students to identify the variables that should stay the same in their investigation to ensure a fair test.
Differentiation
If students need additional support with generating questions, consider providing sentence frames such as these (3F):
▪ How does change ?
▪ What is the effect of on ?
▪ What happens when ?
▪ What is the relationship between and ?
Level 4 ▸ Energy ▸ Lesson 10 106 © Great Minds PBC
PhD SCIENCE® TEXAS
Sample questions:
▪ What material will the marble roll the farthest on?
▪ Will the marble stop in the same place on all the materials?
▪ How does the type of material change how far the marble travels?
▪ How will the material affect how the marble rolls?
▪ Will the marble stop at a shorter distance on some materials than others?
After all students have shared, invite them to think about how they could use their questions to design an investigation.
► Think about the questions we asked as a class. What variable should we change to help us understand the force that causes a marble to slow down and stop?
▪ We have three different materials, so I think we should change the type of material the marble rolls on.
▪ Let’s try all of the materials and observe how the marble slows down and stops on each one.
Guide students to identify that the material the marble rolls on is the variable that should change in the investigation. Create a class fair test guidelines chart on a piece of chart paper and record this variable in the second column.
Then work with students to select a testable question to frame the investigation. Remind students that a testable question is one that can be answered by using evidence gathered through investigation. If none of the questions suggested by students are testable, work with the class to develop a testable question to investigate, such as this: How do different materials affect the distance the marble travels? Record the investigation question in the first column of the class fair test guidelines chart. Prompt students to also record the investigation question in their Science Logbook (Lesson 10 Activity Guide).
Next, ask students to consider other variables in the investigation. Use a collaborative conversation routine such as a Snowball routine to elicit student responses to the following questions.
English Language Development
In Level 3, students learned about variables in fair test investigations. Remind students that a variable is any condition or factor that can change in an investigation.
PhD SCIENCE® TEXAS Level 4 ▸ Energy ▸ Lesson 10 © Great Minds PBC 107
► What variables should stay the same in the investigation?
▪ The marble’s starting speed should always be the same.
▪ The marble should start from rest so that it always starts with the same speed.
▪ The marble should start from the same position each time.
▪ We need to make sure the material lays flat so that the marble doesn’t hit any wrinkles as it rolls.
► How can we make sure all groups gather data consistently and accurately?
▪ We need to measure the distance the marble rolls the same way each time.
▪ All groups should measure how far the marble travels using the same units.
▪ We should record our data in a table.
Record relevant student suggestions in the class fair test guidelines chart.
Sample class fair test guidelines chart:
Investigation Question
▪ How do different materials affect the distance the marble travels?
Change One Variable at a Time
▪ Material marble rolls on: burlap, rubber padding, artificial grass
Keep All Other Variables the Same
▪ Placement of material: lay material flat on a smooth, hard surface
▪ Placement of marble: place the marble in the same starting position each time
▪ Speed of marble: roll the marble the same way each time so that the marble’s starting speed is the same
Gather Data in the Same Way Each Time
▪ Take measurements.
▪ Record data in a table.
Gather Data as Accurately as Possible
▪ Use a meter stick to measure (in centimeters) the distance the marble travels before it comes to rest.
Level 4 ▸ Energy ▸ Lesson 10 108 © Great Minds PBC
PhD SCIENCE® TEXAS
Use the class fair test guidelines chart to facilitate a discussion to develop a class investigation plan. During the discussion, record the class investigation plan on a piece of chart paper. As students share ideas, demonstrate how a grooved ruler can be propped up and taped to a wooden block to create a ramp for the marble to roll down.
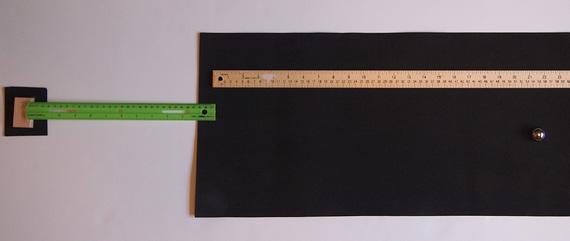
Sample class display:
Teacher Note
If students need additional support when developing the investigation plan, ask guiding questions such as these (3F):
▪ How can we use the ruler and the block to keep the starting speed of the marble the same each time?
▪ How many trials should we do for each material?
▪ How can we measure the distance the marble travels the same way each time?
If needed, explain that rolling the marble down the grooved ruler will ensure that the marble’s starting speed is consistent. Then demonstrate how to align the meter stick with the end of the grooved ruler to measure the distance the marble travels.
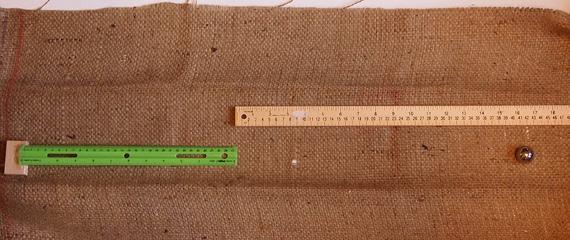
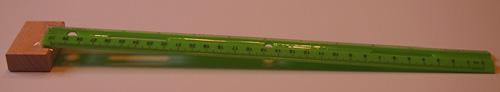
Sample class displays:
Teacher Note
Coach students to place the ramp on the material as shown in the photographs. This placement will keep the angle of the ruler and the speed of the marble consistent. If this setup results in the marble rolling off the end of the material, use scissors to cut a corner off of each piece that is large enough for the block to sit on. Move the cut piece away from the larger piece, and help students set the ramp up so that the block sits on it. The end of the ramp can then be placed on the left edge of the larger piece of material so that the marble has the entire length of the material to roll down. This should provide sufficient space for the marble to roll without changing the angle of the ruler.
PhD SCIENCE® TEXAS Level 4 ▸ Energy ▸ Lesson 10 © Great Minds PBC 109
Tell students that they will conduct four trials for each material and an optional fifth trial if measurements vary significantly. Direct students to look at the data table in their Science Logbook (Lesson 10 Activity Guide). Point out that they should use the unlabeled column to record data for the fifth trial if needed. If students use the column for a fifth trial, instruct them to title the column Trial 5. Tell students that they will complete the column labeled Typical Distance in the next lesson. Display the class investigation plan in a central location so that students can easily refer to it throughout the investigation.
Sample class investigation plan:
1. Place the material on a smooth, hard surface. Lay the material so that it is flat on the surface.
2. Place the wooden block on the material.
3. Lean the ruler groove-side up against the block. Line up the zero on the ruler with the edge of the block. Tape this end of the ruler to the block to create a ramp.
4. Place the meter stick on the material. Line up the zero on the meter stick with the end of the ramp.
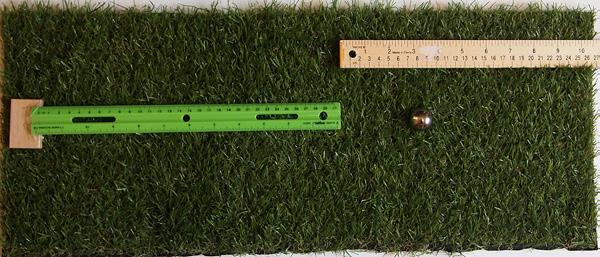
5. Release the marble from the top of the ramp. The marble should roll down the ramp and onto the material.
6. After the marble stops rolling, use the meter stick to measure the distance it traveled. Measure from the bottom of the ramp to the center of the marble.
7. Repeat steps 5 and 6 three times.
8. Repeat steps 1 through 7 for each material.
Spotlight on Knowledge and Skills
Tell students to record and keep all data in their Science Logbook, even if it is inconsistent with data from other trials. Have students consider reasons that may have caused their data to be inconsistent, and encourage them to perform a fifth trial as needed (4.1E). If students know they performed a trial incorrectly, have them record their data in the table and write a note next to the data that describes the error.
Level 4 ▸ Energy ▸ Lesson 10 110 © Great Minds PBC
PhD SCIENCE® TEXAS
Conduct an Investigation 20 minutes
Prompt students to work with a partner to record a prediction in their Science Logbook (Lesson 10 Activity Guide) in response to the investigation question. Explain that students’ predictions should identify how they think different materials will affect the distance the marble travels. Ask students to share their predictions with the class. Differentiation
Sample student responses:
▪ I think the marble will travel the shortest distance on the artificial grass.
▪ I think the marble will travel the farthest distance on the burlap.
▪ I predict that the marble will travel the farthest distance on the rubber padding and the shortest distance on the artificial grass.
► What evidence did you use to make your prediction?
▪ I compared how rough or smooth each material felt. The artificial grass feels rougher than the other two materials.
▪ The burlap is a little rough, but it is also flat and thin. I think the marble will roll across it easily.
Point out similarities and differences in students’ predictions and reasoning. Then ask students to list the three materials they will test in the first column of the data table in their Science Logbook (Lesson 10 Activity Guide).
Sample data table:
Distance Marble Travels (centimeters)
Ask students to feel and describe the texture of each material. Have them think about how the texture of a material might affect the motion of the marble.
PhD SCIENCE® TEXAS Level 4 ▸ Energy ▸ Lesson 10 © Great Minds PBC 111
Material Trial 1 Trial 2 Trial 3 Trial 4 Typical Distance Burlap Rubber padding Artificial grass
When students are ready, instruct each group to begin the investigation. Students should record measurements in their Science Logbook (Lesson 10 Activity Guide) as they work. Explain that students should record measurements to the nearest whole centimeter. Also suggest that students conduct test runs by releasing the marble down the ramp a few times before collecting data to ensure that its initial speed is as consistent as possible. Teacher Note
Check for Understanding
Students conduct an investigation by using the class plan to explore how the force of friction from different materials affects the distance a marble travels.
TEKS Assessed
4.1B Use scientific practices to plan and conduct descriptive investigations and use engineering practices to design solutions to problems.
4.1C Demonstrate safe practices and the use of safety equipment during classroom and field investigations as outlined in Texas Education Agency–approved safety standards.
4.1D Use tools, including hand lenses; metric rulers; Celsius thermometers; calculators; laser pointers; mirrors; digital scales; balances; graduated cylinders; beakers; hot plates; meter sticks; magnets; notebooks; timing devices; sieves; materials for building circuits; materials to support observation of habitats of organisms such as terrariums, aquariums, and collecting nets; and materials to support digital data collection such as computers, tablets, and cameras, to observe, measure, test, and analyze information.
4.1E Collect observations and measurements as evidence.
4.5B Identify and investigate cause-and-effect relationships to explain scientific phenomena or analyze problems.
4.7 Plan and conduct descriptive investigations to explore the patterns of forces such as gravity, friction, or magnetism in contact or at a distance on an object.
Evidence
Students use scientific (4.1B) and safe (4.1C) practices to conduct an investigation where they use tools (4.1D) to collect observations and measurements as evidence (4.1E) of a cause-and-effect relationship (4.5B) between the force of friction on a marble rolling on different surface materials and the distance the marble travels (4.7).
Next Steps
If students need support with recording accurate measurements, work with them to ensure that they consistently measure the distance the marble travels. If students need support to measure to the nearest whole centimeter, work with them individually to practice reading measurements on a ruler or meterstick.
If students need support with working collaboratively, assign roles to encourage individual responsibility while ensuring that the group can carry out the investigation successfully. Possible roles include releasing the marble, measuring the distance the marble travels, changing the material between tests, recording data, and ensuring that all fair test guidelines are followed.
Content Area Connection: Mathematics
As the marble rolls, it may move too far away from the meter stick for students to easily measure the distance it traveled. Model for students how to use another object to help them take the measurement. For example, students can place a pencil perpendicular to the meter stick so that it makes a line that connects the center of the marble to the meter stick.
Level 4 ▸ Energy ▸ Lesson 10 112 © Great Minds PBC
PhD SCIENCE® TEXAS
Land
3 minutes
Ask students to work with a partner from their group to revisit the prediction and data they recorded in their Science Logbook (Lesson 10 Activity Guide).
► How does the data support or challenge your prediction?
▪ I predicted that the marble would travel the shortest distance on the artificial grass. My data supports my prediction because the marble rolled 16 to 17 centimeters on the artificial grass, which is less than the distances for the other materials.
▪ I thought that the marble would travel the farthest on the rubber padding, but my data does not support my prediction. The marble traveled 32 to 33 centimeters on the rubber padding, which is farther than it did on the artificial grass but shorter than it did on the burlap.
Tell students that they will analyze and interpret their data in the next lesson.
Content Area Connection: English
Consider scaffolding students’ contributions to encourage answers with appropriate elaboration and detail. Note for students that some “how” questions, such as this one, require multiple steps in their thinking. For this question, students must determine if the data supports or challenges their prediction before they can describe how. For additional support, provide a sentence frame such as the following (3F): The data (supports/challenges) my prediction because I predicted and the data shows .
PhD SCIENCE® TEXAS Level 4 ▸ Energy ▸ Lesson 10 © Great Minds PBC 113
Lesson 11
Objective: Analyze and interpret data to explain that friction can cause a moving object to slow down and stop.
Launch
Display the photograph of a golf course (Lesson 11 Resource A).
Agenda
Launch (3 minutes)
Learn (38 minutes)
▪ Analyze Data (18 minutes)
▪ Interpret Data (10 minutes)
▪ Conceptual Checkpoint (10 minutes)
Land (4 minutes)
Ask students to closely observe the ground in the photograph as they Think–Pair–Share in response to the following questions.
► What do you notice about the materials that make up the surface of the golf course?

▪ There are several different types of materials.
▪ It looks like the grass around the flag is cut very short.
▪ The grass farther away from the flag looks rougher and thicker.
▪ I see areas of sand too.
Level 4 ▸ Energy ▸ Lesson 11 114 © Great Minds PBC
3 minutes
PhD SCIENCE® TEXAS
► Why do you think golf courses use different surface materials?
▪ I think different materials probably cause golf balls to slow and stop at different distances like the materials we tested in our investigation.
▪ I think a golf ball rolls farther on short grass than on long grass.
▪ Maybe if a player hits a golf ball into the sand, the ball doesn’t roll very far until it stops.
Highlight responses that relate a golf course to students’ investigation from the previous lesson. Tell students that in this lesson, they will analyze and interpret the data from their investigation.
Learn
38 minutes
Analyze Data
18 minutes
Explain that scientists often graph data to look for patterns to help them analyze the results of an investigation. Tell students that they will create line plots to represent the data they recorded during the previous lesson. Explain that students will also determine a typical distance value for each material. Tell students that the typical distance value should be the value they think best represents the data for all of the trials for each material.
Ask students to begin by recording a title for the first line plot in their Science Logbook (Lesson 11 Activity Guide A). Tell students that the title should include burlap as the tested material.
Next, guide students through the process of creating their first line plot. Ask them to use the data table in their Science Logbook (Lesson 10 Activity Guide) to identify the shortest and longest distances they recorded for the marble on burlap.
► How can you use the shortest and longest distances you recorded to create a line plot?
▪ We can use those distances as the endpoints for our line plot.
▪ We need to choose a scale and draw tick marks between the endpoints.
▪ We should label the tick marks with whole numbers because we recorded distances to the nearest whole centimeter.
PhD SCIENCE® TEXAS Level 4 ▸ Energy ▸ Lesson 11 © Great Minds PBC 115
Summarize that students should record the shortest and longest distances as the endpoints of their line plots and draw tick marks using a whole number interval. Divide students into the same groups they worked in during the previous lesson, and ask them to work together to create a number line for the burlap line plot in their Science Logbook (Lesson 11 Activity Guide A). Then tell students to draw an X for each data point above the associated number on the number line.
Sample burlap line plot:
Material Tested: Burlap
X
41
XX X 4243
Distance Marble Travels (centimeters)
After students in each group create a burlap line plot, tell them to work together to analyze it and determine a typical distance value, or the value that best represents the distance the marble traveled on burlap. Guide students by asking them to discuss the following questions with their groups.
► Which values are not the best representations of the data?
► What is the most common distance marked on the line plot?
► Which distance best represents the data set?
Teacher Note
If students need support with this activity, help them select a typical distance value that best represents their data set. If data points are between two numbers, encourage students to pick a distance at about the midway point. If data points represent two consecutive whole numbers, have students choose the distance with more marks. Students may select either distance if both distances have the same number of marks.
Level 4 ▸ Energy ▸ Lesson 11 116 © Great Minds PBC
PhD SCIENCE® TEXAS
Prompt students to record the typical distance value they determined for burlap in the last column of the data table in their Science Logbook (Lesson 10 Activity Guide). Then have students work with their groups to create line plots in their Science Logbook (Lesson 11 Activity Guide A) for the other two materials. Remind students to title their line plots and to use them to determine and record the typical distance value for each material.
Sample rubber padding and artificial grass line plots:
Material Tested: Rubber Padding
53545556
Distance Marble Travels (centimeters)
Sample data table: Distance Marble Travels (centimeters)
XXX X 57 8
Material Tested: Artificial Grass X X X 9
X
Distance Marble Travels (centimeters)
PhD SCIENCE® TEXAS Level 4 ▸ Energy ▸ Lesson 11 © Great Minds PBC 117
Material Trial 1 Trial 2 Trial 3 Trial 4 Typical Distance Burlap 43 41 42 42 42 Rubber padding 53 57 57 55 55 Artificial grass 9 8 9 9 9
Interpret Data 10 minutes
Ask students to work with a partner from their group to discuss and answer the two reflection questions in their Science Logbook (Lesson 11 Activity Guide A). Then ask students to share and discuss their answers with the class.
► What is the relationship between the material and the distance the marble travels?
▪ It seems like the rougher the material, the shorter the distance the marble travels before it stops.
▪ The marble travels farther on smoother materials than on rougher materials.
► What does this relationship tell us?
▪ There must be something that is slowing the marble down on every material.
▪ There must be a force changing the motion of the marble. I think the force is stronger for rougher materials.
Replay the golfer hitting a golf ball video (http://phdsci.link/1396) so that students can contextualize the results of their investigation. Then ask students to consider the forces acting on the ball.
► What forces act on the ball as it rolls?
▪ The force of gravity pulls down on the ball.
▪ There is an upward force from the ground the ball rolls on.
► What force do you think causes the ball to slow down?
▪ I don’t think it is gravity because the ball is not falling.
▪ The upward force isn’t causing the ball to slow down because the ball is not moving up or down.
▪ I think gravity and the upward force are balanced.
▪ There must be another force that is pushing the ball in the direction opposite to its motion.
Differentiation
For students who would benefit from additional processing time, allow them to answer the questions in their Science Logbook on their own before discussing them with a partner.
Teacher Note
In Level 3, gravity was defined as the force that pulls objects toward Earth. Consider reviewing the concept of gravity as well as balanced and unbalanced forces with students as needed.
Teacher Note
If students need additional support expressing their ideas about the force that causes the ball to slow down, ask guiding questions such as these (3F):
▪ How can we use our understanding of forces to explain the ball’s motion?
▪ Were the forces acting on the ball balanced or unbalanced?
Level 4 ▸ Energy ▸ Lesson 11 118 © Great Minds PBC
PhD SCIENCE® TEXAS
Use student responses to confirm that another force must cause the ball to slow down. Identify this force as friction. Remind students that friction is a force exerted between the surfaces of objects in contact and that it causes moving objects to slow down and eventually stop.
► How did the friction acting on the marble compare for each material we tested?
▪ The marble rolled the farthest on the burlap, so I don’t think the force of friction was very strong.
▪ I think the force of friction was strongest for the artificial grass. The marble stopped at the shortest distance on that material.
Confirm that the force of friction was strongest for the material on which the marble rolled the shortest distance.
Conceptual Checkpoint 10 minutes
Tell students that they will now use their new knowledge to explain how forces and energy interact within a system. Tell students that they will watch a video while looking for indicators of energy or force in a boat, water wave, and shoreline system. Play the motorboat on a river video (http://phdsci.link/2435), and point out the boat, water wave, and shorelines for students. Direct students to record their observations about indicators of energy or force in their Science Logbook (Lesson 11 Activity Guide B).
Tell students that the next video is a close-up view of a water wave colliding with a shoreline and that students should again record observations about indicators of energy or force. Play the water wave and shoreline video (http://phdsci.link/2436).
After students have watched both videos, ask students to Think–Pair–Share where they saw indicators of energy or force in the boat, water wave, and shoreline system and in the water wave and shoreline system.
Distribute the Conceptual Checkpoint (Lesson 11 Resource B) to each student and instruct students to read the prompts and independently complete the items that follow.
► In each sentence, circle the words to describe where energy transfers in the system.
▪ The wave / boat transfers motion energy to the wave / boat.
▪ The wave / shoreline transfers motion energy to the wave / shoreline.
▪ Motion energy also becomes sound energy at the boat / shoreline.
Spotlight on Knowledge and Skills
Friction is a complex contact force that occurs at the atomic scale. At this level, friction is introduced to help students understand that multiple forces can act on an object and that together these forces can explain the object’s motion (4.7).
English Language Development
Students will encounter the term friction throughout the module. Providing the Spanish cognate fricción may be helpful.
Teacher Note
For elementary grades, different phenomena are lumped together under the term friction. Students do not need to distinguish among these types of friction until middle and high school.
▪ Static friction occurs between touching objects not moving relative to each other.
▪ Sliding friction occurs between touching objects sliding past each other.
▪ Rolling friction, also called rolling resistance, affects wheels, golf balls, and other rolling objects.
PhD SCIENCE® TEXAS Level 4 ▸ Energy ▸ Lesson 11 © Great Minds PBC 119
► Circle the collision that transfers energy to the shoreline.
▪ Between the boat and the shoreline
▪ Between the waves and the shoreline
▪ Between the shoreline and the sound
► Circle the investigation you could conduct to answer the question.
▪ Investigate how the temperature of the water affects the force on the shoreline.
▪ Investigate how the speed of the boat affects the force on the shoreline.
▪ Investigate how the color of the boat affects the force on the shoreline.
Conceptual Checkpoint
Students use their observations of a boat, wave, and shoreline system to explain how energy transfers through the system and causes damage to the shoreline through a collision force.
4.1B Use scientific practices to plan and conduct descriptive investigations and use engineering practices to design solutions to problems.
4.2B Analyze data by identifying any significant features, patterns, or sources of error.
4.3A Develop explanations and propose solutions supported by data and models.
4.5B Identify and investigate cause-and-effect relationships to explain scientific phenomena or analyze problems.
4.5E Investigate how energy flows and matter cycles through systems and how matter is conserved.
4.7 Plan and conduct descriptive investigations to explore the patterns of forces such as gravity, friction, or magnetism in contact or at a distance on an object.
4.8A Investigate and identify the transfer of energy by objects in motion, waves in water, and sound.
Level 4 ▸ Energy ▸ Lesson 11 120 © Great Minds PBC
TEKS Assessed
PhD SCIENCE® TEXAS
Conceptual Checkpoint (continued)
Evidence
Students use their observations (4.2B) to explain (4.3A) that the boat’s motion energy (4.5B) is transferred to the water in the form of waves and that energy from the waves is transferred to the shoreline as sound energy (4.8A).
Students identify that the collision that transfers energy (4.7) occurs between the waves and the shoreline (4.5E).
Next Steps
If students need support to explain the transfer of energy, prompt them with the following question: How did we follow the path of energy transfer in the anchor model of the windmill?
Students identify that a boat’s speed (4.5E) should be investigated (4.1B) to determine how the forces from waves colliding with the shoreline may damage the shoreline (4.7).
If students need support to identify a collision force, prompt them with a question such as the following: What did you observe happen between the ball and catch during the collision investigation?
If students need support to identify the correct investigation, prompt them with the following question: In the investigation we did in class, what caused the force of the collision to be greater?
After students finish, debrief the Conceptual Checkpoint with students to clarify their understanding of energy transfer in the system. Confirm that energy transferred from the boat to the waves and then to the shoreline. As the wave collided with the shoreline, there was a collision force between the wave and the shoreline, and energy was transferred to the shoreline, causing damage. As the energy was transferred to the shoreline, some of the energy was also transformed to sound.
PhD SCIENCE® TEXAS Level 4 ▸ Energy ▸ Lesson 11 © Great Minds PBC 121
Land4 minutes
Ask students to respond to the Phenomenon Question What causes a moving object to slow down and stop?
Sample student responses:
▪ Friction can cause a moving object to slow down and stop.
▪ A moving object on a rough material will slow down in a shorter distance than the same object on a smooth material because the force of friction is stronger.
Direct students to the list of related phenomena at the bottom of the driving question board. Allow students to Think–Pair–Share how their new learning can explain these student-generated phenomena. Guide students to make connections between what they have learned about forces and energy and the phenomena.
Ask students to look back at the driving question board.
► What questions have we answered?
▪ We now know that friction can cause a ball to stop rolling.
▪ We have answered our questions about why balls slow down and stop.
▪ We know how energy transfers.
► Now that we have determined how energy transfers from place to place, what do we still need to figure out?
▪ Now we need to find out how windmills generate electricity.
▪ Now we want to figure out how the windmill changes the energy in wind to the energy in light.
Use this discussion to connect to students’ observations and descriptions of sound during the collision investigation from previous lessons. Remind students that in the collision investigation the energy indicators they observed seemed to change from motion to sound. Tell students that in the next lesson, they will explore whether energy can change from one form to another.
Level 4 ▸ Energy ▸ Lesson 11 122 © Great Minds PBC
PhD SCIENCE® TEXAS
Lessons 12–13 Changes in Energy Indicators
Prepare
In Concept 1, students began to explore energy transfer and learned that energy can be transferred between objects and by electric currents. In Lessons 12 and 13, students continue to explore the movement of energy through systems as they make observations at three energy in systems stations. After they visit each station, students develop a model to show how energy moves through each system. They identify patterns and relationships in their observations to understand that energy transferred by light and sound may transform to produce new energy phenomena. With this new knowledge, students refine the anchor chart and anchor model before answering questions from the driving question board and selecting new questions to investigate.
Student Learning Knowledge Statement
Energy is transferred and transformed as it moves through a system.
Concept 2: Energy Transformation
Focus Question
How does energy transform?
Phenomenon Question
What do we observe when energy moves through a system?
PhD SCIENCE® TEXAS Level 4 ▸ Energy ▸ Lessons 12–13 © Great Minds PBC 123
Objectives
▪ Lesson 12: Observe transfers of energy that produce motion, light, sound, and thermal energy.
▪ Lesson 13: Explain that energy may transform to produce new phenomena, such as light and temperature change.
Standards Addressed
Texas Essential Knowledge and Skills
Scientific and Engineering Practices
4.1C Demonstrate safe practices and the use of safety equipment during classroom and field investigations as outlined in Texas Education Agency–approved safety standards.
4.1D
Use tools, including hand lenses; metric rulers; Celsius thermometers; calculators; laser pointers; mirrors; digital scales; balances; graduated cylinders; beakers; hot plates; meter sticks; magnets; notebooks; timing devices; sieves; materials for building circuits; materials to support observation of habitats of organisms such as terrariums, aquariums, and collecting nets; and materials to support digital data collection such as computers, tablets, and cameras, to observe, measure, test, and analyze information.
4.1E Collect observations and measurements as evidence.
4.1G Develop and use models to represent phenomena, objects, and processes or design a prototype for a solution to a problem.
4.3A Develop explanations and propose solutions supported by data and models.
Level 4 ▸ Energy ▸ Lessons 12–13 124 © Great Minds PBC
Content Standards Standard Student Expectation Lesson(s) 4.8A Investigate and
, waves in water, and sound. (Addressed) 12, 13 4.8C Demonstrate and describe how electrical energy travels in a closed path that can produce light and thermal energy. (Addressed) 13
identify the transfer of energy by objects in motion
Standard Student Expectation Lesson(s)
12
12, 13
12, 13
12, 13
12, 13 PhD SCIENCE® TEXAS
Scientific and Engineering Practices (continued)
Recurring Themes and Concepts
English Language Proficiency Standards
PhD SCIENCE® TEXAS Level 4 ▸ Energy ▸ Lessons 12–13 © Great Minds PBC 125
Standard Student Expectation Lesson(s) 4.3B Communicate explanations and solutions individually and collaboratively in a variety of settings and formats. 12, 13 4.3C Listen actively to others’ explanations to identify relevant evidence and engage respectfully in scientific discussion. 13
Standard Student Expectation Lesson(s) 4.5B Identify and investigate cause-and-effect relationships to explain scientific phenomena or analyze problems. 12, 13 4.5E Investigate how energy flows and matter cycles through systems and how matter is conserved. 12, 13
Standard Student Expectation Lesson(s) 3D Speak using grade-level content area vocabulary in context to internalize new English words and build academic language proficiency. 12, 13 Materials Student Materials Lesson(s) Science Logbook (Lesson 12 Activity Guide) 12, 13 Sticky note (1) Science Logbook (Lesson 13 Activity Guides A and B) 12 13
Level 4 ▸ Energy ▸ Lessons 12–13 126 © Great Minds PBC Teacher Materials Lesson(s) Hand-crank flashlight (1) 12 Station 1 (2 stations per class):
(1) 12 Station 2 (2 stations per class): 9 oz
(1),
and audio source (1 of each if available), procedure sheet (1) 12 Station 3 (2 stations per class):
thermometers (2), procedure sheet (1) 12 Heat lamp demonstration: heat lamp with reflector (1), Celsius thermometer (1) 13 Heat Lamp Components Diagram (Lesson 13 Resource) 13 Teacher Preparation Lesson(s) Prepare energy in systems stations. (See Lesson 12 Resources A and B.) 12 (Optional) Prepare extension stations. (See Lesson 12 Resources C, D, E, and F.) 12 Cue electric kettle video (http://phdsci.link/2437). 13 Cue power lines video (http://phdsci.link/2438). 13 PhD SCIENCE® TEXAS
solar cell (1), buzzer (1), alligator clip cords (2), flashlight with batteries (1), procedure sheet
clear plastic cup (1), dry rice (1 tbsp), piece of plastic wrap (1, large enough to fit over cup), rubber band
speaker
9 oz clear plastic cups (2), heat lamp with reflector (1), heat light bulb (1), small binder clips (2), Celsius
Lesson 12
Objective: Observe transfers of energy that produce motion, light, sound, and thermal energy.
Agenda
Launch (5 minutes)
Learn (35 minutes)
▪ Observe and Model Energy in Systems (35 minutes)
Land (5 minutes)
Teacher Note
In Lessons 12 and 13, students continue to build a foundation to understand how energy changes forms. Help students understand how energy transfers from object to object by giving examples, such as energy transfer from electrical wires to a speaker. Students’ understanding of energy transfer and the transformation of energy into different forms will be further developed in later grades.
Demonstrate using a hand-crank flashlight for students. Remind students that they observed a hand-crank flashlight in a previous lesson. While demonstrating the hand-crank flashlight, point out that students are observing a system.
► What parts make up the system that produces light from the hand-crank flashlight?
▪ Your hand is moving the crank so you are part of the system.
▪ The crank is part of the system.
▪ There’s a light bulb in the flashlight that lights up.
▪ I think there might be wires inside the flashlight.
Confirm that a hand, crank, wires, and light bulb are all parts of the system. Draw attention to student responses that mention light or the hand moving the crank.
PhD SCIENCE® TEXAS Level 4 ▸ Energy ▸ Lesson 12 © Great Minds PBC 127
Launch 5 minutes
► What indicators of energy can we observe in this system?
▪ Your hand is moving the crank so there is motion energy.
▪ The flashlight lights up so there is light energy.
▪ I can’t see electrical energy, but the light bulb looks like the one in my battery flashlight, so I think electrical energy is there.
► How do you think energy is moving through this system?
▪ I’m not sure what’s inside the flashlight, but I think energy might travel through it from the crank to the light bulb somehow.
▪ I think energy is transferred from your hand to the crank to the wires to the light bulb.
▪ I wonder if the light energy in the light bulb comes from the motion energy of the hand moving the crank somehow.
Point out students’ uncertainty about how energy moves through the system. Introduce the Phenomenon Question What do we observe when energy moves through a system?
Observe and Model Energy in Systems
35 minutes
Inform students that they will explore how energy moves through multiple systems as they visit three stations in groups (Lesson 12 Resource A). Tell students they will investigate the processes occurring at each station by identifying indicators of energy.
Review class expectations for working collaboratively, and then divide the class into groups. Assign each group a specific station to begin working.
Differentiation
Consider the following factors when grouping students: English proficiency, individual learning supports, team dynamics, and intrinsic motivation and interest in science.
Level 4 ▸ Energy ▸ Lesson 12 128 © Great Minds PBC
Learn
35 minutes
PhD SCIENCE® TEXAS
Safety Note
Stations in this lesson pose potential hazards. To minimize the risk, review these safety measures and look for evidence that students are following them (4.1C):
▪ Reiterate the safety measures discussed for the Heat Lamp Station in Lesson 4.
▪ When using a flashlight in Station 1, do not look directly into the flashlight when it is turned on.
▪ If using Extension Station 7, only adults should use the box cutter (or scissors) at the Solar Oven Station. Keep the box cutter in a secure location when not in use.
▪ Students should never eat any food prepared during a lab. Consider using a small piece of butter on some bread to demonstrate melting in the solar box oven.
▪ If demonstrating the oven outside of science lab time, be aware that food must reach an internal temperature of at least 165°F to be free of pathogens. The inside of the box may reach only 200°F, so plan for longer cooking times.
Student groups should work at each station for 10 minutes and follow the directions on the station procedure sheets (Lesson 12 Resource B). Circulate to support teamwork and encourage students to record detailed observations of each station in their Science Logbook (Lesson 12 Activity Guide).
When students finish making observations at each station, instruct them to draw a model of how energy moves through the components of the system in their Science Logbook (Lesson 12 Activity Guide). Have students consider how their observations of energy indicators can help them identify the movement of energy in the system. Encourage students to include labels for all system components and energy indicators and add written explanations where possible. More details about each station are shown on the following pages.
Teacher Note
At this point, students are not expected to explicitly include all transfers of energy in their models since their experience with energy transfer so far includes only energy transfer by objects during a collision, waves in water, and wires. Students also are not yet expected to include the transformation of energy. Some students may observe that energy is present in different forms (light energy, electrical energy, etc.) and can change forms; however, this level of understanding is not yet expected. Transformation of energy is the focus of the next lesson, during which students will revise their models to add energy transfers and transformations.
Extension
Lesson 12 Resources C, D, E, and F include optional energy in systems stations. Consider using these stations as an extension or to support student understanding of energy movement in systems.
Teacher Note
At Station 1, students add and remove a light source near a solar cell. Students record observations about how a buzzer connected to the solar cell changes volume when students add and remove light.
Sample student observations:
▪ We hear a sound when we shine light on the solar cell.
▪ After we remove the light from the solar cell, the sound stops.
▪ Changing the angle of the flashlight changes how much sound the buzzer makes.
Encourage students to point the solar cell at different angles relative to the light source. They will notice the buzzer’s output is greatest when the solar cell is pointed directly at the light. Remind students they previously learned about solar energy in the Earth Features Module. Point out how this relationship affects the placement of solar panels on the roof of a home or other structures. Encourage students to think about which area of the roof at home or at school receives the most direct sunlight.
Differentiation
For students with hearing impairments, use the red LED instead of the buzzer to make this investigation accessible.
PhD SCIENCE® TEXAS Level 4 ▸ Energy ▸ Lesson 12 © Great Minds PBC 129
Station 1: Solar Cell
Sample student response:
Light
Solar cell Sound
▪ When light shines on the solar cell, the buzzer makes a sound. I think energy moves from the light to the solar cell somehow, and then transfers through wires to the buzzer. Energy changed form somehow because we observed both light and sound.
Station 2: Sound Cup
At Station 2, students create a sound cup by covering the opening of the cup with plastic wrap and securing it with a rubber band. Students then place a few grains of rice on the plastic wrap. Students place the sound cup near a speaker and observe the movement of the rice as the speaker volume changes. If no speaker is available, students may talk or make noises next to the cup and observe the rice’s movement as they change the volume of their voices.
Sample student observations:
▪ The rice moves more as the volume of the sound increases.
▪ At low volumes, the rice doesn’t seem to move at all.
▪ When we talk, we should be close to the sound cup, or the rice doesn’t move as much.
Differentiation
Allow students with visual or hearing impairments to lightly touch the cup and feel the vibration.
Level 4 ▸ Energy ▸ Lesson 12 130 © Great Minds PBC
PhD SCIENCE® TEXAS
Sample student response:
▪ When the speaker is turned on, the rice moves. When we turn up the volume, the rice moves more. Both sound and motion are energy indicators that can be observed at the same time. I think energy from the speaker moves to the cup through the air somehow.
Station 3: Air Temperature
At Station 3, students record the temperature of the air in one cup placed under a heat lamp and in another cup placed away from the heat lamp.
Sample student observations:
▪ The air in the cup under the heat lamp has a higher temperature than the air in the cup away from the heat lamp.
▪ The farther away from the heat lamp, the lower the temperature of the air in the cup.
PhD SCIENCE® TEXAS Level 4 ▸ Energy ▸ Lesson 12 © Great Minds PBC 131
Rice moving Sound from speaker
Sample student response:
Heat lamp Light Warm Highertemperature
Lower temperature
▪ The air under a heat lamp gets warmer when the heat lamp is on and the light is shining. The light must make the temperature of the air increase. Energy moves from the bulb in the heat lamp to the air somehow.
After groups have visited each station, come together as a class. Have students Think–Pair–Share in response to the following question to discuss what they have learned about the movement of energy in systems.
► How did energy move through the systems you observed?
Tell students to write one statement from their discussions on a sticky note or index card to hand in.
Sample student responses:
▪ I think energy from light moved to the solar cell. Energy also transferred to the buzzer through the wires since the buzzer made a noise when light shined on the solar cell.
▪ When we made noise near the sound cup, the rice moved around on the plastic so energy from noise must have traveled to the cup.
▪ The bulb in the heat lamp made warmth and light so I think the electrical energy from the electrical outlet moved to the light bulb through the wire.
Level 4 ▸ Energy ▸ Lesson 12 132 © Great Minds PBC
PhD SCIENCE® TEXAS
Check for Understanding
Students discuss and share evidence of how energy can be transferred as it changes form in a system.
TEKS Assessed
4.3B Communicate explanations and solutions individually and collaboratively in a variety of settings and formats.
4.5B Identify and investigate cause-and-effect relationships to explain scientific phenomena or analyze problems.
4.8A Investigate and identify the transfer of energy by objects in motion, waves in water, and sound.
Evidence
Students develop and communicate explanations with peers (4.3B) to identify how energy can transfer from one location or object to another in a system (4.8A) while causing changes in observable energy indicators including light, motion, temperature, and sound (4.5B).
Next Steps
If students need support to explain their reasoning, prompt them with questions such as these: What indicators of energy did you observe at a station? What caused the noise at the solar cell station (or rice to move at the sound cup station, or temperature to increase at the air temperature station)? Work with students to identify the path energy travels at each station.
Confirm that energy transfers occurred at each station. Point out that in addition to their previous knowledge of energy transferring by objects colliding, waves in water, and wires, students have now identified that light and sound transfer energy.
Ask students if they noticed anything else happening to energy as it moved through the different parts of the systems at the stations.
PhD SCIENCE® TEXAS Level 4 ▸ Energy ▸ Lesson 12 © Great Minds PBC 133
Sample student responses:
▪ It looked like there were different types of energy at each station because each had more than one indicator of energy.
▪ I think sound energy actually produced motion energy since that’s the only way the rice could have moved on the plastic.
▪ The heat lamp changed electrical energy to light energy which increased the temperature of nearby air.
Tell students that what they are describing is energy transformation, a process in which one type, or form, of energy changes into another. Energy transformation causes changes in multiple energy indicators, which can be observed in systems like those used for the stations in this lesson. Explain that energy transformation occurred at each station: at Station 1, light energy changed into sound energy; at Station 2, sound energy changed into motion energy; and, at Station 3, electrical energy changed into light and thermal energy. This means that both energy transfer and energy transformation processes could be observed at each station.
English Language Development
Introduce the term energy transformation explicitly. Providing the Spanish cognate transformación de energía may be helpful. Consider explaining that energy transformation is the process of changing energy from one form to another.
Teacher Note
If necessary, remind students that in the Level 3 Solar System Lessons they learned that thermal energy is a type of energy that causes temperature changes and cannot be seen. Remind students that the more thermal energy an object or material has, the higher its temperature will be.
Content Area Connection: English
Use the words transfer and transform to study the Latin prefix trans-, which often means “across” or “change.” Studying morphology helps students identify clues to the meaning of words and build toward academic language proficiency. Break down transform into trans- and -form, and discuss how transform means to change forms. Consider exploring related words, such as transferable, transformation, transport, transcontinental, translate, transparent, and translucent (3D).
Level 4 ▸ Energy ▸ Lesson 12 134 © Great Minds PBC
PhD SCIENCE® TEXAS
Land
5 minutes
Revisit the Phenomenon Question What do we observe when energy moves through a system? Invite students to share their new knowledge that relates to the Phenomenon Question.
Sample student responses:
▪ Sometimes energy transfers from one place to another, but other times energy changes into a different type of energy.
▪ Observing changes in energy indicators tells us how energy is moving or changing forms.
▪ Energy indicators may change as the amount of energy received changes.
Tell students that in the next lesson, they will continue to explore energy in systems as they analyze their observations from the stations.
PhD SCIENCE® TEXAS Level 4 ▸ Energy ▸ Lesson 12 © Great Minds PBC 135
Lesson 13
Objective: Explain that energy may transform to produce new phenomena, such as light and temperature change.
Agenda
Launch (3 minutes)
Learn (37 minutes)
▪ Compare Energy Transfer and Transformation (8 minutes)
▪ Model Energy Transfer and Transformation (19 minutes)
▪ Update Anchor Chart and Anchor Model (10 minutes)
Land (5 minutes)
Launch 3 minutes
Review with students the differences between energy transfer and energy transformation. Show students the electric kettle video (http://phdsci.link/2437) and the power lines video (http://phdsci.link/2438). Ask students to consider and discuss whether they think each video shows energy transfer or energy transformation.
Sample student responses:
▪ Because the kettle plugs in and uses electricity, I think electrical energy probably transforms into thermal energy.
▪ Power lines just move electricity around. I don’t think energy would transform in a power line.
▪ The electric kettle reminds me of the heat lamp and light bulbs we saw before. It has to connect to something to get energy, but another type of energy is produced.
Explain that energy can be both transformed and transferred in many ways. Power lines transfer electrical energy from one location to another. The electrical energy from power lines can then be transformed into light or thermal energy as in the electric kettle.
Tell students that they will learn more about energy transfer and transformation as they continue to explore the Phenomenon Question What do we observe when energy moves through a system?
Teacher Note
If students are unfamiliar with electric kettles, compare them to other appliances found in their homes, such as a toaster or a microwave. Explain that electric kettles plug into an outlet, and then warm up water using electrical energy.
Level 4 ▸ Energy ▸ Lesson 13 136 © Great Minds PBC
PhD SCIENCE® TEXAS
Learn
37 minutes
Compare Energy Transfer and Transformation
8 minutes
Have students use their knowledge of energy transfer and transformation to complete the chart in their Science Logbook (Lesson 13 Activity Guide A) with a partner. Students should list the electric kettle as an example of energy transformation and the power lines as an example of energy transfer. Assist students with identifying additional examples of the energy transfers and transformations they observed in previous class activities. Circulate to ensure that students are correctly identifying differences between the two energy processes.
Sample student chart:
Observations Energy Transfer Energy Transformation
Characteristics
▪ Energy moves from one place to another place
▪ Energy doesn’t change form
▪ Power lines
▪ Collisions
▪ Energy changes from one form into another form
▪ Energy may or may not move
▪ Electric kettles
▪ Windmills
Examples
▪ Hitting a golf ball
▪ Wires of appliance from wall socket to appliance
▪ Solar cell and buzzer
▪ Sound and rice moving
When finished, ask student volunteers to share their work in a class discussion. Highlight student responses that identify energy transfer as the movement of energy from place to place and energy transformation as a change in form, or type, of energy. Encourage students to add to and revise their charts as needed.
PhD SCIENCE® TEXAS Level 4 ▸ Energy ▸ Lesson 13 © Great Minds PBC 137
Model Energy Transfer and Transformation
19 minutes
Tell students that they will add their new understanding of energy transfer and transformation to models of a system they observed in the previous lesson.
Display one of the heat lamps and thermometers used for the air temperature station. Keep the lamp powered off and use the heat lamp components diagram (Lesson 13 Resource) to identify the heat lamp parts for students, including the lamp socket, wire, plug, aluminum reflector, and light bulb. Then plug in the heat lamp and have students observe changes in energy indicators. Point out that there are no energy indicators to observe when the heat lamp is not powered and plugged in.
Ask students to revisit their models of the heat lamp system from the previous lesson in their Science Logbook (Lesson 12 Activity Guide). Have students work independently to revise their models of the heat lamp system. Direct students to add energy transfer to their models by using arrows to indicate the flow of energy through the system and to add energy transformation to their models by circling the components of the system where energy is transformed. Then have students label the components of the heat lamp system and the types of energy in the components. Circulate to support students as necessary.
When finished, invite students to share their thinking.
► How do the parts of the heat lamp work to transfer and transform energy?
▪ When the heat lamp is not plugged in, there is no electrical energy and so there is no energy to transfer or transform. The plug allows electrical energy to transfer into the wire from the outlet.
▪ If the lamp is plugged in, the light shines and it gets hot, which means energy must transfer through the wires to the light bulb. Energy from the light bulb transfers through the air to the thermometer too.
▪ Without power to the light, the lamp doesn’t warm up. I think the light bulb transforms energy from electricity into light and then from light into thermal energy.
Confirm that energy in a heat lamp system initially comes from electrical energy when the lamp is plugged into an electrical outlet. Remind students that electrical energy can be transformed into many different forms of energy. In a heat lamp system, the light bulb transforms electrical energy into light energy. Then light is transformed to thermal energy, both of which can be observed with energy indicators. Use students’ ideas to develop a class model summarizing the transfer and transformation of energy occurring in a heat lamp system.
Extension
In this lesson, students will only revise one of their three system models. Encourage students to revise their other two models if time allows. Consider having students revise all three models to provide additional support for identifying energy transfers and transformations.
Level 4 ▸ Energy ▸ Lesson 13 138 © Great Minds PBC
PhD SCIENCE® TEXAS
Sample class model:
Plug
Energy transfer
Light energy
Thermal energy
Electrical Light Thermal
Wall socket
Energy transformation
Check for Understanding
Students develop a model to show how electrical energy produces light and thermal energy.
TEKS Assessed
4.1G Develop and use models to represent phenomena, objects, and processes or design a prototype for a solution to a problem.
4.5E Investigate how energy flows and matter cycles through systems and how matter is conserved.
4.8C Demonstrate and describe how electrical energy travels in a closed path that can produce light and thermal energy.
Evidence
Students develop models (4.1G) to show how energy flows through a heat lamp system (4.5E) as electrical energy before producing both light and thermal energy (4.8C).
Next Steps
If students need support drawing their models, encourage them to review their Science Logbook observations and models from the previous lesson. As needed, prompt students with questions such as this: What does the production of thermal energy tell you about energy transformation and transfer in this system?
PhD SCIENCE® TEXAS Level 4 ▸ Energy ▸ Lesson 13 © Great Minds PBC 139
Wire
Direct students to review their observations and models of the other two systems from the previous lesson in their Science Logbook (Lesson 12 Activity Guide). Tell students they will use their observations and models of all three systems to help them summarize what they learned about energy transformation in systems. Have students work together in groups to answer the summary questions in their Science Logbook (Lesson 13 Activity Guide B). Then come together as a class to discuss. Throughout the discussion, encourage students to cite evidence from their observations as they explain what they learned.
► What energy indicators helped you observe energy transformations?
▪ At the first station, we saw light and heard sound. When the light shines on the solar cell, we think energy transforms into sound because it causes the buzzer to make a sound.
▪ At the second station, when the sound is louder, the rice moves around more. This makes us think that sound energy moves from the speaker to the cup and is transformed into motion energy.
▪ At the third station, we saw wires, light, and a temperature difference between the thermometer under the heat lamp and the thermometer away from the heat lamp. When the light is on, the air gets hot because the light bulb transforms electrical energy into light and thermal energy.
Confirm student observations regarding the presence of energy and energy transformations at the three stations. Instruct students to trace the flow of energy in their model of each station’s system.
► What patterns did you notice in the energy transformations?
▪ In all the stations, we saw energy transform from one indicator to another.
▪ The energy indicator we start with doesn’t matter because energy can transform in different ways. For example, light energy can transform into electrical, thermal, or sound energy, which can then transform into another energy indicator.
Summarize student ideas to point out that energy transforms when one energy indicator changes into any other energy indicator.
Update Anchor Chart and Anchor Model 10 minutes
Tell students they are ready to record new knowledge about the Concept 2 Focus Question, How does energy transform?, and expand on their knowledge about the Concept 1 Focus Question, What is energy and how does it transfer from place to place? Invite students to share the new knowledge they have learned related to the two focus questions. Summarize students’ ideas on the anchor chart.
Differentiation
As in most class discussions, allow students to construct explanations for the energy in systems stations individually or with peers before whole-class sharing. This support may be particularly beneficial to English learners.
Content Area Connection: English
Ensure that student discussions focus on the topic at hand with students reviewing key ideas and explaining their own ideas and understanding. Encourage students to use content-based vocabulary during discussions. Ask questions such as these:
▪ Who can add to the idea is building?
▪ What have we concluded so far?
To support students in answering these questions, allow group members more time to discuss the questions. See Speaking and Listening Supports in the Implementation Guide for more resources (3D).
Differentiation
As students construct explanations for energy transformations associated with their observations of energy indicators, the following sentence frame may be beneficial (3D): When we observe we think energy transforms into because .
Teacher Note
Students may say that electrical energy is transformed into light energy by the flashlight and that there are three energy indicators present at Station 1. This is accurate if students define the system to include the inside of the flashlight and the flashlight’s batteries.
Level 4 ▸ Energy ▸ Lesson 13 140 © Great Minds PBC
PhD SCIENCE® TEXAS
Sample anchor chart:
Energy
Energy Classification and Transfer
• Energy is why things happen.
• Energy is present when we observe something happening (moving objects, light, temperature change, sound) or when something helps make something happen (electricity, batteries).
• Energy can transfer between objects through collisions, causing changes in their motion.
• Transferring more energy to an object can make it move faster.
• Faster-moving objects can transfer more energy to other objects.
• Energy can also transfer from place to place through electric currents, sound, thermal energy, and light.
Energy Transformation
• Energy transformation occurs when we observe one energy indicator changing into any other energy indicator(s).
Revisit the class anchor model.
► How does our new knowledge of energy transformation help explain how a windmill turns wind into light?
▪ In the windmill, energy transforms from motion (the wind causing the blades to spin) into electrical energy (going through the wires) and then into light (turning the light on).
▪ We know energy can transform because we notice different indicators for different forms of energy.
Tell students that the motion of the windmill blades is an indicator of mechanical energy. Explain that mechanical energy is the energy that an object has because of its motion, position, or condition. Confirm for students that the mechanical energy of the windmill, as wind collides with the blades, is transformed into electrical energy and then light energy.
Teacher Note
Mechanical energy of motion is kinetic energy. Mechanical energy of position or condition is potential energy.
If necessary, remind students that they learned about mechanical energy in the Level 3 Forces and Motion Module.
PhD SCIENCE® TEXAS Level 4 ▸ Energy ▸ Lesson 13 © Great Minds PBC 141
English Language Development
Introduce the term mechanical energy explicitly. Providing the Spanish cognate energía mecánica may be helpful. Consider providing additional examples of mechanical energy such as riding a bike, sharpening a pencil, or driving a car.
Update the anchor model with students’ new understanding of energy transformation and mechanical energy.
Sample anchor model:
How a Windmill Harnesses the Wind
Wind collides with the blades, transferring energy.
Looks like a box.
Electric current transfers energy through wires.
The windmill transforms energy from motion into electrical energy and then into light.
In the windmill system, wind collides with the blades, which transfers energy to something that looks like a box. An electric current transfers energy through the wires and turns on the light. When the wind blows harder, more energy is transferred to the blades. The windmill system transforms energy from mechanical energy to electrical energy and then to light.
Level 4 ▸ Energy ▸ Lesson 13 142 © Great Minds PBC
whenLEDlightsupbladesspin.
PhD SCIENCE® TEXAS
Land
5 minutes
Revisit the driving question board and ask students to consider the related phenomena that they generated earlier in the module. Lead a class discussion about how energy transformation may help explain phenomena on their list.
Draw students’ attention to the questions on the driving question board and ask students which questions they can now answer. Have students provide evidence to support their responses.
Sample student responses:
▪ How does wind turn into electricity? We now know that mechanical energy can transform into electrical energy
▪ How can you get electricity to your house with no windmills? We know that power lines can transfer electrical energy to houses, and the electrical energy can then be used for different things.
► What other questions do we have about electricity?
▪ Does electricity flow through all materials?
▪ What resources do we use to get electricity in our area?
Highlight students’ questions about the materials required for electricity to flow. Guide students to develop the next lesson set’s Phenomenon Question: What do we observe when energy flows through materials?
Optional Homework
Ask students to use their knowledge about energy in systems to explain to a friend or family member how some of the devices in their homes work. Students may wish to draw a model to support their explanation. If time permits in the next lesson, encourage students to share their explanations and models. Display exemplary models in the classroom.
Spotlight on Knowledge and Skills
Students think carefully about the scientific explanations they have developed to answer some of their earlier questions. Throughout the discussion, guide students to focus on unanswered questions on the driving question board or in their Module Question Log that will drive their next investigation of how electrical energy is generated through the transformation of mechanical (motion) energy (4.3A).
PhD SCIENCE® TEXAS Level 4 ▸ Energy ▸ Lesson 13 © Great Minds PBC 143
Lessons 14–15 Conductors, Insulators, and Circuits
Prepare
In this lesson set, students build on their understanding of energy transfer and transformation as they answer the Phenomenon Question What do we observe when energy flows through materials? In Lesson 14, students work in groups to supply energy to a light bulb. They determine that the bulb lights up only when electrical energy travels from an energy source to the bulb in a closed path (i.e., closed loop), creating an electrical circuit. In Lesson 15, students investigate various materials to determine which are conductors of electrical energy and which are not. Next, they examine photographs of conductors and insulators of thermal energy. Finally, students discuss the relationship between conductors and insulators of electrical and thermal energy.
Student Learning Knowledge Statement
In an electrical circuit, electrical energy travels through conductors in a closed loop.
Concept 2: Energy Transformation
Focus Question
How does energy transform?
Phenomenon Question
What do we observe when energy flows through materials?
Level 4 ▸ Energy ▸ Lessons 14–15 144 © Great Minds PBC
PhD SCIENCE® TEXAS
Objectives
▪ Lesson 14: Demonstrate that in an electrical circuit electrical energy must travel in a closed loop.
▪ Lesson 15: Differentiate between conductors and insulators of electrical and thermal energy.
Standards Addressed
Texas Essential Knowledge and Skills
Identify conductors and insulators of thermal and electrical energy. (Introduced)
Demonstrate and describe how electrical energy travels in a closed path that can produce light and thermal energy. (Addressed)
Scientific and Engineering Practices
4.1C Demonstrate safe practices and the use of safety equipment during classroom and field investigations as outlined in Texas Education Agency–approved safety standards.
4.1D
Use tools, including hand lenses; metric rulers; Celsius thermometers; calculators; laser pointers; mirrors; digital scales; balances; graduated cylinders; beakers; hot plates; meter sticks; magnets; notebooks; timing devices; sieves; materials for building circuits; materials to support observation of habitats of organisms such as terrariums, aquariums, and collecting nets; and materials to support digital data collection such as computers, tablets, and cameras, to observe, measure, test, and analyze information.
4.1E Collect observations and measurements as evidence.
4.1G Develop and use models to represent phenomena, objects, and processes or design a prototype for a solution to a problem.
4.2B Analyze data by identifying any significant features, patterns, or sources of error.
4.3A Develop explanations and propose solutions supported by data and models.
PhD SCIENCE® TEXAS Level 4 ▸ Energy ▸ Lessons 14–15 © Great Minds PBC 145
Content Standards Standard Student Expectation Lesson(s) 4.8B
14, 15
14, 15
4.8C
Standard Student Expectation Lesson(s)
14,
15
14, 15
14,
15
14, 15
14
14,
15
Recurring Themes and Concepts
Standard
4.5A Identify and use patterns to explain scientific phenomena or to design solutions. 15
4.5B Identify and investigate cause-and-effect relationships to explain scientific phenomena or analyze problems.
4.5D Examine and model the parts of a system and their interdependence in the function of the system.
4.5E Investigate how energy flows and matter cycles through systems and how matter is conserved.
English Language Proficiency Standards
4A
Learn relationships between sounds and letters of the English language and decode (sound out) words using a combination of skills such as recognizing sound-letter relationships and identifying cognates, affixes, roots, and base words.
Materials
15
Science Logbook (Lesson 14 Activity Guide)
Electrical circuit investigation (1 set per group): prepared aluminum foil strips (2), D battery (1), incandescent flashlight bulb (1), scissors (1), electrical or masking tape (1 roll)
Conductors and insulators investigation (1 set per group): coin (1), sticky note folded to one-quarter size (1), metal paper clip (1), craft stick (1), modeling clay (0.5 oz), steel wool (0.5 oz), prepared electrical circuit from Lesson 14 (1)
Logbook (Lesson 15 Activity Guide)
Level 4 ▸ Energy ▸ Lessons 14–15 146 © Great Minds PBC
Student Expectation Lesson(s)
14,
14, 15
14, 15
Standard Student Expectation Lesson(s)
14, 15
Student
Lesson(s)
14
Materials
14, 15
15
15 PhD SCIENCE® TEXAS
Science
PhD SCIENCE® TEXAS Level 4 ▸ Energy ▸ Lessons 14–15 © Great Minds PBC 147 Teacher Materials Lesson(s) Assembled Snap Circuits® windmill from Lesson 2 (1) 14 18″ sheet of aluminum foil (1 per group) 14 Working electrical circuit from Lesson 14 (1) 15 Thermal Conductors and Insulators Photographs (Lesson 15 Resource) 15 Modified circuit: 18″ string (enough for two 9″ pieces), D battery (1), incandescent flashlight bulb (1), electrical or masking tape (1 roll) 15 Teacher Preparation Lesson(s) Prepare aluminum foil strips for electrical circuit investigation. (See Lesson 14 Resource.) 14 Prepare groups’ circuits according to the instructions in Lesson 14 Resource, but skip step 3 (i.e., do not tape an aluminum foil strip to the light bulb’s metal base). Fold sticky notes to one-quarter size. 15 Prepare a modified circuit according to the instructions in Lesson 14 Resource, but use pieces of string in place of aluminum foil strips. 15
Lesson 14
Objective: Demonstrate that in an electrical circuit electrical energy must travel in a closed loop.
Agenda
Launch (5 minutes)
Learn (35 minutes)
▪ Build an Electrical Circuit (20 minutes)
▪ Discuss Circuit Configuration (15 minutes)
Land (5 minutes)
Launch 5 minutes
Review the five energy indicators students have explored: electricity, temperature change, light, motion, and sound. Then display the assembled Snap Circuits® windmill system, and review what students have learned so far about electrical energy and circuits.
► What did you do to make the LED in the windmill system light up?
▪ We used a balloon pump on the windmill to create wind, which made the blades spin.
▪ When we made the windmill blades spin, the LED lit up.
► Which energy indicators are present when the LED turns on?
▪ Motion is present because the windmill blades spin.
▪ Light is present when the LED turns on.
▪ Electricity is present in the wires that connect the windmill to the LED.
► In what ways does the windmill system transfer energy?
▪ Wind collides with the windmill blades and transfers energy to them.
▪ An electric current transfers energy through the wires.
► In what ways does the windmill system transform energy?
▪ The windmill transforms mechanical energy into electrical energy.
▪ The LED transforms electrical energy into light energy.
Level 4 ▸ Energy ▸ Lesson 14 148 © Great Minds PBC
PhD SCIENCE® TEXAS
Display the electrical circuit investigation materials, and point out the battery. Remind students that in Lesson 4, a battery provided energy to the portable radio. When the radio was turned on, it transformed electrical energy from the battery into sound energy. Teacher Note
Ask students to Think–Pair–Share to discuss ways they could use the materials to make the bulb light up.
Sample student responses:
▪ The aluminum strips are long and thin like the wires in the windmill system. Maybe we can use the strips as wires.
▪ In the windmill system, the parts connected to each other. I think we need to connect all these parts, too.
▪ We snapped parts together in the windmill system. There isn’t a way to snap these parts together, so maybe we can use the tape to connect the parts.
Tell students they will work in groups to use the materials to try to make the bulb light up as they explore the Phenomenon Question What do we observe when energy flows through materials?
Students should understand from previous lessons that a battery stores energy, but they may express curiosity about the way a battery generates electrical energy. Explain that a battery does not store electrical energy. A battery stores chemical energy that is transformed into electrical energy when a certain condition is met. Tell students that one of their tasks during this investigation is to determine that condition. Understanding of chemical potential energy and this energy transformation is not developed until middle school.
Safety Note
Inspect the batteries to ensure that they show no signs of leakage before distributing them to groups. Safely dispose of leaky or damaged batteries in an appropriately labeled container.
Divide the class into groups, and distribute the materials for the electrical circuit investigation. Tell students the goal of the investigation is to work together to use the battery, aluminum foil strips, and tape to make the bulb light up.
PhD SCIENCE® TEXAS Level 4 ▸ Energy ▸ Lesson 14 © Great Minds PBC 149
Learn 35 minutes
an Electrical Circuit 20 minutes
Build
Before students begin working with the materials, have groups develop a plan to build a system in which the bulb lights up. Then instruct groups to draw and label in their Science Logbook (Lesson 14 Activity Guide) a model of the system they plan to build.
Safety Note
The electrical circuit investigation poses potential hazards. To minimize the risk, review these safety measures and look for evidence that students are following them (4.1C):
▪ Do not put any investigation materials in or near your mouth, nose, or ears.
▪ If a light bulb breaks, tell an adult right away. Do not touch the broken pieces.
▪ If a battery becomes hot, tell an adult right away. Do not touch the battery.
Tell groups they may begin working. As students work, circulate to support groups and encourage teamwork.
Ensure that all groups successfully use the materials to make the bulb light up. As needed, provide individual support to groups to guide students in developing their systems. Confirm for students the importance of connecting the materials to create a working system that lights the bulb.
Discuss Circuit Configuration 15 minutes
Invite groups to share details about the systems they built.
► Which energy indicators are present when the bulb lights up?
▪ Light is present when the bulb lights up.
▪ Electricity is present in the aluminum strips that connect the battery to the light bulb.
► In what way did you arrange the components to make the bulb light up?
▪ We taped each aluminum strip to one end of the battery. Then we taped the other ends of the aluminum strips to the metal parts of the light bulb.
▪ We used the aluminum strips like the wires in the windmill system. We ran strips from both ends of the battery to the light bulb. After a few tries, we got the bulb to light up.
Teacher Note
Place the Snap Circuits® windmill system in a central location where groups can observe the system’s components and configuration. Encourage groups to share information as they make observations.
Differentiation
Some groups may need additional support to develop, draw, and label a model of the system they plan to build. If necessary, provide these groups with a list of the materials indicating the quantity or amount of each material. Have groups match the materials on the list to the materials they include in their plan.
Teacher Note
Lesson 14 Resource includes step-by-step instructions explaining how to use the materials to create a working electrical circuit; however, allow time for productive struggle before providing explicit direction to groups.
Teacher Note
In this lesson and Lesson 15, students will observe whether the bulb lights up. Consider darkening the room by turning off certain classroom lights or, if possible, lowering the window shades so that students can more easily determine when the bulb lights up.
Level 4 ▸ Energy ▸ Lesson 14 150 © Great Minds PBC
PhD SCIENCE® TEXAS
► Do you think the bulb would light up if you rearranged the components? Provide your reasoning.
▪ Yes. All the components would be connected to each other, just in a different way.
▪ No, I think the aluminum strips have to be connected in a certain way to transfer electrical energy from the battery to the light bulb.
Have groups resume working to determine whether they can use the same components to build a different system in which the bulb still lights up. Encourage groups to disconnect and reconnect the components in their system, rearrange the components, or experiment with other changes. Instruct groups to observe how changes to the system affect whether or not the bulb lights up.
After several minutes, ask groups to share what happened when they tried to build a different system from the same components.
Sample student responses:
▪ The light went out when we disconnected either of the aluminum strips from the battery.
▪ The bulb wouldn’t light up when we connected both aluminum strips to the same end of the battery.
▪ We tried connecting the aluminum strips to the parts of the battery and light bulb that weren’t metal, but nothing happened.
Summarize that the bulb lights up only when all the components of the system connect in a certain way: one aluminum foil strip must lead from one end of the battery to the light bulb, and the other aluminum foil strip must lead from the light bulb back to the other end of the battery. Explain that the battery, aluminum foil strips, and light bulb form an electrical circuit, a system that includes a source of electrical energy and the complete path of an electric current. Tell students that when all the components of an electrical circuit are connected in the proper order, the circuit forms a closed path, and electrical energy can flow, or transfer, to each component of the circuit.
English Language Development
Introduce the term circuit explicitly. Providing the Spanish cognate for circuit (circuito) may be useful (4A).
Content Area Connection: English
Use the word circuit to explore the Latin root circ-, which often means “around.” Students brainstorm related words, such as circle, circumference, circulate, circuitous, and circumstance, and discuss how their meanings relate to the root. Challenge students to create sentences using circuit in both scientific and everyday contexts (4A).
PhD SCIENCE® TEXAS Level 4 ▸ Energy ▸ Lesson 14 © Great Minds PBC 151
Bring the class back together, and have students reflect on the circuits they built.
► What do you think happens to the electrical energy in a circuit if it does not have a closed path?
▪ Electrical energy can’t get from the battery to the bulb.
▪ Electrical energy wouldn’t transfer in the system, so the bulb doesn’t light up.
Confirm that when the electrical circuit does not form a closed path (i.e., is open), electrical energy cannot flow through the circuit, and the light bulb in the circuit does not light up. Have students individually draw a model in their Science Logbook (Lesson 14 Activity Guide) of the closed-circuit system including a lit light bulb. Then have students write an explanation describing their model and the flow of energy in the circuit system.
Sample student response:
In a closed circuit, all the components are connected. When a circuit is closed, electrical energy flows to each component of the circuit. In this circuit, the energy source is a battery. Electrical energy is changed into light energy in the light bulb.
Level 4 ▸ Energy ▸ Lesson 14 152 © Great Minds PBC
Light bulb Aluminum foil Aluminum foil Battery Closed Circuit
PhD SCIENCE® TEXAS
Check for Understanding
Students develop models to demonstrate and explain how electrical energy flows in a closed circuit.
TEKS Assessed
4.1G Develop and use models to represent phenomena, objects, and processes or design a prototype for a solution to a problem.
4.5D Examine and model the parts of a system and their interdependence in the function of the system.
4.8C Demonstrate and describe how electrical energy travels in a closed path that can produce light and thermal energy.
Evidence
Students develop and draw models (4.1G) to show how the parts of a closed-circuit system (4.5D) work together to allow electrical energy to flow through the system, producing light energy in the bulb (4.8C).
Next Steps
If students need support with drawing and explaining their models, prompt students with questions such as these: How are the components organized in the circuit system you created? What does this tell you about how energy is transferred through the circuit? What happened when the components of the system were not connected properly, or not organized in this way?
Land5 minutes
Remind students that at the beginning of the lesson they described the way the Snap Circuits® windmill system transfers and transforms energy. Have students now describe the way the electrical circuits they built transfer and transform energy.
► How does your electrical circuit transfer energy?
▪ One aluminum strip transfers electrical energy from the battery to the light bulb.
▪ Another aluminum strip transfers electrical energy from the light bulb back to the battery.
Teacher Note
Save each group’s circuit for use in Lesson 15.
PhD SCIENCE® TEXAS Level 4 ▸ Energy ▸ Lesson 14 © Great Minds PBC 153
► How does your electrical circuit transform energy?
▪ The light bulb transforms electrical energy into light energy.
▪ The battery provides electrical energy that gets transformed into light energy.
► How do you think a closed circuit path makes energy transformations possible?
▪ A circuit with a closed path lets electrical energy travel from one place to another. That means electrical energy can get to components, like light bulbs or radios, that transform it into other types of energy.
▪ A circuit can have lots of changes in energy because you can connect different components that can transform energy into different forms. I bet things like ovens and fans and TVs are all connected to electrical circuits!
Optional Homework
Students draw and label a closed circuit that powers an electric fan. They then use the drawing to explain to a friend or family member how an electrical circuit works.
Level 4 ▸ Energy ▸ Lesson 14 154 © Great Minds PBC
PhD SCIENCE® TEXAS
Agenda
Launch (4 minutes)
Lesson 15
Objective: Differentiate between conductors and insulators of electrical and thermal energy.
Launch
4 minutes
Display a working circuit from the previous lesson. Prompt students to share what they know so far about the electrical circuit and the way the circuit transfers and transforms energy.
► What components make up the electrical circuit? What does each component do?
▪ The circuit has a battery that provides electrical energy, aluminum strips that transfer electrical energy around the circuit, and a light bulb that transforms the electrical energy into light energy.
▪ The circuit has an energy source, something to transfer the electrical energy, and something to transform the electrical energy into a different type of energy.
► What must be true of the circuit so that electrical energy can flow through its components?
▪ The circuit has to be a closed path before electrical energy will flow around it. In a closed circuit, all the components are connected in a loop.
► Do you think the light bulb will still light up if we insert a new material between one of the aluminum foil strips and the bulb’s metal base?
▪ Yes. As long as the circuit is closed, I think the bulb will still light up.
▪ I’m not sure. I think it might depend on the material we insert.
Tell students that in this lesson they will work in groups to investigate the ways inserting different materials into a circuit with a closed path affect the flow of electrical energy through the circuit.
Learn (34 minutes)
▪ Investigate Electrical Conductors and Insulators (13 minutes)
▪ Sort Electrical Conductors and Insulators (8 minutes)
▪ Compare Thermal Conductors and Insulators (8 minutes)
▪ Update Anchor Chart (5 minutes)
Land (7 minutes)
PhD SCIENCE® TEXAS Level 4 ▸ Energy ▸ Lesson 15 © Great Minds PBC 155
Learn
34 minutes
Investigate Electrical Conductors and Insulators
13 minutes
Have students rejoin their groups from the previous lesson, and distribute the materials for the conductors and insulators investigation. Have groups examine the electrical circuit. Point out that the end of one aluminum foil strip wraps around the base of the bulb and is secured with tape; however, the other aluminum foil strip is not attached to the bulb’s metal base.
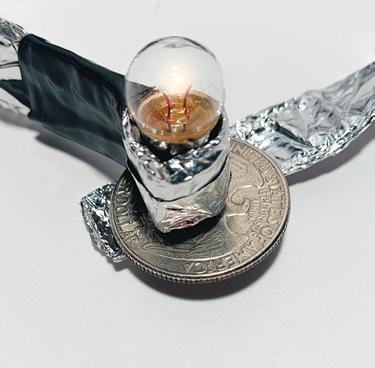
Have groups close the circuit by touching the tip of the bulb’s base to the end of the unsecured aluminum foil strip. Confirm that the bulb lights up, which is an indicator that the circuit is closed. Then have groups lift the bulb away from the unsecured aluminum foil strip. Confirm that the bulb does not light up. Point out that this is because the circuit has been broken, or disconnected, and is no longer a closed path.
Inform students that they will now insert a coin into the circuit. Instruct groups to place the coin between the base of the bulb and the unsecured aluminum foil strip. The bulb should light up. Instruct groups to record their result in their Science Logbook (Lesson 15 Activity Guide).
Level 4 ▸ Energy ▸ Lesson 15 156 © Great Minds PBC
PhD SCIENCE® TEXAS
Next, have groups test the folded sticky note, metal paper clip, craft stick, modeling clay, and steel wool by inserting them one at a time into the circuit the same way they inserted the coin. Tell groups to record the result of each test in their Science Logbook (Lesson 15 Activity Guide). Circulate as students work, listening for descriptions of observations and results. Support students, as needed, to ensure they are performing the tests properly and paying close attention to the light bulb.
Teacher Note
If time permits, consider allowing students to choose other small classroom materials to test. The chart in Lesson 15 Activity Guide includes three blank rows for this purpose. Bring the class back together to discuss their results.
► What did you observe when you tested each material?
▪ The bulb lit up when we inserted the coin, the paper clip, and the steel wool into the circuit.
▪ The bulb did not light up when we inserted the paper, the craft stick, or the modeling clay into the circuit.
Tell students that the coin, the paper clip, and the steel wool are conductors of electrical energy. Explain that a conductor is a material through which energy travels easily. Tell students that the paper, the craft stick, and the modeling clay are insulators of electrical energy. An insulator is a material through which energy does not travel easily.
English Language Development
Introduce the terms conductor and insulator explicitly. Providing the Spanish cognate for conductor (conductor) may be helpful. Consider asking students to compare various conductors and insulators of electrical energy they notice in the classroom (4A).
► Why do you think an electrical circuit might require electrical conductors instead of insulators to work properly?
▪ I think a circuit needs conductors to work because electrical energy can move through them. I don’t think electrical energy can move through insulators.
▪ A circuit only works if electrical energy can flow to every component of the circuit. Conductors allow electrical energy to travel easily. Insulators do the opposite.
PhD SCIENCE® TEXAS Level 4 ▸ Energy ▸ Lesson 15 © Great Minds PBC 157
Sort Electrical Conductors and Insulators 8 minutes
Create a class chart to classify the materials groups tested as electrical conductors or electrical insulators. Ask students which materials should be added to each column. If necessary, include on the chart additional classroom materials students tested.
Sample electrical conductors and insulators class chart:
Electrical Conductors (The bulb lit up.)
Electrical Insulators (The bulb did not light up.)
Coin Paper
Paper clip
Steel wool
Craft stick
Modeling clay
Draw students’ attention to the Electrical Conductors column on the class chart.
► What do you think these materials are made of?
▪ All of them looked and felt like metals to me.
▪ They are shiny, so I think they are all made of metal.
Confirm that the electrical conductors shown on the chart are made of metals. Tell students that metals are usually solid, shiny, and can be used to make circuit components such as wires. Examples of metals include aluminum, gold, and silver.
Next, draw students’ attention to the Electrical Insulators column on the class chart.
► What do you think these materials are made of?
▪ They are made of paper, wood, and clay.
▪ They are made of materials that aren’t metal.
Confirm that paper, wood, and clay are electrical insulators. Tell students that insulators are usually nonmetals, and include materials such as glass, cotton, and quartz. Explain that these nonmetal
Teacher Note
Students may know that the electrical conductors are made of metal. Consider displaying a sheet of aluminum foil and having students describe its properties to help them better understand some common characteristics of metals.
Level 4 ▸ Energy ▸ Lesson 15 158 © Great Minds PBC
PhD SCIENCE® TEXAS
insulators can be found in parts of circuit components such as the outside of a battery or the glass of a light bulb.
► What are some everyday objects you think might be electrical conductors? Provide your reasoning.
▪ I think a nail would be an electrical conductor because it’s made of metal.
▪ A metal fork might be an electrical conductor because it’s also made of metal.
► What are some everyday objects you think might be electrical insulators? Provide your reasoning.
▪ The craft stick is made of wood, so I think a wooden spoon would be an electrical insulator too.
▪ A rubber band might be an electrical insulator because it’s made of rubber.
Compare Thermal Conductors and Insulators 8 minutes
Display the photographs of thermal conductors (Lesson 15 Resource). Tell students that the photographs show examples of conductors. Draw students’ attention to the glowing filaments inside the toaster, the pots and pans on the stove, and the soleplate on the iron. Ask students to Think–Pair–Share what else these objects may have in common.
Teacher Note
The soleplate of an iron refers to the metal plate on the iron that heats when the iron is turned on.
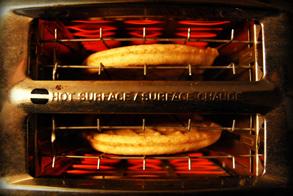
Sample student responses:
▪ I think all the objects are made of metal.
▪ I think all the objects can get really hot.
Highlight student responses about the objects in the photographs becoming very hot. Reveal that the objects in the photographs are conductors of thermal energy. Review that electrical conductors allow electrical energy to flow through them easily, and explain that thermal conductors allow thermal
Teacher Note
If students are unfamiliar with irons as household objects, explain that people use irons to remove wrinkles in their clothes. Tell students that heat from the iron’s metal plate loosens wrinkles so that they no longer hold their shape.


PhD SCIENCE® TEXAS Level 4 ▸ Energy ▸ Lesson 15 © Great Minds PBC 159
energy to flow through them easily. Tell students that most conductors of electrical energy are also conductors of thermal energy.
► Why do you think the objects in the photographs are made of metal?
▪ I think the pots are made of metal so that thermal energy can flow through them and cook food.
▪ I think the plate on the iron is made of metal so that it can get hot enough to get the wrinkles out of clothes.

Next, display the photographs of thermal insulators (Lesson 15 Resource). Draw students’ attention to the wooden spoon in the pot, the oven mitts, and the iron’s plastic handle.
Teacher Note
To prevent students from developing the misconception that all electrical conductors are good thermal conductors (and vice versa), provide the example of pure diamond, which is an electrical insulator but an excellent conductor of thermal energy. In fact, the thermal conductivity of pure diamond is roughly five times higher than that of silver, the most thermally conductive metal (Kidalov and Shakhov 2009).
► What do you think the wooden spoon, oven mitts, and plastic handle might be examples of?
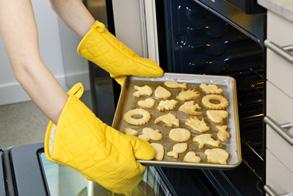

▪ I think they must be thermal insulators because they are made of materials like wood and plastic.
▪ They look like they are meant to keep people from getting burned, so I think they are thermal insulators.
Acknowledge that the wooden spoon, oven mitts, and plastic handle are thermal insulators. Explain that most insulators of electrical energy are also insulators of thermal energy. Further explain that materials like wood, fabric, plastic, and rubber—insulators of electrical energy—are often used to make objects intended to be thermal insulators. Thermal energy cannot easily travel through objects made of these materials.
Summarize that, in general, electrical and thermal energy flow easily through conductors but do not flow easily through insulators.
Level 4 ▸ Energy ▸ Lesson 15 160 © Great Minds PBC
PhD SCIENCE® TEXAS
Update Anchor Chart 5 minutes
Invite students to reflect on the phenomenon question and then share their response to the following prompt.
► What have we learned about how energy flows through materials?
▪ Some materials are conductors and let electrical or thermal energy pass through them easily.
▪ Electrical and thermal energy do not pass through insulators very easily.
▪ Electrical energy can flow through conductors, but it needs to be a closed loop for energy to flow.
Use student responses to update the anchor chart.
Sample anchor chart:
Energy Energy Classification and Transfer
• Energy is why things happen.
• Energy is present when we observe something happening (moving objects, light, temperature change, sound) or when something helps make something happen (electricity, batteries).
• Energy can transfer between objects through collisions, causing changes in their motion.
• Transferring more energy to an object can make it move faster.
• Faster-moving objects can transfer more energy to other objects.
• Energy can also transfer from place to place through electric currents, sound, thermal energy, and light.
• Electrical energy can flow in an electrical circuit from a source of electrical energy to other components only when they are connected in a closed loop.
• Conductors are materials that thermal or electrical energy can travel through easily.
• Insulators are materials that thermal or electrical energy does not travel through easily. (continues)
PhD SCIENCE® TEXAS Level 4 ▸ Energy ▸ Lesson 15 © Great Minds PBC 161
Energy (continued)
Energy Transformation
• Energy transformation occurs when we observe one energy indicator changing into any other energy indicator(s).
Land
7 minutes
Display the modified circuit, and have students make observations about the system and its components. Point out that the bulb is not lit up, even when the circuit is closed.
► What components make up this circuit?
▪ The circuit has a battery, a light bulb, and two strings.
▪ It has strings that are taped to a battery and a light bulb.
► Why do you think the bulb in this circuit is not lit up?
▪ Even though the strings connect the battery to the bulb, I don’t think they transfer electrical energy.
▪ I think the strings are electrical insulators, not conductors.
► What could you change in the circuit to make the bulb light up?
▪ I could replace the strings with a material that we know is a conductor.
▪ I think we could replace the strings with metal wires so electrical energy can flow through the circuit.
Level 4 ▸ Energy ▸ Lesson 15 162 © Great Minds PBC
PhD SCIENCE® TEXAS
Check for Understanding
Students identify how conductors and insulators affect the flow of electrical energy in a closed circuit.
TEKS Assessed
4.3A Develop explanations and propose solutions supported by data and models.
4.5B Identify and investigate cause-and-effect relationships to explain scientific phenomena or analyze problems.
4.8B Identify conductors and insulators of thermal and electrical energy.
Evidence
Students respond to questions to explain (4.3A) how conductors and insulators (4.8B) affect the flow of electrical energy to produce light energy (4.5B) in a closed-circuit system.
Next Steps
If students need support with identifying the roles of conductors and insulators in energy transfer, prompt students with questions such as these: How is this circuit system different from others you have observed? Do you think string is a conductor or insulator? How would you expect conductors and insulators to change the flow of energy in this circuit system?
Revisit the anchor model and invite students to Think–Pair–Share to identify the materials that form a circuit and allow electrical energy to flow through the windmill system.
Sample student responses:
▪ The wires are connected to the LED. I think the wires are made of metal since they conduct electrical energy.
▪ The windmill is connected to the wires in a closed-path circuit. The windmill is a component of the circuit, so something in the windmill is probably made of metal so that electrical energy can flow through it.
PhD SCIENCE® TEXAS Level 4 ▸ Energy ▸ Lesson 15 © Great Minds PBC 163
Use student responses to update the anchor model.
Sample anchor model:
How a Windmill Harnesses the Wind
Wind collides with the blades, transferring energy.
Looks like a box.
Electric current transfers energy through conductive wires.
The windmill transforms energy from motion into electrical energy and then into light.
In the windmill system, wind collides with the blades, which transfers energy to something that looks like a box. An electric current transfers energy through a closed loop of conductive wires and turns on the light. When the wind blows harder, more energy is transferred to the blades. The windmill system transforms energy from mechanical energy to electrical energy and then to light.
Point out that students can now explain how electrical energy flows through the circuit to the LED, but they still do not know how the windmill generates electricity. Guide students to develop the next lesson set’s Phenomenon Question: How do windmills generate electricity?
English Language Development
English learners or striving readers may not be familiar with the term generate Providing the Spanish cognate generar may be helpful. Explain that generate is another way of saying to produce or to cause (4A).
Level 4 ▸ Energy ▸ Lesson 15 164 © Great Minds PBC
whenLEDlightsupbladesspin.
PhD SCIENCE® TEXAS
Lessons 16–18 Generating Electricity
Prepare
In previous lessons, students explored energy transfers and transformations. In Lessons 16 through 18, students apply this new knowledge to determine how energy is transferred and transformed in the windmill phenomenon. Student groups build a simple generator. Then they make observations to explain how the generator plays a role in both energy transfer and transformation by transferring energy from the windmill blades to the light and by transforming mechanical energy into electrical energy.
Student Learning
Knowledge Statement
A generator can be used to transform mechanical energy into electrical energy.
Objectives
▪ Lesson 16: Plan to build generators to transform mechanical energy into electrical energy.
▪ Lesson 17: Start building generators to transform mechanical energy into electrical energy.
▪ Lesson 18: Finish building generators to transform mechanical energy into electrical energy.
Concept 2: Energy Transformation
Focus Question
How does energy transform?
Phenomenon Question
How do windmills generate electricity?
PhD SCIENCE® TEXAS Level 4 ▸ Energy ▸ Lessons 16–18 © Great Minds PBC 165
Standards Addressed
Texas Essential Knowledge and Skills
Content Standards
4.8A Investigate and identify the transfer of energy by objects in motion, waves in water, and sound. (Addressed)
17, 18
4.8B Identify conductors and insulators of thermal and electrical energy. (Addressed) 16, 17, 18
4.8C Demonstrate and describe how electrical energy travels in a closed path that can produce light and thermal energy. (Addressed) 16, 17, 18
Scientific and Engineering Practices
4.1B Use scientific practices to plan and conduct descriptive investigations and use engineering practices to design solutions to problems. 16
4.1C Demonstrate safe practices and the use of safety equipment during classroom and field investigations as outlined in Texas Education Agency–approved safety standards.
4.1D
Use tools, including hand lenses; metric rulers; Celsius thermometers; calculators; laser pointers; mirrors; digital scales; balances; graduated cylinders; beakers; hot plates; meter sticks; magnets; notebooks; timing devices; sieves; materials for building circuits; materials to support observation of habitats of organisms such as terrariums, aquariums, and collecting nets; and materials to support digital data collection such as computers, tablets, and cameras, to observe, measure, test, and analyze information.
16, 17, 18
17, 18
4.1E Collect observations and measurements as evidence. 18
4.1G Develop and use models to represent phenomena, objects, and processes or design a prototype for a solution to a problem. 17, 18
4.2B Analyze data by identifying any significant features, patterns, or sources of error.
18
4.3A Develop explanations and propose solutions supported by data and models. 18
4.3B Communicate explanations and solutions individually and collaboratively in a variety of settings and formats. 16, 17, 18
Level 4 ▸ Energy ▸ Lessons 16–18 166 © Great Minds PBC
Standard Student
Lesson(s)
Expectation
16,
Student Expectation Lesson(s)
Standard
PhD SCIENCE® TEXAS
Recurring Themes and Concepts
English Language Proficiency Standards
Build a generator investigation (1 set per group): 4ʺ long nail (1), 32 m spool of enamel coated copper wire (1), toilet paper tube or prepared paper towel tube section (1), metal nuts (2), neodymium disc magnets (4), LED (1), prepared sheet of sand paper (1), alligator clip cords (2), metric ruler (1), safety goggles (1 per student), procedure sheet (1 per student)
Build a Generator Group Roles (Lesson 17 Resource) (1 per group)
PhD SCIENCE® TEXAS Level 4 ▸ Energy ▸ Lessons 16–18 © Great Minds PBC 167
Standard Student Expectation Lesson(s)
Identify and investigate cause-and-effect relationships to explain scientific phenomena or analyze problems. 18 4.5D Examine and model the parts of a system and their interdependence in the function of the system. 16, 17, 18
Investigate how energy flows and matter cycles through systems and how matter is conserved. 18
4.5B
4.5E
Standard Student Expectation Lesson(s)
Share
17, 18
Narrate,
17, 18 Materials
Materials Lesson(s)
3E
information in cooperative learning interactions.
3H
describe, and explain with increasing specificity and detail as more English is acquired.
Student
16, 17, 18
17, 18 Science Logbook
Activity Guide) 18
(Lesson 18
Teacher Materials Lesson(s)
Generator Photograph (Lesson 16 Resource A)
Scissors (1)
Wire cutters (1), safety goggles (1) 17,
Teacher Preparation
Prepare materials for the generator investigation. Cut one 4ʺ × 5ʺ sheet of sandpaper for each group. If using paper towel tubes, cut tubes into thirds, about 9.5 cm long. Prepare to display one set of materials during the Lesson 16 Learn.
Prepare procedure sheets for students. (See Lesson 16 Resource B.)
Prepare to distribute a copy of Lesson 17 Resource to each group.
(Optional) Cue completed generator reference video (http://phdsci.link/2439).
Lesson(s)
Level 4 ▸ Energy ▸ Lessons 16–18 168 © Great Minds PBC
16
16
18
16
17, 18
16,
17, 18
18 PhD SCIENCE® TEXAS
Lesson 16
Objective: Plan to build generators to transform mechanical energy into electrical energy.
Agenda
Launch (5 minutes)
Learn (30 minutes)
▪ Prepare to Build a Generator (30 minutes)
Land (10 minutes)
Launch
5 minutes
Remind students of the Phenomenon Question they developed at the end of the previous lesson: How do windmills generate electricity? Review how the physical models of windmills that students built in Lesson 2 generated enough electrical energy to light an LED.
► Think about your observations of the windmill physical models. How do you think the spinning motion caused by the wind is transformed into electrical energy?
▪ There’s a box behind the windmill. Maybe that’s where the spinning motion gets transformed into electrical energy.
Listen for student responses that mention the device behind the windmill. If needed, prompt with questions such as these:
► Which parts of the windmill do we have left to explore?
► Which component might play a role in transforming the spinning motion of the windmill blades into electrical energy?
Teacher Note
Display a windmill physical model for student reference, and ensure that students can see the generator and wires.
Spotlight on Knowledge and Skills
Ensure that students understand that the phrase “generate electricity (or electrical energy)” does not mean that energy is created. As needed, clarify that the phrases “generate electricity” and “produce energy” typically refer to the transformation of energy into a desired form (4.8A).
PhD SCIENCE® TEXAS Level 4 ▸ Energy ▸ Lesson 16 © Great Minds PBC 169
Conclude that students need to explore what happens inside the device behind the windmill to understand how energy of motion is transformed into electrical energy. Explain to students that the component inside the device that transforms mechanical energy into electrical energy is a generator. Show students the photograph of a generator (Lesson 16 Resource A).
English Language Development
Introduce the term generator explicitly. Providing the Spanish cognate generador may be helpful. Consider discussing the meaning of the related term generate in different contexts, such as to generate ideas. Providing the Spanish cognate generar may be helpful. Students may also benefit from instruction in the meaning of the term analyze. Providing the Spanish cognate analizar may be helpful.
Teacher Note
Science experiments nearly 200 years ago showed that an electric current can be induced in a closed circuit by passing a conductor through a magnetic field or by moving a magnetic field past a conductor.
Content Area Connection: English
Use the word generate to explore the Latin and Greek roots gen- or gener-, which often mean “birth” or “kind.” Break down generate into gener- and -ate and discuss how each part relates to the word’s meaning. Consider using the Morpheme Matrix routine to explore related words, such as genetic, gender, generation, genius, degenerate, regenerate, and indigenous
► This photograph shows one type of generator. What do you observe in the photograph?
▪ It looks like a lot of metal wire is wrapped around something.
▪ I see a magnet at the top of the generator.
▪ It seems like the part covered in wire might spin.
▪ The red and black knobs might be where wires connect.
Tell students they will build their own generators to transform mechanical energy into electrical energy. This electrical energy will then be transformed into light.
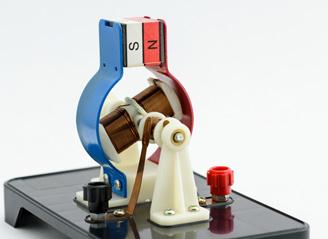
Level 4 ▸ Energy ▸ Lesson 16 170 © Great Minds PBC
PhD SCIENCE® TEXAS
Learn
30 minutes
Prepare to Build a Generator
30 minutes
Remind students that engineers follow a specific process when designing, building, and testing a device. They must carefully plan before starting to build. After they have built the device, they test it and then revise it until it works to meet their needs. Tell students that they will follow a similar process as they build and test a generator.
Distribute a procedure sheet for building a generator (Lesson 16 Resource B) to each student. As a class, read through the procedure sheet, and discuss the directions for building a generator. Review the following safety procedures with the class, and instruct students to ask for help if they have questions or are unclear on how to safely use a particular tool or material.
Safety Note
In this lesson set, students work with sharp objects (e.g., nails, wires, wire cutters), neodymium magnets, and small metallic nuts. To minimize the risk, review these safety measures and look for evidence that students are following them (4.1C):
▪ When working with nails, wire cutters, and wire, wear safety glasses or goggles, and follow class safety procedures for sharp objects.
▪ An adult must always help students use wire cutters. Guide students to use this tool appropriately, or perform the task for them.
▪ Students will push a nail through a cardboard tube. Care must be taken to avoid scrapes or punctures. Help students perform this task as needed.
▪ Because neodymium magnets are very strong, they may be difficult for students to manipulate and pry apart. They are also a pinching hazard. To avoid pinching, show students how to slide the magnets apart. Warn students that if the magnets shatter, they will have sharp edges. Instruct them to ask for help should this occur. It may be useful to prepare the magnets for students’ use. This might include setting up the magnet and nail configuration for students before the lesson. Future storage ideas could include keeping the magnet and nail configuration intact to reduce preparation for subsequent classes.
Introduce students to the components of the generator, discuss specific safety concerns, and model best practices.
PhD SCIENCE® TEXAS Level 4 ▸ Energy ▸ Lesson 16 © Great Minds PBC 171
Sample component descriptions:
▪ Cardboard tube (a toilet paper tube or one-third of a paper towel tube): This serves as the main structure of the generator. The opening should be wide enough for the magnets to spin inside it.
▪ Nail: The nail provides a shaft on which the magnets can turn. The nail should go all the way through the tube and must be able to spin. Model carefully keeping hands away from the point of the nail.
▪ Magnets: The spinning motion of these magnets creates an electric current in the wire, causing electrical energy to flow. If students are curious about how this occurs, explain that it is simply an energy transformation that a generator can perform.
▪ LED: If students have set up the generator correctly, the LED will glow when the nail is spun. Allow students to make mistakes when connecting the LED to their generators. They will be able to revise their designs later.
Land
10 minutes
Allow students to ask questions, then revisit the photograph of the generator shown at the beginning of class (Lesson 16 Resource A). Remind students of the Phenomenon Question How do windmills generate electricity? Have students work with a partner to identify the parts of the generator that are visible and make predictions about the function of each part in enabling a windmill to generate electricity.
Ask students to use their knowledge of conductors and insulators to help them explain their predictions for the functions of the generator parts. Come together as a class to discuss students’ ideas.
Sample student responses:
▪ There is wire on the generator. I think electrical energy might be able to move through the wire since it looks like it is made of metal and we learned that many metals are conductors.
▪ There are plastic parts on the generator. I think plastic is an insulator. I think generators need to have parts made of insulators so that electrical energy only goes where it’s supposed to.
▪ It looks like the middle plastic part with wire wrapped around it can spin. I think the plastic gives the wire structure to be wrapped around without transferring any electrical energy. I think this part will have mechanical energy when it spins.
Differentiation
Consider displaying the materials students will use to create their generators while discussing the components.
Level 4 ▸ Energy ▸ Lesson 16 172 © Great Minds PBC
PhD SCIENCE® TEXAS
▪ I see a magnet. I’m not sure if a magnet is a conductor or insulator, but I know that metals stick to magnets so I think magnets might affect how electrical energy moves through conductors. The magnet might be used for transforming motion energy into electrical energy since it’s next to the spinning part with wire wrapped around it.
Check for Understanding
Students examine the parts that create electricity in a generator system and identify them as conductors and insulators.
TEKS Assessed
4.3B Communicate explanations and solutions individually and collaboratively in a variety of settings and formats.
4.5D Examine and model the parts of a system and their interdependence in the function of the system.
4.8B Identify conductors and insulators of thermal and electrical energy.
Evidence
Students make predictions for how the parts of the generator system work together to transform mechanical energy into electrical energy (4.5D). Students identify parts of the generator as conductors and insulators of electrical energy (4.8B) to explain their predictions to a partner and with the class (4.3B).
Next Steps
If students need support identifying and predicting the parts and functions of a generator, prompt them with questions such as these: What do you remember about how the use of metal materials can affect energy transfer? Why might it be important to have parts in a generator that can spin and move? How does plastic affect the flow of energy in a system?
Tell students that they will start building their generators in the next lesson.
PhD SCIENCE® TEXAS Level 4 ▸ Energy ▸ Lesson 16 © Great Minds PBC 173
Lesson 17
Objective: Start building generators to transform mechanical energy into electrical energy.
Agenda
Launch (3 minutes)
Learn (37 minutes)
▪ Determine Group Roles (7 minutes)
▪ Build a Generator (30 minutes)
Land (5 minutes)
Launch 3 minutes
Remind students that in this lesson they will start building their generators.
► Generators come in different shapes and sizes. Can you think of a time when you may have seen a generator?
▪ I’ve never seen a generator in real life.
▪ My parents have a generator for when the power goes out, but it looks different from the one we saw in the picture.
▪ I saw a wind turbine outside once. We learned that the box behind the blades is a generator.
► Where else do you think you might find a generator that transforms mechanical energy into electrical energy?
▪ There’s a place near my house with lots of wires and metal boxes. Maybe there’s a generator there.
▪ Is there a generator in a solar cell? I remember we turned on a light using a solar cell.
▪ There are generators inside the windmills we built!
Spotlight on Knowledge and Skills
Students may describe electrical substations or transformer stations. Guide students to realize that there is no evidence of a nonelectrical energy source at a substation that might drive generators, such as a hydroelectric dam, a fuel source for burning, or a wind turbine (4.8C, 3H).
Level 4 ▸ Energy ▸ Lesson 17 174 © Great Minds PBC
PhD SCIENCE® TEXAS
Learn
37 minutes
Determine Group Roles 7 minutes
Divide the class into six groups and designate work areas. Review class expectations for group work and the class safety procedures. Distribute a procedure sheet for building a generator (Lesson 16 Resource B) to each student.
Distribute a copy of the group roles table (Lesson 17 Resource) to each group. Describe the responsibilities of each role, and have students follow along in the group roles table.
▪ Materials Manager: ensures that the group has the correct materials (step 1); stores the materials safely at the end of class
▪ Marker*: measures and marks the tube in the correct locations (steps 2 through 5)
▪ Nail Keeper: inserts the nail properly and safely through the tube (step 6); spins the nail when the generator is ready to be tested (steps 19 and 20)
▪ Magnet Keeper: makes sure the two magnet pairs remain separated; places one metallic nut on each side of the nail (steps 7 through 9)
▪ Spool Holder*: holds the wire spool loosely so it can spin as wire is wrapped around the tube (step 10)
▪ Wire Wrapper: wraps copper wire around the tube; cuts the wire (steps 11 through 14)
▪ Sander*: uses sandpaper to remove the enamel from the ends of the wire (step 15)
▪ Connector*
: connects the generator to the LED with alligator clip cords (steps 16 through 18)
Instruct each student to write their name in their group’s table in the box for each role assigned to them. After determining roles and designating a space for each group, distribute materials.
Differentiation
Building a generator is a challenging task, and students will need to pay close attention as they work. Use discretion when forming groups, and consider assigning roles that align with abilities, interests, and safety concerns (3E).
Teacher Note
Set up materials for each group in a bag or small storage bin. Consider numbering the containers to correspond to each group. At the end of class, have students return their materials to the appropriate bag or bin for use in the next lessons.
*Students in these roles may be given a second role.
PhD SCIENCE® TEXAS Level 4 ▸ Energy ▸ Lesson 17 © Great Minds PBC 175
Build a Generator 30 minutes
Direct students to work in their groups to start building their generators. Tell students that they should finish step 9 by the end of today’s lesson. Summarize that students will mark boundaries for the copper wire, push the nail through the tube, and secure the magnets and metallic nuts inside the tube.
Circulate to support students as needed and to ensure they follow safety guidelines.
Check for Understanding
Students safely start building a generator to investigate how its parts work together to transfer energy.
Teacher Note
Students may need extra assistance or supervision while working with the magnets and metallic nuts.
4.1C Demonstrate safe practices and the use of safety equipment during classroom and field investigations as outlined in Texas Education Agency–approved safety standards.
4.5D Examine and model the parts of a system and their interdependence in the function of the system.
4.8A Investigate and identify the transfer of energy by objects in motion, waves in water, and sound.
Evidence
Students demonstrate safe practices and the use of safety equipment (4.1C) as they start building a generator system to investigate how its parts work together to generate electrical energy (4.5D) by transferring energy from spinning magnets to a wire (4.8A) to an LED.
Next Steps
If student groups need support identifying how the parts of the generator work together, prompt them with questions such as these: Which parts of your generator should conduct electricity? Which parts of your generator should insulate, or restrict, the flow of electricity? What do you think may be important about how the parts of your generator are arranged?
If a group finishes early, have group members discuss the function of each component they added to their generator in this lesson and predict the function of components they will add in the next lesson.
Level 4 ▸ Energy ▸ Lesson 17 176 © Great Minds PBC
TEKS Assessed
PhD SCIENCE® TEXAS
Sample student responses:
▪ We used a cardboard tube to build our generator. I think cardboard is an insulator, so electricity won’t flow through it. The next steps in the procedure say to wrap wire around the tube, so I think the tube will give structure to the generator.
▪ We added magnets around a nail in the generator. The magnets can spin with the nail, so I think they are used for turning mechanical energy into electrical energy somehow.
▪ I think the wire that we will use in the next lesson will be a conductor that lets electricity flow.
▪ In the next lesson, we will use alligator clips to connect the wire to the LED. It looks like there’s metal inside the alligator clips, so I think the alligator clips will let electricity flow from the wire to the LED.
▪ In the next lesson, we will add an LED. We used an LED in our windmill model. I think an LED is like a light bulb that turns electrical energy into light energy.
5 minutes
Instruct groups to clean up their workspaces and carefully place their partially built generators and other components in the appropriate numbered bags or bins.
Debrief by having groups share what went well and what was challenging on their first day of construction.
PhD SCIENCE® TEXAS Level 4 ▸ Energy ▸ Lesson 17 © Great Minds PBC 177
Land
Lesson 18
Objective: Finish building generators to transform mechanical energy into electrical energy.
Agenda
Launch (5 minutes)
Learn (35 minutes)
▪ Build, Test, and Modify a Generator (25 minutes)
▪ Form Conclusions About Generating Electricity (10 minutes)
Land (5 minutes)
Launch
5 minutes
Divide the class into the same groups as in the previous lesson. Distribute a procedure sheet (Lesson 16 Resource B) to each student and a group roles table (Lesson 17 Resource) to each group. Remind students that they finished steps 1 through 9 in the previous lesson. Have students review the next steps for building a generator and their group roles. Answer questions they have.
Remind students that it takes care, patience, and teamwork to create a device that transfers and transforms energy.
Learn
35 minutes
Build, Test, and Modify a Generator
25 minutes
Review class expectations for group work and the class safety procedure for using wire cutters. Direct students to retrieve their materials and continue working.
In this lesson, each group should complete their generator by wrapping wire around the tube, cutting the wire, removing the enamel from the wire, and connecting their generator to an LED. Make sure
Level 4 ▸ Energy ▸ Lesson 18 178 © Great Minds PBC
PhD SCIENCE® TEXAS
students wrap the wire carefully. If the wire is too tight, it can pinch the tube. If it is too loose, the LED may not light up. Assist or supervise students as needed as they cut the wire.
Sample completed student generator:
When groups finish building their generators, have students attempt to light the LEDs and record their observations in their Science Logbook (Lesson 18 Activity Guide). If the LED does not light up, students should brainstorm possible design problems with their generator setup. They should then modify the generator and try again. During the revision process, provide guidance to students who have specific questions to help them figure out the problem. Assist with disassembly and revision if needed. The following are examples of possible design problems:
▪ The opening of the tube has become too small to allow the magnets to spin freely.
▪ The head of the nail is too close to the tube to grip easily.
▪ The magnets are not balanced correctly inside the tube.
▪ The copper wire is too loosely wrapped or is wrapped outside the marked boundaries.
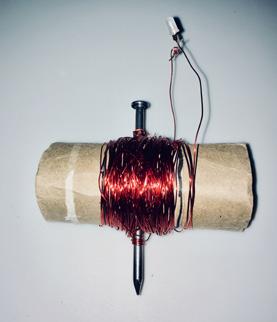
▪ The enamel has not been completely removed from the ends of the wire.
▪ The generator is not connected to the LED correctly.
The brightness of the LED will vary depending on how quickly the magnets are spun. If generators are set up correctly but the light is difficult to see, consider dimming the classroom lights. This will also allow students to see more variation in the brightness of the LED.
Differentiation
Some students may have difficulty capturing their thoughts accurately as they record their observations. These students may benefit from taking a moment to explain their understanding to a partner before recording their thoughts in writing. As students write, coach them to include each of the components they mentioned during their partner discussion (3E).
Teacher Note
Consider showing students the working generator video (http://phdsci.link/2439) to help them brainstorm possible design solutions.
Spotlight on Knowledge and Skills
Explain that the LED must be connected to the generator. If the wires do not form a complete circuit, the LED will not light up (4.8C).
PhD SCIENCE® TEXAS Level 4 ▸ Energy ▸ Lesson 18 © Great Minds PBC 179
When students succeed in lighting their LED, instruct them to respond to the questions in their Science Logbook (Lesson 18 Activity Guide).
Check for Understanding
Students answer questions to record their observations of the transfer and transformation of mechanical energy to light energy in their generators.
TEKS Assessed
4.1E Collect observations and measurements as evidence.
4.5B Identify and investigate cause-and-effect relationships to explain scientific phenomena or analyze problems.
4.8A Investigate and identify the transfer of energy by objects in motion, waves in water, and sound.
4.8C Demonstrate and describe how electrical energy travels in a closed path that can produce light and thermal energy.
Evidence
Students collect observations as evidence (4.1E) of how spinning the nail transfers energy to the generator system (4.8A) and causes the magnets to change the amount of electrical energy in the generator system (4.5B), which changes the amount of light produced (4.8C).
Next Steps
If groups need support getting their generators to function properly, consider pairing groups to record observations of one functional design. If students need support answering questions, prompt students with questions such as these: What could cause more energy to be transferred and transformed in this system? What do you remember about how speed relates to the amount of energy that can be transferred between two objects?
Form Conclusions About Generating Electricity
10 minutes
Tell students they will use their observations to help them draw conclusions about how electricity is generated. Facilitate a class discussion of the questions in the Science Logbook (Lesson 18 Activity Guide).
Spotlight on Knowledge and Skills
Revisit the relationship between speed and energy. Ensure that students make connections between the speed of the spinning magnets and the amount of energy. For example, the faster the magnets spin, the more mechanical energy the magnets possess, and the more electrical energy is transferred, as indicated by the brightness of the LED. Students should also identify the transformation of mechanical energy into electrical energy (4.8A).
English Language Development
As students analyze and interpret data (Lesson 18 Activity Guide), sentence frames such as the following may be beneficial for English learners (3H):
▪ When we , the LED lit up.
▪ When we , the LED did not light up.
▪ When we , the LED got brighter.
▪ Energy was transferred from to to
▪ Energy transformed from to to
Level 4 ▸ Energy ▸ Lesson 18 180 © Great Minds PBC
PhD SCIENCE® TEXAS
► What did you do to cause the LED to light up?
▪ We had to spin the nail fast enough.
► What caused the LED to produce different amounts of light? Did you observe a pattern? If so, what was it?
▪ If we didn’t spin the nail fast enough, the LED didn’t light up.
▪ If we spun the nail faster, the LED got brighter.
▪ We discovered during our investigations with the ball bearings that more speed means more energy. So if we spun the nail faster, there was more mechanical energy, which transformed into more electrical energy.
► What energy transfers and transformations did you observe?
▪ Energy was transferred from the spinning magnets to the wires and then to the LED.
▪ Mechanical energy was transformed into electrical energy, and that energy was transformed into light energy.
If needed, review the distinction between energy transfer and transformation. Energy transfer is the movement of energy from place to place, and energy transformation is the change of one energy indicator into another. Allow students to add new ideas to their list of energy transfers and transformations in their Science Logbook (Lesson 18 Activity Guide).
Sample student responses:
Energy Transfers
▪ Energy is transferred from the spinning magnets to the wires.
▪ Electrical energy is transferred through the wires to the LED.
Energy Transformations
▪ Mechanical energy is transformed into electrical energy.
▪ Electrical energy is transformed into light energy.
Teacher Note
Some students may explain that they first must transfer energy to the nail for it to spin the magnets. This is correct. Expand on these responses by guiding the class to make the connection between the energy they supply to their generators and the energy wind supplies to a windmill’s generator (3H).
PhD SCIENCE® TEXAS Level 4 ▸ Energy ▸ Lesson 18 © Great Minds PBC 181
Check for Understanding
Students distinguish between and categorize examples of energy transfer and transformation processes observed in their generators.
TEKS Assessed
4.3A Develop explanations and propose solutions supported by data and models.
4.5E Investigate how energy flows and matter cycles through systems and how matter is conserved.
4.8A Investigate and identify the transfer of energy by objects in motion, waves in water, and sound.
4.8C Demonstrate and describe how electrical energy travels in a closed path that can produce light and thermal energy.
Evidence
Students use observations of their generators to explain (4.3A) the flow of energy (4.5E) as it transfers from moving magnets to the wire (4.8A) to the LED.
Next Steps
If students need support identifying how energy is transferred in the generator, prompt them with questions such as these: Where have you seen energy transfer occurring in a system before? Which components in your system are conductors of electricity? What do you know about the functions of a conductor?
Students use observations of their generators to explain (4.3A) how mechanical energy is transformed into electrical energy, which is then transformed into light energy (4.8C).
If students need support identifying examples of energy transformation, prompt them with questions such as these: What type of energy is associated with the spinning of the generator? What could have happened to this energy to cause the LED to light up?
Level 4 ▸ Energy ▸ Lesson 18 182 © Great Minds PBC
PhD SCIENCE® TEXAS
Land5 minutes
Revisit the Phenomenon Question How do windmills generate electricity? Invite students to share their new knowledge that helps them answer this question.
Sample student responses:
▪ We learned that the box behind the windmill is a generator.
▪ Generators transform mechanical energy into electrical energy.
▪ In a windmill, the wind blowing the blades probably makes the spinning motion in the generator like how we spun the nail in our generator.
Summarize students’ progress in their exploration of the windmill and how it works. Focus on students’ new understanding that the device behind the windmill is a generator that transforms the spinning motion caused by the wind into electrical energy.
Revisit the class anchor chart, and add students’ new knowledge.
PhD SCIENCE® TEXAS Level 4 ▸ Energy ▸ Lesson 18 © Great Minds PBC 183
Sample anchor chart:
Energy
Energy Classification and Transfer
• Energy is why things happen.
• Energy is present when we observe something happening (moving objects, light, temperature change, sound) or when something helps make something happen (electricity, batteries).
• Energy can transfer between objects through collisions, causing changes in their motion.
• Transferring more energy to an object can make it move faster.
• Faster-moving objects can transfer more energy to other objects.
• Energy can also transfer from place to place through electric currents, sound, thermal energy, and light.
• Electrical energy can flow in an electrical circuit from a source of electrical energy to other components only when they are connected in a closed loop.
• Conductors are materials that thermal or electrical energy can travel through easily.
• Insulators are materials that thermal or electrical energy does not travel through easily.
Energy Transformation
• Energy transformation occurs when we observe one energy indicator changing into any other energy indicator(s).
• Generators transform mechanical energy into electrical energy.
Tell students that they will update the class anchor model in the next lesson when they revisit the Essential Question: How do windmills change wind to light?
Optional Homework
Students develop a list of devices, other than those discussed in class, that they think contain generators. During the next lesson, students talk about the devices and explain the evidence they found to support their thinking.
Level 4 ▸ Energy ▸ Lesson 18 184 © Great Minds PBC
PhD SCIENCE® TEXAS
Lessons 19–20 Windmills at Work Prepare
In Lessons 16 through 18, students created a generator to better understand how windmills transform mechanical energy into electrical energy. In Lesson 19, students build a key concepts checklist to guide them as they revise the class anchor model. In Lesson 20, students revisit the story of William Kamkwamba. This sets the stage for the Engineering Challenge introduced in Lesson 21. Students then apply their new understanding of energy to explain how energy is transferred and transformed and answer the Essential Question.
Student Learning
Knowledge Statement
Everything that happens can be explained by the transfer and transformation of energy.
Objectives
▪ Lesson 19: Model how windmills transfer and transform energy.
▪ Lesson 20: Explain that energy makes things happen when it is transferred and transformed.
Concept 2: Energy Transformation
Focus Question
How does energy transform?
Phenomenon Question
How do windmills change wind to light? (Essential Question)
PhD SCIENCE® TEXAS Level 4 ▸ Energy ▸ Lessons 19–20 © Great Minds PBC 185
Standards Addressed
Texas Essential Knowledge and Skills
Scientific and Engineering Practices
Recurring Themes and Concepts
Level 4 ▸ Energy ▸ Lessons 19–20 186 © Great Minds PBC
Content Standards Standard Student Expectation Lesson(s) 4.8A Investigate and identify the transfer of energy by objects in motion, waves in water, and sound. (Addressed) 19, 20 4.8B Identify conductors and insulators of thermal and electrical energy. (Addressed) 19, 20 4.8C Demonstrate and describe how electrical energy travels in a closed path that can produce light and thermal energy. (Addressed) 19, 20
Standard Student Expectation Lesson(s) 4.1G Develop and use models to represent phenomena, objects, and processes or design a prototype for a solution to a problem. 19, 20 4.2B Analyze data by identifying
, patterns, or sources of error. 20 4.3A Develop explanations and propose solutions supported by data and models. 19, 20 4.4A Explain how scientific discoveries and innovative solutions to problems impact science and society. 20
any significant features
Standard Student Expectation Lesson(s) 4.5B Identify and investigate cause-and-effect relationships to explain scientific phenomena or analyze problems. 19, 20 4.5D Examine and model the parts of a system and their interdependence in the function of the system. 19 4.5E Investigate how energy flows and matter cycles through systems and how matter is conserved. 19, 20 PhD SCIENCE® TEXAS
English Language Proficiency Standards
PhD SCIENCE® TEXAS Level 4 ▸ Energy ▸ Lessons 19–20 © Great Minds PBC 187
Standard Student Expectation Lesson(s) 2E Use visual, contextual, and linguistic support to enhance and confirm understanding of increasingly complex and elaborated spoken language. 19, 20 Materials Student Materials Lesson(s) Science Logbook (Lesson 19 Activity Guide) 19 Science Logbook (Lesson 2 Activity Guide) 19 Conceptual Checkpoint (Lesson 20 Resource B) 20 Highlighter (1) 20 Teacher Materials Lesson(s) Hoover Dam Turbines Photograph (Lesson 19 Resource) 19 The Boy Who Harnessed the Wind by William Kamkwamba and Bryan Mealer (2012) 20 Bicycle with Dynamo Light System Illustration (Lesson 20 Resource A) 20 Teacher Preparation Lesson(s) Prepare to distribute a copy of Lesson 20 Resource B to each student. 20
Lesson 19
Objective: Model how windmills transfer and transform energy.
Launch
Agenda
Launch (5 minutes)
Learn (38 minutes)
▪ Develop Key Concepts Checklist (10 minutes)
▪ Revise Initial Models (15 minutes)
▪ Refine Anchor Model (13 minutes)
Land (2 minutes)
5 minutes
Remind students that they learned about another use of generators in the Earth Features Module by showing them turbines that generate electricity inside the Hoover Dam (Lesson 19 Resource). Ask students to think about what they learned in the previous module about hydroelectric dams.
Teacher Note
If needed, refer to the reading Finding Out about Hydropower by Matt Doeden (2015, 14–18). A digital version of the text is available on Epic! by opening a free educator account (http://phdsci.link/1036).
► How do you think the generators in the Hoover Dam compare to the generators you built?
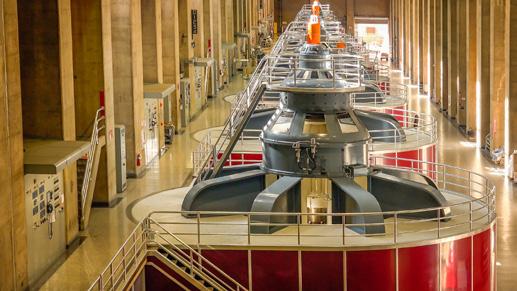
▪ Maybe they have a lot of the same parts: wires and something that spins.
▪ They both transform mechanical energy to electrical energy.
Level 4 ▸ Energy ▸ Lesson 19 188 © Great Minds PBC
PhD SCIENCE® TEXAS
▪ The dam uses mechanical energy from water, and the windmill uses mechanical energy from the wind.
▪ Our generators are tiny compared to the ones in the Hoover Dam.
Inform students that, after building a generator in the previous lesson, they are ready to apply their learning to answer the Essential Question: How do windmills change wind to light?
► How is your generator like the windmill?
▪ The magnets spin like the blades of the windmill spinning in the wind.
▪ Both transform mechanical energy into electrical energy, and we know this happens because the light turns on.
Tell students they will demonstrate their new learning by revising their models of the windmill.
Learn
38 minutes
Develop Key Concepts Checklist
10 minutes
Display the anchor model. Ask students to consider what they have learned about energy transfers and transformations over the last few weeks. As a class, summarize their learning by developing a key concepts checklist.
► What energy concepts should we make sure we show on our model of the windmill?
As students share, listen for key ideas to include on the key concepts checklist. Record the checklist on the board where students can refer to it.
Teacher Note
For background on using key concepts checklists, see these professional resources from Ambitious Science Teaching about a similar technique called “gotta-have” checklists (2E):
▪ Generalizable Science Ideas: The “Gotta Have” Checklist video (Tools for Ambitious Science Teaching 2013) (http://phdsci.link/1005)
▪ “Face-to-Face Tools: Making Changes in Student Thinking Visible Over Time” (2015) (http://phdsci.link/1159).
Differentiation
For students who need support with the language demands of this lesson, build a word bank from the key concepts checklist that students can use as they move through this lesson. Include energy, transfer, and transform in the word bank (2E).
PhD SCIENCE® TEXAS Level 4 ▸ Energy ▸ Lesson 19 © Great Minds PBC 189
Sample key concepts checklist:
Key Concepts Checklist
▪ Energy transformations
▪ Energy transfers
▪ Relationship between energy and speed
▪ Different indicators of energy
If students overlook key energy concepts, review the anchor chart and discuss which concepts from the chart help explain the windmill phenomenon.
After the class develops the key concepts checklist, direct students to record a copy in their Science Logbook (Lesson 19 Activity Guide).
Revise Initial Models 15 minutes
Have students revisit the initial model they drew in their Science Logbook (Lesson 2 Activity Guide). Explain that they will now create an updated model (Lesson 19 Activity Guide). Tell students that they may include parts from their initial models and add or change elements to represent their new understanding. Remind students to refer to the key concepts checklist to help them show how those concepts apply to the windmill phenomenon.
After creating their revised model, instruct students to share their model with a partner and identify similarities and differences between their models. Students should record similarities and differences in the table in their Science Logbook (Lesson 19 Activity Guide). Allow students to revise their models after their discussions. As students work, circulate to observe and support their thinking.
Differentiation
As needed, provide students with individual support. Have visual aids available such as physical models from previous lessons or the anchor chart to support students to revise their models (2E).
Level 4 ▸ Energy ▸ Lesson 19 190 © Great Minds PBC
PhD SCIENCE® TEXAS
Sample student response:
Similarities
▪ Both our models show wind pushing the blades of the windmill.
▪ We both showed wires connecting the windmill to the light.
▪ We labeled light as an indicator of energy.
▪ Our models show that electrical energy gets transformed into light energy at the LED.
Differences
▪ I used arrows to show electrical energy transferring from the generator through the wires to the light.
▪ On the generator in my partner’s model, they labeled mechanical energy transforming into electrical energy.
▪ I added a label saying that the faster the wind blows, the more energy gets transferred and transformed into light.
Check for Understanding
Students revise models of the windmill system to represent how mechanical energy is transferred to the generator and transformed into electrical energy.
TEKS Assessed
4.1G Develop and use models to represent phenomena, objects, and processes or design a prototype for a solution to a problem.
4.5B Identify and investigate cause-and-effect relationships to explain scientific phenomena or analyze problems.
4.5D Examine and model the parts of a system and their interdependence in the function of the system.
4.8A Investigate and identify the transfer of energy by objects in motion, waves in water, and sound.
PhD SCIENCE® TEXAS Level 4 ▸ Energy ▸ Lesson 19 © Great Minds PBC 191
Check for Understanding (continued)
Evidence
Students develop models to represent (4.1G) the transfer of energy (4.8A) through the components of a windmill system (4.5D).
Next Steps
If students need support with model revisions, encourage them to review the class anchor chart and class anchor model. As needed, prompt students with questions such as these: What could you add or remove from your model to make it more accurate? How could something like a generator relate to how energy is transferred in a windmill system?
Students explain that energy transformation by the windmill depends on the cause-and-effect relationship (4.5B) that the harder the wind blows, the more energy transfers to the windmill blades (4.8A), increasing the input energy to the windmill system.
If students need support to explain their models, prompt them with questions such as these: How is energy transfer different from the process of energy transformation? What might affect how energy transfer and energy transformation occur in a windmill?
Refine Anchor Model 13 minutes
Invite students to share their revised models with the class by describing new components and labels. As students share new components, encourage other students to use nonverbal signals to show whether they agree that the new component accurately represents how the windmill system works. Call on students to justify their agreement or disagreement with evidence.
If most students agree with the addition of a component and can justify the addition, draw it on the anchor model. Continue asking students what is missing from the anchor model and adding those components until everyone is satisfied that the anchor model successfully explains the windmill phenomenon. As the anchor model develops, students may revise their models as necessary.
Level 4 ▸ Energy ▸ Lesson 19 192 © Great Minds PBC
PhD SCIENCE® TEXAS
Sample anchor model:
How a Windmill Harnesses the Wind
Generator behind blades transforms motion energy into electrical energy.
whenLEDlightsupbladesspin.
Electric current transfers energy through conductive wires.
Wind collides with the blades, transferring energy.
The windmill transforms energy from motion into electrical energy and then into light.
In the windmill system, wind collides with the blades, which transfers energy to a generator. The motion of the spinning blades moves the magnets inside the generator, where the mechanical energy of the spinning magnets is transformed into electrical energy. An electric current transfers energy through a closed loop of conductive wires and turns on the light. When the wind blows harder, more energy is transferred to the blades. The windmill system transforms energy from mechanical energy to electrical energy and then to light.
Review the key concepts checklist, asking students to use nonverbal signals to show whether they think the anchor model represents each concept. Call on students to justify their answers with evidence, and revise the anchor model to represent all key concepts if needed.
2 minutes
Have students explain to a partner their answer to the Essential Question: How do windmills change wind to light? Select a few student pairs to share their answers.
PhD SCIENCE® TEXAS Level 4 ▸ Energy ▸ Lesson 19 © Great Minds PBC 193
Land
Sample student response:
▪ When the wind collides with the blades of the windmill, the blades turn, and energy is transferred to the windmill through the force of the air on the blades. The generator transforms the mechanical energy from the blades and the magnets into electrical energy. Electrical energy is transferred through the wires to the light, and the energy is transformed again when the light comes on.
Tell students that during the next lesson, they will revisit the driving question board to see if they have answered all their questions about energy.
Level 4 ▸ Energy ▸ Lesson 19 194 © Great Minds PBC
PhD SCIENCE® TEXAS
Lesson 20
Objective: Explain that energy makes things happen when it is transferred and transformed.
Agenda
Launch (2 minutes)
Learn (38 minutes)
▪ Discuss the Driving Question Board (10 minutes)
▪ Revisit The Boy Who Harnessed the Wind (18 minutes)
▪ Conceptual Checkpoint (10 minutes)
Launch
Land (5 minutes)
2 minutes
Remind students that they have learned a lot about energy throughout the module. Tell students they will update the driving question board with new knowledge and check for unanswered questions.
Explain that students will then discuss how their new knowledge of energy could be used to improve the world.
Learn
38 minutes
Discuss the Driving Question Board
10 minutes
Display the driving question board. Have students discuss which questions they have answered and which questions they still need to answer.
PhD SCIENCE® TEXAS Level 4 ▸ Energy ▸ Lesson 20 © Great Minds PBC 195
Sample student responses:
▪ We have answered almost all our questions.
▪ We still have some questions on the driving question board that we have not answered, but they didn’t really fit in as we were figuring out how the windmill worked.
▪ Maybe we can investigate those questions next.
Coach students to discuss the questions that can now be answered using their new knowledge.
Revisit the list of student-generated phenomena, and allow students time to reflect on how their new knowledge can explain phenomena on the list.
Guide students to continue searching for answers independently to any unrelated questions or phenomena that cannot be explained using what they have learned. If students show significant interest in a particular question, allow them to share what they find with the class in a later lesson.
Revisit The Boy Who Harnessed the Wind 18 minutes
► How could our knowledge of energy help us make the world better?
▪ I could produce light in my basement since it’s always dark in there. To get mechanical energy for the generator, I could turn a crank or maybe harness wind from outside.
▪ When I turn off my lights or the TV when I’m not watching it, I’m saving energy since it takes energy to turn them on.
▪ I’m going to be more careful when I ride my bike fast. Since I’m going fast, the bike and I have a lot of energy and could hurt someone in a collision.
Remind students that another student used his knowledge of energy to solve serious problems in his community. Revisit The Boy Who Harnessed the Wind (Kamkwamba and Mealer 2012), and read the book aloud through page 27. After finishing the reading, ask student pairs to discuss anything new they noticed and wondered about how William harnessed the wind.
Lead a discussion with text-dependent questions such as those that follow. As needed, reread relevant pages from the book as students discuss the questions, and remind them to cite text evidence to explain their thinking.
Extension
The read-aloud in this lesson does not include the last two pages, which have detailed information about William Kamkwamba. Consider reading and discussing those pages as an extension activity for students.
Differentiation
As in most class discussions, allow students to consider each question and develop responses individually or with peers before whole-class sharing. Students may benefit from answering the text-dependent questions using a Think–Pair–Share or Jot–Pair–Share. These routines allow individual students to consider their thoughts about each question and then collaboratively discuss the question with peers before sharing with the whole class (2E).
Content Area Connection: English Reread The Boy Who Harnessed the Wind and discuss how specific words and phrases in the book represent energy (2E).
Content Area Connection: Geography
Use Google Earth™ mapping service to locate William’s village of Masitala, Malawi. Adding contextual details may be beneficial for some students’ understanding (2E).
Consider providing opportunities for students to research these questions about William and the challenges his community faced. Discuss the geographical characteristics, economy, and culture of Malawi.
Level 4 ▸ Energy ▸ Lesson 20 196 © Great Minds PBC
PhD SCIENCE® TEXAS
► After William understood that a windmill could generate electricity and pump water from the ground, what did he do next?
▪ He closed his eyes and saw a windmill outside his home generating electricity from the breeze. (Page 12)
▪ He imagined the windmill getting cool water from the ground to water the plants. (Page 13)
▪ He decided he would build electric wind. (Page 14)
► What steps did William take to build his windmill system?
▪ He went to the junkyard to find scraps of metal, a tractor fan, and other pieces. (Page 15) He also found a broken bicycle and a generator from a bike headlight. (Page 17)
▪ William’s friends offered to help. They chopped trees to make a tower. (Pages 19 and 20)
▪ He connected wires to a light bulb. (Page 23)
► How do the illustrations on pages 22 and 23 show the types of energy transfer and transformation that make “electric wind”?
▪ The blue lines show the wind. I think there is a lot of energy in this wind, because the book says it is a “gusting gale.” (Page 21)
▪ The first picture shows that energy is transferred from the wind to the windmill where the blue lines wrap around the blades. (Page 22) On the next page, the wire transfers energy from the windmill to the light bulb. (Page 23)
▪ The second picture shows mechanical energy from the wind transforming into light. (Page 23) The picture only shows the blue lines for wind and yellow for the light, but we know there’s probably a generator between the blades and the light bulb that transforms the energy.
Discuss that although William was just a young boy, he was also an engineer—he worked to solve an important problem that he identified. Use this as an opportunity to explain to students that anyone can be an engineer. Explain that although some engineers develop a new device to solve a problem, others may refine existing technologies to meet new criteria and constraints, which is what William did.
Conceptual Checkpoint 10 minutes
Display the illustration of a person pedaling a bicycle with a dynamo generator and LED system, or dynamo light system, mounted to the front of their bicycle (Lesson 20 Resource A).
Teacher Note
Students may want to know more about William Kamkwamba and his life in Malawi. Play and discuss a video about Kamkwamba, such as “How I Harnessed the Wind” (Kamkwamba 2009) (http://phdsci.link/1004). Consider telling students that Kamkwamba was 22 years old when this video was recorded.
Extension
Many engineers and technicians play a role in designing wind turbines (e.g., electrical engineers, mechanical engineers, aerospace engineers, materials engineers). If students are interested, have them research different types of engineers and what they do. Consider asking engineers in the community to come to class and tell students about their work.
PhD SCIENCE® TEXAS Level 4 ▸ Energy ▸ Lesson 20 © Great Minds PBC 197
Explain to students that this technology was developed by engineers to provide a reliable source of energy to run a light, called a headlamp, on the front of a bicycle. Tell students that cyclists who use a headlamp can ride more safely in cities and at night.
Explain that a dynamo light system harnesses the power of pedaling a bicycle. The system transforms the motion of a bicycle wheel into usable electrical energy. Refer to the bicycle illustration (Lesson 20 Resource A), and work with students to trace the path of energy through the system. Begin with the energy transformation from mechanical energy to electrical energy in the dynamo generator. Then focus on the electrical energy transfers that lead to the LED headlamp. Finally, discuss the electrical energy that is transformed into light in the headlamp.
Distribute the Conceptual Checkpoint (Lesson 20 Resource B). Read the prompts aloud, and instruct students to record their responses.
► On the model, use a highlighter to trace the flow of energy between the generator and the headlamp.
Teacher Note
Students may mention battery-operated headlamps used by cyclists. Explain that in contrast to battery light systems, dynamo light systems are more reliable because a dynamo light system does not include batteries which can run out of energy. An added benefit of some dynamo light systems is a built-in charger for phones and other devices.
Teacher Note
Students may choose to represent the flow of energy as it begins outside of the dynamo generator: from the wheel, which turns the dynamo generator; from the dynamo generator to the headlamp; and out of the headlamp as light. Though this entire path does not have to be shown, it is accurate because it represents the flow through the entire system, including bicycle components.
Level 4 ▸ Energy ▸ Lesson 20 198 © Great Minds PBC
Headlamp
Dynamo generator Wires Light
PhD SCIENCE® TEXAS
► Use evidence from the model to explain why energy flows through the system.
▪ The headlamp can produce light because energy flows in a closed path in the system.
► Use evidence from the model to explain why energy cannot flow through the system.
▪ If the wires are cut or broken, the flow of energy would stop because there is not a closed path where energy can flow. The bulb won’t get energy and it can’t light up.
► In the table, circle materials that could be used as conductors to make energy flow through the system.
Material Metal or Nonmetal Light Produced
Copper Metal Bright light
Plastic Nonmetal None
Iron Metal Dim light
Rubber Nonmetal None
PhD SCIENCE® TEXAS Level 4 ▸ Energy ▸ Lesson 20 © Great Minds PBC 199 Light Headlamp Bicycle tire Dynamo generator LED bulb Wires
Conceptual Checkpoint
Students use models and data to determine how electrical energy flows through the components of a dynamo light system to produce light energy.
TEKS Assessed
4.1G Develop and use models to represent phenomena, objects, and processes or design a prototype for a solution to a problem.
4.2B Analyze data by identifying any significant features, patterns, or sources of error.
4.3A Develop explanations and propose solutions supported by data and models.
4.5E Investigate how energy flows and matter cycles through systems and how matter is conserved.
4.8B Identify conductors and insulators of thermal and electrical energy.
4.8C Demonstrate and describe how electrical energy travels in a closed path that can produce light and thermal energy.
Evidence
Students develop a model (4.1G) to show the closed path of electrical energy (4.8C) between the generator and the headlamp in the dynamo light system (4.5E).
Students use evidence from the model to explain (4.3A) how electrical energy flows in a closed system (4.5E) and produces light energy (4.8C).
Students use evidence from the model (4.1G) to explain (4.3A) that electrical energy cannot flow through the dynamo light system (4.5E) because the system is open and therefore the headlamp cannot produce light (4.8C).
Students analyze data (4.2B) and identify copper and iron as conductors of electrical energy (4.8B) that can be used to make energy flow through the dynamo light system (4.5E).
Next Steps
If students need support to highlight the path of energy flow in the model, prompt them with questions such as these: What happens because the dynamo generator produces electrical energy? Where does that electrical energy travel?
If students need support to develop an explanation, ask guiding questions such as these: Is light produced in the system? Is the system open or closed?
If students need support to explain why the headlamp does not produce light, prompt students with questions such as these: How does this system look different from the working system in the other model? What happens in the system if the path is not closed?
If students need support to identify metals as conductors, prompt students with questions such as these: What types of materials have we observed or used as conductors in class? How does the function of a conductor differ from that of an insulator?
Level 4 ▸ Energy ▸ Lesson 20 200 © Great Minds PBC
PhD SCIENCE® TEXAS
Debrief the Conceptual Checkpoint to clarify student understanding of energy transfer and transformation in the dynamo light system. Confirm for students that the motion of pedaling, and the movement of the wheels that results from pedaling, causes the dynamo generator to produce electrical energy. This electrical energy is then transferred through conductive wires to the headlamp, where it is transformed into light energy. Similar to systems students have observed in previous lessons, the proper functioning of a dynamo light system depends on the presence of a closed path, or closed circuit.
Land
5 minutes
Have students recall what they have learned about the transfer and transformation of energy through systems. Ask students to consider the dynamo light system, the generators and light bulb circuits created in class, and William’s windmill system.
► What are some similarities you noticed about the flow of energy in these systems?
▪ Both William’s windmill system and the dynamo light system used generators to produce electrical energy from mechanical energy.
▪ Most of these systems had some sort of metal that worked as a conductor, transferring energy from one place or object to another.
▪ They all involved electrical energy, either being used and transformed into something else, or being produced from some other form of energy.
Tell students that each system was engineered for a specific purpose or to solve a problem. Have students reflect on how using these types of systems could help solve problems that may occur in an environment.
► What impacts do you think systems, such as windmills and generators, could have on an environment?
▪ Windmills can help generate electricity in places where it may be hard to get.
▪ Dynamo light systems produce electrical energy without having to buy a battery or plug into an outlet. They transform the mechanical energy of a bike into electrical energy.
▪ Some of these systems take up space, which could be bad. The windfarm we saw took up a lot of space and if it was on land, that might mean you would have to cut down lots of trees.
PhD SCIENCE® TEXAS Level 4 ▸ Energy ▸ Lesson 20 © Great Minds PBC 201
Tell students that in the next lesson, they will use their knowledge of energy to create their own devices to transfer and transform energy. Like William, they will design devices to solve a problem. Provide the next lesson set’s Phenomenon Question: How can we apply our knowledge of energy to solve a problem?
Optional Homework
Students write a short book reflection about the story of William Kamkwamba to share with others.
Level 4 ▸ Energy ▸ Lesson 20 202 © Great Minds PBC
PhD SCIENCE® TEXAS
Lessons 21–26 Engineering Challenge
Prepare
Throughout previous lessons in this module, students worked to build a shared understanding of energy, energy transfer, and energy transformation. In Lessons 21 through 25, students apply that knowledge to solve a problem in an Engineering Challenge. After reviewing the engineering design process, students identify an available energy source, a desired application of energy, and the materials available. Then students propose a solution. They apply what they have learned about energy transfer and transformation to design a device that transforms energy from an available form into the desired form, emulating William Kamkwamba. In Lesson 26, students present their final designs to their peers.
Student Learning Knowledge Statement
The engineering design process can be used to create a device to transfer energy and transform it from an available form into the desired form.
Objective
▪ Lessons 21–26: Apply the engineering design process to build and improve a device that transfers and transforms energy.
Application of Concepts
Task Engineering Challenge
Phenomenon Question
How can we apply our knowledge of energy to solve a problem?
PhD SCIENCE® TEXAS Level 4 ▸ Energy ▸ Lessons 21–26 © Great Minds PBC 203
Standards Addressed
Texas Essential Knowledge and Skills
Content Standards Standard
Expectation
4.7 Plan and conduct descriptive investigations to explore the patterns of forces such as gravity, friction, or magnetism in contact or at a distance on an object. (Addressed)
4.8A Investigate and identify the transfer of energy by objects in motion, waves in water, and sound. (Addressed)
4.8B Identify conductors and insulators of thermal and electrical energy. (Addressed)
4.8C Demonstrate and describe how electrical energy travels in a closed path that can produce light and thermal energy. (Addressed)
4.11A Identify and explain advantages and disadvantages of using Earth’s renewable and nonrenewable natural resources such as wind, water, sunlight, plants, animals, coal, oil, and natural gas. (Mastered)
4.11B Explain the critical role of energy resources to modern life and how conservation, disposal, and recycling of natural resources impact the environment. (Mastered)
Scientific and Engineering Practices
Standard
4.1A Ask questions and define problems based on observations or information from text, phenomena, models, or investigations. 21
4.1B Use scientific practices to plan and conduct descriptive investigations and use engineering practices to design solutions to problems.
4.1C Demonstrate safe practices and the use of safety equipment during classroom and field investigations as outlined in Texas Education Agency–approved safety standards
Level 4 ▸ Energy ▸ Lessons 21–26 204 © Great Minds PBC
Student
Lesson(s)
22, 23, 25, 26
21, 22, 23, 24, 25, 26
22, 24, 25, 26
21, 22, 23, 24, 25, 26
22, 25, 26
21, 22, 23, 24, 25, 26
Student
Expectation Lesson(s)
21, 22, 23, 24, 25, 26
21, 22, 23, 24, 25, 26 PhD SCIENCE® TEXAS
Scientific and Engineering Practices (continued)
4.1D
Use tools, including hand lenses; metric rulers; Celsius thermometers; calculators; laser pointers; mirrors; digital scales; balances; graduated cylinders; beakers; hot plates; meter sticks; magnets; notebooks; timing devices; sieves; materials for building circuits; materials to support observation of habitats of organisms such as terrariums, aquariums, and collecting nets; and materials to support digital data collection such as computers, tablets, and cameras, to observe, measure, test, and analyze information.
4.1F Construct appropriate graphic organizers used to collect data, including tables, bar graphs, line graphs, tree maps, concept maps, Venn diagrams, flow charts or sequence maps, and input-output tables that show cause and effect.
4.1G Develop and use models to represent phenomena, objects, and processes or design a prototype for a solution to a problem.
a design or object using criteria.
Recurring Themes and Concepts
English Language Proficiency Standards
PhD SCIENCE® TEXAS Level 4 ▸ Energy ▸ Lessons 21–26 © Great Minds PBC 205
Standard Student Expectation Lesson(s)
23, 24, 25, 26
23, 25, 26
22, 23, 24, 25, 26 4.2D Evaluate
21, 23, 24 4.3A Develop explanations and propose solutions
by
and models. 24, 26 4.3B Communicate explanations and solutions individually and collaboratively in a variety of settings and formats. 22 4.3C Listen actively to others’ explanations to identify relevant evidence and engage respectfully in scientific discussion. 26 4.4A Explain how scientific discoveries and innovative solutions to problems impact science and society. 21, 26 4.4B Research and explore resources such as museums, libraries, professional organizations, private companies, online platforms, and mentors employed in a science, technology, engineering, and mathematics (STEM) field to investigate STEM careers. 22
supported
data
Standard Student Expectation Lesson(s)
Identify and
cause-and-effect
scientific phenomena or analyze problems. 22, 23, 25
Examine and
system. 22, 23, 24, 26 4.5E Investigate
23, 24, 25, 26 4.5F Explain the
and
of
,
and
22, 24
4.5B
investigate
relationships to explain
4.5D
model the parts of a system and their interdependence in the function of the
how energy flows and matter cycles through systems and how matter is conserved.
relationship between the structure
function
objects
organisms,
systems.
Standard Student Expectation Lesson(s) 3E Share information in cooperative learning interactions. 22, 23, 24, 25
Materials
Engineering Challenge materials (1 set per group): pinwheels from Lesson 1 (1); Snap Circuits® Green kit (1); cardboard generator from Lesson 18 (1); stopwatch (1); alligator clip cords (4); handheld balloon pump (1); safety goggles (1 per student); various materials such as aluminum foil, cardboard boxes or tubes, plastic cups or bottles, paper plates, straws, tape, string, wooden skewers, and craft sticks
Preparation
Prepare for students to research renewable energy engineers. (See Lesson 22 Resource.)
The quantities of additional Engineering Challenge materials needed may vary according to group designs. Decide in advance what materials to make available so that students can include that information in their planning.
Level 4 ▸ Energy ▸ Lessons 21–26 206 © Great Minds PBC
Student Materials Lesson(s) Science Logbook
21, 22, 23, 24, 25, 26 Sticky
(at least
21, 24, 26
22, 23, 24, 25, 26 Highlighters in 2 different colors (1 of each color) 22, 25 Science Logbook (Lesson 26 Activity Guides A and B) 26 Teacher Materials Lesson(s) Engineering Challenge Rubric (Lesson 21 Resource A) 21, 22, 23, 24, 25, 26 Flooded Neighborhood Photograph (Lesson 21 Resource B) 21 Chart paper (1 sheet), marker (1) 21 The Boy Who Harnessed the Wind by William Kamkwamba and Bryan Mealer (2012) 21 Engineering Design Process (Lesson 21 Resource C) 21 Safety goggles (1) 22, 23, 24, 25, 26 Teacher
Lesson(s)
(Lesson 21 Activity Guides A and B)
notes
14)
22
22, 23, 24, 25, 26 PhD SCIENCE® TEXAS
Lesson 21
Objective: Apply the engineering design process to build and improve a device that transfers and transforms energy.
Launch
5 minutes
Teacher Note
Review the Engineering Challenge rubric (Lesson 21 Resource A) before beginning Lesson 21. Use the rubric to assess students throughout the Engineering Challenge. Checks for Understanding present additional points of evidence to consider. Look and listen for evidence of student engagement in each stage of the engineering design process.
Display the flooded neighborhood photograph (Lesson 21 Resource B), and tell students that it was taken by the Federal Emergency Management Agency (FEMA) in Houston, Texas, after Hurricane Harvey in 2017.
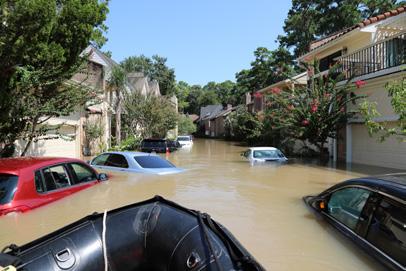
Agenda
Launch (5 minutes)
Learn (35 minutes)
▪ Ask About a Problem (15 minutes)
▪ Discuss How William Used the Engineering Design Process (20 minutes)
Land (5 minutes)
PhD SCIENCE® TEXAS Level 4 ▸ Energy ▸ Lesson 21 © Great Minds PBC 207
► What problems do you notice?
▪ The street is flooded.
▪ The cars are covered in water.
Ask students what they know about floods, and briefly discuss recent floods, either locally or in other states. Explain to students that there can be many problems associated with flooding but that they will focus on a problem related to energy.
Tell students to imagine that because of the flooding, electrical energy has stopped flowing to the homes. Tell students that the people in the homes need light to gather supplies and make sure everyone is safe but that the batteries and flashlights in the homes have all been damaged by the flood.
► Can you design something to solve this problem?
Remind students of the Phenomenon Question How can we apply our knowledge of energy to solve a problem? Tell students that in the coming lessons, they will develop their own solution to a problem.
Learn 35 minutes
Ask About a Problem 15 minutes
Have students turn to the engineering design process visual in their Science Logbook (Lesson 21 Activity Guide A), and remind students that the Ask stage of the engineering design process starts with defining the problem.
► What problem must our design be able to solve?
▪ We need to design a light that works without plug-in electricity.
▪ Homes are not getting electrical energy, and there are no batteries. We need to make electricity to provide light.
Level 4 ▸ Energy ▸ Lesson 21 208 © Great Minds PBC
PhD SCIENCE® TEXAS
Ask students to record a problem statement in the Ask section of their Science Logbook (Lesson 21 Activity Guide B). Have students share their answers. Use their responses to generate a class problem statement, and record it on a piece of chart paper.
Sample class problem statement:
▪ The people in the homes need a light to see but don’t have any sources of electrical energy.
► Using what you have learned about transforming energy, how can you solve the problem?
▪ We need a light that can use electrical energy.
▪ We can change mechanical energy into electrical energy.
▪ We could make something that transfers energy from wind or from another source that makes something move.
Remind students that in the Ask stage of the engineering design process it is important to identify the criteria and constraints of a design problem. As a class, develop the criteria and constraints that students’ solutions to the problem must meet.
► How will we know if our device is successful?
▪ We can get a light to turn on without a battery.
▪ We can turn on a light with mechanical energy.
▪ The light is bright enough to see, and it stays on long enough for people to find supplies.
Work with students to decide that the device must transfer energy and transform it to produce light that is bright and stays on for as long as possible.
► What limitations or restrictions are there on your possible solutions?
▪ It can’t be too big because people need to be able to carry it.
▪ We can only make it with materials we have.
Decide with students that the device must fit in the classroom and be constructed using only materials from class. Have students record these criteria and constraints in the Ask section of their Science Logbook (Lesson 21 Activity Guide B).
Teacher Note
If necessary, review the meanings of the terms criteria and constraints
Criteria: what is needed; what are the requirements?
Constraints: what is possible; what are the limitations?
Spotlight on Knowledge and Skills
As students discuss the criteria and constraints, acknowledge that many factors will influence the design of their devices, and that each group will come up with different solutions.
Encourage students to think about the resources available to them, how the area may have changed after a flood, and how these two factors will affect their designs (4.2D).
PhD SCIENCE® TEXAS Level 4 ▸ Energy ▸ Lesson 21 © Great Minds PBC 209
Sample student response:
Criteria
▪ The light turns on.
▪ Mechanical energy is transferred to the device and transformed into light energy.
▪ The light is as bright as possible.
▪ The light stays on for as long as possible.
Check for Understanding
Constraints
▪ Must be small enough to carry.
▪ Must be made with classroom materials.
Students identify the need to transfer and transform energy as they define the criteria for a successful device.
TEKS Assessed
4.1A Ask questions and define problems based on observations or information from text, phenomena, models, or investigations.
4.8A Investigate andidentify the transfer ofenergy byobjects inmotion, waves in water, and sound.
4.8C Demonstrate and describe how electrical energy travels in a closed path that can produce light and thermal energy.
Evidence
Students list criteria for their device (4.1A) that include transfer of mechanical energy to the device (4.8A) and transformation of mechanical energy into light energy (4.8C) that is as bright and long lasting as possible.
Next Steps
If students need support identifying the need to transfer mechanical energy, have them revisit the generators from Lesson 18. Prompt students with questions such as these: Where will the electrical energy for the light bulb come from? What needs to happen to the nail in the generator to create electrical energy?
Level 4 ▸ Energy ▸ Lesson 21 210 © Great Minds PBC
PhD SCIENCE® TEXAS
Discuss How William Used the Engineering Design Process
20 minutes
Explain that in the Imagine stage, engineers will often research how other people solved similar problems. Recall with students the story of William Kamkwamba and how he built a windmill to generate electricity for his home.
► What problems did William hope to solve by building a windmill?
▪ People couldn’t see at night. They didn’t have money for lights.
▪ There wasn’t enough rain, so the crops weren’t growing.
► How did William use a windmill and energy from the wind to solve those problems?
▪ The windmill generated electricity for lights.
▪ The windmill provided electrical energy to pump water for crops. The energy transferred from the wind to the windmill. A generator transformed that mechanical energy into the electrical energy used to run a pump.
► How did William’s solution make a difference for his village?
▪ The windmill helped villagers get electricity for lights so they could see at night.
▪ The windmill pumped water from the ground into their fields. It helped them make more food.
Check for Understanding
Students discuss how William used energy to solve a problem in his community.
TEKS Assessed
4.4A Explain how scientific discoveries and innovative solutions to problems impact science and society.
4.8A Investigate andidentify the transfer ofenergy byobjects inmotion, waves in water, and sound.
PhD SCIENCE® TEXAS Level 4 ▸ Energy ▸ Lesson 21 © Great Minds PBC 211
Check for Understanding (continued)
Evidence
Students explain how William’s solution transferred energy from the motion of the wind (4.8A) and transformed it into electrical energy for lights or a water pump, which helped people in the village see at night and water their fields to grow more food (4.4A).
Next Steps
If students need support identifying the transfer and transformation of mechanical energy, show students pages 13 and 14 in The Boy Who Harnessed the Wind. Explain that “drawing water” means pulling water from the ground and that a pump pushes and pulls air and water to bring the water to the surface. Ask questions such as these: What type of energy causes the windmill to spin? Is energy needed to move water out of the ground?
Have students review the engineering design process in their Science Logbook (Lesson 21 Activity Guide A). Have students think about the questions William must have asked and the steps he took to design a solution to the problem. Use The Boy Who Harnessed the Wind (Kamkwamba and Mealer 2012) as a reference to show the engineering design process in action. Reread sections of the book as needed. Have students write their ideas about what William did to follow the engineering design process on sticky notes and place the notes under the appropriate heading on the engineering design process visual
► How did William use the engineering design process to solve a problem?
▪ He figured out what problems he needed to solve. Then he read lots of books from the library to research and brainstorm solutions.
▪ He made different types of windmills with different materials and improved them each time.
▪ He shared his work with other people in his village.
While discussing students’ responses, emphasize the importance of planning, persistence, and teamwork.
► Where in the process do you think William had to repeat steps a few times?
▪ I bet his first windmill didn’t work, so he had to imagine, create, and improve a lot.
▪ He probably had a lot of questions as he was putting the windmill together, and he had to be really creative with his materials. I bet he had to imagine and plan a few times to make it work better.
Level 4 ▸ Energy ▸ Lesson 21 212 © Great Minds PBC
PhD SCIENCE® TEXAS
Explain that although the engineering design process is sometimes like a straight line followed step by step and sometimes like a circle where steps are repeated, it is most like a web with an input and an output. Engineers may take different paths through the engineering design process to solve problems and may repeat steps until the solutions meet all criteria and constraints. However, the process always starts with a problem as the input and ends with a solution as the output.
Differentiation
For students who would benefit from a visual aid, display the engineering design process (Lesson 21 Resource C), and draw arrows from each step to the others.
5 minutes
Have students review what they learned about William and his windmill and compare it to their own Engineering Challenge.
► How can learning about William’s solution help us solve our problem?
▪ He used a windmill to make light. We can do that too!
▪ William’s solution transformed mechanical energy from the wind into electrical energy.
▪ We can transform mechanical energy into light, just like he did.
PhD SCIENCE® TEXAS Level 4 ▸ Energy ▸ Lesson 21 © Great Minds PBC 213
Ask Imagine Improve Plan Create Share Define the problem Redesign Receive feedback Identify criteria and constraints Research Test and evaluate Build a prototype Brainstorm solutions Select a solution Gather materials Generate detailed design
Land
Lesson 22
Objective: Apply the engineering design process to build and improve a device that transfers and transforms energy.
Launch
5 minutes
Review the Phenomenon Question How can we apply our knowledge of energy to solve a problem? Ask students to summarize the problem they must solve and the stages they have completed already.
▪ We need to design a light for people in a flooded area.
▪ We did the Ask stage because we identified the criteria and constraints.
▪ We started the Imagine stage because we researched how William solved a similar problem.
Learn
35 minutes
Imagine a Solution 25 minutes
Work with students to develop a list of the materials they have access to from their work during the module. The list should include pinwheels from Lesson 1, LEDs, alligator clips, materials from previous investigation stations, the Snap Circuit® materials, and cardboard tube generators from Lesson 18. Explain that students may also use disposable or reused materials from the classroom and the recycling bin such as aluminum foil, cardboard boxes or tubes, plastic cups or bottles, paper plates, straws, tape, string, wooden skewers, or craft sticks.
Agenda
Launch (5 minutes)
Learn (35 minutes)
▪ Imagine a Solution (25 minutes)
▪ Plan a Solution (10 minutes)
Land (5 minutes)
Level 4 ▸ Energy ▸ Lesson 22 214 © Great Minds PBC
PhD SCIENCE® TEXAS
Safety Note
This Engineering Challenge poses potential hazards. To minimize the risks, review these safety measures and look for evidence that students are following them (4.1C):
▪ Do not put materials in or near your mouth, nose, or ears.
▪ If an LED light breaks, tell an adult right away. Do not touch the broken pieces.
▪ Wear safety goggles at all times.
Gather the available materials to display for students.
► Which of these materials are conductors? Which of these materials are insulators?
▪ The pinwheel is made of paper. That’s an insulator.
▪ The wires are conductors.
▪ The craft sticks are insulators.
► How do the structures of these materials function to transfer and transform energy?
▪ The pinwheels have blades that can be pushed by the wind. That transfers energy.
▪ The wires are made of metal which is a conductor. That transfers electrical energy.
▪ The hand crank has a handle which can turn to transform energy.
▪ We can use the generators we made and spin the nail to create electrical energy for the light.
Review class expectations for group work, and then divide the class into groups. Tell groups they will each brainstorm ideas for a solution to the problem. Draw students’ attention to the anchor model and the anchor chart. Encourage students to use their knowledge of energy as they brainstorm how to build their device. Tell students to record their thoughts in the Imagine section of their Science Logbook (Lesson 21 Activity Guide B). Have students label the materials in their drawings and identify each as an insulator or a conductor.
Teacher Note
Consider using the groups established for Lessons 16 through 18 so that students may use the generators they developed in those lessons without conflict (3E).
PhD SCIENCE® TEXAS Level 4 ▸ Energy ▸ Lesson 22 © Great Minds PBC 215
Hand crank Insulator
Sample student responses: Generator from class
Insulator and conductor
Pinwheel
Insulator
Conductor
Alligator clips
LED lights
Wires Conductor
Milk carton
Insulator
LED lights
As students work, circulate and ask questions such as the following.
► How can these parts work together to create a device that produces light?
▪ If we connect materials that are conductors to the wires on the generator, then electricity can flow to the light.
▪ The insulators can work as a handle so we can hold it safely. Allow students 10 minutes to brainstorm at least one idea. Gather students together, and review the criteria and constraints charts in the Ask section of their Science Logbook (Lesson 21 Activity Guide B).
► What problem are we working to solve?
▪ We need to make a light that doesn’t need to be plugged in.
▪ There is no electricity. We need a light that works using mechanical energy.
Remind students of their learning regarding renewable and nonrenewable resources from the Earth Features Module.
► What kind of energy are you using in your design? Why?
▪ We should use renewable energy because there is access to water and wind.
▪ We should rely on renewable energy because we don’t know if there is access to coal, oil, or natural gas.
Level 4 ▸ Energy ▸ Lesson 22 216 © Great Minds PBC
PhD SCIENCE® TEXAS
Tell students that these types of problems are similar to the ones that renewable energy engineers are working on every day. Have students research the types of solutions renewable energy engineers are designing and the other work renewable energy engineers are doing. Inform students they have access to online and printed resources for research. (See Lesson 22 Resource.)
Introduce students to the texts they will use, and then review classroom guidelines for text-based research. Have students work in their groups as they research, and ask them to record notes in the Imagine section of their Science Logbook (Lesson 21 Activity Guide B). Circulate to support their work.
► What seems interesting about working as a renewable energy engineer? What seems challenging?
► What ideas for your own designs did you get from your research?
▪ I saw that a larger circle in a turbine means the turbine can get more power from the wind. That makes me think we could make a bigger pinwheel to get the light to stay on for longer.
▪ I saw that one engineer planned a wind farm. Maybe we can use a wind farm too. If we can connect more than one pinwheel, maybe we can power more lights on our device.
Then have students discuss and select an idea as a group. To select an idea, students should compare their ideas and identify the idea, or combination of ideas, that best meets the criteria and constraints.
Check for Understanding
Students imagine a solution, research the work of engineers, and draw a diagram to show the conducting and insulating materials they will need to build a light device.
TEKS Assessed
4.1B Use scientific practices to plan and conduct descriptive investigations and use engineering practices to design solutions to problems.
4.4B Research and explore resources such as museums, libraries, professional organizations, private companies, online platforms, and mentors employed in a science, technology, engineering, and mathematics (STEM) field to investigate STEM careers.
4.5F Explain the relationship between the structure and function of objects, organisms, and systems.
4.8B Identify conductors and insulators of thermal and electrical energy.
Teacher Note
Depending on the resources students use, they may need more time for their research. Consider allowing extra time for students to research and gather ideas for their design.
Extension
Electrical engineers, mechanical engineers, aerospace engineers, and materials engineers are among those who play a role in designing wind turbines. Have students research different types of engineers and what they do. Consider asking engineers in the community to visit the class to tell students about their work.
PhD SCIENCE® TEXAS Level 4 ▸ Energy ▸ Lesson 22 © Great Minds PBC 217
Check for Understanding (continued)
Evidence
Students explain how the structure of the materials functions (4.5F) to transfer or transform energy. Students use this understanding to brainstorm ideas for a solution (4.1B) and draw a sketch of the assembled materials, identifying insulators and conductors (4.8B) in the design.
Students research renewable energy engineers (4.4B) to gather ideas students can apply to their designs (4.1B) and to learn about possible STEM careers.
Plan a Solution 10 minutes
Next Steps
If students need help identifying conductors, insulators, contact forces, or energy transfer and transformation, review their Science Logbook pages from previous lessons and discuss how the materials used to build their device are related to each of the concepts.
If students need support to conduct their research, encourage them to partner with another student researching the same topic. Have pairs discuss their sources and information while working together.
Remind students that in the Plan stage, engineers decide on materials and make a diagram of their design. Have students work together in their groups to create a detailed diagram in the Plan section of their Science Logbook (Lesson 21 Activity Guide B). Tell students they should label all the materials needed for their design. Then have students use two colored highlighters to label the energy in their designs. Tell students to use one color and a dashed line to highlight the path where electrical energy will travel and another color and solid lines to highlight the mechanical energy in their device.
Sample student responses:
Mechanical energy
Electrical energy path
Pinwheel Generator from class LED
Legs made cardboardfromtubes with craft sticks to keep it standing
Mechanical energy
Electrical energy path
Hand crank
Wires
LED lights
Level 4 ▸ Energy ▸ Lesson 22 218 © Great Minds PBC
Alligatorclips
PhD SCIENCE® TEXAS
Review with students that contact forces, or the forces that result when two objects physically touch, cause the transfer of energy that changes each object’s motion. Have students answer the questions in the Plan section of their Science Logbook (Lesson 21 Activity Guide B), and then respond to the following question.
► What causes the force that transfers mechanical energy into your device?
▪ Moving air pushes on the pinwheel blades and causes the pinwheel to spin.
▪ My hand pushing the handle makes it move.
Check for Understanding
Students work with their groups to draw a detailed model illustrating the flow of electrical energy and how mechanical energy will transfer in their solution.
4.1G Develop and use models to represent phenomena, objects, and processes or design a prototype for a solution to a problem.
4.3B Communicate explanations and solutions individually and collaboratively in a variety of settings and formats.
4.5B Identify and investigate cause-and-effect relationships to explain scientific phenomena or analyze problems.
4.7 Plan and conduct descriptive investigations to explore the patterns of forces such as gravity, friction, or magnetism in contact or at a distance on an object.
4.8A Investigate andidentify the transfer ofenergy byobjects inmotion, waves in water, and sound.
4.8C Demonstrate and describe how electrical energy travels in a closed path that can produce light and thermal energy.
PhD SCIENCE® TEXAS Level 4 ▸ Energy ▸ Lesson 22 © Great Minds PBC 219
TEKS Assessed
Check for Understanding (continued)
Evidence
Students collaboratively develop a detailed model (4.3B) of their light device (4.1G) and identify the closed path that electrical energy travels to the lights (4.8C).
Next Steps
If students do not accurately draw a closed loop for the path of the electricity, review the anchor chart and model and ask guiding questions such as these: Where is the electricity flowing in your device? Is the path for the electricity closed or open? Will the light turn on if the path is open? How can you change your drawing to show a closed loop?
Students identify the cause (4.5B) of the force that transfers mechanical energy (4.8A) to the device as a push from either the wind or their hand (4.7).
If students need support identifying the cause of the force, prompt them with questions such as these: What part of your device is moving? What is pushing on that part?
5 minutes
Debrief the Plan stage by inviting groups to describe their device.
► What materials will you need?
▪ Tape to connect the pinwheel to the nail
▪ Three paper towel tubes
▪ A juice carton
▪ Aluminum foil to connect the LEDs
Level 4 ▸ Energy ▸ Lesson 22 220 © Great Minds PBC
Land
PhD SCIENCE® TEXAS
► How will your materials work together to change mechanical energy into light?
▪ We are using a hand crank. When we push the handle, it transfers energy and generates electricity, which travels down the wires to the light bulbs.
▪ We have some recycled materials that we are using to hold up our windmill blades. That gives the windmill space to turn when we pump air on it.
▪ We are using the generator and spinning the nail using our hands. We connected a lot of lights together with wires and foil.
After students listen to one another’s ideas, encourage groups to continue thinking about different ways they can use the materials in a device that changes mechanical energy into light.
PhD SCIENCE® TEXAS Level 4 ▸ Energy ▸ Lesson 22 © Great Minds PBC 221
Lesson 23
Objective: Apply the engineering design process to build and improve a device that transfers and transforms energy.
Launch
5 minutes
Review the criteria and constraints chart in the Ask section of students’ Science Logbook (Lesson 21 Activity Guide B).
► What does your device need to do to be successful?
▪ The light needs to turn on.
▪ The light needs to be bright and stay on as long as possible.
▪ We need to transform mechanical energy into light energy.
► How can we test a device to see if it is an acceptable solution?
▪ We can build it and see if the light turns on.
▪ We can blow air on it and see how bright the light gets.
▪ We can turn the handle on the crank and see how long that keeps the light on.
Remind students that in the Create stage, engineers build a prototype of their design and test it. Tell students that before they begin creating, they will plan how they will test their device.
Agenda
Launch (5 minutes)
Learn (37 minutes)
▪ Create and Test a Device (37 minutes)
Land (3 minutes)
Level 4 ▸ Energy ▸ Lesson 23 222 © Great Minds PBC
PhD SCIENCE® TEXAS
Learn
37 minutes
Create and Test a Device 37 minutes
Ask students to get into their Engineering Challenge groups. Review with students that they will need to use a contact force on their device. The force on their device will produce mechanical energy that the device transforms into electrical energy which turns on a light.
► What strength of push will make a bright light? What strength of push will keep the light on longer?
▪ I think a stronger push will make the light brighter.
▪ I think a strong push will make the light stay on longer but it might be dimmer.
▪ I think a weak push or a strong push will work as long as we keep the pinwheel spinning.
Have students Think–Pair–Share to discuss ways they could apply contact forces of different strengths to their device.
▪ We could do 3 turns of the hand crank for a weak push and 10 turns for a strong push.
▪ We could try a small pinwheel for a weak push and a bigger pinwheel for a strong push.
▪ We could pull the balloon pump halfway back for a weak push and pull it all the way back for a strong push.
Show students the data table in the Create section of their Science Logbook (Lesson 21 Activity Guide B). Have students decide in their groups how they will test input forces of different strengths for their design and how they will record the tests in the data table. Tell students to fill in the table headings to describe what effects using different strengths of force has on the light output of the device. Circulate and support students as needed.
PhD SCIENCE® TEXAS Level 4 ▸ Energy ▸ Lesson 23 © Great Minds PBC 223
Sample student responses:
Design Number Force strength How are you transferring force? How bright is the light? How long does the light stay on?
1 Strong push 10 cranks
1 Weak push 5 cranks
Design Number Force strength How are you transferring force? Light brightness Time light is on
1 Strong push Fast pumps of air
1 Weak push Slow pumps of air
After groups have completed their table headings, have them begin building their device according to their plans. When their device is built, have students test their device using both strong and weak contact forces. As they test their device, have students complete the table and answer the questions in the Create section of their Science Logbook (Lesson 21 Activity Guide B). Circulate as students work, and support them as needed.
Sample student response:
Design Number Force strength How are you transferring force? Light brightness Time light is on
1 Strong push Fast pumps of air bright 1 second
1 Weak push Slow pumps of air dim 0 seconds - flickering
► What works well?
▪ The light turns on!
▪ The pinwheel is spinning really fast.
Differentiation
As students build their device over the next several lessons, it may be helpful for them to fulfill particular roles within their groups. Consider assigning roles such as these and rotating student roles daily (3E):
▪ Team leader
▪ Scribe
▪ Time keeper
▪ Builders
Teacher Note
Students may find that their light flickers and does not stay on for a full second. Have students record time to the nearest half of a second. If the light stays on for less than half a second, they can write 0 seconds, flicker, or another note to capture their observations.
Level 4 ▸ Energy ▸ Lesson 23 224 © Great Minds PBC
PhD SCIENCE® TEXAS
► What needs improvement?
▪ The light doesn’t stay on for a long time.
▪ The light is pretty dim, even with a strong push.
▪ The light isn’t turning on.
► How does the electricity travel to the light?
▪ Electricity is traveling from the generator, through the wires, to the light, and then back to the generator.
▪ Energy is flowing through the aluminum foil from the pinwheel and generator to the lights.
Check for Understanding
Students create a prototype of their device and test it to see if it can change mechanical energy into light.
TEKS Assessed
4.1F Construct appropriate graphic organizers used to collect data, including tables, bar graphs, line graphs, tree maps, concept maps, Venn diagrams, flow charts or sequence maps, and input-output tables that show cause and effect.
4.1G Develop and use models to represent phenomena, objects, and processes or design a prototype for a solution to a problem.
4.2D Evaluate a design or object using criteria.
4.5B Identify and investigate cause-and-effect relationships to explain scientific phenomena or analyze problems.
4.5E Investigate how energy flows and matter cycles through systems and how matter is conserved.
4.7 Plan and conduct descriptive investigations to explore the patterns of forces such as gravity, friction, or magnetism in contact or at a distance on an object.
4.8C Demonstrate and describe how electrical energy travels in a closed path that can produce light and thermal energy.
PhD SCIENCE® TEXAS Level 4 ▸ Energy ▸ Lesson 23 © Great Minds PBC 225
Check for Understanding (continued)
Evidence
Students construct a data table (4.1F) to record the effects (4.5B) of forces of different strengths (4.7) on their device.
Next Steps
If students need support constructing a data table, prompt them with questions such as these: How can you transfer a strong push to your device? What about a weak push? What information do you want to collect about the light?
Students build a prototype of their device (4.1G) and describe the closed path required for the electrical energy (4.5E) to produce light (4.8C).
If students need support identifying the path of electrical energy through their device, prompt them with questions such as these: What happens to the light if you disconnect this wire? What about a wire on the other side of the light? Where is the source of electricity?
Students plan and conduct a descriptive investigation comparing the effects (4.5B) of forces of different strengths (4.7) on the success of their device (4.2D).
If students need support comparing the effects of contact forces of different strengths on the success of their device, have them focus on one criterion at a time, either brightness or time. Prompt them with questions such as these: How bright is the light when you use a strong force? What about when you use a weak force?
Land3 minutes
Remind students that engineers’ solutions rarely work exactly as intended the first time engineers test them. Engineers often improve their designs many times before they are satisfied with their work. Have each group evaluate their device and Think–Pair–Share ideas they have for improvements.
▪ The pinwheel keeps falling off the nail, so we are going to try taping it on.
▪ We can’t get the light to turn on, so we want to try different ways of connecting the wires.
Level 4 ▸ Energy ▸ Lesson 23 226 © Great Minds PBC
PhD SCIENCE® TEXAS
Lesson 24
Objective: Apply the engineering design process to build and improve a device that transfers and transforms energy.
Launch
2 minutes
Ask students to rejoin their engineering groups and set up their device to share with their peers. Explain that students will participate in a Gallery Walk for groups to share ideas.
Agenda
Launch (2 minutes)
Learn (40 minutes)
▪ Provide Peer Feedback (20 minutes)
▪ Improve a Solution (20 minutes) Land (3 minutes)
Learn
Differentiation
Use a Chalk Talk instead of a Gallery Walk if students would benefit from more individual processing time (3E).
40 minutes
Provide Peer Feedback
20 minutes
Have students circulate to view and try other groups’ devices, leaving feedback on sticky notes. Remind students to leave the devices as they found them. Post the following questions for students:
▪ What suggestions can we leave for this team?
▪ Does this design give us ideas for improving our design?
Students should use these questions as well as the criteria and constraints recorded in the Ask stage (Lesson 21 Activity Guide B) to guide the feedback they leave for groups.
Differentiation
As students provide feedback to their classmates on their designs, sentence frames such as these may be beneficial (3E):
▪ Can you tell us why you chose ?
▪ To help fix , try
PhD SCIENCE® TEXAS Level 4 ▸ Energy ▸ Lesson 24 © Great Minds PBC 227
► How is this design similar to and different from your design?
Model for students how to complete a Venn diagram to record their answers in the Improve section of their Science Logbook (Lesson 21 Activity Guide B). Encourage students to record similarities and differences between the materials and the function of the design.
Sample student response:
Miguel and Maya
Our Design ’s Design
Uses a pinwheel
Transfers
mechanical energy
Uses a hand crank
Creates light Stays on for 1 second Stays on as long as we turn the handle Uses wires
Improve a Solution
20 minutes
Next, have groups move back to their own device and review the feedback from other groups. Have students use the feedback to discuss new ideas they have for improvements.
Draw students’ attention to the anchor chart and anchor model. Review with students how electrical energy travels and which types of materials allow electrical energy to flow through them. Have students discuss the following questions in their groups.
Level 4 ▸ Energy ▸ Lesson 24 228 © Great Minds PBC
PhD SCIENCE® TEXAS
► What materials are you using? Which are electrical conductors? Which are insulators?
▪ We are using a paper pinwheel. Paper is an insulator. We are also using aluminum foil, which is a conductor.
▪ We are using a hand crank. It has some metal bits, but also plastic, so I think part of it is a conductor and part of it is an insulator.
► How can this information help you improve your device?
▪ We have a lot of tape attaching our aluminum foil together. Maybe tape is an insulator and that’s why the light isn’t turning on.
▪ Electrical energy needs to flow in a closed loop for the light to turn on. All the wires need to be connected, but our device is too wobbly. We need to make the supports sturdier.
Have groups use their knowledge of circuits, their test results, and the feedback from other groups to decide how they will improve their device. After groups discuss their improvements, have them answer the questions in the Improve section of their Science Logbook (Lesson 21 Activity Guide B) between the Venn diagram and the data table. Then give students time to create a new version of their device. Circulate as students work to support them as needed and ask the following questions.
► What changes are you making to your device? Why are you making those changes?
► What materials are you using to create a closed path for electrical energy to travel?
► How will you know if your design is successful?
Tell students to complete the headings on the data table in the Improve section of their Science Logbook (Lesson 21 Activity Guide B).
When they have completed the table headings, have students test their new designs and document their improvements and findings in the data table. Remind students that the engineering design process is iterative (i.e., it repeats) and that they may need to revisit another stage of the process. Encourage students to return to the Plan, Create, and Improve stages of the process until they are satisfied with their design. Explain to students that they can improve their design as many times as needed, but every time they test a new design, they should change the number they record in the first column of the data table in their Science Logbook (Lesson 21 Activity Guide B). After students finish making improvements, have them answer the final two questions in the Improve section.
Teacher Note
LEDs have a positive and a negative side, just like a battery. If students are having difficulty getting the light on their device to turn on and all the circuit components seem to be connected correctly, have students try turning the LEDs around. If students use more than one LED in their design, they will need to check each LED, one at a time.
Teacher Note
Students can copy the headings they used in the Create stage.
Differentiation
If students are looking for ways to improve their designs, consider challenging groups to add more lights to their design or to make their device shine brighter (3E).
PhD SCIENCE® TEXAS Level 4 ▸ Energy ▸ Lesson 24 © Great Minds PBC 229
Sample student responses: Design Number Force Strength Did the light turn on?
How bright is the light?
How long does the light stay on?
2 Strong Yes Dim 0 seconds (flickering)
3 Strong No N/A N/A
4 Strong Yes Bright 1.5 seconds
► Which materials in your design are conductors of electrical energy?
▪ The wires on the generator and the alligator clips
▪ The aluminum foil
► How are the parts of your design working together to create a path for energy to flow to the light?
▪ The alligator clips are attached to the generator wires and the light bulb so electricity can travel between them.
▪ The carton holds everything up so it’s sturdy and the wires stay connected. The wires are taped together so energy can flow to the light from the generator.
▪ The pinwheel is moving the nail on the generator, which generates electrical energy in the wires. The electrical energy travels through the aluminum foil to the lights.
Level 4 ▸ Energy ▸ Lesson 24 230 © Great Minds PBC
PhD SCIENCE® TEXAS
Check for Understanding
Students consider the materials in their design to improve their device so that it produces brighter light for a longer amount of time.
TEKS Assessed
4.1D Use tools, including hand lenses; metric rulers; Celsius thermometers; calculators; laser pointers; mirrors; digital scales; balances; graduated cylinders; beakers; hot plates; meter sticks; magnets; notebooks; timing devices; sieves; materials for building circuits; materials to support observation of habitats of organisms such as terrariums, aquariums, and collecting nets; and materials to support digital data collection such as computers, tablets, and cameras, to observe, measure, test, and analyze information.
4.2D Evaluate a design or object using criteria.
4.5E Investigate how energy flows and matter cycles through systems and how matter is conserved.
4.5F Explain the relationship between the structure and function of objects, organisms, and systems.
4.8B Identify conductors and insulators of thermal and electrical energy.
Evidence
Students identify electrical conductors and insulators (4.8B) in their device and use that information to improve how energy flows (4.5E) through their device (4.2D).
Next Steps
If students need support identifying materials as conductors or insulators, have them review the circuit they built in Lesson 14 or have them try closing a simple circuit with their materials to see if the materials can turn on the light.
Students use a timer to evaluate (4.1D) whether the structure of their new design (4.5F) can keep the light on for longer (4.2D).
If students need support determining whether their design is improved, have them revisit the criteria and constraints table and their testing data from the Create stage. Prompt them with questions such as these: How long could you keep the light on in the first test? How long can you keep the light on now?
PhD SCIENCE® TEXAS Level 4 ▸ Energy ▸ Lesson 24 © Great Minds PBC 231
Land
3 minutes
Ask groups to consider whether their improved device solves the problem.
► Does your device work better? How do you know?
▪ Yes! We were able to get the light to stay on for a whole second!
▪ Yes. Before we couldn’t get the light to turn on, but then we fixed our circuit and it worked!
▪ No. In our first test we got the light to flicker, but now we can’t get it to turn on at all.
Let students know that in the next lesson, they will have more time to Improve their device before they prepare a presentation about their design.
Level 4 ▸ Energy ▸ Lesson 24 232 © Great Minds PBC
PhD SCIENCE® TEXAS
Lesson 25
Objective: Apply the engineering design process to build and improve a device that transfers and transforms energy.
Launch
5 minutes
Begin the class by asking students to briefly discuss their responses to the following questions.
► Where are you in the engineering design process?
► What stages have you completed already? What stages are left?
► What is going well in your group’s process?
Explain that groups will have some time to continue improving their device. Then each group will work on a presentation for sharing their final device with the class.
Learn
Agenda
Launch (5 minutes)
Learn (38 minutes)
▪ Improve a Solution (12 minutes)
▪ Prepare to Share (26 minutes)
Land (2 minutes)
Differentiation
If students need support reflecting on the engineering design process, review Lesson 21 Activity Guide A. Ask students to identify the part of the visual that describes their current tasks. Then ask students to identify the stages they have completed and to consider what has gone well during those stages. Encourage students to include content-based vocabulary to support their responses.
38 minutes
Improve a Solution
12 minutes
Have students rejoin their engineering groups. Tell groups they should agree on a final design to present to the class. Have students finalize their device. If students need to test their device, they should record notes and test results in the Improve section of their Science Logbook (Lesson 21 Activity Guide B).
PhD SCIENCE® TEXAS Level 4 ▸ Energy ▸ Lesson 25 © Great Minds PBC 233
Prepare to Share 26 minutes
Introduce students to the presentation checklist in the Share section of their Science Logbook (Lesson 21 Activity Guide B). Review the checklist with students, and discuss questions they have about the requirements for the presentation.
Explain that scientists and engineers present their work using a variety of ways, including speeches, visual presentations, videos, websites, and published articles. Work with students to determine which methods of presentation will work given the time and resources available in the classroom.
Tell students that as part of their presentation, they will create two diagrams. The first diagram will be a detailed model of their final design. Brainstorm with students what details they should include. Decide with students that their final design diagrams should contain
▪ all materials labeled and identified as a conductor or an insulator and
▪ the path of electrical energy through the device, highlighted.
Then explain to students that they also need to create a diagram explaining how energy is transferred and transformed in their device. Work with students to generate some ideas for how they can represent this information in a graphic organizer.
Have students rejoin their engineering groups. Give groups time to create their diagrams, plan their presentations, and record notes in the Share section of their Science Logbook (Lesson 21 Activity Guide B).
Sample student responses:
Wind blows
Pinwheel turns
Nail spins
Pinwheel turns
Nail spins
Changes motion energy to electrical energy
Differentiation
If students need support completing a graphic organizer, provide them with a template of their choosing to complete, such as one of the following:
Differentiation
Some students may benefit from additional time and support to prepare for an oral presentation. Provide students with time to rehearse each part of the presentation before the whole class presentation. Consider providing students with index cards and allowing them to write notes on the cards to refer to during the presentation (3E).
Level 4 ▸ Energy ▸ Lesson 25 234 © Great Minds PBC
Force Effect causes causes
Force Effect
PhD SCIENCE® TEXAS
causes causes Hand push Crank handle to turn
Electrical energy to come out of generator
Check for Understanding
Students create a diagram of their final design and a graphic organizer to explain the transfer of mechanical energy to their device and the transformation of mechanical energy into electrical energy.
TEKS Assessed
4.1F Construct appropriate graphic organizers used to collect data, including tables, bar graphs, line graphs, tree maps, concept maps, Venn diagrams, flow charts or sequence maps, and input-output tables that show cause and effect.
4.1G Develop and use models to represent phenomena, objects, and processes or design a prototype for a solution to a problem.
4.5E Investigate how energy flows and matter cycles through systems and how matter is conserved.
4.7 Plan and conduct descriptive investigations to explore the patterns of forces such as gravity, friction, or magnetism in contact or at a distance on an object.
4.8A Investigate and identify the transfer of energy by objects in motion, waves in water, and sound.
4.8B Identify conductors and insulators of thermal and electrical energy.
4.8C Demonstrate and describe how electrical energy travels in a closed path that can produce light and thermal energy.
PhD SCIENCE® TEXAS Level 4 ▸ Energy ▸ Lesson 25 © Great Minds PBC 235
Check for Understanding (continued)
Evidence
Students create a final model (4.1G) that shows the path of electrical energy as it flows through (4.5E) their device to produce light (4.8C) and indicates materials that are insulators and conductors of electrical energy (4.8B).
Students construct a graphic organizer (4.1F) to describe the forces affecting their device (4.7), the transfer of mechanical energy to their device, and the transformation of mechanical energy into electrical energy in their device (4.5E, 4.8A).
Next Steps
If students need support creating their model, consider having them use another group’s model to follow the flow of energy through the device. Students can use their diagrams from Lesson 22 to review which materials are conductors and insulators of electrical energy. If students need support identifying how one force causes another force, prompt them with questions such as these: What causes the generator to move? Where is that mechanical energy coming from?
2 minutes
Remind students that during the next lesson, their groups will be presenting their designs to the class. Ask students to determine how each group member will contribute to the presentation.
Level 4 ▸ Energy ▸ Lesson 25 236 © Great Minds PBC
Land
PhD SCIENCE® TEXAS
Lesson 26
Objective: Apply the engineering design process to build and improve a device that transfers and transforms energy.
Launch
2 minutes
Allow groups a few minutes to finalize their presentations.
Agenda
Launch (2 minutes)
Learn (38 minutes)
▪ Share a Solution (38 minutes)
Land (5 minutes)
38 minutes
Share a Solution
38 minutes
Gather the class for the presentations. Tell students to listen to each group’s presentation, and encourage students to ask questions from their Science Logbook (Lesson 26 Activity Guide A) during the presentations.
Allow groups to share their diagrams and demonstrate their devices during their presentations. After each presentation, instruct students to write one piece of feedback on a sticky note or a half sheet of paper. Clarify that the feedback should at a minimum identify one strength or one idea for improvement for that group’s presentation.
Collect student feedback before the next group presents. Review the feedback, and after all groups have presented, distribute the appropriate feedback to each group to review.
Teacher Note
Lesson 26 Activity Guide A helps promote student engagement. Students may use the questions provided or questions of their own. Students are not required to write their questions before asking them.
Differentiation
If students need support to write feedback, prompt them to use the list of questions in their Science Logbook (Lesson 26 Activity Guide A) for guidance. Consider providing sentence starters such as these:
▪ I liked how you explained .
▪ I thought you could have said more about
PhD SCIENCE® TEXAS Level 4 ▸ Energy ▸ Lesson 26 © Great Minds PBC 237
Learn
Check for Understanding
Students use their model and diagrams to explain how their devices work to produce light. Students listen to others’ explanations and provide feedback to their peers.
TEKS Assessed
4.3A Develop explanations and propose solutions supported by data and models.
4.3C Listen actively to others’ explanations to identify relevant evidence and engage respectfully in scientific discussion.
4.5E Investigate how energy flows and matter cycles through systems and how matter is conserved.
4.7 Plan and conduct descriptive investigations to explore the patterns of forces such as gravity, friction, or magnetism in contact or at a distance on an object.
4.8A , waves in water, and sound. Investigate and identify the transfer of energy by objects in motion
4.8B Identify conductors and insulators of thermal and electrical energy.
4.8C Demonstrate and describe how electrical energy travels in a closed path that can produce light and thermal energy.
4.11A Identify and explain advantages and disadvantages of using Earth’s renewable and nonrenewable natural resources such as wind, water, sunlight, plants, animals, coal, oil, and natural gas.
Evidence
Students use their final diagram, graphic organizer, data table, and prototype to communicate (4.3A) which materials are insulators and conductors of electrical energy (4.8B), as well as how their device uses forces (4.7), transfers energy (4.8A), and transforms electrical energy into light (4.5E, 4.8C). Students also explain the advantages of using renewable resources in their design (4.11A).
Students listen to their peers’ explanations of their designs and provide feedback related to strengths and opportunities for improving those designs (4.3C).
Next Steps
To support students as they explain how their devices work, have students use the presentation checklist in the Share section of their Science Logbook (Lesson 21 Activity Guide B). As needed, prompt students to use their diagram, graphic organizer, or prototype to explain information from the checklist.
If students need support to provide feedback, review with them the presentation checklist in the Share section of their Science Logbook (Lesson 21 Activity Guide B).
Level 4 ▸ Energy ▸ Lesson 26 238 © Great Minds PBC
PhD SCIENCE® TEXAS
Have students create a Venn diagram, comparing their design with at least one other group’s design (Lesson 26 Activity Guide B).
Sample student response:
Our Design Other Designs Some groups used hand cranks. Used wires
Used a pinwheel
Used one LED
We used our generator from before.
Made light
Transferred and transformed energy
Some groups used a lot of LEDs. Some groups used only snap circuits. Used multiple parts together
Solved a problem
Invite students to share what was the same and what was different about the devices they compared. Use student responses to discuss how there can be many ways to solve the same problem. Finally, have students reflect on their knowledge and participation by using the checklists in their Science Logbook (Lesson 26 Activity Guide B).
5 minutes
Revisit the Phenomenon Question How can we apply our knowledge of energy to solve a problem? Ask students to reflect on this question and the engineering design process.
PhD SCIENCE® TEXAS Level 4 ▸ Energy ▸ Lesson 26 © Great Minds PBC 239
Land
► How did you apply your knowledge of energy to solve a problem?
▪ People needed to see in their houses during a power outage, so we used what we learned in class about windmills to transform energy from wind into light, like William did.
▪ We built a device that transfers and transforms energy.
► What knowledge about energy was most useful in designing your device?
▪ Learning about different energy transformations helped us. We knew we could use one energy source and change it to produce light.
▪ Knowing that energy is transferred in different ways allowed us to connect our device so that energy moved from one place to another.
Explain that students will summarize their understanding of the Essential Question, How do windmills change wind to light?, and apply this new knowledge in an End-of-Module Assessment in subsequent lessons.
Optional Homework
Students find examples of other technologies that solve a problem by using the transfer or transformation of mechanical energy, and they create a graphic organizer to explain the energy transfer or transformation in that device. Some example technologies include a coffee grinder, pencil sharpener, can opener, or electric fan.
Spotlight on Knowledge and Skills
Help students reflect on the relationship between science, engineering, and technology. Engineers apply relevant scientific knowledge to improve or develop technologies that solve problems in society (4.4A).
Level 4 ▸ Energy ▸ Lesson 26 240 © Great Minds PBC
PhD SCIENCE® TEXAS
Lessons 27–29 Windmills at Work Prepare
In Lessons 27 through 29, students synthesize their learning from throughout the module and articulate their understanding of energy in a Socratic Seminar and End-of-Module Assessment. In Lesson 27, students discuss the Essential Question in a Socratic Seminar and capture their thoughts in writing. They briefly revisit the driving question board to reflect on their progress and then individually complete the End-of-Module Assessment in Lesson 28. During the End-of-Module Assessment, students apply their knowledge of patterns and systems to construct explanations about energy, how it transfers from place to place, and how it transforms. In this module’s culminating lesson, Lesson 29, students debrief the assessment and look ahead to the next module.
Student Learning
Knowledge Statement
In a system, specific indicators of energy can be produced through energy transfers and transformations.
Application of Concepts
Tasks
Socratic Seminar
End-of-Module Assessment
Phenomenon Question
How do windmills change wind to light? (Essential Question)
PhD SCIENCE® TEXAS Level 4 ▸ Energy ▸ Lessons 27–29 © Great Minds PBC 241
Objectives
▪ Lesson 27: Explain changes in a system as the transfer and transformation of energy. (Socratic Seminar)
▪ Lesson 28: Explain changes in a system as the transfer and transformation of energy. (End-of-Module Assessment)
▪ Lesson 29: Explain changes in a system as the transfer and transformation of energy. (End-of-Module Assessment Debrief)
Standards Addressed*
Texas Essential Knowledge and Skills
Content Standards
Plan and conduct descriptive investigations to explore the patterns of forces such as gravity, friction, or magnetism in contact or at a distance on an object. (Mastered)
29 4.8A Investigate and identify the transfer of energy by objects in motion, waves in water, and sound. (Mastered)
Identify conductors and insulators of thermal and electrical energy. (Mastered)
Demonstrate and describe how electrical energy travels in a closed path that can produce light and thermal energy. (Mastered)
28, 29
28, 29
* Students may apply these standards in instructional activities or in the End-of-Module Assessment. See the End-of-Module Assessment rubric for specific standards the assessment addresses.
Level 4 ▸ Energy ▸ Lessons 27–29 242 © Great Minds PBC
Standard Student Expectation Lesson(s)
27,
27,
27,
27,
4.7
28,
4.8B
4.8C
28, 29
PhD SCIENCE® TEXAS
Scientific and Engineering Practices
Recurring Themes and Concepts
English Language Proficiency Standards
PhD SCIENCE® TEXAS Level 4 ▸ Energy ▸ Lessons 27–29 © Great Minds PBC 243
Standard Student Expectation Lesson(s) 4.1G Develop and use models to represent phenomena, objects, and processes or design a prototype for a solution to a problem. 28 4.2B Analyze data by identifying any significant features, patterns, or sources of error. 28 4.3A Develop explanations and propose solutions supported by data and models. 27, 28 4.3B Communicate explanations and solutions individually and collaboratively in a variety of settings and formats. 27, 28 4.3C Listen actively to others’ explanations to identify relevant evidence and engage respectfully in scientific discussion. 27
Standard Student Expectation Lesson(s) 4.5A Identify and use patterns to explain scientific phenomena or to design solutions. 27, 28 4.5B Identify and investigate cause-and-effect relationships to explain scientific phenomena or analyze problems. 28 4.5D Examine and model the parts of a system and their interdependence in the function of the system. 28 4.5E Investigate how energy flows and matter cycles through systems and how matter is conserved. 27, 28
Standard Student Expectation Lesson(s) 3F Ask and give information ranging from using a very limited bank of high-frequency, high-need, concrete vocabulary, including key words and expressions needed for basic communication in academic and social contexts, to using abstract and content-based vocabulary during extended speaking assignments. 27
Level 4 ▸ Energy ▸ Lessons 27–29 244 © Great Minds PBC Materials Student Materials Lesson(s) Science Logbook (Lesson 27 Activity Guides A, B, and C) 27 End-of-Module Assessment 28 End-of-Module Assessment Rubric 29 Sticky notes (3 per student) 29 Sample of End-of-Module Assessment responses that meet expectations (either sample responses from Teacher Edition or samples from class) 29 Teacher Materials Lesson(s) Module Concept Statements (Lesson 29 Resource A) 29 Recurring Themes and Concepts (Lesson 29 Resource B) 29 Teacher Preparation Lesson(s) Cue video “How Plug-In Vehicles Work” (EPA 2014) (http://phdsci.link/2445) 28 Score End-of-Module Assessments and write individual feedback. 29 Select End-of-Module Assessment responses to share with students. 29 Prepare visual for student connections between module learning and content standards. (See Lesson 29 Resources A and B.) 29 PhD SCIENCE® TEXAS
Lesson 27
Objective: Explain changes in a system as the transfer and transformation of energy. (Socratic Seminar)
Agenda
Launch (7 minutes)
Learn (33 minutes)
▪ Prepare for Socratic Seminar (8 minutes)
▪ Engage in Socratic Seminar (25 minutes)
Land (5 minutes)
Launch
7 minutes
Students make a relationship map to show connections among key terms learned throughout the module. To start the map, they cut out the key terms in their Science Logbook (Lesson 27 Activity Guide A). Individually, students arrange the terms in their Science Logbook to show the term relationships. They can draw arrows or other symbols and write words between the terms to express the relationships. After students organize the map, they can glue the terms in place.
Learn
33 minutes
Prepare for Socratic Seminar 8 minutes
Tell students they will share their understanding of the Essential Question with one another through a Socratic Seminar discussion. First, students write an initial response to the Essential Question: How do windmills change wind to light? in their Science Logbook (Lesson 27 Activity Guide B) as a Quick Write. When students finish, ask them to draw a line below their response. At the end of the seminar, students will revisit this response to see how their thoughts have changed.
Content Area Connection: English
This Socratic Seminar allows students to use their speaking and listening skills to express and deepen their science content knowledge. In a Socratic Seminar, students prepare for and participate in a collaborative, evidence-based, academic conversation. See the Socratic Seminar resource in the Implementation Guide for more background (3F).
In this discussion, students should work toward grade-level expectations for speaking and listening.
PhD SCIENCE® TEXAS Level 4 ▸ Energy ▸ Lesson 27 © Great Minds PBC 245
Engage in Socratic Seminar 25 minutes
As needed, review the routines and expectations for participating effectively in a Socratic Seminar, including classroom guidelines and resources for speaking and listening. Have students review the collaborative conversation strategies in their Science Logbook (Lesson 27 Activity Guide C). Explain that this resource reminds students of different ways they can participate in a collaborative conversation and provides sentence frames to support student participation. Instruct students to choose one or two conversation strategies to use as a visual reminder of effective ways to contribute to the discussion and to cut out or circle those strategies as a visual reminder.
Remind students that during the seminar they should incorporate science terminology learned during the module. Students can refer to their relationship map from this lesson’s Launch, the anchor chart, the anchor model, and other classroom resources to support their discussion.
Display and read aloud the Essential Question to prompt the discussion: How do windmills change wind to light?
Students discuss the question. In the Socratic Seminar, students respond to one another directly, with minimal teacher facilitation. Students can remind one another of conversation norms, ask for evidence, and pose questions to extend the conversation.
As needed, step in briefly to reinforce norms for collaborative conversations. Consider posing one or two of the following questions midway through the seminar to spur additional conversation.
► How is William’s windmill similar to and different from the other windmills we saw in photographs and paintings?
► How could a windmill work on days with little wind?
► How might different forces affect the motion of a windmill and the energy it produces?
► What phenomena have you experienced that can be explained through energy transfers and transformations?
► How could the use of insulators and conductors affect energy transfers occurring in a system like a windmill?
English Language Development
English learners may benefit from having a word bank available to use as they participate in the Socratic Seminar discussion. Include words and phrases such as energy transfer, transform, windmill, generate, wind, speed, indicators of energy (i.e., sound, light, and motion), collision, and electricity (3F).
Level 4 ▸ Energy ▸ Lesson 27 246 © Great Minds PBC
PhD SCIENCE® TEXAS
Check for Understanding
As students engage in the Socratic Seminar, take notes on their participation, content knowledge, and use of scientific language. To monitor student participation and the flow of the conversation, consider writing each student’s name around the edge of a piece of paper before the lesson and drawing lines between speakers during the conversation.
TEKS Assessed
4.3C Listen actively to others’ explanations to identify relevant evidence and engage respectfully in scientific discussion.
4.7 Plan and conduct descriptive investigations to explore the patterns of forces such as gravity, friction, or magnetism in contact or at a distance on an object.
4.8A Investigate and identify the transfer of energy by objects in motion, waves in water, and sound.
4.8B Identify conductors and insulators of thermal and electrical energy.
4.8C Demonstrate and describe how electrical energy travels in a closed path that can produce light and thermal energy.
Evidence
Listen for evidence that students
▪ actively listen and engage in discussion of relevant evidence and explanations (4.3C);
▪ describe how patterns of forces acting on a system affect changes in energy (4.7);
▪ identify different types of energy transfers occurring in systems (4.8A);
▪ distinguish energy flow between types of materials that make up conductors and insulators (4.8B); and
▪ describe energy transformation processes as occurring in a closed path system (4.8C).
Next Steps
If students express misconceptions about energy, meet with them individually or in a small group before the End-of-Module Assessment. Provide additional hands-on investigation of phenomena related to their misunderstanding, and help students use precise language to construct explanations of those phenomena.
PhD SCIENCE® TEXAS Level 4 ▸ Energy ▸ Lesson 27 © Great Minds PBC 247
Land5 minutes
Students reread their Quick Write from the beginning of the lesson. Below the line, they summarize how the Socratic Seminar reinforced or changed their thinking. Encourage students to share examples of how their thinking evolved during the discussion.
Explain that in the next lesson students will apply their understanding of energy in an End-of-Module Assessment.
Level 4 ▸ Energy ▸ Lesson 27 248 © Great Minds PBC
PhD SCIENCE® TEXAS
Lesson 28
Objective: Explain changes in a system as the transfer and transformation of energy. (End-of-Module Assessment)
Agenda
Launch (8 minutes)
Learn (35 minutes)
▪ Prepare for the End-of-Module Assessment (7 minutes)
▪ Complete the End-of-Module Assessment (28 minutes)
Land (2 minutes)
Launch
8 minutes
Teacher Note
In this lesson, students take an End-of-Module Assessment that assesses standards addressed throughout the Energy Module. All standards are summatively assessed throughout the grade level in Conceptual Checkpoints, Engineering and Science Challenges, and End-of-Module and End-of-Spotlight Assessments. For additional evidence of student understanding of the content standards, scientific and engineering practices, and recurring themes and concepts, assign Benchmark 1 found in the Assessment Pack and in the digital platform. This assessment includes items related to standards addressed in the Earth Features Module, Spotlight Lessons on Mixtures and Solutions, and the Energy Module.
Demonstrate an example of energy transfers or transformations for students: turn the classroom lights off and on, slide a textbook across a table, or flip a water bottle in the air. Ask students to Think–Pair–Share to discuss the following prompts.
► How do you think people without an understanding of energy would describe what happened?
▪ The textbook moved because you used your arm to push it.
▪ The light switch turned the lights on.
▪ The water bottle flipped because you threw it in the air.
PhD SCIENCE® TEXAS Level 4 ▸ Energy ▸ Lesson 28 © Great Minds PBC 249
► Using what you know now about energy, describe what happened.
▪ When you pushed the book, energy from your arm transferred to the book because I saw it slide across the table. The energy from the contact force between your arm and the book transferred mechanical energy from your moving arm to the book, causing it to move.
▪ When you flipped the light switch, you caused electrical energy to travel through a wire and to the light bulb. The light bulb transforms electrical energy into light energy.
▪ When you flipped the water bottle, you transferred the mechanical energy from your hand to the bottle, and you transformed some of the energy into sound energy.
Return to the driving question board, and ask students to share reflections on how their understanding of energy has grown since applying what they have learned in this module.
Teacher Note
Display the driving question board with the anchor chart and anchor model to help students make connections. Ask students to share any new questions that might lead to future investigations.
Extension
Students can research or investigate these questions independently at work stations or as optional homework.
35 minutes
Prepare for the End-of-Module Assessment
7 minutes
Tell students they will complete an End-of-Module Assessment to apply their learning to a new context: the energy technology used for hybrid electric cars. Explain that like traditional, gasoline-using cars, hybrid cars have systems that work together to provide energy for a car and its functions. Both types of cars produce and use energy in many forms, including electrical, mechanical, sound, light, and thermal energy.
► What are some functions, or systems, in a car that need energy to work?
▪ Cars need energy to make them move. If they don’t turn on, they won’t move.
▪ The air conditioning in a car needs energy to cool the inside of a car.
▪ Nothing in a car will work if the car isn’t turned on and running.
▪ I think the radio and headlights need energy coming from somewhere.
Level 4 ▸ Energy ▸ Lesson 28 250 © Great Minds PBC
Learn
PhD SCIENCE® TEXAS
Confirm for students that both traditional and hybrid cars contain many different systems that rely on energy to function and work. Tell students that in a traditional car, most of these functions get energy from an engine that uses gasoline as its energy source. Hybrid cars, on the other hand, can use gasoline but also can use electrical energy.
Play the video “How Plug-In Vehicles Work” (EPA 2014) (http://phdsci.link/2445). Ask students to identify how hybrid electric cars differ from traditional, gasoline-using cars.
► What do you notice about a hybrid electric car that seems to be different from a traditional, gasoline-using car?
▪ Hybrid cars have a battery that gives energy to the electric motor.
▪ Even though hybrid cars have a gas tank, they only use it when the battery doesn’t have enough energy to work.
▪ It seems like a hybrid car would use less gasoline than a regular car, since hybrids use the battery first before switching to gasoline.
▪ Hybrid cars have an electric motor. Is this different from what’s in a gasoline-using car?
Highlight student responses that identify that hybrid cars use less gasoline than traditional cars. Explain that an electric motor is unique to a hybrid car and is not part of traditional, gasoline-using cars. Explain that the electric motor works with the battery to provide electrical energy to support most of the functions and systems in a hybrid car, but that gasoline may be used as a backup energy source for this system.
Tell students that traditional, gasoline-using cars also have batteries, but that these batteries are much smaller than those in hybrid cars.
► Why do you think a traditional car has a smaller battery than a hybrid car?
▪ Hybrid cars probably need a bigger battery because they don’t use as much gas for energy.
▪ Regular cars probably don’t have room for a big battery because they need so much gas.
▪ Maybe regular cars just use batteries for some functions, but not everything.
Teacher Note
The video uses the term plug-in hybrid electric vehicles (PHEVs) to refer to what are more commonly called hybrid electric cars, or hybrid cars. As needed, clarify for students that these terms are names for the same type of car. All hybrids rely on the same technologies for energy production and use.
PhD SCIENCE® TEXAS Level 4 ▸ Energy ▸ Lesson 28 © Great Minds PBC 251
Confirm for students that traditional cars rely on energy from a battery to start the engine and supply some functions, but they do not use energy from the battery to move the car while driving. In contrast, batteries are the primary energy source for hybrid cars. The batteries in hybrid cars are larger to store the energy to operate all the car’s systems. Hybrid car brake systems have also been engineered to reclaim some of a car’s mechanical energy by transforming it to electrical energy and storing it in the battery.
► What questions do you have about hybrid cars?
▪ How much energy can be produced by a battery in a hybrid car?
▪ How does a hybrid car know when to switch from using a battery to using gas for energy?
▪ Are there hybrid cars that do not have to be plugged in?
Tell students that they will investigate some of these questions as they complete the End-of-Module Assessment.
Complete the End-of-Module Assessment
2
8 minutes
Prepare students for the End-of-Module Assessment by explaining that the assessment is a way for them to show all the knowledge they have developed through their study of energy. Remind students to provide detailed explanations and to use the resources posted in the room if needed.
Distribute the End-of-Module Assessment. Read aloud the assessment items. Students complete the End-of-Module Assessment individually. Throughout the assessment, remind students to provide complete responses. If needed, provide additional time for students to finish.
Differentiation
Provide an audio recording of the assessment items for students who need additional reading support.
Level 4 ▸ Energy ▸ Lesson 28 252 © Great Minds PBC
PhD SCIENCE® TEXAS
Teacher Note
To prepare for the next lesson, review End-of-Module Assessment responses to provide rubric scores and actionable feedback to students on a separate page from the assessment. (See the rubric and sample responses in the End-of-Module Assessment section of this book.) In the next lesson, students review their own assessment responses and then the teacher feedback. Also, select an exemplar student response for each question to share with students, or plan to share the sample student responses provided in the Teacher Edition. If selecting student responses, remember to remove identifying information and to select diverse student responses.
When providing feedback, be sure to guide students to focus on specific areas of improvement to deepen their understanding of module concepts. For students who need remediation, offer opportunities to revisit portions of the module.
2 minutes
Tell students that in the next lesson, they will share their thinking about the End-of-Module Assessment questions.
PhD SCIENCE® TEXAS Level 4 ▸ Energy ▸ Lesson 28 © Great Minds PBC 253
Land
Lesson 29
Objective: Explain changes in a system as the transfer and transformation of energy. (End-of-Module Assessment Debrief)
Agenda
Launch (8 minutes)
Learn (27 minutes)
▪ Debrief the End-of-Module Assessment (17 minutes)
▪ Revise End-of-Module Assessment Responses (10 minutes)
Land (10 minutes)
Launch
8 minutes
Explain that in this lesson, students will review the End-of-Module Assessment, discuss responses, and then have an opportunity to revise their answers. First, they will review the assessment rubric and assess their own responses to begin reflecting on their learning.
Share the End-of-Module Assessment rubric with students and distribute their individual responses (without teacher feedback, if possible). Students reflect on their own responses, recording their self-assessment feedback on their copy of the rubric.
Next, distribute written teacher feedback on students’ End-of-Module Assessments. Students review the teacher feedback of their own responses independently and write on sticky notes any questions they want to discuss with the class. Students post their questions, either anonymously or with their names. Quickly review students’ questions as they post them and plan which questions to discuss first.
Level 4 ▸ Energy ▸ Lesson 29 254 © Great Minds PBC
PhD SCIENCE® TEXAS
Learn
27 minutes
Debrief the End-of-Module Assessment 17 minutes
Distribute copies of sample responses that meet expectations, one response per assessment item. Students compare the sample responses to the rubric criteria and annotate those responses with the evidence of each rubric criterion they demonstrate.
Discuss each assessment item, posing relevant student questions from the Launch. Provide sentence frames such as the following to encourage all students to participate in the discussion:
▪ In the sample response, I notice
▪ That makes me wonder .
▪ That makes me realize .
▪ I thought . How does that relate to ?
▪ I would add because .
Discuss the remaining student questions. As needed, encourage students to review their Science Logbook, the anchor model, the anchor chart, and other resources for evidence during the discussion.
Revise End-of-Module Assessment Responses 10 minutes
Students revise their End-of-Module Assessment responses by using a different color pen or pencil, applying new ideas from the debrief conversation to deepen their responses.
Land
10 minutes
Display the Module Concept Statements (Lesson 29 Resource A) one at a time. Explain that each sentence states a key idea that students learned and summarizes one section of the anchor chart.
Teacher Note
Depending on school and classroom guidelines and routines, decide whether to score and provide feedback on these revised responses.
Teacher Note
Point out the connection between these statements and the key details of a text. Display the following sentence as an example of the module’s “main idea,” which the key details support: Energy can neither be created nor destroyed, but it can be transferred and transformed to be more useful.
As an alternative to reading the concept statements from Lesson 29 Resource A, students can practice summarizing by writing their own sentence to summarize each section of the anchor chart.
PhD SCIENCE® TEXAS Level 4 ▸ Energy ▸ Lesson 29 © Great Minds PBC 255
Display the anchor chart for students to refer to. Display and read aloud one concept statement and ask students to identify the section of the anchor chart to which the statement is most related. Students can indicate their responses by pointing to the relevant section of the anchor chart or writing that section’s heading on individual whiteboards.
Sample student responses:
▪ Energy Classification and Transfer: Energy is why things happen. Energy can transfer between objects through collisions and from place to place through water waves, electric currents, sound, thermal energy, and light.
▪ Energy Transformation: Energy transformation occurs when one phenomenon indicating the presence of energy changes into any other energy phenomenon.
As needed, students should discuss each statement to understand its meaning.
Display all the module concept statements on a visual, alongside the module’s Recurring Themes and Concepts (Lesson 29 Resource B). Introduce these Recurring Themes and Concepts as understandings that provide a link between scientific ideas. Referencing the visual, ask students to relate each of the displayed Recurring Themes and Concepts to relevant statements. As students discuss the following questions, indicate these connections visually, either through layering connections onto students’ prior terminology concept maps or by creating a visual of the module’s enduring knowledge. See the sample visual that follows these questions.
► How do these statements relate to cause and effect?
▪ Both of the statements include energy changes. When energy transforms, this causes changes in indicators of energy that can be observed in a system.
▪ Collisions cause the transfer of energy from one object to another.
► How do these statements relate to systems and system models?
▪ Energy transfer and energy transformation both can happen as energy moves through a system. We can represent these systems with models in the classroom.
▪ Indicators of energy and changes in energy can be observed in system models.
Teacher Note
This lesson highlights several Recurring Themes and Concepts because these concepts help explain the content that students study in this module. Connections to other Recurring Themes and Concepts can be highlighted in the discussion as they naturally appear.
Level 4 ▸ Energy ▸ Lesson 29 256 © Great Minds PBC
PhD SCIENCE® TEXAS
► How do these statements relate to patterns?
▪ Collisions and water waves transfer energy from one place to another in patterns that we can predict and observe.
▪ Energy change can occur in patterns, especially in systems that have circuits where energy flows from one object to another in closed loops.
Sample visual: Teacher Note
Energy is why things happen. Energy can transfer between objects through collisions and from place to place through water waves, electric currents, sound, thermal energy, and light.
Energy transformation occurs when one phenomenon indicating the presence of energy changes into any other energy phenomenon.
This visual can be created for each individual module, or subsequent module concept statements and Recurring Themes and Concepts can be layered onto this visual to create a yearlong visual that captures the enduring knowledge from all modules. The style of this visual will vary greatly from classroom to classroom due to teacher preferences and the fact that the visual is student-generated.
After discussing connections, students should continue to reflect on their learning and consider how it has grown over the module. Ask questions such as the following, and have student volunteers share with the class their answer to each question:
PhD SCIENCE® TEXAS Level 4 ▸ Energy ▸ Lesson 29 © Great Minds PBC 257
Patterns Systems Cause and Effect Energy and Matter
► What do you notice about the connections? Why do the connections between the Recurring Themes and Concepts and our module concept statements matter?
► What do you hope to learn next to deepen your understanding?
Optional Homework
Students compose a short message about energy to share with their family or community.
Level 4 ▸ Energy ▸ Lesson 29 258 © Great Minds PBC
PhD SCIENCE® TEXAS
Student End-of-Module Assessment, Sample Responses, and Rubric
© Great Minds PBC 259
Date: LEVEL 4 MODULE 2: ENERGY
Name:
End-of-Module Assessment
1. Observe the model. Transfer of Energy in a Car
Battery Driver pushesaccelerator pedal. No push onaccelerator pedal
Wheels move faster. Wheels do not move.
a. Circle a word that describes how the accelerator pedal changes the flow of energy in the system.
Pushing the accelerator pedal increases / decreases the energy flowing to the wheels of the car.
Level 4 ▸ Energy ▸ End-of-Module Assessment PhD SCIENCE® TEXAS 260 © Great Minds PBC This page may be reproduced for classroom use only.
Energy Energy Electric motor
b. The accelerator causes the car to move. Friction is a force that changes the motion of an object. Friction occurs between the tire of a moving car and the road.
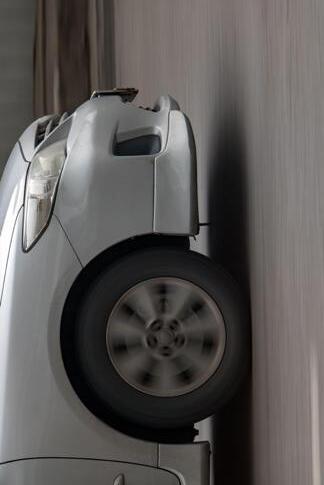
Circle how friction changes the movement of a car.
▪ Friction causes a car to speed up.
▪ Friction does not change the speed of a car.
▪ Friction causes a car to slow down and then stop.
PhD SCIENCE® TEXAS Level 4 ▸ Energy ▸ End-of-Module Assessment © Great Minds PBC 261 This page may be reproduced for classroom use only.
2. The diagram shows how a battery in a hybrid car connects and provides power to different components of the system.
a. Use a highlighter to trace the flow of energy between the battery and the headlights of a car.
b. Use the diagram to explain how energy is transformed as it flows from the battery to the headlights.
3. The battery transfers energy to the car heater through metal wires. The heat produced in the car heater is what type of energy?
▪ Light energy
Thermal energy
▪
Mechanical energy
Electrical energy ▪
Level 4 ▸ Energy ▸ End-of-Module Assessment 262 © Great Minds PBC
Electric motor Engine Headlights Gas tank Battery Wires
▪
This page may be reproduced for classroom use only. PhD SCIENCE® TEXAS
4. Hybrid car batteries have insulating materials and cooling systems to keep the batteries from overheating during charging. The table shows materials that make up batteries of hybrid cars.
a. In the table, circle two materials that are thermal insulators.
b. Use evidence fr om the table to explain how thermal insulators affect the flow of thermal energy to the
PhD SCIENCE® TEXAS Level 4 ▸ Energy ▸ End-of-Module Assessment © Great Minds PBC 263 This page may be reproduced for classroom use only.
Material Metal or Nonmetal Easily Transfers Thermal Energy Silicone polymer Nonmetal No Magnesium Metal Yes Polyimide foam Nonmetal No Copper
Metal Yes
tin
battery.
PhD SCIENCE® TEXAS
Name: Sample
Date: LEVEL 4 MODULE 2: ENERGY
1. Observe the model. Transfer of Energy in a Car
Battery Driver pushesaccelerator pedal. No push onaccelerator pedal Energy Electric motor
a. Circle a word that describes how the accelerator pedal changes the flow of energy in the system.
Pushing the accelerator pedal increases / decreases the energy flowing to the wheels of the car.
Level 4 ▸ Energy ▸ End-of-Module Assessment 264 © Great Minds PBC
End-of-Module Assessment
Wheels move faster. Wheels do not move. Energy
b. The accelerator causes the car to move. Friction is a force that changes the motion of an object. Friction occurs between the tire of a moving car and the road.
Circle how friction changes the movement of a car.
▪ Friction causes a car to speed up.
▪ Friction does not change the speed of a car.
▪ Friction causes a car to slow down and then stop.
PhD SCIENCE® TEXAS Level 4 ▸ Energy ▸ End-of-Module Assessment © Great Minds PBC 265
2. The diagram shows how a battery in a hybrid car connects and provides power to different components of the system.
a. Use a highlighter to trace the flow of energy between the battery and the headlights of a car.
b. Use the diagram to explain how energy is transformed as it flows from the battery to the headlights. Energy from the battery must flow first to the electric motor, then to the engine, and then to the headlights. Batteries produce electrical energy, and when it gets to the headlights, the electrical energy is transformed into light energy.
3. The battery transfers energy to the car heater through metal wires. The heat produced in the car heater is what type of energy?
▪ Light energy
▪ Thermal energy
▪ Electrical energy
▪ Mechanical energy
Level 4 ▸ Energy ▸ End-of-Module Assessment 266 © Great Minds PBC
Electric motor Engine Headlights Gas tank Battery Wires
PhD SCIENCE® TEXAS
4. Hybrid car batteries have insulating materials and cooling systems to keep the batteries from overheating during charging. The table shows materials that make up batteries of hybrid cars.
a. In the table, circle two materials that are thermal insulators.
b. Use evidence fr om the table to explain how thermal insulators affect the flow of thermal energy to the battery. The silicone polymer and polyimide foam are insulators. They are nonmetal so they would slow or stop the flow of thermal energy to the battery, keeping it from getting too hot.
PhD SCIENCE® TEXAS Level 4 ▸ Energy ▸ End-of-Module Assessment © Great Minds PBC 267
Material Metal or Nonmetal Easily Transfers Thermal Energy Silicone polymer Nonmetal No Magnesium Metal Yes Polyimide foam Nonmetal No Copper
Metal Yes
tin
LEVEL 4 MODULE 2: ENERGY
End-of-Module Assessment Rubric
Score each student’s End-of-Module Assessment. The rubric describes evidence of student work that meets expectations. Use the blank spaces as needed to record evidence of student work that exceeds or falls below expectations. Name:
Date:
The student uses evidence from a model (4.1G) to identify that pushing an accelerator pedal increases energy flow in the system (4.5D), between the battery and the wheels, causing movement (4.8A).
The student identifies that friction between a tire and the road (4.7) causes the movement of a car to slow down and stop (4.5B).
The student develops a model (4.1G) by tracing a path to show the flow of electrical energy from the battery to the headlights, where light energy is produced (4.8C) in a hybrid car (4.5E).
Level 4 ▸ Energy ▸ End-of-Module Assessment Rubric 268 © Great Minds PBC
Item TEKS Assessed 1 Does Not Yet Meet Expectations Incorrect or unreasonable response with no detail or evidence 2 Approaches Expectations Incorrect or unreasonable response with some detail or evidence OR Correct or reasonable response with insufficient detail or evidence 3 Meets Expectations
or reasonable response with sufficient detail or evidence 4 Exceeds Expectations
or reasonable response with more than sufficient detail or evidence Score 1a 4.1G 4.5D 4.8A
Correct
Correct
1b 4.5B 4.7
2a 4.1G 4.5E 4.8C
This page may be reproduced for classroom use only. PhD SCIENCE® TEXAS
The student explains (4.3A) the flow of energy in a system (4.5E) by describing how electrical energy from the battery can transform to produce light energy in the headlights of a car (4.8C).
The student uses patterns (4.5A) to explain (4.3A) that the heat produced in the heater is thermal energy (4.8C).
The student analyzes the data (4.2B) to identify silicone polymer and polyimide foam materials as thermal insulators (4.8B).
The student uses evidence from data to explain (4.3A) how thermal insulators (4.8B) slow or stop the transfer of thermal energy from the engine to the battery (4.5B).
PhD SCIENCE® TEXAS Level 4 ▸ Energy ▸ End-of-Module Assessment Rubric © Great Minds PBC 269 This page may be reproduced for classroom use only. Item TEKS Assessed 1 Does Not Yet Meet Expectations Incorrect or unreasonable response with no detail or evidence 2 Approaches Expectations Incorrect or unreasonable response with some detail or evidence OR Correct or reasonable response with insufficient detail or evidence 3 Meets Expectations Correct or reasonable response with sufficient detail or evidence 4 Exceeds Expectations Correct or reasonable response with more than sufficient detail or evidence Score 2b 4.3A 4.5E 4.8C
3 4.3A 4.5A 4.8C
4a 4.2B 4.8B
4b 4.3A 4.5B 4.8B
End-of-Module Assessment Alignment Map
For teacher reference, this alignment map lists the Texas Essential Knowledge and Skills assessed by each item in the End-of-Module Assessment.
1a ▪ 4.8A Investigate and identify the transfer of energy by objects in motion, waves in water, and sound.
1b ▪ 4.7 Plan and conduct descriptive investigations to explore the patterns of forces such as gravity, friction, or magnetism in contact or at a distance on an object.
2a ▪ 4.8C Demonstrate and describe how electrical energy travels in a closed path that can produce light and thermal energy.
2b ▪ 4.8C Demonstrate and describe how electrical energy travels in a closed path that can produce light and thermal energy.
3
▪ 4.8C Demonstrate and describe how electrical energy travels in a closed path that can produce light and thermal energy.
▪ 4.1G Develop and use models to represent phenomena, objects, and processes or design a prototype for a solution to a problem.
N/A
▪ 4.1G Develop and use models to represent phenomena, objects, and processes or design a prototype for a solution to a problem.
▪ 4.3A Develop explanations and propose solutions supported by data and models.
▪ 4.3A Develop explanations and propose solutions supported by data and models.
▪
4.5D Examine and model the parts of a system and their interdependence in the function of the system.
▪ 4.5B Identify and investigate cause-and-effect relationships to explain scientific phenomena or analyze problems.
▪ 4.5E Investigate how energy flows and matter cycles through systems and how matter is conserved.
▪ 4.5E Investigate how energy flows and matter cycles through systems and how matter is conserved.
▪ 4.5A Identify and use patterns to explain scientific phenomena or to design solutions.
4a
4b
▪ 4.8B Identify conductors and insulators of thermal and electrical energy.
▪ 4.8B Identify conductors and insulators of thermal and electrical energy.
▪ 4.2B Analyze data by identifying any significant features, patterns, or sources of error.
▪ 4.3A Develop explanations and propose solutions supported by data and models.
N/A
▪ 4.5B Identify and investigate cause-and-effect relationships to explain scientific phenomena or analyze problems.
Level 4 ▸ Energy ▸ End-of-Module Assessment Rubric 270
Item Content Standards Scientific and Engineering Practices Recurring Themes and Concepts
© Great Minds PBC PhD SCIENCE® TEXAS This page may be reproduced for classroom use only.
Energy Resources
Contents
Lesson 1 Resource A: Windmill Paintings
Lesson 1 Resource B: Windmill Gears Photograph
Lesson 1 Resource C: Windmill Grinding Photograph
Lesson 2 Resource: Windmill Model Setup Instructions
Lesson 3 Resource A: Modern Wind Turbine Photograph
Lesson 3 Resource B: Wind Farm Photograph
Lesson 3 Resource C: Wind Farm Diagram
Lesson 4 Resource: Energy Stations Setup Instructions
Lesson 11 Resource A: Golf Course Photograph
Lesson 11 Resource B: Conceptual Checkpoint
© Great Minds PBC 271
Lesson 12 Resource A: Energy in Systems Stations Setup Instructions
Lesson 12 Resource B: Energy in Systems Stations Procedure Sheets
Lesson 12 Resource C: Extension: Energy in Systems Stations Setup Instructions
Lesson 12 Resource D: Extension: Energy in Systems Stations Guidance
Lesson 12 Resource E: Extension: Energy in Systems Stations Procedure Sheets
Lesson 12 Resource F: Extension: Energy in Systems Observations
Lesson 13 Resource: Heat Lamp Components Diagram
Lesson 14 Resource: Electrical Circuit Investigation Setup Instructions and Procedure
Lesson 15 Resource: Thermal Conductors and Insulators Photographs
Lesson 16 Resource A: Generator Photograph
Lesson 16 Resource B: Build a Generator Procedure Sheet
Lesson 17 Resource: Build a Generator Group Roles
Lesson 19 Resource: Hoover Dam Turbines Photograph
Lesson 20 Resource A: Bicycle with Dynamo Light System Illustration
Lesson 20 Resource B: Conceptual Checkpoint
Lesson 21 Resource A: Engineering Challenge Rubric
Lesson 21 Resource B: Flooded Neighborhood Photograph
Lesson 21 Resource C: Engineering Design Process
Lesson 22 Resource: Researching Renewable Energy Engineers
Lesson 29 Resource A: Module Concept Statements
Lesson 29 Resource B: Recurring Themes and Concepts
Level 4 ▸ Energy ▸ Resources PhD SCIENCE® TEXAS 272 © Great Minds PBC
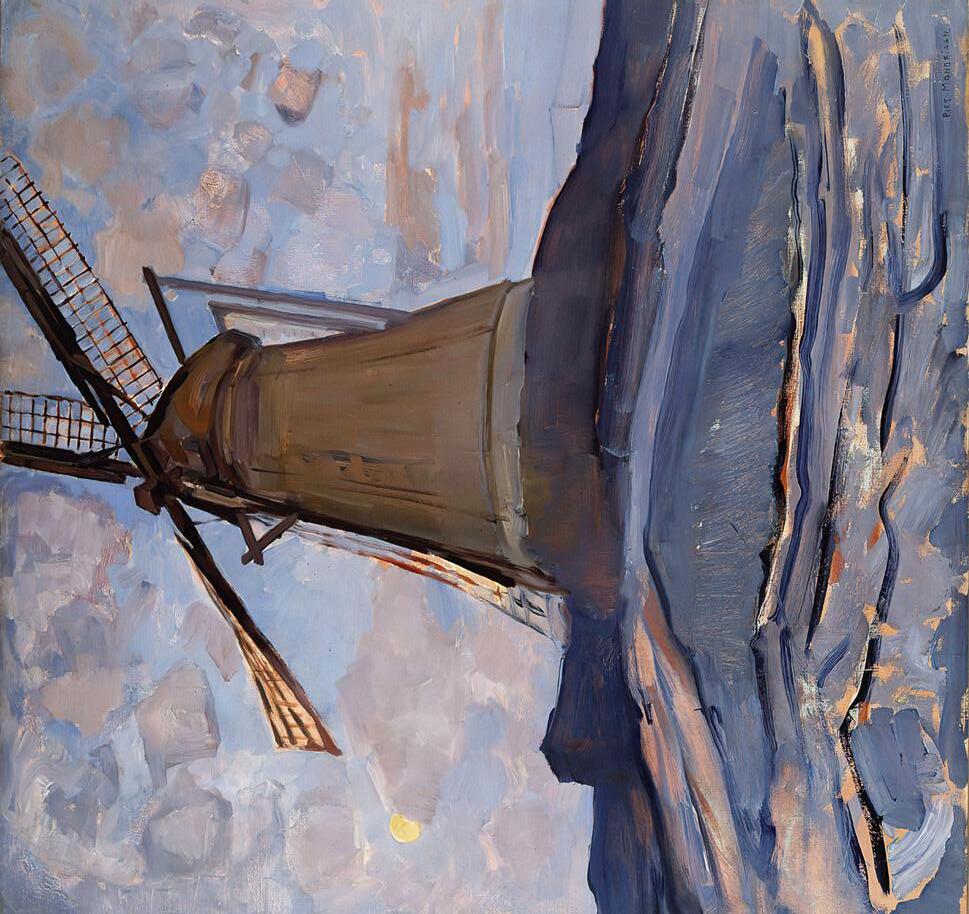
© Great Minds PBC 273 This page may be reproduced for classroom use only. PhD SCIENCE® TEXAS Level 4 ▸ Energy ▸ Lesson 1 ▸ Resource A LESSON 1 RESOURCE A Windmill Paintings Windmill, 1917 (Piet Mondrian)
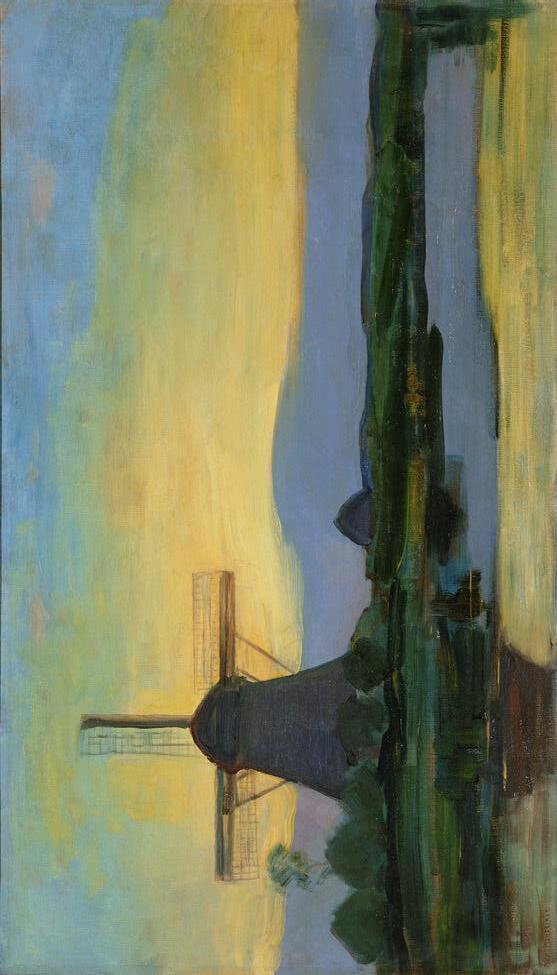
274 © Great Minds PBC This page may be reproduced for classroom use only. Level 4 ▸ Energy ▸ Lesson 1 ▸ Resource A Oostzijdse Mill with Extended Blue, Yellow, and Purple Sky, 1907 –08 (Piet Mondrian) PhD SCIENCE® TEXAS
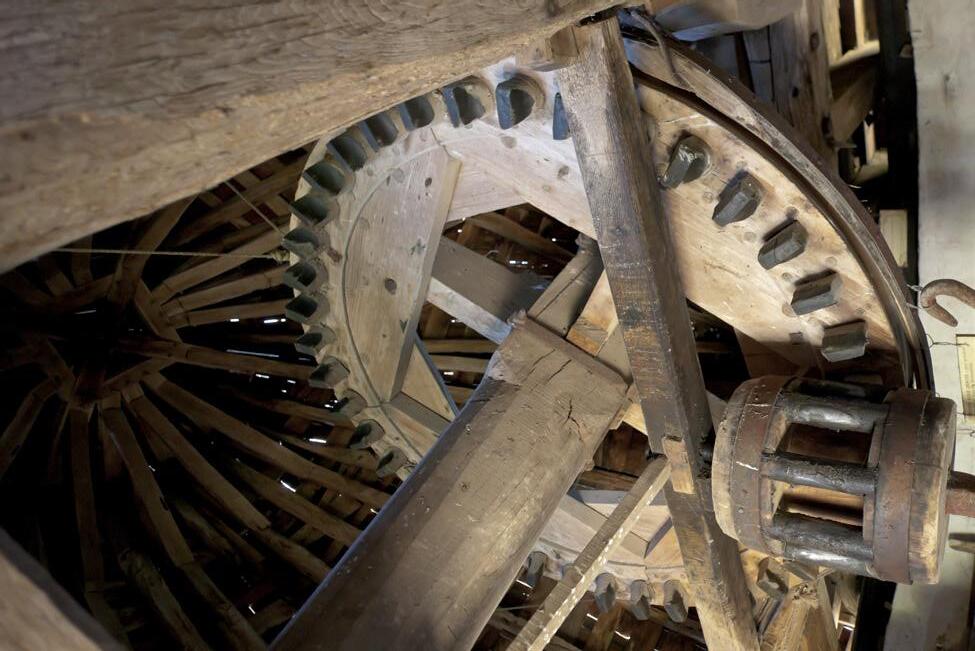
© Great Minds PBC 275 This page may be reproduced for classroom use only. PhD SCIENCE® TEXAS Level 4 ▸ Energy ▸ Lesson 1 ▸ Resource B LESSON 1 RESOURCE B Windmill Gears Photograph
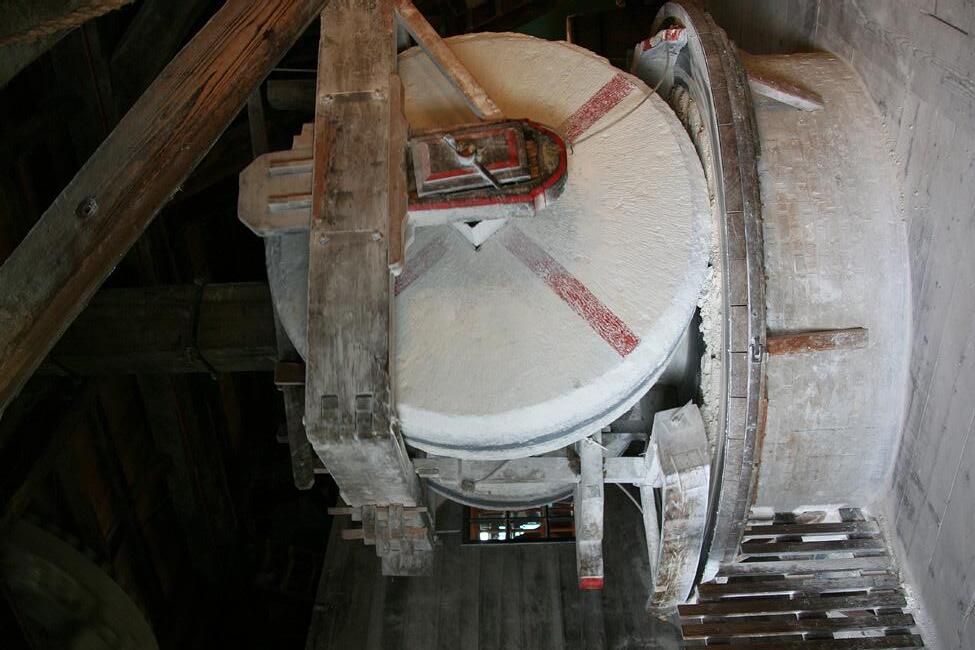
276 © Great Minds PBC This page may be reproduced for classroom use only. Level 4 ▸ Energy ▸ Lesson 1 ▸ Resource C LESSON 1 RESOURCE C Windmill Grinding Photograph PhD SCIENCE® TEXAS
LESSON 2 RESOURCE
Model Setup Instructions
Windmill
Materials and Preparation
Materials (1 set per group): base grid (1), fan (1), generator (1), pivot stand base (1), pivot post (1), pivot top (1), black jumper wire (1), red jumper wire (1), red LED (1), balloon pump (1)
Materials note: The base grids, fans, generators, pivot stand bases, pivot posts, pivot tops, black jumper wires, red jumper wires, and red LEDs used in this activity are from the Snap Circuits ® Green kit by Elenco ® .
Preparation: Place all materials at workstations. No additional setup is required.
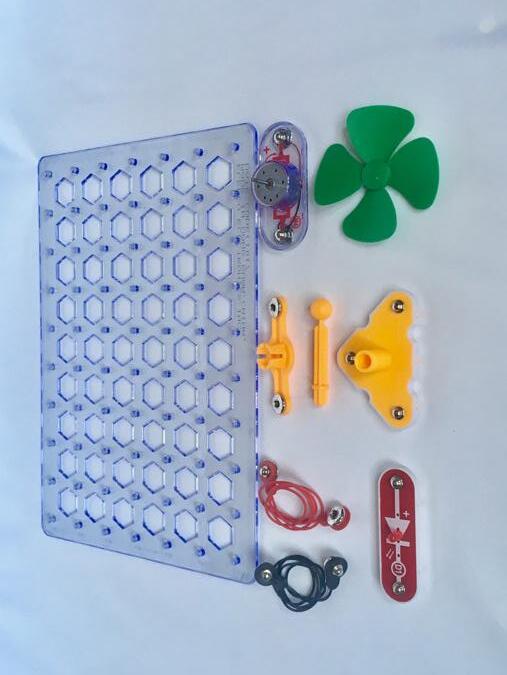
© Great Minds PBC 277 This page may be reproduced for classroom use only. PhD SCIENCE® TEXAS Level 4 ▸ Energy ▸ Lesson 2 ▸ Resource
Students
of components may vary.
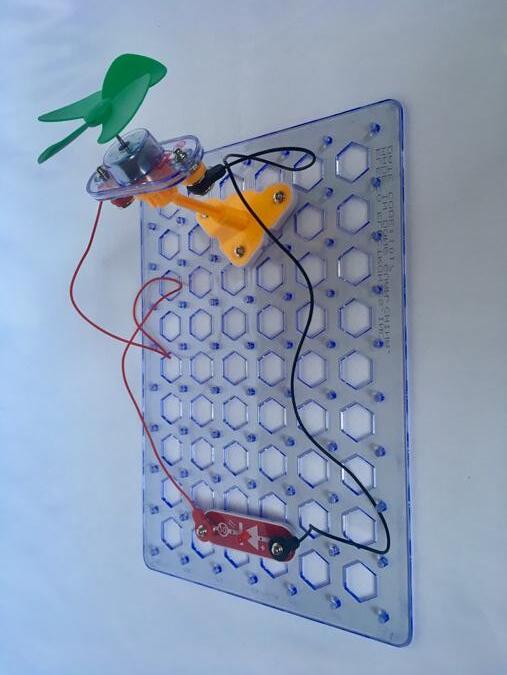
278 © Great Minds PBC This page may be reproduced for classroom use only. Level 4 ▸ Energy ▸ Lesson 2 ▸ Resource
Windmill Configuration
Exact placement
PhD SCIENCE® TEXAS
should work out (or use trial and error to arrive at) the configuration shown.
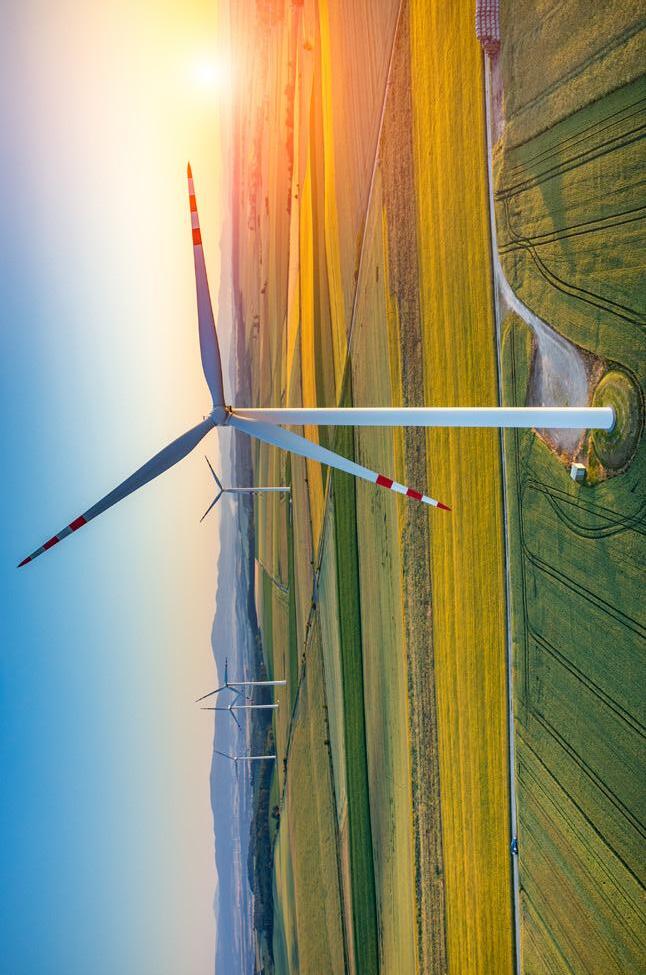
© Great Minds PBC 279 This page may be reproduced for classroom use only. PhD SCIENCE® TEXAS Level 4 ▸ Energy ▸ Lesson 3 ▸ Resource A LESSON 3 RESOURCE A Modern Wind Turbine Photograph
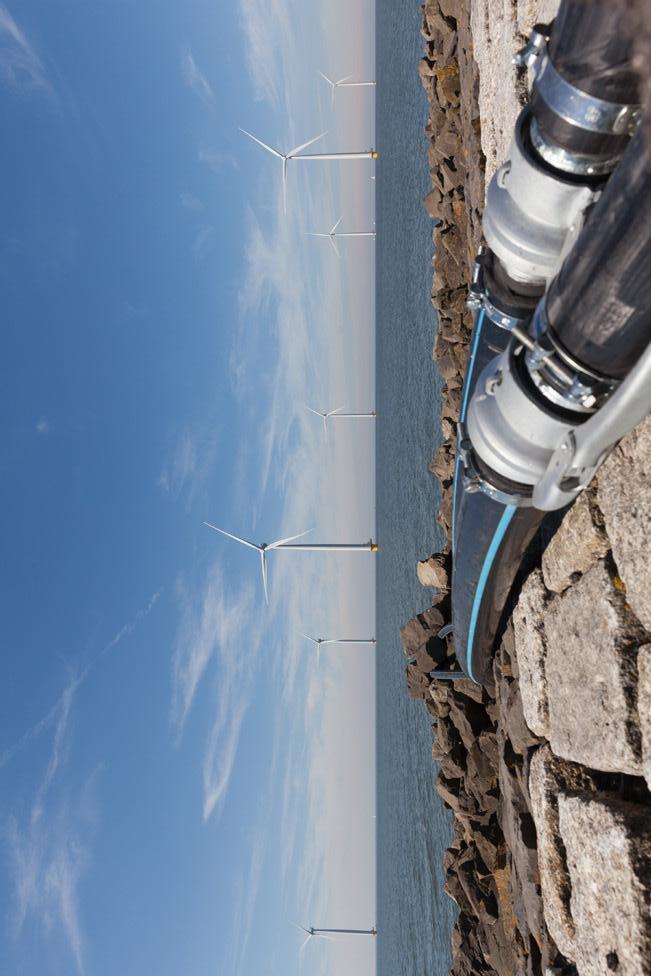
280 © Great Minds PBC This page may be reproduced for classroom use only. Level 4 ▸ Energy ▸ Lesson 3 ▸ Resource B LESSON 3 RESOURCE B Wind Farm Photograph Image 1 PhD SCIENCE® TEXAS
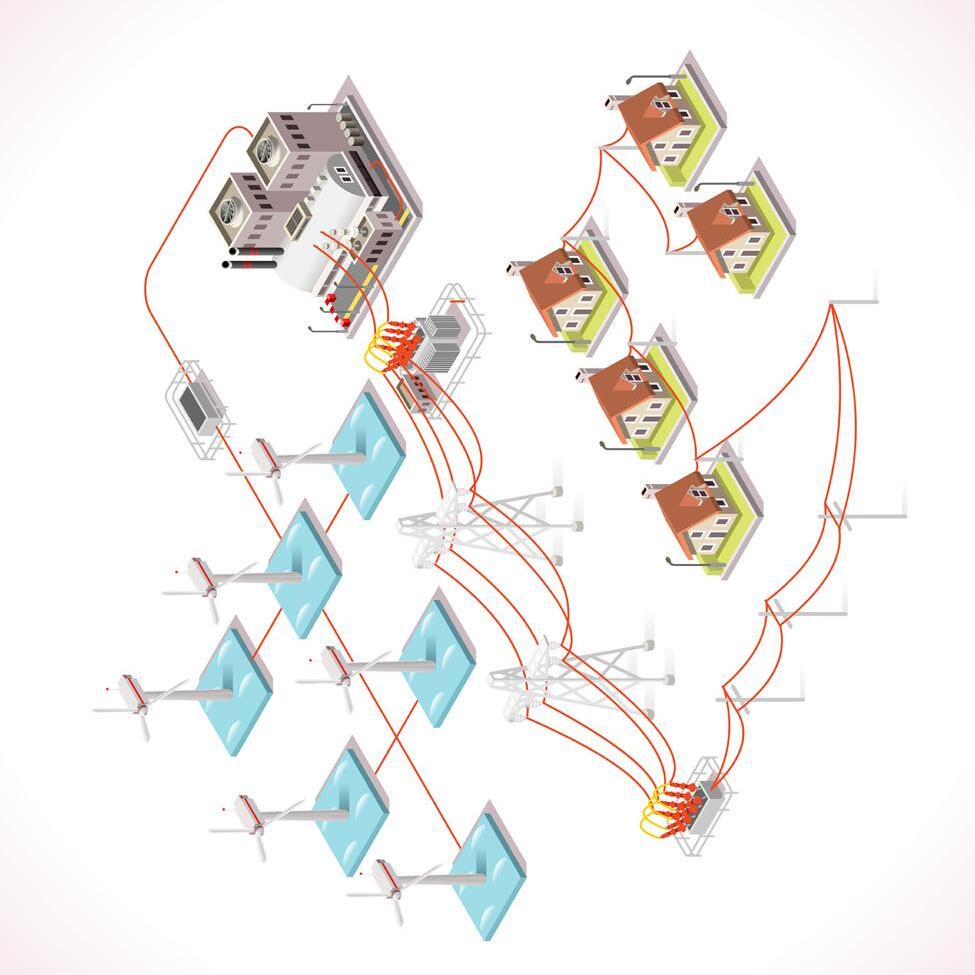
© Great Minds PBC 281 This page may be reproduced for classroom use only. PhD SCIENCE® TEXAS Level 4 ▸ Energy ▸ Lesson 3 ▸ Resource C LESSON 3 RESOURCE C Wind Farm Diagram Image 2
LESSON
Energy Stations Setup Instructions
Follow the instructions to set up the seven energy stations before Lessons 4 and 5. Students visit all stations during both lessons.
Materials: 6 qt clear plastic bins (2), hand-crank flashlights (2), pull back toy cars (2), handheld radios with batteries (2), assembled Snap Circuits ® windmills from Lesson 2 (2), handheld balloon pumps (2), heat lamps with reflectors (2), heat light bulbs (2), small blocks of wood (2), sandpaper (enough to create two 4 ″ × 5 ″ sheets), scissors (1 per class), thin plastic cutting board (enough to create two 5 ″ × 5 ″ sheets), toy boats (2), access to water
Advance Timing Note: One day before, test the radio batteries and the heat lamp bulbs.
Preparation: Set up the following stations in different locations around the classroom.
Station 1: Place two hand-crank flashlights at the station.
Station 2: Place two pull back cars at the station.
Station 3: Place two handheld battery-powered radios at the station. Remove batteries from the radios and place at station. Students should put in the batteries to make the radio work when they get to the station.
Station 4: Place two assembled Snap Circuits ® windmills from Lesson 2 at the station and two balloon pumps.
Station 5: Screw the bulbs into the heat lamps with reflectors and place the two assembled heat lamps at the station. Plug in both lamps each time student groups arrive at the station and disconnect the plug when students change stations.
Station 6: Cut the sandpaper into two 4 ″ × 5 ″ sheets. Place the two small sheets of sandpaper and two wood blocks at the station.
Station 7: Cut the cutting board into two 5 ″ × 5 ″ squares. Fill two clear plastic bins halfway with water. Place a toy boat in each plastic bin. Place the prepared plastic bins and the small squares of cutting board at the station.
Rotation Notes: Remove batteries from the radios as students change stations. Disconnect the lamp plugs at the end of each station rotation and plug them back in when the next student group arrives.
Procedure: Have students follow the procedure outlined in the lesson.
282 © Great Minds PBC This page may be reproduced for classroom use only. Level 4 ▸ Energy ▸ Lesson 4 ▸ Resource
RESOURCE
4
PhD SCIENCE® TEXAS
© Great Minds PBC 283 This page may be reproduced for classroom use only. PhD SCIENCE® TEXAS Level 4 ▸ Energy ▸ Lesson 11 ▸ Resource A LESSON 11 RESOURCE A Golf Course Photograph
Date:
Name:
1. Observe the photographs.
a. In each sentence, circle the words to describe where energy transfers in the system. The
wave / boat
transfers motion energy to the wave / boat. The
transfers motion energy to the wave / shoreline.
wave / shoreline
Motion energy also becomes sound energy at the boat / shoreline.
b. Circle the collision that transfers energy to the shoreline.
▪ Between the boat and the shoreline
▪ Between the waves and the shoreline
▪ Between the shoreline and the sound
284 © Great Minds PBC This page may be reproduced for classroom use only. Level 4 ▸ Energy ▸ Lesson 11 ▸ Resource B
RESOURCE B
LESSON 11
Conceptual Checkpoint
PhD SCIENCE® TEXAS
2. Read the question.
Question: Do forces from boats transfer energy that may damage the shoreline?
Circle the investigation you could conduct to answer the question.
▪ Investigate how the temperature of the water affects the force on the shoreline.
▪ Investigate how the speed of the boat affects the force on the shoreline.
▪ Investigate how the color of the boat affects the force on the shoreline.
© Great Minds PBC 285 This page may be reproduced for classroom use only. PhD SCIENCE® TEXAS Level 4 ▸ Energy ▸ Lesson 11 ▸ Resource B
Stations
A Energy in Systems
LESSON 12
Setup Instructions
Follow these instructions to set up the energy in systems stations before the lesson. For most class sizes, set up two of each station.
Station 1: Solar Cell
Materials: solar cell (1), buzzer (1), alligator clip cords (2), flashlight with batteries (1), procedure sheet (1)
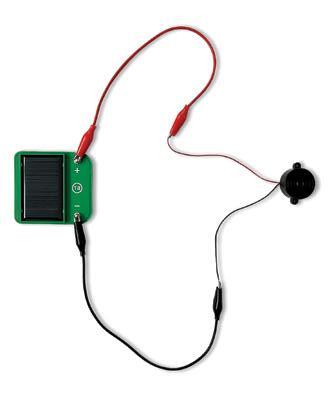
Materials note: The solar cells used in this activity are from the Snap Circuits ® Green kit by Elenco ® .
Preparation
1. Place all materials at the station.
2. Connect the solar cell and buzzer as shown.
3. Confirm that the device functions correctly by turning on the flashlight and shining the light onto the solar cell, and then turning off the flashlight. The device should make a sound when the solar cell is exposed to light.
286 © Great Minds PBC This page may be reproduced for classroom use only. Level 4 ▸ Energy ▸ Lesson 12 ▸ Resource A
RESOURCE
PhD SCIENCE® TEXAS
Station 2: Sound Cup
Materials: 9 oz clear plastic cup (1), dry rice (1 tbsp), piece of plastic wrap (1, large enough to fit over cup), rubber band (1), speaker and audio source (1 of each if available), procedure sheet (1)
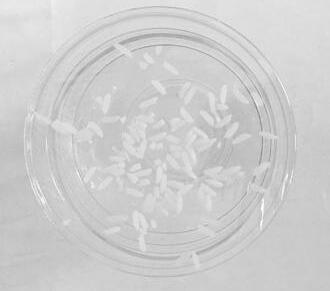
Preparation
1. Place all materials at the station.
2. If using a speaker, cue the audio source and set the volume to its lowest setting. Otherwise, students can talk to the cup at different volumes.
Procedure: Students work together to create the device for the station as shown. Note that students may need help securing the plastic wrap around the cup.
Station 3: Air Temperature
Materials: 9-ounce clear plastic cups (2), heat lamp with reflector (1), heat light bulb (1), small binder clips (2),
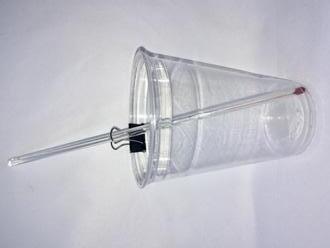
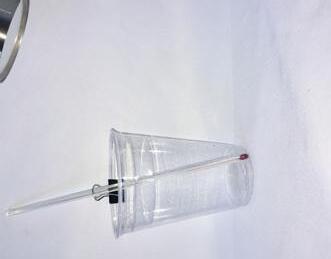
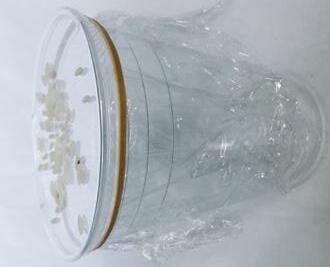
Celsius thermometers (2), procedure sheet (1)
Preparation
1. Assemble the heat lamp, and place all materials at the station.
2. Secure one thermometer in each cup with a small clip as shown. Place one cup 6 to 8 inches away from the heat lamp. Place the second cup on the table, farther away from the heat lamp.
© Great Minds PBC 287 This page may be reproduced for classroom use only. PhD SCIENCE® TEXAS Level 4 ▸ Energy ▸ Lesson 12 ▸ Resource A
Stations
Energy in Systems
Procedure Sheets
These sheets provide students with directions for each station. Cut out and display the relevant procedure sheet at each station. Station 1: Solar Cell
1. Add light by turning on the flashlight and pointing it at the solar cell. Observe and record what happens.
2. Remove light by turning off the flashlight. Observe and record what happens.
3. Explore: How can you change the sound? Station 2: Sound Cup (with speaker)
1. Gently stretch the piece of plastic wrap over the top of the cup. Secure the plastic wrap to the cup with a rubber band.
2. Place about 5 to 10 grains of rice on the plastic wrap.
3. Place the sound cup near the speaker.
4. Turn on the speaker and slowly increase the volume. Observe and record what happens.
5. Explore: How can you change what the rice does?
288 © Great Minds PBC This page may be reproduced for classroom use only. Level 4 ▸ Energy ▸ Lesson 12 ▸ Resource B
12 RESOURCE B
LESSON
PhD SCIENCE® TEXAS
Station 2: Sound Cup (without speaker)
1. Gently stretch the piece of plastic wrap over the top of the cup. Secure the plastic wrap to the cup with a rubber band.
2. Place about 5 to 10 grains of rice on the plastic wrap.
3. Talk or make noises with your mouth next to the cup. Observe and record what happens.
4. Talk or make noises more loudly. Observe and record what happens.
5. Explore: How can you change what the rice does?
Station 3: Air Temperature
1. Observe both cups.
2. Record the temperature of the air in each cup.
3. Compare the temperatures.
© Great Minds PBC 289 This page may be reproduced for classroom use only. PhD SCIENCE® TEXAS Level 4 ▸ Energy ▸ Lesson 12 ▸ Resource B
C
LESSON 12 RESOURCE
Extension: Energy in Systems Stations
Setup Instructions
Follow these instructions to set up the energy in systems stations extensions before the lesson.
For most class sizes, set up two of stations 4, 5, and 6. Station 7 is teacher guided, so only one station should be set up.
Station 4: Rubber Band Box (sound)
Materials: shoebox (1), large rubber bands of varying widths (at least 4), pencil (1), procedure sheet (1)
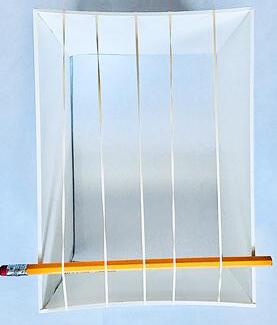
Preparation
1. Place all materials at the station.
2. Build the rubber band box. First, remove the lid of the shoebox. Next, stretch the rubber bands around the box, spacing them evenly. Finally, secure the pencil under the rubber bands at one end of the box.
Station 5: Kazoo (sound)
Materials: kazoo (1 per student), alcohol pads (1 per group), procedure sheet (1)
Preparation
1. Place all materials at the station.
2. No additional setup is required. Sanitize the kazoos with alcohol pads before each new group moves to the station.
290 © Great Minds PBC This page may be reproduced for classroom use only. Level 4 ▸ Energy ▸ Lesson 12 ▸ Resource C
PhD SCIENCE® TEXAS
Station 6: Tuning Fork (sound)
Materials: tuning fork (1), procedure sheet (1)
Preparation
1. Place all materials at the station.
2. No additional setup is required.
Station 7: Solar Oven (heat)
Materials: cardboard pizza box (1 per group), box cutter or scissors (1), aluminum foil (1 roll), clear tape (1), plastic wrap (or a heavy-duty resealable freezer bag) (1 roll), black construction paper (enough to cover the bottom of each group’s pizza box), newspapers (about 4 sheets per group), ruler or wooden spoon (1 per group), thermometer (1 per group)
Preparation
1. Place all materials at the station. Note: This teacher-guided activity does not require a procedure sheet.
2. Follow these directions for making the solar oven (Home Science Tools, n.d.): http://phdsci.link/1161 . This activity must be done outside on a clear, sunny day.
© Great Minds PBC 291 This page may be reproduced for classroom use only. PhD SCIENCE® TEXAS Level 4 ▸ Energy ▸ Lesson 12 ▸ Resource C
Extension: Energy in Systems Stations
Guidance
Station 4: Rubber Band Box (sound)
The rubber band box procedure sheet directs students to pluck stretched rubber bands and make observations about the resulting movements and sounds.
Sample student observations:
▪ The rubber bands don’t move unless we pluck them.
▪ When we pluck the rubber bands, they move back and forth really fast and we hear a sound.
▪ The skinnier rubber bands move faster and make a higher-pitched sound than the thicker rubber bands.
Station 5: Kazoo (sound)
The kazoo procedure sheet directs students to hum into a kazoo with different volumes (soft, medium, and loud) to make sounds.
Sample student observations:
▪ The kazoo is louder when we hum louder.
▪ The kazoo isn’t as loud when we hum softer.
▪ Humming into the kazoo tickles our lips.
Station 6: Tuning Fork (sound)
The tuning fork procedure sheet directs students to strike a tuning fork on the table with different forces (light, medium, hard).
Sample student observations:
▪ The sound is louder or softer based on how hard or soft we hit the tuning fork on the table.
▪ The harder we hit the tuning fork on the table, the louder the sound it makes is.
▪ We also notice that the tuning fork shakes back and forth more when we hit it harder on the table.
292 © Great Minds PBC This page may be reproduced for classroom use only. Level 4 ▸ Energy ▸ Lesson 12 ▸ Resource D
12 RESOURCE D
LESSON
PhD SCIENCE® TEXAS
Station 7: Solar Oven (thermal energy)
This teacher-guided activity can be conducted in small groups or as a class.
Sample student observations:
▪ Sunlight makes the food get hot enough to cook.
▪ We need to use a shiny surface for the solar oven to get hot enough.
© Great Minds PBC 293 This page may be reproduced for classroom use only. PhD SCIENCE® TEXAS Level 4 ▸ Energy ▸ Lesson 12 ▸ Resource D
Energy in Systems Stations
Procedure Sheets
These sheets provide students with directions for each extension station. Cut out and display the relevant procedure sheet at each station.
Station 4: Rubber Band Box
1. Pluck the rubber bands.
2. Observe and record what happens.
3. Explore: How can you change the sound made with the rubber band box? Station 5: Kazoo
1. Hum at different volumes (soft, medium, loud) into the kazoo.
2. Observe and record what happens.
3. Explore: How can you change the sound made with the kazoo? Station 6: Tuning Fork
1. Tap the tuning fork once on the table (light, medium, or hard). Observe and record what happens.
2. Tap the tuning fork once again but with a different force (light, medium, or hard). Observe and record what happens.
3. Explore: How can you change the sound made with the tuning fork?
294 © Great Minds PBC This page may be reproduced for classroom use only. Level 4 ▸ Energy ▸ Lesson 12 ▸ Resource E LESSON 12 RESOURCE E
Extension:
PhD SCIENCE® TEXAS
Date:
Name:
LESSON 12 RESOURCE F Extension: Energy in Systems
Observations
As you visit each station, record observations about the movement of energy through the system. Station 4: Rubber Band Box Observations
Station 5: Kazoo
Observations
© Great Minds PBC 295 This page may be reproduced for classroom use only. PhD SCIENCE® TEXAS Level 4 ▸ Energy ▸ Lesson 12 ▸ Resource F
296 © Great Minds PBC This page may be reproduced for classroom use only. Level 4 ▸ Energy ▸ Lesson 12 ▸ Resource F PhD SCIENCE® TEXAS Station 6: Tuning Fork Observations Station 7: Solar Oven
Observations
Heat
© Great Minds PBC 297 This page may be reproduced for classroom use only. PhD SCIENCE® TEXAS Level 4 ▸ Energy ▸ Lesson 13 ▸ Resource LESSON 13 RESOURCE
Lamp
Plug Wire Lamp socket Light bulb Aluminum reflector
Components Diagram
and Procedure
Instructions
Materials (1 set per group): 18-inch sheet of aluminum foil (1), D battery (1), incandescent flashlight bulb (1), scissors (1), electrical or masking tape (1 roll)
Preparation
Follow the instructions to prepare two 9-inch aluminum foil strips for each group before the lesson.
1. Fold an 18-inch sheet of aluminum foil in half lengthwise.
2. Repeat the fold four more times.
3. Cut the resulting strip in half to create two 9-inch aluminum foil strips.
Procedure
Note: The following procedure describes how to use the materials to create a working electrical circuit. Allow time for productive struggle before providing explicit direction to groups.
1. Wrap one end of an aluminum foil strip around the threaded portion of the light bulb. Tape the foil strip in place.
2. Use tape to attach the other end of the aluminum foil strip to either battery terminal. Ensure that the foil directly contacts the terminal.
3. Use tape to attach one end of the second aluminum foil strip to the light bulb’s metal base. Use additional tape as necessary to prevent contact between the two foil strips; contact will result in a short circuit, which will cause the battery to become hot.
4. Use tape to attach the other end of the second aluminum foil strip to the free battery terminal. Ensure that the foil directly contacts the terminal. Performing this step completes the electrical circuit, and the bulb will light up.
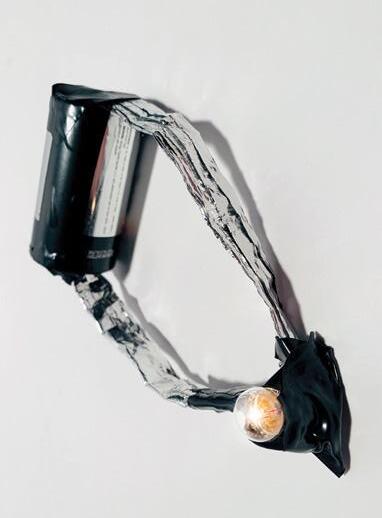
298 © Great Minds PBC This page may be reproduced for classroom use only. Level 4 ▸ Energy ▸ Lesson 14 ▸ Resource
LESSON 14 RESOURCE Electrical Circuit Investigation Setup
PhD SCIENCE® TEXAS
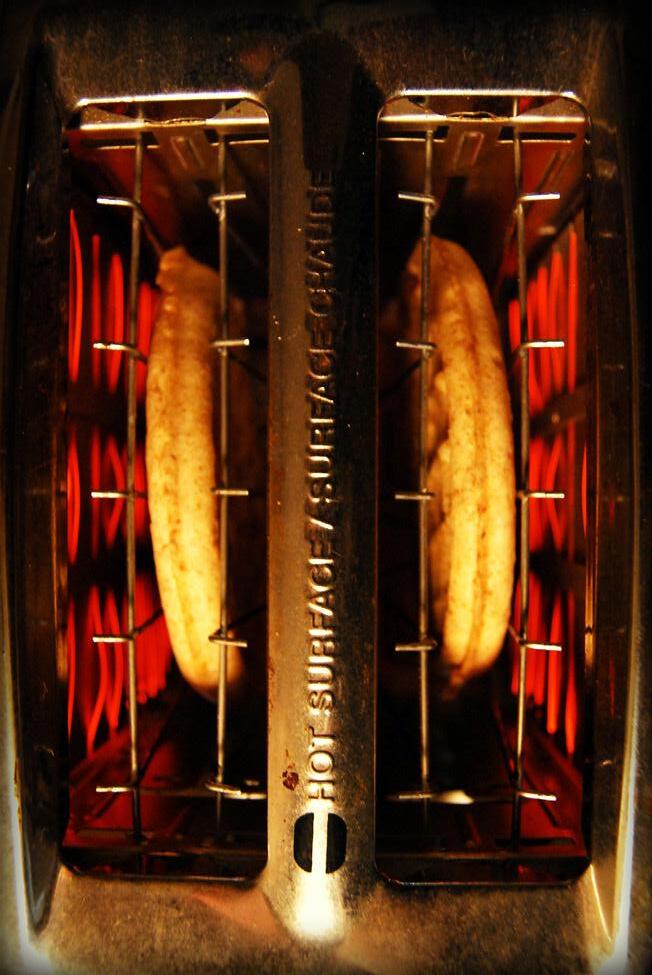
© Great Minds PBC 299 This page may be reproduced for classroom use only. PhD SCIENCE® TEXAS Level 4 ▸ Energy ▸ Lesson 15 ▸ Resource LESSON 15 RESOURCE
Thermal Conductors and Insulators Photographs Thermal Conductors
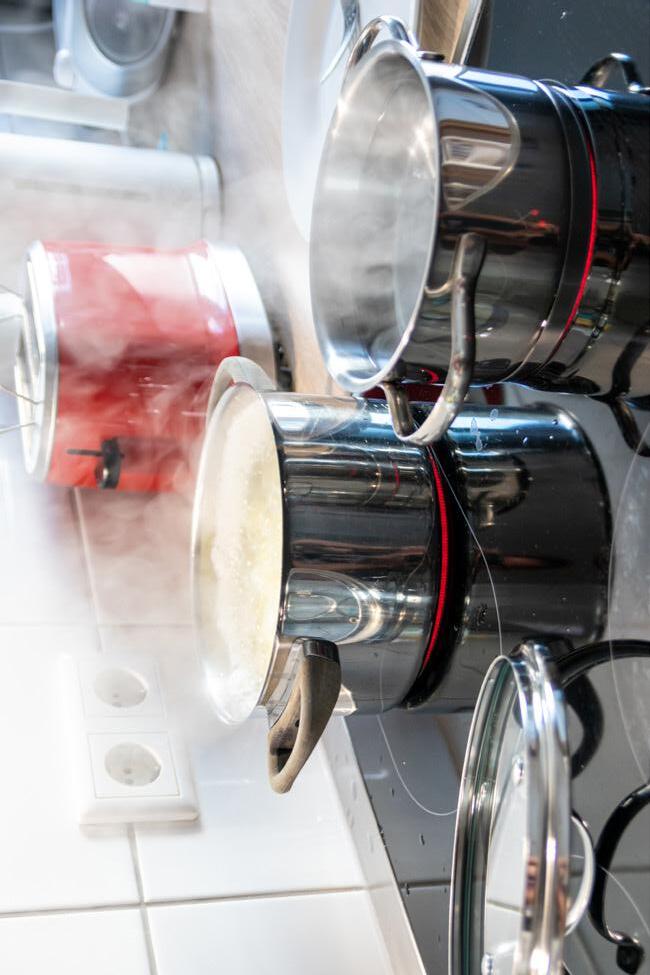
300 © Great Minds PBC This page may be reproduced for classroom use only. Level 4 ▸ Energy ▸ Lesson 15 ▸ Resource PhD SCIENCE® TEXAS

© Great Minds PBC 301 This page may be reproduced for classroom use only. PhD SCIENCE® TEXAS Level 4 ▸ Energy ▸ Lesson 15 ▸ Resource

302 © Great Minds PBC This page may be reproduced for classroom use only. Level 4 ▸ Energy ▸ Lesson 15 ▸ Resource Thermal Insulators PhD SCIENCE® TEXAS
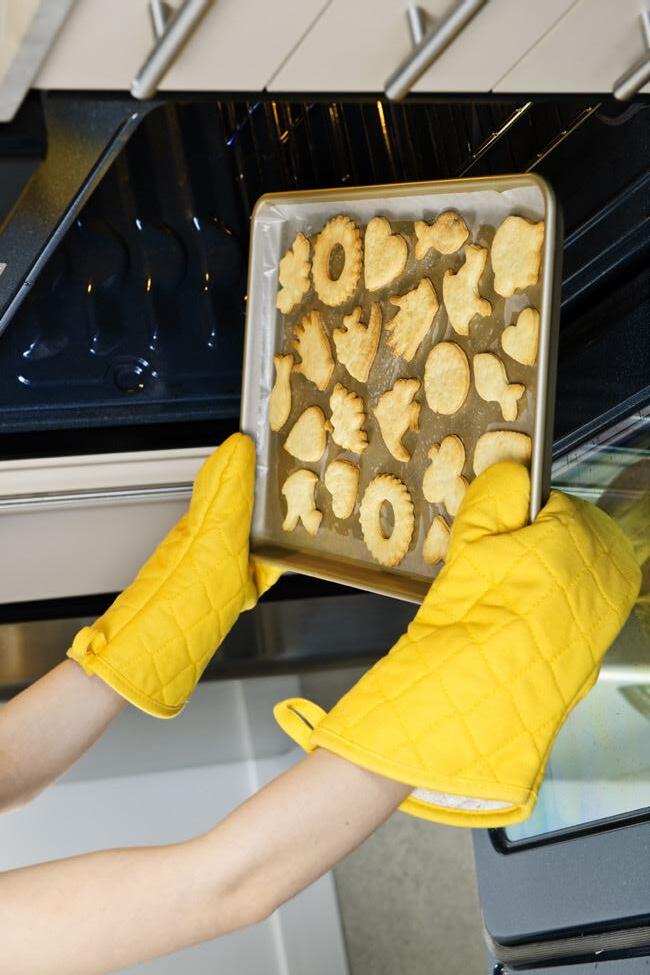
© Great Minds PBC 303 This page may be reproduced for classroom use only. PhD SCIENCE® TEXAS Level 4 ▸ Energy ▸ Lesson 15 ▸ Resource

304 © Great Minds PBC This page may be reproduced for classroom use only. Level 4 ▸ Energy ▸ Lesson 15 ▸ Resource PhD SCIENCE® TEXAS
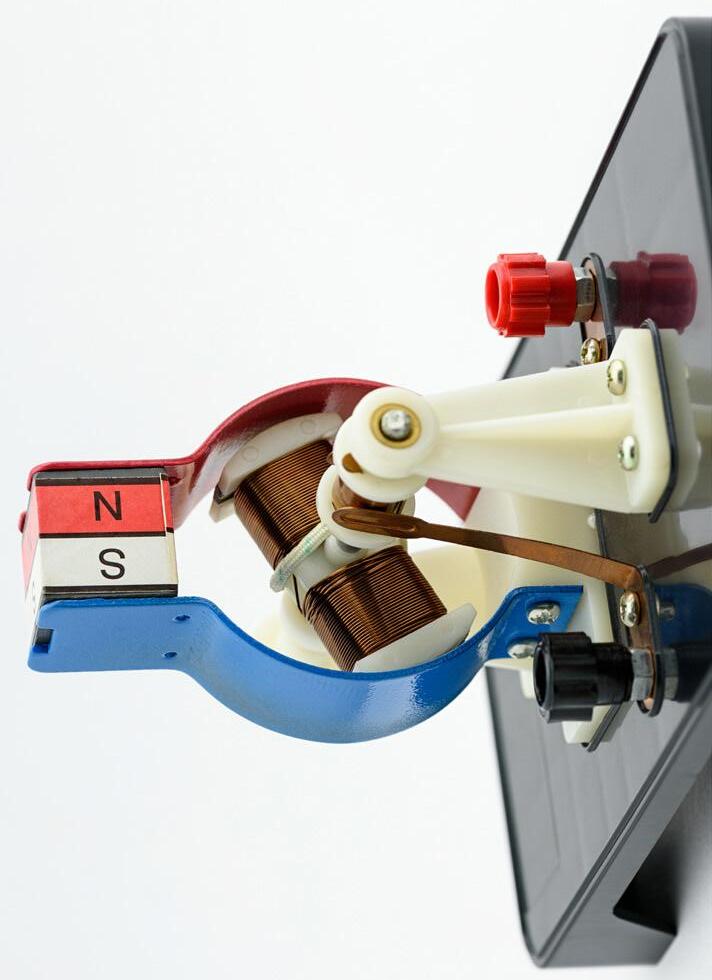
© Great Minds PBC 305 This page may be reproduced for classroom use only. PhD SCIENCE® TEXAS Level 4 ▸ Energy ▸ Lesson 16 ▸ Resource A LESSON 16 RESOURCE A Generator Photograph
This procedure sheet provides students with directions for building a generator. Print and cut out a copy of the procedure sheet for each student.
1. Gather the materials: cardboard tube, nail, ruler, spool of copper wire, 2 nuts, 4 magnets, LED, sheet of sandpaper, 2 alligator clip cords.
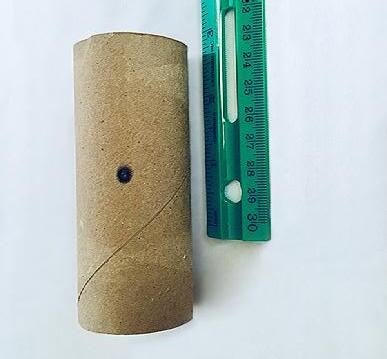
2. Use a ruler to find the center of the tube. Mark the center with a pen or pencil.
3. Starting at the center point, measure 2 cm toward one end of the tube. Use a pen or pencil to make a dark mark there.
306 © Great Minds PBC This page may be reproduced for classroom use only. Level 4 ▸ Energy ▸ Lesson 16 ▸ Resource B
16 RESOURCE B Build a Generator Procedure Sheet
LESSON
Build a Generator Procedure Sheet
PhD SCIENCE® TEXAS
4. Repeat step 3 on the other side of the tube.
5. Use the two outer marks as guides to draw two lines around the entire tube.
6. Carefully push a nail through the center point (shown on the left). Make sure the nail goes all the way through the tube (shown on the right). Your teacher can help you with this.
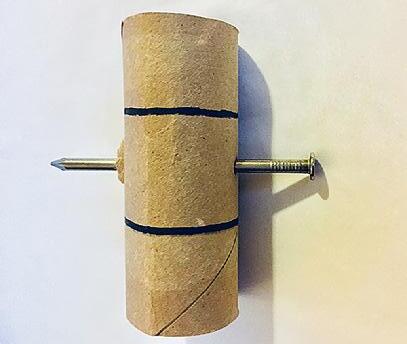
© Great Minds PBC 307 This page may be reproduced for classroom use only. PhD SCIENCE® TEXAS Level 4 ▸ Energy ▸ Lesson 16 ▸ Resource B
7. Drop one pair of magnets into the tube so that the magnets lie centered on the nail.
8. Turn the tube over, and place a metal nut on each side of the nail on top of the magnets.
9. Drop the second pair of magnets on top of the nuts and nail. The nuts and nail should sit in between the two sets of magnets like a sandwich.
10. Have one group member hold the wire spool loosely so that it can spin.
308 © Great Minds PBC This page may be reproduced for classroom use only. Level 4 ▸ Energy ▸ Lesson 16 ▸ Resource B
Metal nut Nail Magnet
PhD SCIENCE® TEXAS
11. Measure 10 cm from the end of the wire, and hold that spot against the tube between the two lines made in step 5.
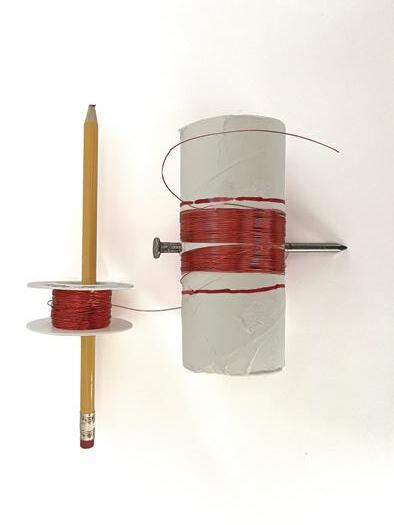
12. Wrap the remaining wire 200 times around the tube, keeping the wire between the two lines. Do not wrap the 10 cm portion of wire measured in step 11.
13. After wrapping the wire 200 times, measure 10 cm more of the wire to leave unwrapped at the other end.
14. Use wire cutters to cut the wire. Your teacher can help you with this.
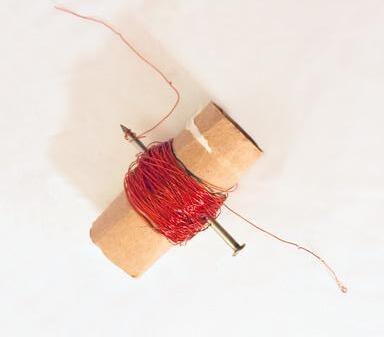
© Great Minds PBC 309 This page may be reproduced for classroom use only. PhD SCIENCE® TEXAS Level 4 ▸ Energy ▸ Lesson 16 ▸ Resource B
15. Use sandpaper to completely remove 1 to 2 cm of the enamel coating from both ends of the wire.
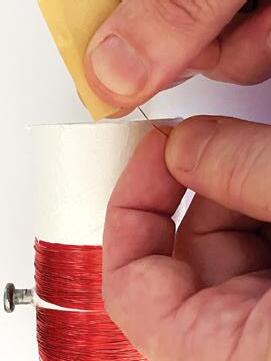
16. Attach one end of an alligator clip cord to one of the wires on the LED.
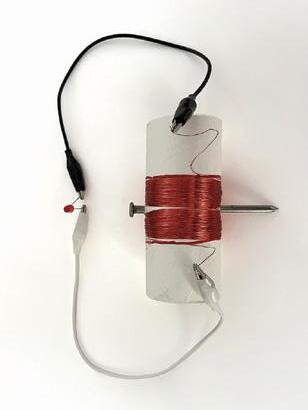
17. Attach the other end of the clip cord to one of the sanded ends of wire on your generator.
18. Repeat steps 16 and 17 with the remaining alligator clip cord and the remaining wires on the LED and your generator.
19. Pinch the head of the nail and spin it. If your generator is set up correctly, the LED will flash.
20. Spin the nail at different speeds, and observe what happens.
310 © Great Minds PBC This page may be reproduced for classroom use only. Level 4 ▸ Energy ▸ Lesson 16 ▸ Resource B
PhD SCIENCE® TEXAS
LESSON 17 RESOURCE
Build a Generator Group Roles
The table shows suggested group roles and the task assigned to each role. Print a copy of the table for each group.
Make sure your group has the correct materials (step 1). At the end of class, store the materials safely.
Group Roles
Measure and mark the tube in the correct locations (steps 2 through 5).
Insert the nail properly and safely through the tube (step 6). Spin the nail when the generator is ready to be tested (steps 19 and 20).
Make sure the two magnet pairs remain separated. Place one metallic nut on each side of the nail (steps 7 through 9).
Hold the spool loosely so it can spin as wire is wrapped around the tube (step 10).
Wrap copper wire around the tube. Cut the wire (steps 11 through 14).
Use sandpaper to remove the enamel from the ends of the wire (step 15).
Connect the generator to the LED with alligator clip cords (steps 16 through 18).
Role
Task Materials Manager
Marker
Nail Keeper
Magnet Keeper
Spool Holder
Wire Wrapper
Sander
Connector
© Great Minds PBC 311 This page may be reproduced for classroom use only. PhD SCIENCE® TEXAS Level 4 ▸ Energy ▸ Lesson 17 ▸ Resource
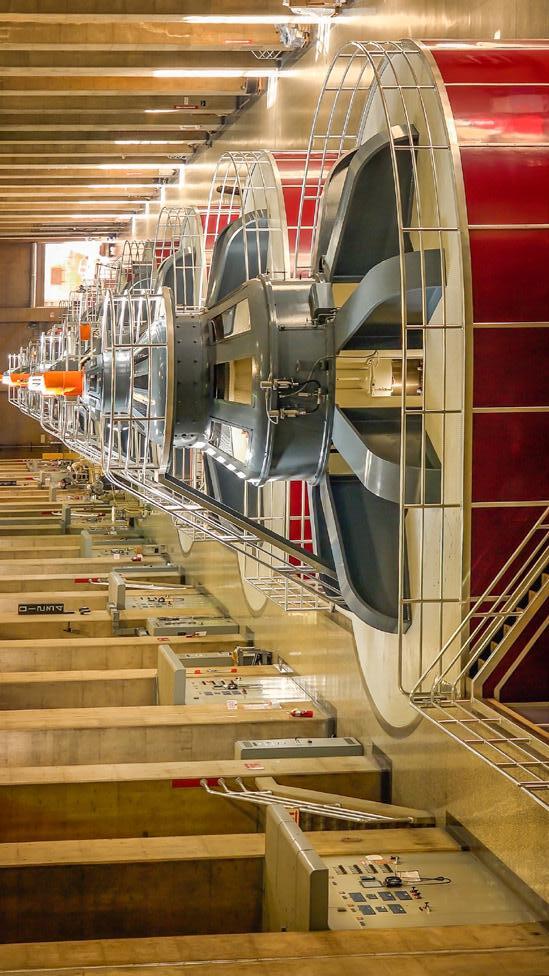
312 © Great Minds PBC This page may be reproduced for classroom use only. Level 4 ▸ Energy ▸ Lesson 19 ▸ Resource LESSON 19 RESOURCE Hoover Dam Turbines Photograph PhD SCIENCE® TEXAS
© Great Minds PBC 313 This page may be reproduced for classroom use only. PhD SCIENCE® TEXAS Level 4 ▸ Energy ▸ Lesson 20 ▸ Resource A LESSON 20 RESOURCE A Bicycle
Illustration
with Dynamo Light System
Headlamp
Dynamo generator
Wires Light
Date:
Name:
1. The model shows the components of a dynamo light system. The headlamp produces light. a. On the model, use a highlighter to trace the flow of energy between the generator and the headlamp.
314 © Great Minds PBC This page may be reproduced for classroom use only. Level 4 ▸ Energy ▸ Lesson 20 ▸ Resource B LESSON 20 RESOURCE B
Checkpoint
Conceptual
Dynamo Light System Light Headlamp Bicycle tire Dynamo generator LED bulb Wires PhD SCIENCE® TEXAS
b. Use evidence from the model to explain why energy flows through the system.
2. The model shows the components of a dynamo light system. The headlamp does not produce light.
© Great Minds PBC 315 This page may be reproduced for classroom use only. PhD SCIENCE® TEXAS Level 4 ▸ Energy ▸ Lesson 20 ▸ Resource B
Headlamp Bicycle tire
LED bulb Wires
Dynamo Light System
Dynamo generator
a. Use evidence from the model to explain why energy cannot flow through the system.
materials that could be used as conductors to make energy flow through the system.
b. In the table, circle
316 © Great Minds PBC This page may be reproduced for classroom use only. Level 4 ▸ Energy ▸ Lesson 20 ▸ Resource B
Material Metal or Nonmetal Light Produced Copper Metal Bright light Plastic Nonmetal None Iron Metal Dim light Rubber Nonmetal None PhD SCIENCE® TEXAS
Rubric
Challenge. The rubric describes evidence of student engagement that meets expectations for each stage of the engineering design process. Use the blank spaces as needed in the rubric to record evidence of student work that exceeds or falls below expectations.
Score
4 Exceeds Expectations
More than sufficient evidence of engagement in stage
Score each student’s engagement in the Engineering
3 Meets Expectations Sufficient evidence of engagement in stage
2 Approaches Expectations
The student lists criteria for their device (4.1A) that include transfer of mechanical energy to the device (4.8A) and transformation of mechanical energy into light energy (4.8C) that is as bright and long lasting as possible.
Some evidence of engagement in stage
1 Does Not Yet Meet Expectations No evidence of engagement in stage
TEKS Assessed
Date: Engineering Design Process Stage
Name:
4.1C
All
The student demonstrates safe practices during the engineering challenge as outlined in Texas Education Agency–approved safety standards (4.1C). Ask
© Great Minds PBC 317 This page may be reproduced for classroom use only. PhD SCIENCE® TEXAS Level 4 ▸ Energy ▸ Lesson 21 ▸ Resource A
LESSON 21 RESOURCE A Engineering Challenge
4.1A 4.8A 4.8C
The student explains how William’s solution transferred and transformed energy from the motion of the wind (4.8A) to provide energy for lights or a water pump, which helped people in the village to see at night with lights and to water fields to grow more food (4.4A).
The student explains how structures of the materials function (4.5F) and uses this understanding to brainstorm ideas for a solution (4.1B) and draw a sketch of their design, identifying insulators and conductors in the design (4.8B). The student researches renewable energy engineers (4.4B) to gather ideas the student can apply to their design (4.1B) and learn about possible STEM careers.
318 © Great Minds PBC This page may be reproduced for classroom use only. Level 4 ▸ Energy ▸ Lesson 21 ▸ Resource A Engineering Design Process Stage TEKS Assessed 1 Does Not Yet Meet Expectations No evidence of engagement in stage 2 Approaches Expectations Some evidence of engagement in stage 3 Meets Expectations Sufficient evidence of engagement in stage 4 Exceeds Expectations More than sufficient evidence of engagement in stage Score Imagine 4.4A
4.8A
Imagine 4.1B
4.4B 4.5F 4.8B
PhD SCIENCE® TEXAS
The student works with their group (4.3B) to develop a detailed model (4.1G) of their light device and to identify the closed path electrical energy travels to the lights (4.8C). The student identifies the cause (4.5B) of the force (4.7) that transfers mechanical energy (4.8A) to the device.
The student plans and conducts a descriptive investigation comparing the effects (4.5B) of forces of different strengths (4.7) on the success of their device (4.2D) and constructs a data table (4.1F) to record their results. The student builds a prototype (4.1G) and describes the closed path required for the electrical energy (4.5E) to produce light (4.8C).
The student plans and conducts a descriptive investigation comparing the effects (4.5B) of forces of different strengths (4.7) on the success of their device (4.2D).
© Great Minds PBC 319 This page may be reproduced for classroom use only. PhD SCIENCE® TEXAS Level 4 ▸ Energy ▸ Lesson 21 ▸ Resource A Engineering Design Process Stage TEKS Assessed 1 Does Not Yet Meet Expectations No evidence of engagement in stage 2 Approaches Expectations Some evidence of engagement in stage 3 Meets Expectations Sufficient evidence of engagement in stage 4 Exceeds Expectations More than sufficient evidence of engagement in stage Score Plan 4.1G 4.3B 4.5B 4.7 4.8A 4.8C
Create 4.1F 4.1G 4.2D 4.5B 4.5E 4.7 4.8C
The student identifies electrical conductors and insulators (4.8B) in their device and uses that information to improve how energy flows (4.5E) through their device (4.2D). The student uses a timer to evaluate (4.1D) whether the improved structure for the design (4.5F) can keep the light on for longer (4.2D).
The student creates a final model (4.1G) that shows the path of electrical energy as it flows through (4.5E) their device to produce light (4.8C) and indicates materials that are insulators and conductors of electrical energy (4.8B).
The student constructs a graphic organizer (4.1F) to describe the forces affecting their device (4.7), the transfer of mechanical energy to their device (4.8A), and the transformation of mechanical energy into electrical energy in their device (4.5E).
320 © Great Minds PBC This page may be reproduced for classroom use only. Level 4 ▸ Energy ▸ Lesson 21 ▸ Resource A Engineering Design Process Stage TEKS Assessed 1 Does Not Yet Meet Expectations No evidence of engagement in stage 2 Approaches Expectations Some evidence of engagement in stage 3 Meets Expectations Sufficient evidence of engagement in stage 4 Exceeds Expectations More than sufficient evidence of engagement in stage Score Improve 4.1D 4.2D 4.5E 4.5F 4.8B
Share 4.1F 4.1G 4.5E 4.7 4.8A 4.8B 4.8C
PhD SCIENCE® TEXAS
Students use their final diagram, graphic organizer, data table, and prototype to communicate (4.3A) which materials are insulators and which are conductors of electrical energy (4.8B), as well as how the device uses forces (4.7), transfers energy (4.8A), and transforms electrical energy into light (4.5E, 4.8C). The student also explains the advantages of using a renewable resource in their design (4.11A). The student listens to their peers’ explanations of their designs and provides feedback related to strengths and opportunities for improving those designs (4.3C).
© Great Minds PBC 321 This page may be reproduced for classroom use only. PhD SCIENCE® TEXAS Level 4 ▸ Energy ▸ Lesson 21 ▸ Resource A Engineering Design Process Stage TEKS Assessed 1 Does Not Yet Meet Expectations No evidence of engagement in stage 2 Approaches Expectations Some evidence of engagement in stage 3 Meets Expectations Sufficient evidence of engagement in stage 4 Exceeds Expectations More than sufficient evidence of engagement in stage Score Share 4.3A 4.3C 4.5E 4.7 4.8A 4.8B 4.8C 4.11A
Alignment Map
Engineering Challenge
Assessed in each stage of the engineering design process during the Engineering Challenge.
For teacher reference, this alignment map lists the Texas Essential Knowledge and Skills
Recurring Themes and Concepts
N/A
Scientific and Engineering Practices
▪ 4.1A Ask questions and define problems based on observations or information from text, phenomena, models, or investigations.
Content Standards
4.8A Investigate and identify the transfer of energy by objects in motion , waves in water, and sound.
▪
Stage
N/A
▪ 4.5F Explain the relationship between the structure and function of objects , organisms, and systems.
▪
4.1C Demonstrate safe practices and the use of safety equipment during classroom and field investigations as outlined in Texas Education Agency-approved safety standards.
4.1C Demonstrate safe practices and the use of safety equipment during classroom and field investigations as outlined in Texas Education Agency-approved safety standards.
▪
▪ 4.8C Demonstrate and describe how electrical energy travels in a closed path that can produce light and thermal energy.
4.8A Investigate and identify the transfer of energy by objects in motion , waves in water, and sound.
▪
Ask
Imagine
4.4A Explain how scientific discoveries and innovative solutions to problems impact science and society.
▪
▪
4.1B Use scientific practices to plan and conduct descriptive investigations and use engineering practices to design solutions to problems.
4.1C Demonstrate safe practices and the use of safety equipment during classroom and field investigations as outlined in Texas Education Agency-approved safety standards.
▪
4.8B Identify conductors and insulators of thermal and electrical energy.
▪
Imagine
4.4B Research and explore resources such as museums, libraries, professional organizations, private companies, online platforms, and mentors employed in a science, technology, engineering, and mathematics (STEM) field to investigate STEM careers.
▪
322 © Great Minds PBC
page
classroom
Level 4 ▸ Energy ▸ Lesson 21 ▸ Resource A
This
may be reproduced for
use only.
PhD SCIENCE® TEXAS
Recurring Themes and Concepts
4.5B Identify and investigate cause-and-effect relationships to explain scientific phenomena or analyze problems.
▪
StageContent StandardsScientific and Engineering Practices
▪ 4.1C Demonstrate safe practices and the use of safety equipment during classroom and field investigations as outlined in Texas Education Agency-approved safety standards.
4.1G Develop and use models to represent phenomena, objects, and processes or design a prototype for a solution to a problem.
▪
▪
4.3B Communicate explanations and solutions individually and collaboratively in a variety of settings and formats.
4.5B Identify and investigate cause-and-effect relationships to explain scientific phenomena or analyze problems.
▪
▪
4.1C Demonstrate safe practices and the use of safety equipment during classroom and field investigations as outlined in Texas Education Agency-approved safety standards.
▪
4.7 Plan and conduct descriptive investigations to explore the patterns of forces such as gravity, friction, or magnetism in contact or at a distance on an object.
▪
▪
Plan
4.5E Investigate how energy flows and matter cycles through systems and how matter is conserved.
4.1F Construct appropriate graphic organizers used to collect data, including tables , bar graphs, line graphs, tree maps, concept maps, Venn diagrams, flow charts or sequence maps, and inputoutput tables that show cause and effect.
▪
4.8A Investigate and identify the transfer of energy by objects in motion , waves in water, and sound.
4.8C Demonstrate and describe how electrical energy travels in a closed path that can produce light and thermal energy.
▪
▪
4.7 Plan and conduct descriptive investigations to explore the patterns of forces such as gravity, friction, or magnetism in contact or at a distance on an object.
Create
4.1G Develop and use models to represent phenomena, objects, and processes or design a prototype for a solution to a problem.
▪
4.8C Demonstrate and describe how electrical energy travels in a closed path that can produce light and thermal energy.
▪
4.2D Evaluate a design or object using criteria.
▪
© Great Minds PBC 323 This page may be reproduced for classroom use only. PhD SCIENCE® TEXAS Level 4 ▸ Energy ▸ Lesson 21 ▸ Resource A
Themes and Concepts
Recurring
4.5E Investigate how energy flows and matter cycles through systems and how matter is conserved.
▪
and Engineering Practices
4.5F Explain the relationship between the structure and function of objects , organisms, and systems.
▪
4.1C Demonstrate safe practices and the use of safety equipment during classroom and field investigations as outlined in Texas Education Agency-approved safety standards.
▪
▪
4.8B Identify conductors and insulators of thermal and electrical energy.
▪
Improve
4.5E Investigate how energy flows and matter cycles through systems and how matter is conserved.
▪
4.1D Use tools, including hand lenses; metric rulers; Celsius thermometers; calculators; laser pointers; mirrors; digital scales; balances; graduated cylinders; beakers; hot plates; meter sticks; magnets; notebooks; timing devices ; sieves; materials for building circuits ; materials to support observation of habitats of organisms such as terrariums, aquariums, and collecting nets; and materials to support digital data collection such as computers, tablets, and cameras, to observe, measure, test, and analyze information.
4.2D Evaluate a design or object using criteria.
▪
▪
4.1C Demonstrate safe practices and the use of safety equipment during classroom and field investigations as outlined in Texas Education Agency-approved safety standards.
4.1F Construct appropriate graphic organizers used to collect data, including tables , bar graphs, line graphs, tree maps, concept maps, Venn diagrams, flow charts or sequence maps, and inputoutput tables that show cause and effect.
▪
4.7 Plan and conduct descriptive investigations to explore the patterns of forces such as gravity, friction, or magnetism in contact or at a distance on an object.
▪
▪
Share
4.1G Develop and use models to represent phenomena, objects , and processes or design a prototype for a solution to a problem.
▪
4.8A Investigate and identify the transfer of energy by objects in motion , waves in water, and sound.
4.8B Identify conductors and insulators of thermal and electrical energy.
▪
▪
4.8C Demonstrate and describe how electrical energy travels in a closed path that can produce light and thermal energy.
324 © Great Minds PBC This page may be reproduced for classroom use only. Level 4 ▸ Energy ▸ Lesson 21 ▸ Resource A
StageContent StandardsScientific
PhD SCIENCE® TEXAS
Recurring Themes and Concepts
4.5E Investigate how energy flows and matter cycles through systems and how matter is conserved.
▪
StageContent StandardsScientific and Engineering Practices
4.1C Demonstrate safe practices and the use of safety equipment during classroom and field investigations as outlined in Texas Education Agency-approved safety standards.
▪
▪
4.3A Develop explanations and propose solutions supported by data and models.
4.3C Listen actively to others’ explanations to identify relevant evidence and engage respectfully in scientific discussion.
▪
4.7 Plan and conduct descriptive investigations to explore the patterns of forces such as gravity, friction, or magnetism in contact or at a distance on an object.
▪
▪
Share
4.8A Investigate and identify the transfer of energy by objects in motion , waves in water, and sound.
4.8B Identify conductors and insulators of thermal and electrical energy.
▪
▪
4.8C Demonstrate and describe how electrical energy travels in a closed path that can produce light and thermal energy.
4.11A Identify and explain advantages and disadvantages of using Earth’s renewable and nonrenewable natural resources such as wind , water, sunlight, plants, animals, coal, oil, and natural gas.
▪
© Great Minds PBC 325 This page may be reproduced for classroom use only. PhD SCIENCE® TEXAS Level 4 ▸ Energy ▸ Lesson 21 ▸ Resource A
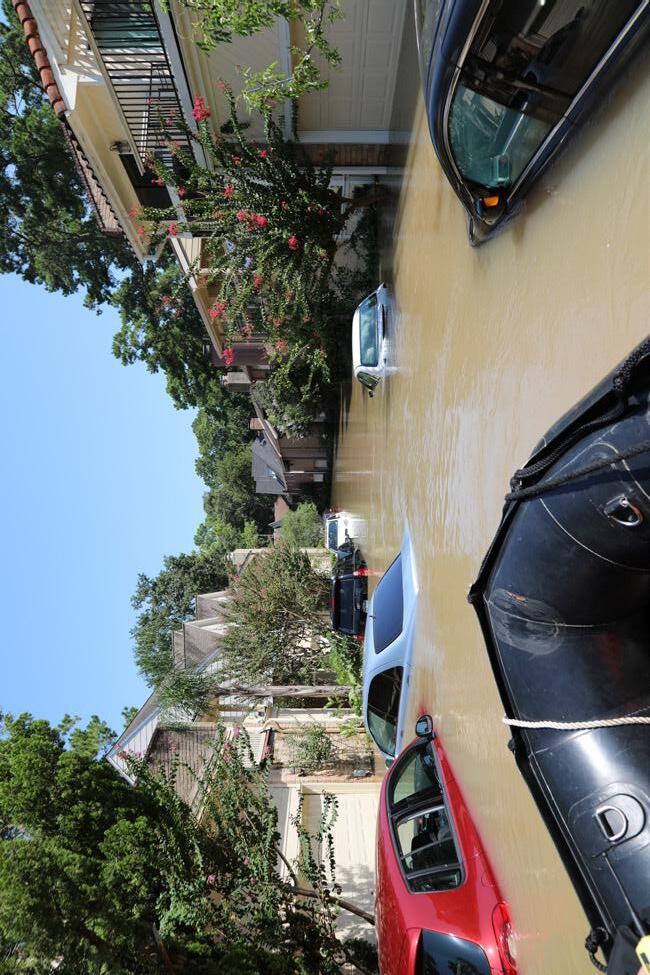
326 © Great Minds PBC This page may be reproduced for classroom use only. Level 4 ▸ Energy ▸ Lesson 21 ▸ Resource B LESSON 21 RESOURCE B Flooded Neighborhood Photograph PhD SCIENCE® TEXAS
© Great Minds PBC 327 This page may be reproduced for classroom use only. PhD SCIENCE® TEXAS Level 4 ▸ Energy ▸ Lesson 21 ▸ Resource C LESSON 21 RESOURCE C Engineering Design Process Ask Imagine Improve Plan Create Share Define the problem Redesign Receive feedback Identify criteria and constraints Research Test and evaluate Build a prototype Brainstorm solutions Select a solution Gather materials Generate detailed design
Researching
Renewable Energy Engineers
Students should use the resources available in their school and community as they research. If a school or local library is available, reach out to library personnel to collaborate on resource curation and supports for students. Provide informational texts at varying complexity levels to meet students’ reading needs. Students may benefit from access to audio and visual resources in addition to printed texts.
To synthesize information and build background knowledge before coaching students as they research, use local resources and visit the following web pages:
“Careers in Renewable Energy”
National Geographic http://phdsci.link/2441
“Renewable Energy Scientist: A Conversation with Tom Zambrano”
NASA Climate Kids
http://phdsci.link/2442
“Wind Energy Engineer” Science Buddies Career Discovery Tool
▪
▪
▪
http://phdsci.link/2443
“Solar Energy Systems Engineer” Science Buddies Career Discovery Tool
▪
http://phdsci.link/2444
328 © Great Minds PBC This page may be reproduced for classroom use only. Level 4 ▸ Energy ▸ Lesson 22 ▸ Resource
LESSON 22 RESOURCE
PhD SCIENCE® TEXAS
Energy is why things happen. Energy can transfer between objects through collisions and from place to place through water waves, electric currents, sound, thermal energy, and light.
© Great Minds PBC 329 This page may be reproduced for classroom use only. PhD SCIENCE® TEXAS Level 4 ▸ Energy ▸ Lesson 29 ▸ Resource A LESSON 29 RESOURCE A
Module Concept Statements
330 © Great Minds PBC This page may be reproduced for classroom use only. Level 4 ▸ Energy ▸ Lesson 29 ▸ Resource A
PhD SCIENCE® TEXAS
Energy transformation occurs when one phenomenon indicating the presence of energy changes into any other energy phenomenon.
© Great Minds PBC 331 This page may be reproduced for classroom use only. PhD SCIENCE® TEXAS Level 4 ▸ Energy ▸ Lesson 29 ▸ Resource B LESSON 29 RESOURCE B
Recurring Themes and Concepts Patterns
332 © Great Minds PBC This page may be reproduced for classroom use only. Level 4 ▸ Energy ▸ Lesson 29 ▸ Resource B
PhD SCIENCE® TEXAS
Cause and Effect
Scale, Proportion, and Quantity
© Great Minds PBC 333 This page may be reproduced for classroom use only. PhD SCIENCE® TEXAS Level 4 ▸ Energy ▸ Lesson 29 ▸ Resource B
334 © Great Minds PBC This page may be reproduced for classroom use only. Level 4 ▸ Energy ▸ Lesson 29 ▸ Resource B
PhD SCIENCE® TEXAS
Systems
Energy and Matter
© Great Minds PBC 335 This page may be reproduced for classroom use only. PhD SCIENCE® TEXAS Level 4 ▸ Energy ▸ Lesson 29 ▸ Resource B
Structure and Function
336 © Great Minds PBC This page may be reproduced for classroom use only. Level 4 ▸ Energy ▸ Lesson 29 ▸ Resource B
PhD SCIENCE® TEXAS
© Great Minds PBC 337 This page may be reproduced for classroom use only. PhD SCIENCE® TEXAS Level 4 ▸ Energy ▸ Lesson 29 ▸ Resource B
Stability and Change
Appendix A Energy Storyline
Anchor Phenomenon: Windmills at Work
Essential Question: How do windmills change wind to light?
Conceptual Overview
Energy can be neither created nor destroyed, but people harness energy by transferring it to the desired place or transforming it into a form people can use.
1. Energy is why things happen.
2. People can observe phenomena that indicate the presence of energy. It can be useful to classify those indicators into categories such as sound, light, thermal energy, electrical energy, and the motion of objects.
3. Energy can transfer between objects through collisions and from place to place through water waves, electric currents, sound, thermal energy, and light.
4. Energy transformation occurs when one phenomenon indicating the presence of energy changes into any other energy phenomenon.
338 © Great Minds PBC
Focus Content Standards
4.7 Plan and conduct descriptive investigations to explore the patterns of forces such as gravity, friction, or magnetism in contact or at a distance on an object.
4.8A Investigate and identify the transfer of energy by objects in motion, waves in water, and sound.
4.8B Identify conductors and insulators of thermal and electrical energy.
4.8C Demonstrate and describe how electrical energy travels in a closed path that can produce light and thermal energy.
4.11A Identify and explain advantages and disadvantages of using Earth’s renewable and nonrenewable natural resources such as wind, water, sunlight, plants, animals, coal, oil, and natural gas.
4.11B Explain the critical role of energy resources to modern life and how conservation, disposal, and recycling of natural resources impact the environment.
Concept 1: Energy Classification and Transfer (Lessons 1-11)
Focus Question: What is energy and how does it transfer from place to place?
Lessons 1–3
Phenomenon Question: How do windmills harness the wind?
Phenomenon: Windmills at Work (anchor phenomenon)
Lesson Set Objective: Students observe the transfer of energy, create a model to explain how windmills work, and develop a driving question board.
Knowledge Statement: Everything that happens in a system is caused by energy.
Wonder: First, we view historic paintings of windmills, a video of the inside of a working windmill, and photographs of present-day windmills. We ask questions about the windmills’ structure and function. The answers to these questions allow us to start finding out how these structures have helped us in the real world for many years, such as allowing people to grind wheat into flour. As technology advances, windmill designs and functions have also changed.
We notice different characteristics about the windmills:
▪ Windmills are really big. That one is taller than the trees.
▪ They look like a house with a fan on top.
▪ The windmill fans have holes in them. They also have some kind of stick that connects to the house.
▪ The windmills in the paintings look very similar.
We wonder about ideas such as these:
▪ What’s inside the house part of the windmill?
▪ What do people use windmills for? How do they work?
▪ How does the windmill spin if the fans have holes in them?
▪ Are these paintings of the same windmill? Do all windmills look like this?
▪ Why don’t these windmills look like the tall, skinny ones that I have seen before?
* The purple headings indicate the relevant content stage within the content learning cycle. See the Implementation Guide for more information on the content learning cycle.
PhD SCIENCE® TEXAS Level 4 ▸ Energy ▸ Appendix A © Great Minds PBC 339
*
Organize: We work in small groups to design our own simple paper windmill. We collaborate with other groups to determine the best design for our windmill models. We figure out that how fast the blades spin depends on the amount of wind.
Next, our teacher reads to us part of the book The Boy Who Harnessed the Wind (Kamkwamba and Mealer 2012). We participate in a group discussion about how William Kamkwamba used materials he found in his village in Malawi, Africa, to build a large windmill that could harness the wind and generate electricity for his community. He also built a machine that pumped water to save his village from drought, connecting our learning to a real-world problem.
After this discussion, we think about how to make our own present-day windmills by using circuit kits to light up a light-emitting diode (LED) with wind.
Wonder: Next, we continue to work together to answer the question, How do windmills harness the wind? We begin by viewing a photograph and diagram of a wind farm side by side.
We notice different characteristics about the two wind farms:
▪ The wind turbines are tall and skinny in both. Even the blades are skinny.
▪ Two cords or pipes are coming out of the water. Or maybe they are going in.
▪ The red lines connect the wind farm to houses. They go through other things in the middle.
We wonder about the two wind farms:
▪ In the diagram, does electricity flow through all the wires?
▪ What are those black cords in the photograph?
▪ What do these windmills do? How do they make electricity?
Organize: Next, we determine that the electricity going through the wires is energy. Then we work together as a class to develop an anchor model of how a windmill works by using evidence from our paper windmill and our circuit kit. We start to understand what energy is through these models.
We then construct a driving question board with the questions that we have regarding the changing energy in the windmill model. We plan to answer these questions: What is energy and how does it transfer from place to place? How does energy transform?
Level 4 ▸ Energy ▸ Appendix A 340 © Great Minds PBC
PhD SCIENCE® TEXAS
Essential Question: How do windmills change wind to light?
What is energy and how does it transfer from place to place?

Where does wind come from? Why does William need to have the windmill?
Will the windmill keep going after the wind is gone?
Where does our electricity come from?
How does energy transform?
How is electricity made? Does William use the electricity to cook?
Why don’t they have electricity in Malawi?
Related
Phenomena:
What else did he use the windmill to power?
How can you get electricity to your house with no windmills?
How did William connect the windmill to the light bulb?
How does the energy go from the windmill to the light bulb?
How did he connect electricity to his house?
How did the windmill make electricity? How many windmills would you need to power a whole city?
How does wind turn into electricity?
How much wind does the windmill need to power one light bulb?
Next Steps: Through class discussion, we determine that the best place to start answering the Essential Question is with the first question: What is energy and how does it transfer from place to place?
PhD SCIENCE® TEXAS Level 4 ▸ Energy ▸ Appendix A © Great Minds PBC 341
Lessons 4–5
Phenomenon Question: How do we know energy is present?
Phenomenon: Energy Indicators
Lesson Set Objective: Students observe patterns to identify indicators for the presence of energy. They use these indicators as evidence to explain when energy is present.
Knowledge Statement: Light, sound, temperature change, and motion indicate the presence of energy in a system.
Reveal: We visit seven different stations and identify how energy is present at each through patterns we observe. We classify these indicators of the presence of energy into categories: light, moving objects, temperature change, sound, and things that make something happen (e.g., electricity, batteries).
Distill: We then record these categories on an anchor chart along with our class definition of energy. We post the anchor chart for the length of the module so we can make changes to it as we discover more information.
Energy
Energy Classification and Transfer
• Energy is why things happen.
• Energy is present when we observe something happening (moving objects, light, temperature change, sound) or when something helps make something happen (electricity, batteries).
While reflecting on our experiences at the energy stations, we find a pattern: Objects that move faster seem to have more energy.
Next Steps: We decide that we want to find the answer to this question: What is the relationship between energy and speed?
Lessons 6–7
Phenomenon Question: What is the relationship between energy and speed?
Phenomenon: Effect of Energy on Speed
Lesson Set Objective: Students test a prediction by planning a fair test investigation to explore the cause and effect relationship between energy and speed.
Knowledge Statement: The speed of an object is related to the energy of the object.
Wonder: We ask questions about why a race car can move so much faster than a regular car. We wonder if energy might be related to speed.
Organize: We work together as a class to develop a working explanation that answers the question, What is the relationship between energy and speed?
Reveal: As a class, we decide on three different investigations to determine whether our explanation is correct. We use evidence from our investigations to help show the cause and effect relationship between energy and speed. However, we need to gather more evidence, so we design a fair test.
We work as a class to design a fair, reliable, and precise investigation to gather evidence about the relationship between energy and speed. We make sure to think about speed, distance, and time when we design and conduct our investigations. We practice collecting accurate data. We then analyze our data and look for patterns.
Next Steps: We wonder how we might determine whether ball bearings moving with greater speed actually have more energy. We agree that if the ball bearing has more energy, it can push an object farther, so we decide to explore the question, What happens to energy when objects collide?
Level 4 ▸ Energy ▸ Appendix A 342 © Great Minds PBC
PhD SCIENCE® TEXAS
Lessons 8–9
Phenomenon Question: What happens to energy when objects collide?
Phenomenon: Energy Changes During a Collision
Lesson Set Objective: Students collect and graph data to identify patterns in the transfer of energy between colliding objects.
Knowledge Statement: Energy in a system can transfer between objects through collisions, causing changes in the objects’ motion.
Reveal: We conduct a fair test investigation to see what happens when one ball bearing crashes into an object, an open rectangular prism that we call a catch. After we analyze our data, we make a bar graph to help us look for patterns in the data.
Distill: To help us understand how energy is transferred, we develop a class model of what happens before, during, and after the collision, being careful to show where all the energy is in the system and what phenomena we observe.
We use our models and evidence from our investigations to explain that the more energy given to an object, the greater the speed of that object, and the greater the speed of the object, the more motion energy that object can transfer to another object.
Next, we add the evidence from our models to the driving question board to answer the question, How does energy transfer from place to place?
We discover ideas such as the following:
▪ We put energy into the system by lifting the ball bearing.
▪ When more energy is transferred, the object moves with more speed.
▪ Sound means there is energy present.
▪ Temperature change means there is energy present.
We add our new knowledge to the anchor chart and update our anchor model with our new discoveries, which include the following:
▪ Wind collides with the windmill blades, pushes the blades, and transfers motion energy.
▪ Energy is carried through the wires of the windmill by an electric current.
Energy Energy Classification and Transfer
• Energy is why things happen.
• Energy is present when we observe something happening (moving objects, light, temperature change, sound) or when something helps make something happen (electricity, batteries).
• Energy can transfer between objects through collisions, causing changes in their motion.
• Transferring more energy to an object can make it move faster.
• Faster-moving objects can transfer more energy to other objects.
• Energy can also transfer from place to place through electric currents.
PhD SCIENCE® TEXAS Level 4 ▸ Energy ▸ Appendix A © Great Minds PBC 343
How a Windmill Harnesses the Wind
Wind collides with the blades, transferring energy. Looks like a box.
Electric current transfers energy through wires.
In the windmill system, wind collides with the blades, which transfers energy to something that looks like a box. An electric current transfers energy through the wires and turns on the light. When the wind blows harder, more energy is transferred to the blades.
Next Steps: We are curious about what causes an object such as the catch to slow down and stop.
Lessons 10–11
Phenomenon Question: What causes a moving object to slow down and stop?
Phenomenon: Slowing Motion
Lesson Set Objective: Students plan and conduct an investigation to find out what causes an object to slow down and stop as it moves across different materials. They use their observations to explain that friction can cause the object to slow down and stop.
Knowledge Statement: Friction can cause a moving object to slow down and stop.
Organize: We watch a video of a golfer hitting a golf ball and notice that the ball’s speed changes as it slows down and stops. We conclude that a force must be causing this change in motion.
Next, we watch a video of a golf ball rolling across grass of different heights. The ball slows down and stops as it rolls into the taller grass. We determine that the material a ball rolls on must affect its motion. Our teacher tells us that we will plan and conduct an investigation to learn more. We explore the materials available for our investigation and come up with questions we could answer by using the materials. We share our questions and work together to develop a testable question: How do different materials affect the distance a marble travels?
Reveal: Next, we determine guidelines to make sure our investigation is a fair test, and then we develop our investigation plan. We decide to roll a marble down the groove of a ruler onto three different materials to see how far it rolls. Before we begin our investigation, we predict how different materials will affect the distance the marble travels. Then we conduct our investigation by completing four trials for each material and recording our data in a table.
After the investigation we review our predictions and analyze our data. We create line plots to help us find the typical distance the marble rolls on each material. We determine that the marble travels farther on smoother materials than it travels on rougher materials.
Level 4 ▸ Energy ▸ Appendix A 344 © Great Minds PBC
whenLEDlightsup
bladesspin.
PhD SCIENCE® TEXAS
We then consider the forces acting on a marble as it rolls and determine that a force must be acting on the marble in the opposite direction of its motion. Our teacher explains that friction is a force exerted between the surfaces of objects in contact and friction causes moving objects to slow down and eventually stop.
Distill/Know: In a Conceptual Checkpoint, we describe how energy and force in a boat, water wave, and shoreline system can damage a shoreline.
Next Steps: We wonder how energy changes from one form to another.
Concept 2: Energy Transformation (Lessons 12–20)
Focus Question: How does energy transform?
Lessons 12–13
Phenomenon Question: What do we observe when energy moves through a system?
Phenomenon: Changes in Energy Indicators
Lesson Set Objective: Students observe how energy transfer in a system can produce motion, light, sound, and thermal energy. They then identify patterns and relationships in their observations to understand that energy transferred by light, sound, and thermal energy may transform to produce new energy phenomena.
Knowledge Statement: Energy is transferred and transformed as it moves through a system.
Wonder/Organize: We observe a hand-crank flashlight system and notice its components and the changes in energy indicators that happen in the system. We wonder what happens to energy as it moves through systems.
Reveal: We work in small groups and visit three different stations that focus on the following energy indicators: light, sound, and temperature change. After visiting the stations, we develop models of the movement of energy through the systems we observe. We observe the pattern that energy transforms from one indicator into another.
Organize: Our teacher shows us videos of an electric kettle and power lines, and we identify these as examples of energy transfer and transformation. We work with a partner to complete a chart where we identify more examples of systems we have seen that exhibit energy transfer and transformation.
Reveal: We work independently to revise our models of the flow of energy in the heat lamp system we previously observed. We then share our ideas, and use them to build a class model showing how energy transfers through the heat lamp system, transforming from electrical energy to light and thermal energy.
Distill: We answer and discuss summary questions to identify patterns in energy transfer and transformation processes. Then we use our knowledge of how energy moves through a system to add to the anchor chart our observation that energy transformation occurs when one energy indicator changes into any other energy indicator(s). We identify that mechanical energy is the energy an object has due to its motion, condition, or position. We also add more detail to our anchor model: The windmill transforms mechanical energy into electricity and then into light.
PhD SCIENCE® TEXAS Level 4 ▸ Energy ▸ Appendix A © Great Minds PBC 345
Energy Energy Classification and Transfer
• Energy is why things happen.
• Energy is present when we observe something happening (moving objects, light, temperature change, sound) or when something helps make something happen (electricity, batteries).
• Energy can transfer between objects through collisions, causing changes in their motion.
• Transferring more energy to an object can make it move faster.
• Faster-moving objects can transfer more energy to other objects.
• Energy can also transfer from place to place through electric currents, sound, thermal energy, and light.
Energy Transformation
• Energy transformation occurs when we observe one energy indicator changing into any other energy indicator(s).
How a Windmill Harnesses the Wind
Wind collides with the blades, transferring energy. Looks like a box.
Electric current transfers energy through wires.
The windmill transforms energy from motion into electrical energy and then into light.
In the windmill system, wind collides with the blades, which transfers energy to something that looks like a box. An electric current transfers energy through the wires and turns on the light. When the wind blows harder, more energy is transferred to the blades. The windmill system transforms energy from mechanical energy to electrical energy and then to light.
Next Steps: We wonder how energy flows through materials.
Level 4 ▸ Energy ▸ Appendix A 346 © Great Minds PBC
whenLEDlightsupbladesspin.
PhD SCIENCE® TEXAS
Lessons 14–15
Phenomenon Question: What do we observe when energy flows through materials?
Phenomenon: Conductors, Insulators, and Circuits
Lesson Set Objective: Students work in groups to supply energy to a light bulb by creating an electrical circuit and then investigate materials to determine which are conductors of electrical energy and which are not. They then examine photographs of conductors and insulators of thermal energy.
Knowledge Statement: In an electrical circuit, electrical energy travels through conductors in a closed loop.
Organize: We review what we have learned so far about electrical energy and circuits. Our teacher shows us aluminum foil, a battery, and a light bulb, and asks us how we could use the materials to make the bulb light up.
Reveal: We work in groups to make the bulb light up. We share our system with the class, and try to build a different system in which the bulb still lights up.
We notice that the bulb lights up only when all parts of the system connect in a certain way—when we make a closed-loop circuit.
Distill: We discuss what happens to electrical energy when the circuit is no longer closed, and then we draw a model of a closed circuit in which a light bulb is lit. We then describe the way electrical circuits transfer and transform energy.
Organize: Our teacher shows us a working circuit from the previous lesson and asks whether the light bulb will still light up if a new material is inserted between the aluminum foil strips and the bulb’s metal base. We decide to investigate the ways inserting different materials into a circuit affects the flow of electrical energy through the circuit.
Reveal: In groups, we insert objects made of different materials between the aluminum foil strip and the bulb in our circuit. We observe that when we insert metal objects in our closed circuit, the light bulb still lights up, but when we insert objects made of materials other than metal, the light bulb does not light up. We figure out that the metal objects are conductors, while objects made from other materials are insulators.
PhD SCIENCE® TEXAS Level 4 ▸ Energy ▸ Appendix A © Great Minds PBC 347
Organize/Reveal: Our teacher shows us photographs of common objects that commonly get hot and are made of metal. We identify the objects as conductors of thermal energy. We then observe photographs of a wooden spoon, oven mitts, and the plastic handle of an iron and identify them as thermal insulators.
Energy
Energy Classification and Transfer
• Energy is why things happen.
• Energy is present when we observe something happening (moving objects, light, temperature change, sound) or when something helps make something happen (electricity, batteries).
• Energy can transfer between objects through collisions, causing changes in their motion.
• Transferring more energy to an object can make it move faster.
• Faster-moving objects can transfer more energy to other objects.
• Energy can also transfer from place to place through electric currents, sound, thermal energy, and light.
• Electrical energy can flow in an electrical circuit from a source of electrical energy to other components only when they are connected in a closed loop.
• Conductors are materials that thermal or electrical energy can travel through easily.
• Insulators are materials that thermal or electrical energy does not travel through easily.
Energy Transformation
• Energy transformation occurs when we observe one energy indicator changing into any other energy indicator(s).
Level 4 ▸ Energy ▸ Appendix A 348 © Great Minds PBC
PhD SCIENCE® TEXAS
Distill: We update the anchor chart with our new knowledge. Our teacher shows us a circuit made of string, a battery, and a light bulb. We suggest replacing the string with an object that is a conductor. We revisit the anchor model and describe how electrical energy flows through the circuit to the LED.
How a Windmill Harnesses the Wind
Wind collides with the blades, transferring energy.
Looks like a box.
Electric current transfers energy through conductive wires.
The windmill transforms energy from motion into electrical energy and then into light.
In the windmill system, wind collides with the blades, which transfers energy to something that looks like a box. An electric current transfers energy through a closed loop of conductive wires and turns on the light. When the wind blows harder, more energy is transferred to the blades. The windmill system transforms energy from mechanical energy to electrical energy and then to light.
Next steps: We wonder how the windmill generates electricity.
Lessons 16–18
Phenomenon Question: How do windmills generate electricity?
Phenomenon: Generating Electricity
Organize: Through discussion we determine that the box behind the windmill must transform mechanical energy into electrical energy. In pictures of generators, we observe that they all have wires and magnets.
Reveal: We work in groups to build our own generators with classroom materials. We manipulate the materials by spinning the nail at different rates and discover that if we spin the nail slowly, the LED does not light, but if we increase the speed, the LED lights up. The faster we spin the nail, the more mechanical energy there is, and the mechanical energy then transforms into electrical energy.
PhD SCIENCE® TEXAS Level 4 ▸ Energy ▸ Appendix A © Great Minds PBC 349
whenLEDlightsupbladesspin.
Lesson Set Objective: Student groups build a simple generator and make observations to explain how it plays a role in both energy transfer between the windmill blades and the light and transformation of mechanical energy to electrical energy.
Knowledge Statement: A generator can be used to transform mechanical energy into electrical energy.
We make observations such as these:
▪ Energy is transferred from the spinning magnets to the wires.
▪ Electrical energy is transferred through the wires to the LED.
▪ Mechanical energy is transformed into electrical energy.
▪ Electrical energy is transformed into light energy.
Distill: After debriefing our observations of the generators, we describe the energy transfers and transformations that occurred. We add our new knowledge to the anchor chart.
Energy
Energy Classification and Transfer
• Energy is why things happen.
• Energy is present when we observe something happening (moving objects, light, temperature change, sound) or when something helps make something happen (electricity, batteries).
• Energy can transfer between objects through collisions, causing changes in their motion.
• Transferring more energy to an object can make it move faster.
• Faster-moving objects can transfer more energy to other objects.
• Energy can also transfer from place to place through electric currents, sound, thermal energy, and light.
• Electrical energy can flow in an electrical circuit from a source of electrical energy to other components only when they are connected in a closed loop.
• Conductors are materials that thermal or electrical energy can travel through easily.
• Insulators are materials that thermal or electrical energy does not travel through easily.
Energy Transformation
• Energy transformation occurs when we observe one energy indicator changing into any other energy indicator(s).
• Generators transform mechanical energy into electrical energy.
Next Steps: We agree that we are ready to answer our Essential Question: How do windmills change wind to light?
Level 4 ▸ Energy ▸ Appendix A 350 © Great Minds PBC
PhD SCIENCE® TEXAS
Lessons 19–20
Phenomenon Question: How do windmills change wind to light?
(Essential Question)
Phenomenon: Windmills at Work
Lesson Set Objective: Students revise the class anchor model and apply their new understanding of energy to explain how energy is transferred and transformed and answer the Essential Question.
Knowledge Statement: Everything that happens can be explained by the transfer and transformation of energy.
Distill: We realize that we have learned a lot about energy during the module, and list what we have learned in a key concepts checklist. Our checklist includes the following concepts:
▪ Energy transformations
▪ Energy transfers
▪ Relationship between energy and speed
▪ Different indicators of energy
Through class discussion, we also update our original anchor model to include all the items on our key concepts checklist. As we add new items to our model, we justify our reasoning with evidence from the activities we completed.
How a Windmill Harnesses the Wind
Generator behind blades transforms motion energy into electrical energy.
Electric current transfers energy through conductive wires.
Wind collides with the blades, transferring energy.
The windmill transforms energy from motion into electrical energy and then into light.
In the windmill system, wind collides with the blades, which transfers energy to a generator. The motion of the spinning blades moves the magnets inside the generator, where the mechanical energy of the spinning magnets is transformed into electrical energy. An electric current transfers energy through a closed loop of conductive wires and turns on the light. When the wind blows harder, more energy is transferred to the blades. The windmill system transforms energy from mechanical energy to electrical energy and then to light.
Next, we revisit The Boy who Harnessed the Wind (Kamkwamba and Mealer 2012) and discuss how the boy, William, solved a problem by building a windmill.
Know: In a Conceptual Checkpoint, we demonstrate our knowledge by describing energy transfer and transformation in a bicycle dynamo light system.
Next Steps: Next, we reflect on the flow of energy in systems we have observed and consider how those systems were designed to solve problems. We agree we can engineer our own devices to solve a problem and answer the question, How can we apply our knowledge of energy to solve a problem?
PhD SCIENCE® TEXAS Level 4 ▸ Energy ▸ Appendix A © Great Minds PBC 351
whenLEDlightsup
bladesspin.
Application of Concepts (Lessons 21–29): Engineering Challenge, End-of-Module Socratic Seminar, Assessment, and Debrief
Essential Question: How do windmills change wind to light?
Lessons 21–26 (Engineering Challenge)
Phenomenon Question: How can we apply our knowledge of energy to solve a problem?
Phenomenon: Apply the engineering design process to construct and refine a device that transforms energy.
Lesson Set Objective: After reviewing the engineering design process, students identify an available energy source, a desired application of energy, and the materials available to propose a solution. Students then apply what they have learned about energy transfer and transformations to design a device that transforms energy from an available form into the desired form.
Knowledge Statement: The engineering design process can be used to create a device to transfer energy and transform it from an available form into the desired form.
First, we see an image that shows a flood around people’s homes, and we discuss what we know about flooding. We learn that people have many problems when it floods, including losing power to their homes. Without light, it is difficult for people to find supplies and make sure everyone is safe.
Know: Next, we are presented with a challenge: We must help people living in an area that has flooded by designing a device to produce light so they can gather supplies. As we develop a plan in our groups, we must think about the criteria, the constraints, and the materials available to us. We discuss William Kamkwamba’s story again and think about how he used the engineering design process to come up with a solution to generate electricity for the people in his village.
Next, we develop a list of materials and think about how we can use the materials to transfer and transform energy in a device we design. We discuss which materials are conductors and which are insulators as we begin to plan our design. We research renewable energy engineers for inspiration as we work together in groups to finalize a diagram of our device.
Our device will begin working with either a contact force between the wind and pinwheel blades or between our hands and a hand crank. We think about what we have learned about mechanical energy, and we use that understanding to decide how our device will use moving parts to transfer and transform energy to light an LED bulb.
Once we complete the plan for our design, we use our materials to build it. We then test our device using different amounts of force to see how that affects how long the LED stays lit.
Next, we provide peer feedback to one another and use that information to improve our device designs. We may need to return to the Plan, Create, and Imagine stages as we work on improvements.
When we finish improving our design, we start preparing for a presentation where we share what we have learned with the class. We create a detailed model of our design and create a diagram explaining how energy is transferred and transformed in our devices. We listen to each other’s group presentations, and then we give one piece of feedback that identifies one strength or one improvement for each group’s presentation.
Next Steps: We are ready to demonstrate what we’ve learned in an End-of-Module Assessment.
Level 4 ▸ Energy ▸ Appendix A 352 © Great Minds PBC
PhD SCIENCE® TEXAS
Lessons 27-29 (End-of-Module Socratic Seminar, Assessment, and Debrief)
Phenomenon Question: How do windmills change wind to light?
(Essential Question)
Phenomenon: Windmills at Work
Lesson Set Objective: Students apply their knowledge of patterns and systems to construct explanations about energy, how it transfers from place to place, and how it transforms.
Knowledge Statement: In a system, specific indicators of energy can be produced through energy transfers and transformations.
Distill: As a class we participate in a Socratic Seminar and discuss our Essential Question: How do windmills change wind to light? We use the driving question board, the anchor chart, and the anchor model to help us answer this question.
Know: We show our understanding of energy in the End-of-Module Assessment, and then we reflect on our learning about energy and the assessment.
Next Steps: We discuss any remaining questions about energy, and then we share our thoughts about how energy plays a role in our lives and in nature.
PhD SCIENCE® TEXAS Level 4 ▸ Energy ▸ Appendix A © Great Minds PBC 353
Appendix B Energy Glossary
These Level 4–appropriate descriptions of the terminology are not intended to be complete definitions.
354 © Great Minds PBC
Term Description Lesson Circuit a system that includes a source of electrical energy and the complete path of an electric current 14 Collision when two objects hit, and exert a force on, each other 7 Conductor a material through which energy travels easily 15 Contact force a force that results when two objects touch 9 Electrical energy a type of energy that is transferred through wires by electric currents 9 Energy necessary to make something happen 3 Energy transfer the movement of energy from one part of a system to another 8 Energy transformation when one form of energy changes into another; produces changes in indicators of energy 12 Generator a device that transforms mechanical energy into electrical energy 16 Indicators of energy phenomena that show the presence of energy; can be classified as sound, light, temperature change, and motion 5
PhD SCIENCE® TEXAS Level 4 ▸ Energy ▸ Appendix B © Great Minds PBC 355 Term Description Lesson Insulator a material through which energy does not travel easily 15 Mechanical energy energy that an object has because of its motion, position, or condition 13 Speed the distance an object moves in a certain amount of time 7 System a group of objects that interact 8
Appendix C
Energy Content-Specific Words, General Academic Words, and Spanish Cognates
Key Terms (Tier Two or Three)
Word(s) Spanish Cognate
Circuit Circuito
Collision None
Conductor Conductor
Contact force Fuerza de contacto
Electrical energy Energía eléctrica
Energy Energía
Energy transfer
Energy transformation
Transferencia de energía
Transformación de energía
Generator Generador
Indicators of energy
Indicadores de energía
356 © Great Minds PBC
Key Terms (Tier Two or Three) (continued)
Word(s) Spanish Cognate
Insulator None
Mechanical energy Energía mecánica
Speed None System Sistema
Content-Specific Words (Tier Three)
Word(s) Spanish Cognate
PhD SCIENCE® TEXAS Level 4 ▸ Energy ▸ Appendix C © Great Minds PBC 357
Electricity
Friction
Generate Generar Heat None Light
Sonido Temperature Temperatura Time
Wind
Windmill
Distance Distancia
Electricidad
Fricción
None Sound
None
None
None
General Academic Words (Tier Two)
Word(s) Spanish Cognate
Analyze Analizar
Data Datos
Fair (adj.)
None
Generate Generar
Harness (v.)
None
Move Mover
Object (n.)
Objeto
Precise Preciso
Reliable None
Surface Superficie
Transfer (n./v.)
Transferencia (n.), transferir (v.)
Transform Transformar
Level 4 ▸ Energy ▸ Appendix C 358
© Great Minds PBC PhD SCIENCE® TEXAS
Earth and Space
TEXAS
Earth and Space Overview
ESSENTIAL QUESTION
How can patterns in nature be used to make predictions?
Introduction
Throughout the Earth and Space lessons, students explore seasonal and Moon phase patterns through the phenomenon of flowering plant behaviors to answer the Essential Question: How can patterns in nature be used to make predictions? Students collect and analyze data for day length, temperature, and Moon phases to identify patterns and predict future trends. The lessons conclude with an End-of-Spotlight Assessment during which students analyze data to identify relationships between seasonal and Moon phase patterns and European nightjar behaviors.
In Lesson 1, students build on their understanding of patterns by analyzing field notes that relate seasonal and Moon phase patterns to strawberry plant growth to answer the Phenomenon Question How can gardeners identify patterns in nature? Then students create a driving question board and compile their questions about how patterns in nature are connected.
During Lessons 2 through 4, students identify seasonal day length and temperature patterns and connect them to strawberry plant growth to answer the Phenomenon Question How do day length and temperature relate to strawberry growth? They begin by collecting monthly day length data to discover a yearlong sequence. Students then examine day length sequences over multiple years, construct a bar graph, identify seasonal day length patterns, and identify patterns to predict day lengths in the future. Then they analyze temperature data and construct a line graph to discover seasonal temperature patterns. Students analyze the graph to predict future temperature patterns and compare their predictions to authentic data.
In Lesson 5, students are introduced to the Peruvian apple cactus and explore the correlation between nighttime flowering behaviors and Moon
360 © Great Minds PBC
phase patterns to answer the Phenomenon Question How does the Moon’s appearance relate to Peruvian apple cactus flowers? Students observe the appearance of the Moon throughout a month to identify changes and analyze the Moon phases over a series of consecutive months to identify patterns of change. Then students use these patterns to predict future Moon shapes and flowering behaviors.
During Lessons 6 and 7, students apply their knowledge of seasonal and Moon phase patterns in a summative assessment. They are introduced
Spotlight Lessons Map
to the phenomenon of European nightjar behaviors and relate migration activity to changes in seasons and Moon phases. Students synthesize their learning as they answer the Phenomenon Question How do seasons and Moon phases relate to nightjar migration? Following the assessment, students reflect on and revise their responses to deepen their understanding of seasonal and Moon phase patterns.
Patterns in Nature
How can gardeners identify patterns in nature?
Patterns in nature are revealed by events that repeat in order.
▪ Lesson 1: Analyze data to determine if patterns exist in nature.
Seasonal Patterns
How do day length and temperature relate to strawberry growth?
Seasonal day length and temperature patterns change in predictable ways.
▪ Lesson 2: Collect observations to identify the relationship between day length and strawberry flowers.
▪ Lesson 3: Compare day length observations to identify yearlong patterns.
▪ Lesson 4: Analyze temperature data to identify seasonal patterns.
© Great Minds PBC 361 PhD SCIENCE® TEXAS Level 4 ▸ Earth and Space ▸ Overview
Student Learning Texas Essential Knowledge and Skills for Science English Language Proficiency Standards
Phenomenon
4.1A 4.2B 4.3C 4.5A 4.9A 4.9B 4C 5B
4.1E 4.1F 4.2B 4.2C 4.3A 4.3B 4.3C 4.5A 4.5B 4.5G 4.9A 1A 3H
PhenomenonStudent Learning
Moon Patterns
How does the Moon’s appearance relate to Peruvian apple cactus flowers?
The Moon phase visible from Earth changes in a predictable pattern each month.
▪ Lesson 5: Identify patterns in the appearance of the Moon, and use the patterns to make a prediction.
Nightjar Activity
How do seasons and Moon phases relate to nightjar migration?
Seasonal and Moon phase patterns can be used to make predictions.
▪ Lesson 6: Analyze data to identify and predict seasonal and Moon phase patterns. (End-of-Spotlight Assessment)
▪ Lesson 7: Analyze data to identify and predict seasonal and Moon phase patterns. (End-of-Spotlight Assessment Debrief)
362 © Great Minds PBC Level 4 ▸ Earth and Space ▸ Overview PhD SCIENCE® TEXAS
Texas Essential Knowledge and Skills for Science English Language Proficiency Standards
4.1E 4.2B 4.3C 4.5A 4.5C 4.9B 4G
4.1E 4.1G 4.2B 4.2C 4.5A 4.5C 4.5G 4.9A 4.9B 1A 4C
Focus Standards*
Texas Essential Knowledge and Skills for Science
4.1 Scientific and engineering practices. The student asks questions, identifies problems, and plans and safely conducts classroom, laboratory, and field investigations to answer questions, explain phenomena, or design solutions using appropriate tools and models. The student is expected to
4.1A ask questions and define problems based on observations or information from text, phenomena, models, or investigations;
4.1E collect observations and measurements as evidence;
4.1F construct appropriate graphic organizers used to collect data, including tables, bar graphs, line graphs, tree maps, concept maps, Venn diagrams, flow charts or sequence maps, and input-output tables that show cause and effect; and
4.1G develop and use models to represent phenomena, objects, and processes or design a prototype for a solution to a problem.
4.2 Scientific and engineering practices. The student analyzes and interprets data to derive meaning, identify features and patterns, and discover relationships or correlations to develop evidence-based arguments or evaluate designs. The student is expected to
4.2B analyze data by identifying any significant features, patterns, or sources of error; and
4.2C use mathematical calculations to compare patterns and relationships.
4.3 Scientific and engineering practices. The student develops evidence-based explanations and communicates findings, conclusions, and proposed solutions. The student is expected to
4.3A develop explanations and propose solutions supported by data and models,
4.3B communicate explanations and solutions individually and collaboratively in a variety of settings and formats, and
4.3C listen actively to others’ explanations to identify relevant evidence and engage respectfully in scientific discussion.
4.5 Recurring themes and concepts. The student understands that recurring themes and concepts provide a framework for making connections across disciplines. The student is expected to
4.5A identify and use patterns to explain scientific phenomena or to design solutions;
4.5B identify and investigate cause-and-effect relationships to explain scientific phenomena or analyze problems;
4.5C use scale, proportion, and quantity to describe, compare, or model different systems; and
4.5G explain how factors or conditions impact stability and change in objects, organisms, and systems.
4.9 The student recognizes patterns among the Sun, Earth, and Moon system and their effects. The student is expected to
4.9A collect and analyze data to identify sequences and predict patterns of change in seasons such as change in temperature and length of daylight; and
4.9B collect and analyze data to identify sequences and predict patterns of change in the observable appearance of the Moon from Earth.
© Great Minds PBC 363 PhD SCIENCE® TEXAS Level 4 ▸ Earth and Space ▸ Overview
* The bold text identifies standards that students should master in these lessons. The italicized text identifies standards that students will develop knowledge of throughout the year.
English Language Proficiency Standards
1A Use prior knowledge and experiences to understand meanings in English.
3H Narrate, describe, and explain with increasing specificity and detail as more English is acquired
4C Develop basic sight vocabulary, derive meaning of environmental print, and comprehend English vocabulary and language structures used routinely in written classroom materials.
Building Content Knowledge
Throughout the Earth and Space lessons, students explore patterns in nature by relating seasonal and Moon patterns to plant and animal behaviors. Students analyze data, identify sequences and patterns, and use their identified patterns to make predictions (4.9A, 4.9B). The lessons conclude with an assessment during which students apply their knowledge of seasonal and Moon patterns and how these patterns relate to European nightjar behaviors.
In Lesson 1, students analyze a gardener’s notes, including flowering data, seasonal trends, and Moon phase observations (4.9A, 4.9B). They determine that although some of the data have a particular sequence in the table, more data are needed to determine if patterns exist.
In Lessons 2 through 4, students analyze seasonal and strawberry growth data. They begin by identifying how day length changes across one year. Next, students analyze day length data across multiple years and conclude that there is a pattern of similar changes each year (4.9A). They compare the pattern to strawberry growth data and conclude that there is a relationship between the variables. Finally, students analyze temperature data and
4G Demonstrate comprehension of increasingly complex English by participating in shared reading, retelling or summarizing material, responding to questions, and taking notes commensurate with content area and grade level needs.
5B Write using newly acquired basic vocabulary and content-based grade-level vocabulary.
identify a seasonal temperature change pattern (4.9A). They use the pattern to predict the temperature in a subsequent year.
In Lesson 5, students explore the appearance of the Moon as it relates to Peruvian apple cactus flowers. First, students analyze Moon phases across one month and determine the sequence. Next, they compare the sequence across multiple months and determine that the Moon phase pattern repeats about once per month. Last, students use the pattern they identified to predict what the Moon will look like at the beginning of the following month (4.9B) and predict when a Peruvian apple cactus will likely have the most open flowers.
In Lessons 6 and 7, student learning culminates in an assessment in which students apply their knowledge of seasonal and Moon phase patterns to European nightjar activity. They collect and analyze data to identify and predict day length, temperature, and Moon phase patterns (4.9A, 4.9B) as they relate to nightjar observations.
364 © Great Minds PBC Level 4 ▸ Earth and Space ▸ Overview PhD SCIENCE® TEXAS
Key Terms
In this module, students learn the following terms through investigations, models, explanations, class discussions, and other experiences.
▪ Moon phase
▪ Sunrise
▪ Sunset
Safety Considerations
The safety and well-being of students are of utmost importance in all classrooms, and educators must act responsibly, prudently, and proactively to safeguard students as outlined in the Texas Education Agency–approved safety standards (4.1C). Science investigations frequently include activities, demonstrations, and experiments that require extra attention to safety measures. Educators must do their best to ensure a safe classroom environment.
The hands-on, minds-on activities of these lessons require students to interact with a variety of materials. Some of the more important safety measures to implement in this module follow.
1. Teachers must explain all safety considerations to students and review all safety expectations with them before each activity.
2. Students must carefully listen to and follow all teacher instructions. Instructions may be oral, on classroom postings, or written in the Science Logbook or other handouts.
3. Students must demonstrate appropriate classroom behavior (e.g., no running, jumping, or pushing) during science investigations. Students must handle all supplies and equipment carefully and
respectfully. Additionally, students should do their best to avoid touching their face during investigations.
4. Students and teachers must put away all food and drinks during science investigations. Investigation materials can easily contaminate food and drinks. Also, spilled food or drinks can disrupt investigations.
5. Students must never place materials in their mouth during a science investigation.
6. Students and teachers must wear personal protective equipment (e.g., safety goggles) during investigations that require this equipment. Students and teachers must wear safety goggles whenever they work with objects with sharp points (e.g., wires, toothpicks), materials made up of tiny pieces (e.g., sand), glass, projectiles (objects that move through the air), hot liquids, and liquids other than pure water.
7. Students must immediately inform teachers of any spills, breakages, or materials falling to the floor. Students must then follow all teacher instructions for cleaning up, including allowing teachers to clean up spills, breakages, and other materials that
© Great Minds PBC 365 PhD SCIENCE® TEXAS Level 4 ▸ Earth and Space ▸ Overview
may be dangerous. During investigations, items can fall to the floor even when everyone is careful. Immediate removal of debris from the floor is essential to help prevent injury.
8. Students must follow teacher instructions regarding cleanup at the end of each investigation. Teachers may ask students to return materials to specific storage locations in the classroom or to clean the surfaces of their desks with provided materials (e.g., water and paper towels). After completion of the investigation and cleanup, students must thoroughly wash their hands.
9. Teachers must monitor student activity on the internet. If students must access the internet for science research purposes, teachers must monitor students’ activity to ensure conformation with school and district policies.
More information on safety in the elementary science classroom appears in the Implementation Guide. Teachers should always follow the health and safety guidelines of their school or district. For additional information on safety in the science classroom, consult the Texas Education Agency–approved safety standards (4.1C).
366 © Great Minds PBC Level 4 ▸ Earth and Space ▸ Overview PhD SCIENCE® TEXAS
Lesson 1 Patterns in Nature Prepare
In this lesson, students build on their prior knowledge about patterns as they explore the phenomenon of patterns in nature. First, students use photographs to observe the appearance of a field during different seasons and discuss the difference between a sequence and a pattern. Students then analyze a gardener’s notes to look for patterns in data, and they conclude that they need more data to determine if the sequences they identify repeat to form patterns. Finally, students generate questions related to the Essential Question as they work together to build a driving question board.
Student Learning
Knowledge Statement
Patterns in nature are revealed by events that repeat in order.
Objective
▪ Lesson 1: Analyze data to determine if patterns exist in nature.
Earth and Space
Essential Question
How can patterns in nature be used to make predictions?
Phenomenon Question
How can gardeners identify patterns in nature?
PhD SCIENCE® TEXAS Level 4 ▸ Earth and Space ▸ Lesson 1 © Great Minds PBC 367
Standards Addressed
Texas Essential Knowledge and Skills
Content Standards
Standard Student Expectation Lesson(s)
4.9A Collect and analyze data to identify sequences and predict patterns of change in seasons such as change in temperature and length of daylight. (Introduced)
4.9B Collect and analyze data to identify sequences and predict patterns of change in the observable appearance of the Moon from Earth. (Introduced)
Scientific and Engineering Practices
Standard Student Expectation
4.1A Ask questions and define problems based on observations or information from text, phenomena, models, or investigations. 1
4.2B Analyze data by identifying any significant features, patterns, or sources of error. 1
4.3C Listen actively to others’ explanations to identify relevant evidence and engage respectfully in scientific discussion.
Recurring Themes and Concepts
Standard Student Expectation
4.5A Identify and use patterns to explain scientific phenomena or to design solutions.
Level 4 ▸ Earth and Space ▸ Lesson 1 PhD SCIENCE® TEXAS 368 © Great Minds PBC
1
1
Lesson(s)
1
Lesson(s)
1
English Language Proficiency Standards
4C Develop basic sight vocabulary, derive meaning of environmental print, and comprehend English vocabulary and language structures used routinely in written classroom materials.
5B Write using newly acquired basic vocabulary and content-based grade-level vocabulary.
PhD SCIENCE® TEXAS Level 4 ▸ Earth and Space ▸ Lesson 1 © Great Minds PBC 369
Standard Student Expectation Lesson(s)
1
1
Student Materials Lesson(s) Gardener’s Notes (Lesson 1 Resource B) (1 per group) 1 Science Logbook (Lesson 1 Activity Guide) 1 Sticky note (1) 1 Teacher Materials Lesson(s) Field through a year photographs (1 set) 1 Chart paper (1 sheet), marker (1) 1 Teacher Preparation Lesson(s) Prepare the field through a year photographs. (See Lesson 1 Resource A.) 1 Prepare to distribute a copy of Lesson 1 Resource B to each group. 1
Materials
Lesson 1
Objective: Analyze data to determine if patterns exist in nature.
Agenda
Launch (5 minutes)
Learn (35 minutes)
▪ Analyze a Gardener’s Notes (20 minutes)
▪ Build a Driving Question Board (15 minutes)
Land (5 minutes)
Launch 5 minutes
Display the field through a year photographs (Lesson 1 Resource A). Have students Think–Pair–Share what they notice and wonder about the photographs.
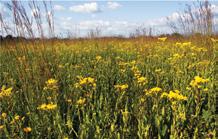
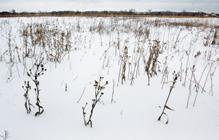
Sample student responses:
▪ I notice that the field looks different at different times of the year.
▪ I notice yellow flowers in one of the photographs.
▪ I notice snow in one of the photographs.
▪ I wonder why the plants look different in different seasons.
Acknowledge students’ responses, highlighting those that relate to seasons, and confirm that each of the photographs was taken during a different season. Work with the class to arrange the photographs to show how the seasons could change throughout the year.
Sample photograph placement:
Spotlight on Knowledge and Skills
In the Kindergarten Sky Lessons, students predict day and night patterns (K.9A). In the Level 1 Weather Conditions Lessons, students develop an understanding of yearly seasons (1.9). In the current lessons, students build on their knowledge of patterns as they analyze seasonal and Moon phase data to predict future events and flowering plant behaviors (4.9A, 4.9B).
Level 4 ▸ Earth and Space ▸ Lesson 1 PhD SCIENCE® TEXAS 370 © Great Minds PBC
Review the order of the seasons with students, and explain that seasons follow a sequence, or a specific order of events.
► Can you predict what this field will look like at a time in the future? Explain your reasoning.
▪ Yes, because I think the seasons will repeat in the same order every year.
▪ I think we can predict that the field will be covered with snow at certain times in winter.
Acknowledge that students can make some predictions because they know that the sequence of the seasons repeats every year. Explain that when a sequence of events repeats over time, this is called a pattern. Introduce the Essential Question: How can patterns in nature be used to make predictions? Tell students that in these lessons they will analyze data to identify patterns in nature and to discover how these patterns can help people make predictions about the behaviors of organisms.
English Language Development
Students will encounter the terms sequence and pattern throughout these lessons. Providing the Spanish cognates for sequence (sequencia) and pattern (patrón) may be helpful.
Teacher Note
35 minutes
Analyze a Gardener’s Notes 20 minutes
Invite students to share their experiences and prior knowledge about gardening. Then ask them to consider these questions:
► Why might someone choose to grow a garden?
▪ Gardens can grow fresh food for us to eat.
▪ The flowers in gardens look pretty.
▪ Gardens provide a habitat for bees, butterflies, birds, and other organisms.
► What patterns in nature could be helpful to a gardener and why?
▪ Gardeners need to know about patterns in rainfall because plants need water.
▪ It would be useful for a gardener to know when the temperature will start to change because different plants may grow better at different temperatures.
▪ A gardener wants to know when the different plants in their garden will produce flowers or fruit.
A particular order or sequence of events may exist without repeating. If a sequence does repeat, it is called a pattern. Students will discover in this lesson that identifying a sequence alone is not sufficient to determine if a pattern exists. The sequence must repeat to be considered a pattern.
PhD SCIENCE® TEXAS Level 4 ▸ Earth and Space ▸ Lesson 1 © Great Minds PBC 371
Learn
Acknowledge that knowing about patterns in nature can help gardeners plan their gardens. Tell students that they will look for sequences and patterns in observations made by a gardener as they explore the Phenomenon Question How can gardeners identify patterns in nature?
Divide the class into groups. Tell students that a gardener in Texas grows two types of strawberries and one type of cactus. Distribute a copy of the gardener’s notes (Lesson 1 Resource B) to each group. Explain that the gardener wants to predict when the different plants will flower each year. The gardener observed each type of plant on the first day of each month to determine if the plants produced flowers. The gardener also recorded data about three other variables on each day of observation.
► What do you notice about how the plants change during the year?
▪ I notice that the plants flower in different months, but all the plants have flowers in May and June.
▪ I notice that all the plants have flowers for a few months in a row, and then they don’t have flowers for a few months.
► What do you notice about how the other variables change during the year?
▪ I notice that the time of sunset gets later over time and then gets earlier again.
▪ I notice that the temperature is the highest during June, July, August, and September.
▪ I notice the Moon’s appearance is a little bit different most months.
Highlight responses that describe a sequence, such as temperatures getting higher and then lower throughout the year. Remind students that a pattern is when a sequence repeats over time. Then ask students to consider whether there is enough information in the table for the gardener to identify patterns and make predictions about the following year. Instruct students to work in their groups to answer the question in their Science Logbook (Lesson 1 Activity Guide).
► Can you identify patterns from the data in the table? Explain your reasoning.
▪ No, I don’t think we can identify patterns yet because we don’t know if the sequences will repeat. We need data from more years to see if the sequences repeat.
Differentiation
To support student analysis of the gardener’s notes, consider having students use a marking system (e.g., colored highlighters, different shapes) to indicate when each plant had flowers present. Students may also annotate the other columns by circling the three highest temperatures or underlining sunsets that happen after 8:00 p.m. to look for sequences in the data.
Teacher Note
In the Level 3 Forces and Motion Module, students conduct fair test investigations that introduce them to variables as conditions or factors in an investigation.
Teacher Note
Students may explain that they can identify patterns in temperature because they have already learned that seasons repeat every year. Challenge students to determine whether the data table provides enough evidence to show that temperature changes in the same way every year (5B).
Level 4 ▸ Earth and Space ▸ Lesson 1 PhD SCIENCE® TEXAS 372 © Great Minds PBC
Check for Understanding
This task is a pre-assessment. Students demonstrate an initial understanding of how to analyze seasonal and Moon data for patterns.
TEKS Assessed
4.2B Analyze data by identifying any significant features, patterns, or sources of error.
4.5A Identify and use patterns to explain scientific phenomena or to design solutions.
4.9A Collect and analyze data to identify sequences and predict patterns of change in seasons such as change in temperature and length of daylight.
4.9B Collect and analyze data to identify sequences and predict patterns of change in the observable appearance of the Moon from Earth.
Evidence
Students analyze data (4.2B) and identify sequences in flowering times, seasonal changes, and/or Moon appearance (4.9A, 4.9B), and students explain that they need additional data to determine if patterns exist in the data (4.5A).
Next Steps
If students need support to determine that patterns are not present in the gardener’s notes, guide them to analyze one column at a time. Ask students if they notice a sequence in the data. Then ask them if they see the sequence repeat in the table. Repeat for all columns in the table.
Have groups share their responses, and agree that students need more data to determine if the sequences they noticed are patterns that repeat.
► What data could we collect to see if these sequences are patterns that can be used to make predictions?
▪ We could find out when the plants flowered in other years.
▪ We could collect more data about sunset, temperature, and Moon phases to see if any of the sequences repeat.
Tell students they will analyze additional data in these Earth and Space lessons to determine if patterns exist for the variables and if the patterns are related.
Teacher Note
Flowering patterns of strawberry plants are related to seasonal changes and flowering patterns of the Peruvian apple cactus are related to both seasonal changes and the phases of the Moon. In this lesson, students make initial data observations and do not need to know which variables are related.
Consider explaining to students that variables in a table may not be related. Additionally, explain that even when two or more variables are related, one variable may not affect or cause another.
PhD SCIENCE® TEXAS Level 4 ▸ Earth and Space ▸ Lesson 1 © Great Minds PBC 373
Build a Driving Question Board 15 minutes
Instruct students to reflect on their previous questions about patterns in nature as they consider the following question:
► What else might we need to know to help us explain how patterns in nature can be used to make predictions?
Ask students to write one question on a sticky note that they think the class should answer while investigating the Essential Question. Have students share their questions with the class as they place their sticky notes on the driving question board. Prompt students to explain how their question relates to other questions already on the board.
Sample driving question board:
Teacher Note
Driving question boards are typically organized around Focus Questions. Because Spotlight Lessons do not have Focus Questions, the driving question board instead provides sample questions related to student learning (4C).


Does plant flowering relate to temperature?
Essential Question: How can patterns in nature be used to make predictions? Earth and Space Does temperature change in the same way every year?
Do any plants have patterns that relate to the Moon or the stars?
Does the Sun rise and set at the same time everyday?
Related
Phenomena: Plants in the Environment Survival and Change Weather
Are patterns in nature the same everywhere on Earth?
How do plants know when to start growing and open their flowers?
Level 4 ▸ Earth and Space ▸ Lesson 1 PhD SCIENCE® TEXAS 374 © Great Minds PBC
Land
5 minutes
Revisit the Phenomenon Question How can gardeners identify patterns in nature? Invite students to use their learning to answer the Phenomenon Question.
Sample student responses:
▪ Gardeners can make observations over time and record data.
▪ Gardeners can analyze data collected over time and see if the data repeat.
▪ Gardeners might need to collect a lot of data to see a pattern.
Confirm that collecting and analyzing data is key to identifying patterns in nature. Explain that students will analyze additional data in the coming lessons to identify patterns that exist in nature and then use patterns they discover to make predictions.
Optional Homework
Students identify patterns in their own lives, such as school schedules or types of clothing worn throughout the year. They construct data tables that include enough data to show that the patterns repeat. Students share their data with the class.
PhD SCIENCE® TEXAS Level 4 ▸ Earth and Space ▸ Lesson 1 © Great Minds PBC 375
Lessons 2–4 Seasonal Patterns Prepare
In these lessons, students learn how strawberry plant growth relates to seasonal temperature and day length changes. In Lesson 2, students watch a time-lapse video to observe how a strawberry plant grows and then analyze the growth of two different types of strawberry plants over time. Students notice that day length changes throughout the year and wonder if there is a relationship between day length and the production of strawberry flowers and fruit. In Lesson 3, students analyze two years of day length data to identify how day length changes seasonally and then analyze how strawberry fruit growth patterns relate to day length. In Lesson 4, students construct a line graph to observe temperature changes over three years and use the data to predict future temperature patterns. Then students add strawberry growth data to their temperature graph to analyze the relationship between plant growth and temperature.
Student Learning
Knowledge Statement
Seasonal day length and temperature patterns change in predictable ways.
Earth and Space
Essential Question
How can patterns in nature be used to make predictions?
Phenomenon Question
How do day length and temperature relate to strawberry growth?
Level 4 ▸ Earth and Space ▸ Lessons 2–4 PhD SCIENCE® TEXAS 376 © Great Minds PBC
Objectives
▪ Lesson 2: Collect observations to identify the relationship between day length and strawberry flowers.
▪ Lesson 3: Compare day length observations to identify yearlong patterns.
▪ Lesson 4: Analyze temperature data to identify seasonal patterns.
Standards Addressed
Texas Essential Knowledge and Skills
Content Standards
4.9A Collect and analyze data to identify sequences and predict patterns of change in seasons such as change in temperature and length of daylight. (Addressed)
Scientific and Engineering Practices
Standard
4.1E Collect observations and measurements as evidence.
4.1F Construct appropriate graphic organizers used to collect data, including tables, bar graphs, line graphs, tree maps, concept maps, Venn diagrams, flow charts or sequence maps, and input-output tables that show cause and effect.
4.2B Analyze data by identifying any significant features, patterns, or sources of error.
4.2C Use mathematical calculations to compare patterns and relationships.
4.3A Develop explanations and propose solutions supported by data and models.
4.3B Communicate explanations and solutions individually and collaboratively in a variety of settings and formats.
4.3C Listen actively to others’ explanations to identify relevant evidence and engage respectfully in scientific discussion.
PhD SCIENCE® TEXAS Level 4 ▸ Earth and Space ▸ Lessons 2–4 © Great Minds PBC 377
Standard Student Expectation Lesson(s)
2, 3, 4
Student Expectation Lesson(s)
2, 3, 4
2, 3, 4
3, 4
2
2, 3, 4
3, 4
2, 3, 4
Recurring Themes and Concepts
English Language Proficiency Standards
Level 4 ▸ Earth and Space ▸ Lessons 2–4 PhD SCIENCE® TEXAS 378 © Great Minds PBC
Standard Student Expectation Lesson(s) 4.5A Identify and use patterns to explain scientific phenomena or to design solutions. 2, 3, 4 4.5B Identify and investigate cause-and-effect relationships to explain scientific phenomena or analyze problems. 2, 3, 4 4.5G Explain how factors or conditions impact stability and change in objects, organisms, and systems. 3
Standard Student Expectation Lesson(s) 1A Use prior knowledge and experiences to understand meanings in English. 2, 4 3H Narrate, describe, and explain with increasing specificity and detail as more English is acquired. 3, 4 Materials Student Materials Lesson(s) Sunrise and sunset data table strip (1 per student pair), day length chart strip (1 per student pair) 2 Highlighter or marker (1, optional) 2 Science Logbook (Lesson 2 Activity Guide) 2 Day length data table (1 per group), bar graph template (1 per group) 3 Science Logbook (Lesson 3 Activity Guide) 3 Line graph activity (1 set per group): San Antonio temperature data table (1), prepared line graph template (1), marker (1), ruler (1) 4 Science Logbook (Lesson 4 Activity Guide) 4
PhD SCIENCE® TEXAS Level 4 ▸ Earth and Space ▸ Lessons 2–4 © Great Minds PBC 379 Teacher Materials Lesson(s) Gardener Observations Data Table (Lesson 2 Resource A) 2, 4 San Antonio Sunrise and Sunset Data (Lesson 2 Resource B) 2 Chart paper (1 sheet), tape or glue 2 Class Day Length Chart (Lesson 2 Resource E, optional) 2 San Antonio Day Length Graph (Lesson 3 Resource A) 3 Day Length and Fruiting Data Tables (Lesson 3 Resource B) 3 Class Average Day Length Graph (Lesson 3 Resource E, optional) 3 Class Strawberry Fruit Graph (Lesson 3 Resource F, optional) 3 Line graph templates: graph chart paper (7 sheets), black marker (1), meter stick (1) 4 Class Average Temperature Graph (Lesson 4 Resource C, optional) 4 San Antonio Temperature Graph (Lesson 4 Resource D) 4 Class Strawberry Data (Lesson 4 Resource E, optional) 4 Chart paper (1 sheet), marker (1) 4 Teacher Preparation Lesson(s) Cue strawberry plant video (http://phdsci.link/1840). 2 Prepare to distribute one sunrise and sunset data table strip and one day length chart strip to each student pair. (See Lesson 2 Resources C and D.) 2 Prepare to distribute one day length data table and one bar graph template to each of 8 groups. (See Lesson 3 Resources C and D.) 3 Prepare to distribute one San Antonio temperature data table to each group. (See Lesson 4 Resource A.) 4 Prepare one line graph template for each group and one additional template for demonstration. (See Lesson 4 Resource B.) 4
Lesson 2
Objective: Collect observations to identify the relationship between day length and strawberry flowers.
Agenda
Launch (8 minutes)
Learn (32 minutes)
▪ Collect Day Length Data (15 minutes)
▪ Analyze Day Length Data (17 minutes)
Land (5 minutes)
Launch 8 minutes
Tell students they will watch a time-lapse video to observe how strawberry plants grow. Play the strawberry plant growth video (http://phdsci.link/1840).
► What do you notice about how the strawberry plant changes?
▪ I notice that the flowers grow first and then the strawberries grow.
▪ I notice that the flowers disappear when the strawberries grow.
Remind students of the gardener’s notes (Lesson 1 Resource B) that showed that the strawberry plants grow flowers at specific times of the year. Display the gardener observations data table (Lesson 2 Resource A), and tell students that a gardener tracked the growing conditions of the strawberry plants and organized the observations into a data table.
Direct students’ attention to the growing conditions that the gardener recorded for each of the days.
► What do you notice about the growing conditions that the gardener recorded?
▪ The water droplet shows the amount of water both plants receive. Both plants receive the same amount of water.
▪ The Sun and the number of hours show how much Sun the plants are exposed to each day. The amount of sunlight goes up each month.
▪ The thermometer shows the temperature, which gets higher each month.
Teacher Note
In this lesson set, students observe two species of strawberry plant: the Virginia strawberry plant, or F. virginiana, and the woodland strawberry plant, or F. vesca
Within each species, some subspecies are short-day plants, some are long-day plants, and some are day-neutral plants. This lesson set features a short-day subspecies of the Virginia strawberry and a long-day subspecies of the woodland strawberry.
Level 4 ▸ Earth and Space ▸ Lesson 2 PhD SCIENCE® TEXAS 380 © Great Minds PBC
Acknowledge students’ responses, and confirm that the number of hours next to the Sun icon represents day length. Tell students that the number of minutes next to the water icon shows how long the plants were watered each day and the temperature recorded next to the thermometer icon is the day’s average temperature. Then direct students’ attention to the observations of the strawberry plants.
► What do you notice about the two different strawberry plants?
▪ Plant A has strawberries in April, and it has flowers that will become more strawberries.
▪ Plant B has no strawberries, and it does not grow flowers until June.
Highlight responses that mention that flowers and strawberries appear earlier on Plant A than on Plant B.
► Why do you think Plant A has strawberries in April and June, but Plant B does not?
▪ Both plants were watered the same amount, but the temperature and day length changed over time. Maybe Plant B needs a different amount of sunlight each day to grow strawberries than Plant A does.
▪ Plant B grew flowers later than Plant A did, so maybe Plant B needs higher temperatures to grow strawberries than Plant A does.
Highlight responses that mention the variations in day length and temperature over time. Tell students they will look at data collected by a gardener to see if there is a pattern that will help students answer the Phenomenon Question How do day length and temperature relate to strawberry growth?
Learn
32 minutes
Collect Day Length Data
15 minutes
Point out the Sun icon and day length information in the gardener observations data table (Lesson 2 Resource A).
► How do you think the gardener determined the day length?
▪ Maybe the gardener measured how long it was light outside.
▪ I think the gardener tracked the time between when the Sun came up and when it went down.
PhD SCIENCE® TEXAS Level 4 ▸ Earth and Space ▸ Lesson 2 © Great Minds PBC 381
Tell students that daytime begins at sunrise when the Sun first appears over the horizon and ends at sunset when the Sun disappears over the horizon. Inform students that the gardener measured day length from sunrise to sunset.
English Language Development
Introduce the terms sunrise and sunset explicitly. Consider providing photographs or videos that show a sunrise and a sunset. Help students understand the relationship between sunrise and sunset by asking them to identify the opposite of sunrise and the opposite of sunset.
Display the San Antonio sunrise and sunset data (Lesson 2 Resource B).
► How can you use this data table to see how day length changes over time?
▪ We can use the sunrise and sunset data to calculate how long each day is.
▪ We can analyze the sunrise and sunset data over a long period to see how the day length changes.
Place students in pairs, and assign each pair a different data set. Provide them with a sunrise and sunset data table strip (Lesson 2 Resource C) and a day length chart strip (Lesson 2 Resource D).
► How can you use the day length chart to show the total length of a day?
▪ We can color in the space between the sunrise and sunset times.
▪ We can draw a line connecting the sunrise and the sunset times to show the day’s length.
► How can you calculate your date’s day length?
▪ We can use the sunrise and sunset times to calculate the length of the day.
▪ We can count the number of boxes between sunrise and sunset to calculate the day length. Work with students to establish a heading for the final column in their data table strip (e.g., Length of Day or Day Length). Instruct pairs to think of the day length chart as a number line. Ask them to place an up arrow to correspond to the sunrise time and a down arrow to correspond to the sunset time on their assigned date. Have students shade in the time between the sunrise and sunset arrows. Instruct pairs to count the time between sunrise and sunset and record it in the final column of their data table strip. Tell students that the time between the arrows represents the daytime hours and the rest of the day length chart represents nighttime hours.
Teacher Note
In the Kindergarten Sky Lessons, students learn that dawn is when the Sun rises, and dusk is when the Sun sets. The Level 2 Objects in the Sky Lessons introduce students to the term horizon, defined as where the sky meets the ground (1A).
Teacher Note
To make content more accessible to Level 4 students, the sunrise and sunset data have been rounded to the nearest quarter hour. The data tables also omit the change to and from daylight saving time, which typically occurs in March and November, to maintain consistency in the visual representations of the data.
Teacher Note
While sunrise and sunset data are measured in 15-minute intervals in this lesson set, day length is measured in hours. Each 15-minute interval is equivalent to one quarter of an hour and should be represented as 0.25, 0.5, or 0.75 in students’ data tables.
Differentiation
To assist students in visualizing the data, consider providing them with a highlighter or marker to clearly mark the day length.
Level 4 ▸ Earth and Space ▸ Lesson 2 PhD SCIENCE® TEXAS 382 © Great Minds PBC
Sample student day length chart strip and data table strip:
Check for Understanding
Students construct an input-output table to calculate day length.
4.1F Construct appropriate graphic organizers used to collect data, including tables, bar graphs, line graphs, tree maps, concept maps, Venn diagrams, flow charts or sequence maps, and input-output tables that show cause and effect.
4.2C Use mathematical calculations to compare patterns and relationships.
4.5B Identify and investigate cause-and-effect relationships to explain scientific phenomena or analyze problems.
4.9A Collect and analyze data to identify sequences and predict patterns of change in seasons such as change in temperature and length of daylight.
Evidence
Students construct a data table (4.1F) to calculate day length (4.9A) by counting the total (4.2C) number of hours between sunrise and sunset (4.5B).
Next Steps
If students need support to calculate day length, offer a highlighter to more easily differentiate the daytime data on the day length chart. Work with students to ensure that the up arrow corresponds to sunrise and the down arrow corresponds to sunset. Guide students to count the number of whole-hour intervals between the arrows. Then have them count the 15-minute intervals, or quarters, to add to the whole-hour intervals.
PhD SCIENCE® TEXAS Level 4 ▸ Earth and Space ▸ Lesson 2 © Great Minds PBC 383
12am 10am 11am 12pm 1pm 2pm3pm4pm 5pm 6pm 7pm 8pm9pm 10pm11pm 12am 1am 2am 3am 4am 5am 6am 7am 8am 9am Day Sunrise Sunset Day Length January 15, 2018 8:30 a.m. 7:00 p.m. 10.5 hours
TEKS Assessed
Analyze Day Length Data 17 minutes
Have each student pair share their day length data with another pair. Lead a discussion about how the data can be used to identify patterns.
► What similarities or differences do you notice between your data and the other pair’s data?
▪ The day lengths are different.
▪ Sunrise is at the same time, but the sunset is at a different time.
► How can we analyze each pair’s data to discover possible patterns across the class?
▪ We can make a class data table by putting all the timelines together in order.
▪ I think we can put the strips in order by date.
Confirm that students will construct a class data table by sequencing the timelines from all pairs. Allow time for pairs to bring their day length chart strips to the front of the class, sequence them by date, and label the months to create a class data chart.
Teacher Note
Students will compare more day length data in Lesson 3. If student-made charts are challenging to line up or interpret, consider displaying the class day length chart (Lesson 2 Resource E).
Level 4 ▸ Earth and Space ▸ Lesson 2 PhD SCIENCE® TEXAS 384 © Great Minds PBC
12am 10am 11am 12pm 1pm 2pm3pm4pm 5pm 6pm7pm8pm9pm 10pm11pm 12am 1am 2am 3am 4am 5am 6am 7am 8am 9am January 12am 10am 11am 12pm 1pm 2pm 3pm 4pm 5pm 6pm 7pm 8pm9pm 10pm11pm 12am 1am 2am 3am 4am 5am 6am 7am 8am 9am February 12am 10am 11am 12pm 1pm 2pm 3pm 4pm 5pm 6pm7pm8pm9pm 10pm11pm 12am 1am 2am 3am 4am 5am 6am 7am 8am 9am March 12am 10am 11am 12pm 1pm 2pm 3pm 4pm 5pm 6pm7pm8pm9pm 10pm11pm 12am 1am 2am 3am 4am 5am 6am 7am 8am 9am April 12am 10am 11am 12pm 1pm 2pm 3pm 4pm 5pm 6pm7pm8pm9pm 10pm11pm 12am 1am 2am 3am 4am 5am 6am 7am 8am 9am May 12am 10am 11am 12pm 1pm 2pm 3pm 4pm 5pm 6pm7pm8pm9pm 10pm11pm 12am 1am 2am 3am 4am 5am 6am 7am 8am 9am June 12am 10am 11am 12pm 1pm 2pm 3pm 4pm 5pm 6pm7pm8pm9pm 10pm11pm 12am 1am 2am 3am 4am 5am 6am 7am 8am 9am July 12am 10am 11am 12pm 1pm 2pm 3pm 4pm 5pm 6pm7pm8pm9pm 10pm11pm 12am 1am 2am 3am 4am 5am 6am 7am 8am 9am August 12am 10am 11am 12pm 1pm 2pm 3pm 4pm 5pm 6pm7pm8pm9pm 10pm11pm 12am 1am 2am 3am 4am 5am 6am 7am 8am 9am September 12am 10am 11am 12pm 1pm 2pm 3pm 4pm 5pm 6pm7pm8pm9pm 10pm11pm 12am 1am 2am 3am 4am 5am 6am 7am 8am 9am October 12am 10am 11am 12pm 1pm 2pm 3pm 4pm 5pm 6pm7pm8pm9pm 10pm11pm 12am 1am 2am 3am 4am 5am 6am 7am 8am 9am November 12am 10am 11am 12pm 1pm 2pm 3pm 4pm 5pm 6pm7pm8pm9pm 10pm11pm 12am 1am 2am 3am 4am 5am 6am 7am 8am 9am December
Sample class data chart:
Prompt students to observe the class data and answer the question in their Science Logbook (Lesson 2 Activity Guide).
► Observe the class data. What patterns do you notice?
▪ The day lengths get longer and then shorter again.
▪ The day length is shorter at both ends of the year and longer in the middle of the year.
Teacher Note
In this lesson set, students examine daytime length at a location in the Northern Hemisphere. Daytime length in the Southern Hemisphere follows the opposite pattern; daytime length decreases between January and June and increases between June and December.
Land5 minutes
Ask students to reflect on the patterns they observed during the lesson.
► What additional information do we need to predict future strawberry plant growth?
▪ We need to know if the day length pattern repeats the same way every year.
▪ We need to know if the strawberry plants flower and bear fruit at the same time every year.
Tell students that in the next lesson they will explore more than 12 months of day length data and compare the data to strawberry plant growth.
PhD SCIENCE® TEXAS Level 4 ▸ Earth and Space ▸ Lesson 2 © Great Minds PBC 385
Lesson 3
Objective: Compare day length observations to identify yearlong patterns.
Agenda
Launch (5 minutes)
Learn (35 minutes)
▪ Construct Bar Graphs (25 minutes)
▪ Analyze Strawberry Fruit Data (10 minutes)
Land (5 minutes)
Launch 5 minutes
Display the San Antonio day length graph (Lesson 3 Resource A), and have students compare it to the data they collected in the previous lesson.
► How is this graph similar to the class data we collected?
▪ The graph and our class data both show the day length for each month.
▪ Both show that the day length gets longer and then gets shorter again.
▪ They both have 24 boxes total and show both daytime and nighttime hours.
► How is this graph different from our class data?
▪ Our data is not a bar graph.
▪ Our class data shows the sunrise and sunset times. The bar graph shows the number of hours of daylight.
Confirm that the two visuals show day length in San Antonio for the year 2018 differently. Tell students that the bar graph shows the day length and night length data together.
► How might the bar graph be useful when studying strawberry plant growth?
▪ We can see the pattern of both nighttime and daytime hours at the same time.
▪ We can easily count the hours of the day because it starts at 0 and goes up to 24.
Level 4 ▸ Earth and Space ▸ Lesson 3 PhD SCIENCE® TEXAS 386 © Great Minds PBC
Agree that the bar graph is a better way to view patterns in the data. Tell students that in this lesson they will look at day length patterns across multiple years by making a bar graph.
Learn
35 minutes
Construct Bar Graphs 25 minutes
Display the day length and fruiting data tables (Lesson 3 Resource B).
► How can we use data tables to determine if there is a day length pattern?
▪ We can graph the data from all the years to see if the day length sequence repeats.
▪ We can analyze the day lengths in the data table to look for patterns.
Highlight responses that mention a graph. Point out that the data tables show a large amount of information and that finding patterns in a data table can be difficult. Explain that scientists often organize their data to make analyzing the data easier and that one of the ways they do this is by graphing data to reveal patterns.
Divide the class into eight groups and provide each group with a different day length data table (Lesson 3 Resource C) and a bar graph template (Lesson 3 Resource D). Work with the class to determine how to make consistent bar graphs from the day length data tables. As students agree on how to construct the bar graphs, ask them to fill in the labels on their graphs and choose the appropriate vertical scale numbers. Assist groups as needed as they graph their data.
Teacher Note
A common student error when creating bar graphs is to not leave space between the bars of the graph, which results in a graph that looks like a histogram instead of a bar graph. Histograms and bar graphs are used to display different types of data. The space between each category supports students in processing information because each category is distinct and easily visible.
Teacher Note
If students do not suggest graphing their data, revisit the bar graph featured in the Launch, and ask how this type of graph could be used to represent the data.
Differentiation
To support students with varied graphing abilities, model how to represent the data on the graph. Some students may benefit from working in a small group or with one-on-one teacher support.
PhD SCIENCE® TEXAS Level 4 ▸ Earth and Space ▸ Lesson 3 © Great Minds PBC 387
Sample graph template and completed graph:
When groups have completed their bar graphs, bring the class together to combine the data in sequential order starting with January 2019. Instruct all groups except the January through March group to fold their graph paper along the vertical axis so that all the graphs can be combined. Combine the graphs to display the class data.
Sample class graph:
Teacher Note
Students do not learn the terms x-axis and y-axis until later levels. At this point, do not use these terms with students. Instead, consider referring to the axes as lines that go up and across.
Teacher Note
If student-made graphs are challenging to line up or interpret, consider displaying the class average day length graph (Lesson 3 Resource E). Alternately, tape the graphs to a large board or glue them to chart paper.
Spotlight on Knowledge and Skills
After assembling the class bar graph, ask students to observe the results and discuss their observations.
In these lessons students observe, describe, and predict yearly patterns in how day length changes (4.9A, 3H). In the Level 5 Sun, Earth, and Moon System Module, students will explore how Earth’s rotation on its axis causes the day/night cycle (5.9).
Level 4 ▸ Earth and Space ▸ Lesson 3 PhD SCIENCE® TEXAS 388 © Great Minds PBC
10 11 12 13 14 15 16 17 18 19 20 21 22 23 24 January February Average Day Length 2019 Hours in a Day March
8 9 10 11 12 13 14 15 16 17 18 19 20 21 22 23 24 7 6 5 4 3 2 0 January February Hours in Day March Day Length 2019 Day Length 2019 April May June Day Length 2019 July August September Day Length 2019 ctober November December Day Length 2020 January February March Day Length 2020 April MayJune Day Length 2020 July August September Day Length 2020 ctober November December
► What do you notice about the data?
▪ I see the days are shorter in December and January and then longer in June and July.
▪ The pattern repeats in 2019 and 2020, and the day length changes in the same way every year.
▪ The days are shorter, then get longer, then get shorter again.
Ask students to name the four seasons that occur every year. Use students’ responses to record Winter, Spring, Summer, and Fall on the board. Ask students to work with a partner to discuss the months they think belong in each season. Invite volunteers to share how they grouped the months into seasons.
Sample student responses:
▪ We think April and May are in the spring.
▪ We put June, July, and August in summer.
▪ We grouped December, January, and February in winter.
Use students’ responses to explain that seasons can be described by the events and weather conditions that occur during different times of the year. Explain that observations of weather conditions are used to group the months, and write the months on the board with their corresponding seasons.
▪ Winter: December, January, February
▪ Spring: March, April, May
▪ Summer: June, July, August
▪ Fall: September, October, November
Label the seasons on the class bar graph, and instruct students to Jot–Pair–Share to answer the question in their Science Logbook (Lesson 3 Activity Guide).
► How does day length change in each season?
▪ The days are always short in the winter and get longer in the summer.
▪ The days are shortest in the winter months of December, January, and February, and the longest in the summer months of June, July, and August.
PhD SCIENCE® TEXAS Level 4 ▸ Earth and Space ▸ Lesson 3 © Great Minds PBC 389
Check for Understanding
Students analyze a bar graph to identify seasonal day length patterns.
TEKS Assessed
4.2B Analyze data by identifying any significant features, patterns, or sources of error.
4.5G Explain how factors or conditions impact stability and change in objects, organisms, and systems.
4.9A Collect and analyze data to identify sequences and predict patterns of change in seasons such as change in temperature and length of daylight.
Evidence
Students analyze (4.2B) a class bar graph to identify that changes to seasonal day length (4.5G) repeat in a predictable way (4.9A).
Next Steps
If students need support to analyze the bar graph, prompt them to find the tallest bars on the graph and notice the monthly data. Repeat the process with the shortest bars on the graph. Ask students to describe the pattern of long and short days each year.
Analyze Strawberry Fruit Data
10 minutes
Revisit the day length and fruiting data tables (Lesson 3 Resource B). Give students a few minutes to review the data for their assigned months.
► How can we use the bar graph and the fruiting data to determine if strawberry fruit growth is related to day length?
▪ We can show which months the strawberries grew by coloring the bars different colors and then looking for a pattern.
▪ We can label the graph to show when Plant A and Plant B grew strawberries.
Acknowledge students’ responses and confirm that they can draw on the class graph to show when Plants A and B produced strawberries. Work with students to create a symbol to represent when Plant A produces strawberries and a symbol to represent when Plant B produces strawberries. Have a student
Level 4 ▸ Earth and Space ▸ Lesson 3 PhD SCIENCE® TEXAS 390 © Great Minds PBC
from each former group draw a symbol above the appropriate months in that group’s section of the class bar graph to represent each month the strawberry plants produced fruit.
Sample class data graph: Teacher Note
If student-made graphs are challenging to annotate, consider displaying the class strawberry fruit graph (Lesson 3 Resource F).
When students finish annotating the graph, analyze the results as a class.
► As you look across the data, what patterns do you notice?
▪ Each kind of strawberry grows at the same time each year.
▪ Plant A grows strawberries when the days are getting longer.
▪ Plant B grows strawberries when the days are getting shorter.
► If the gardener wanted strawberries in March, which strawberry plant should they grow and why?
▪ The gardener should grow Plant A because Plant A grows strawberries when the days are shorter.
▪ They should grow Plant A because Plant B does not grow strawberries in March.
Confirm that each kind of plant produces strawberries at the same time each year. Tell students that Plant A is a short-day plant because it begins strawberry growth when the days are shorter and Plant B is a long-day plant because it grows fruit when the days are longer than 12 hours.
Teacher Note
These plants are called short-day and long-day plants, but the length of nighttime determines when the plants grow flowers.
For more information on how plants respond to changes in daytime length, refer to Oregon State University’s “What are short-day and long-day plants?” web page (http://phdsci.link/1843).
PhD SCIENCE® TEXAS Level 4 ▸ Earth and Space ▸ Lesson 3 © Great Minds PBC 391
Day Length 2019 8 9 10 11 12 13 14 15 16 17 18 19 20 21 22 23 24 7 6 5 4 3 2 0 January February Hours in a Day March Day Length 2019 April MayJune Day Length 2019 July August September Day Length 2019 ctober November December Day Length 2020 January February March Day Length 2020 April MayJune Day Length 2020 July August September Day Length 2020 ctober November December WinterWinterSpringSummerFallWinterSpringSummerFall A A A A A A A A B B B B B B B B B B
Land5 minutes
Direct students’ attention to the class day length bar graph. Point out the season labels along the horizontal axis of the graph. Ask students to share what they know about the weather conditions during each season. Prompt them to include observations of the strawberry plant data in their responses.
► What do you know about the weather in the different seasons?
▪ I know it’s always hot in the summer when Plant B grows fruit.
▪ It is rainy and colder in the fall and winter, and neither plant grows fruit for most of the fall and winter.
▪ It is usually warm in springtime when Plant A grows fruit.
Highlight responses that mention temperature, and tell students that in the next lesson they will analyze temperature data and strawberry fruit growth.
Optional Homework
Students discuss with an adult how the current month’s day length compares with the previous month’s day length. Then students predict how the day length will change in the next month.
Level 4 ▸ Earth and Space ▸ Lesson 3 PhD SCIENCE® TEXAS 392 © Great Minds PBC
Lesson 4
Objective: Analyze temperature data to identify seasonal patterns.
Launch
Agenda
Launch (4 minutes)
Learn (35 minutes)
▪ Discuss Data Tables (4 minutes)
▪ Construct a Line Graph (23 minutes]
▪ Analyze Strawberry Data (8 minutes]
Land (6 minutes)
4 minutes
Display the gardener observations data table (Lesson 2 Resource A). Point out that both temperature and day length change for each observation.
► How can we determine if temperature is also related to strawberry growth throughout a year?
▪ We can collect temperature data and observe strawberry growth for a year.
▪ We can experiment to find out if strawberries grow differently in different temperatures.
Confirm that students can look at temperature data for each month to analyze how the temperature changed throughout that year. Tell students they will use a gardener’s observations to collect temperature data and compare the data to strawberry growth.
Learn
35 minutes
Discuss Data Tables 4 minutes
Tell students that the gardener collected temperature and growth information for both strawberry plants. Divide the class into groups and distribute a different San Antonio temperature data table (Lesson 4 Resource A) to each group. Give groups a few minutes to review their data tables.
Spotlight on Knowledge and Skills
In the Level 1 Weather Conditions
Lessons, students use changes in nature to describe seasonal patterns (1.9, 1A). In this lesson, students use day length and temperature to predict patterns of change in seasons (4.9A, 3H).
PhD SCIENCE® TEXAS Level 4 ▸ Earth and Space ▸ Lesson 4 © Great Minds PBC 393
► How can we use the data tables to help find patterns that might show a relationship between temperature and strawberry growth?
▪ We can use the data tables to make a graph of temperature changes.
▪ We can graph temperature data just like we graphed the day length data.
Acknowledge students’ responses, and tell groups they will construct a line graph by using the San Antonio temperature data. Explain that each group will graph a different data set to contribute to a class line graph to show temperature changes in San Antonio from 2018 to 2020.
Construct a Line Graph 23 minutes
Give each group a ruler and a line graph template. (See Lesson 4 Resource B.) Draw students’ attention to the title, the horizontal and vertical axes, and the labels on the demonstration template. Point out the vertical axis title of Temperature (°F), and prompt students to work in their groups to label the vertical axis on their line graph. Circulate to provide support.
Draw groups’ attention to the lines along the bottom of each graph, and point out the horizontal axis title of Month. Direct groups to label the six months from their data table on the horizontal line. Prompt each group to find the average temperature data for their first month in their assigned table.
Use the line graph demonstration template to show groups how to plot a month’s average temperature on the graph. (See Lesson 4 Resource B.) Locate the number closest to the average temperature on the vertical line. Place a finger on the number, align a meter stick horizontally next to the finger, and let the meter stick extend lengthwise across the graph. Move the finger along the meter stick, stopping above the month label. Place a dot that aligns with both the month and average temperature. Repeat the procedure to plot one more point along the graph. Use the meter stick to connect the two points. Instruct students to plot their six data points by using the same procedure. Circulate to provide support as needed.
After groups plot their data points, bring the class together to combine the data in sequential order starting with January 2018. Instruct all groups except the January through June group to fold their chart paper along the vertical axis so that all the graphs can be combined. Combine the graphs to display the class data, and ask students to observe the graph and look for patterns in the data.
Differentiation
Consider providing students with connecting words to describe the patterns they observe, such as then, first, or next (3H).
Level 4 ▸ Earth and Space ▸ Lesson 4 PhD SCIENCE® TEXAS 394 © Great Minds PBC
Sample class line graph:
Teacher Note
If student-made graphs are challenging to line up or interpret, consider displaying the class average temperature graph (Lesson 4 Resource C).
► What do you notice about the temperature across the years?
▪ It is cold in the beginning of the year, gets warmer in the first six months, and then gets colder again in the last six months of the year.
▪ The temperature changes the same way each year.
Acknowledge students’ responses. Instruct students to use the class line graph to predict temperature patterns for January through June 2022 in their Science Logbook (Lesson 4 Activity Guide).
Differentiation
Some students may need support to draw the upward trending line. Encourage students to plot predicted temperature points for each month and to use a ruler to connect the data points.
► How did you make your prediction?
▪ I know the weather is cold in the winter and gets warmer in the summer months.
▪ I know it is cold in the winter and warm in the summer, so I drew a line from colder temperatures to warmer temperatures.
PhD SCIENCE® TEXAS Level 4 ▸ Earth and Space ▸ Lesson 4 © Great Minds PBC 395
Average Temperature, 2018 JanuaryFebruary Temperature (°F) March Month AprilMayJune 100 90 80 70 60 50 40 30 20 10 Average Temperature, 2018 JulyAugustSeptember Month OctoberNovemberDecember JulyAugustSeptemberOctoberNovemberDecember JulyAugustSeptemberOctoberNovemberDecember Average Temperature, 2019 JanuaryFebruaryMarch Month AprilMayJune Average Temperature, 2019 Month January Average Temperature, 2020 FebruaryMarch Month AprilMayJune Average Temperature, 2020 Month
student response: Average Temperature, January–June 2022 JanuaryFebruary Temperature (°F) MarchApril May June 100 0 90 80 70 60 50 40 30 20 10 Month
Sample
Check for Understanding
Students construct a line graph to predict seasonal temperature changes.
TEKS Assessed
4.1F Construct appropriate graphic organizers used to collect data, including tables, bar graphs, line graphs, tree maps, concept maps, Venn diagrams, flow charts or sequence maps, and input-output tables that show cause and effect.
4.5A Identify and use patterns to explain scientific phenomena or to design solutions.
4.9A Collect and analyze data to identify sequences and predict patterns of change in seasons such as change in temperature and length of daylight.
Evidence
Students use patterns (4.5A) observed in previous years’ data to construct a line graph (4.1F) to predict an upward trend in temperature (4.9A) for the first six months of a new year.
Next Steps
If students need support to draw a line graph, refer to the class line graph, and ask students which set of months their line graph should most closely match. Help students identify the upward trend in temperature from January through June of each year.
Display the San Antonio temperature graph (Lesson 4 Resource D). Have students compare the actual data in the graph to their predictions.
Level 4 ▸ Earth and Space ▸ Lesson 4 PhD SCIENCE® TEXAS 396 © Great Minds PBC
Average Temperature, January–June 2022 80 90 100 70 60 50 40 30 20 10 0 January February Temperature (°F) March April May June Month
Sample student responses:
▪ My graph was kind of right. The exact numbers weren’t the same, but my line goes up like the actual data.
▪ The actual graph shows a higher temperature in June than what I predicted.
Analyze Strawberry Data 8 minutes
Direct students’ attention to the class line graph and group data tables. Ask students to consider how to incorporate the strawberry fruit data into the line graph.
► How can we use the graph and data table to see if strawberry fruiting is related to temperature?
▪ We can show which months the strawberries grew by adding symbols like we did with the day length graph.
▪ We can label when strawberries grew above the months on the graph and see if they grew when it was warm or cold.
Acknowledge students’ responses, and confirm that students can draw on the line graph to show when the plants produced strawberries. Have students look at their data tables to determine if strawberries grow on either plant during their date range. Invite each group to share strawberry growth results from their date range. Agree as a class on a symbol to represent each plant. Draw a symbol near the data point above the appropriate months to represent each month the strawberry plants produced fruit. Have students look for patterns in the graphs.
Sample class line graph:
Teacher Note
If student-made graphs are challenging to annotate, consider displaying the class strawberry data (Lesson 4 Resource E).
► What do you notice about the strawberry data?
▪ Some strawberries grow when it is cooler in the winter and spring but don’t grow after it gets hot in the summer.
▪ Plant B grows strawberries in months when it’s hotter.
PhD SCIENCE® TEXAS Level 4 ▸ Earth and Space ▸ Lesson 4 © Great Minds PBC 397
Average Temperature, 2018 JanuaryFebruary Temperature (°F) March Month AprilMayJune 100 90 80 70 60 50 40 30 20 10 Average Temperature, 2018 JulyAugustSeptember Month OctoberNovemberDecember JulyAugustSeptemberOctoberNovemberDecember JulyAugustSeptemberOctoberNovemberDecember Average Temperature, 2019 JanuaryFebruaryMarch Month AprilMayJune Average Temperature, 2019 Month January Average Temperature, 2020 FebruaryMarch Month AprilMayJune Average Temperature, 2020 Month A A A A A A A A A A A A B B B B B B B B B B B B B B B
Confirm that Plant A grows best during cooler spring months, while Plant B typically produces fruit when the weather is warmer.
Land
6 minutes
Revisit the Phenomenon Question How do day length and temperature relate to strawberry growth? Work with students to write statements that summarize the patterns they observed. Add these statements to a class anchor chart with the heading Seasonal Patterns. Post the anchor chart in a prominent place in the classroom.
Sample anchor chart:
Seasonal Patterns
• Days get longer in the summer and shorter in the winter.
• Temperature is higher in the summer and lower in the winter.
• Temperature and day length changes repeat in the same way every year.
• Strawberry growth is related to day length and temperature and repeats in the same way every year.
Turn students’ attention to the driving question board, and ask students whether their new knowledge helps answer any of their questions. As students listen to their peers, they can use nonverbal signals to indicate whether they agree or disagree with each idea.
Ask students which questions on the driving question board remain unanswered. Highlight any questions related to the Moon or nighttime patterns. Tell students that in the next lesson they will collect and analyze data to discover another way that patterns in nature can be used to make predictions as they learn more about the Peruvian apple cactus and its flowering behavior.
Level 4 ▸ Earth and Space ▸ Lesson 4 PhD SCIENCE® TEXAS 398 © Great Minds PBC
Lesson 5 Moon Patterns
Prepare
In this lesson, students explore changes to the appearance of the Moon as they investigate the Phenomenon Question
How does the Moon’s appearance relate to Peruvian apple cactus flowers?
First, students observe photographs of Peruvian apple cactus flowers and notes taken by a gardener and wonder if the changing appearance of the Moon relates to the opening of the flowers. Next, students analyze photographs of the Moon over consecutive months to identify patterns of change in its appearance as viewed from Earth. Finally, students use the pattern of the Moon’s changing appearance to predict what the Moon will look like in the future and when the most Peruvian apple cactus flowers will be open.
Student Learning
Knowledge Statement
The Moon phase visible from Earth changes in a predictable pattern each month.
Objective
▪ Lesson 5: Identify patterns in the appearance of the Moon, and use the patterns to make a prediction.
Earth and Space
Essential Question
How can patterns in nature be used to make predictions?
Phenomenon Question
How does the Moon’s appearance relate to Peruvian apple cactus flowers?
PhD SCIENCE® TEXAS Level 4 ▸ Earth and Space ▸ Lesson 5 © Great Minds PBC 399
Standards Addressed
Texas Essential Knowledge and Skills
Scientific and Engineering Practices
Recurring Themes and Concepts
English Language Proficiency Standards
comprehension of increasingly complex English by participating in shared reading, retelling or summarizing material, responding to questions, and taking notes commensurate with content area and grade level needs.
Level 4 ▸ Earth and Space ▸ Lesson 5 PhD SCIENCE® TEXAS 400 © Great Minds PBC
Content Standards Standard Student Expectation Lesson(s) 4.9B Collect and analyze data to identify sequences and predict patterns of change in the observable appearance of the Moon from Earth. (Addressed) 5
Standard Student Expectation Lesson(s) 4.1E Collect observations and measurements as evidence. 5 4.2B Analyze data by identifying any significant features, patterns, or sources of error. 5 4.3C Listen actively to others’ explanations to identify relevant evidence and engage respectfully in scientific discussion. 5
Standard Student Expectation Lesson(s) 4.5A Identify and use patterns to explain scientific phenomena or to design solutions. 5 4.5C Use scale, proportion, and quantity to describe, compare, or model different systems. 5
Standard Student Expectation Lesson(s) 4G Demonstrate
5
PhD SCIENCE® TEXAS Level 4 ▸ Earth and Space ▸ Lesson 5 © Great Minds PBC 401 Materials Student Materials Lesson(s) Science Logbook (Lesson 5 Activity Guide) 5 Moon calendars (1 month per student pair) 5 Teacher Materials Lesson(s) Peruvian Apple Cactus Photographs (Lesson 5 Resource A) 5 Gardener’s Peruvian Apple Cactus and Moon Notes (Lesson 5 Resource B) 5 Moon calendar for month following current month (1) 5 Teacher Preparation Lesson(s) Prepare Moon calendars. (See Lesson 5 Resource C.) 5
Lesson 5
Objective: Identify patterns in the appearance of the Moon, and use the patterns to make a prediction.
Agenda
Launch (5 minutes)
Learn (35 minutes)
▪ Observe Photographs of the Moon (15 minutes)
▪ Identify Patterns and Make Predictions About the Moon (20 minutes)
Land (5 minutes)
Launch
5 minutes
Display the Peruvian apple cactus photographs (Lesson 5 Resource A). Tell students that the photograph on the left was taken during the day and the photograph on the right was taken at night. Ask students what they notice and wonder.
Sample student responses:
▪ I notice that the cactus flowers are white on the inside and red on the outside.
▪ I notice that the flowers are closed in one photo and open in the other.
▪ I wonder why one of the photographs was taken at night.
Level 4 ▸ Earth and Space ▸ Lesson 5 PhD SCIENCE® TEXAS 402 © Great Minds PBC
Highlight students’ responses that mention the open and closed flowers, and remind students that the photograph of the open flowers was taken at night. Explain to students that the flowers of the Peruvian apple cactus open at night and that each flower is open for only one night.
Explain that a gardener observed eight Peruvian apple cactus plants weekly during summer. On each night of observation, the gardener counted the total number of flowers open on the plants and recorded the data. The gardener also made drawings to show how the Moon appeared each night. Display the gardener’s Peruvian apple cactus and Moon notes (Lesson 5 Resource B). Ask students what they notice and wonder.
Sample student responses:
▪ I notice that the Moon is a full circle when there are more than one hundred flowers open.
▪ I notice that there are fewer open flowers when half of the Moon or no Moon is showing.
▪ I wonder if the Moon affects the cactus flowers.
Acknowledge students’ responses, and confirm that for the Peruvian apple cactus, the number of open flowers peaks each time the Moon appears as a full circle.
► Do you think the gardener can predict which nights will have the most open flowers in the future? Explain your reasoning.
▪ Yes, if the gardener can predict which nights the Moon appears as a full circle.
▪ It depends on whether the appearance of the Moon always follows the same pattern.
Highlight uncertainty about predicting the Moon’s appearance, and introduce the Phenomenon Question How does the Moon’s appearance relate to Peruvian apple cactus flowers? Tell students they will analyze data to find out more about how the Moon’s shape appears to change.
Teacher Note
The flowers of the Peruvian apple cactus open shortly before sunset and close shortly after sunrise. Therefore, the flowers are open only for short periods of time during daylight hours.
Spotlight on Knowledge and Skills
Learn 35 minutes
Observe Photographs of the Moon 15 minutes
Place students in pairs and provide each pair with a different month’s Moon calendar from the past year. (See Lesson 5 Resource C.) Point out the month and year above each calendar, and explain that each
In the Level 2 Objects in the Sky Lessons, students learn about shadows on the Moon and that the Sun illuminates the Moon (2.9A). In the Level 5 Sun, Earth, and Moon System Module, students deepen their understanding of why the Moon’s appearance from Earth changes over time. In the current lessons, students do not investigate why the Moon has phases; instead, students analyze data and notice patterns (4.9B).
PhD SCIENCE® TEXAS Level 4 ▸ Earth and Space ▸ Lesson 5 © Great Minds PBC 403
student pair will view photographs of the Moon from a different month. Allow students to independently observe the shape of the Moon during their month and to reflect on what they notice. Then prompt students to discuss the following question with their partner.
► How did the appearance of the Moon change during the month?
After students discuss the photographs in pairs, invite volunteers to share their observations with the class.
Sample student responses:
▪ The Moon looks like it got smaller until we couldn’t see it anymore. Then it started to look bigger until it was a full circle.
▪ At the beginning of the month, we could see part of the Moon. Then the Moon started to look bigger, and we could see a little more each day. Then we couldn’t see the Moon at all.
Acknowledge that the Moon appears to have different shapes on different days. Tell students that the shape of the bright portion of the Moon visible from Earth is called the Moon phase. Explain that when the Moon appears as a full circle, the Moon phase is called a full moon. When the Moon appears completely dark, the Moon phase is called a new moon. Have students organize these new terms by completing the Images terminology learning routine. Ask students to work in pairs to label the full moon and new moon phases on their calendars. Circulate to provide support.
English Language Development
Introduce the term Moon phase explicitly. Providing the Spanish cognate for phase (fase) may be helpful. Consider asking students to share any questions that they have about the term (4G).
Combine each student pair with another to make groups of four. Instruct students to discuss the similarities and differences in the appearance of the Moon during their two calendar months. Bring the class back together, and invite volunteers to share what they noticed.
Sample student responses:
▪ There is a full moon and a new moon in both months.
▪ The bright parts of the Moon change between the full moon and new moon phases.
Teacher Note
The images on the Moon calendars show the approximate appearance of the Moon from Earth each night.
English Language Development
Students will encounter the terms full moon and new moon throughout the lesson set. Consider using the Moon calendar to show students examples of each.
Teacher Note
Images is a terminology learning routine in which students view an image that represents the topic of study. Students label or add annotations to the image to show additional information or connections. Then students discuss what the image represents (4G).
Level 4 ▸ Earth and Space ▸ Lesson 5 PhD SCIENCE® TEXAS 404 © Great Minds PBC
Highlight the similarities and differences between the two months that students observed, and wonder aloud if any patterns exist across an entire year.
Identify Patterns and Make Predictions About the Moon 20 minutes
Work with students to sequence the Moon calendars in chronological order, and post them side by side in the classroom. Have students participate in a Gallery Walk routine to observe how the appearance of the Moon changes each month throughout the year. Encourage students to look for patterns.
After students have viewed the calendars for the year, bring the class back together, and direct students to answer the question in their Science Logbook (Lesson 5 Activity Guide).
► What patterns do you notice about the appearance of the Moon?
▪ There is a full moon and a new moon each month.
▪ The Moon phases change the same way over and over again. The bright part of the Moon looks a little bigger each day until it is full, and then it looks smaller each day until we can’t see it anymore.
Invite volunteers to share their responses with the class. Guide students to notice the Moon phase patterns throughout the year: After a new moon, the bright part of the Moon appears to get bigger until it is a full moon, and after the full moon, the bright part of the Moon gets smaller again. Tell students that the phases repeat in the same order about once per month.
Remind students that patterns can be used to make predictions. Draw students’ attention to the last month of the posted Moon calendars. Ask students to predict what the Moon will look like on the first day of the next month. Provide time for students to discuss their ideas with a partner, and then direct students to draw their predictions in their Science Logbook (Lesson 5 Activity Guide). Finally, have students record their responses to the next question in their Science Logbook.
► How did you predict what the Moon will look like on the first day of the next month?
▪ The shape of the Moon on the last few days of the month was a little bigger each day. I know the Moon looks bigger until it is a full moon, so I drew it a little bigger than the day before.
▪ Moon phases follow the same pattern over and over. I looked at the pattern from the other months to predict the next shape in the pattern.
Teacher Note
Do not reveal the calendar for the next month yet. That calendar will be introduced later in the lesson.
Differentiation
Some students may have difficulty identifying patterns because the lunar cycle is slightly shorter than a calendar month and the Moon phases do not fall on the same day of each month. Encourage these students to focus on the shapes of the Moon instead of on specific dates or times of the month.
Extension
Students use patterns of the observable appearance of the Moon to predict the Moon phase on a significant day in their life. Students write their prediction on a class chart and observe the appearance of the Moon on that date. Students may also use a Moon phase calculator to evaluate their prediction.
PhD SCIENCE® TEXAS Level 4 ▸ Earth and Space ▸ Lesson 5 © Great Minds PBC 405
Check for Understanding
Students analyze Moon phase data to identify patterns and make predictions about what the Moon will look like in the future.
TEKS Assessed
4.2B Analyze data by identifying any significant features, patterns, or sources of error.
4.5A Identify and use patterns to explain scientific phenomena or to design solutions.
4.9B Collect and analyze data to identify sequences and predict patterns of change in the observable appearance of the Moon from Earth.
Evidence
Students analyze Moon phase data (4.2B) to identify patterns (4.5A) in the appearance of the Moon from Earth (4.9B).
Next Steps
If students need support to identify patterns, direct their attention to one of the Moon calendars displayed in the classroom. Draw boxes around the dates on which the new moon and the full moon occur for that month. Ask students to describe how the Moon changes each day as it transitions from a new moon to a full moon. Then direct students’ attention to Moon calendars from other months, and work with students to establish that the appearance of the Moon follows the same sequence each month.
Students use Moon phase patterns (4.5A) to make a reasonable prediction about what the Moon will look like on the first day of the next month, and they explain how they used patterns to make their prediction (4.9B).
If students do not make a reasonable prediction about the appearance of the Moon, direct their attention to the images of the Moon on the last few days of the last calendar month posted. Have students describe how the appearance of the Moon changes during this time. Work with students to locate the same sequence of changes in a different month, and then guide students to use this information to make their prediction.
If students need support to explain how they made their prediction, direct their attention to the Moon calendars, and ask how the images can be used to help predict what the Moon will look like next.
Level 4 ▸ Earth and Space ▸ Lesson 5 PhD SCIENCE® TEXAS 406 © Great Minds PBC
Land
5 minutes
Revisit the Phenomenon Question How does the Moon’s appearance relate to Peruvian apple cactus flowers? Display the gardener’s Peruvian apple cactus and Moon notes (Lesson 5 Resource B).
► When do you predict the next night with the most open cactus flowers will occur? Explain your reasoning.
▪ The nights with full moons have the most flowers open. I predict that most flowers will open on the next full moon date.
▪ The Moon phases repeat about once per month. The last full moon was near the end of July. I predict the date of the next full moon and the most open flowers will be near the end of August.
Use students’ responses about the appearance of the Moon to update the class anchor chart. Add a new Moon Patterns heading, and record students’ ideas.
Sample anchor chart:
Seasonal Patterns
• Days get longer in the summer and shorter in the winter.
• Temperature is higher in the summer and lower in the winter.
• Temperature and day length changes repeat in the same way every year.
• Strawberry growth is related to day length and temperature and repeats in the same way every year.
Moon Patterns
• Moon phases change throughout a year following a sequence that repeats about once per month.
• After a new moon, the bright part of the Moon appears to get bigger until it is a full moon. After the full moon, the bright part of the Moon gets smaller again.
PhD SCIENCE® TEXAS Level 4 ▸ Earth and Space ▸ Lesson 5 © Great Minds PBC 407
Tell students that in the next lesson they will apply what they have learned about patterns in nature in an End-of-Spotlight Assessment.
Optional Homework
With adult supervision, students go outdoors at night to observe and draw the appearance of the Moon. Students explain to a trusted adult, family member, or peer how patterns can be used to predict what the Moon will look like in the future.
Level 4 ▸ Earth and Space ▸ Lesson 5 PhD SCIENCE® TEXAS 408 © Great Minds PBC
Lessons 6–7 Nightjar Activity Prepare
In these lessons, students synthesize their learning from earlier lessons and articulate their understanding of collecting and analyzing seasonal and Moon phase data to predict patterns. Students are introduced to a new phenomenon, the relationship between European nightjar behaviors and seasonal and Moon phase patterns. Students complete an assessment in which they apply their knowledge of seasonal and Moon phase patterns, relate these patterns to nightjar migration activity, and make predictions about future events. Following the assessment, students debrief and reflect on how they built their knowledge throughout the lessons.
Student Learning
Knowledge Statement
Seasonal and Moon phase patterns can be used to make predictions.
Objectives
▪ Lesson 6: Analyze data to identify and predict seasonal and Moon phase patterns. (End-of-Spotlight Assessment)
▪ Lesson 7: Analyze data to identify and predict seasonal and Moon phase patterns. (End-of-Spotlight Assessment Debrief)
Earth and Space
Essential Question
How can patterns in nature be used to make predictions?
Phenomenon Question
How do seasons and Moon phases relate to nightjar migration?
PhD SCIENCE® TEXAS Level 4 ▸ Earth and Space ▸ Lessons 6–7 © Great Minds PBC 409
Standards Addressed*
Texas Essential Knowledge and Skills
Scientific and Engineering Practices
Recurring Themes and Concepts
* Students may apply these standards in instructional activities or in the End-of-Spotlight Assessment. See the End-of-Spotlight Assessment rubric for specific standards the assessment addresses.
Level 4 ▸ Earth and Space ▸ Lessons 6–7 PhD SCIENCE® TEXAS 410 © Great Minds PBC
Content Standards Standard Student Expectation Lesson(s) 4.9A Collect and analyze data to identify sequences and predict patterns of change in seasons such as change in temperature and length of daylight. (Mastered) 6, 7 4.9B Collect and analyze data to identify sequences and predict patterns of change in the observable appearance of the Moon from Earth. (Mastered) 6, 7
Standard Student Expectation Lesson(s) 4.1E Collect observations and measurements as evidence. 6, 7 4.1G Develop and use models to represent phenomena, objects, and processes or design a prototype for a solution to a problem. 6, 7 4.2B Analyze data by identifying any significant features, patterns, or sources of error. 6, 7 4.2C Use mathematical calculations to compare patterns and relationships. 6, 7
Standard Student Expectation Lesson(s) 4.5A Identify and use patterns to explain scientific phenomena or to design solutions. 6, 7 4.5C Use scale, proportion, and quantity to describe, compare, or model different systems. 6, 7 4.5G Explain how factors or conditions impact stability and change in objects, organisms, and systems. 6, 7
English Language Proficiency Standards
PhD SCIENCE® TEXAS Level 4 ▸ Earth and Space ▸ Lessons 6–7 © Great Minds PBC 411
Standard Student Expectation Lesson(s) 1A Use prior knowledge and experiences to understand meanings in English. 6 4C Develop basic sight vocabulary, derive meaning of environmental print, and comprehend English vocabulary and language structures used routinely in written classroom materials. 7 Materials Student Materials Lesson(s) Science Logbook (Lesson 6 Activity Guide) 6 Scissors (1), glue stick (1) 6 End-of-Spotlight Assessment 6 Day Length and Temperature Data (Lesson 6 Resource D) 6 End-of-Spotlight Assessment Rubric 7 Sticky notes (at least 2), pens or pencils in 2 different colors (1 of each) 7 Sample End-of-Spotlight Assessment responses that meet expectations (either sample responses from Teacher Edition or samples from the class, optional) 7 Teacher Materials Lesson(s) European Nightjar Photograph (Lesson 6 Resource A) 6 European Nightjar Migration Map (Lesson 6 Resource B) 6 Nightjar Activity Field Notes (Lesson 6 Resource C) 6 Content Standards (Lesson 7 Resource A) 7 Recurring Themes and Concepts (Lesson 7 Resource B) 7
Level 4 ▸ Earth and Space ▸ Lessons 6–7 PhD SCIENCE® TEXAS 412 © Great Minds PBC Teacher Preparation Lesson(s) Prepare to distribute a copy of Lesson 6 Resource D and the End-of-Spotlight Assessment to each student. 6 Prepare to distribute a copy of the End-of-Spotlight Assessment Rubric to each student. 7 Score End-of-Spotlight Assessment and write individual feedback. 7 Select End-of-Spotlight Assessment responses to share with students for additional support. If selecting student responses, remember to remove identifying information and choose diverse student responses. 7 Prepare visual for student connections between content standards and recurring themes and concepts. 7
Lesson 6
Objective: Analyze data to identify and predict seasonal and Moon phase patterns. (End-of-Spotlight Assessment)
Agenda
Launch (5 minutes)
Learn (38 minutes)
▪ Prepare for End-of-Spotlight Assessment (15 minutes)
▪ Complete End-of-Spotlight Assessment (23 minutes)
Land (2 minutes)
Launch
5 minutes
Ask students to make a relationship map to show connections among key terms and content-specific words learned throughout the lessons. Students cut out the key terms in their Science Logbook (Lesson 6 Activity Guide). Individually, students arrange the terms on the concept map page in their Science Logbook to show relationships between them. Tell students to draw arrows or other symbols and write words between the terms to express the relationships. Once students organize the map, they glue the terms in place.
Learn 38 minutes
Prepare for End-of-Spotlight Assessment 15 minutes
Ask students to recall the organisms they studied in the lessons, as well as prior knowledge they may have about organism behaviors that relate to seasonal or Moon phase changes. Instruct students to use terms from their concept maps and to Think–Pair–Share to discuss ideas. Invite volunteers to share ideas with the class.
Spotlight on Knowledge and Skills
In the Kindergarten Sky lessons, students identify and describe the characteristics of daytime and nighttime (K.9A, 1A). This phenomenon is essential for understanding the behavior of nocturnal organisms, such as European nightjars. In the Level 3 Survival and Change Module, students relate seasonal changes to animal behaviors such as hibernation and migration (3.12A, 1A).
PhD SCIENCE® TEXAS Level 4 ▸ Earth and Space ▸ Lesson 6 © Great Minds PBC 413
Sample student responses:
▪ Some strawberry plants grow strawberries during the cooler months in the winter and spring.
▪ Peruvian apple cactuses produce more flowers during a full moon.
▪ Bears hibernate during the cold winter months.
▪ Some birds migrate to warmer places in the fall and to cooler places in the spring.
Acknowledge students’ responses. Build on responses that describe the gardener’s observations from previous lessons to explain that gardeners observe plants and relate plant behaviors to seasons and Moon phases, while other people observe birds and work to connect bird behaviors to patterns found in nature. Tell students they will analyze observations recorded by scientists who study birds. The observed birds are small nocturnal songbirds called European nightjars. Display the European nightjar photograph (Lesson 6 Resource A).
Teacher Note
The information about European nightjars presented in this lesson was gathered from research conducted by behavioral ecologists. Behavioral ecologists are one group of scientists who study birds. They investigate animal behaviors to examine the effects of evolutionary and environmental factors on behaviors.
Explain to students that scientists attached tracking devices to the birds’ bodies to observe and document where they traveled and how often they traveled over a three-year period (Evens et al. 2017). Display the European nightjar migration map (Lesson 6 Resource B).
Teacher Note
Researchers discovered that European nightjar behaviors correlate with Moon phases and fall migration patterns (Norevik et al. 2019). Nightjars are nocturnal hunters, and they require light for optimal nighttime navigation. Therefore, they are most active during nights with a full moon and are especially active between the summer and fall seasons before migrating to the Democratic Republic of Congo in southern Africa.
Level 4 ▸ Earth and Space ▸ Lesson 6 PhD SCIENCE® TEXAS 414 © Great Minds PBC
Direct students to observe the migration map to answer the following question.
► What conclusions might we make from this information?
▪ The nightjars migrate in the fall to the Democratic Republic of Congo.
▪ The nightjars migrate to the United Kingdom in the spring.
▪ Nightjar migration seems to be a pattern that happens every year.
Highlight responses that mention that nightjar migration is a pattern and can be predicted. Tell students that scientists who study these birds wondered if other patterns in nature could be used to predict nightjar migrations, so they collected additional data. Display the nightjar activity field notes (Lesson 6 Resource C). Ask students to think about how the information on the migration map and the scientists’ field notes are similar to data they analyzed in earlier lessons.
► How are the patterns you observe similar to the patterns you observed in earlier lessons?
▪ The nightjars do different things throughout the year, like strawberries do.
▪ Nightjar migration is a pattern that happens in the fall and spring.
▪ The full moon phase seems connected to how active the nightjars are, which is like the cactus flower opening on full moon nights.
PhD SCIENCE® TEXAS Level 4 ▸ Earth and Space ▸ Lesson 6 © Great Minds PBC 415 United Kingdom Democratic
Nightjar Migration Spring Fall
Republic of Congo
► What questions might scientists who study birds ask after collecting these observations?
▪ Do nightjars follow the same migration route each year?
▪ Are nightjars more active during every full moon?
▪ How do seasons and Moon phase patterns relate to nightjar activity?
Acknowledge students’ responses. Tell students they will analyze seasonal and Moon phase data and how it relates to European nightjar migration patterns to complete an assessment in which they answer the Phenomenon Question How do seasons and Moon phases relate to nightjar migration?
Complete End-of-Spotlight Assessment 23 minutes
Prepare students for the End-of-Spotlight Assessment by explaining that the assessment is a way to show the knowledge they have developed through their study of seasonal and Moon phase patterns. Remind students to provide detailed explanations and to use resources posted in the room if needed. Tell students they will use what they have learned about seasonal and Moon phase patterns to complete the assessment.
Distrubute a copy of the End-of-Spotlight Assessment and a copy of the day length and temperature data (Lesson 6 Resource D) to each student. Read aloud the assessment items. Students complete the End-of-Spotlight Assessment individually. If needed, provide additional time for students to finish.
Teacher Note
To prepare for the next lesson, review End-of-Spotlight Assessment responses to provide rubric scores and actionable feedback to students on a separate page from the assessment. (See the rubric and sample responses in the End-of-Spotlight Assessment section of this book.) In the next lesson, students review their own assessment responses and then the teacher feedback. Also, select an exemplar student response for each question to share with students, or plan to provide the sample student responses provided in the Teacher Edition. If selecting student responses, remember to remove identifying information and to select diverse responses.
When providing feedback, be sure to guide students to focus on specific areas of improvement to deepen their understanding of the concepts in these lessons. For students who need remediation, offer opportunities to revisit portions of the lessons.
Differentiation
Provide an audio recording of the assessment items for students who need additional reading support.
Level 4 ▸ Earth and Space ▸ Lesson 6 PhD SCIENCE® TEXAS 416 © Great Minds PBC
Land
2 minutes
Tell students that they will share their thinking about the End-of-Spotlight Assessment questions in the next lesson.
PhD SCIENCE® TEXAS Level 4 ▸ Earth and Space ▸ Lesson 6 © Great Minds PBC 417
Lesson 7
Objective: Analyze data to identify and predict seasonal and Moon phase patterns. (End-of-Spotlight Assessment Debrief)
Agenda
Launch (7 minutes)
Learn (30 minutes)
▪ Debrief the End-of-Spotlight Assessment (15 minutes)
▪ Revise End-of-Spotlight Assessment Responses (8 minutes)
▪ Reflect on Driving Question Board (7 minutes)
Launch 7 minutes
Explain that in this lesson students will review the End-of-Spotlight Assessment, discuss responses, and then have an opportunity to revise their answers. First, they will review the assessment rubric and assess their responses to begin reflecting on their learning.
Share the End-of-Spotlight Assessment Rubric with students, and distribute their responses (without teacher feedback, if possible). Ask students to reflect on their responses, and record their self-assessment feedback on their copy of the rubric.
Next, distribute written teacher feedback on students’ End-of-Spotlight Assessments. Students review the teacher’s feedback on their responses independently and write on sticky notes any questions they want to discuss with the class. Students post their questions, either anonymously or with their names. Quickly review students’ questions as they post them, and plan which questions to discuss first.
Land (8 minutes)
Level 4 ▸ Earth and Space ▸ Lesson 7 PhD SCIENCE® TEXAS 418 © Great Minds PBC
Learn 30 minutes
Debrief the End-of-Spotlight Assessment
15 minutes
Distribute copies of sample responses that meet expectations, one response per assessment item. Ask students to compare the sample responses to the rubric criteria and to annotate those responses with the evidence of each rubric criterion they demonstrate.
Discuss each assessment item, posing relevant student questions from Launch. To encourage all students to participate in the discussion, provide sentence frames such as these:
▪ In the sample response, I notice
▪ That makes me wonder .
▪ That makes me realize .
▪ I thought . How does that relate to ?
▪ I would add because .
Discuss the remaining student questions. As needed, encourage students to review their Science Logbook, the anchor chart, and other resources for evidence during the discussion.
Revise End-of-Spotlight Assessment Responses
8 minutes
Ask students to use a different color pen or pencil to revise their End-of-Spotlight Assessment responses, applying their new ideas from the debrief conversation to deepen their responses.
Teacher Note
Depending on school and classroom guidelines and routines, decide whether to score and provide feedback on these revised responses.
PhD SCIENCE® TEXAS Level 4 ▸ Earth and Space ▸ Lesson 7 © Great Minds PBC 419
Reflect on Driving Question Board 7 minutes
Draw students’ attention to the driving question board, and invite them to reflect on their new knowledge and what else they would like to learn. Begin by asking students to think about questions they answered during the module. Pose questions such as these to facilitate the discussion.
► What did you do to answer these questions?
► Which answers surprised you? Why?
► Which questions relate to each other? How?
Land
8 minutes
Show students the content standards they focused on in these lessons, and explain that standards are one tool teachers use to plan instruction (Lesson 7 Resource A). Read aloud each content standard, and ask students to highlight evidence of related learning in their Science Logbook, End-of-Spotlight Assessment, or other resources. As needed, direct students to discuss each standard to understand its meaning.
Explain that each standard states a key idea associated with the lessons’ Recurring Themes and Concepts (Lesson 7 Resource B). Introduce these Recurring Themes and Concepts as understandings that provide a link between scientific ideas. Referring to the visual, ask students to relate each of the displayed Recurring Themes and Concepts to the relevant displayed statements. As students discuss the following questions, indicate these connections by layering connections onto students’ similar recurring themes and connections from previous modules or by creating a visual of their enduring knowledge from the lessons. (See the sample visual.)
► How do some of these statements relate to patterns?
▪ Temperature and day length change in similar ways across multiple years.
▪ The Moon phases change in the same way. They repeat about once per month, and they can be predicted for future years.
Teacher Note
The statements found in Lesson 7 Resource A are modified versions of the content standards. The statements represent student learning from the Earth and Space Lessons, and their abbreviated length allows students to reflect on their connections to the Recurring Themes and Concepts more easily.
Teacher Note
This lesson highlights select Recurring Themes and Concepts because these concepts help explain the content that students study in these lessons. Connections to other Recurring Themes and Concepts can be highlighted in the discussion as they naturally appear.
Level 4 ▸ Earth and Space ▸ Lesson 7 PhD SCIENCE® TEXAS 420 © Great Minds PBC
► How do some of these statements relate to stability and change?
▪ Day length and temperature patterns change in predictable ways in different seasons.
▪ Moon phases change in predictable ways throughout the year.
► How do some of these statements relate to scale, proportion, and quantity?
▪ When the day length is longer, the nighttime length is shorter, and when the day length is shorter, nighttime length is longer.
▪ The appearance of the Moon’s shape changes from full to smaller and then gets large again.
Sample visual: Teacher Note
Seasonal patterns such as temperature and day length change in predictable ways throughout the year.
The Moon phase visible from Earth changes in a predictable pattern each month and throughout the year.
This visual can be created for each individual module and set of spotlight lessons or for subsequent modules. Recurring Themes and Concepts, standards, or concept statements can be layered onto this visual to create a yearlong visual record of students’ enduring knowledge. The style of this visual will vary from classroom to classroom because of teacher preferences and varied student responses (4C).
After discussing connections, students should continue to reflect on their learning and consider how it has grown during the module. Ask questions such as the following, and have student volunteers share their answers with the class:
► What do you notice about the connections? Why do the connections between Recurring Themes and Concepts and our standards matter?
► What do you hope to learn next to deepen your understanding?
PhD SCIENCE® TEXAS Level 4 ▸ Earth and Space ▸ Lesson 7 © Great Minds PBC 421
Patterns Stability and Change Scale, Proportion. and Quantity
Optional Homework
Students research another organism whose observed behaviors relate to seasonal and Moon phase patterns. Examples might include dung beetles, wildebeests, and hawk moths. Students present their findings to an adult, friends, or classmates.
Level 4 ▸ Earth and Space ▸ Lesson 7 PhD SCIENCE® TEXAS 422 © Great Minds PBC
Name:
Date: LEVEL 4 MODULE 2: EARTH AND SPACE
Assessment
End-of-Spotlight
1. Observe the average monthly day length graph.
a. Use evidence from the data to put the following months in or der from shortest to longest average day length.
December
longest day length
October
July
April
shortest day length
b. In 2017, nightjars migrated to the United Kingdom in spring.
Which statement describes how the day length changed in the United Kingdom during the nightjars’ spring migration?
▪ The days got longer.
▪ The days got shorter.
▪ There was no change in day length.
▪ The days got shorter and then longer.
PhD SCIENCE® TEXAS Level 4 ▸ Earth and Space ▸ End-of-Spotlight Assessment © Great Minds PBC 423 This page may be reproduced for classroom use only.
c. The nightjars began their fall migration at the end of August 2016. Fill in the blank. In the United Kingdom, the average day length in August 2016 was
hours. Predict what the average day length will be in August 2027.
▪ Day length in August 2027 will be longer than in August 2016.
▪ Day length in August 2027 will be shorter than in August 2016.
▪ Day length in August 2027 will be the same as in August 2016.
2. Observe the average monthly temperature graph. Nightjars migrated to the United Kingdom in spring. Circle the statement that describes the temperature change in the United Kingdom during the nightjars’ spring migration.
▪ The temperature did not change.
▪ The temperature got colder each month.
▪ The temperature got warmer each month.
▪ The temperature got warmer and then got colder.
3. The average temperature in fall was 52°F. The average temperature in spring was 50°F. Fill in the blank and circle a word to complete the sentences.
The difference between the temperatures in fall and spring was
°F. The temperature was warmer / colder in fall than it was in spring.
Level 4 ▸ Earth and Space ▸ End-of-Spotlight Assessment PhD SCIENCE® TEXAS 424 © Great Minds PBC This page may be reproduced for classroom use only.
PhD SCIENCE® TEXAS Level 4 ▸ Earth and Space ▸ End-of-Spotlight Assessment © Great Minds PBC 425 This page may be reproduced for classroom use only. 4. Observe the Moon phases from August 2016. MondayTuesdayWednesdayThursdayFridaySaturdaySunday 123465 78910111312 14151617182019 21222324252726 282930 31123 New Moon Full Moon In 2016, the nightjars started their fall migration on August 29. Circle the Moon phase that appeared on that day.
The model predicts the Moon phase for each Sunday
Nightjars are the most active during a full moon before their fall migration. Circle the week when nightjars will be most active.
Week 1
Week 2
Week 3
Week 4
Level 4 ▸ Earth and Space ▸ End-of-Spotlight Assessment PhD SCIENCE® TEXAS © Great Minds PBC This page may be reproduced for classroom use only.
United Kingdom Moon Phases Week 5 Week 4 Week 3 Week 2 Week 1
▪
▪
▪
▪
Name: Sample
Date: LEVEL 4 MODULE 2: EARTH AND SPACE
Assessment
End-of-Spotlight
1. Observe the average monthly day length graph.
a. Use evidence from the data to put the following months in order fr om shortest to longest average day length.
December
July
longest day length
October
April
July
October
April
December
shortest day length
b. In 2017, nightjars migrated to the United Kingdom in spring. Which statement describes how the day length changed in the United Kingdom during the nightjars’ spring migration?
▪ The days got longer.
▪ The days got shorter.
▪ There was no change in day length.
▪ The days got shorter and then longer.
PhD SCIENCE® TEXAS Level 4 ▸ Earth and Space ▸ End-of-Spotlight Assessment © Great Minds PBC 427
c. The nightjars began their fall migration at the end of August 2016. Fill in the blank. In the United Kingdom, the average day length in August 2016 was 15 hours. Predict what the average day length will be in August 2027.
▪ Day length in August 2027 will be longe r than in August 2016.
▪ Day length in August 2027 will be shorte r than in August 2016.
▪ Day length in August 2027 will be the s ame as in August 2016.
2. Observe the average monthly temperatur e graph. Nightjars migrated to the United Kingdom in spring. Circle the statement that describes the temperature change in the United Kingdom during the nightjars’ spring migration.
▪ The temperature did not change.
▪ The temperature got colder each month.
▪ The temperature got warmer each month.
▪ The temperature got warmer and then got colder.
3. The average temperature in fall was 52°F. The average temperature in spring was 50°F.
Fill in the blank and circle a word to complete the sentences.
The difference between the temperatures in fall and spring was 2 °F.
The temperature was warmer / colder in fall than it was in spring.
Level 4 ▸ Earth and Space ▸ End-oght Assessment PhD SCIENCE® TEXAS 428 © Great Minds PBC
f-Spotli
In 2016, the nightjars started their fall migration on August 29. Circle the Moon phase that appeared on that day.
PhD SCIENCE® TEXAS Level 4 ▸ Earth and Space ▸ End-of-Spotlight Assessment © Great Minds PBC 429 4. Observe the Moon phases
August 2016. MondayTuesdayWednesdayThursdayFridaySaturdaySunday 123465 78910111312 14151617182019 21222324252726 282930 31123 New Moon Full Moon
from
The model predicts the Moon phase for each Sunday United Kingdom
Nightjars are the most active during a full moon before their fall migration. Circle the week when nightjars will be most active.
1
2
3
4
Level 4 ▸ Earth and Space ▸ End-of-Spotlight Assessment PhD SCIENCE® TEXAS © Great Minds PBC
Moon
Week 5 Week 4 Week 3 Week 2 Week 1
Phases
▪ Week
▪ Week
▪ Week
▪ Week
LEVEL 4 MODULE 2: EARTH AND SPACE
End-of-Spotlight Assessment Rubric
Score each student’s End-of-Spotlight Assessment. The rubric describes evidence of student work that meets expectations. Use the blank spaces as needed to record evidence of student work that exceeds or falls below expectations.
Name:
Date:
3 Meets Expectations
Correct
4 Exceeds Expectations
Correct
The student analyzes the day length graph (4.5A) to sequence (4.2B) the months in order from shortest day length to longest day length (4.9A).
The student analyzes the day length graph and seasons table (4.2B) to identify that day lengths get longer in the spring (4.5A, 4.9A).
The student analyzes the graph to determine the average day length in August 2016 (4.1E) and uses patterns (4.5A) to predict the day length for August 2027 (4.9A).
PhD SCIENCE® TEXAS Level 4 ▸ Earth and Space ▸ End-of-Spotlight Assessment Rubric © Great Minds PBC 431
Item TEKS Assessed 1 Does Not Yet Meet Expectations Incorrect or unreasonable response with no detail or evidence
Approaches Expectations
or unreasonable response with some detail or evidence OR
or reasonable response with insufficient detail or evidence
2
Incorrect
Correct
or reasonable response with sufficient detail or evidence
Score 1a 4.2B 4.5A 4.9A
or reasonable response with more than sufficient detail or evidence
1b 4.2B 4.5A 4.9A
1c 4.1E 4.5A 4.9A
ItemTEKS Assessed 1 Does Not Yet Meet Expectations
Incorrect or unreasonable response with no detail or evidence
Incorrect or unreasonable response with some detail or evidence
Meets Expectations
Correct or reasonable response with sufficient detail or evidence
Exceeds Expectations
Correct or reasonable response with more than sufficient detail or evidence
The student analyzes the temperature graph and seasons table (4.2B) to identify that temperature increases in the spring (4.5A, 4.9A).
The student calculates the difference in temperature (4.2C) to compare (4.5C) the temperatures during the fall and spring (4.9A).
The student uses Moon phase observations as evidence (4.1E) to predict how the Moon will appear after a full moon (4.5G, 4.9B).
The student uses Moon phase observations as evidence (4.1E) to predict the week when a full moon will occur (4.5G, 4.9B).
Level 4 ▸ Earth and Space ▸ End-of-Spotlight Assessment Rubric PhD SCIENCE® TEXAS 432 © Great Minds PBC
2 Approaches Expectations
OR
3
Correct or reasonable response with insufficient detail or evidence
4
Score 2 4.2B 4.5A 4.9A
3 4.2C 4.5C 4.9A
4 4.1E 4.5G 4.9B
5 4.1E 4.5G 4.9B
End-of-Spotlight Assessment Alignment Map
For teacher reference, this alignment map lists the Texas Essential Knowledge and Skills assessed by each item in the End-of-Spotlight Assessment.
1a ▪ 4.9A Collect and analyze data to identify sequences and predict patterns of change in seasons such as change in temperature and length of daylight.
1b ▪ 4.9A Collect and analyze data to identify sequences and predict patterns of change in seasons such as change in temperature and length of daylight.
1c ▪ 4.9A Collect and analyze data to identify sequences and predict patterns of change in seasons such as change in temperature and length of daylight.
2 ▪ 4.9A Collect and analyze data to identify sequences and predict patterns of change in seasons such as change in temperature and length of daylight.
3 ▪ 4.9A Collect and analyze data to identify sequences and predict patterns of change in seasons such as change in temperature and length of daylight.
4 ▪ 4.9B Collect and analyze data to identify sequences and predict patterns of change in the observable appearance of the Moon from Earth.
5 ▪ 4.9B Collect and analyze data to identify sequences and predict patterns of change in the observable appearance of the Moon from Earth.
▪ 4.2B Analyze data by identifying any significant features, patterns, or sources of error.
▪ 4.5A Identify and use patterns to explain scientific phenomena or to design solutions.
▪ 4.2B Analyze data by identifying any significant features, patterns, or sources of error.
▪ 4.5A Identify and use patterns to explain scientific phenomena or to design solutions.
▪ 4.1E Collect observations and measurements as evidence.
▪ 4.5A Identify and use patterns to explain scientific phenomena or to design solutions.
▪ 4.2B Analyze data by identifying any significant features, patterns, or sources of error.
▪ 4.5A Identify and use patterns to explain scientific phenomena or to design solutions.
▪ 4.2C Use mathematical calculations to compare patterns and relationships.
▪ 4.5C Use scale, proportion, and quantity to describe, compare, or model different systems.
▪ 4.1E Collect observations and measurements as evidence.
▪ 4.1E Collect observations and measurements as evidence.
▪ 4.5G Explain how factors or conditions impact stability and change in objects, organisms, and systems.
▪ 4.5G Explain how factors or conditions impact stability and change in objects, organisms, and systems.
Great Minds
PhD SCIENCE® TEXAS Level 4 ▸ Earth and Space ▸ End-of-Spotlight Assessment Rubric 433
Item Content Standards Scientific and Engineering Practices Recurring Themes and Concepts
©
PBC
Earth and Space Resources
Contents
Lesson 1 Resource A: Field Through a Year Photographs
Lesson 1 Resource B: Gardener’s Notes
Lesson 2 Resource A: Gardener Observations Data Table
Lesson 2 Resource B: San Antonio Sunrise and Sunset Data
Lesson 2 Resource C: Sunrise and Sunset Data Table Strips
Lesson 2 Resource D: Day Length Chart Strips
Lesson 2 Resource E: Class Day Length Chart
Lesson 3 Resource A: San Antonio Day Length Graph
Lesson 3 Resource B: Day Length and Fruiting Data Tables
Lesson 3 Resource C: Day Length Data Tables
Lesson 3 Resource D: Bar Graph Template
434 © Great Minds PBC
Lesson 3 Resource E: Class Average Day Length Graph
Lesson 3 Resource F: Class Strawberry Fruit Graph
Lesson 4 Resource A: San Antonio Temperature Data Tables
Lesson 4 Resource B: Line Graph Template Preparation Instructions
Lesson 4 Resource C: Class Average Temperature Graph
Lesson 4 Resource D: San Antonio Temperature Graph
Lesson 4 Resource E: Class Strawberry Data
Lesson 5 Resource A: Peruvian Apple Cactus Photographs
Lesson 5 Resource B: Gardener’s Peruvian Apple Cactus and Moon Notes
Lesson 5 Resource C: Moon Calendar Preparation Instructions
Lesson 6 Resource A: European Nightjar Photograph
Lesson 6 Resource B: European Nightjar Migration Map
Lesson 6 Resource C: Nightjar Activity Field Notes
Lesson 6 Resource D: Day Length and Temperature Data
Lesson 7 Resource A: Content Standards
Lesson 7 Resource B: Recurring Themes and Concepts
PhD SCIENCE® TEXAS Level 4 ▸ Earth and Space ▸ Resources
© Great Minds PBC 435
Level 4 ▸ Earth and Space ▸ Lesson 1 ▸ Resource A PhD SCIENCE® TEXAS LESSON 1 RESOURCE A Field Through a Year Photographs Print and cut out one set of photographs to use during the lesson. Consider using card stock and laminating for multiple uses. 436 This page may be reproduced for classroom use only. © Great Minds PBC
PhD SCIENCE® TEXAS Level 4 ▸ Earth and Space ▸ Lesson 1 ▸ Resource A © Great Minds PBC This page may be reproduced for classroom use only. 437
Level 4 ▸ Earth and Space ▸ Lesson 1 ▸ Resource A PhD SCIENCE® TEXAS 438 This page may be reproduced for classroom use only. © Great Minds PBC
PhD SCIENCE® TEXAS Level 4 ▸ Earth and Space ▸ Lesson 1 ▸ Resource B LESSON 1 RESOURCE B
Month Flowers Present Time of Sunset Temperature Moon’s Appearance January None 5:46 p.m. 52°F February Virginia Strawberry 6:12 p.m. 57°F Moon not visible March Virginia Strawberry 6:33 p.m. 63°F April Virginia Strawberry 7:52 p.m. 70°F Moon not visible May Virginia Strawberry Woodland Strawberry Peruvian Apple Cactus 8:10 p.m. 77°F Moon not visible June Virginia Strawberry Woodland Strawberry Peruvian Apple Cactus 8:29 p.m. 83°F July Woodland Strawberry Peruvian Apple Cactus 8:37 p.m. 85°F August Woodland Strawberry Peruvian Apple Cactus 8:26 p.m. 86°F September Woodland Strawberry Peruvian Apple Cactus 7:55 p.m. 81°F October Peruvian Apple Cactus 7:19 p.m. 72°F November Peruvian Apple Cactus 6:47 p.m. 61°F December None 5:34 p.m. 54°F © Great Minds PBC This page may be reproduced for classroom use only. 439
Gardener’s Notes
LESSON 2 RESOURCE A Gardener Observations Data Table Date Growing Conditions Plant A: Virginia Strawberry Plant B: W oodland Strawberry February 15, 2022 11.5hours 20 minutes 52°F Flowers No flowers April 15, 2022 13 hours 20 minutes 68°F Strawberries and flowers No flowers June 15, 2022 14 hours 20 minutes 86°F Strawberries and flowers Flowers Level 4 ▸ Earth and Space ▸ Lesson 2 ▸ Resource A PhD SCIENCE® TEXAS 440 This page may be reproduced for classroom use only. © Great Minds PBC
San Antonio Sunrise and Sunset Data
PhD SCIENCE® TEXAS Level 4 ▸ Earth and Space ▸ Lesson 2 ▸ Resource B LESSON 2 RESOURCE B
Date Sunrise Sunset January 15, 2018 8:30 a.m. 7:00 p.m. February 15, 2018 8:15 a.m. 7:30 p.m. March 15, 2018 7:45 a.m. 7:45 p.m. April 15, 2018 7:00 a.m. 8:00 p.m. May 15, 2018 6:45 a.m. 8:30 p.m. June 15, 2018 6:30 a.m. 8:30 p.m. July 15, 2018 6:45 a.m. 8:30 p.m. August 15, 2018 7:00 a.m. 8:15 p.m. September 15, 2018 7:15 a.m. 7:30 p.m. October 15, 2018 7:30 a.m. 7:00 p.m. November 15, 2018 8:00 a.m. 6:45 p.m. December 15, 2018 8:30 a.m. 6:30 p.m. © Great Minds PBC This page may be reproduced for classroom use only. 441
Data Table Strips
and Sunset
Print and cut out one copy of each data table. Distribute one data table to each student pair during the collect day length data activity.
Level 4 ▸ Earth and Space ▸ Lesson 2 ▸ Resource C PhD SCIENCE® TEXAS LESSON 2 RESOURCE C Sunrise
Day Sunrise Sunset January 15, 2018 8:30 a.m. 7:00 p.m. Day Sunrise Sunset February 15, 2018 8:15 a.m. 7:30 p.m. Day Sunrise Sunset March 15, 2018 7:45 a.m. 7:45 p.m. Day Sunrise Sunset April 15, 2018 7:00 a.m. 8:00 p.m. Day Sunrise Sunset May 15, 2018 6:45 a.m. 8:30 p.m. Day Sunrise Sunset June 15, 2018 6:30 a.m. 8:30 p.m. 442 This page may be reproduced for classroom use only. © Great Minds PBC
PhD SCIENCE® TEXAS Level 4 ▸ Earth and Space ▸ Lesson 2 ▸ Resource C Day Sunrise Sunset July 15, 2018 6:45 a.m. 8:30 p.m. Day Sunrise Sunset August 15, 2018 7:00 a.m. 8:15 p.m. Day Sunrise Sunset September 15, 2018 7:15 a.m. 7:30 p.m. Day Sunrise Sunset October 15, 2018 7:30 a.m. 7:00 p.m. Day Sunrise Sunset November 15, 2018 8:00 a.m. 6:45 p.m. Day Sunrise Sunset December 15, 2018 8:30 a.m. 6:30 p.m. © Great Minds PBC This page may be reproduced for classroom use only. 443
Level 4 ▸ Earth and Space ▸ Lesson 2 ▸ Resource D PhD SCIENCE® TEXAS LESSON 2 RESOURCE D Day Length Chart
Print and cut out one day length chart strip to distribute to each student pair during the collect day length data activity. 12am 1am 2am 3am 4am 5am 6am 7am 8am 9am 10am 11am 12pm 1pm 2pm 3pm 4pm 5pm 6pm 7pm 8pm 9pm 10pm 11pm 12am 12am 1am 2am 3am 4am 5am 6am 7am 8am 9am 10am 11am 12pm 1pm 2pm 3pm 4pm 5pm 6pm 7pm 8pm 9pm 10pm 11pm 12am 12am 1am 2am 3am 4am 5am 6am 7am 8am 9am 10am 11am 12pm 1pm 2pm 3pm 4pm 5pm 6pm 7pm 8pm 9pm 10pm 11pm 12am 12am 1am 2am 3am 4am 5am 6am 7am 8am 9am 10am 11am 12pm 1pm 2pm 3pm 4pm 5pm 6pm 7pm 8pm 9pm 10pm 11pm 12am 444 This page may be reproduced for classroom use only. © Great Minds PBC
Strips
© Great Minds PBC 445 This page may be reproduced for classroom use only. PhD SCIENCE® TEXAS Level 4 ▸ Earth and Space ▸ Lesson 2 ▸ Resource D 12am 10am 11am 12pm 1pm 2pm3pm4pm 5pm 6pm7pm8pm9pm 10pm11pm 12am 1am 2am 3am 4am 5am 6am 7am 8am 9am 12am 10am 11am 12pm 1pm 2pm3pm4pm 5pm 6pm7pm8pm9pm 10pm11pm 12am 1am 2am 3am 4am 5am 6am 7am 8am 9am 12am 10am 11am 12pm 1pm 2pm3pm4pm 5pm 6pm7pm8pm9pm 10pm11pm 12am 1am 2am 3am 4am 5am 6am 7am 8am 9am 12am 10am 11am 12pm 1pm 2pm3pm4pm 5pm 6pm7pm8pm9pm 10pm11pm 12am 1am 2am 3am 4am 5am 6am 7am 8am 9am
446 © Great Minds PBC This page may be reproduced for classroom use only. Level 4 ▸ Earth and Space ▸ Lesson 2 ▸ Resource D PhD SCIENCE® TEXAS 12am 10am 11am 12pm 1pm 2pm3pm4pm 5pm 6pm7pm8pm9pm 10pm11pm 12am 1am 2am 3am 4am 5am 6am 7am 8am 9am 12am 10am 11am 12pm 1pm 2pm3pm4pm 5pm 6pm7pm8pm9pm 10pm11pm 12am 1am 2am 3am 4am 5am 6am 7am 8am 9am 12am 10am 11am 12pm 1pm 2pm3pm4pm 5pm 6pm7pm8pm9pm 10pm11pm 12am 1am 2am 3am 4am 5am 6am 7am 8am 9am 12am 10am 11am 12pm 1pm 2pm3pm4pm 5pm 6pm7pm8pm9pm 10pm11pm 12am 1am 2am 3am 4am 5am 6am 7am 8am 9am
PhD SCIENCE® TEXAS Level 4 ▸ Earth and Space ▸ Lesson 2 ▸ Resource E LESSON 2 RESOURCE E
12am 1am 2am 3am 4am 5am 6am 7am 8am 9am 10am 11am 12pm 1pm 2pm 3pm 4pm 5pm 6pm 7pm 8pm 9pm 10pm 11pm 12am January 12am 1am 2am 3am 4am 5am 6am 7am 8am 9am 10am 11am 12pm 1pm 2pm 3pm 4pm 5pm 6pm 7pm 8pm 9pm 10pm 11pm 12am February 12am 1am 2am 3am 4am 5am 6am 7am 8am 9am 10am 11am 12pm 1pm 2pm 3pm 4pm 5pm 6pm 7pm 8pm 9pm 10pm 11pm 12am March 12am 1am 2am 3am 4am 5am 6am 7am 8am 9am 10am 11am 12pm 1pm 2pm 3pm 4pm 5pm 6pm 7pm 8pm 9pm 10pm 11pm 12am April 12am 1am 2am 3am 4am 5am 6am 7am 8am 9am 10am 11am 12pm 1pm 2pm 3pm 4pm 5pm 6pm 7pm 8pm 9pm 10pm 11pm 12am May 12am 1am 2am 3am 4am 5am 6am 7am 8am 9am 10am 11am 12pm 1pm 2pm 3pm 4pm 5pm 6pm 7pm 8pm 9pm 10pm 11pm 12am June 12am 1am 2am 3am 4am 5am 6am 7am 8am 9am 10am 11am 12pm 1pm 2pm 3pm 4pm 5pm 6pm 7pm 8pm 9pm 10pm 11pm 12am July 12am 1am 2am 3am 4am 5am 6am 7am 8am 9am 10am 11am 12pm 1pm 2pm 3pm 4pm 5pm 6pm 7pm 8pm 9pm 10pm 11pm 12am August 12am 1am 2am 3am 4am 5am 6am 7am 8am 9am 10am 11am 12pm 1pm 2pm 3pm 4pm 5pm 6pm 7pm 8pm 9pm 10pm 11pm 12am September 12am 1am 2am 3am 4am 5am 6am 7am 8am 9am 10am 11am 12pm 1pm 2pm 3pm 4pm 5pm 6pm 7pm 8pm 9pm 10pm 11pm 12am October 12am 1am 2am 3am 4am 5am 6am 7am 8am 9am 10am 11am 12pm 1pm 2pm 3pm 4pm 5pm 6pm 7pm 8pm 9pm 10pm 11pm 12am No ember 12am 1am 2am 3am 4am 5am 6am 7am 8am 9am 10am 11am 12pm 1pm 2pm 3pm 4pm 5pm 6pm 7pm 8pm 9pm 10pm 11pm 12am December © Great Minds PBC This page may be reproduced for classroom use only. 447
Class Day Length Chart
This page may be reproduced for classroom use only. © Great Minds PBC LESSON 3 RESOURCE A San Antonio Day Length Graph Level 4 ▸ Earth and Space ▸ Lesson 3 ▸ Resource A PhD SCIENCE® TEXAS 448 0 10 11 12 13 14 15 16 17 18 19 20 21 22 23 24 123456789 January February March April May June July August September October November December Day Length Month San Antonio Day Length, 2018 Hours in a Day
Length and Fruiting Data Tables
Plant B Observations (Woodland Strawberry) January
Green leaves
Flowers growing
Some strawberries
Green leaves March
Green leaves
Strawberries growing
Strawberries growing
Strawberries growing
Strawberries growing
Strawberries growing
Green leaves
Many strawberries
Many strawberries
Some strawberries
Green and yellow leaves
Green leaves
Green leaves
Green leaves
Green leaves
13 hours
13.5 hours
14.5 hours
July 13.75 hours
13.25 hours
August
September 12.5 hours
11.5 hours
October
November 10.75 hours
December 10.25 hours
© Great Minds PBC This page may be reproduced for classroom use only. 449
PhD SCIENCE® TEXAS Level 4 ▸ Earth and Space ▸ Lesson 3 ▸ Resource B
RESOURCE
Day
Day Length Data
Month Average Day Length
LESSON 3
B
Average
and Strawberry Observations, 2019
Plant A Observations (Virginia Strawberry)
10.5 hours
11 hours
Green leaves February 12 hours
Green leaves April
May
Flowers growing June
Green and yellow leaves
Green leaves
Average Day Length Data and Strawberry
Plant B Observations (Woodland Strawberry)
Gr een leaves
Gr een leaves
Green leaves
Green leaves
Flowers growing
Strawberries growing
Strawberries growing
Strawberries gr owing
Strawberries gr owing
Strawberries gr owing
Gr een leaves
Gr een leaves
Plant A Observations (Virginia Strawberry)
Average Day Length
Observations, 2020 Month
10.5 hours Green leaves
11.25 hours Flowers growing
Some strawberries
Many strawberries
12 hours
13 hours
13.5 hours Many strawberries
Some strawberries
14 hours
Green and yellow leaves
13.75 hours
Green and yellow leaves
Green leaves
Green leaves
Green leaves
Green leaves
13 hours
January
February
March
April
May
June
July
August
September 12.25 hours
11.5 hours
October
November 10.75 hours
December 10.25 hours
Level 4 ▸ Earth and Space ▸ Lesson 3 ▸ Resource B PhD SCIENCE® TEXAS
This page may be reproduced for classroom use only. © Great Minds PBC 450
PhD SCIENCE® TEXAS Level 4 ▸ Earth and Space ▸ Lesson 3 ▸ Resource C © Great Minds PBC This page may be reproduced for classroom use only. LESSON 3 RESOURCE C
Print and cut out one copy of each day length data table. Distribute one table to each group during the construct bar graphs activity. Average Day Length, January–March 2019 Month Average Day Length January 10.5 hours February 11 hours March 12 hours Average Day Length, April–June 2019 Month Average Day Length April 13 hours May 13.5 hours June 14.5 hours Average Day Length, July–September 2019 Month Average Day Length July 13.75 hours August 13.25 hours September 12.5 hours Average Day Length, October–December 2019 Month Average Day Length October 11.5 hours November 10.75 hours December 10.25 hours 451
Day Length Data Tables
Average Day Length, January–March 2020 Month Average Day Length January 10.5 hours February 11.25 hours March 12 hours Average Day Length, April–June 2020 Month Average Day Length April 13 hours May 13.5 hours June 14 hours Average Day Length, July–September 2020 Month Average Day Length July 13.75 hours August 13 hours September 12.25 hours Average Day Length, October–December 2020 Month Average Day Length October 11.5 hours November 10.75 hours December 10.25 hours Level 4 ▸ Earth and Space ▸ Lesson 3 ▸ Resource C PhD SCIENCE® TEXAS This page may be reproduced for classroom use only. © Great Minds PBC 452
PhD SCIENCE® TEXAS Level 4 ▸ Earth and Space ▸ Lesson 3 ▸ Resource D LESSON 3 RESOURCE D Bar Graph Template
during the
© Great Minds PBC This page may be reproduced for classroom use only. 453
Print and cut out one copy of the bar graph template for each group. Distribute one template to each group
construct bar graphs activity.
Level 4 ▸ Earth and Space ▸ Lesson 3 ▸ Resource E PhD SCIENCE® TEXAS LESSON 3 RESOURCE E Class Average Dy Length Gr a aph 8 9 10 11 12 13 14 15 16 17 18 19 20 21 22 23 24 7 6 5 4 3 2 0 January February Hours in a Day March April May June July August September ctober November December January February March April May June July August September ctober November December Day Length 2019 Day Length 2019 Day Length 2019 Day Length 2019 Day Length 2020 Day Length 2020 Day Length 2020 Day Length 2020 This page may be reproduced for classroom use only. © Great Minds PBC 454
Graph
PhD SCIENCE® TEXAS Level 4 ▸ Earth and Space ▸ Lesson 3 ▸ Resource F LESSON 3 RESOURCE F
Day Length 2019 Day Length 2019 Day Length 2019 Day Length 2019 Day Length 2020 Day Length 2020 Day Length 2020 Day Length 2020 Hours in a Day 8 9 10 11 12 13 14 15 16 17 18 19 20 21 22 23 24 7 6 5 4 3 2 0 March A A A A A A A A B B B B B B B B B B January February April May June July August September ctober November December January February March April May June July August September ctober November December Winter Spring Summer Fall Winter Spring Summer Fall Winter © Great Minds PBC This page may be reproduced for classroom use only. 455
Class Strawberry Fruit
Level 4 ▸ Earth and Space ▸ Lesson 4 ▸ Resource A PhD SCIENCE® TEXAS LESSON 4 RESOURCE A San Antonio Temperature Data Tables Print and cut out one copy of each average temperature data table. Distribute one table to each group during the contruct a line graph activity. Average Temperature Data, January–June 2018 Month Average Temperature (°F) Plant A Observations (Virginia Strawberry) Plant B Observations (Woodland Strawberry) January 49°F Gr een leaves Green leaves February 58°F Flowers gr owing Green leaves Mar ch 67°F Some strawberries Green leaves April 68°F Many strawberries Green leaves May 81°F Many strawberries Flowers growing June 86°F Some strawberries Strawberries growing This page may be reproduced for classroom use only. © Great Minds PBC 456
Plant B
PhD SCIENCE® TEXAS Level 4 ▸ Earth and Space ▸ Lesson 4 ▸ Resource A Average Temperature Data, July–December 2018 Month Average Temperature (°F)
Observations (Virginia Strawberry)
Plant A
Observations (Woodland Strawberry) July 86°F Green and yellow leaves Strawberries growing August 87°F Green and yellow leaves Strawberries growing September 80°F Green and yellow leaves Strawberries growing October 70°F Green leaves Strawberries growing November 57°F Green leaves Green leaves December 54°F Green leaves Green leaves Average Temperature Data, January–June 2019 Month Average Temperature (°F)
Plant B
Observations (Virginia Strawberry)
Plant A
Observations
January 51°F Green leaves Green leaves February 58°F Flowers growing Green leaves March 61°F Some strawberries Green leaves April 69°F Many strawberries Green leaves May 77°F Many strawberries Flowers growing June 82°F Some strawberries Strawberries growing © Great Minds PBC This page may be reproduced for classroom use only. 457
(Woodland Strawberry)
Level 4 ▸ Earth and Space ▸ Lesson 4 ▸ Resource A PhD SCIENCE® TEXAS Average Temperature Data, July–December 2019 Month Average Temperature (°F) Plant A Observations (Virginia Strawberry)
Observations
July 85°F Green and yellow leaves Strawberries growing August 89°F Green and yellow leaves Strawberries growing September 86°F Green and yellow leaves Strawberries growing October 72°F Green leaves Strawberries growing November 59°F Green leaves Green leaves December 56°F Green leaves Green leaves Average Temperature Data, January–June 2020 Month Average Temperature (°F)
Observations
Plant B
(Woodland Strawberry)
Plant A
(Virginia Strawberry)
Observations
January 58°F Green leaves Green leaves February 55°F Flowers growing Green leaves March 69°F Some strawberries Green leaves April 70°F Many strawberries Green leaves May 79°F Many strawberries Flowers growing June 83°F Some strawberries Strawberries growing This page may be reproduced for classroom use only. © Great Minds PBC 458
Plant B
(Woodland Strawberry)
PhD SCIENCE® TEXAS Level 4 ▸ Earth and Space ▸ Lesson 4 ▸ Resource A Average Temperature Data, July–December 2020 Month Average Temperature (°F) Plant A Observations (Virginia Strawberry) Plant B Observations (W oodland Strawberry) July 89°F Green and yellow leaves Strawberries gr owing August 88°F Green and yellow leaves Strawberries gr owing September 81°F Green and yellow leaves Strawberries gr owing October 71°F Green leaves Strawberries gr owing November 60°F Green leaves Gr een leaves December 55°F Green leaves Gr een leaves © Great Minds PBC This page may be reproduced for classroom use only. 459
Follow the instructions to prepare one line graph template for each group and one line graph demonstration template to use during the lesson.
Materials: graph chart paper (7 sheets), black marker (1), meter stick (1)
Materials Note: Use graph chart paper so students can easily count the squares as they construct the lines for their gr aphs. If graph chart paper is unavailable, use lined chart paper, or use chart paper and draw lines.
Preparation
1. Use the marker and meter stick to draw horizontal and vertical axes on 6 sheets of chart paper, leaving about 2 inches on all sides for titles and labels.
2. Label each gr aph with a different title from the following list.
3. Draw 6 evenly spaced tick marks along each horizontal axis, leaving a few inches between each tick mark for labels.
4. Title each horiz ontal axis Month.
5. Draw 10 evenly spaced tick marks along each vertical axis, leaving a few inches between each tick mark.
6. Title each vertic al axis Temperature (°F).
7. Repeat steps 1 through 6 with the remaining sheet of chart paper to prepare a template to use for a demonstration during the lesson. Select any data se t to use as an example.
LESSON 4 RESOURCE B
Level 4 ▸ Earth and Space ▸ Lesson 4 ▸ Resource B PhD SCIENCE® TEXAS
Line Graph Template Preparation Instructions
▪ Average
2018 ▪ Average Temperature
2018 ▪ Average Temperature
2019 ▪ Average Temperature Data,
2019 ▪ Average Temperature Data,
2020 ▪ Average Temperature Data,
2020
Temperature Data, January –June
Data, July–Dec ember
Data, January –June
July–Dec ember
January –June
July–Dec ember
This page may be reproduced for classroom use only. © Great Minds PBC 460
PhD SCIENCE® TEXAS Level 4 ▸ Earth and Space ▸ Lesson 4 ▸ Resource C LESSON 4 RESOURCE C Class Average Tempera ture Graph Temperature (°F) Average Temperature, 2018 Average Temperature, 2018 Average Temperature, 2019 Average Temperature, 2019 Average Temperature, 2020 Average Temperature, 2020 100 90 80 70 60 50 40 30 20 10 0 January February March April May June July August September October November December January February March April May June July August September October November December January February March April May June July August September October November December Month Month Month Month Month Month © Great Minds PBC This page may be reproduced for classroom use only. 461
Level 4 ▸ Earth and Space ▸ Lesson 4 ▸ Resource D PhD SCIENCE® TEXAS This page may be reproduced for classroom use only. LES SON 4 RESOURCE D San Antonio Temperature Graph Average Temperature, January–June 2022 80 90 100 70 60 50 40 30 20 10 0 Temp er at u r e ( ° F ) January February March April May June Month © Great Minds PBC 462
PhD SCIENCE® TEXAS Level 4 ▸ Earth and Space ▸ Lesson 4 ▸ Resource E LES SON 4 RESOURCE E Class Strawberry Data Average Temperature, 2018 Average Temperature, 2018 Average Temperature, 2019 Average Temperature, 2019 Average Temperature, 2020 Average Temperature, 2020 100 Temperature (°F) 90 80 70 60 50 40 30 20 10 0 A A A A A A A A A A A A B B B B B B B B B B B B B B B January February March April May June July August September October November December January February March April May June July August September October November December January February March April May June July August September October November December Month Month Month Month Month Month © Great Minds PBC This page may be reproduced for classroom use only. 463
Level 4 ▸ Earth and Space ▸ Lesson 5 ▸ Resource A PhD SCIENCE® TEXAS LES SON 5 RESOURCE A Peruvian Apple Cactus Photographs This page may be reproduced for classroom use only. © Great Minds PBC 464
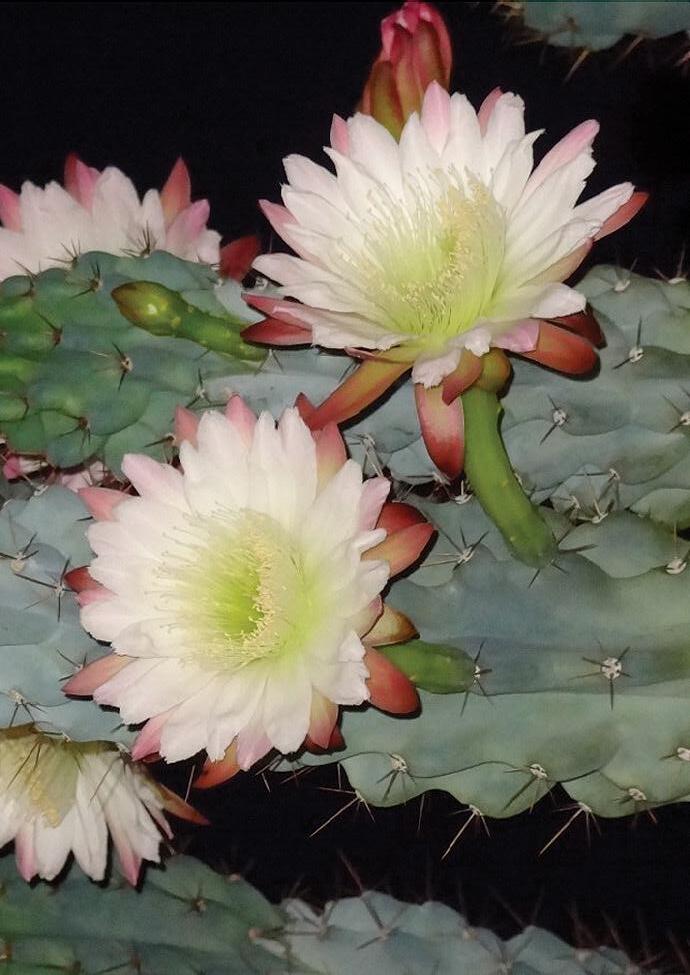
PhD SCIENCE® TEXAS Level 4 ▸ Earth and Space ▸ Lesson 5 ▸ Resource A © Great Minds PBC This page may be reproduced for classroom use only. 465
Level 4 ▸ Earth and Space ▸ Lesson 5 ▸ Resource B PhD SCIENCE® TEXAS LES SON 5 RESOURCE B Gardener’s Peruvian Apple
Notes Date Number of Flowers Opened During Night Moon’s Appearance May 19 35 May 26 83 June 2 9 June 10 12 No Moon visible June 17 27 June 24 201 July 2 18 July 10 20 No Moon visible July 16 73 July 24 324 This page may be reproduced for classroom use only. © Great Minds PBC 466
Cactus and Moon
Instructions
Follow the steps to prepare the Moon calendars for Lesson 5.
1. Access the Moon Phase Calculator on the University of Texas McDonald Observatory StarDate website ( http://phdsci.link/1884 ).
2. Use the drop-down menu to select the current month and year.
3. Once the current month and year are selected, click the Go button to generate the calendar.
4. Right-click to print the calendar.
5. Repeat steps 2 through 4 for the preceding 11 months to create a set of calendars for one full year. (For ex ample, if it is currently April 2024, print a calendar for each month from May 2023 through April 2024.)
6. Repeat steps 2 through 4 for the month immediately following the current month and year. (For ex ample, if it is currently April 2024, print a calendar for May 2024.)
7. Cut out the 13 printed calendars so that only the month, year, and calendar are visible.
8. Each student pair will receive a calendar for one month of the most recent 12 months. The Moon calendar for the next month will be used with the whole class while students make a prediction.
LES SON 5 RESOURCE C
Moon Calendar Preparation
PhD SCIENCE® TEXAS Level 4 ▸ Earth and Space ▸ Lesson 5 ▸ Resource C
© Great Minds PBC This page may be reproduced for classroom use only. 467
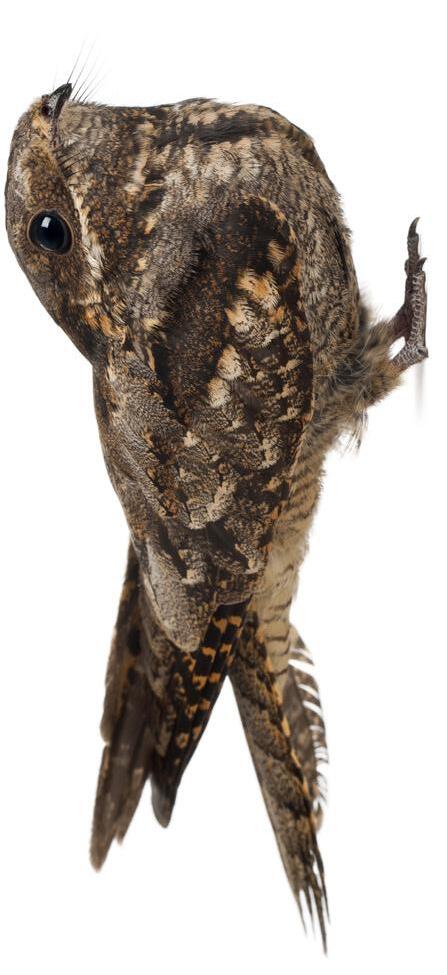
Level 4 ▸ Earth and Space ▸ Lesson 6 ▸ Resource A PhD SCIENCE® TEXAS LES SON 6 RESOURCE A European Nightjar Photograph This page may be reproduced for classroom use only. © Great Minds PBC 468
PhD SCIENCE® TEXAS Level 4 ▸ Earth and Space ▸ Lesson 6 ▸ Resource B LES SON 6 RESOURCE B European Nightjar Migration Map United Kingdom
Nightjar Migration Spring Fall © Great Minds PBC This page may be reproduced for classroom use only. 469
Democratic Republic of Congo
Field Notes
Nightjar Activity
Nightjar Activity Field Notes
Location: United Kingdom
Date range: Summer and Fall 2016
e active during full moon ee times mor e thr Nightjars ar phases. ▪ 11 days after the full moon, most of the nightjars start their migration.
e active during sunrise and sunset and move less Nightjars ar during nighttime hours when the Moon is less illuminated. ▪ This page may be reproduced for classroom use only. © Great Minds PBC 470
Level 4 ▸ Earth and Space ▸ Lesson 6 ▸ Resource C PhD SCIENCE® TEXAS LES SON 6 RESOURCE C
▪
LES SON 6 RESOURCE D Day Length and Temperature Data PhD SCIENCE® TEXAS Level 4 ▸ Earth and Space ▸ Lesson 6 ▸ Resource D © Great Minds PBC This page may be reproduced for classroom use only. Seasons Table Season Months Summer June, July, August Fall September, October, November Winter December, January, February Spring March, April, May Day Length Data Average Monthly Day Length in the United Kingdom, June 2016–May 2017 Day Length (Hours) 24 22.5 21 19.5 18 16.5 15 13.5 12 10.5 9 7.5 6 4.5 3 1.5 0 June July August September October November December January February March April May Month 471
Level 4 ▸ Earth and Space ▸ Lesson 6 ▸ Resource D PhD SCIENCE® TEXAS This page may be reproduced for classroom use only. Temperature Data modngid Ketine U 7 1 h 0 n t y 2 e irut –Ma a 6 r 1 e 0 e 2 e nuJ ly Thtnoe MgarevA 0 5 10 15 20 25 30 35 40 45 50 55 60 65 Average Temperature (°F) Jun Jul Aug Sep Oct Nov Dec Jan Feb Mar Apr May Month © Great Minds PBC 472
Seasonal patterns such as temperature and day length change in predictable ways throughout the year.
PhD SCIENCE® TEXAS Level 4 ▸ Earth and Space ▸ Lesson 7 ▸ Resource A LES SON 7 RESOURCE A Content Standards
© Great Minds PBC This page may be reproduced for classroom use only. 473
Level 4 ▸ Earth and Space ▸ Lesson 7 ▸ Resource A PhD SCIENCE® TEXAS
This page may be reproduced for classroom use only. © Great Minds PBC 474
The Moon phase visible from Earth changes in a predictable pattern each month and throughout the year.
PhD SCIENCE® TEXAS Level 4 ▸ Earth and Space ▸ Lesson 7 ▸ Resource B LES SON 7 RESOURCE B Recurring Themes
© Great Minds PBC This page may be reproduced for classroom use only. 475
and Concepts Patterns
Cause and E�ect
Level 4 ▸ Earth and Space ▸ Lesson 7 ▸ Resource B PhD SCIENCE® TEXAS
This page may be reproduced for classroom use only. © Great Minds PBC 476
PhD SCIENCE® TEXAS Level 4 ▸ Earth and Space ▸ Lesson 7 ▸ Resource B
© Great Minds PBC This page may be reproduced for classroom use only. 477
Scale, Proportion, and Quantity
Level 4 ▸ Earth and Space ▸ Lesson 7 ▸ Resource B PhD SCIENCE® TEXAS Systems This page may be reproduced for classroom use only. © Great Minds PBC 478
PhD SCIENCE® TEXAS Level 4 ▸ Earth and Space ▸ Lesson 7 ▸ Resource B Energy and
© Great Minds PBC This page may be reproduced for classroom use only. 479
Matter
Structure and Function
Level 4 ▸ Earth and Space ▸ Lesson 7 ▸ Resource B PhD SCIENCE® TEXAS This page may be reproduced for classroom use only. © Great Minds PBC 480
PhD SCIENCE® TEXAS Level 4 ▸ Earth and Space ▸ Lesson 7 ▸ Resource B Stability and Change © Great Minds PBC This page may be reproduced for classroom use only. 481
Appendix D
Earth and Space Glossary
This Level 4–appropriate description of the terminology is not intended to be a complete definition.
Term Description Lesson Moon phase the shape of the bright portion of the Moon visible from Earth 5 Sunrise when the Sun first appears over the horizon 2 Sunset when the Sun disappears over the horizon 2 © Great Minds PBC 482
Appendix E
Earth and Space Content-Specific Words, General Academic Words, and Spanish Cognates
Key Terms (Tier Two or Three)
Word(s)
Moon phase Fase (phase)
Sunrise None
Sunset None
Content-Specific Words (Tier Three)
Word(s)
Full moon None
New moon None
Spanish Cognate
Spanish Cognate
© Great Minds PBC 483
General Academic Words (Tier Two)
Word(s) Spanish Cognate
Pattern Patrón
Sequence Sequencia
Level 4 ▸ Earth and Space ▸ Appendix E PhD SCIENCE® TEXAS
© Great Minds PBC 484
End Matter
TEXAS
Works Cited
Energy
Ambitious Science Teaching. 2015. Face-to-Face Tools: Making Changes in Student Thinking Visible over Time. Tools for Ambitious Science Teaching. University of Washington. http://uwcoeast.wpengine.com/ wp-content/uploads/2014/08/Guide-Face-to-Face-Tools.pdf
Doeden, Matt. 2015. Finding Out about Hydropower. Minneapolis: Lerner.
English Language Proficiency Standards, 19 Tex. Admin. Code § 74.4 (2007). Golf Channel. 2016. “Trouble at the Postage Stamp.” Video, 3:04. https://www.golfpass.com/travel-advisor/video/trouble-at-thepostage-stamp#
Home Science Tools. n.d. “How to Make a DIY Solar Oven.” Accessed September 19, 2022. https://www.homesciencetools.com/a/build-asolar-oven-project.
Jeans, James. (1929) 1945. The Universe around Us. New York: MacMillan.
Kamkwamba, William. 2009. “How I Harnessed the Wind.” Filmed July 2009 in Oxford, England. TED video, 5:56. https://www.ted.com/talks/ william_kamkwamba_how_i_harnessed_the_wind.
Kamkwamba, William, and Bryan Mealer. 2012. The Boy Who Harnessed the Wind: Picture Book Edition. New York: Puffin Books.
Mara, Wil. 2013. Wind Turbine Service Technician. Ann Arbor, MI: Cherry Lake.
Texas Essential Knowledge and Skills for Science, 19 Tex. Admin. Code § 112 (2021).
© Great Minds PBC
486
Tools for Ambitious Science Teaching. 2013. Generalizable Science Ideas: The “Gotta Have” Checklist. Ambitious Science Teaching. Vimeo, 9:55, posted April 26, 2015 by Mark Windschitl. Accessed September 19, 2022. https://vimeo.com/126087021.
Earth and Space
English Language Proficiency Standards, 19 Tex. Admin. Code § 74.4 (2007).
Evens, Ruben, Greg J. Conway, Ian G. Henderson, Brian Cresswell, Frédéric Jiguet, Caroline Moussy, Didier Sénécal, Nele Witters, Natalie Beenaerts, and Tom Artois. 2017. “Migratory Pathways, Stopover Zones and Wintering Destinations of Western European Nightjars Caprimulgus europaeus.” IBIS: International Journal of Avian Science 159, no. 3, 680–686. https://doi.org/10.1111/ibi.12469.
US Environmental Protection Agency (EPA). 2014. “How Plug-In Vehicles Work.” Video, 3:00. https://www.epa.gov/greenvehicles/explainingelectric-plug-hybrid-electric-vehicles.
Norevik, Gabriel, Susanne Åkesson, Arne Andersson, Johan Bäckman, and Anders Hedenström. “The Lunar Cycle Drives Migration of a Nocturnal Bird.” PLoS Biology 17, no. 10 (2019): e3000456. https://doi.org/10.1371/journal.pbio.3000456.
Texas Essential Knowledge and Skills for Science, 19 Tex. Admin. Code § 112 (2017).
PhD SCIENCE® TEXAS Level 4 ▸ Energy | Earth and Space ▸ Works Cited © Great Minds PBC
487
Credits
Great Minds® has made every effort to obtain permission for the reprinting of all copyrighted material. If any owner of copyrighted material is not
acknowledged herein, please contact Great Minds for proper acknowledgment in all future editions and reprints of this module.
Energy
Pages 22, (left), 273, Piet Mondrian, Windmill, 1917 © 2022 Mondrian/Holtzman Trust. Image credit: Art Collection 2/Alamy Stock Photo; pages 22 (right), 274, Piet Mondrian, Oostzijdse Mill with Extended Blue, Yellow, and Purple Sky, 1907–08 © 2022 Mondrian/Holtzman Trust, image credit: Haags Gemeentemuseum, The Hague, Netherlands/Bridgeman Images; pages 24 (left), 275, PHB.cz (Richard Semik)/Shutterstock.com; pages 24 (right), 276, Bikeworldtravel/Shutterstock.com; pages 34, 279, Stockr/Shutterstock.com; pages 35, 280, esbobeldijk/Shutterstock.com; pages 114, 283, Nixx Photography/Shutterstock.com; page 159 (from left), Adam Meaney/Shutterstock.com, sunakri/Shutterstock.com, mariakray/ Shutterstock.com; page 160 (from left), Nielskliim/Shutterstock.com,
Elena Elisseeva/Shutterstock.com, simonidadj/Shutterstock.com; pages 170, 305, William Potter/Shutterstock.com; pages 188, 312, CrackerClips Stock Media/Shutterstock.com; pages 207, 326, FEMA News Photos; pages 261, 265, vasa/Alamy Stock Photo; page 284 (left), BlackBoxGuild/Shutterstock.com, (right), shiv.mer/Shutterstock.com; page 299, Adam Meaney/Shutterstock.com; page 300, sunakri/ Shutterstock.com; page 301, mariakray/Shutterstock.com; page 302, Nielskliim/Shutterstock.com; page 303, Elena Elisseeva/Shutterstock.com; page 304, simonidadj/Shutterstock.com
All other images are the property of Great Minds.
© Great Minds PBC
488
Earth and Space
Pages 370 (all), 436, 437, 438, Tom Uhlman/Alamy Stock Photo; pages 402 (left), 464, tamu1500/Shutterstock.com; pages 402 (right), 465, earlbowden via pxhere.com; pages 414, 468, Eric Isselee/Shutterstock.com; pages 425, 426, 429, 430 (all), Elena11/Shutterstock.com
All other images are the property of Great Minds.
PhD SCIENCE® TEXAS Level 4 ▸ Energy | Earth and Space ▸ Credits
PBC 489
© Great Minds
Acknowledgments
Great Minds® Staff
The following writers, editors, reviewers, and support staff contributed to the development of this curriculum:
Amanda Abbood, Nashrah Ahmed, Maria Albina, Ana Alvarez, Lindsay Arensbak, Lynne Askin-Roush, Marissa Axtell, Brian Aycock, Keith Bannister, Nina Barcelli, Trevor Barnes, John Barnett, Greg Bartus, Michele Baskin, Koi Beard, Tocarra Bell, Brianna Bemel, Kerry Benson, Sanobar Bhaidani, David Blair, Ranell Blue, Jennifer Bolton, Sandy Brooks, Bridget Brown, Taylor Brown, Dan Brubaker, Carolyn Buck, Sharon Buckby, Lisa Buckley, Kristan Buckman, Becky Bundy, Sarah Bushnell, Eric Canan, Adam Cardais, Crystal Cizmar, Emily Cizmas, Rolanda Clark, Elizabeth Clarkin-Breslin, Christina Cooper, Kim Cotter, Karen Covington, Gary Crespo, Madeline Cronk, Lisa Crowe, Allison Davidson, Kristin Davis, Brandon Dawson, Megan Dean, Katherine DeLong, Julie Dent, Jill Diniz, Erin Doble, Delsena Draper, Amy Dupre, Jami Duty, Jessica Dyer, Lily Eisermann, Alison Engel, Sandy Engelman, Tamara Estrada,
Lindsay Farinella, De Edra Farley, Ubaldo Feliciano-Hernández, Molly Fife, Lisa Fiorilli, Soudea Forbes, Mark Foster, Richard Fox, Peter Fraser, Reba Frederics, Liz Gabbard, Diana Ghazzawi, Lisa Giddens-White, Patricia Gilbert, Ellen Goldstein, Laurie Gonsoulin, Pamela Goodner, Kristen Gray, Lorraine Griffith, Dennis Hamel, Debbie Hardin, Heather Harkins, Cassie Hart, Kristen Hayes, Sarah Henchey, Marcela Hernández, Abbi Hoerst, Jessica Holman, Missy Holzer, Matthew Hoover, Robert Hunter, Jennifer Hurd, Rachel Hylton, Robert Ingram Jr., Mamie Jennings, Reagan Johnson, Yuria Joo, Marsha Kaplan, Francine Katz, Ashley Kelley, Robert Kelly, Lisa King, Suzanne Klein, Betsy Kolodziej, Sarah Kopec, Jenny Kostka, Drew Krepp, Rachel Lachiusa, Brittany Langlitz, Mike Latzke, Lori Leclair, Catherine Lee, Jennifer Leonberger, Jessica Levine, Caren Limbrick, Latoya Lindsay, Sarah Lomanno, Katherine Longo, Scott Loper, Susan Lyons, Kristi Madden, David Malone, Carolyn Mammen, Katrina Mangold, Stacie McClintock, Miranda McDaniel, Megan McKinley-Hicks, Cindy Medici, Ivonne Mercado, Sandra Mercado,
© Great Minds PBC
490
Kevin Mesiar, Patty Messersmith, Brian Methe, Patricia Mickelberry, Marisa Miller, Sara Montgomery, Melissa Morgan, Mackenzie Most, Lynne Munson, Mary-Lise Nazaire, Corinne Newbegin, Darin Newton, Bekka Nolan, Tara O’Hare, Gillia Olson, Max Oosterbaan, Tamara Otto, Catherine Paladino, Meagan Palamara, Christine Palmtag, Mallory Park, Marya Parr, Joshua Paschdag, Emily Paulson, Emily Peterson, Margaret Petty, Nina Phelps, Jeffrey Plank, Judy Plazyk, Amelia Poppe, Lizette Porras, Jeanine Porzio, Jennifer Raspiller, Dan Ray, Brianna Reilly, Jocelyn Rice, Leandra Rizzo, Sally Robichaux, Cortni Robinson, Jeff Robinson, Todd Rogers, Karen Rollhauser, Allyson Romero, Angel Rosado Vega, Carol Rose, Angela Rothermel, Kim Rudolph, Megan Russo, Isabel Saraiva, Vicki Saxton, Michelle Schaut, Lauren Scheck,
Colleagues and Contributors
We are grateful for the many educators, writers, and subject-matter experts who made this program possible.
Tricia Boese, Thomas Brasdefer, Andrew Chen, Arthur Eisenkraft, Pat Flanagan, Rachel Gritzer, Fran Hess, Kim Marcus, Fred Myers, Jim O’Malley, Neela Roy, Ed Six, and Larry Stowe
Gina Schenck, Stephanie Schoembs, Amy Schoon, Jesse Semeyn, Rudolph Shaffer, Khushali Shah, Nawshin Sharif, Lawrence Shea, Aaron Shields, Cindy Shimmel, Maria Shingleton, Melissa Shofner, Erika Silva, Kerwyn Simpson, Laura Sirak-Schaeffer, Amy Snyder, Victoria Soileau, Rachel Stack, Isaac Stauffer, Leigh Sterten, Marianne Strayton, Mary Sudul, Lisa Sweeney, Elizabeth Szablya, Annie Wentz Tete, Heidi Theisen, Brian Thompson, Lauren Trahan, Olga Tuman, Kimberly Tyler, Jennifer VanDragt, Tracy Vigliotti, Freddy Wang, Lara Webb, Dave White, Charmaine Whitman, Erica Wilkins, Tiffany Williams, Erin Wilson, Mark Wise, Glenda Wisenburn-Burke, Armetta Wright, Howard Yaffe, Nazanene Yaqubie, Christina Young, Amy Zaffuto, Cat Zarate, and Suzanne Zimbler.
PhD SCIENCE® TEXAS Level 4 ▸ Energy | Earth and Space ▸ Acknowledgments
© Great Minds PBC 491
ON THE COVER
Windmill, 1917
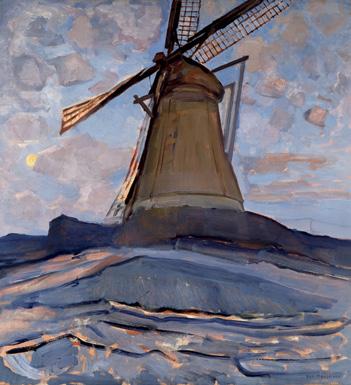
Piet Mondrian, Dutch, 1872–1944
Oil on canvas
© 2022 Mondrian/Holtzman Trust
Photo credit: Art Collection 2/Alamy Stock Photo
Windmills and how they work anchor this study of energy. Students investigate and identify energy indicators, observe energy transformation, gather and analyze data to determine the relationship between speed and energy, and model the flow of energy through a windmill. Inspired by a true story about a boy who built a windmill that lit his house and changed his community, students design their own light-generating device.
In the Spotlight: Flowering plant behaviors inspire the study of how patterns in nature can be used to make predictions. Students identify patterns of change by analyzing seasonal day length and temperature data and exploring how the Moon’s appearance is a repeating pattern. They use what they learn to identify and predict day length, temperature, and Moon phase patterns as they relate to nightjar observations.
TEXAS
LEVEL 4 MODULES
1 EARTH FEATURES with Spotlight Lessons on Mixtures and Solutions
2 ENERGY with Spotlight Lessons on Earth and Space
3 PLANTS IN THE ENVIRONMENT
ISBN 979-8-88588-528-7
Great Minds® brings teachers and scholars together to craft exemplary instructional materials that inspire joy in teaching and learning. PhD Science®, Eureka Math®, Eureka Math2 ®, and our English curriculum Wit & Wisdom® all give teachers what they need to take students beyond rote learning to provide a deeper, more complete understanding of the sciences, mathematics, and the humanities.
A
9 798885 885287