Regional Strategy for Growth and


TIP Strategies, Inc., would like to thank the following individuals and organizations for their participation in this planning process, including the Greater Spokane Inc. staff who provided administrative support for the plan.
Michaele Armstrong
sp3nw
Brooke Baker
Baker Construction & Development, Inc.
Gary Ballew
Greater Spokane Inc.
Chaz Bates
City of Spokane Valley
Lance Beck
Greater Spokane Valley Chamber of Commerce Glen Best
Inland Power & Light Company
Mason Burley Urbanova
Ben Cabildo
AHANA
Todd Coleman
S3R3 Solutions
Kirstin Davis
City of Spokane
Alisha Benson
Chief Executive Officer
Jodi Brant
Education Attainment Navigator
Cyndi Donahue
Ignite Northwest
Ginger Ewing
Terrain
Kelly Fukai
Spokane International Airport
Alex Gibilisco
City of Spokane
Lars Gilberts
Numerica Credit Union
Miguel Gonzales
Hispanic Business/Professionals Association
Joey Gunning
Greater Spokane Inc.
David Guthrie
Northeast Public Development Authority
Shauna Harshman
City of Spokane
Lacrecia Hill
Spokane Independent Metro Business Alliance
Meg Lindsay Providence
Mark Losh
West Plains Chamber of Commerce
Deekon Jones
New Developed Nations
Patrick Jones
Eastern Washington University Steve MacDonald
City of Spokane Mark Mattke
Spokane Workforce Council Brian McClatchey City of Spokane Traci McGlathery STCU
Spokane Independent Metro Business Alliance
Jeff McMorris
Spokane County
Ben Krauss
Director of the Multi-Ethnic Development Council
Yolanda Pagaduan
Director of Communications & Marketing
Stacia Rasmussen
Life Sciences Spokane Business Development Manager
Aleesha Roedel
Government Contracting Assistance Specialist
April Needham
Washington State University Spokane
John Powers
Powers Economics
Mark Richard
Downtown Spokane Partnership
Jaxon Riley
Leadership Spokane
Lisa Simpson Visit Spokane
Juliet Sinisterra
University District
Teri Stripes City of Spokane Joe Tortorelli
City of Deer Park Steve Trabun
Avista Corporation
TIP Strategies, Inc., is a privately held economic development consulting firm with offices in Austin and Seattle. TIP is committed to providing quality solutions for public sector and private sector cli ents. Established in 1995, the firm’s primary focus is economic development strategic planning.
TIP Strategies
2905 San Gabriel Street, Suite. 309 Austin, TX 78705
PH: +1 512 3439113
www.tipstrategies.com
Maria Vandervert
Communications & Marketing Manager
Jeff Marcell, Senior Partner
Elizabeth Scott, Senior Consultant
Katrina Parkey, Consultant


THRIVE Spokane, a comprehensive economic development strategy (CEDS), represents a collective vision for equitable and sustainable economic prosperity across Spokane County, Washington. Developed in accordance with the US Economic Development Administration’s (EDA) CEDS requirements, the purpose of THRIVE Spokane is to align economic development efforts and guide practitioners and partners in the implementation of programs that support business and economic growth over the next five years. This planning objective was accomplished by bringing together public and private partners through an inclusive and collaborative process.
Greater Spokane has grown into the second largest metro area in the state of Washington and a significant economic driver for the Inland Northwest. The region is home to vibrant and dynamic industries ranging from aerospace and life sciences to advanced manufacturing and agriculture. Communities in Spokane County are brimming with potential, and residents are optimistic about the future. The region is supported by a full spectrum of outstanding higher education institutions that support the broad workforce development needs of new and established businesses and help diverse student populations access meaningful career pathways. In addition to the City of Spokane, the County seat, there are dozens of smaller cities, towns, and unincorporated communities throughout Spokane County that contribute to the region’s high quality of life and provide amenities to residents and visitors. A unique blend of outdoor recreational opportunities abounds across all four seasons, from fishing and rafting to hiking and skiing. Collectively, the region’s philanthropic and nonprofit organizations are working toward a resilient future by addressing the community’s mental health needs, educational opportunities, and more.
With cautious optimism about the future of the Spokane region, it is clear there are major hurdles to economic growth. Lasting impacts of historical inequities still linger in the region today. In the 1950s, the predominantly Black or of African Descent East Central neighborhood was torn apart for the construction of I-90, which was deemed necessary to advance economic growth.1 Businesses along the corridor were forced to close, hundreds of homes were demolished, and green space was nearly eliminated with the dramatic reduction of Liberty Park. Neighborhoods impacted by the creation of I-90 include some of the most underserved communities in Spokane today. Pervasive redlining practices kept Native American or Indigenous families from purchasing homes
1 Spokane Regional Health District’s Neighborhoods Matter Project and Frank Oesterheld. “Neighbor hoods Matter: The Impact of the I-90 Freeway on the East Central Neighborhood, an Oral History—Intro duction.” Spokane Historical.
on the land of their ancestors,2 which was brutally taken from the Tribes in the previous century, excluding them and many other Black and Brown families from the generational wealth building that homeownership often brings. Expo ’74 is lauded as a landmark event in Spokane’s history, but it too came at a cost. The historic Trent Alley district, predominantly occupied by Chinese American and Japanese American businesses, was razed for the exposition in the name of urban renewal.3 Access to affordable housing, high quality education, and reliable broadband are just a few examples of current inequities, each of which is being dramatically accelerated by the COVID-19 pandemic, leaving some residents and communities with the sense they are being left behind. Addressing these issues will prepare the region to be more resilient in the face of future economic disruptions and help to promote equitable opportunities for all residents.
With these considerations in mind, Greater Spokane Incorporated (GSI) led the preparation of an updated CEDS for Spokane County. In its simplest form, economic development is the creation of wealth through business development. In today’s competitive environment, the practice has expanded to address broader, community-based issues that directly impact a region’s ability to attract and grow businesses. Likewise, this planning process took a broad view of economic development. Funded in part through a grant from the EDA, the CEDS documents the community’s vision for regional economic prosperity through sustainable and equitable growth. The action-oriented plan will shape economic development efforts by leveraging the region’s assets and opportunities, while mitigating its weaknesses. Although the plan focuses on strategies for the next five years, the impacts will extend well beyond that timeframe.
No strategic plan can solve every community challenge. However, by engaging the community in brave spaces where people feel comfortable learning, growing, and sharing their thoughts on Greater Spokane’s future, the CEDS process and the resulting THRIVE Spokane action plan will move the region toward greater alignment, improved communication, and enhanced cooperation among public and private leadership.
2 Margo Hill. “No Honor in Genocide: A Case Study of Street Renaming and Community Organizing in the Wake of Decolonization Efforts.” Journal of Hate Studies 17, 1: (October 5, 2021). 3 Jim Kershner. “Demolition Fades Memories Further.” The Spokesman-Review. (May 9, 2009).
community engagement was a top consideration throughout the formulation of THRIVE Spokane. Unfortunately, that mindset has not always been the case. Planning efforts have not always included nontraditional economic development organizations or many community-based organizations, an omission that has had lasting impacts on the region. Although leadership has made a concerted effort to ensure broad participation, they also acknowledge there is a long road ahead to build trust and partnership within the community in order to move the CEDS forward.
The THRIVE Spokane Steering Committee, comprised of nearly 40 community leaders, oversaw the planning process, including the coordination of community engagement events. Steering committee members represented a wide variety of organizations encompassing municipal governments; private sector businesses; Black, Indigenous, and people of color (BIPOC) and community-based organizations; and more. These members played a vital role in the plan’s development, providing countless hours of in-kind support. Working through multiple iterations of draft strategies and action items, the steering committee vetted the plan, ensuring it aligned around a unifying vision of regional prosperity. Committee members are dedicated to implementing the CEDS, which directs strategic initiatives around Spokane’s numerous assets and expands economic opportunity for all residents.
Along with the steering committee, a group of thought leaders, comprised of public, private, and philanthropic leaders throughout the region, provided feedback and insights on the plan. These advisors added value to THRIVE Spokane with additional expertise and lived experience reflected in the plan. Members of this group have also been invited to support the plan’s implementation. In addition, over 1,000 people provided input via multiple project-related surveys and more than 175 individuals representing 100 organizations were thoughtfully engaged through a vigorous outreach process to co-create THRIVE Spokane.
With the assistance of TIP Strategies (TIP), GSI launched the project in June 2021. In the initial discovery phase, the engagement focused on data collection and analysis, drawing on a variety of resources. The second phase of the project included individual and group conversations, surveys, and roundtables to better understand the region’s opportunities. Community visioning was a critical component of this phase, providing the project team a forum to bring together a diverse group of voices, partners, and organizations to define what economic prosperity means for the region’s future. During the third and final phase, both quantitative data and qualitative insights, combined with TIP’s extensive experience and understanding of best practices from other regions, helped shape the strategies in the plan.
As a CEDS, THRIVE Spokane must adhere to the EDA’s criteria and format for an economic development plan. This body of work includes all the requisite components to qualify as a CEDS, after final EDA approval. Requirements such as the strengths, weaknesses, opportunities, and threats (SWOT) analysis, which was informed by both qualitative and quantitative analysis, directly link to the strategies outlined in the Action Plan section. Other required elements, such as the vision statement, were formed based on broad public input, which highlighted some of the area’s most complex problems, established regional priorities, and set the framework for action.
Like communities around the world, the Spokane region continues to deal with the implications of the COVID-19 pandemic, placing economic recovery foremost on the minds of many residents. Other concerns the region continues to grapple with include the threat of climate change and the need to build resilient systems. Not only to achieve climate resilience, but also to create economic resilience and build equitable opportunities for residents. The pandemic accelerated many threats that were already forming, including housing deficits, lack of childcare, and economic inequality. Although progress is occurring throughout the region, there is a sense that improved communication channels and coordination across partners could do even more to solve these and other pressing concerns. Regional leaders also recognize that Spokane must remain competitive to attract and retain diverse talent and to help ensure long-term prosperity. These themes formed the foundation of the CEDS planning framework and ultimately the vision, guiding principles, and action plan for THRIVE Spokane.
Public participation is an essential aspect of any community visioning process. A community vision survey provided a flexible and accessible mechanism for public engagement in the CEDS process. Survey responses helped identify where community members want the regional economy to be in 10 to 20 years. This information was used to articulate a broad regional vision statement for the CEDS. Responses were also disaggregated by geographic and demographic characteristics to measure how effectively community members were engaged across neighborhoods, generations, gender, and racial/ethnic backgrounds and to illustrate different viewpoints among these groups. Ultimately, the visioning process generated nearly 1,000 responses, capturing input from diverse voices in the community to craft the following vision statement.
The Greater Spokane community is creative by nature and embraces its regional connectivity and competitive advantages to ensure resilient growth and economic opportunity for all.
Four guiding principles were developed as a direct response to some of the region’s most complex challenges and compelling opportunities. These guiding principles embody the goals and objectives identified throughout the planning process. The strategies and actions within this plan are organized around these ideas.
• RECOVERY AND RESILIENCE: Target efforts that prepare the region to avoid, withstand, and recover from economic shocks and natural disasters.
• COMPETITIVENESS: Position the Greater Spokane region as a strong competitor to attract talent, capital, and resources for strategic economic development.
• EQUITABLE GROWTH: Seek to understand, address, and dismantle outcome disparity through intentional initiatives that include all Spokane residents in the benefits of economic growth and prosperity.
• CONNECTIVITY: Promote the interconnectedness of Greater Spokane and drive cross-sector partnerships to align efforts that advance economic opportunity for all.
THRIVE Spokane is the Spokane community’s road map to guide economic development efforts across the County over the next five years. Through a robust stakeholder engagement process, the Greater Spokane community came together to identify the region’s most pressing challenges and greatest opportunities to reduce economic barriers and increase economic opportunity for all. The four guiding principles in this CEDS—recovery and resilience, competitiveness, equitable growth, and connectivity—are structured to complement and build on one another to create a holistic approach to economic development. The CEDS includes new, as well as existing, strategies, all developed by the CEDS steering committee with the input of leaders and community members across the region. Whether it be deploying community wealth building4 strategies for driving resilience or strengthening business retention and expansion efforts to make the region a stronger economic competitor, collaboration and coordination across sectors will be essential to the successful implementation of THRIVE Spokane. With ambitious and bold initiatives, the plan is designed to allow regional leaders and implementation partners to act swiftly as economic conditions change.
The evaluation framework for the CEDS can be found in the implementation matrix, which will be updated on a regular basis to track plan implementation.


As part of the planning process, TIP Strategies conducted a broad analysis of the economic and social conditions that influence economic vitality and competitiveness. The data used for this background analysis came from the US Census Bureau’s 2019 American Community Survey (ACS) five-year average sample, the US Bureau of Labor Statistics (BLS), and Emsi. The data was compiled at the start of the project and, at the time, reflected the most recent available. Although there are local sources featuring more recent data, such as Spokane Trends,5 for the purposes of this project, it was necessary to use data that can be directly compared to neighboring communities in Idaho, as well as peer communities throughout the US. Data sets were chosen intentionally to ensure that the same methodology was used to create accurate comparisons, as well as offer the ability to track data changes longitudinally. The assembled data exposed trends and patterns that have continued in recent years. These trends and patterns were used as the basis for the SWOT analysis and as the foundation for the data-driven strategies presented in the Action Plan.
Although the CEDS only includes strategies for Spokane County, TIP’s economic analysis encompassed Stevens and Pend Oreille Counties in Washington and Kootenai County, Idaho, which are part of the Spokane-Coeur d’Alene combined statistical area (CSA). Due to Spokane’s geographic location on the Idaho border and the bistate dynamics, including a cross-border labor shed, it was imperative to understand the characteristics of the other counties in the CSA. The complete analysis, including comparisons to statewide and national data, can be found at thrivespokane.org, a CEDS project website maintained by GSI. Key findings from this interactive analysis, summarized here, informed and shaped the direction of the CEDS.
The region is growing and attracting new residents.
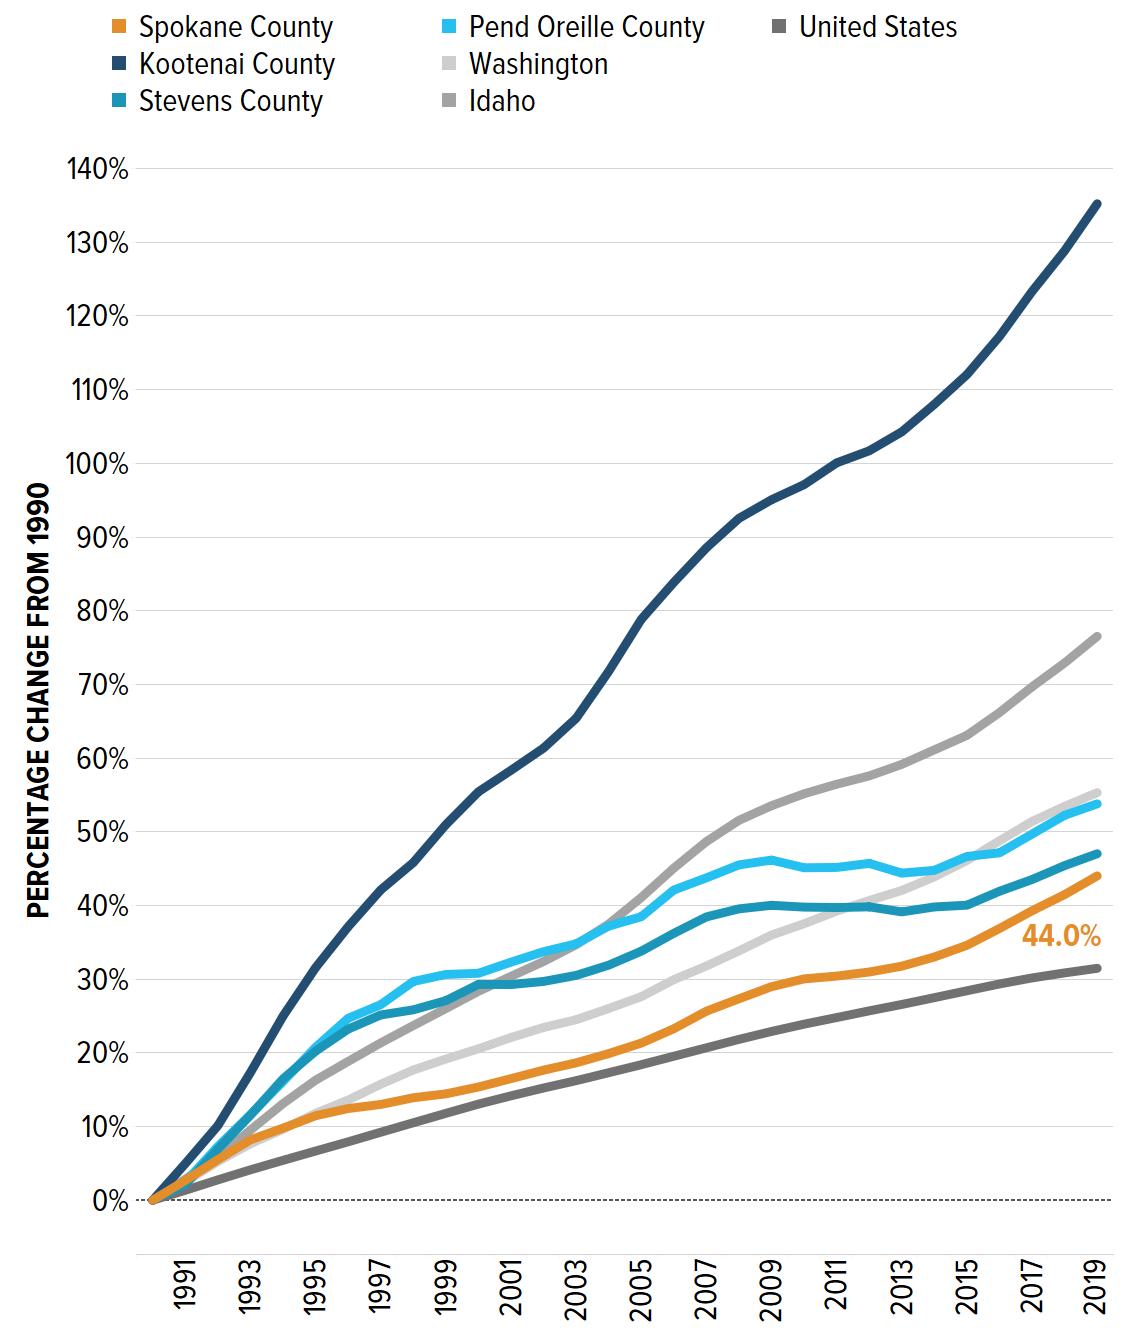
Spokane County continues to be the most populous County in Eastern Washington, with an estimated 2021 population of just over 541,000. The County reached a milestone population marker of 500,000 in 2017. Since then, the County continues to grow at a steady pace and has increased by 44 percent over the past three decades. This growth has been overwhelmingly driven by strong positive net in-migration to Spokane County from other parts of the US.
Sources: US Census Bureau, Population Estimates Program; Moody’s Analytics; TIP Strategies, Inc.
5 SpokaneTrends.org is a collaboration between the City of Spokane and Eastern Washington University, with the support of the Innovia Foundation, to provide relevant community data in a user-friendly format.
More than 75 percent of population growth since 2015 can be attributed to net domestic migration. Small neighboring counties continue to grow as well, and often at a faster pace (see Figure 2, page 8). Kootenai County, Idaho, to the east, has grown particularly fast, more than doubling its population in the same 30-year period. Even with this strong growth, it was still less than one-third of Spokane’s total population in 2019.
Regional has stressed the housing supply as affordability escapes many.
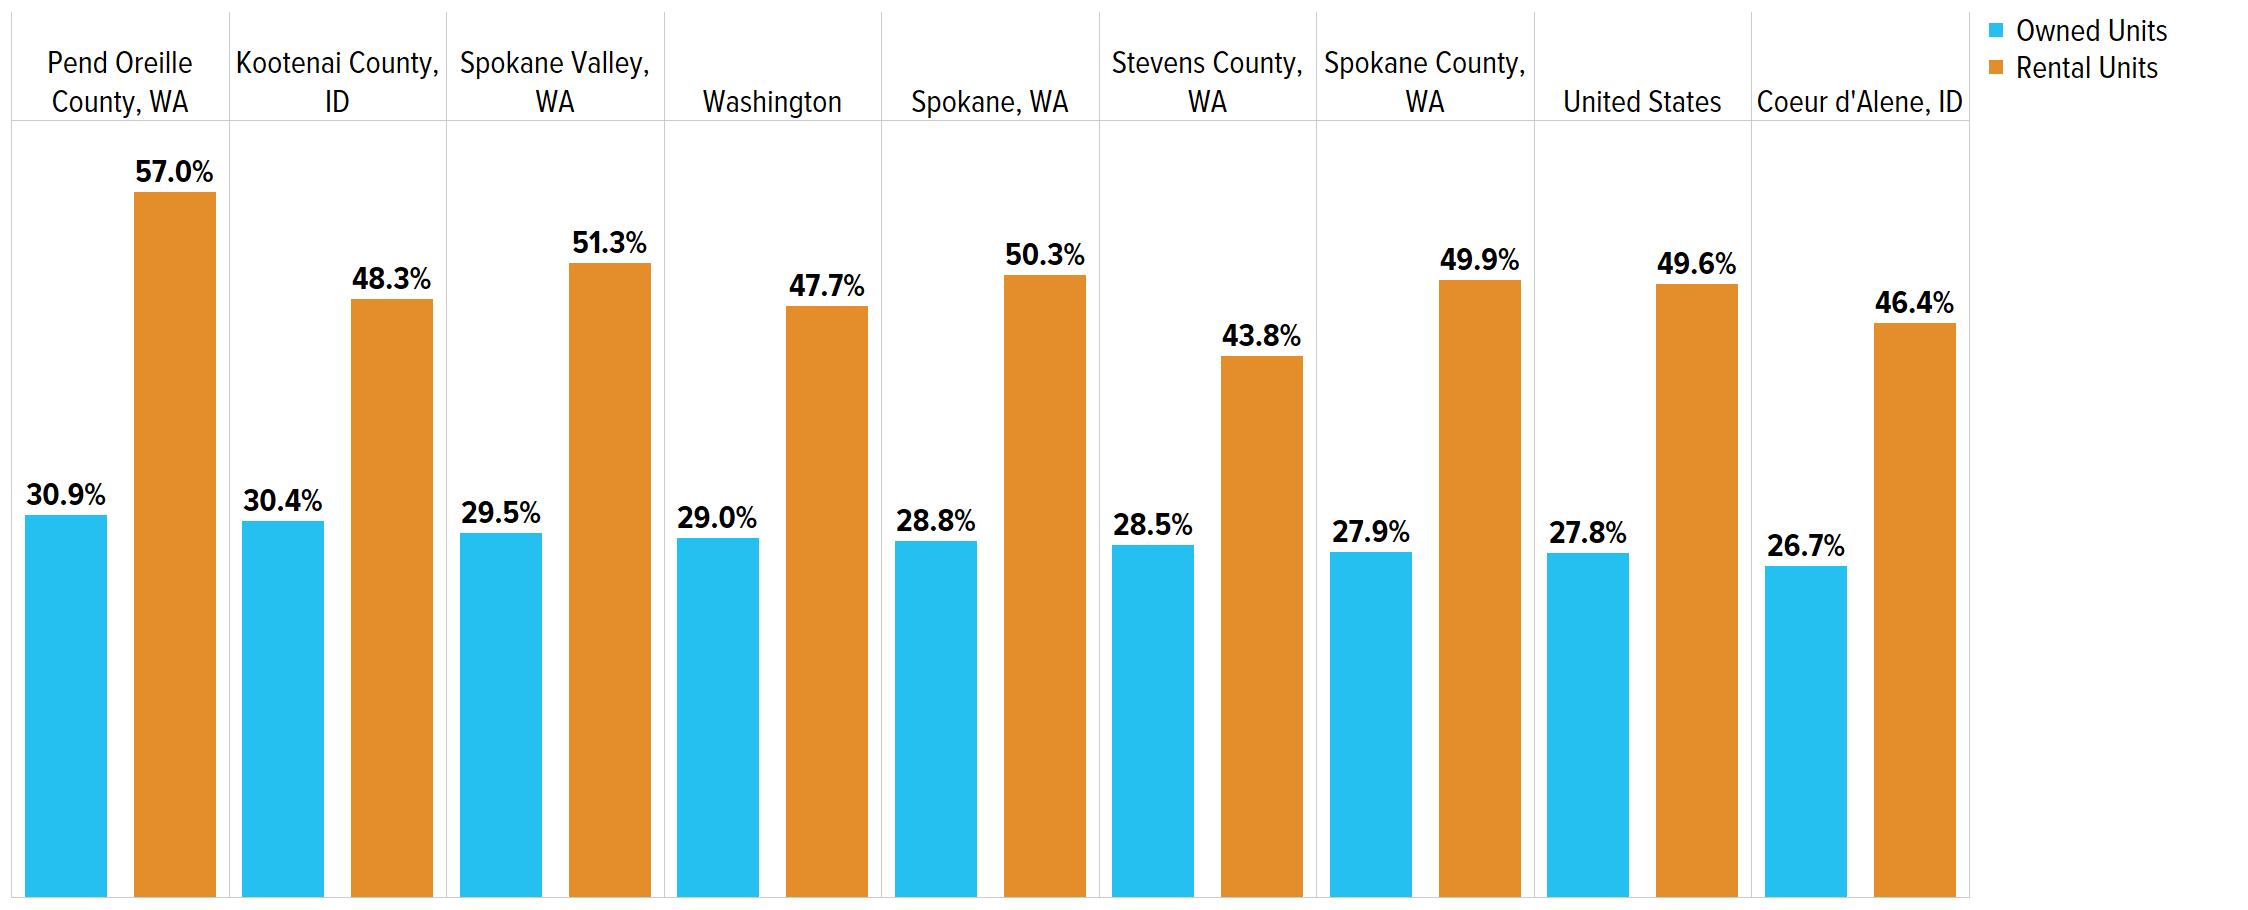
The 2019 median home value in Spokane County ($225,000) was on par with the national median ($218,000) and in the middle of the regional values. Spokane City’s median home value did not follow this trend and was lower than nearby regions at $188,000. Despite modest home values, housing affordability in the region is challenging (see Figure 3), as 28 percent of homeowner
households and one-half of all renter households in Spokane County were costburdened (paying more than 30 percent of income on housing). Comparing median household income with the median home value, Spokane County residents may be able to afford a home, but minor changes to mortgage terms or slight fluctuations in income could put homeownership out of reach. More recent data from the Federal Housing Finance Agency and the National Association of Realtors show how this trend has accelerated since 2019 (see Figure 4). Through 2019, the average appreciation of single-family homes in the Spokane metro area increased by 2 to 3 percent each quarter. The alreadyhigh appreciation rate has continued to increase, peaking in the second quarter of 2021 when the average home appreciated by 8.7 percent in a three-month period. This rapid appreciation can be seen in the median listing prices, which hit a new high in January 2022, at nearly $490,000.
Sources: American Community Survey, 2019 five-year sample; TIP Strategies, Inc.
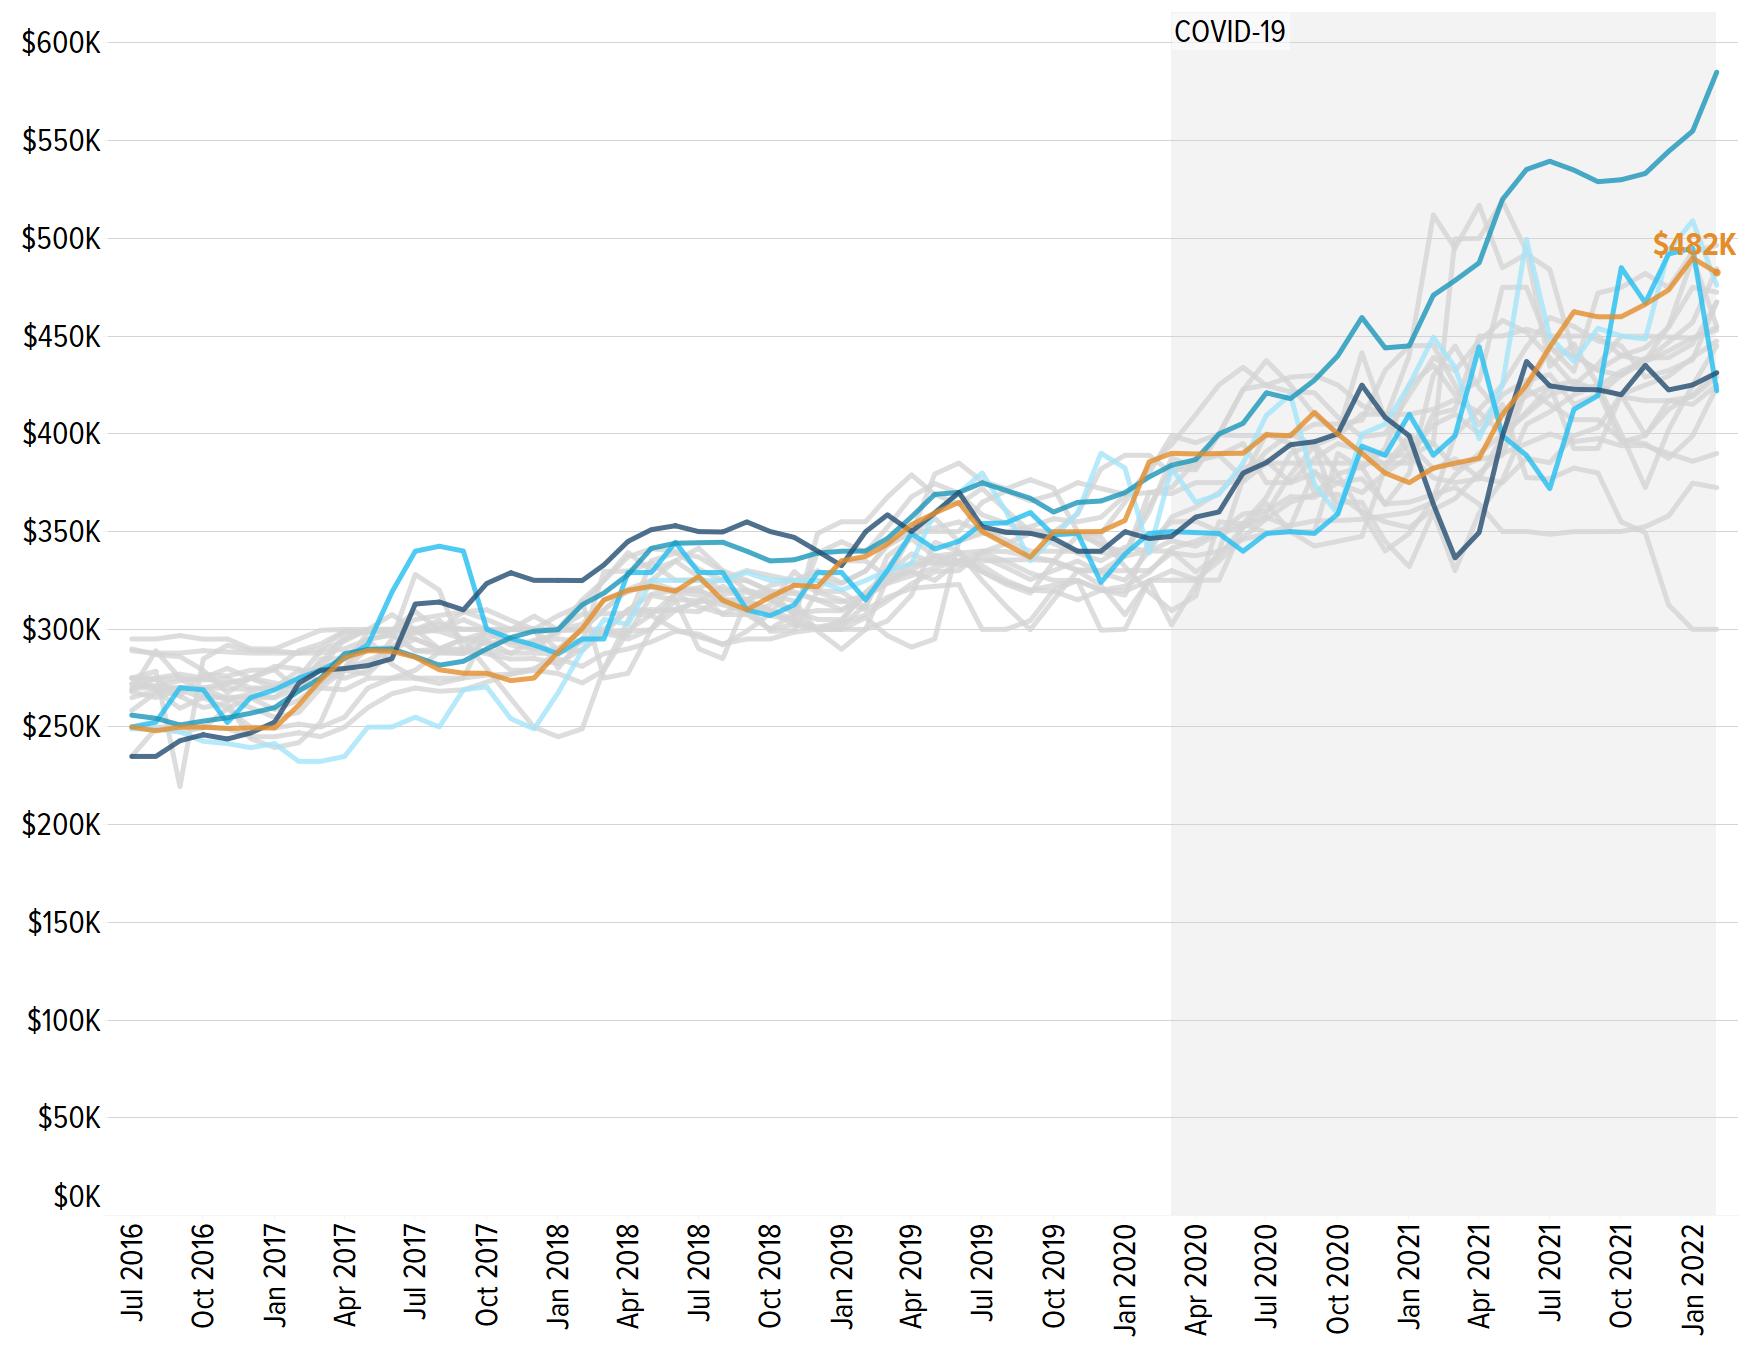
COMPARISONS TO METRO AREAS WITHIN 10 PERCENT OF SPOKANE’S MEDIAN LISTING PRICE FOR AT LEAST THREE-QUARTERS OF THE MONTHS MEASURED.
Spokane-Spokane Valley, WA
Albany, OR
Boise City, ID
The Dalles, OR
Walla Walla, WA
Other similarly priced metro areas
Sources: National Association of Realtors, Realtor.com, residential listings database; TIP Strategies, Inc.
Notes: Metro areas were defined as similarly priced if the median listing price of homes for sale on the multiple listing service (MLS) was within 10 percent of values in the Spokane metro area across at least three-quarters of the months analyzed. The similarly priced metros represented by gray lines include the following: Atlanta-Sandy Springs-Roswell, Georgia; Chico, California; Crescent City, California; Fernley, Nevada; Grand Junction, Colorado; Kingston, New York; Laconia, New Hampshire; Merced, California; Morehead City, North Carolina; Nogales, Arizona; Red Bluff, California; Richmond, Virginia; Salisbury, Maryland-Delaware; Show Low, Arizona; Trenton, New Jersey; Worcester, Massachusetts-Connecticut; and Yuba City, California.
Spokane County workers make up the largest labor force in the region.
Although Spokane County’s labor force of nearly 250,000 is relatively large, the County’s labor force participation rates in 2019 were a bit lacking at 60.8 percent compared to the state and national benchmarks of about 63 percent during that same time period (see Figure 5). County employment has grown consistently since 2011 and surpassed pre-Great Recession (2007–2009) levels in 2016. The COVID-19 recession led to widespread employment contractions, but the effect was relatively smaller in Spokane County (a 3.6 percent decrease) compared to the Great Recession (4.3 percent) and compared to statewide and national declines.
Residents in the Spokane region have higher overall education rates, but average income levels.
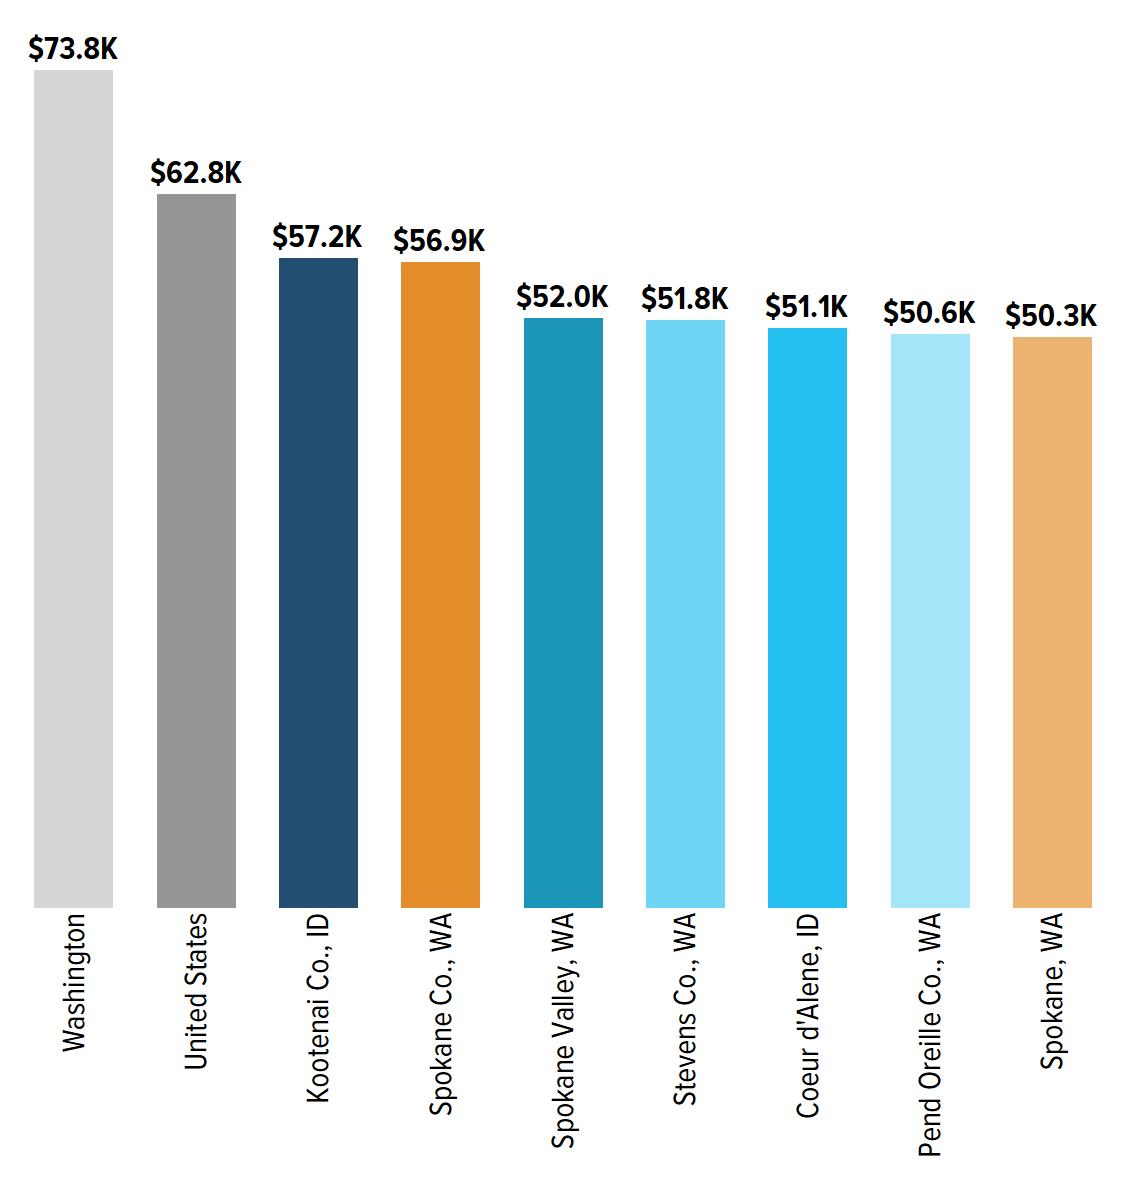
Though more than 84 percent of Spokane’s population identifies as White, the County tends to be more diverse than neighboring regions, though less so than Washington State overall. Spokane County also tends to have more educated residents with at least 31 percent holding a bachelor’s degree or more, though this is slightly below state and national levels (see Figure 6, page 12). However, higher educational attainment may not have translated into higher wages as the median household in Spokane County sits below the national median and only slightly above its rural neighbors (see Figure 7, page 12). Moreover, the County has an elevated federal poverty rate at 13.7 percent of the population, compared with only 10.8 percent for the state.


20 years. The retail, accommodation and food services, and education sectors are all major employers in Spokane County and were steadily rising through the end of 2019. However, these sectors saw substantial losses during the COVID-19 recession, shedding a combined total of over 6,700 jobs in 2020 (see Figure 8, page 13). Sales workers, food preparation and serving workers, and instructors followed a similar pattern with significant reduction in jobs over the same period. Office and administrative workers—the largest occupational group in the County—also saw losses, but this occupation group appears to be on a longer-term gradual decline, as there are 3,100 fewer of these jobs in the County compared to 2015.
Sources: American Community Survey, 2019 five-year sample; TIP Strategies, Inc.
Notes: Educational attainment only measured for population 25 years and older. High school includes equivalency. Some college indicates no degree was received. Graduate degree includes professional degrees and doctoral programs. Totals may not sum to 100 percent due to rounding.
Stable trends point to a strong healthcare sector as manufacturing gradually declines.
Healthcare continues to be the largest employer sector in Spokane County with over 46,000 jobs in 2020—more than 18 percent of total employment. Growth in this sector has been steady over the past 20 years and is on track with state trends and even slightly outpacing national growth. Though the manufacturing sector stabilized after 2008 and has experienced modest gains since 2010, the long-term trend is still downward, declining by more than 21 percent in the past
Sources: American Community Survey, 2019 five-year sample; TIP Strategies, Inc.

With the threat of new COVID-19 variants, the Occupational Risk Tool provides a timely examination of occupations likely to be affected by public health and economic crises. The interactive data visualization, available at thrivespokane. org, explores occupational risk from two sources: the risk to personal health from COVID-19 and the economic risk from job or income loss. The two risk sources are used to plot a position for more than 700 occupations that illustrates the amount of risk to earning and health that residents may experience as a result of their jobs. The information can be mapped by ZIP Code and disaggregated across demographic groups and by individual occupations within major occupational groupings as well as by major industry sectors. While workers continue to face health risks associated with in-person work, communities that understand the pain points of their local labor force will be better equipped to respond effectively to the evolving needs of resident workers.
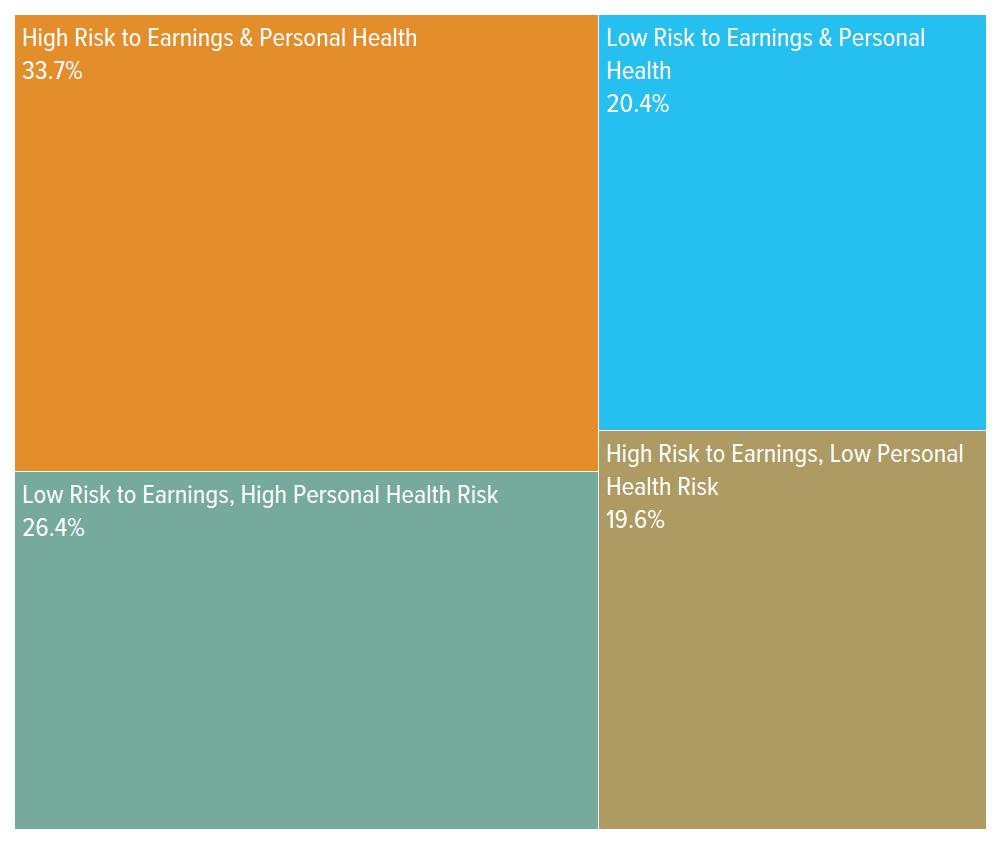
One in three workers living in the Spokane metro are in jobs with a high risk to earnings and to personal health.
One-third of all workers (33.7 percent, totaling over 266,000) living in the Spokane metropolitan area are in the highest risk quadrant with relatively high risk to personal health and earnings (see Figure 9). This share is just above the national rate of 31.1 percent and in the middle of the distribution among similarsized metro areas (those with 100,000 to 500,000 workers). A few of the largest occupations in the highest risk quadrant include food preparation and serving workers, personal care aides, and waiters and waitresses.
Workers in low-wage jobs face disproportionately higher risks to both their earnings and health.
Risk is also disproportionately distributed among low-wage jobs. While 48 percent of jobs in the region pay less than $20 per hour, these jobs comprise 70 percent of jobs with the highest level of risk to both earnings and personal health. Often, Black, Indigenous, and people of color (BIPOC) are disproportionately employed in these low-wage jobs. Not only are BIPOC populations more likely to be employed in jobs with greater exposure to risks, but they are also earning less in those jobs.
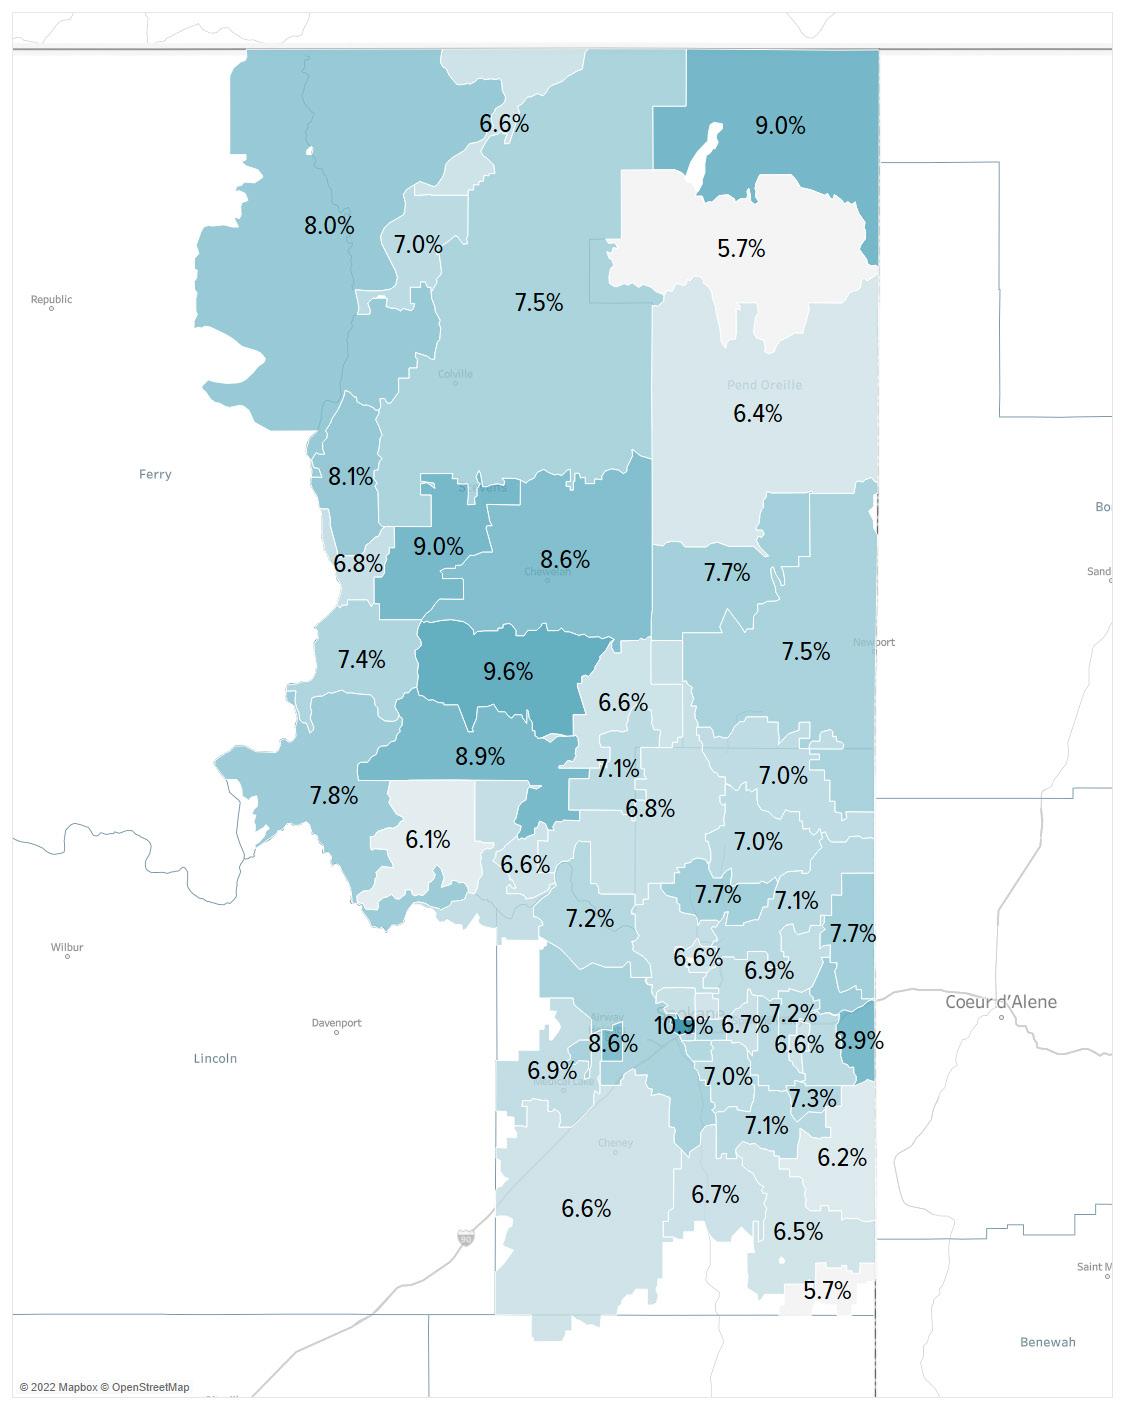
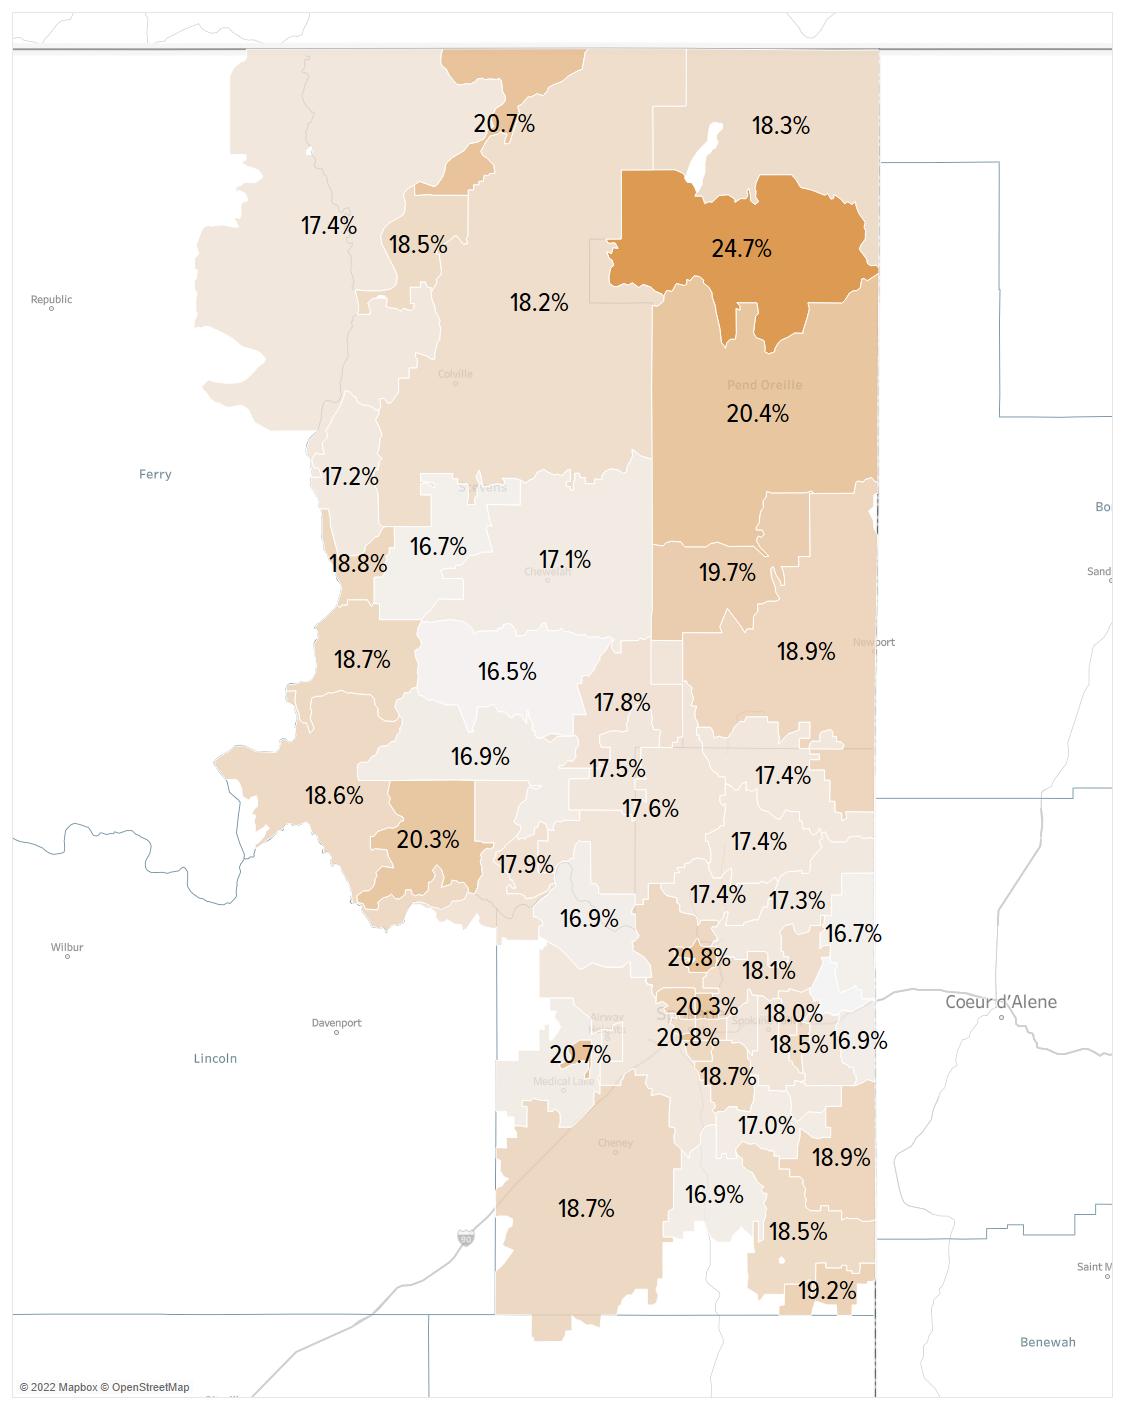
Risk is not evenly distributed throughout the region. An analysis of occupational risk by ZIP Code shows that some areas of the Spokane metro have higher shares of at-risk workers than other areas (see Figure 10, page 15). More than 20 percent of worker residents in the
northern reaches of Pend Oreille County, as well some areas on the north side of the City of Spokane, may experience high personal health and earnings risks, as these areas have relatively high concentrations of food service, sales, or administrative occupation workers. In contrast, downtown Spokane has the highest share of low-risk resident workers (10.9 percent) in the metro with a relatively large number of lower risk business and management occupations.
Sources: US Department of Labor Occupational Information Network (O*NET); ACS 2018 five-year sample via Integrated Public Use Microdata Series (IPUMS); Emsi 2021.2—QCEW Employees, Non-QCEW Employees, and SelfEmployed; Charles S. Gascon and Devin Werner. “COVID-19 and Unemployment Risk: State and MSA [metropolitan statistical area] Differences.” Federal Reserve Bank of St. Louis. (April 3, 2020); TIP Strategies, Inc. Notes: Only detailed occupations with more than 10 resident workers in the region are included. Unemployment is by occupation group (2-digit Standard Occupational Classification, SOC). Selected occupations’ “essential” and “salary” indicators have been modified from their initial designations by the Federal Reserve Bank of St. Louis.
HIGH RISK TO EARNINGS AND PERSONAL HEALTH
Share (percentage) of workers in their resident ZIP Code in occupation with high risk to earnings and high risk to health. Darker ZIP Codes have higher shares.
LOW RISK TO EARNINGS AND PERSONAL HEALTH
Share (percentage) of workers in their resident ZIP Code in occupation with low risk to earnings and low risk to health. Darker ZIP Codes have higher shares.
Sources: US Department of Labor
five-year
Employees, and Self-Employed; Gascon and Werner. “COVID-19 and Unemployment Risk”; TIP Strategies, Inc. Notes: Only ZIP Codes with at least
total resident workers and
other single-address
Codes are also excluded). Only detailed occupations with more than 10 resident workers in the region are included. In risk score calculations,
is used, and selected occupations’ “essential” and “salary” indicators have been modified from their initial designations by the Federal Reserve Bank of St. Louis.
by occupation group
Following an analysis of quantitative, qualitative, and strategic factors, six sectors were identified as target industries for business development. These six sectors not only have a strong presence in the Spokane region, but also throughout Washington State, in addition to demonstrating growth potential. Industries within the target sectors include both local and traded cluster businesses, as well as businesses of all sizes, from micro enterprises to the region’s largest employers. (See page 40 for a discussion of local and traded clusters.)
Occupations within the target clusters also tend to have higher-than-average wages, which offer opportunities to increase equity across the region by investing in skills-based workforce development. Cluster development efforts, including investments in workforce, supply chain development and local materials sourcing, and business growth and recruitment, are critical for future economic growth. Furthermore, the role of technology and innovation must be considered in industry development efforts, as they cut across all sectors. Strategies to fuel growth and investment are included in the CEDS. The full target sector analysis can be found in Appendix A.
With guidance from THRIVE Spokane Steering Committee members, intentional inclusivity was the focus of the plan’s community engagement process. The cornerstone for these activities was a series of roundtable discussions. The steering committee helped develop a targeted list of area experts and regional leaders to gather input on challenges and opportunities for the CEDS. Roundtables were organized by topic, including sector-focused discussions, as well as sessions centered on broad issues and programmatic areas. The roundtable discussions were supplemented with one-on-one interviews to solicit feedback on issues that did not surface in a collective setting.
While most roundtable discussions took place over 60 minutes, the importance of diversity, equity, and inclusion warranted a two-hour workshop that provided a space for a human-centered listening session and deepened relationships across the community. The workshop laid the foundation for stronger partnerships and created additional opportunities for BIPOC organizational leaders to shape key components of the CEDS, including the co-creation of strategies and actions specific to the needs of BIPOC business owners and communities. Although there is still work to be done to build trust throughout the community, this discussion was an important first step in that process.
Surveys also provided the public the opportunity to shape THRIVE Spokane without scheduling constraints. A community vision survey generated nearly 1,000 responses and input from a wide range of diverse voices. The success of this survey is due, in part, to a targeted digital campaign to reach underrepresented demographic groups and geographies. Survey responses were disaggregated to compare responses across different demographics and geographies, and insights from the data were used to craft the THRIVE Spokane vision statement.
Two other surveys targeted toward regional business leaders in the aerospace industry and the health and life sciences industry helped to gather industryspecific insights. With the growing importance of both industries in the region, these survey data were used to bolster THRIVE Spokane’s strategies around leveraging industry synergies and building a resilient supply chain.
A marketing campaign supported outreach for THRIVE Spokane and an associated media kit provided partners with logos, social media graphics, a press release, and several print articles. Greater Spokane Inc. also maintains a CEDS project website, thrivespokane.org, with background reports, presentations on the planning process, and information on ways to provide feedback.
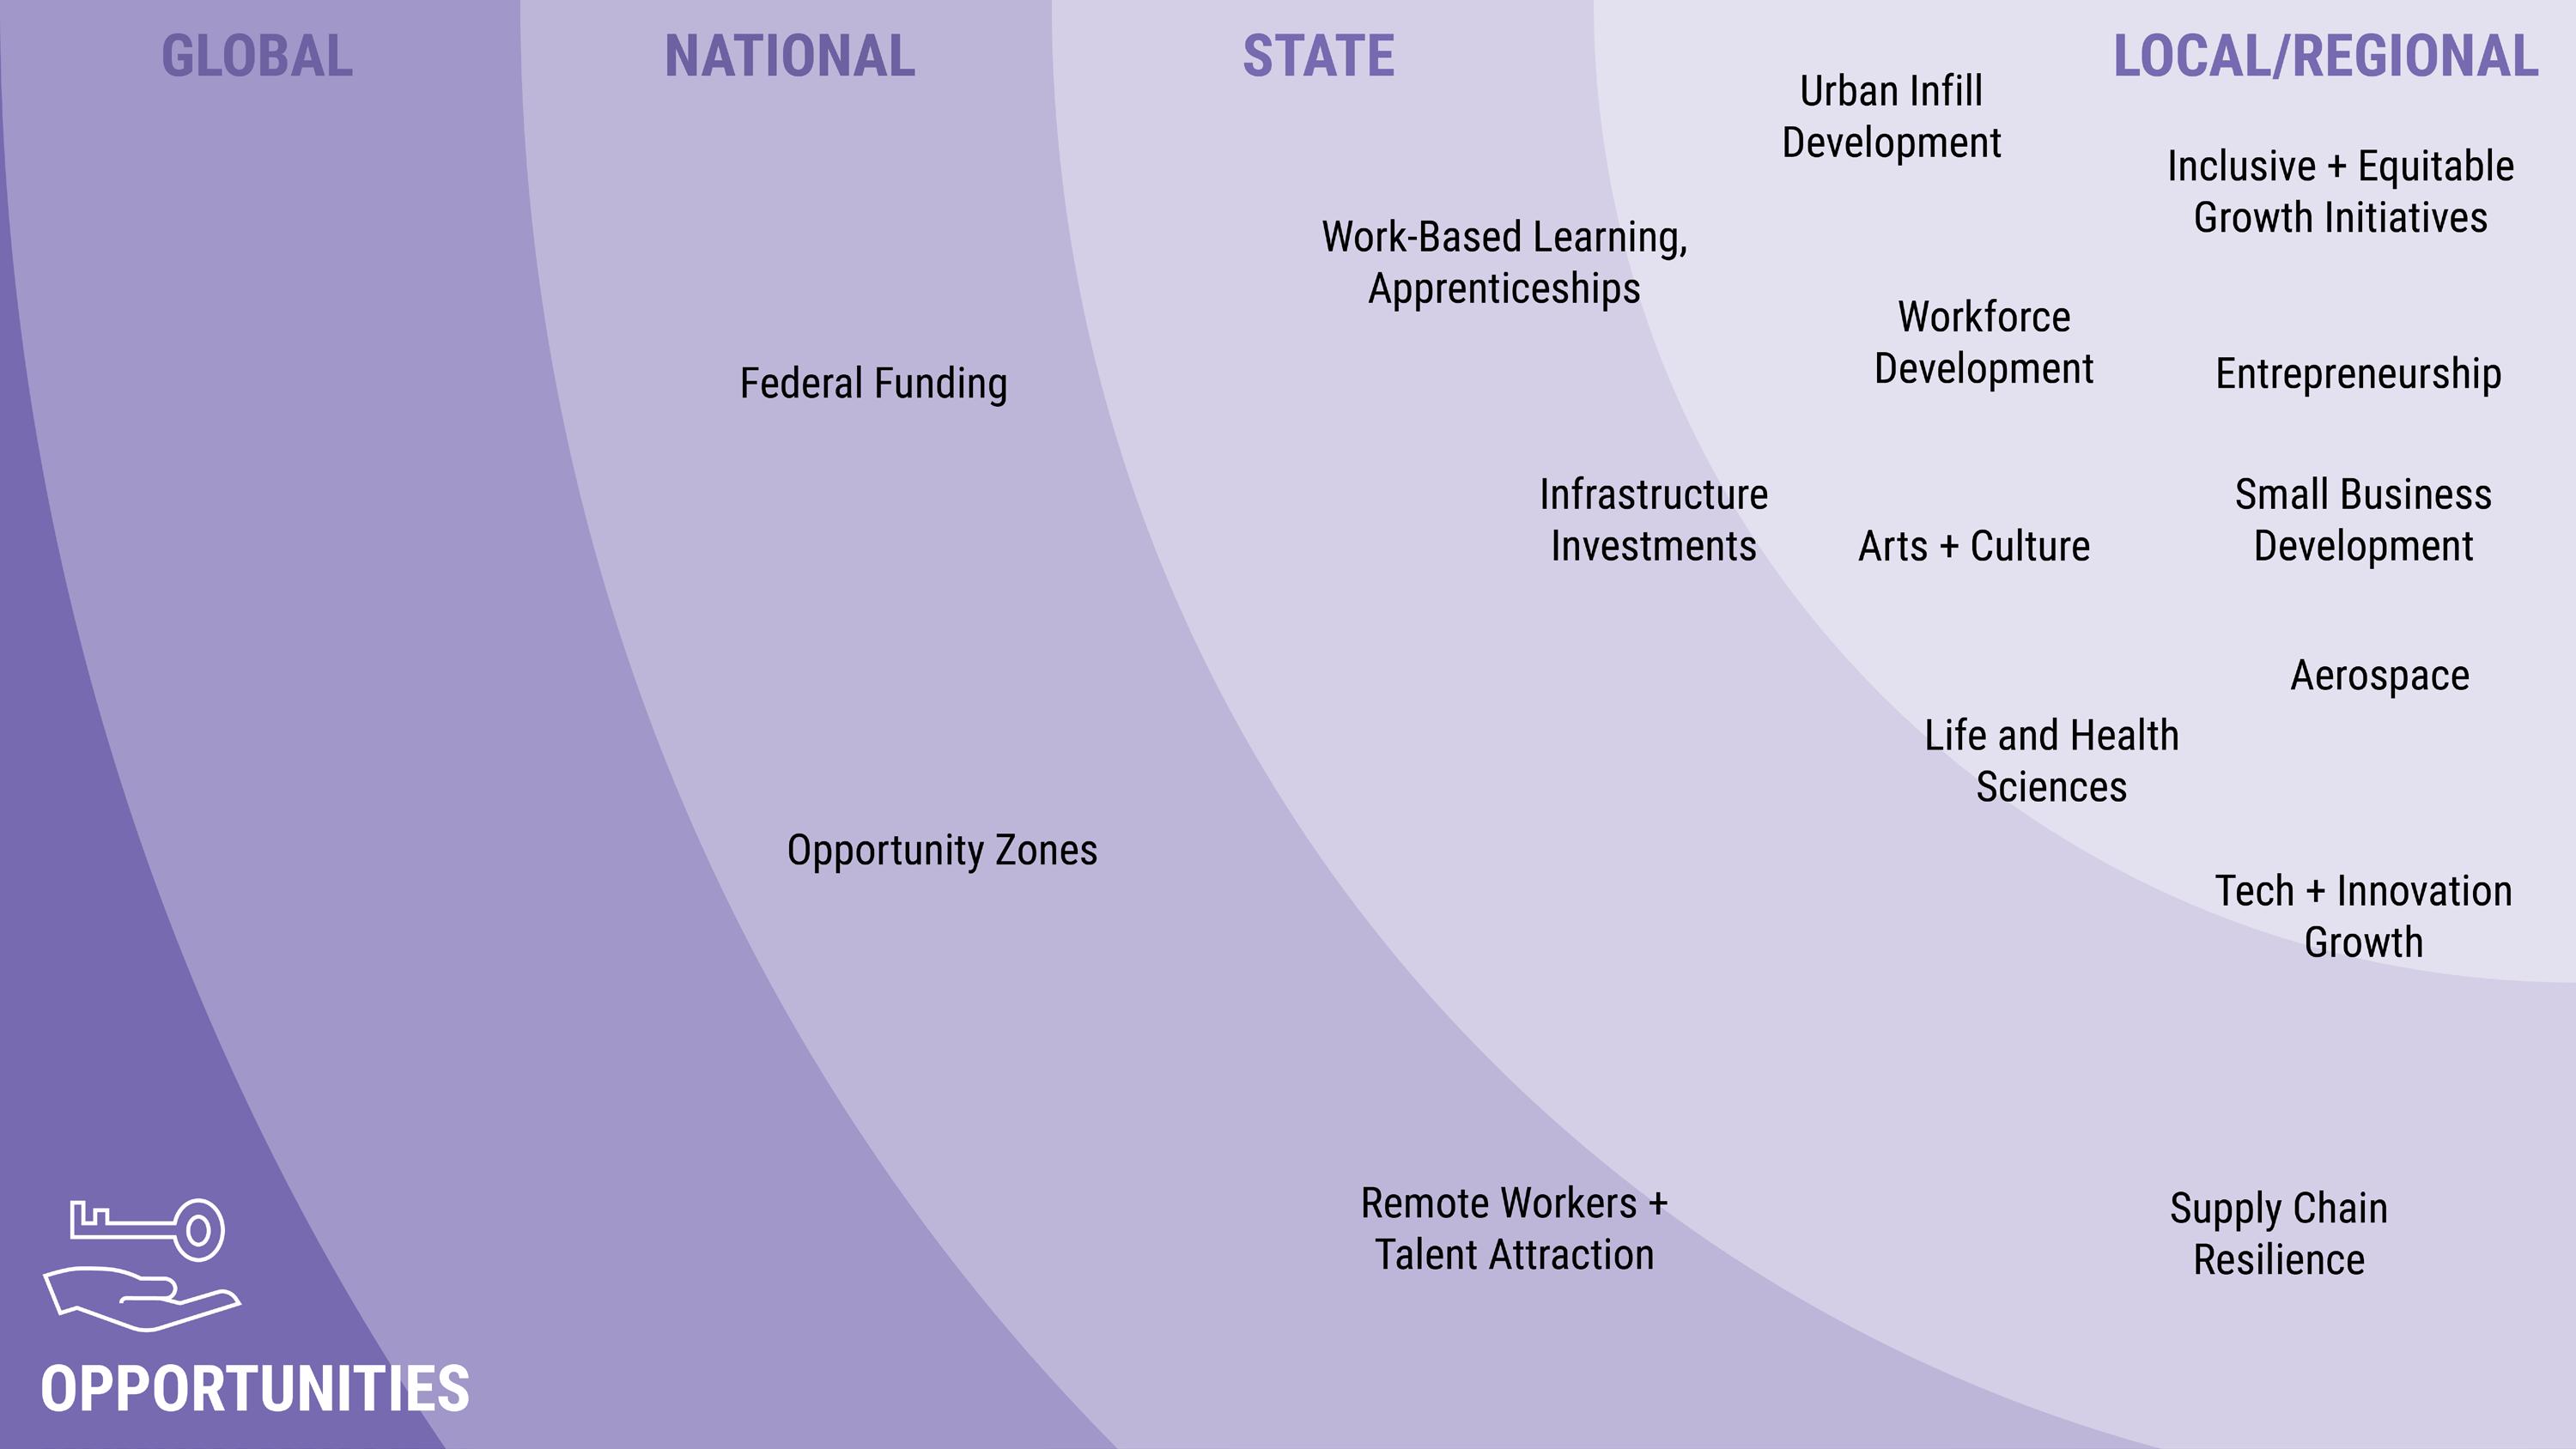
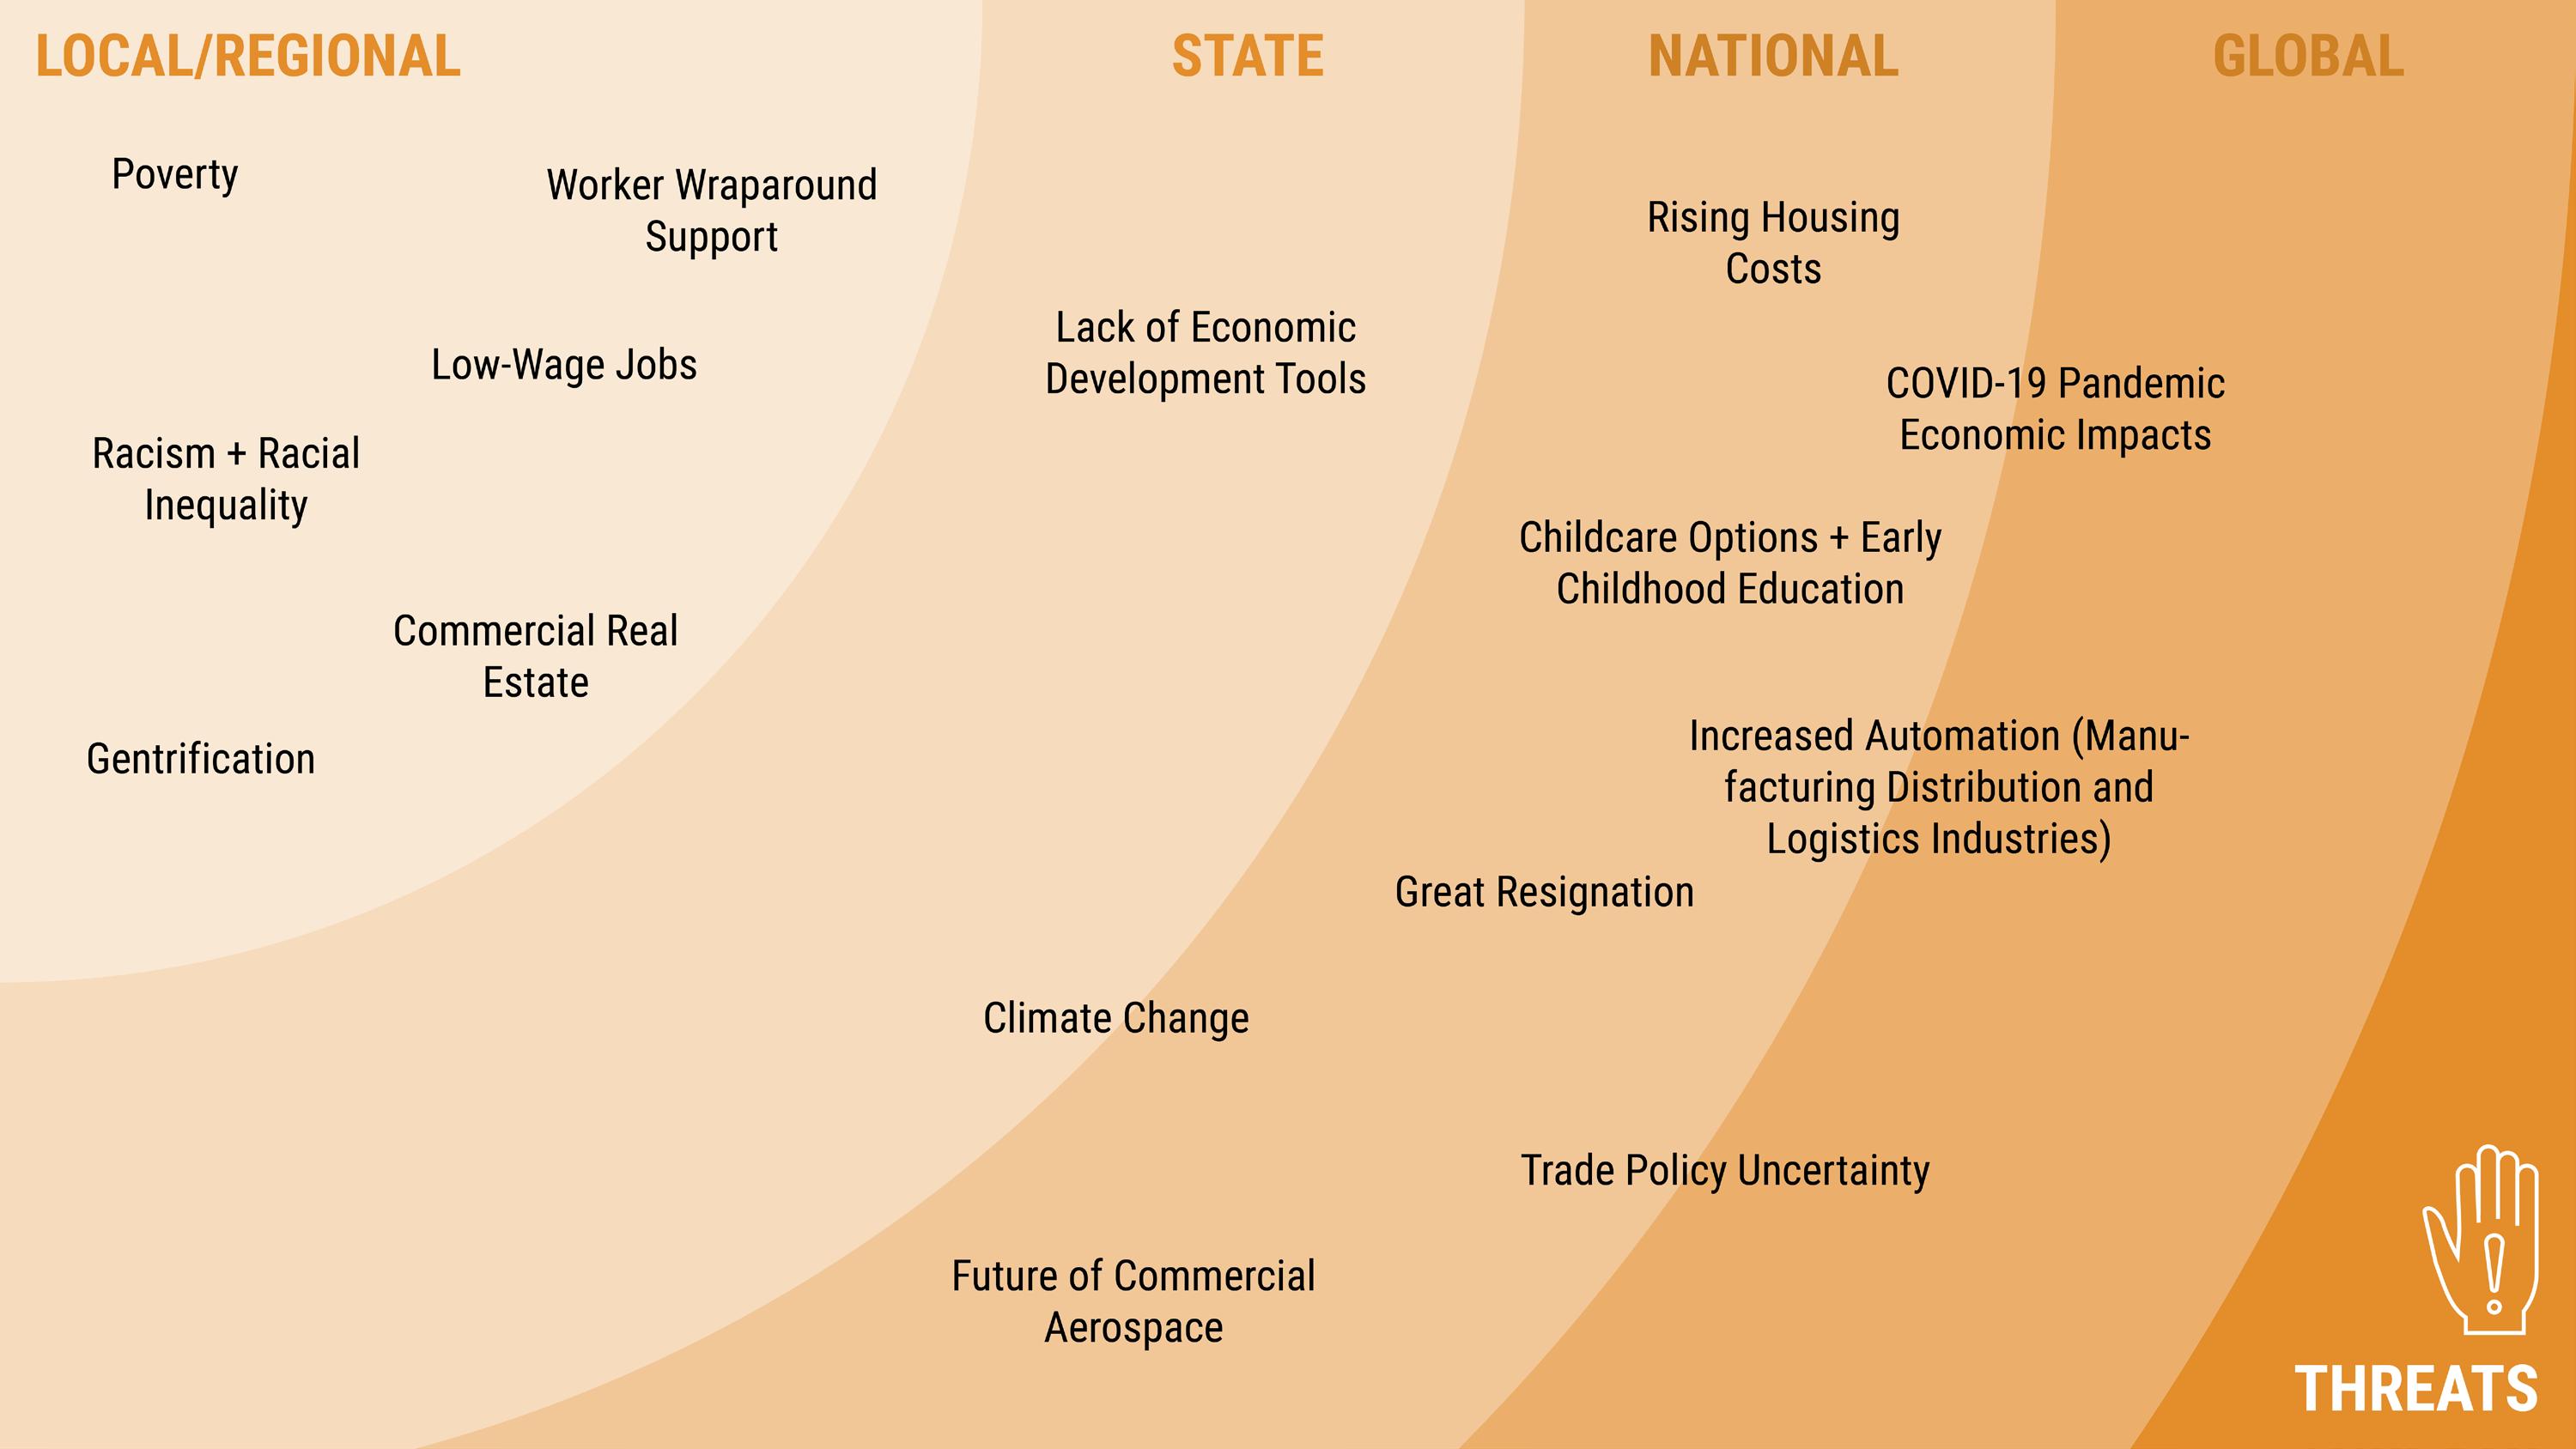
The SWOT Analysis is the culmination of both qualitative and quantitative research outlined in the previous sections. Building on these findings and observations, TIP conducted a more extensive review of Greater Spokane’s strengths, weaknesses, opportunities, and threats (SWOT). The SWOT Analysis summarizes the Spokane region’s competitive position and highlights factors that differentiate the area from the competition. The diagrams in Appendix B summarize the results of the analysis. Items closer to the center of the graph are more local in nature. Those at the outer corners are influenced by state, national, or global trends, placing them largely outside local leadership’s control (see Figure 12).

See Appendix B for detailed diagrams.
While it is important to be aware of national and global trends, many of which have been accelerated by the COVID-19 pandemic, the focus should be on maximizing the Spokane community’s strengths and opportunities. Nearly every strategy and action in the plan is supported by findings from this analysis.

 Image of Spokane cityscape at night by Nick Brommer courtesy of Visit Spokane

Greater Spokane’s economic prosperity is directly linked to its ability to avoid, withstand, and quickly recover from major disruptions to its economic base. Whether it be natural disasters or economic shocks like those experienced at the onset of the COVID-19 pandemic, the region can strengthen its recovery efforts and bolster its long-term resilience through responsive and steady-state initiatives. Responsive initiatives reinforce and expand a region's capacity to respond following a shock. They include activities like establishing strong communication channels to understand business needs after an incident. Conversely, steadystate initiatives, are long-term strategies to withstand or avoid a shock altogether. These initiatives include creating redundancies in broadband networks to protect commerce channels or enhancing job-driven training for skills that are easily transferable across occupations and industries. Through the CEDS process, the Spokane community identified resilience as a top priority. With a pool of available federal funds and emerging technologies, the region is in a prime position to address modernizing infrastructure as well as social inequities, each of which influence an area’s ability to recover from disruption. With this commitment, the Spokane region can work toward building a flexible workforce, supporting business needs, and hardening infrastructure, among other initiatives outlined in this section, all of which can position the Greater Spokane economy for resilient growth.
1.1 Support a resilient local workforce by improving job-driven skill sets and reducing barriers to employment (see Action 3.5.3).
1.1.1. Engage business associations to inform the workforce system of emerging hiring trends, to address skill and opportunity shortages, and prepare workers for high-growth, high-demand jobs of the future.
1.1.2. Work with the Spokane Workforce Council to expand skill training opportunities to focus on transferable workforce skills so that workers can better shift between jobs or industries.
Example: In Clark County, Washington, the region’s associate development organization, the Columbia River Economic Development Council (CREDC), and Workforce Southwest Washington (WSW) are closely aligned partners. In addition to being co-located in one office, staff from both organizations come together for an annual retreat to develop cohesive strategic work plans. Joint business visits are also conducted for nearly every business recruitment and expansion meeting. Furthermore, the executive director of WSW has a permanent board seat on CREDC’s board and vis-à-vis. WSW is also a top-level investor in CREDC.

1.1.3. Expand wraparound investments to reduce barriers to employment, such as efficient routes to connect workers to employment centers, development of a diverse set of attainable housing options, broadband expansion to help remote workers complete their work effectively, or business support for early learning programs to extend childcare hours.
1.2 Focus on upstream opportunities to build a responsive and resilient supply chain to support the region’s target sectors.
1.2.1. Identify opportunities to nearshore or localize suppliers to shorten supply chains and reduce risk (see Action 2.3.2).
1.2.2. Coordinate local supply chain networking events to connect manufacturers, including raw materials suppliers, across the region. Ensure BIPOC businesses have the support and resources needed to attend these events (see Strategy 3.2 and Action 3.7.3).
1.3 Invest in the development of downtowns and commercial centers throughout Spokane County through small business support, residential expansion, and storefront revitalization.
1.3.1. Support the modernization and increase the competitiveness of aging downtown commercial buildings, especially in historically underserved areas.
1.3.2. Identify municipal/County-controlled land in downtown and urban areas for residential housing and in-fill opportunities.
• Pursue the redevelopment of large surface parking lots with mixed-income, mixed-use developments (see Strategy 3.1).
1.3.3. Prioritize downtown investments and revitalization efforts that support local businesses, including basic infrastructure and nonmotorized transportation routes (see Strategy 4.1).
1.4 Establish strong communication channels to understand business community needs and to promote business continuity and preparedness.
1.4.1. Leverage the region’s business support organization network to establish a process for regular communication with businesses to understand their priority issues and needs.
Location: Fort Collins, Colorado
In response to the drastic decline of tourism activity due to the COVID-19 pandemic, Visit Fort Collins (VFC), the city’s official destination marketer, created Rebuilding For Resiliency: A Path Forward for Visit Fort Collins, a strategic recovery plan. The plan’s recovery strategies fall into four main categories: securing competitive funding, refocusing its marketing campaign on leisure activities and youth sports, developing community connections, and leveraging brand promise. Each strategy defines the recovery challenge, response action, task timing, and necessary community partners to ensure a quick return to pre-pandemic growth trajectories while also contributing to the city’s overall recovery and economy. Through the report’s implementation, a tourism improvement district (TID) was created to fund marketing and sales support for hotels within the district through the addition of a lodging tax. The new fee is projected to raise $800,000 a year, in addition to lodging tax revenue. The city is paid 2 percent of the revenue each year for collecting the fee, while VFC receives 70 percent. The remaining funds are directed toward the city’s Fort Fund arts and culture grants.

1.4.2. Host workshops to ensure that businesses understand their vulnerabilities in the face of disruptions.
1.4.3. Provide tools to help businesses overcome their vulnerabilities and to ensure they have processes in place, such as succession planning, e-commerce sales expansion, continuity plans, and digital literacy, to continue critical operations in the event of an unplanned disruption or disaster (see Action 3.6.2).
1.5 Promote technology resilience by ensuring redundancy in telecommunications and networks.
1.5.1. Coordinate with telecommunications providers to resolve weak service zones to ensure residents can easily access information and resources (see Action 3.6.1).
1.5.2. Work with municipalities to expand redundancies to ensure there are no single points of failure and to protect public safety in the event of natural or human-influenced disasters.
1.5.3. Encourage rapid deployment of telecommunications and network lines across Spokane County, especially in major employment areas and commercial corridors (see Action 4.1.1).
1.6 Address climate resilience by modernizing infrastructure systems to withstand disruption, improve efficiency, and enhance connectivity.
1.6.1. Launch a feasibility study for hardening infrastructure systems most vulnerable to changes in climate and weather patterns, such as wildfires, severe storms, and flooding.
• Apply community wealth building initiatives to ensure neighborhoods with limited resources have equal access to system modernization and improvements.

1.6.2. Support existing work to bury electric lines to mitigate potential impacts of severe weather events.
1.6.3. Continue to invest in and expand sustainable infrastructure, such as permeable pavement and flow-through planters, to mitigate stormwater impacts on sewer systems.
6. Johanna Bozuwa. “Building Resiliency through Green Infrastructure: A Community Wealth Building Approach.” Democracy Collaborative. (February 28, 2019).
Position the Greater Spokane region as a strong competitor to attract talent, capital, and resources for strategic economic development.

Strategies and actions under the guiding principle of competitiveness revolve around fundamental economic development activities. These activities aim to generate investment, create employment opportunities, and spur wealth creation in Greater Spokane by positioning the region as a strong competitor in the attraction of talent, capital, and resources. Building a more robust business retention and expansion (BRE) program, encouraging targeted real estate development, and launching marketing campaigns form the foundation for success. As a major business hub for the Inland Northwest, the Spokane region can benefit from local industry synergies. Targeting real estate development in priority areas will help the region implement equitable growth initiatives, uplifting long-neglected communities and expanding housing supply to maintain a relatively low cost of living. Meanwhile, launching high-impact external marketing campaigns that highlight the region’s quality-of-life amenities can help attract tourists and talent. Through regional collaboration and coordination, community leaders can pursue strategic economic development opportunities that embrace the region’s competitive advantages and continue to grow a thriving local economy.
2.1 Pursue innovative financing options, like external funding opportunities (philanthropic, state, federal), for economic and community development projects.
2.1.1. Form an Economic Development District through the US Economic Development Administration to access more funding opportunities and technical assistance.
• Convene regularly to address regional issues, track metrics, and benchmark peer communities.
• Monitor the economic dashboard for early warning signs then proactively address potential disruptions and economic challenges.
2.1.2. Expand the use of financing options, including research-anddevelopment tax credits, new market tax credits, and opportunity zones, to attract investment.
• Ensure projects leveraging federal incentive programs align with neighborhood needs (see Strategy 3.3) and minimize the displacement of communities.
2.1.3. Create and maintain a database to gather all funding opportunities in one place and work with economic development partners to apply for and use external funding more effectively.
• Host workshops to educate community leaders, decisionmakers, elected officials, and the media about external funding opportunities and how they work.
• Leverage tools such as GrantStation to develop the database.
2.2 Position the region for equitable real estate development, including the development of commercial and industrial space to meet business needs as well as the development of a diverse housing stock to meet the needs of a growing population (see Action 3.3.2).
2.2.1. Ensure the region has adequate commercial and industrial developments, particularly Class B office space, to support business retention, expansion, and attraction efforts.
• Market Advantage Spokane’s Real Estate Opportunities to ensure that businesses are fully aware of available real estate space in the region.
• Support the development of flexible spaces that accommodate growing startups (see Strategy 4.2).
2.2.2. Launch a land banking project to identify and assemble industrial redevelopment opportunities in underserved areas, including brownfield and greyfield sites.
2.2.3. Invest in mixed-use projects and smaller-scale projects that bring new urban housing, retail sites, restaurant space, and entertainment space (see Strategy 4.3).
2.2.4. Expand and preserve a full range of housing options (owner and rental, using local housing action plans as a baseline) (see Action 3.3.3).
• Ensure public and private sector coordination, including the City of Spokane and Spokane County’s public development authorities (PDAs).
• Target new housing developments in areas that can easily connect low-income workers with growing employment centers throughout the region.
• Explore zoning policy changes to ease processes and reduce barriers to housing development.

2.2.5. Evaluate community land trusts and community investment funds as an innovative mechanism for long-term housing affordability.
2.2.6. Leverage state and federal funds to implement strategies in local housing action plans.
2.2.7. Promote the region’s identity and high quality of life to support tourism, business attraction, and talent attraction and retention.
2.2.8. Partner with Visit Spokane and municipalities on marketing campaigns to raise the region’s profile and assist with business and talent attraction.
2.2.9. Update talent recruitment and retention tools regularly, including materials and programming, that build on the strong presence of the local higher education institutions.
• Target young professionals, high-demand occupations, and remote workers to build the region’s talent base.
Imagine Pittsburgh Location: Pittsburgh, Pennsylvania
More Information: Pittsburgh Passport
Approximately 10 years ago, Pittsburgh, Pennsylvania, realized it had a talent problem. Carnegie Mellon University was educating some of the most talented and innovative engineering students in the country, but after graduation, they were leaving in droves for jobs on the East and West Coasts. Community leaders collaborated and identified three key factors. The first was that students did not feel they had any connections to the city. Some never even left campus during their school tenure. The other two factors were the city’s lack of vibrancy and density of innovative jobs to keep graduates. Out of these findings, Imagine Pittsburgh was born, with the primary goal to better integrate students into the local community. After nearly 10 years and investments in quality of place, Pittsburgh has increased student retention and is recognized as a leading innovation hub. Imagine Pittsburgh has continued to evolve, including the addition of the Pittsburgh Passport Summer Internship Series in 2019. The Passport Series offers a wide range of programs, from social events to industry tours, designed to connect students to the city outside of working hours. In today’s competitive talent landscape, the extent to which a region can retain higher-ed graduates is a top consideration for decision-makers when evaluating corporate expansions or relocations.

2.3
Strengthen existing business growth and retention programs and bolster business recruitment efforts, especially around target sectors.
2.3.1. Invite regional workforce development specialists on business retention and expansion (BRE) visits where workforce availability is likely to be a major issue.
2.3.2. Include questions about existing business vendors and suppliers during BRE visits and events to uncover supply chain recruitment opportunities (see Action 1.2.1).
2.3.3. Set a goal of attracting a major anchor institution to support target sectors.
2.4 Engage the Fairchild Air Force Base in regional economic development initiatives that leverage the Spokane region’s aerospace and defense assets.
2.4.1. Continue Forward Fairchild’s work to maintain strong business relationships with the base and to integrate military leaders into the Spokane community.
2.4.2. Connect military personnel separating from service in the region with local aerospace employers.
2.5 Fortify the region’s health and life sciences industry by enhancing sectorspecific workforce development initiatives and business services.
2.5.1. Work with medical education institutions and healthcare systems to increase medical residency positions to retain top health and life sciences talent within the region.
2.5.2. Support Evergreen Bioscience Innovation Cluster’s work to attract health and life sciences entrepreneurs and companies by strengthening the ecosystem of the sector’s business support in the region.
2.5.3. Attract research-and-development investments to support university and college researchers and innovators in life sciences.
2.5.4. Deploy strategies to upskill workers within the health and life sciences industry, as well as build awareness of career opportunities in the sector (see Strategy 3.5).
2.5.5. Encourage career exploration programs for PreK-12 students, especially in science, technology, engineering, and mathematics (STEM) industries (see Action 3.4.1).
Seek to understand, address, and dismantle outcome disparity through intentional initiatives that include all Spokane residents in the benefits of economic growth and prosperity.
Certain geographies in Spokane County have been largely overlooked for major development projects for too long. These areas have been inequitably perceived as ill-suited for real estate investment and business development, in part because of missing critical infrastructure. Meanwhile, certain populations within Spokane have experienced systematic exclusion from full participation in many aspects of economic prosperity. This reality must change if the Spokane region wants to achieve its goal of maintaining diversity, equity, and inclusion (DEI) as core values. All regional economic development initiatives must include a racial justice outcomes analysis so that equity efforts in the Spokane economy are not siloed or sidelined alongside traditional economic development activities. Prioritizing funding for equitable growth initiatives until racial and other social disparities are no longer significantly measurable in the market is essential to change the unequal opportunity landscape. Equitable economic growth should be considered as both a process and an outcome. It is a process in that initiatives, programs, and policies must be developed and delivered by impacted communities to ensure inclusive community engagement that centers diverse experiences and reduces historic and existing barriers to full participation in the local, regional, national, and global economy. Equitable growth becomes an outcome once a person’s identity or identities no longer impacts their ability to experience the benefits of economic growth or prosperity. By making intentional investments and prioritizing resources for underserved geographies and populations, the region can collectively work toward implementing equitable growth initiatives that preserve and advance economic opportunity for all Spokane residents.
3.1 Prioritize sustainable funding for coalitions, including the Business Equity Coalition of the Inland Northwest and the Multi-Ethnic Development Council, that are accountable to the communities they serve in addressing DEI issues, building trust, creating strong communication channels, and fostering collaboration across Spokane County (see Action 1.3.2 and Strategy 4.4).
3.1.1. Convene human resource professionals on a regular basis to understand barriers and opportunities to drive equity in the private sector.
• Encourage employers to revisit their human resource processes to promote more inclusive and equitable hiring practices. Activities to consider include studying the current skills and experiences listed on job postings and removing unnecessary requirements and connecting businesses with tools and resources to develop earnand-learn models (such as pre-apprenticeships, apprenticeships, on-the-job training, incumbent worker training, and internships).
• Identify metrics to evaluate business equity in Spokane County.
 Image of Black London in the Browne's Addition Neighborhood, courtesy of the Live Local INW Coalition
3.1.2. Deploy resources for community organizations on topics such as decolonization and antiracism, consensus building, and government relations.
Example: The Future Ground Network began as a pilot program in Ontario and Quebec, Canada, to convene and mentor the nonprofit environmental community. The online resource hub provides monthly trainings and toolkits on topics ranging from the Land Back movement (returning Native lands back to Indigenous populations) to campaign strategizing and grant writing, for community service providers. In 2021, the program expanded across Canada and now serves over 3,000 members and 150 organizations.
3.2 Devote resources to and build capacity of an ecosystem of support by and for BIPOC business owners, including community development financial institutions (CDFIs) and early stage business funding (see Action 1.2.2).
3.2.1. Elevate the region’s buy local campaigns, such as Live Local INW, to support locally owned BIPOC and small businesses.

3.2.2. Convene financial lending organizations (banks, CDFIs, credit unions) to improve collaboration on loans and long-term, flexible financing options available to BIPOC business owners.
• Explore alternate funding tools, like co-ops, to provide BIPOC business owners with other forms of innovative financing.
3.2.3. Support Indigenous businesses and Tribes seeking funding opportunities for community and business investment.
3.3 Drive equitable economic and workforce development by targeting investments and resources in communities and populations that need them most (see Action 2.1.2).
3.3.1. Incorporate community benefit agreements for companies recruited to Spokane and for new public and private projects developed by regional corporations and institutions.
• Draft these agreements in a manner that gives preference to contracting with firms that are locally owned, those which have a diverse ownership and workforce, in addition to those which utilize apprenticeship programs.
3.3.2. Reduce barriers to public-private development projects in priority areas to attract additional investment, promote real estate development by community-based entities, and job growth from locally owned businesses, while pursuing policies and processes to stabilize communities and mitigate gentrification (see Strategy 2.2).
• Create community-based financing mechanisms that provide business and real estate ownership opportunities for more community members.
• Explore vacancy taxes for undeveloped land and parking lots to reduce displacement pressure in historically underinvested areas.
3.3.3. Recruit and fund housing industry innovators to lead the rapid development of more privately owned, permanently affordable housing, such as apartment cooperatives, conversion of mobile and/or manufactured home parks to resident-managed nonprofit associations, development of multiple limited-equity microvillage infill developments, and cohousing communities in a variety of formats (see Action 2.2.4).
• Plan for the protection and incremental expansion of transportationoriented business districts by increasing allowable housing and commercial densities in these areas (see Strategy 4.1).
3.4
Strengthen STEM education and culturally competent and trauma-informed programs in PreK-12 schools in the Spokane region.
3.4.1. Support Spokane STEM’s existing work to enhance STEM education opportunities for all youth in the region by increasing the number of students pursuing and achieving success in STEM careers through collaboration with business, early learning, PreK-12, higher education, and community leaders (see Action 2.5.5).
• Elevate the Innovia Foundation’s promise scholarship initiative to ensure that every child has opportunity and access to their career or college of choice.
3.5
Strengthen the regional talent pipeline by aligning efforts with current and future workforce needs and by ensuring that economic opportunity is equally accessible to all residents regardless of race, ethnicity, gender, sexual orientation, or other identity (see Action 2.5.4).
Location: Greenville, South Carolina

More Information: Racial Equity Index
Building on the momentum of the nationwide social justice movements in the summer of 2020, the Greenville Racial Equity and Economic Mobility Commission (REEM) was created to identify and address systemic racial barriers in Greenville County, South Carolina. REEM is headed by United Way of Greenville County (UWGC), the Greenville Chamber of Commerce, and the Urban League of the Upstate. To better understand the role of race in economic mobility, UWGC released the Greenville County Racial Equity Index in June 2020. Through collaborative partnerships with local community and economic development professionals and institutions, REEM has identified five focus areas: income and wealth, criminal justice, education and workforce development, health and wellness, and communitywide learning. Each area has a corresponding subcommittee staffed by community and business leaders, totaling more than 30 people. REEM is working on a community engagement strategy (informed by focus groups, surveys, and community dialogs) that will provide action-oriented recommendations for each focus area to be carried out by the appropriate subcommittee. One policy change that has already come out of the Criminal Justice Committee is the duty-to-intervene obligation for police officers who witness colleagues using excessive force. Additionally, the police force will provide implicit bias training for all officers.
3.5.1. Focus efforts on underserved and at-risk youth by coordinating efforts with nontraditional economic development organizations and connecting opportunity youth to programs and resources like those offered through Next Generation Zone and Legacy Learners LLC.
3.5.2. Expand career exploration activities connecting students and adults to job opportunities in the region.
• Continue to sponsor and amplify outreach about career fairs and hiring events.
3.5.3. Uplift BIPOC workers by connecting them with clear career pathways that offer workers earn-and-learn initiatives, like stipends, paid work experience, internships, or on-the-job training (see Strategy 1.1).
3.5.4. Invest resources and capacity into programs that expand reentry pathways to employment and reintegration of formerly incarcerated individuals, while reducing system entry and recidivism by fully implementing proven criminal justice system reforms.
3.5.5. Support organizations, such as the Resource Center of Spokane County, that address barriers to employment, including childcare and mental health (see Action 4.5.3).
3.6
Prioritize digital equity initiatives by ensuring equal access to broadband and supporting digital literacy programs for underserved communities and businesses in both rural and urban communities throughout Spokane County.
3.6.1. Target broadband expansion efforts in neighborhoods with weak service zones (see Action 1.5.1) and support publicly owned infrastructure.
3.6.2. Support digital literacy programs in low-income communities by improving access to broadband-ready devices and services for residents and businesses (see Action 1.4.3), with an emphasis on programs led by members of those populations and communities.
3.7 Expand public contracting opportunities for BIPOC owned businesses, including support and mentorship programs to alleviate procedural barriers.

3.7.1. Conduct disparity studies to better understand existing public procurement and contract awards by demographic characteristics and increase diversity.
• Use findings from the disparity study as a baseline metric.
• Ensure transparent reporting and metric development to track progress.
3.7.2. Support existing business groups geared toward BIPOC business owners to create a framework for a mentorship program to assist businesses pursuing public contracts.
3.7.3. Promote and adopt practices around procurement localization and diversification, including unbundling contracts and the development of a diverse/small business supplier database (see Action 1.2.2).
Promote the interconnectedness of Greater Spokane and drive cross-sector partnerships to align efforts that advance economic opportunity for all.

The fourth goal area for the CEDS is centered around the concept of connectivity, a concept that encompasses investments needed to grow the region’s creative economy, improve communication channels, and support physical infrastructure development. This goal area also lays the groundwork to support other aspects of economic development, including fostering resilient economic growth and developing a strong quality of place. In order to grow the region’s creative economy, enhanced alignment is needed between Greater Spokane’s public and private sector programs, organizations, and nontraditional economic development partners to improve synergies and address the region’s most pressing issues. Furthermore, the goal of connectivity extends beyond traditional infrastructure investments, like transportation improvements, to include broadband expansion that can support innovation and investments in early childhood education to support working parents. As the lines between economic development and community development blur, enhancing regional infrastructure will be essential to connect people and businesses to the tools they need to thrive. To amplify the collective impact of regional partners, the opportunity remains to break down silos and work collaboratively to align efforts that advance economic opportunity for all Spokane residents.
4.1 Identify and prioritize infrastructure investments and projects to enhance existing developments and stimulate new projects, especially in underserved and rural communities (see Actions 1.3.3 and 3.3.3).
4.1.1. Facilitate the rapid deployment of telecommunications and broadband networks in growing commercial centers to meet business needs, including small industrial parks (see Action 1.5.3).
4.1.2. Install necessary utility structures in growing commercial centers, such as the West Plains Regional Airport area, the Hillyard neighborhood, and Spokane Valley’s Northeast Industrial Area.
4.1.3. Focus “complete streets” investments, including sidewalks and street lighting, in historically underserved areas and downtowns (see Action 4.3.1).
4.1.4. Prioritize transit-oriented development, including nonmotorized routes, to connect residential and commercial areas.
4.2 Bolster and continue to align the network of entrepreneurial support organizations and resources (see Action 2.2.1).
Image of Kendall Yards Night Market by Libby Kamrowski courtesy of Visit Spokane4.2.1. Annually update the GSI StartUp Spokane’s Knowledge Network, an asset map of entrepreneurial support resources, and make it publicly available.
4.2.2. Support youth entrepreneurship programs to help Spokane’s young residents cultivate an entrepreneurial spirit, building a community culture of innovation.
4.2.3. Grow the region’s creative economy by deepening ties among the public sector, education, and the private sector.
4.3 Create vibrant and inclusive communities by investing in the resources needed to activate public spaces, support arts and culture, and expand outdoor recreation opportunities for all (see Action 2.2.3).
4.3.1. Invest in the infrastructure needed to stimulate public spaces, such as Wi-Fi and sidewalks (see Action 4.1.3).
4.3.2. Identify park and green space development opportunities, including bike paths and hiking trails, to increase the percentage of residents in the region who live within a 10-minute walk to a public space.
• Increase public green spaces that connect retail sites with surrounding sites along major commercial corridors and adjacent neighborhoods.
4.3.3. Encourage and promote public outdoor events, such as art shows or farmers’ markets, that draw people to downtowns and commercial districts.
4.4 Develop and implement a method to proactively involve community-based organizations to provide input on economic development initiatives, to improve access to other community leaders, and to initiate continuous improvement of the THRIVE Spokane CEDS (see Strategy 3.1).
4.4.1. Host biannual community connections to provide a time and space for community-based organizational leaders to meet with economic development partners, share common pain points, and identify collaborative solutions.
Location: Providence, Rhode Island

More Information: The Providence Foundation
The Providence Foundation (PF) was established as a nonprofit in the mid1970s to promote economic development in downtown Providence, Rhode Island, through policy advocacy, land use development and management, community and stakeholder engagement, and business attraction and recruitment. The foundation values diversity and represents the interests of businesses, property owners, residents, and nonprofit institutions in the area. Additionally, PF recognizes downtown Providence’s outsized and integral role in the state’s larger economy but does not limit development activities to only the downtown area. To further its mission, PF created the Downtown Providence Parks Conservancy (DPPC) as an operating division that seeks to preserve and develop the city’s historic downtown through the creation and use of public spaces. The foundation’s executive director is obligated to serve simultaneously as the executive director of DPPC. PF is an active partner in supporting Providence’s nascent innovation district and marketing downtown businesses and cultural programming through a partnership with the Downtown Improvement District. Altogether, PF leverages public-private partnerships to diversify funding sources for redevelopment initiatives that foster robust economic ecosystems.
4.5
Invest in high quality childcare through public-private partnerships to support Spokane’s working parents and ensure the region’s youngest members are school ready.
4.5.1. Establish a fund by private businesses that invests in childcare service networks to support their employees.
4.5.2. Expand business resources geared toward local small businesses in the childcare and early education industry. These resources can include customized business training and mentorship to improve quality, along with materials to strengthen the talent pipeline for early learning educators.
4.5.3. Identify childcare deserts,7 especially in high poverty areas, to target areas with the most critical needs (see Action 3.5.5).
4.6
Prioritize investment in multimodal and intermodal transportation and freight mobility systems infrastructure to maximize connectivity and capability that supports growth of the Spokane regional economy.

4.6.1. Support and advocate for increased investments in modal connectivity to increase capacity, efficiency, and optionality for the movement of goods and people.
4.6.2. Continue to advocate for new and increased investments in regional transportation infrastructure that supports business growth with a focus on target sectors to stimulate job growth, such as facilities at Spokane International Airport to accommodate growth in passenger and cargo activity.
4.6.3. Advocate for transportation investments that support and enhance the efficient movement of the workforce for improved access to education, training, and employment centers.
4.6.4. Develop a unified transportation priority list that advances projects based on readiness for construction through the area’s designated transportation planning organization, the Spokane Regional Transportation Council, to maximize funding opportunities for maintaining, improving, and expanding the regional transportation system.

While benefiting from a diverse industry base, the Spokane economy can take advantage of a select group of target sectors that have a strong presence in the region. Spokane’s target industries closely mirror those of Washington State, shedding light on how important Spokane’s economy is to the state. Businesses that comprise Spokane County’s target sectors range from microenterprises with just a few employees to the region’s largest employers. Traded sector businesses—enterprises where most of the goods and services are sold outside of the region—tend to make up the majority of companies in the clusters. However, local businesses, especially in the healthcare sector, may also be encompassed in the target sectors. Successful industry clusters must include more than a high concentration of businesses. Strong workforce training, entrepreneurial support, and robust infrastructure systems are essential to cultivate target sector growth. Furthermore, deep ties between clusters, such as those found between agribusiness and life sciences or aerospace and manufacturing, will also strengthen clusters.
The area has a long history supporting agribusiness and can continue that momentum by expanding agricultural exports and food manufacturing, as well as the growing local food movement. Meanwhile, the COVID-19 pandemic exposed an accelerating need to strengthen certain sectors, like energy infrastructure and technology and logistics, to limit supply chain risks and fortify an interconnected economy.
Fostering growth in the health and life sciences by building on the strong foundation provided by the region’s higher educational institutions, the central University District, and local healthcare industry, will continue to advance the economy. Additionally, the region’s robust aerospace and aviation assets find close alignment with the manufacturing and materials sector. Combined, these target industries capitalize on the region’s creative talent pool to drive innovative growth.
The six sectors identified by this analysis demonstrate significant future potential to generate new investment. Focusing business development efforts within these sectors, and across sectors, will continue to build on the region’s successful companies, innovative talent, and high quality of place to support equitable economic growth.
Image of University District Gateway Bridge by Libby Kamrowski courtesy of Visit Spokane
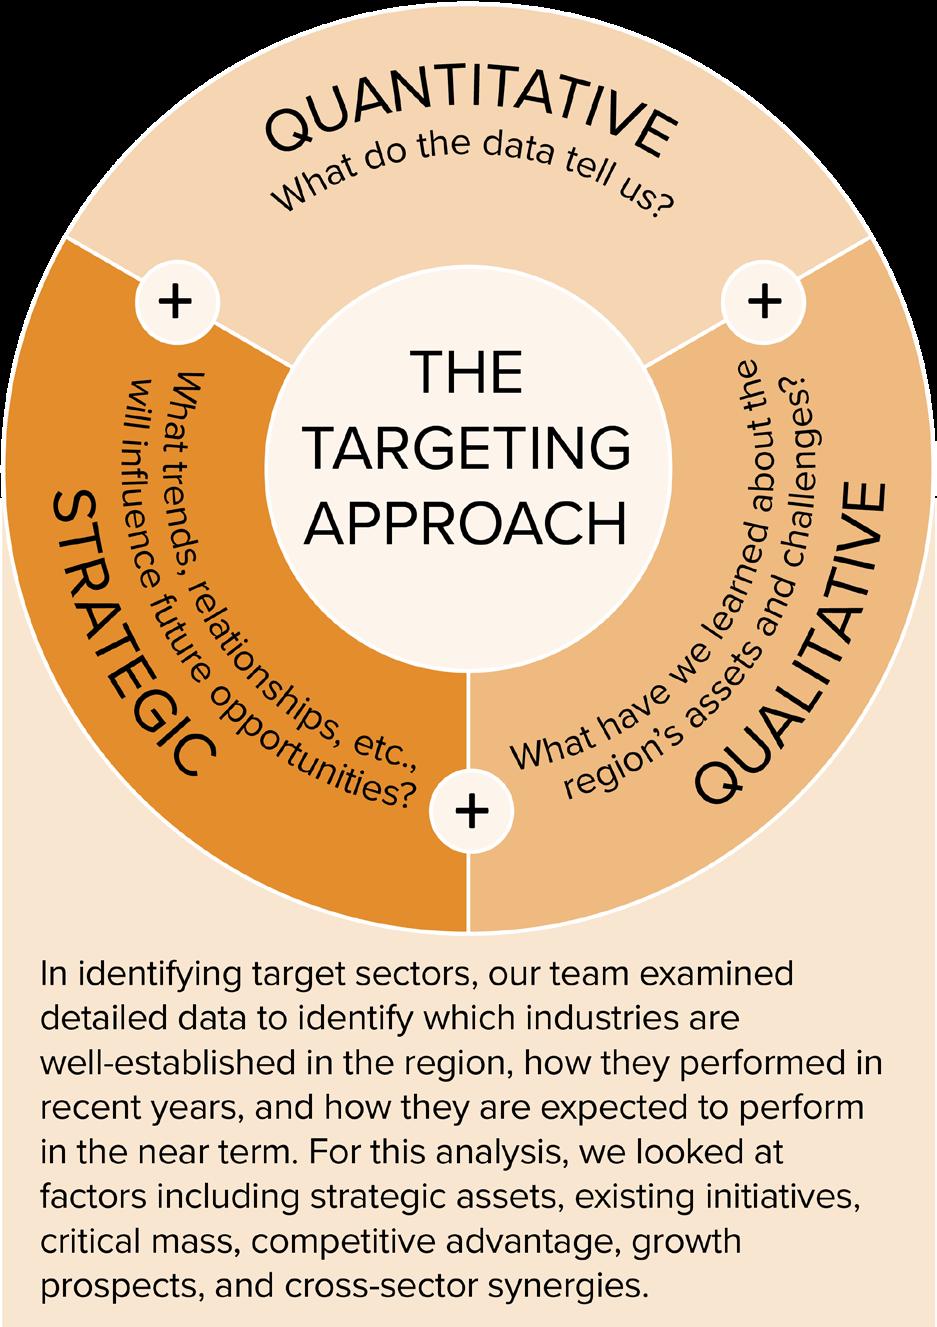
In the first phase of this project TIP Strategies reviewed employment using standard NAICS industry classifications. For the targeting analysis, we take this a step further by filtering employment within an industry cluster framework developed by the US Economic Development Administration in conjunction with the Institute for Strategy and Competitiveness at Harvard Business School (www.clustermapping.us).
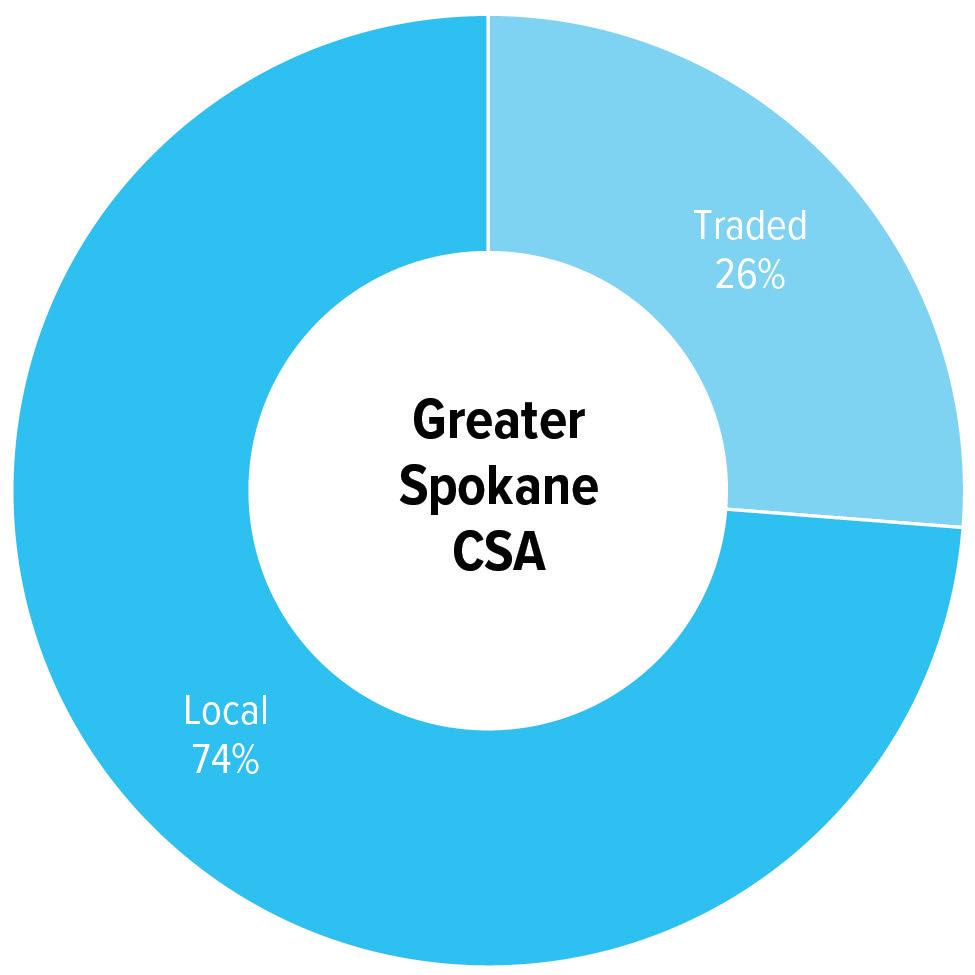
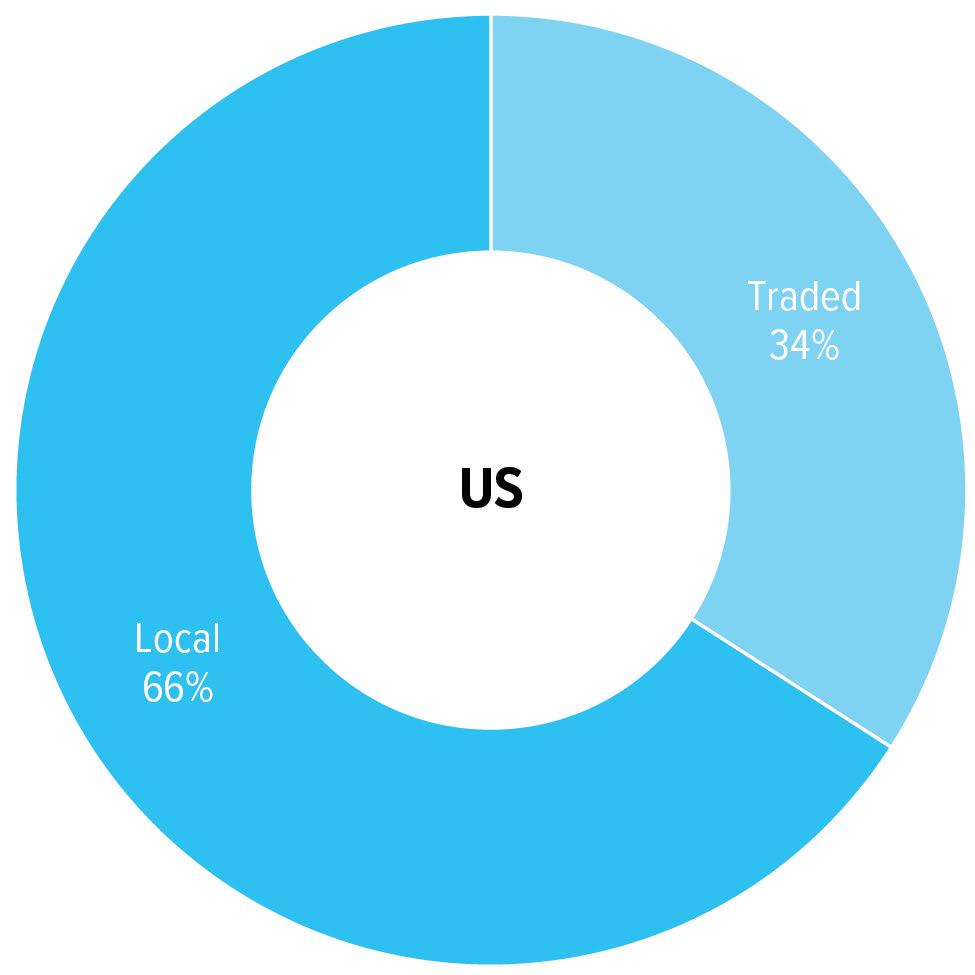
Increasing the ratio of traded-to-local clusters is a common strategy for enhancing economic prosperity. Traded clusters are emphasized by economic developers because they include industries and firms that typically produce goods and services for customers beyond the local region. These traded activities are thus more likely to produce externally generated revenues which can, in turn, help boost local tax coffers. As an example, a dental office might serve local customers exclusively, while a manufacturing plant, a data center, or a hotel would typically serve paying customers beyond the local area. The ability of traded clusters to serve larger markets also presents greater opportunity for employment growth, whereas a dental office might face more finite geographic limits to expansion.
• Primarily serve local markets.
• Present in virtually every market.
• Location is not dependent upon competitive advantage.
• Serve outside markets.
• Free to choose where they locate.
• Tend to be highly concentrated in a few regions that have specific advantages.
Sources: US Bureau of Labor Statistics; Emsi 2020.3– QCEW Employees, Non-QCEW Employees, and Self-Employed; U.S. Economic Development Administration; Institute for Strategy and Competitiveness, Harvard Business School; TIP Strategies, Inc. Note: The cluster methodology developed at Harvard Business School has been adjusted by TIP Strategies to align with the 6-digit NAICS classifications used by Emsi.
While local clusters (such as dental offices) typically account for a similar share of employment across communities of varying size, the share of total employment represented by traded clusters (such as automotive assembly plants) may differ dramatically from one community to the next. Traded clusters that account for a larger-than-average share of total employment can suggest areas of competitive advantage. This figure compares the distribution of employment by cluster in the US (first column) with the local area (second column). The third column uses location quotients (LQs) to convey the intensity of employment locally relative to the US. If a traded cluster represents 1 percent of US employment and 5 percent of local employment, its LQ would be 5.00, meaning that the traded cluster in the local area is 5 times as large as would be expected based on national patterns.
Sources: US Bureau of Labor Statistics; Emsi 2020.3– QCEW Employees, Non-QCEW Employees, and Self-Employed; US Economic Development Administration; Institute for Strategy and Competitiveness, Harvard Business School; TIP Strategies, Inc. Note: The cluster methodology developed at Harvard Business School has been adjusted by TIP Strategies to align with the 6-digit NAICS classifications used by Emsi.

Understanding anticipated job growth in traded clusters is an essential element of the targeting process. This figure compares projected net job gains in percentage terms over a fiveyear horizon for the US (first column) and the local area (second column). The column on the far right shows projections (in numeric terms) for local net job gains in traded clusters in descending order. The last three rows of the exhibit—showing projected job growth aggregated for traded clusters, local clusters, and total employment—can help inform strategic discussions and refine goals for the future.
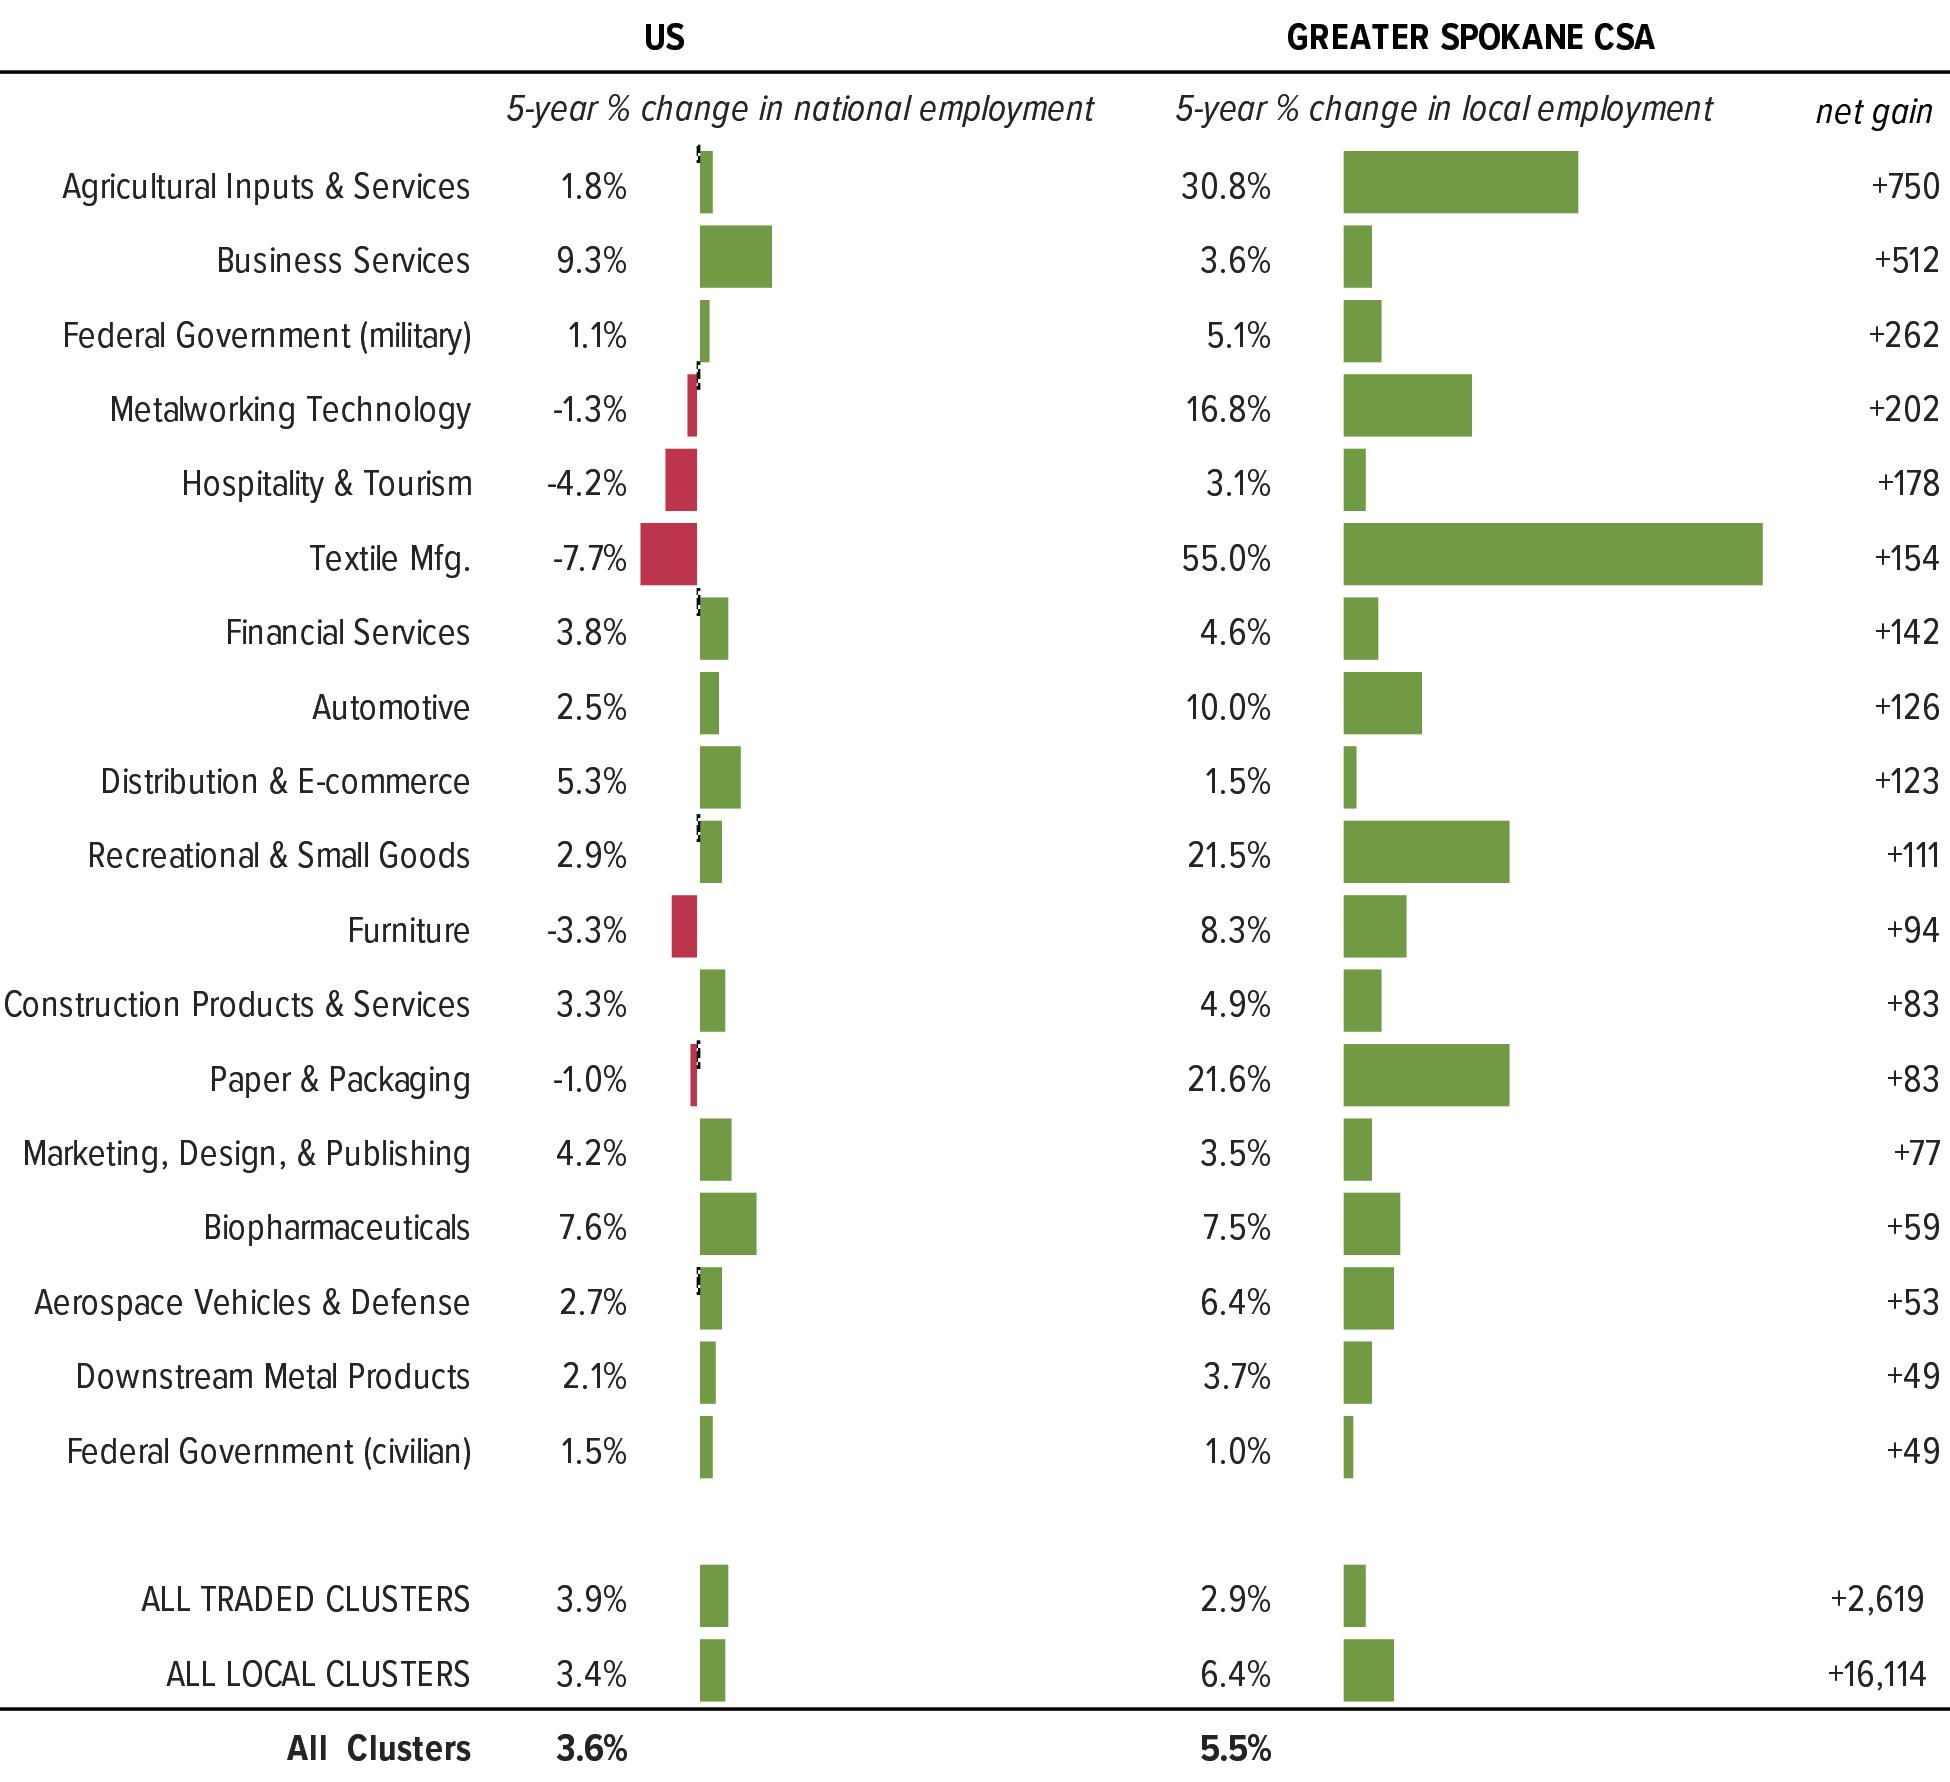
Sources: US Bureau of Labor Statistics; Emsi 2020.3– QCEW Employees, Non-QCEW Employees, and Self-Employed; US Economic Development Administration; Institute for Strategy and Competitiveness, Harvard Business School; TIP Strategies, Inc.
"Note: The cluster methodology developed at Harvard Business School has been adjusted by TIP Strategies to align with the 6-digit NAICS classifications used by Emsi.

An analysis of job postings can help reframe our understanding of the local job market from the employer’s perspective rather than simply through the lens of government statistics. This back-of-the-envelope analysis uses job postings from the prior calendar year to identify the most sought-out occupations (first column) and the most frequently occurring words and phrases (second column). LQs are used to approximate the local intensity of recruiting efforts and illustrate employer demand for specific hard skills. A help wanted ad that appears locally at 5 times the relative rate as the US would have an LQ of 5.00; likewise a specific skill that appears more frequently in local postings than the national average would have an LQ greater than 1.00, suggesting higher demand in the local market. The results should prompt strategic questions about the alignment of the region’s talent pipeline with the needs of employers and with target (traded) clusters.
Sources: Emsi 2020.3; TIP Strategies, Inc.
WHOLESALE
WHOLESALE
WHOLESALE

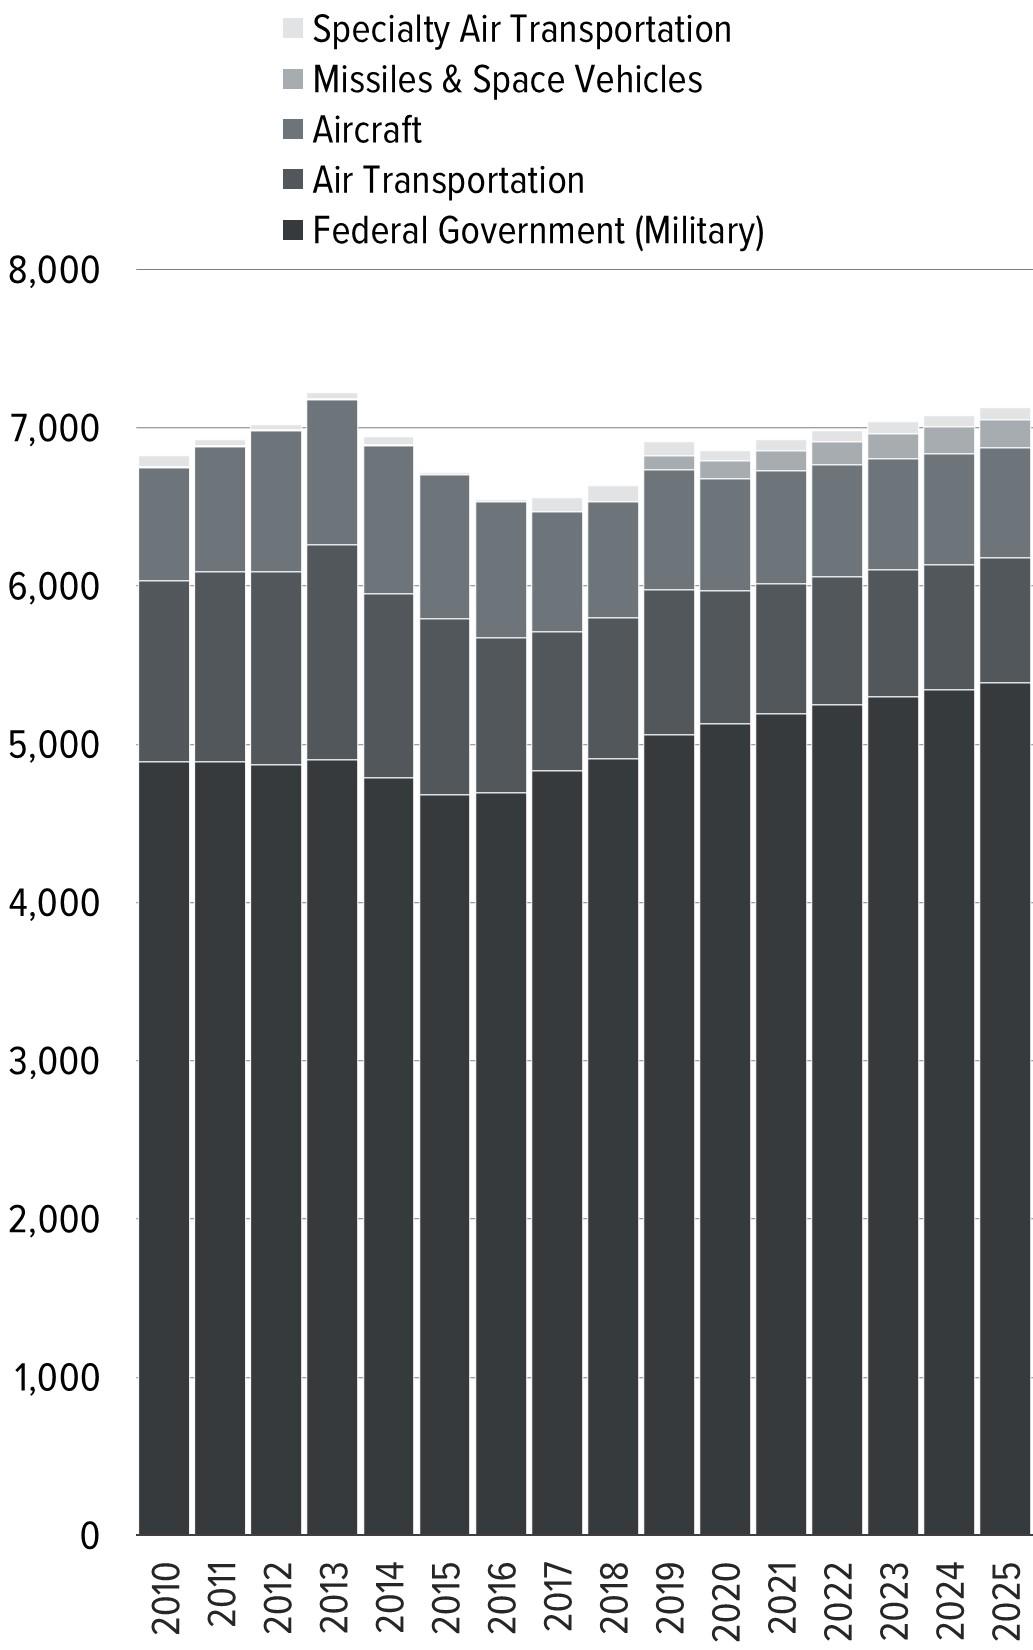
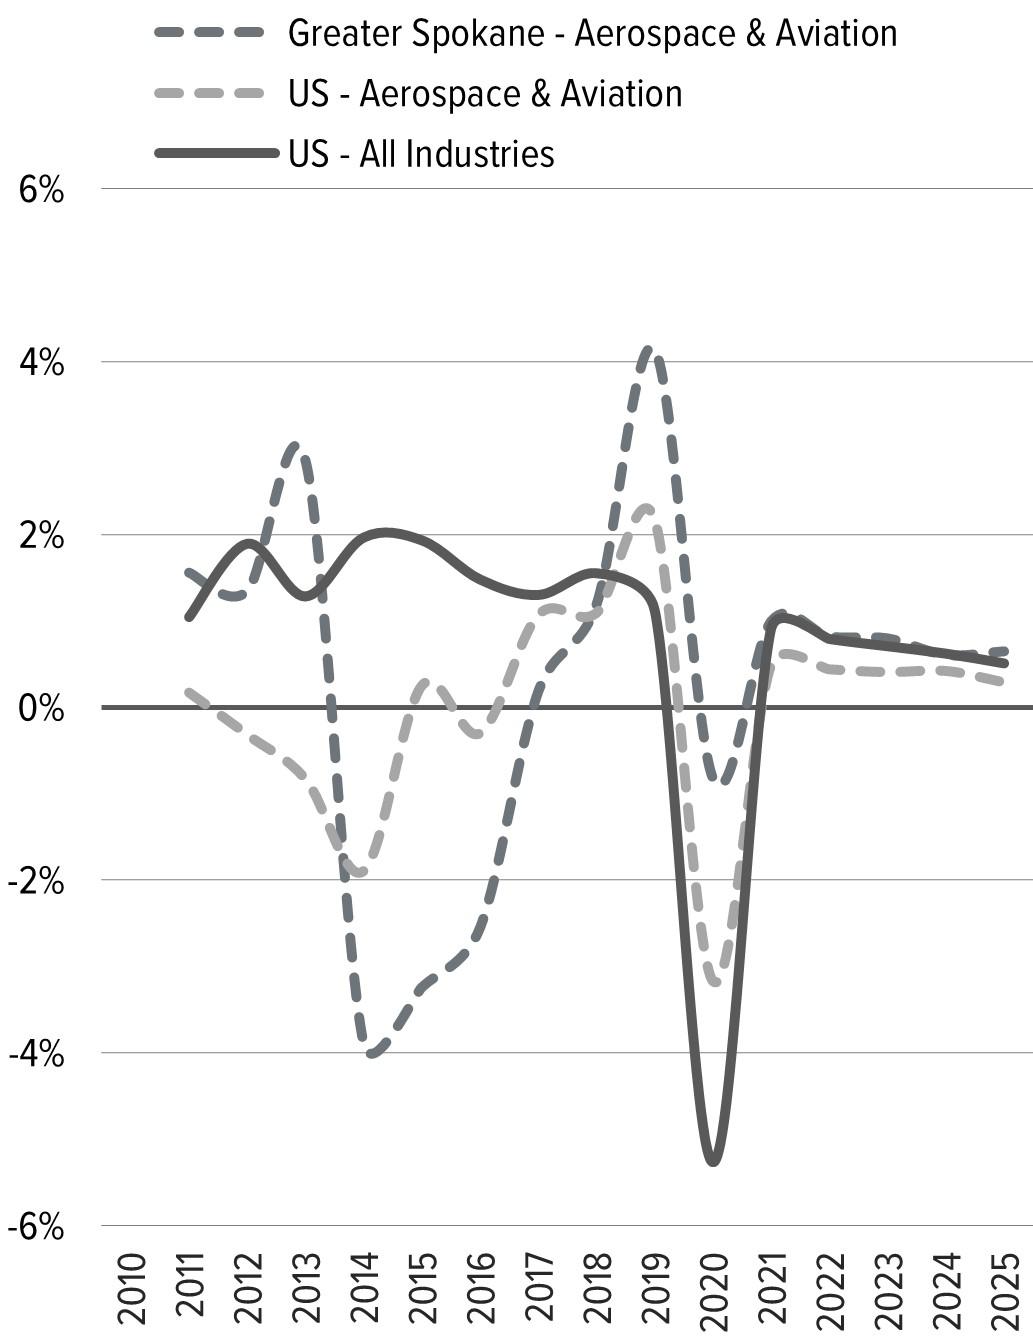
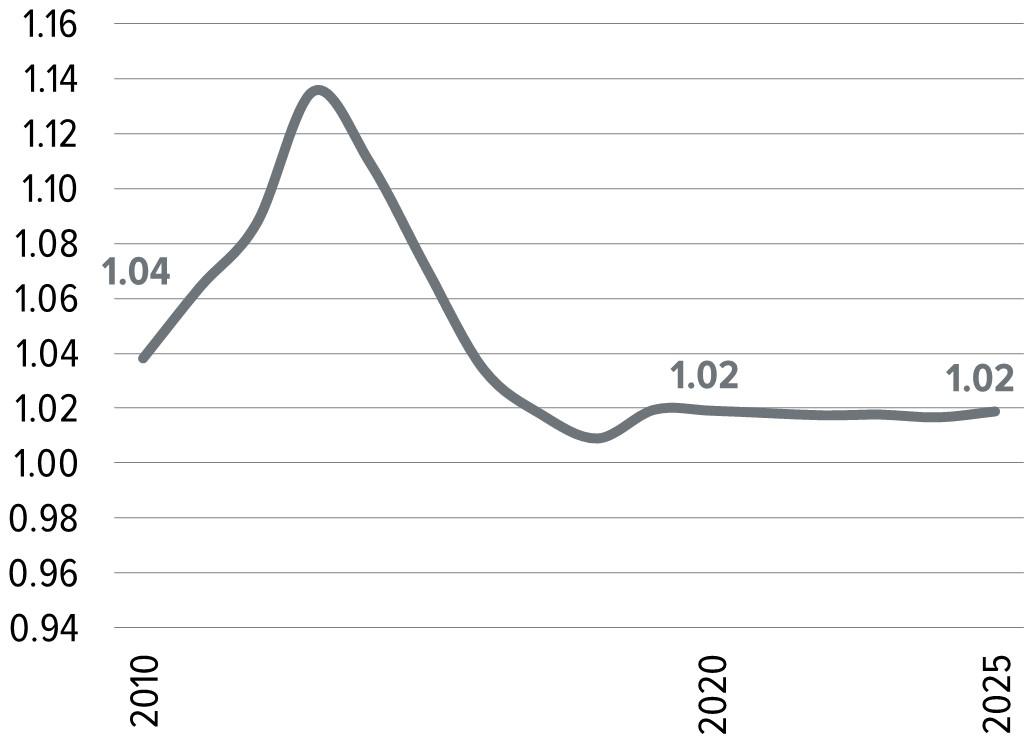
US
Each target industry is underpinned by its workforce, making the occupational composition of each target worthy of further analysis. This table shows each target's largest occupational contributors. The number of local jobs for each occupation is shown along with the occupation's weight (in percentage terms) within the target. The LQ compares the occupation's local weight to its national weight within this target. An LQ that exceeds 1.00 indicates a local occupation employed more heavily by the local target industry than national patterns might imply, while an LQ below 1.00 indicates relatively lighter local reliance on the occupation. Median local hourly earnings accompany the occupations shown in the exhibit. Wage ratios exceeding 1.00 indicate higher pay than the same occupation might expect nationally, while ratios below 1.00 suggest relatively lower compensation than the national level.
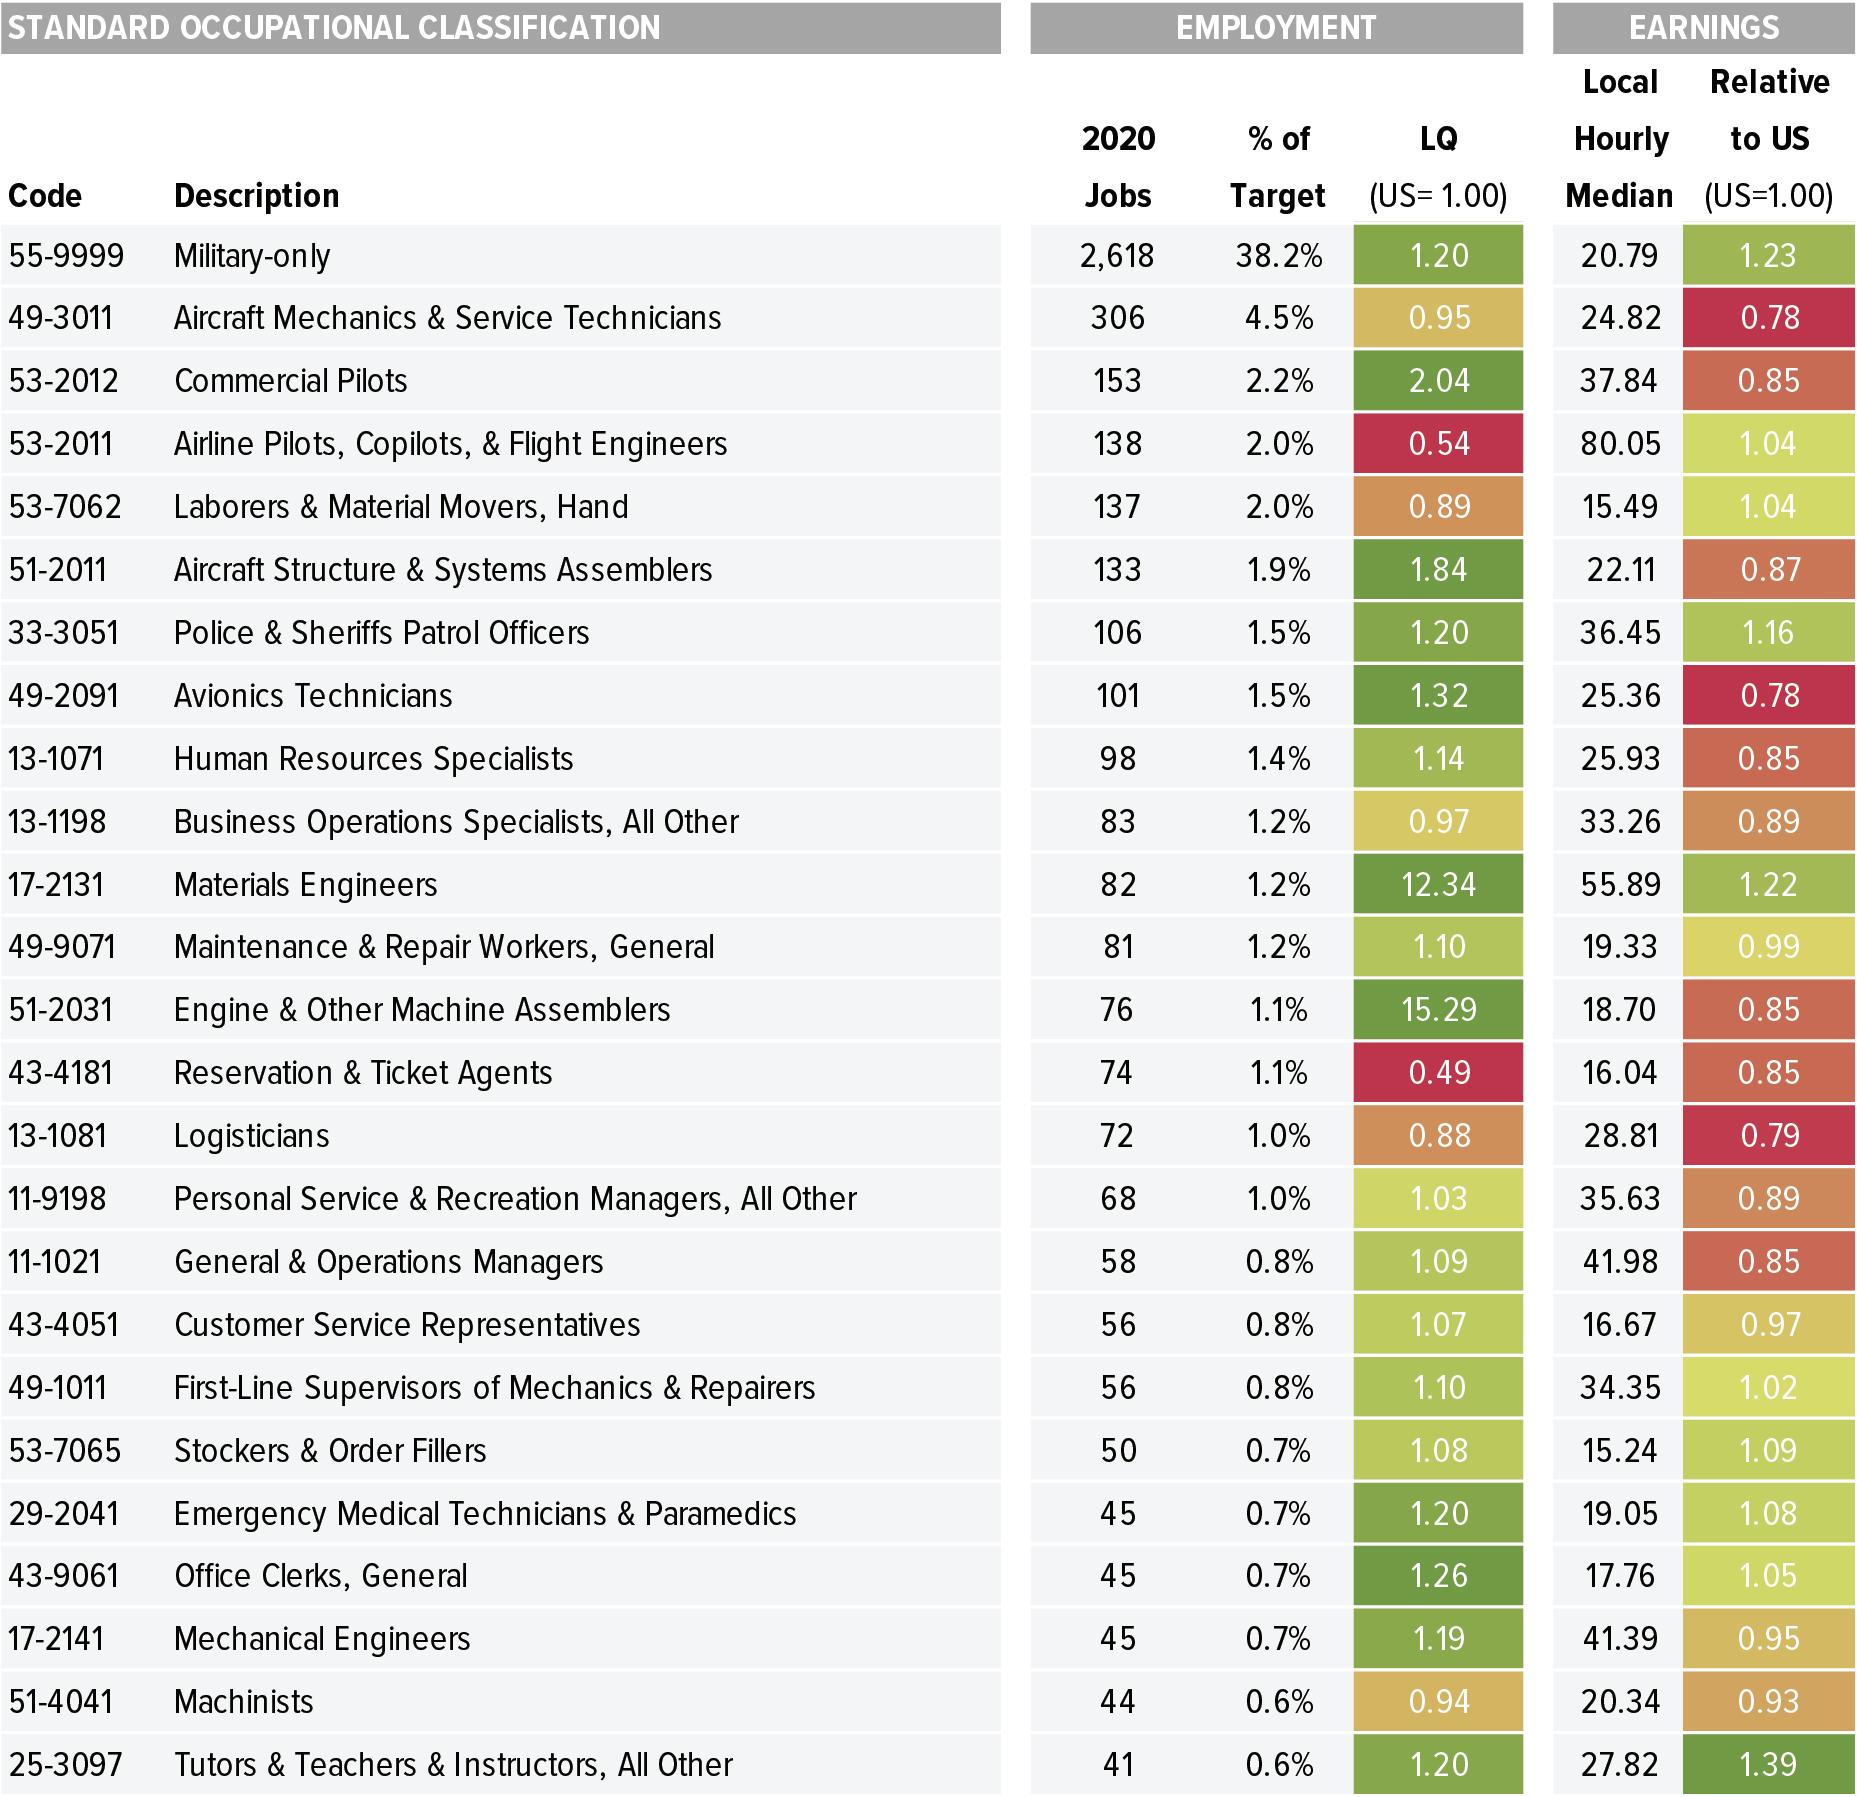
Sources: US Bureau of Labor Statistics; Emsi 2020.3—QCEW Employees, Non-QCEW Employees, and Self-Employed; US Economic Development Administration; Institute for Strategy and Competitiveness at Harvard Business School; TIP Strategies, Inc.
Note: The cluster methodology developed at Harvard Business School has been adjusted by TIP Strategies to align with the six-digit NAICS classifications used by Emsi.
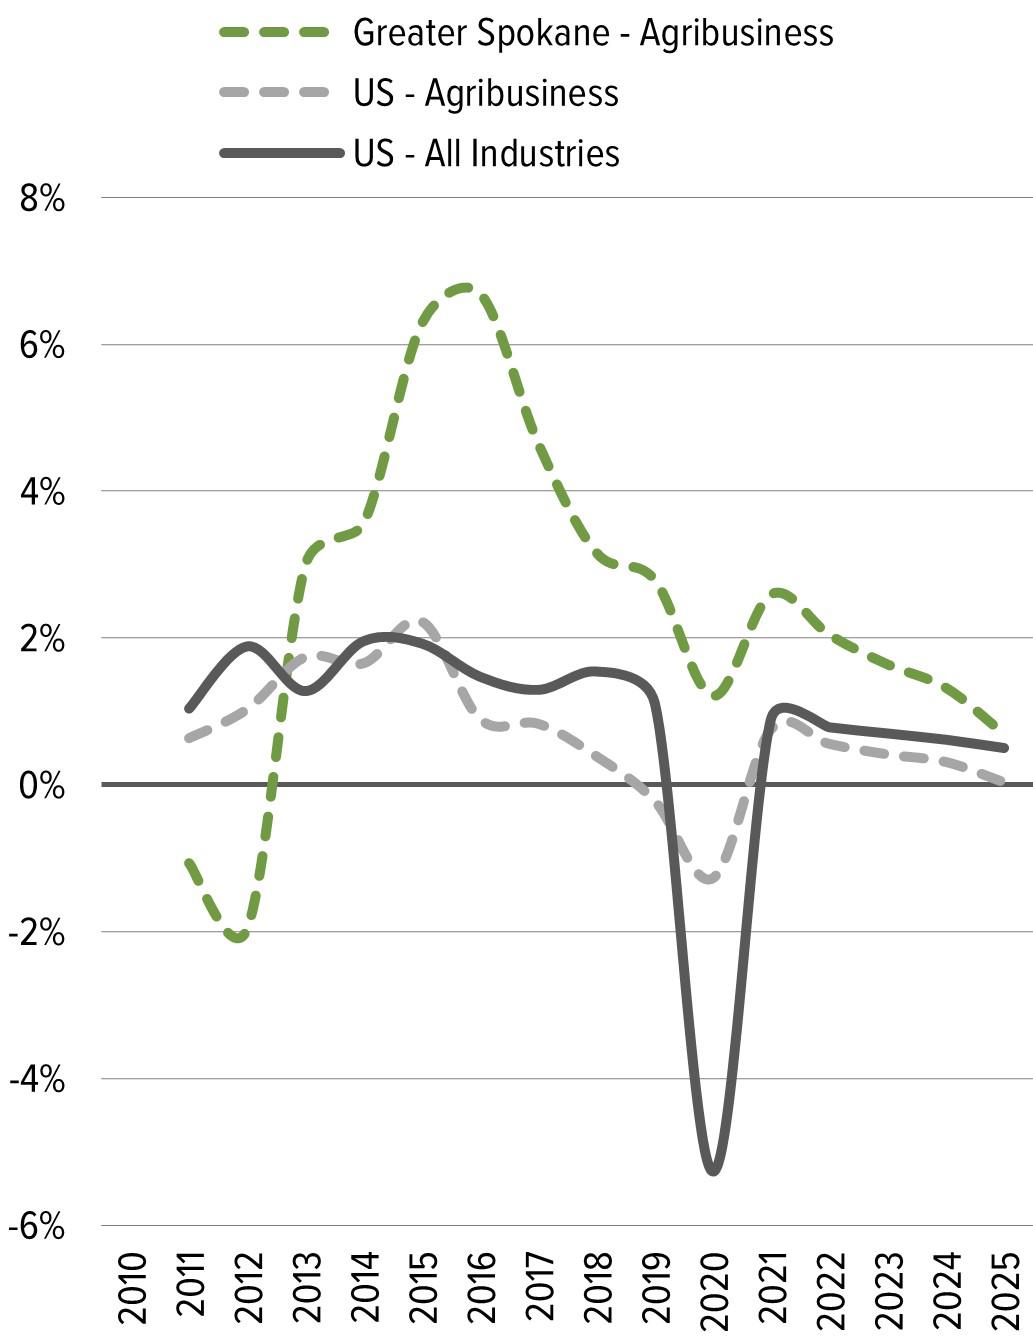
US
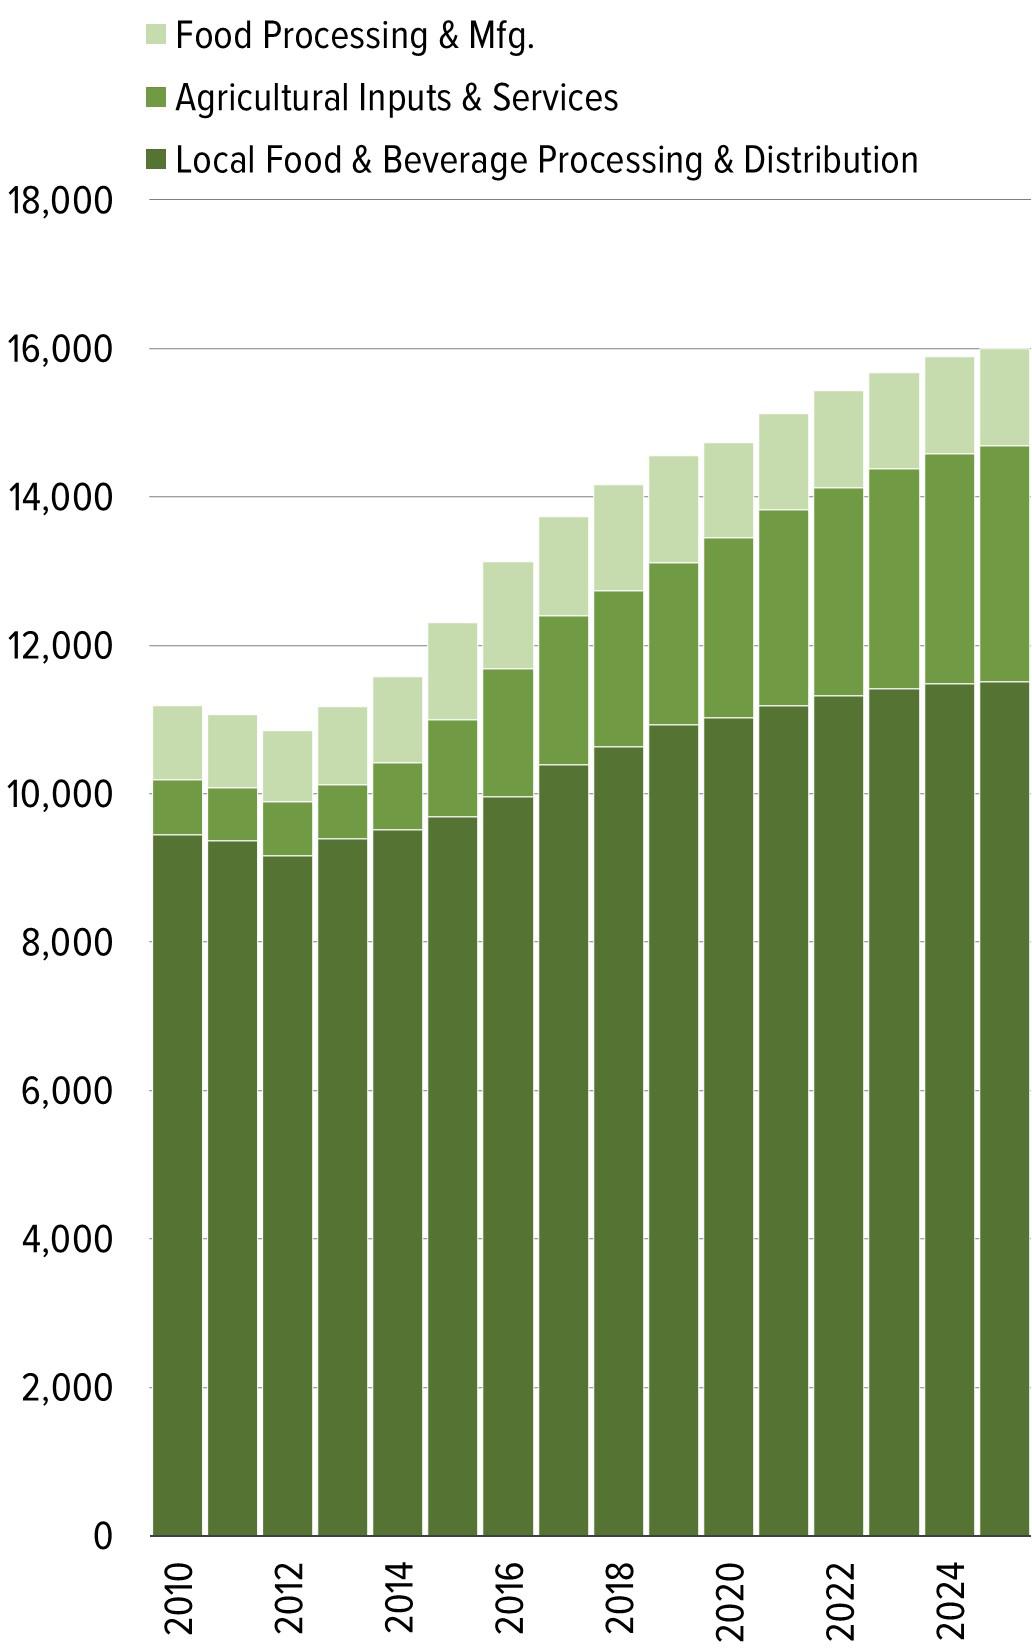

GREATER
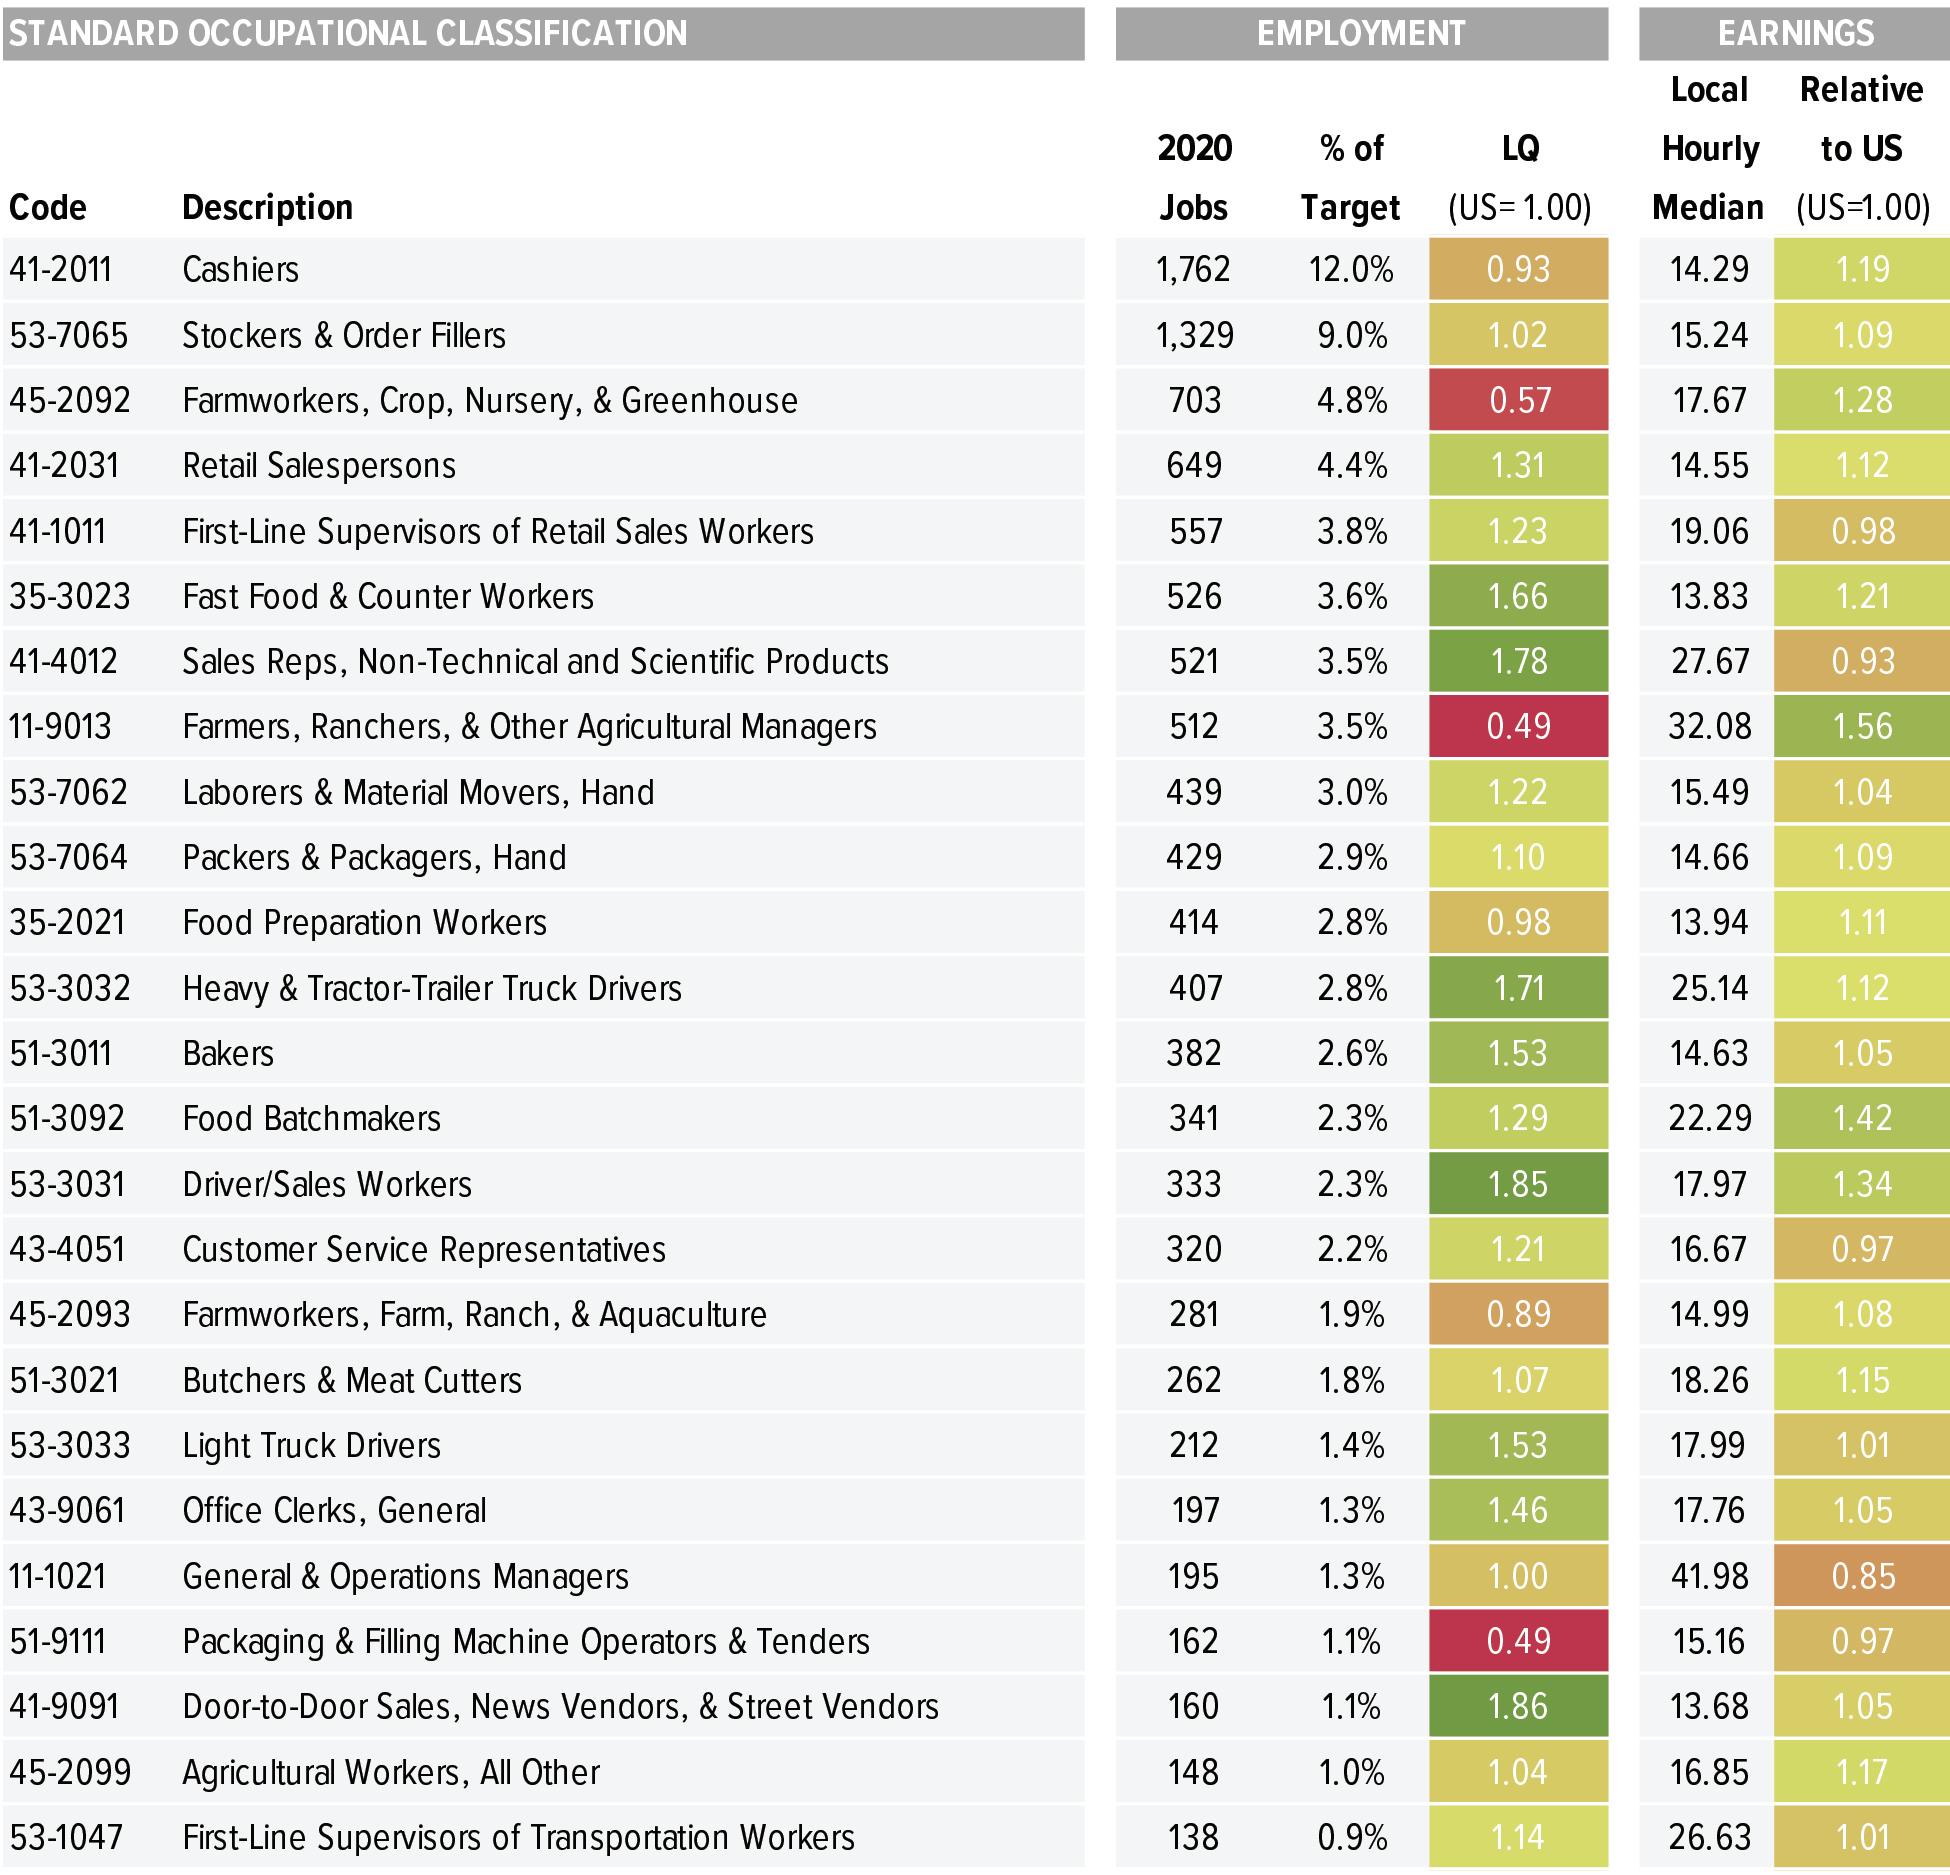
Sources: US Bureau of Labor Statistics; Emsi 2020.3—QCEW Employees, Non-QCEW Employees, and Self-Employed; US Economic Development Administration; Institute for Strategy and Competitiveness at Harvard Business School; TIP Strategies.
Note: The cluster methodology developed at Harvard Business School has been adjusted by TIP Strategies to align with the six-digit NAICS classifications used by Emsi.
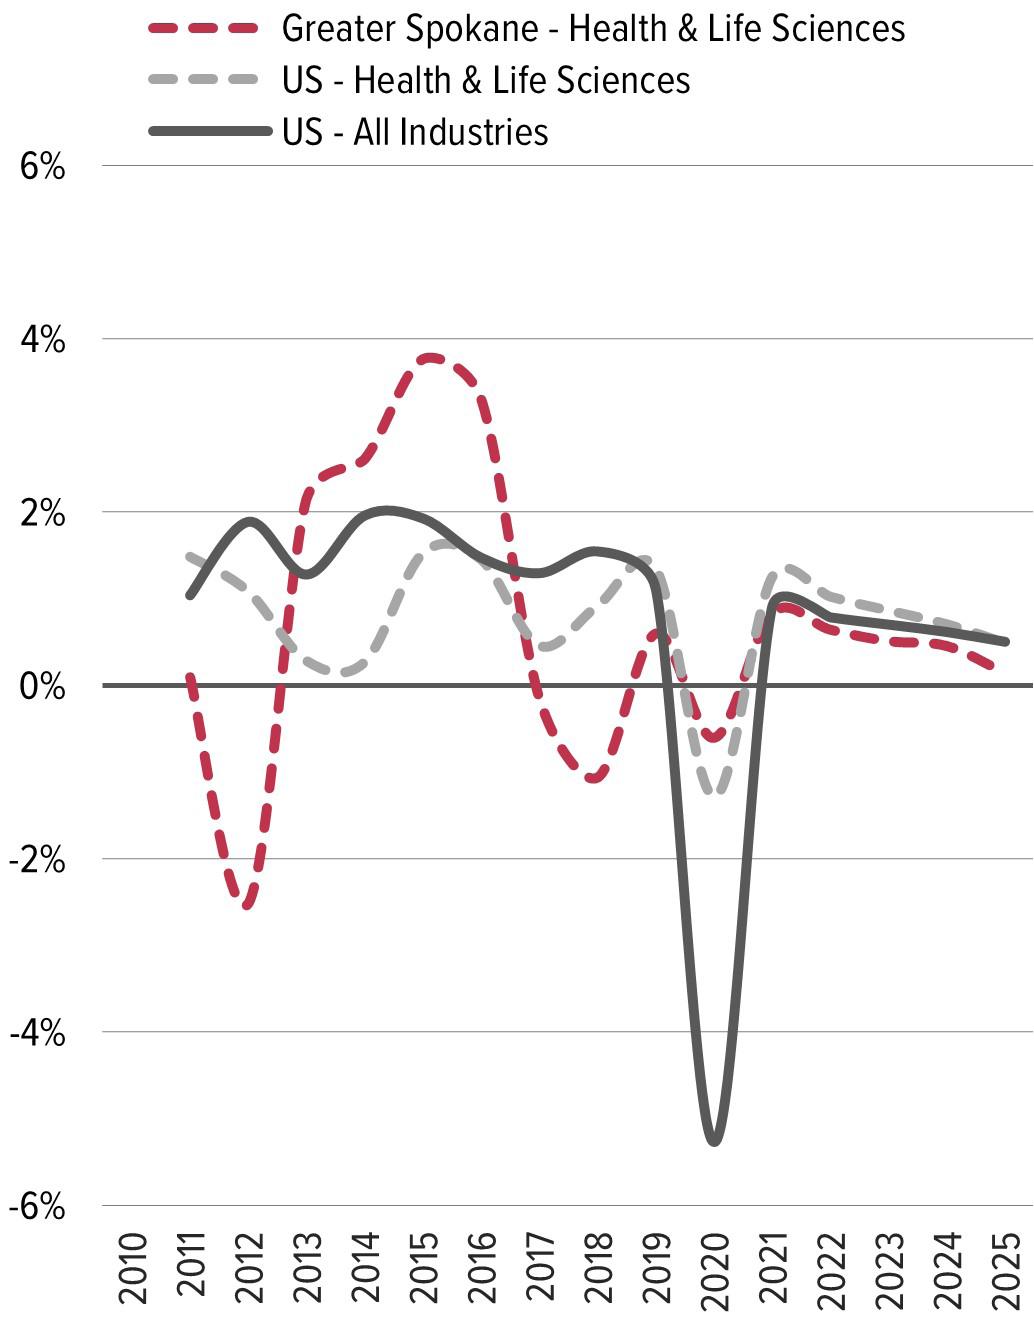
US OVERALL TOTAL TARGET
Net Change, 2020–2025 +5,652,930 +580,546
Percent Change, 2020–2025 +3.6% +4.4%
GREATER SPOKANE TOTAL TARGET
Net Change, 2020–2025 +18,646 +729


Percent Change, 2020–2025 +5.5% +2.6%
ANNUAL EMPLOYMENT

Sources: US Bureau of Labor Statistics; Emsi 2020.3—QCEW Employees, Non-QCEW Employees, and Self-Employed; US Economic Development Administration; Institute for Strategy and Competitiveness at Harvard Business School; TIP Strategies.
Note: The cluster methodology developed at Harvard Business School has been adjusted by TIP Strategies to align with the six-digit NAICS classifications used by Emsi.
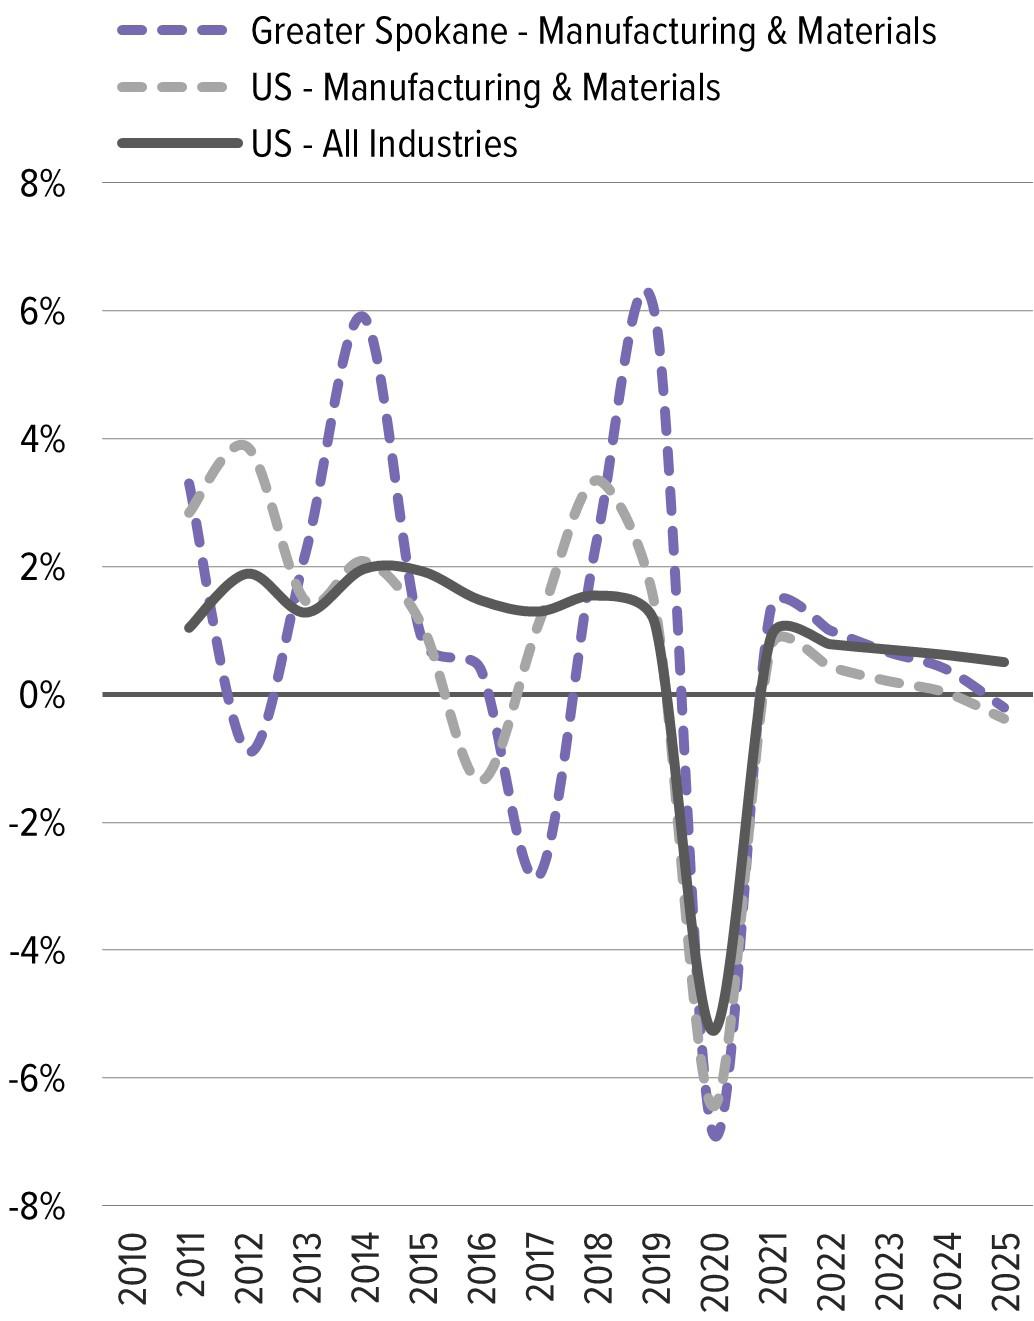
US OVERALL TOTAL TARGET
Net Change, 2020–2025
Percent Change, 2020–2025
GREATER SPOKANE TOTAL TARGET
Net Change, 2020–2025
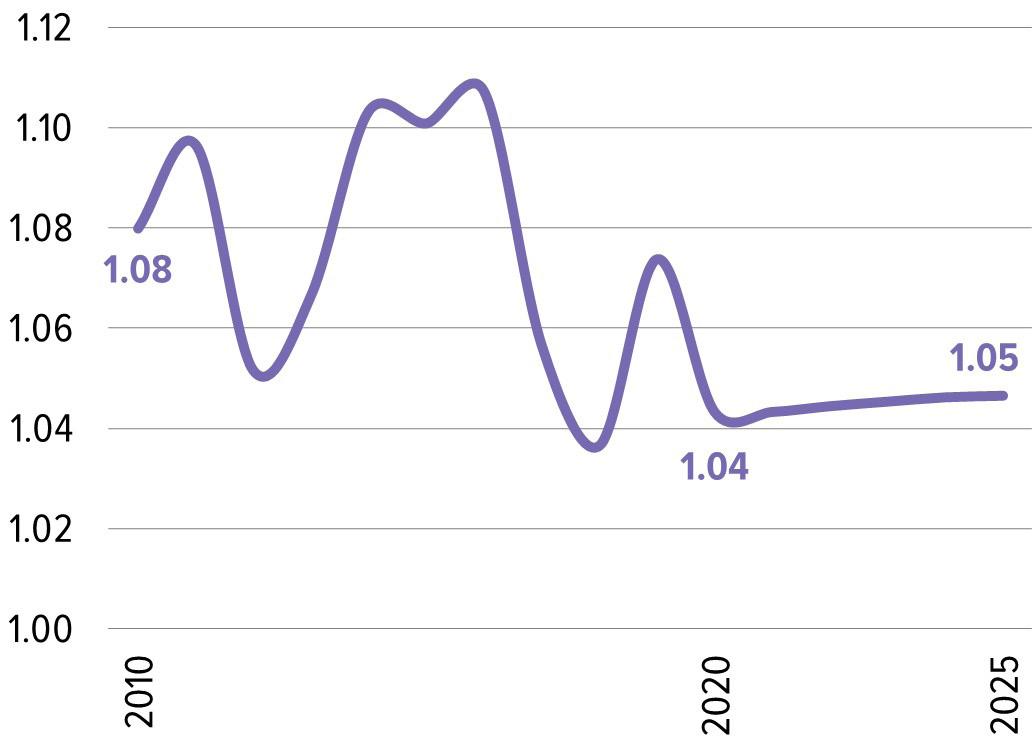
Percent Change, 2020–2025
ANNUAL EMPLOYMENT

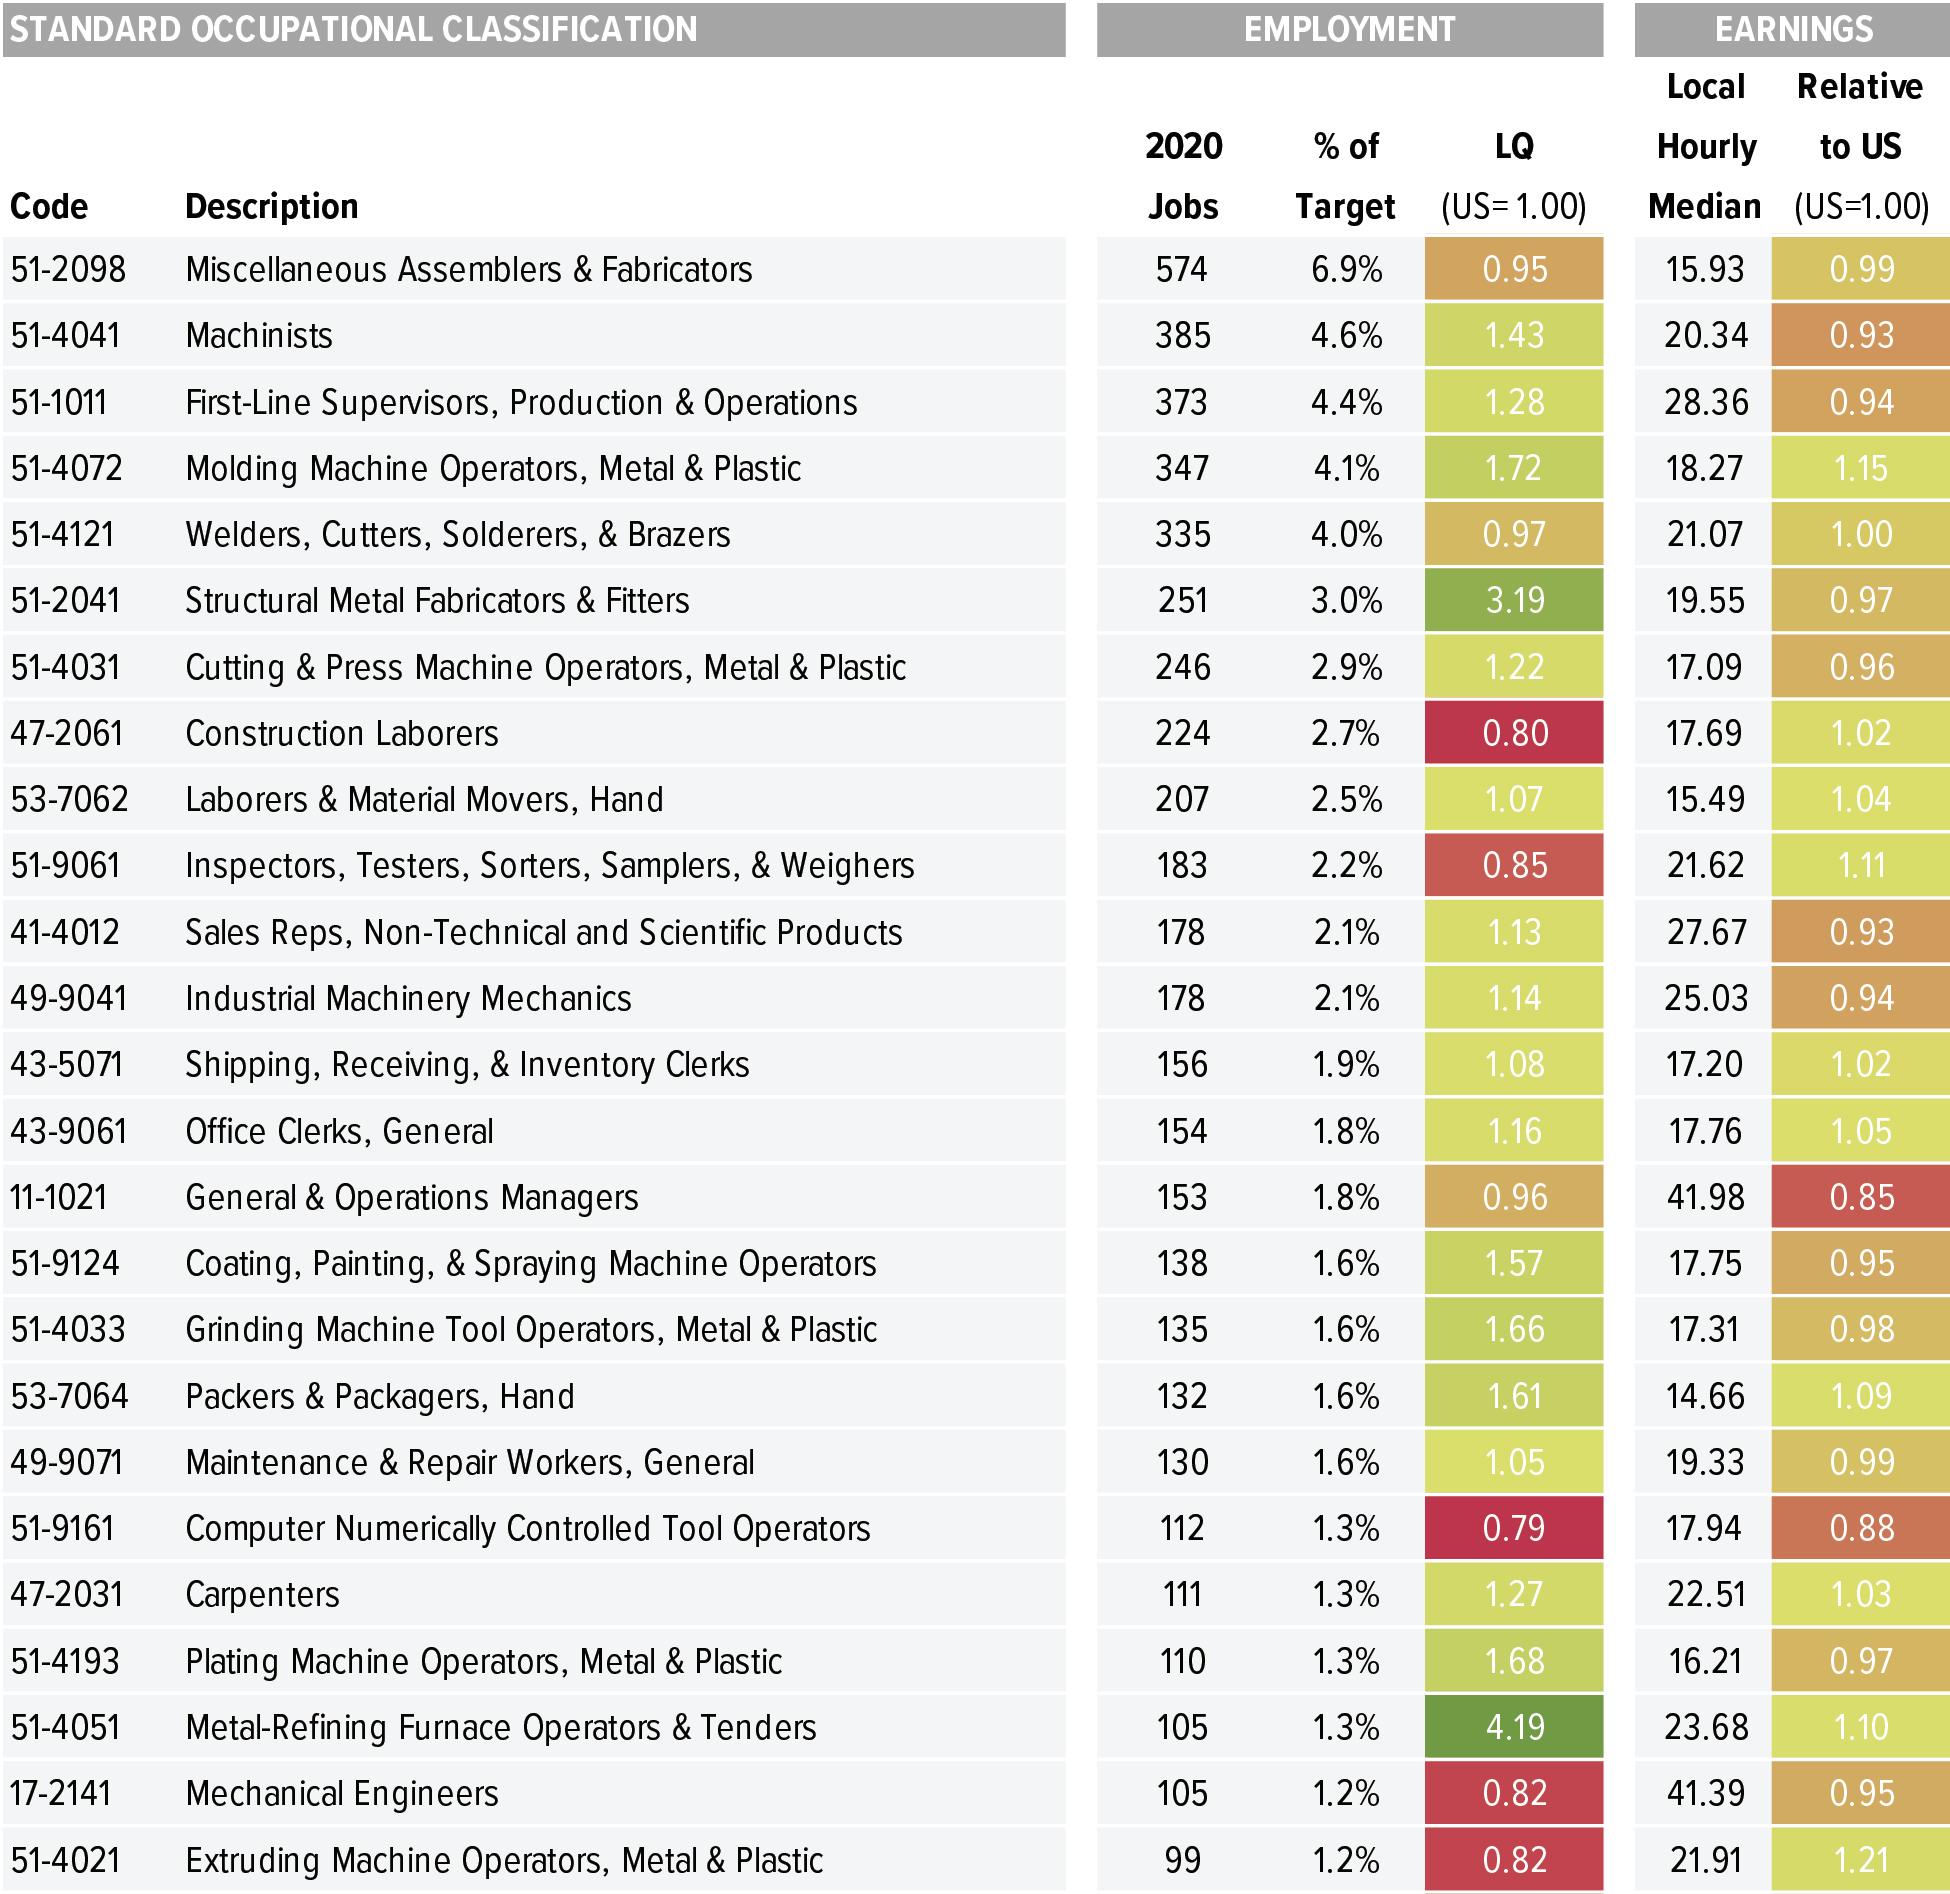
Sources: US Bureau of Labor Statistics; Emsi 2020.3—QCEW Employees, Non-QCEW Employees, and Self-Employed; US Economic Development Administration; Institute for Strategy and Competitiveness at Harvard Business School; TIP Strategies.
Note: The cluster methodology developed at Harvard Business School has been adjusted by TIP Strategies to align with the six-digit NAICS classifications used by Emsi.
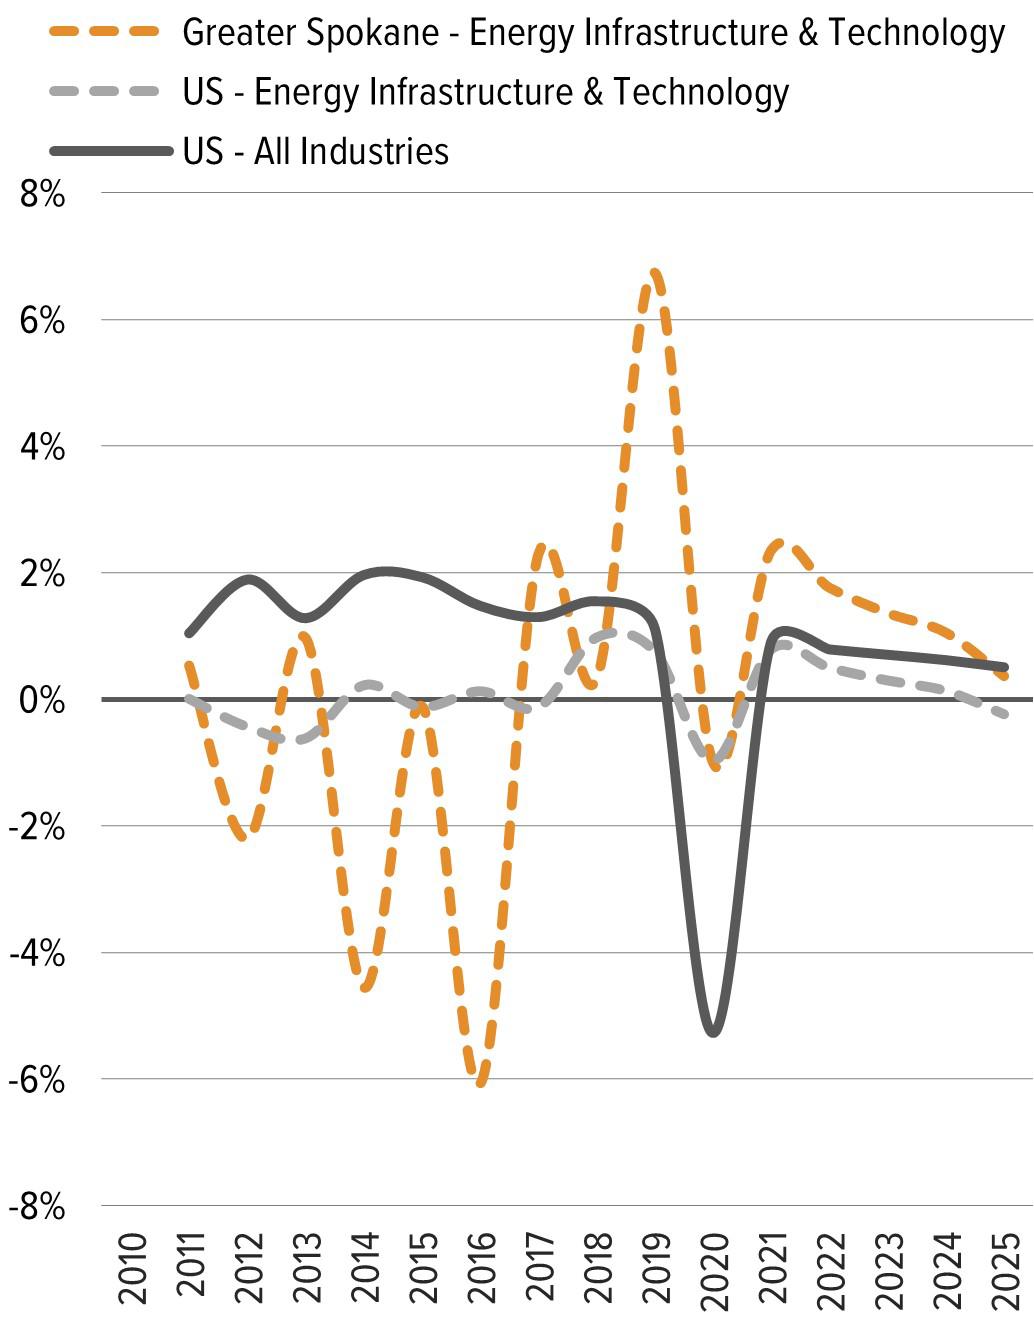
US OVERALL TOTAL TARGET
Net Change, 2020–2025 +5,652,930 +49,582
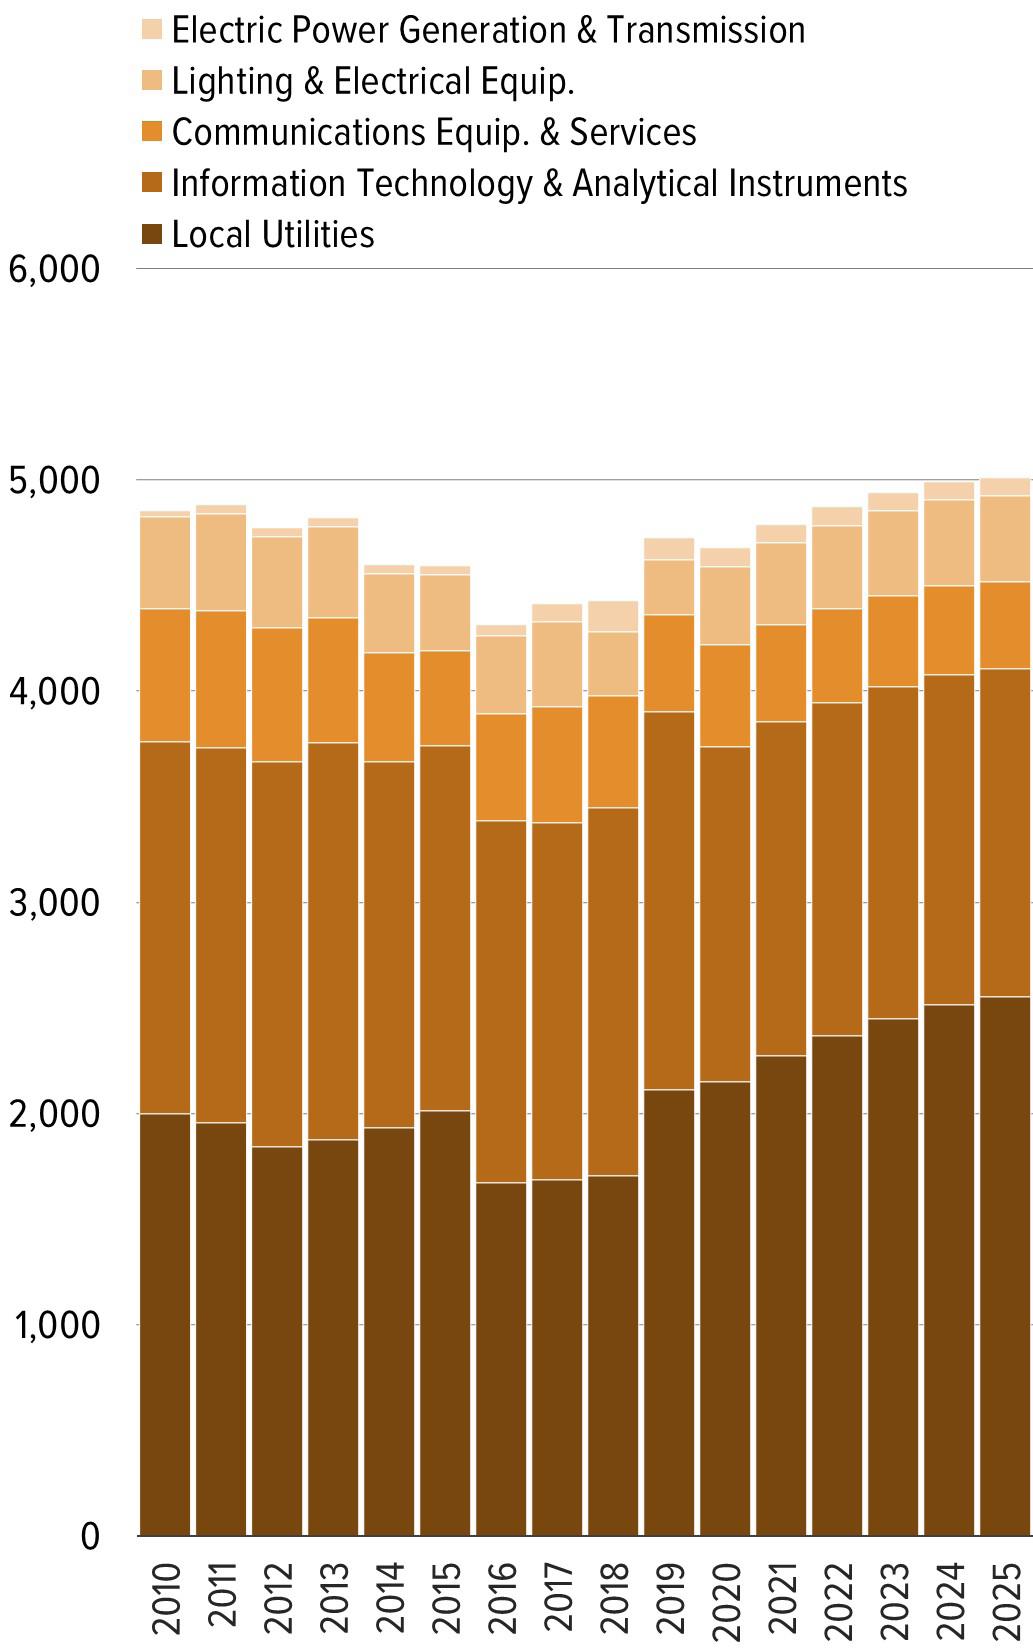
Percent Change, 2020–2025 +3.6% +1.5%
GREATER SPOKANE TOTAL TARGET
Net Change, 2020–2025 +18,646 +330
Percent Change, 2020–2025 +5.5% +7.1%


Sources: US Bureau of Labor Statistics; Emsi 2020.3—QCEW Employees, Non-QCEW Employees, and Self-Employed; US Economic Development Administration; Institute for Strategy and Competitiveness at Harvard Business School; TIP Strategies.
Note: The cluster methodology developed at Harvard Business School has been adjusted by TIP Strategies to align with the six-digit NAICS classifications used by Emsi.
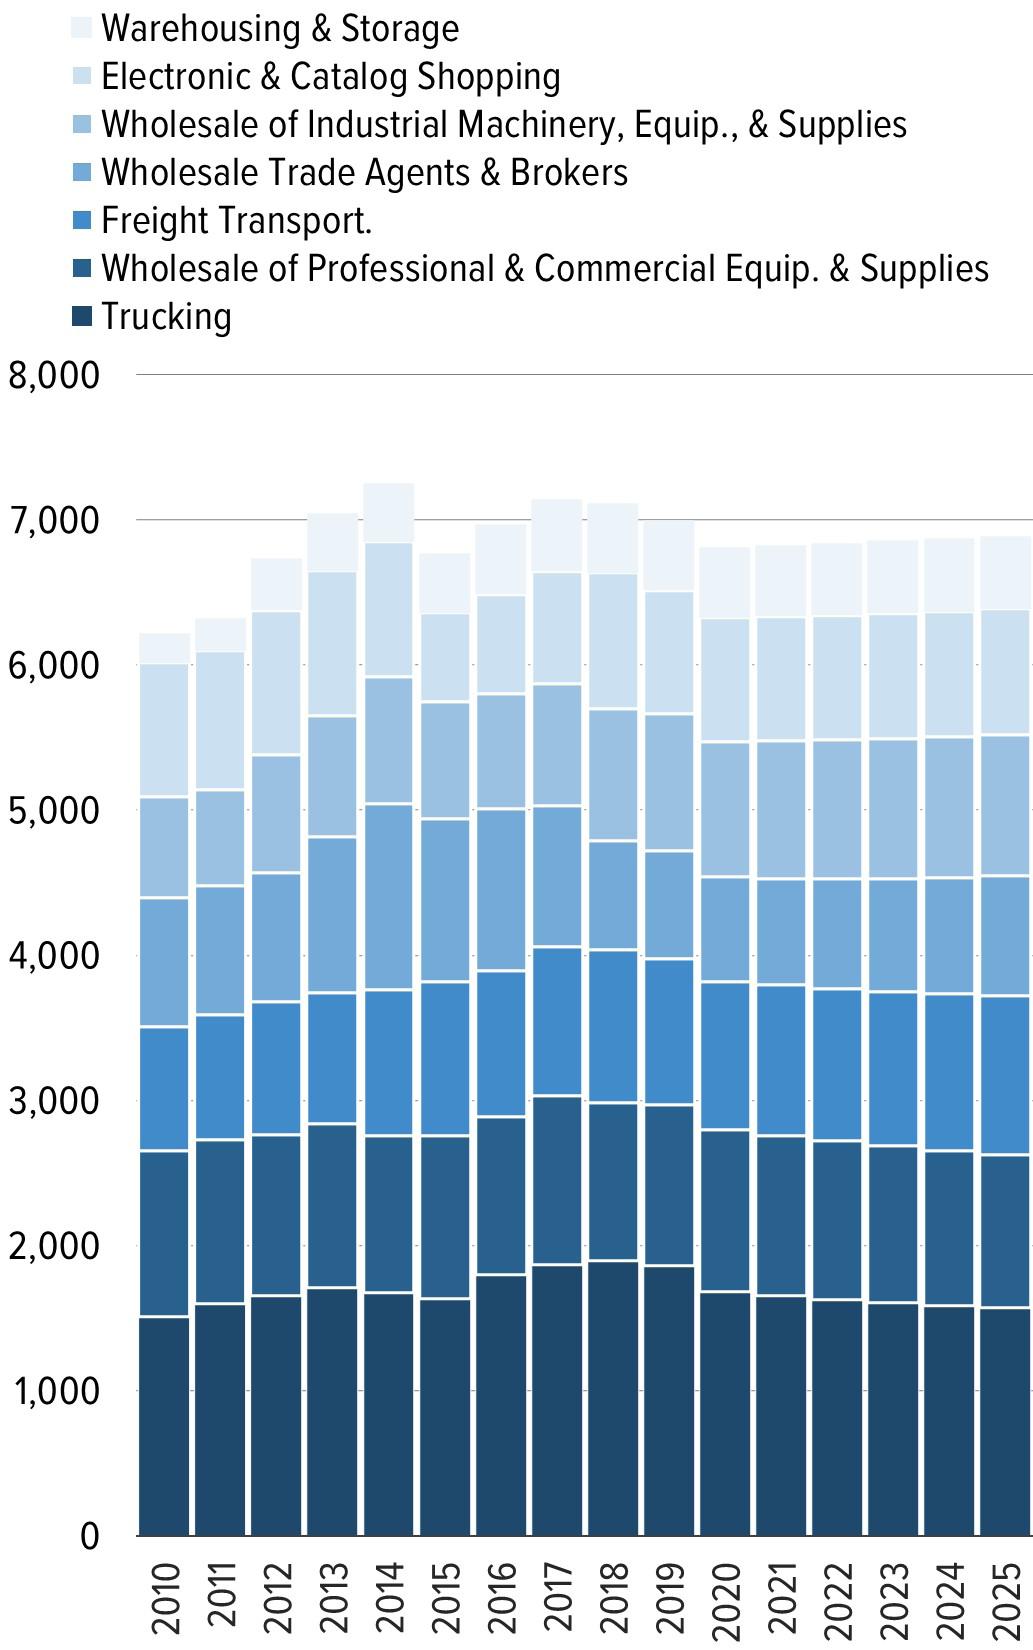
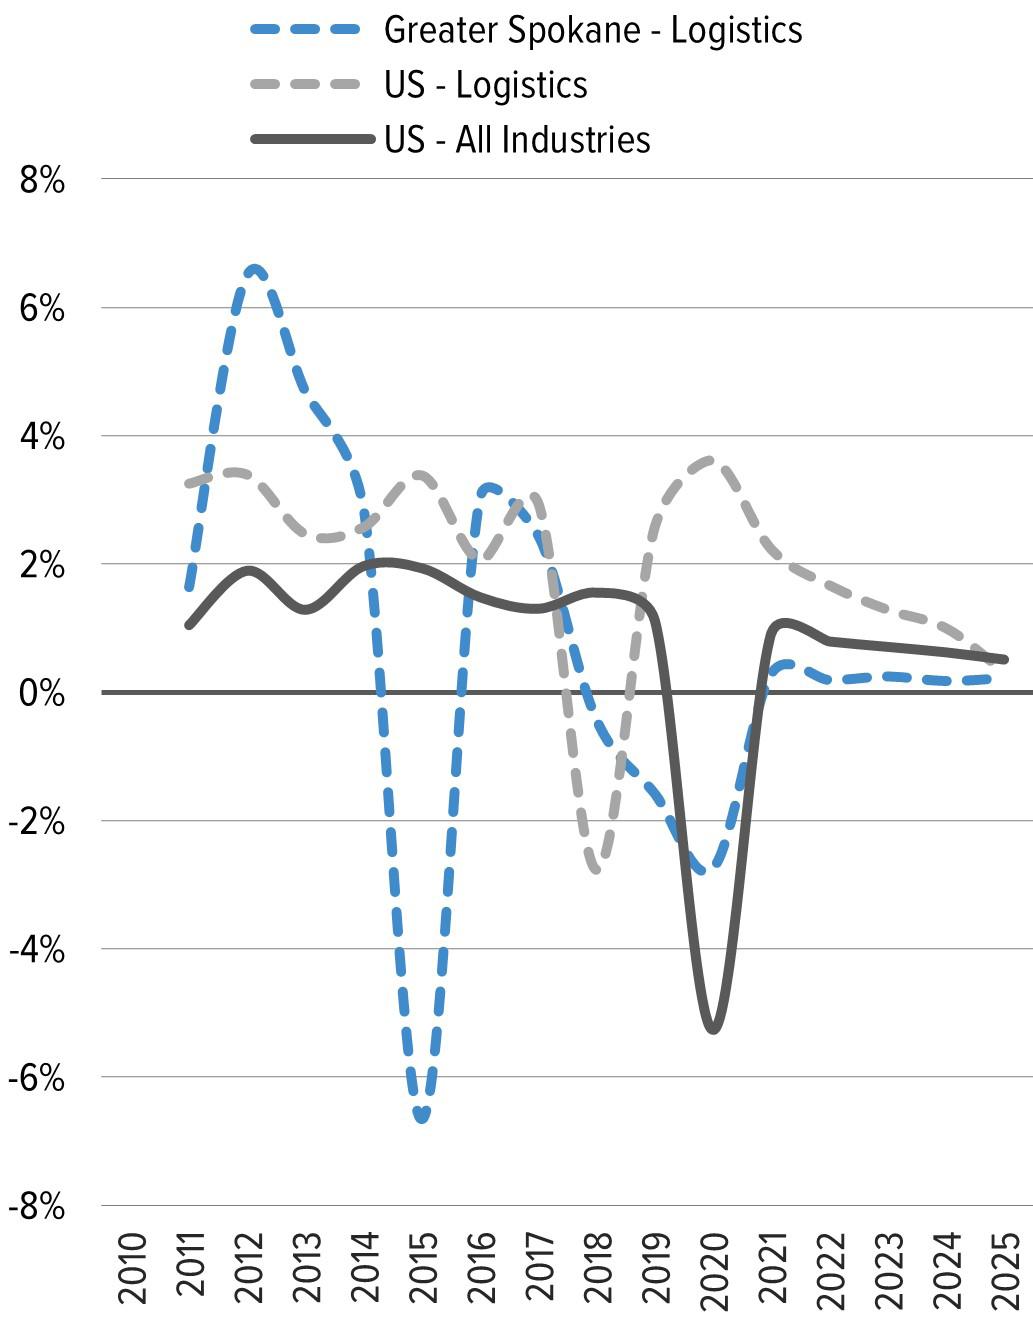
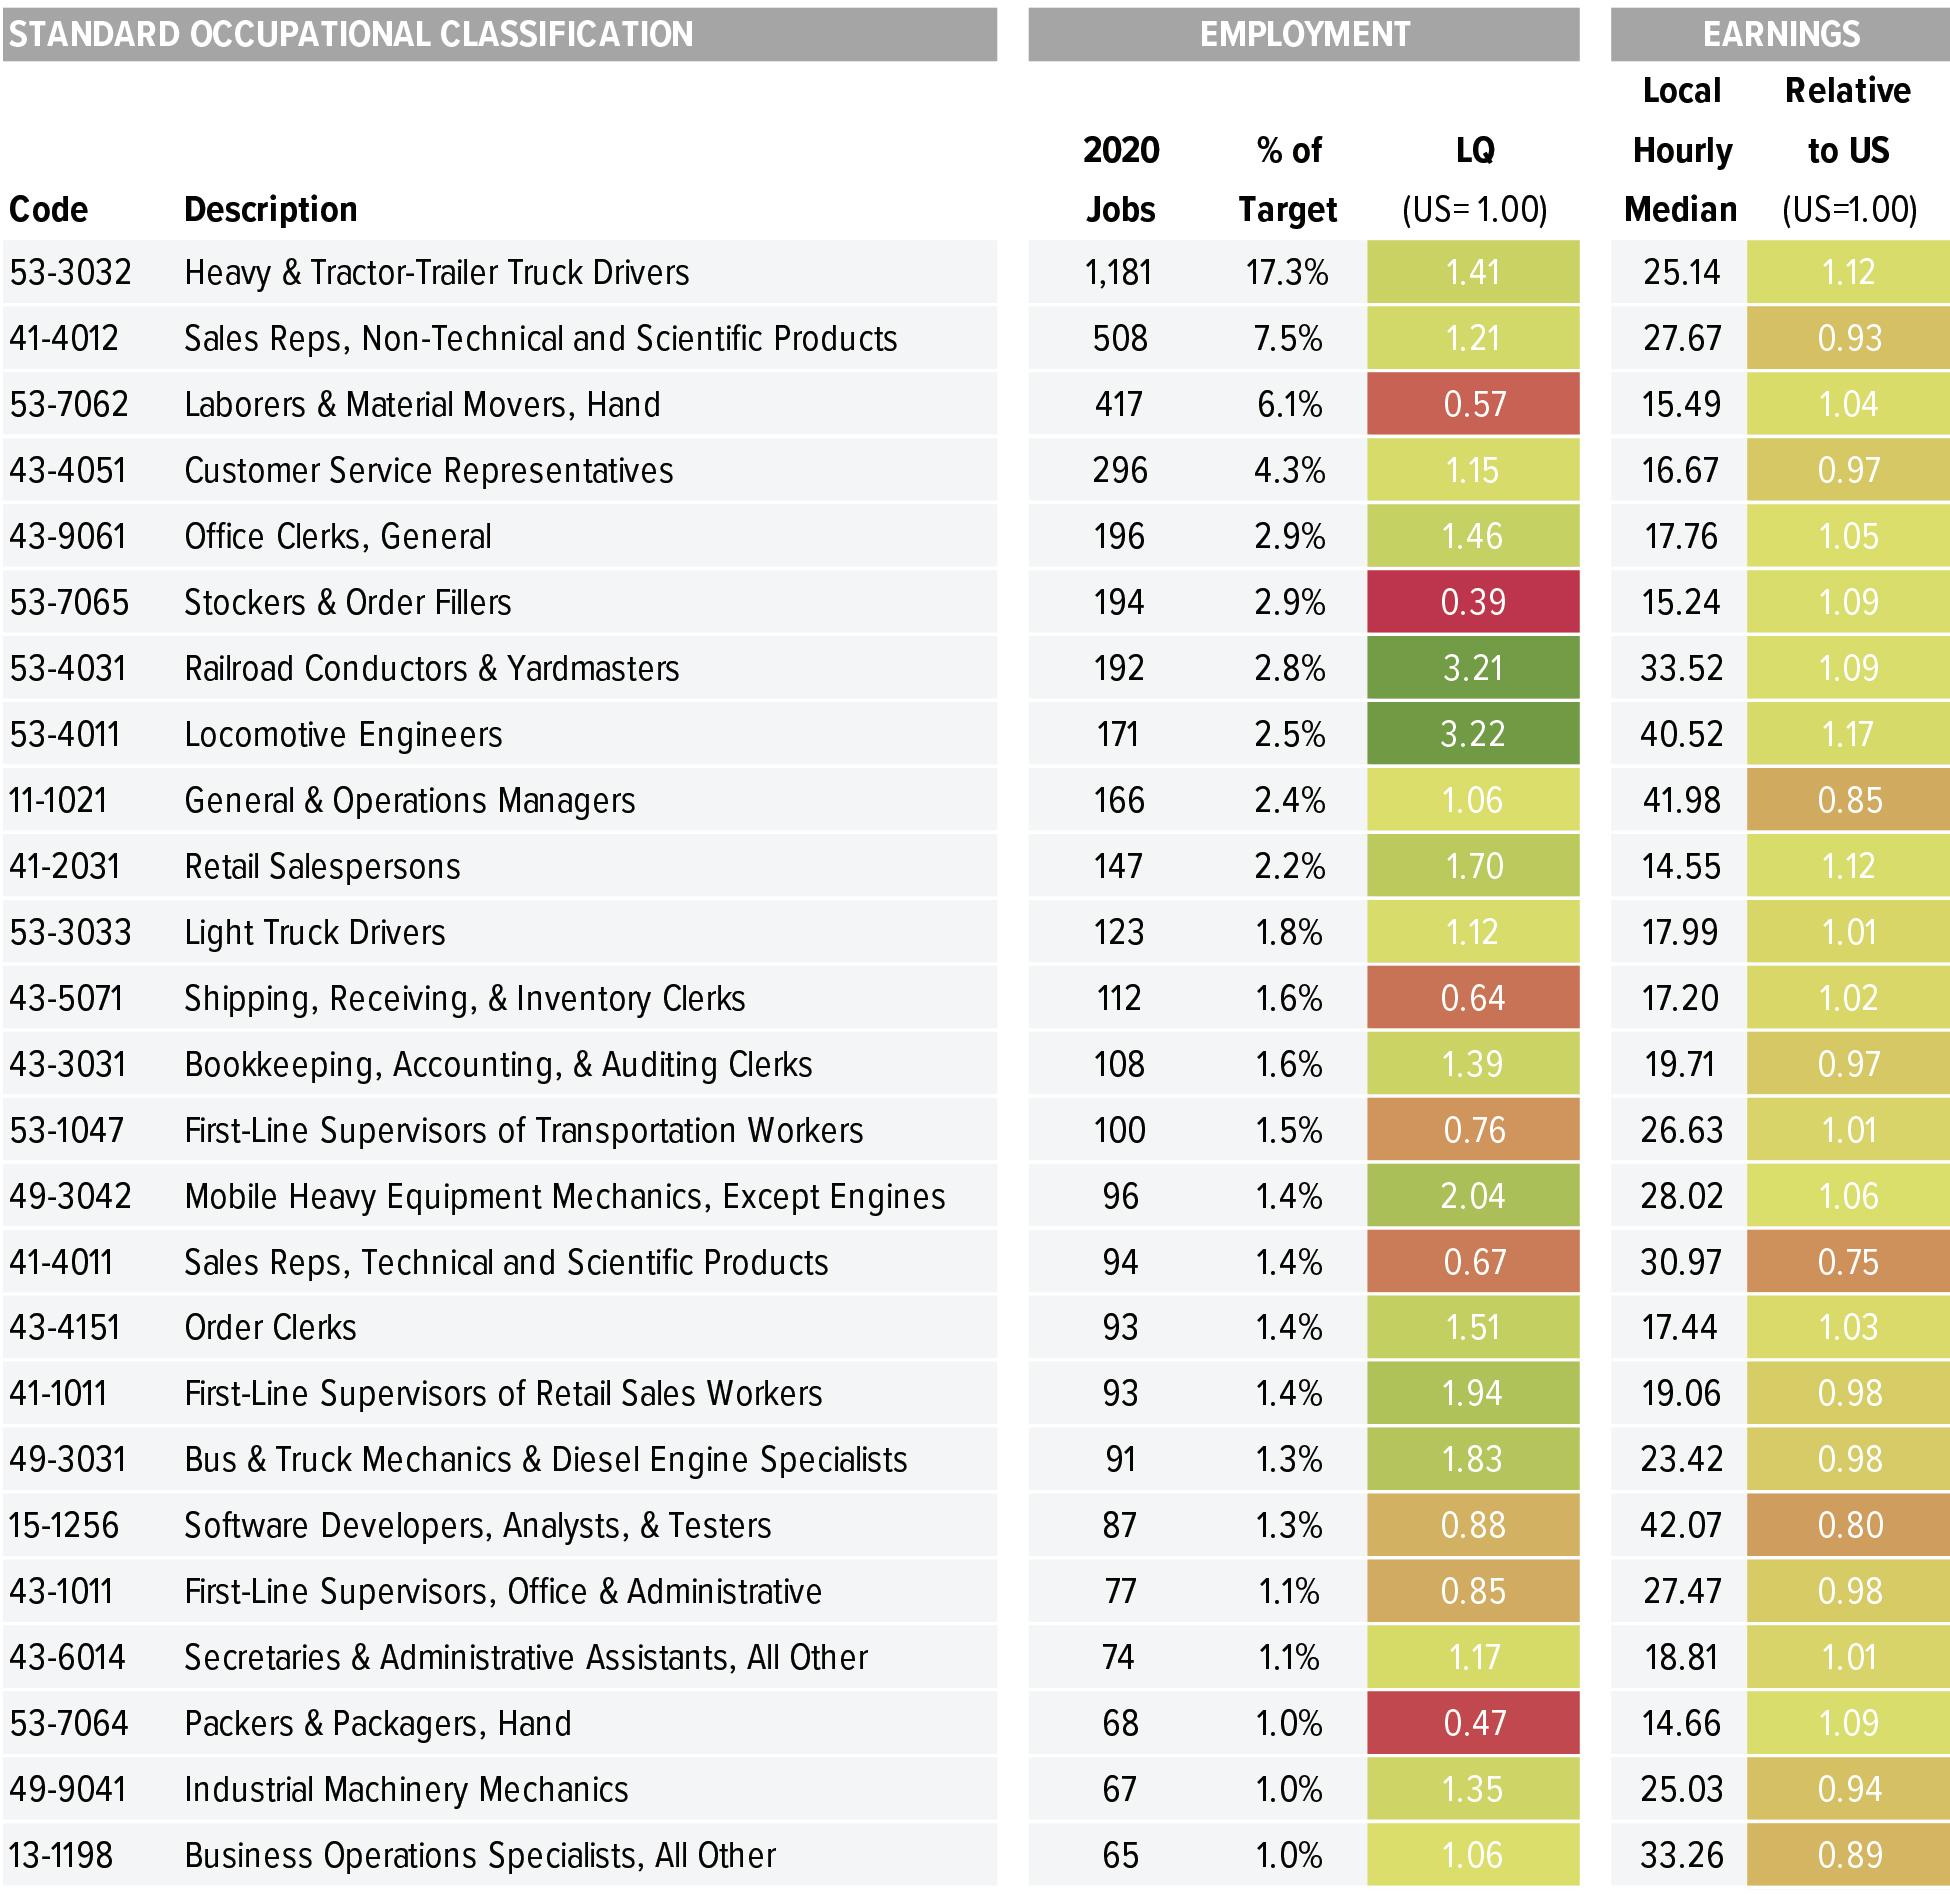
