24 minute read
ECONOMIC CONTEXT

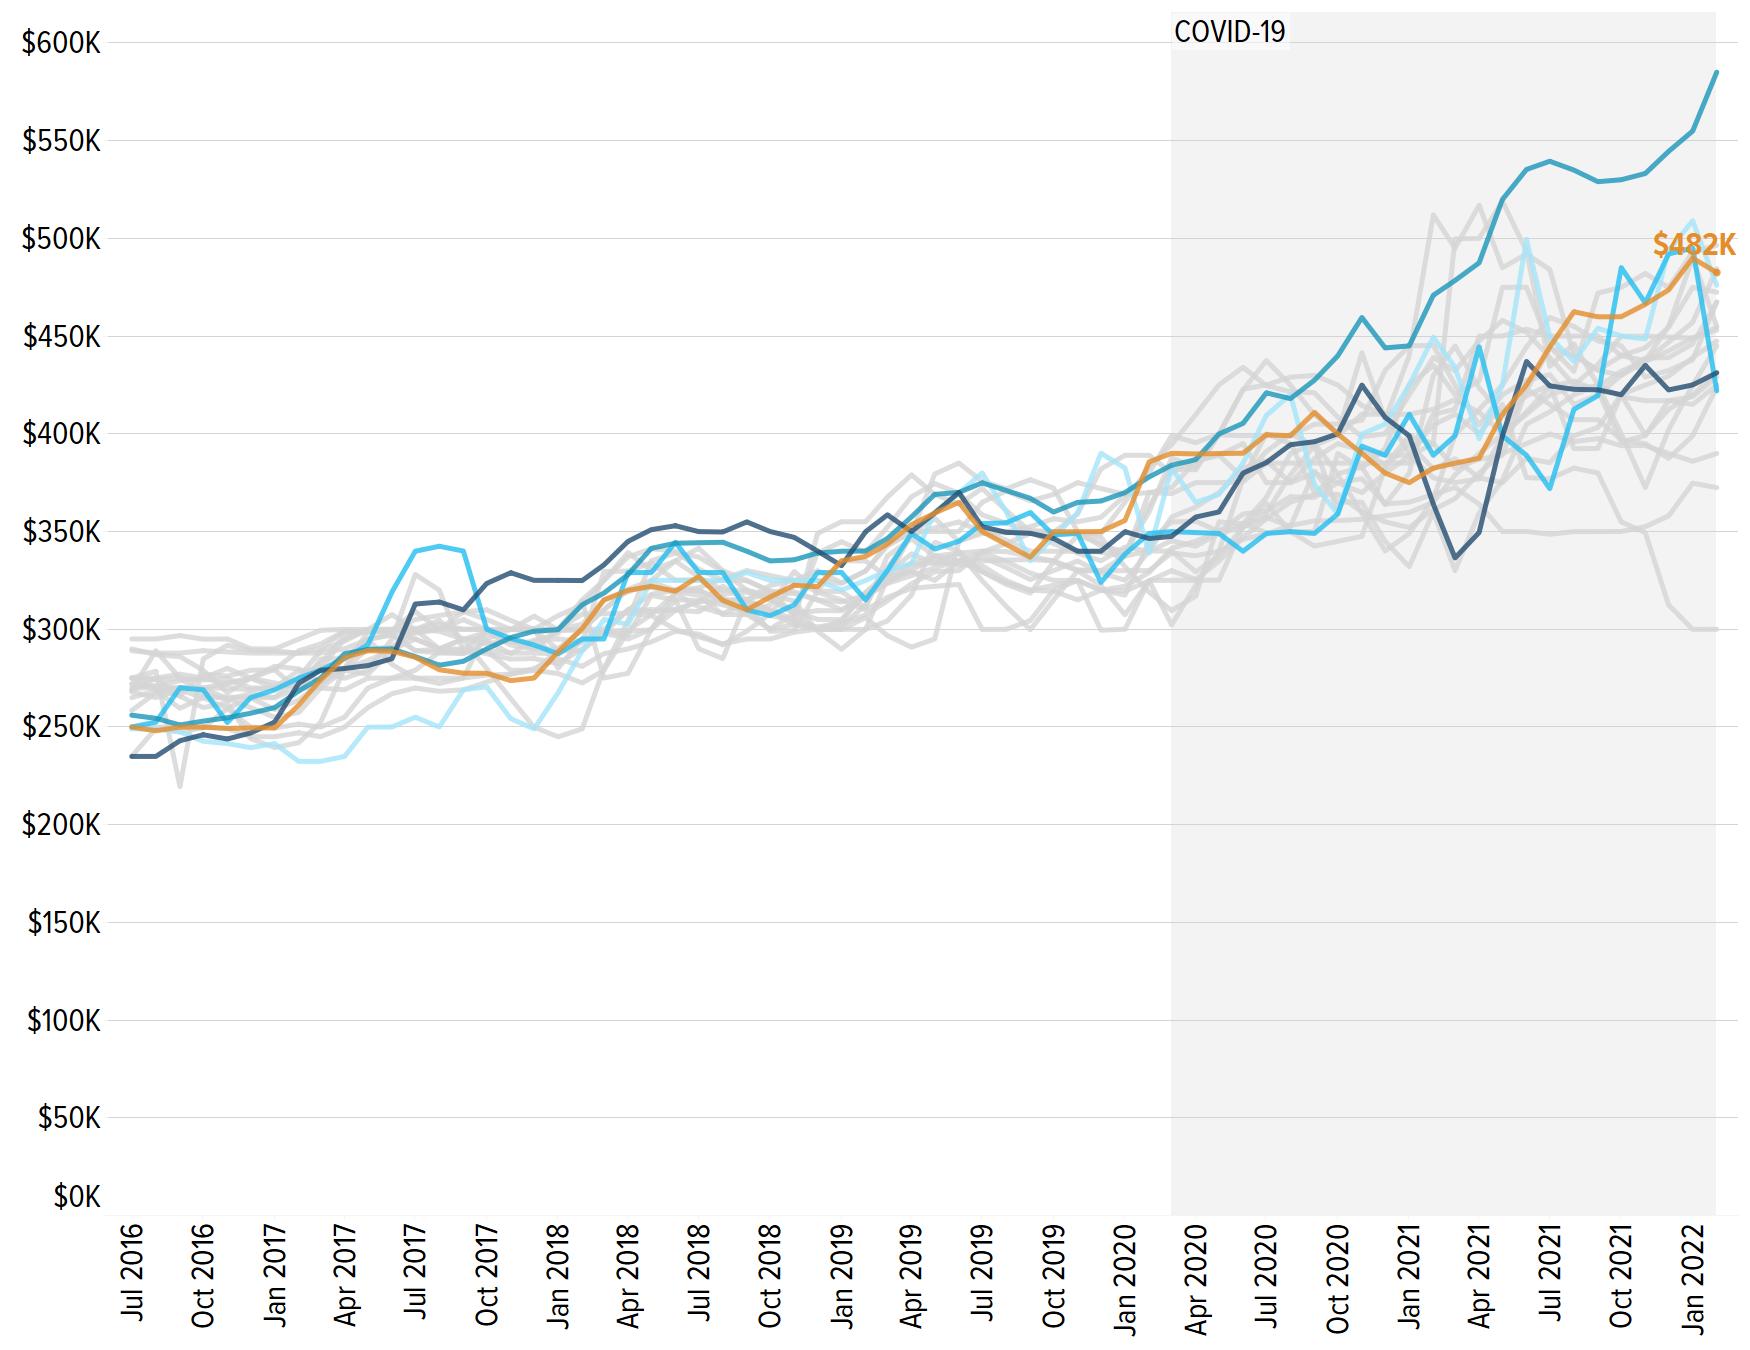
FIGURE 4. MEDIAN LISTING PRICE TRENDS OF MLS-LISTED FOR-SALE HOMES
WITH COMPARISONS TO METRO AREAS WITHIN 10 PERCENT OF SPOKANE’S MEDIAN LISTING PRICE FOR AT LEAST THREE-QUARTERS OF THE MONTHS MEASURED. ■ Spokane-Spokane Valley, WA ■ Albany, OR ■ Boise City, ID ■ The Dalles, OR ■ Walla Walla, WA ■ Other similarly priced metro areas
Advertisement
Sources: National Association of Realtors, Realtor.com, residential listings database; TIP Strategies, Inc. Notes: Metro areas were defined as similarly priced if the median listing price of homes for sale on the multiple listing service (MLS) was within 10 percent of values in the Spokane metro area across at least three-quarters of the months analyzed. The similarly priced metros represented by gray lines include the following: Atlanta-Sandy Springs-Roswell, Georgia; Chico, California; Crescent City, California; Fernley, Nevada; Grand Junction, Colorado; Kingston, New York; Laconia, New Hampshire; Merced, California; Morehead City, North Carolina; Nogales, Arizona; Red Bluff, California; Richmond, Virginia; Salisbury, Maryland-Delaware; Show Low, Arizona; Trenton, New Jersey; Worcester, Massachusetts-Connecticut; and Yuba City, California. Although Spokane County’s labor force of nearly 250,000 is relatively large, the County’s labor force participation rates in 2019 were a bit lacking at 60.8 percent compared to the state and national benchmarks of about 63 percent during that same time period (see Figure 5). County employment has grown consistently since 2011 and surpassed pre-Great Recession (2007–2009) levels in 2016. The COVID-19 recession led to widespread employment contractions, but the effect was relatively smaller in Spokane County (a 3.6 percent decrease) compared to the Great Recession (4.3 percent) and compared to statewide and national declines.
Residents in the Spokane region have higher overall education rates, but average income levels.
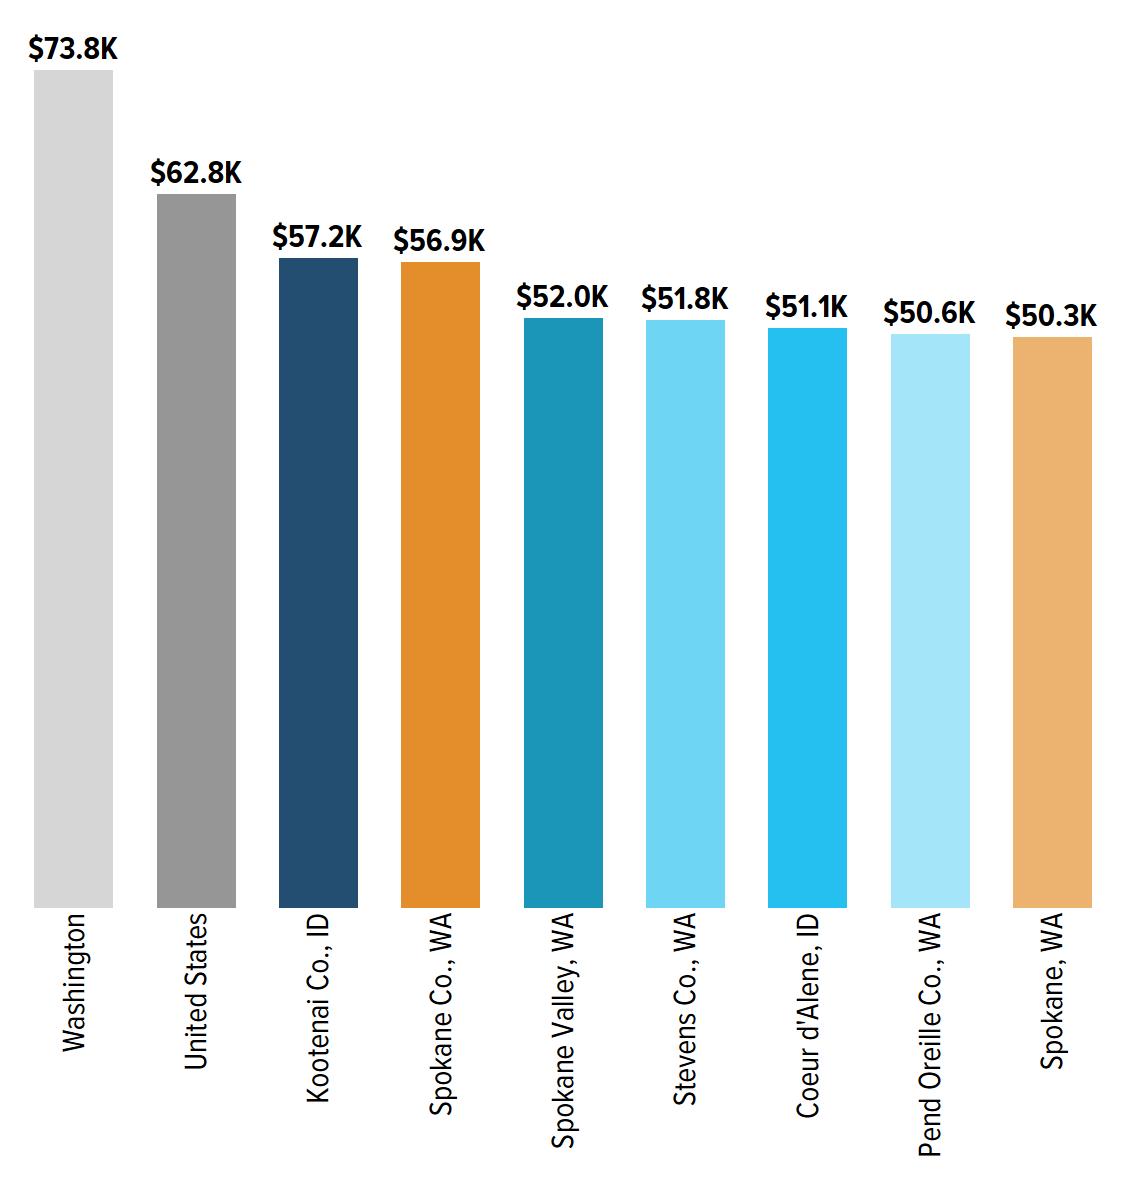
Though more than 84 percent of Spokane’s population identifies as White, the County tends to be more diverse than neighboring regions, though less so than Washington State overall. Spokane County also tends to have more educated residents with at least 31 percent holding a bachelor’s degree or more, though this is slightly below state and national levels (see Figure 6, page 12). However, higher educational attainment may not have translated into higher wages as the median household in Spokane County sits below the national median and only slightly above its rural neighbors (see Figure 7, page 12). Moreover, the County has an elevated federal poverty rate at 13.7 percent of the population, compared with only 10.8 percent for the state.
FIGURE 5. LABOR FORCE DETAIL, 2019
LABOR FORCE SIZE, LABOR FORCE PARTICIPATION RATE, AND UNEMPLOYMENT RATE FOR SELECTED GEOGRAPHIES.
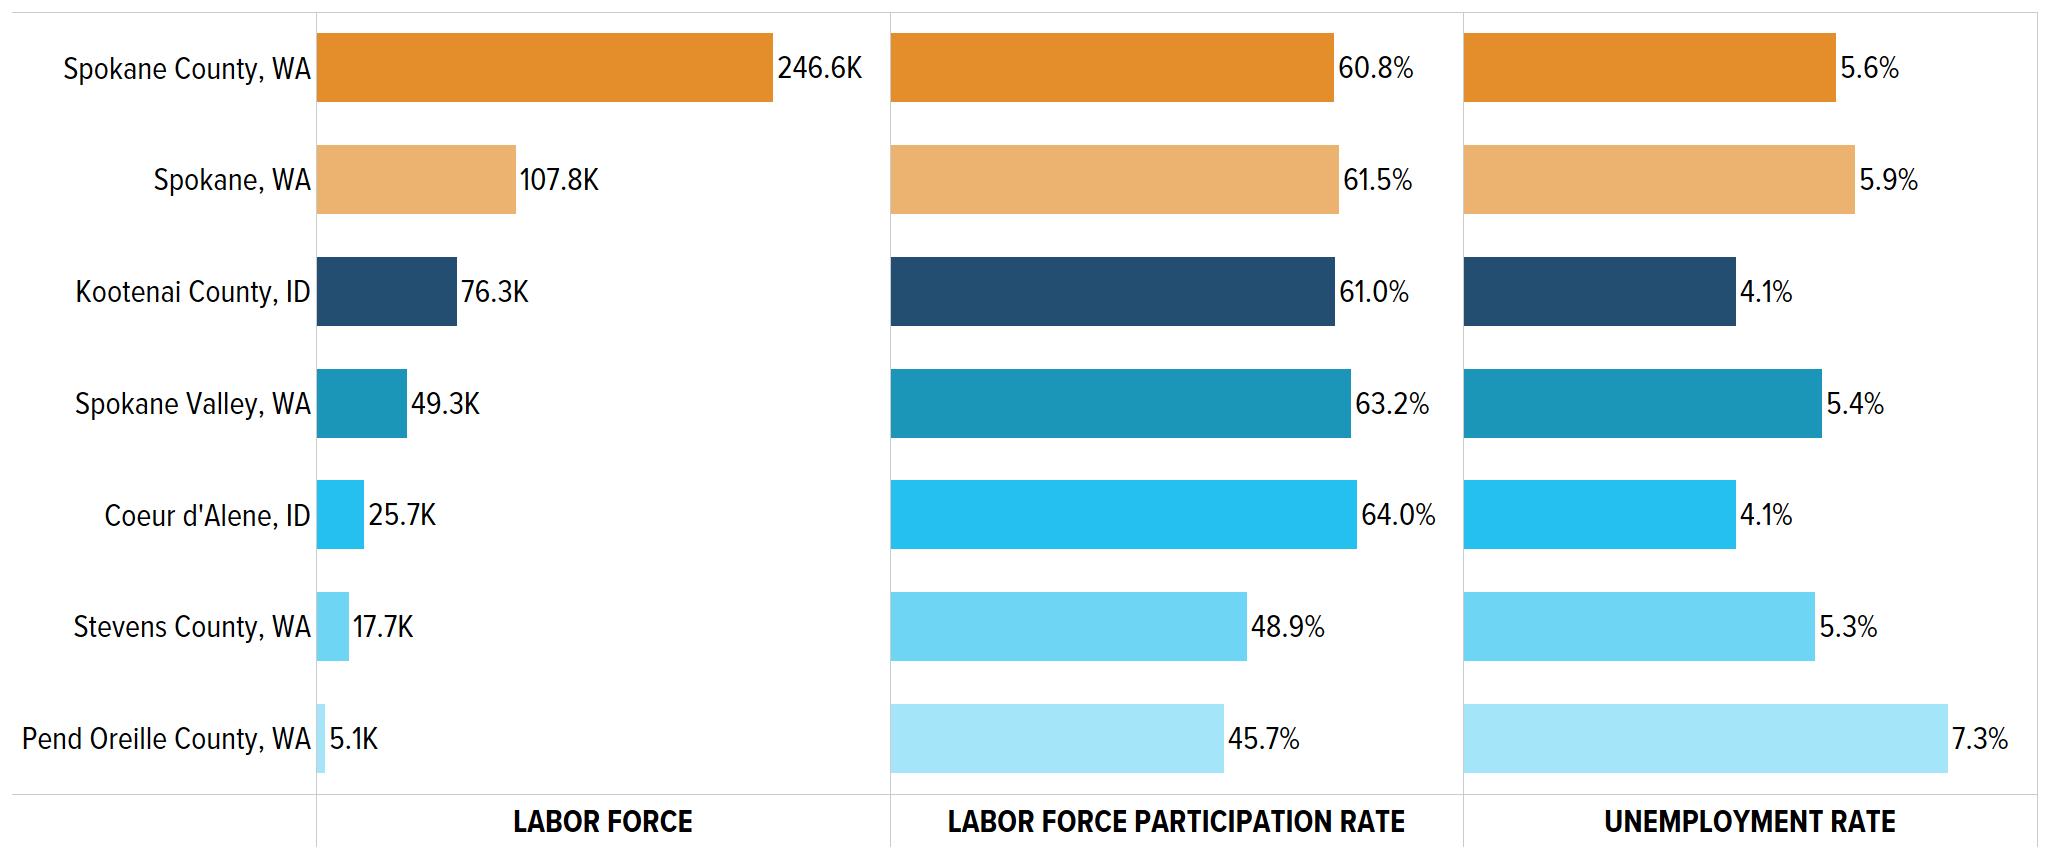
Sources: American Community Survey, 2019 five-year sample; TIP Strategies, Inc. Note: Labor force participation rate (LFPR) is estimated as the quotient of the civilian labor force and the population 16 years and older. The labor force comprises all employed and unemployed persons.
FIGURE 6. EDUCATIONAL ATTAINMENT, 2019
POPULATION (25 AND OLDER) BY SHARE OF EDUCATIONAL ATTAINMENT.

Sources: American Community Survey, 2019 five-year sample; TIP Strategies, Inc. Notes: Educational attainment only measured for population 25 years and older. High school includes equivalency. Some college indicates no degree was received. Graduate degree includes professional degrees and doctoral programs. Totals may not sum to 100 percent due to rounding.
Stable trends point to a strong healthcare sector as manufacturing gradually declines.
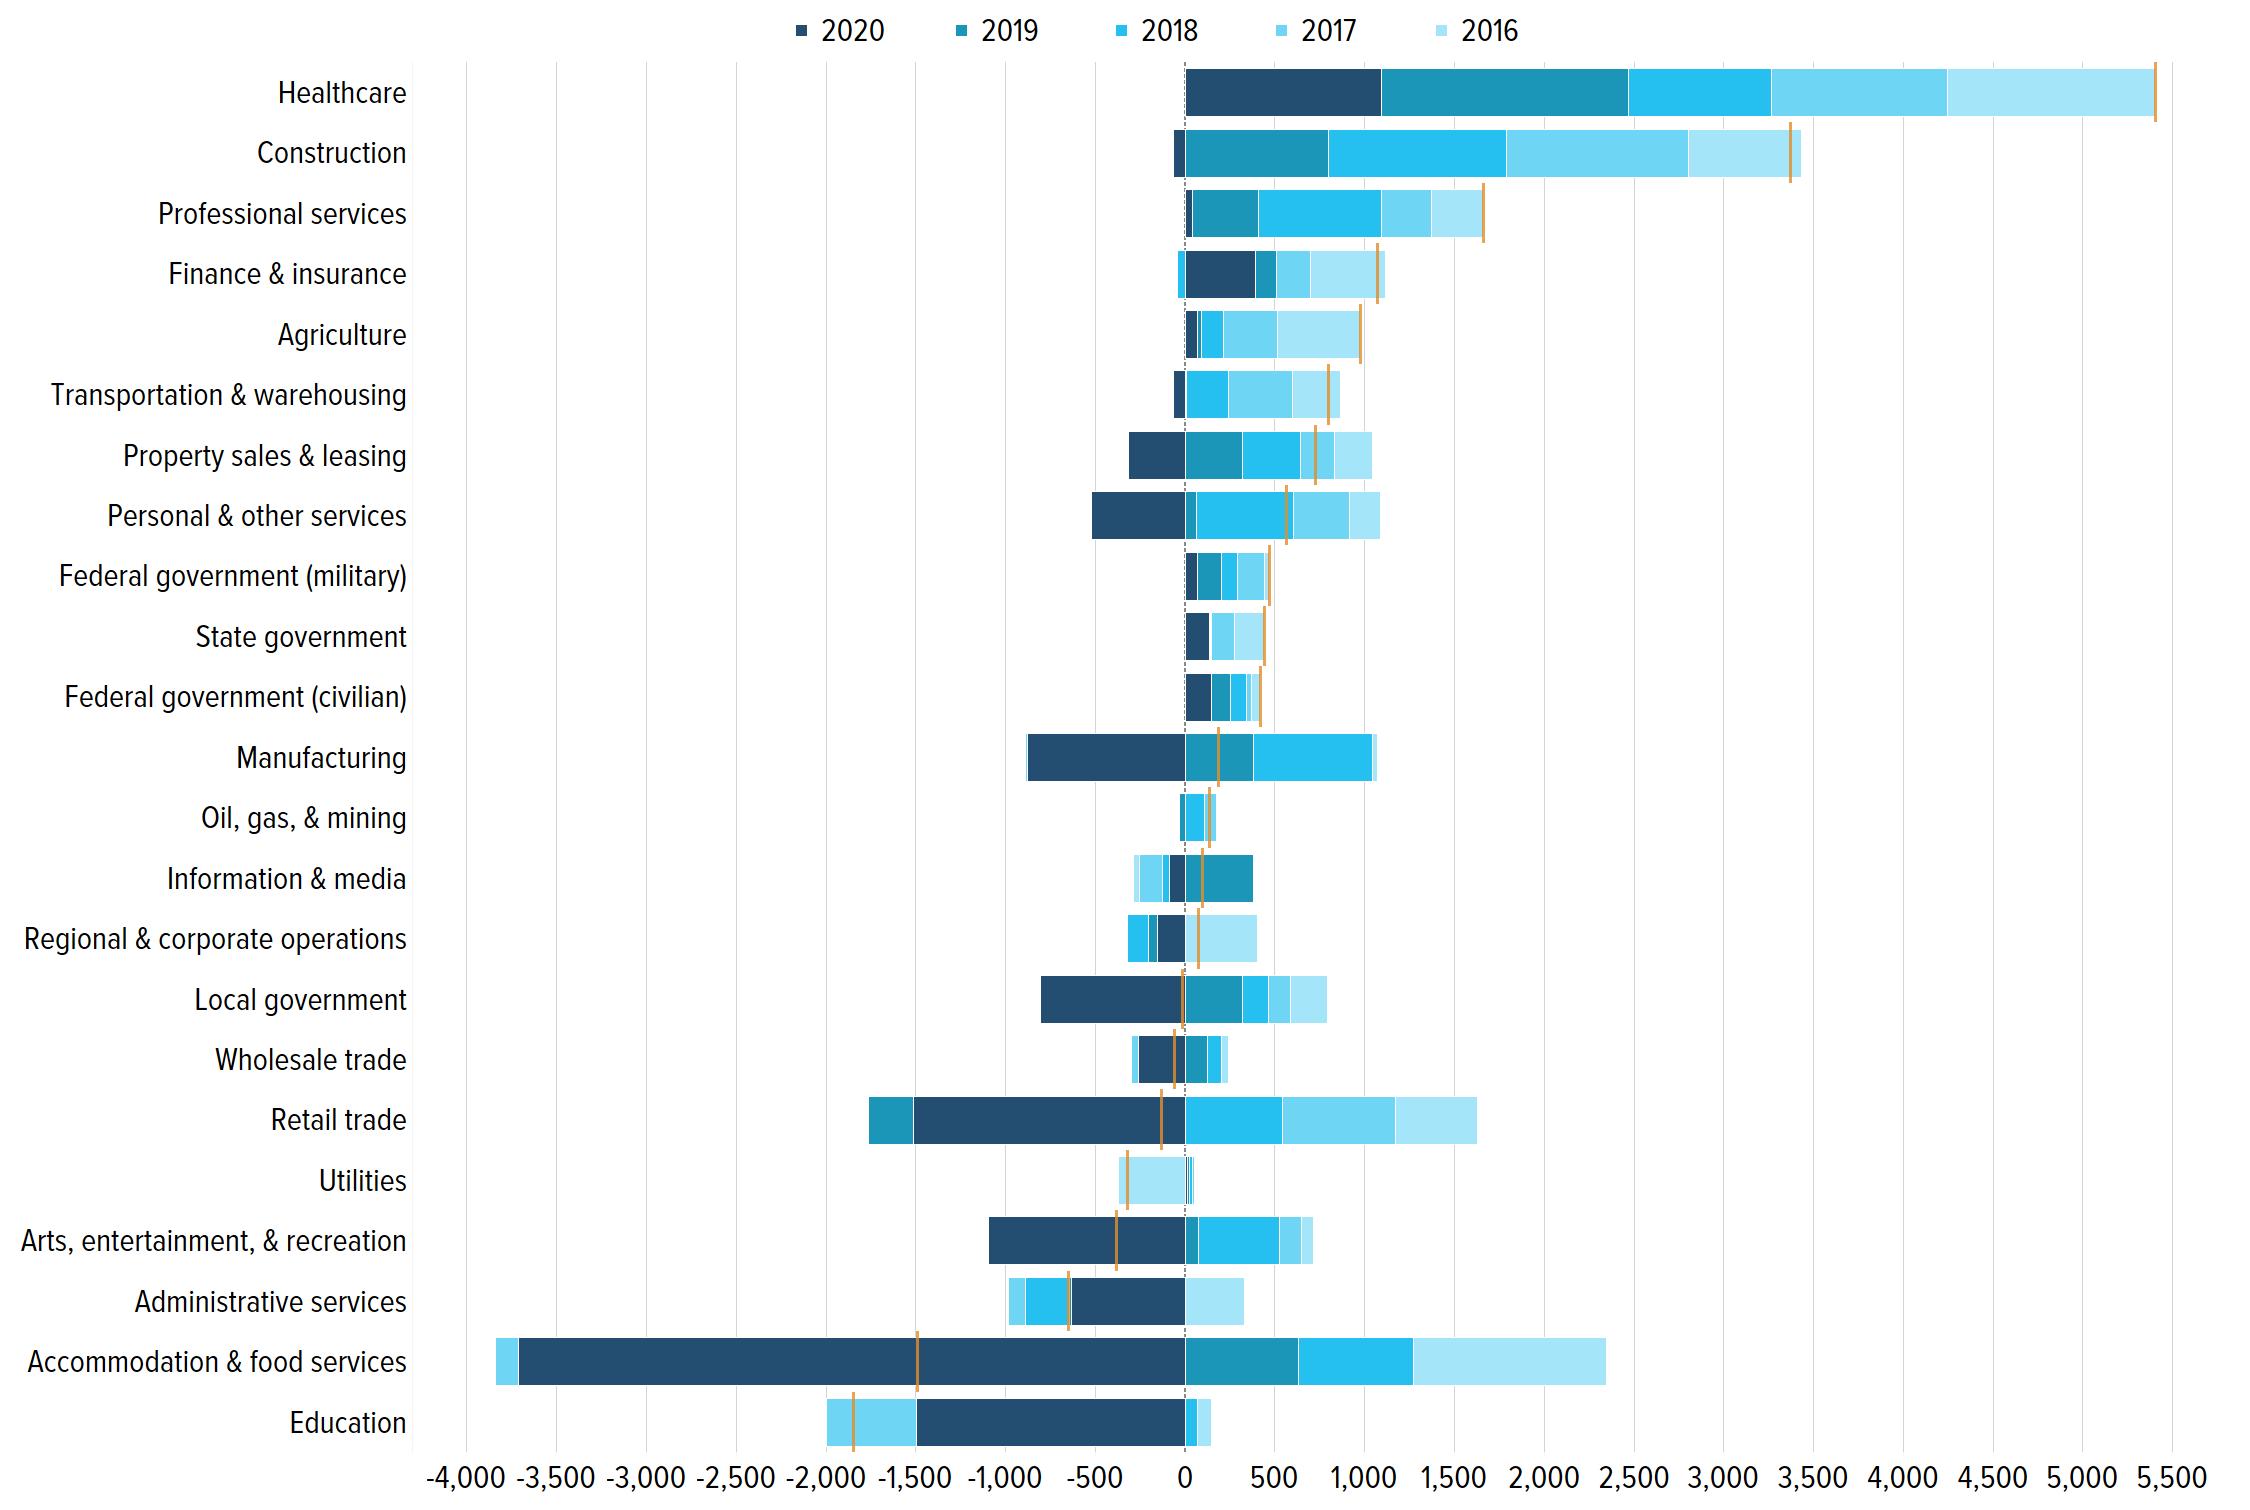
Healthcare continues to be the largest employer sector in Spokane County with over 46,000 jobs in 2020—more than 18 percent of total employment. Growth in this sector has been steady over the past 20 years and is on track with state trends and even slightly outpacing national growth. Though the manufacturing sector stabilized after 2008 and has experienced modest gains since 2010, the long-term trend is still downward, declining by more than 21 percent in the past 20 years. The retail, accommodation and food services, and education sectors are all major employers in Spokane County and were steadily rising through the end of 2019. However, these sectors saw substantial losses during the COVID-19 recession, shedding a combined total of over 6,700 jobs in 2020 (see Figure 8, page 13). Sales workers, food preparation and serving workers, and instructors followed a similar pattern with significant reduction in jobs over the same period. Office and administrative workers—the largest occupational group in the County—also saw losses, but this occupation group appears to be on a longer-term gradual decline, as there are 3,100 fewer of these jobs in the County compared to 2015.
FIGURE 7. MEDIAN HOUSEHOLD INCOME, 2019
Sources: American Community Survey, 2019 five-year sample; TIP Strategies, Inc. Sources: BLS; Emsi 2021.3—Quarterly Census of Employment and Wages (QCEW) Employees, Non-QCEW Employees, and Self-Employed; TIP Strategies, Inc. Note: Orange bars indicate the total net change from 2016 to 2020.
With the threat of new COVID-19 variants, the Occupational Risk Tool provides a timely examination of occupations likely to be affected by public health and economic crises. The interactive data visualization, available at thrivespokane. org, explores occupational risk from two sources: the risk to personal health from COVID-19 and the economic risk from job or income loss. The two risk sources are used to plot a position for more than 700 occupations that illustrates the amount of risk to earning and health that residents may experience as a result of their jobs. The information can be mapped by ZIP Code and disaggregated across demographic groups and by individual occupations within major occupational groupings as well as by major industry sectors. While workers continue to face health risks associated with in-person work, communities that understand the pain points of their local labor force will be better equipped to respond effectively to the evolving needs of resident workers.
One in three workers living in the Spokane metro are in jobs with a high risk to earnings and to personal health.
One-third of all workers (33.7 percent, totaling over 266,000) living in the Spokane metropolitan area are in the highest risk quadrant with relatively high risk to personal health and earnings (see Figure 9). This share is just above the national rate of 31.1 percent and in the middle of the distribution among similarsized metro areas (those with 100,000 to 500,000 workers). A few of the largest occupations in the highest risk quadrant include food preparation and serving workers, personal care aides, and waiters and waitresses.
Workers in low-wage jobs face disproportionately higher risks to both their earnings and health.
Risk is also disproportionately distributed among low-wage jobs. While 48 percent of jobs in the region pay less than $20 per hour, these jobs comprise 70 percent of jobs with the highest level of risk to both earnings and personal health. Often, Black, Indigenous, and people of color (BIPOC) are disproportionately employed in these low-wage jobs. Not only are BIPOC populations more likely to be employed in jobs with greater exposure to risks, but they are also earning less in those jobs.
Risk is not evenly distributed throughout the region.
An analysis of occupational risk by ZIP Code shows that some areas of the Spokane metro have higher shares of at-risk workers than other areas (see Figure 10, page 15). More than 20 percent of worker residents in the northern reaches of Pend Oreille County, as well some areas on the north side of the City of Spokane, may experience high personal health and earnings risks, as these areas have relatively high concentrations of food service, sales, or administrative occupation workers. In contrast, downtown Spokane has the highest share of low-risk resident workers (10.9 percent) in the metro with a relatively large number of lower risk business and management occupations.
FIGURE 9. EMPLOYMENT SHARE BY RISK QUADRANT
SHARE OF RESIDENT WORKERS BY THEIR OCCUPATION’S QUADRANT ON THE RISK PLOT. RISK TO EARNINGS AND HEALTH WITHIN A QUADRANT VARY BY OCCUPATION.
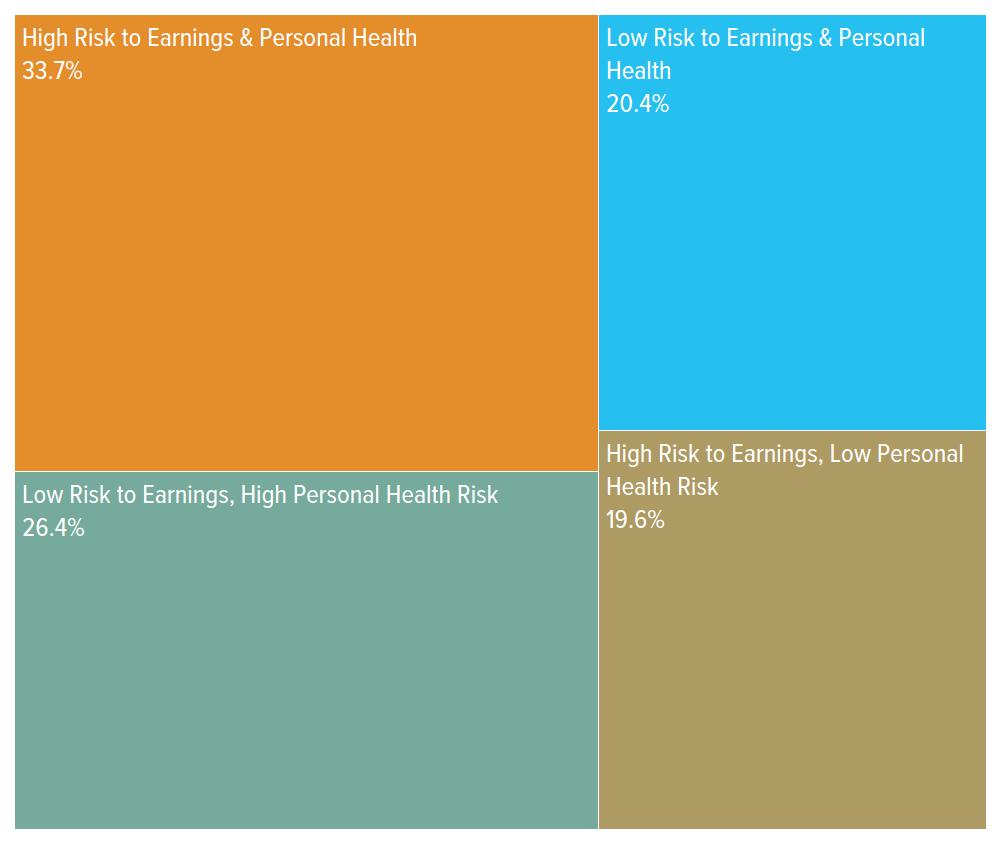
Sources: US Department of Labor Occupational Information Network (O*NET); ACS 2018 five-year sample via Integrated Public Use Microdata Series (IPUMS); Emsi 2021.2—QCEW Employees, Non-QCEW Employees, and SelfEmployed; Charles S. Gascon and Devin Werner. “COVID-19 and Unemployment Risk: State and MSA [metropolitan statistical area] Differences.” Federal Reserve Bank of St. Louis. (April 3, 2020); TIP Strategies, Inc. Notes: Only detailed occupations with more than 10 resident workers in the region are included. Unemployment is by occupation group (2-digit Standard Occupational Classification, SOC). Selected occupations’ “essential” and “salary” indicators have been modified from their initial designations by the Federal Reserve Bank of St. Louis.
FIGURE 10. OCCUPATIONAL RISK MAP
HIGH RISK TO EARNINGS AND PERSONAL HEALTH Share (percentage) of workers in their resident ZIP Code in occupation with high risk to earnings and high risk to health. Darker ZIP Codes have higher shares. LOW RISK TO EARNINGS AND PERSONAL HEALTH Share (percentage) of workers in their resident ZIP Code in occupation with low risk to earnings and low risk to health. Darker ZIP Codes have higher shares.
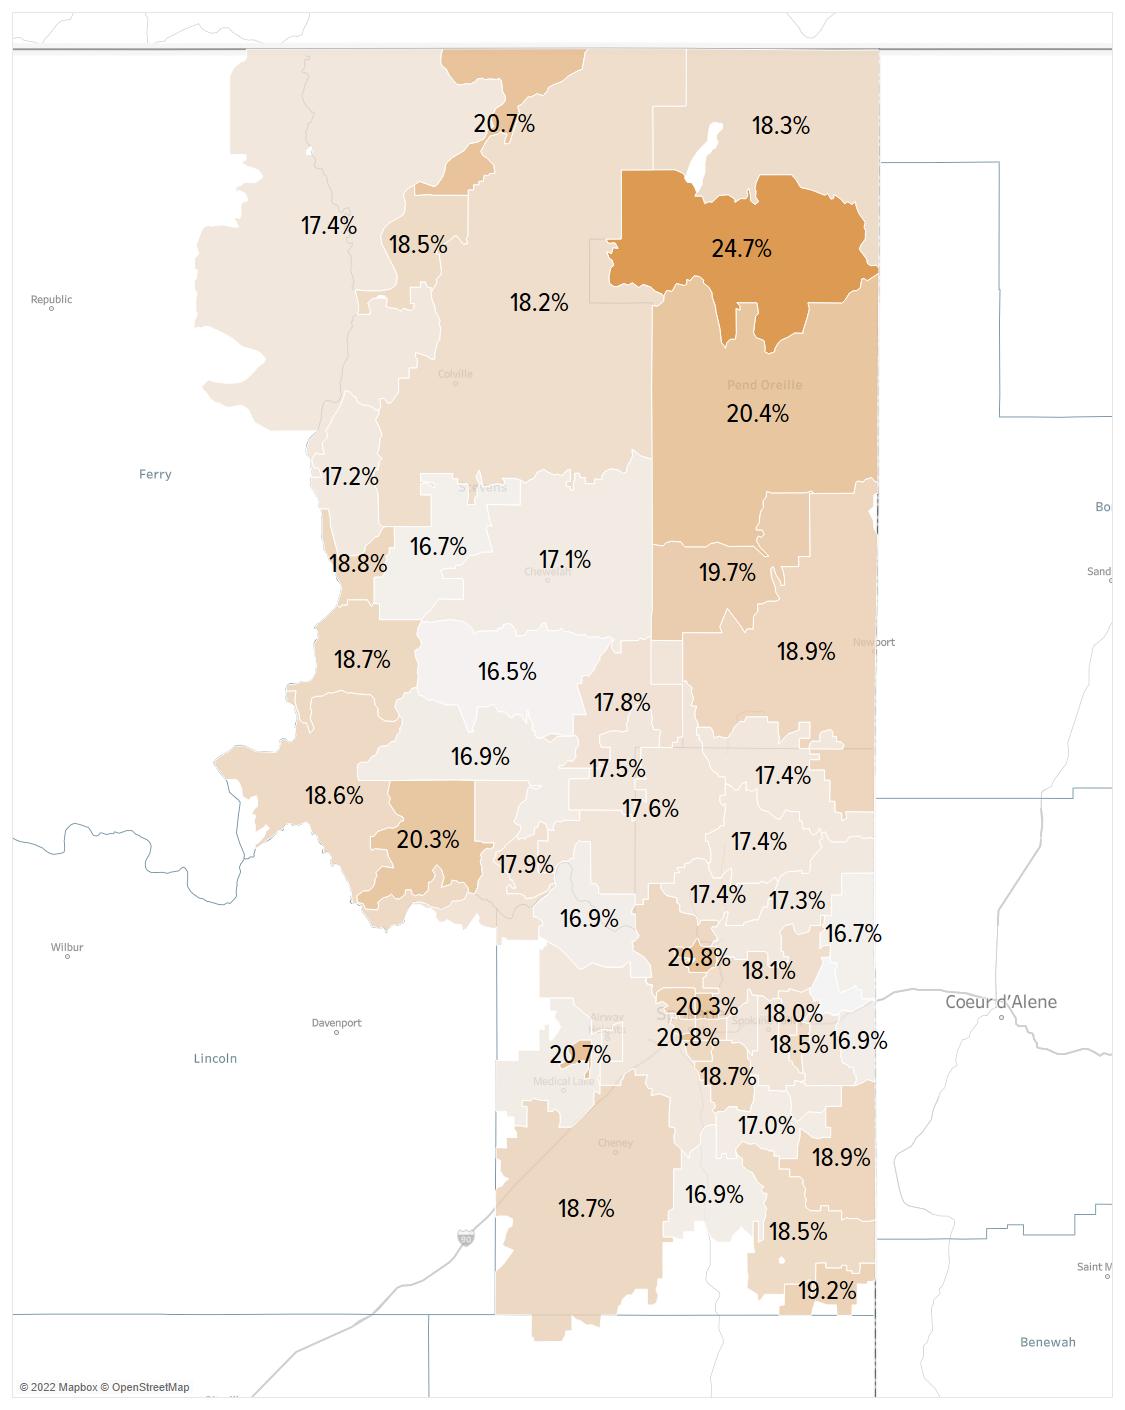
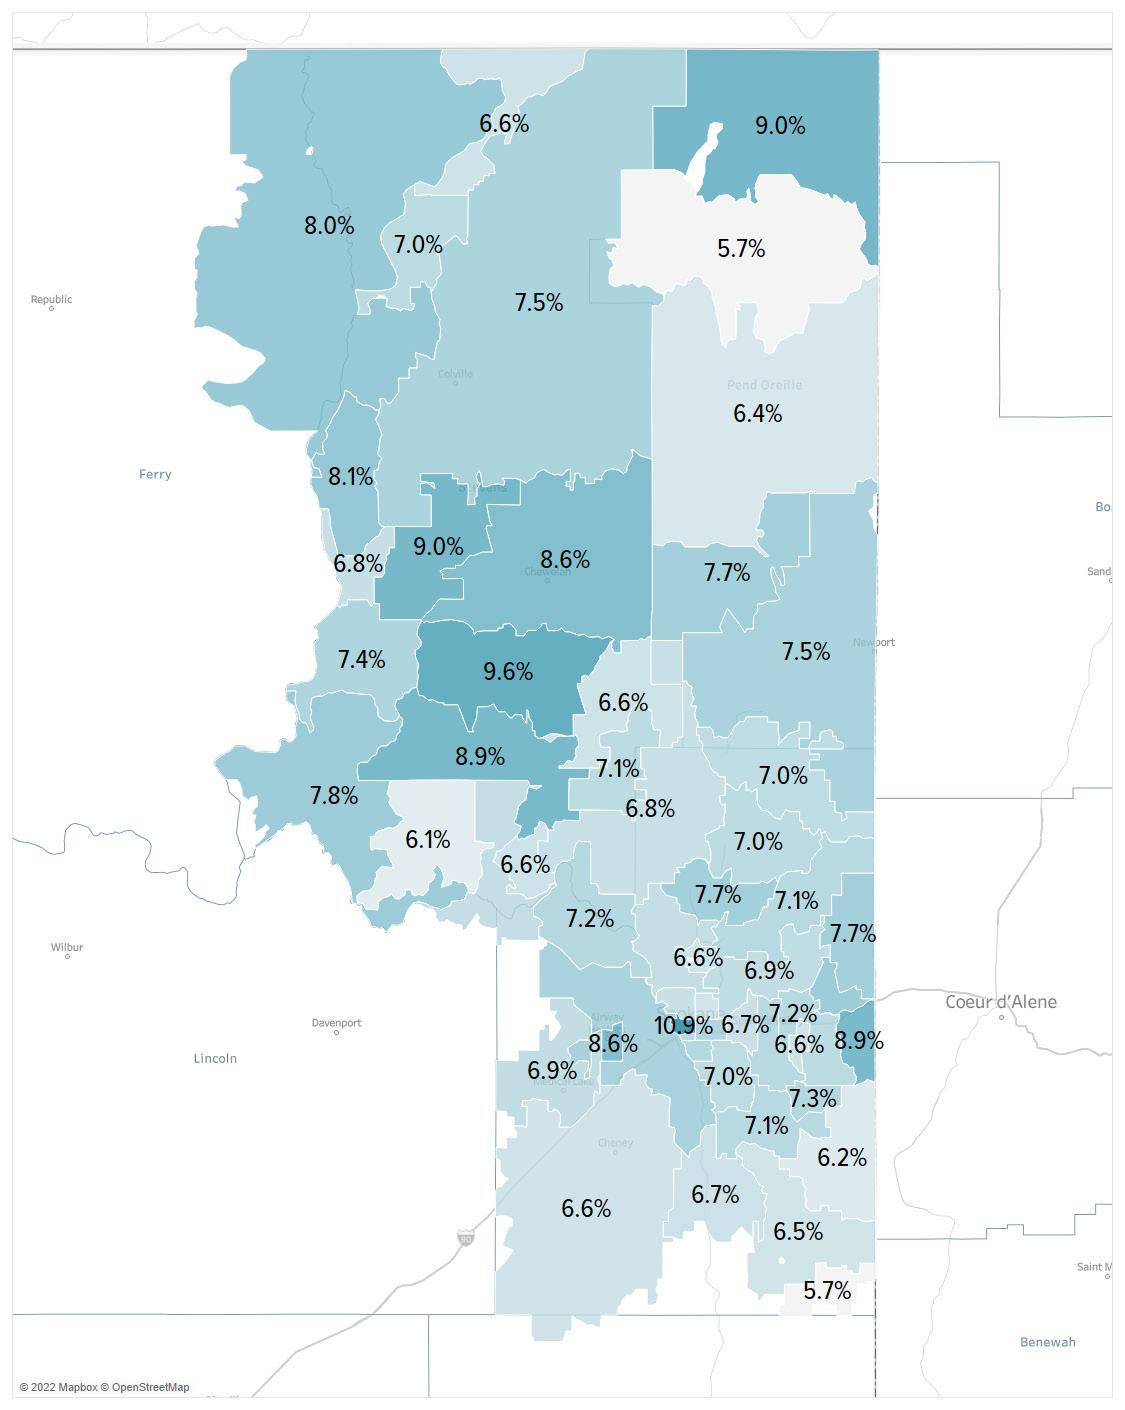
Sources: US Department of Labor (O*NET); ACS 2018 five-year sample via IPUMS; ACS 2019 five-year sample; Emsi 2021.2—QCEW Employees, Non-QCEW Employees, and Self-Employed; Gascon and Werner. “COVID-19 and Unemployment Risk”; TIP Strategies, Inc. Notes: Only ZIP Codes with at least 50 total resident workers and at least 1 resident worker matching the selection criteria are shown (PO boxes or other single-address ZIP Codes are also excluded). Only detailed occupations with more than 10 resident workers in the region are included. In risk score calculations, unemployment by occupation group (2-digit SOC) is used, and selected occupations’ “essential” and “salary” indicators have been modified from their initial designations by the Federal Reserve Bank of St. Louis.
Following an analysis of quantitative, qualitative, and strategic factors, six sectors were identified as target industries for business development. These six sectors not only have a strong presence in the Spokane region, but also throughout Washington State, in addition to demonstrating growth potential. Industries within the target sectors include both local and traded cluster businesses, as well as businesses of all sizes, from micro enterprises to the region’s largest employers. (See page 40 for a discussion of local and traded clusters.)
Occupations within the target clusters also tend to have higher-than-average wages, which offer opportunities to increase equity across the region by investing in skills-based workforce development. Cluster development efforts, including investments in workforce, supply chain development and local materials sourcing, and business growth and recruitment, are critical for future economic growth. Furthermore, the role of technology and innovation must be considered in industry development efforts, as they cut across all sectors. Strategies to fuel growth and investment are included in the CEDS. The full target sector analysis can be found in Appendix A.
FIguRE 11. THRIVE SPOKANE TARGET SECTORS
AEROSPACE AND AVIATION
AGRIBUSINESS

HEALTH AND LIFE SCIENCES
MANUFACTURING AND MATERIALS
ENERGY INFRASTRUCTURE AND TECHNOLOGY
LOGISTICS
COMMUNITY ENGAGEMENT
With guidance from THRIVE Spokane Steering Committee members, intentional inclusivity was the focus of the plan’s community engagement process. The cornerstone for these activities was a series of roundtable discussions. The steering committee helped develop a targeted list of area experts and regional leaders to gather input on challenges and opportunities for the CEDS. Roundtables were organized by topic, including sector-focused discussions, as well as sessions centered on broad issues and programmatic areas. The roundtable discussions were supplemented with one-on-one interviews to solicit feedback on issues that did not surface in a collective setting.
While most roundtable discussions took place over 60 minutes, the importance of diversity, equity, and inclusion warranted a two-hour workshop that provided a space for a human-centered listening session and deepened relationships across the community. The workshop laid the foundation for stronger partnerships and created additional opportunities for BIPOC organizational leaders to shape key components of the CEDS, including the co-creation of strategies and actions specific to the needs of BIPOC business owners and communities. Although there is still work to be done to build trust throughout the community, this discussion was an important first step in that process.
Surveys also provided the public the opportunity to shape THRIVE Spokane without scheduling constraints. A community vision survey generated nearly 1,000 responses and input from a wide range of diverse voices. The success of this survey is due, in part, to a targeted digital campaign to reach underrepresented demographic groups and geographies. Survey responses were disaggregated to compare responses across different demographics and geographies, and insights from the data were used to craft the THRIVE Spokane vision statement.
Two other surveys targeted toward regional business leaders in the aerospace industry and the health and life sciences industry helped to gather industryspecific insights. With the growing importance of both industries in the region, these survey data were used to bolster THRIVE Spokane’s strategies around leveraging industry synergies and building a resilient supply chain.
A marketing campaign supported outreach for THRIVE Spokane and an associated media kit provided partners with logos, social media graphics, a press release, and several print articles. Greater Spokane Inc. also maintains a CEDS project website, thrivespokane.org, with background reports, presentations on the planning process, and information on ways to provide feedback.
SWOT ANALYSIS
The SWOT Analysis is the culmination of both qualitative and quantitative research outlined in the previous sections. Building on these findings and observations, TIP conducted a more extensive review of Greater Spokane’s strengths, weaknesses, opportunities, and threats (SWOT). The SWOT Analysis summarizes the Spokane region’s competitive position and highlights factors that differentiate the area from the competition. The diagrams in Appendix B summarize the results of the analysis. Items closer to the center of the graph are more local in nature. Those at the outer corners are influenced by state, national, or global trends, placing them largely outside local leadership’s control (see Figure 12).
FIGURE 12. SWOT ANALYSIS OVERVIEW DIAGRAM
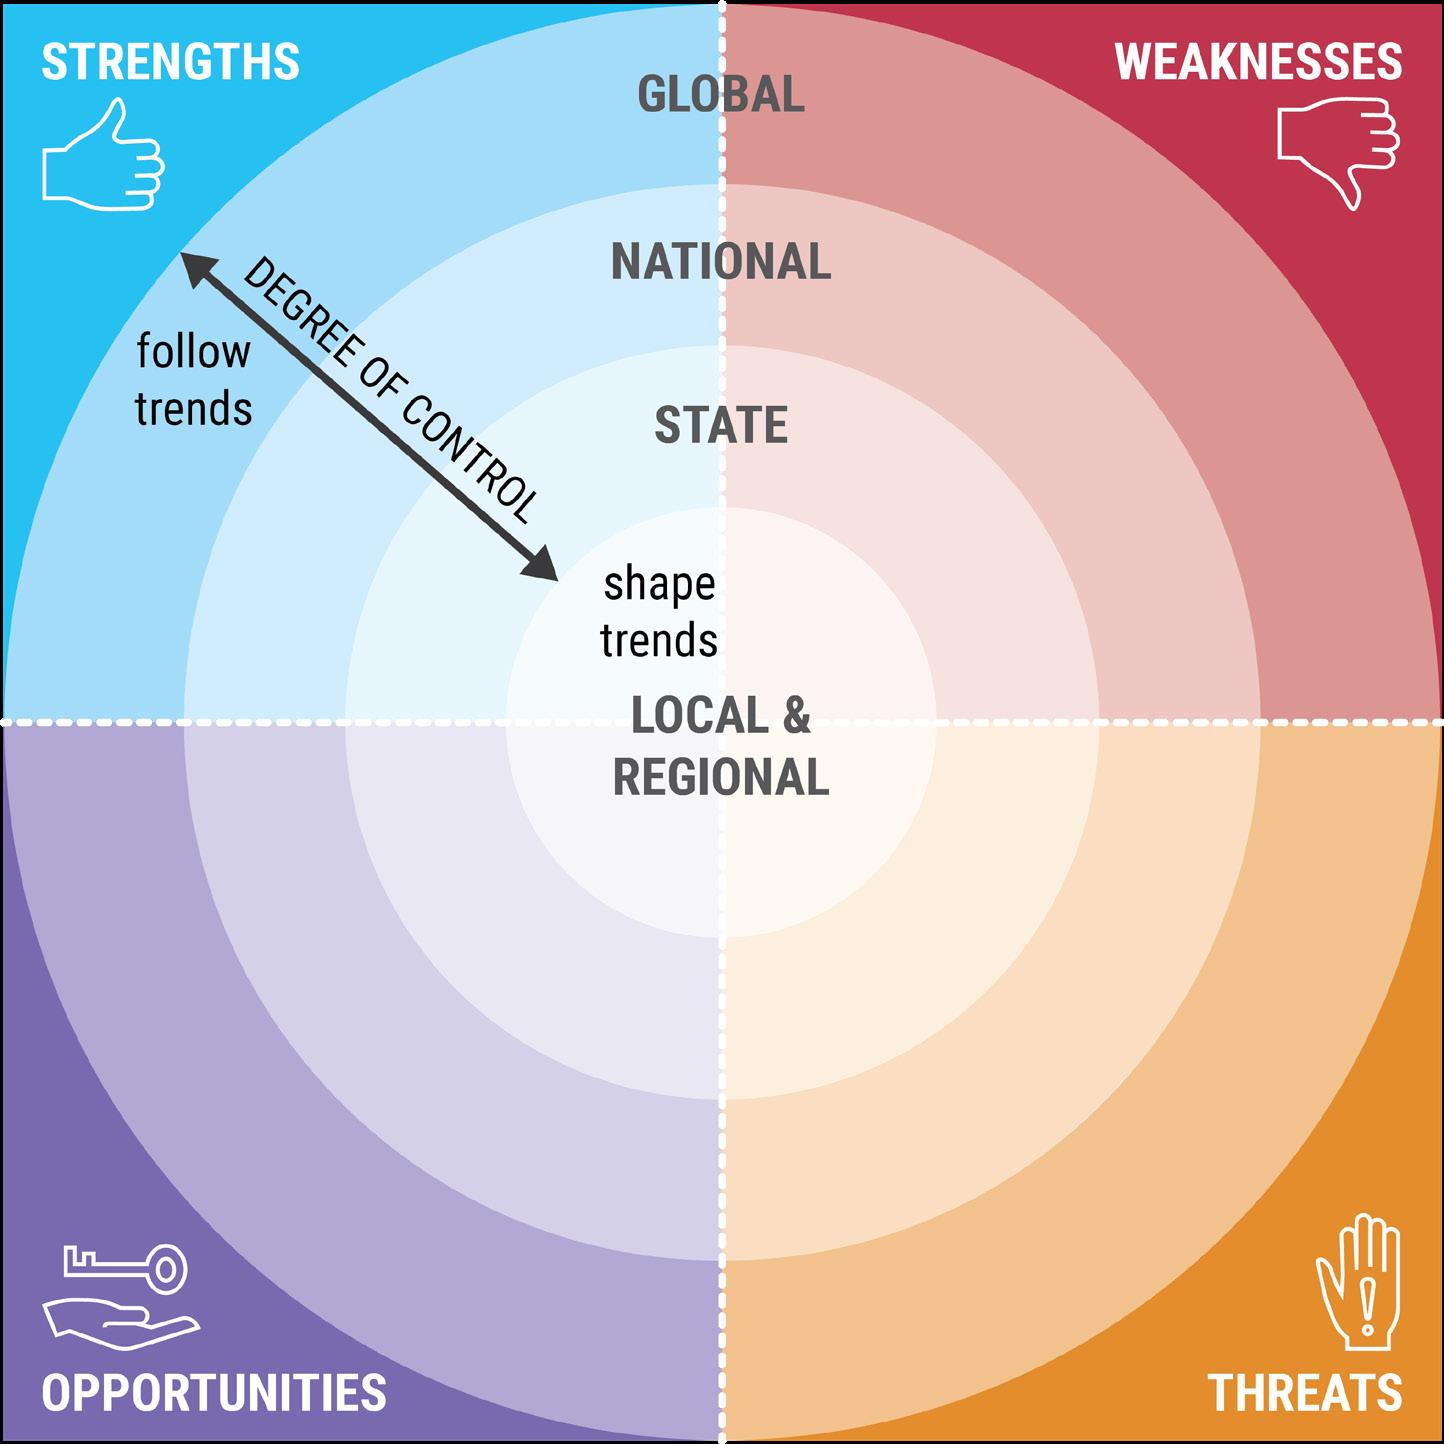
See Appendix B for detailed diagrams. While it is important to be aware of national and global trends, many of which have been accelerated by the COVID-19 pandemic, the focus should be on maximizing the Spokane community’s strengths and opportunities. Nearly every strategy and action in the plan is supported by findings from this analysis.
Image of Furguson's Cafe in the Garland Districct courtesy of Visit Spokane

ACTION PLAN
Image of Spokane cityscape at night by Nick Brommer courtesy of Visit Spokane
GOAL 1. RECOVERY AND RESILIENCE
Target efforts that prepare the region to avoid, withstand, and recover from economic shocks and natural disasters.

Image of Spokane in Winter courtesy of Visit Spokane Greater Spokane’s economic prosperity is directly linked to its ability to avoid, withstand, and quickly recover from major disruptions to its economic base. Whether it be natural disasters or economic shocks like those experienced at the onset of the COVID-19 pandemic, the region can strengthen its recovery efforts and bolster its long-term resilience through responsive and steady-state initiatives. Responsive initiatives reinforce and expand a region's capacity to respond following a shock. They include activities like establishing strong communication channels to understand business needs after an incident. Conversely, steadystate initiatives, are long-term strategies to withstand or avoid a shock altogether. These initiatives include creating redundancies in broadband networks to protect commerce channels or enhancing job-driven training for skills that are easily transferable across occupations and industries. Through the CEDS process, the Spokane community identified resilience as a top priority. With a pool of available federal funds and emerging technologies, the region is in a prime position to address modernizing infrastructure as well as social inequities, each of which influence an area’s ability to recover from disruption. With this commitment, the Spokane region can work toward building a flexible workforce, supporting business needs, and hardening infrastructure, among other initiatives outlined in this section, all of which can position the Greater Spokane economy for resilient growth.

STRATEGIES AND ACTIONS
1.1 Support a resilient local workforce by improving job-driven skill sets and reducing barriers to employment (see Action 3.5.3). 1.1.1. Engage business associations to inform the workforce system of emerging hiring trends, to address skill and opportunity shortages, and prepare workers for high-growth, high-demand jobs of the future. 1.1.2. Work with the Spokane Workforce Council to expand skill training opportunities to focus on transferable workforce skills so that workers can better shift between jobs or industries.
Example: In Clark County, Washington, the region’s associate development organization, the Columbia River Economic Development Council (CREDC), and Workforce Southwest Washington (WSW) are closely aligned partners. In addition to being co-located in one office, staff from both organizations come together for an annual retreat to develop cohesive strategic work plans. Joint business visits are also conducted for nearly every business recruitment and expansion meeting. Furthermore, the executive director of WSW has a permanent board seat on CREDC’s board and vis-à-vis. WSW is also a top-level investor in CREDC. 1.1.3. Expand wraparound investments to reduce barriers to employment, such as efficient routes to connect workers to employment centers, development of a diverse set of attainable housing options, broadband expansion to help remote workers complete their work effectively, or business support for early learning programs to extend childcare hours.
1.2 Focus on upstream opportunities to build a responsive and resilient supply chain to support the region’s target sectors. 1.2.1. Identify opportunities to nearshore or localize suppliers to shorten supply chains and reduce risk (see Action 2.3.2). 1.2.2. Coordinate local supply chain networking events to connect manufacturers, including raw materials suppliers, across the region. Ensure BIPOC businesses have the support and resources needed to attend these events (see Strategy 3.2 and Action 3.7.3). 1.3 Invest in the development of downtowns and commercial centers throughout Spokane County through small business support, residential expansion, and storefront revitalization. 1.3.1. Support the modernization and increase the competitiveness of aging downtown commercial buildings, especially in historically underserved areas.
1.3.2. Identify municipal/County-controlled land in downtown and urban areas for residential housing and in-fill opportunities. • Pursue the redevelopment of large surface parking lots with mixed-income, mixed-use developments (see Strategy 3.1). 1.3.3. Prioritize downtown investments and revitalization efforts that support local businesses, including basic infrastructure and nonmotorized transportation routes (see Strategy 4.1). 1.4 Establish strong communication channels to understand business community needs and to promote business continuity and preparedness. 1.4.1. Leverage the region’s business support organization network to establish a process for regular communication with businesses to understand their priority issues and needs.
CASE STUDY
Location: Fort Collins, Colorado
More Information: Rebuilding For Resiliency In response to the drastic decline of tourism activity due to the COVID-19 pandemic, Visit Fort Collins (VFC), the city’s official destination marketer, created Rebuilding For Resiliency: A Path Forward for Visit Fort Collins, a strategic recovery plan. The plan’s recovery strategies fall into four main categories: securing competitive funding, refocusing its marketing campaign on leisure activities and youth sports, developing community connections, and leveraging brand promise. Each strategy defines the recovery challenge, response action, task timing, and necessary community partners to ensure a quick return to pre-pandemic growth trajectories while also contributing to the city’s overall recovery and economy. Through the report’s implementation, a tourism improvement district (TID) was created to fund marketing and sales support for hotels within the district through the addition of a lodging tax. The new fee is projected to raise $800,000 a year, in addition to lodging tax revenue. The city is paid 2 percent of the revenue each year for collecting the fee, while VFC receives 70 percent. The remaining funds are directed toward the city’s Fort Fund arts and culture grants.

1.4.2. Host workshops to ensure that businesses understand their vulnerabilities in the face of disruptions. 1.4.3. Provide tools to help businesses overcome their vulnerabilities and to ensure they have processes in place, such as succession planning, e-commerce sales expansion, continuity plans, and digital literacy, to continue critical operations in the event of an unplanned disruption or disaster (see Action 3.6.2). 1.5 Promote technology resilience by ensuring redundancy in telecommunications and networks.
1.5.1. Coordinate with telecommunications providers to resolve weak service zones to ensure residents can easily access information and resources (see Action 3.6.1). 1.5.2. Work with municipalities to expand redundancies to ensure there are no single points of failure and to protect public safety in the event of natural or human-influenced disasters.
1.5.3. Encourage rapid deployment of telecommunications and network lines across Spokane County, especially in major employment areas and commercial corridors (see Action 4.1.1). 1.6 Address climate resilience by modernizing infrastructure systems to withstand disruption, improve efficiency, and enhance connectivity. 1.6.1. Launch a feasibility study for hardening infrastructure systems most vulnerable to changes in climate and weather patterns, such as wildfires, severe storms, and flooding. • Apply community wealth building initiatives to ensure neighborhoods with limited resources have equal access to system modernization and improvements.5F6 1.6.2. Support existing work to bury electric lines to mitigate potential impacts of severe weather events. 1.6.3. Continue to invest in and expand sustainable infrastructure, such as permeable pavement and flow-through planters, to mitigate stormwater impacts on sewer systems.

6. Johanna Bozuwa. “Building Resiliency through Green Infrastructure: A Community Wealth Building Approach.” Democracy Collaborative. (February 28, 2019).
Image of Main Market Co-Op by Aaron Theiseni courtesy of Visit Spokane
GOAL 2. COMPETITIVENESS
Position the Greater Spokane region as a strong competitor to attract talent, capital, and resources for strategic economic development.
Image of Main and Wall, Downtown Spokane by Libby Kamrowski courtesy of Visit Spokane Strategies and actions under the guiding principle of competitiveness revolve around fundamental economic development activities. These activities aim to generate investment, create employment opportunities, and spur wealth creation in Greater Spokane by positioning the region as a strong competitor in the attraction of talent, capital, and resources. Building a more robust business retention and expansion (BRE) program, encouraging targeted real estate development, and launching marketing campaigns form the foundation for success. As a major business hub for the Inland Northwest, the Spokane region can benefit from local industry synergies. Targeting real estate development in priority areas will help the region implement equitable growth initiatives, uplifting long-neglected communities and expanding housing supply to maintain a relatively low cost of living. Meanwhile, launching high-impact external marketing campaigns that highlight the region’s quality-of-life amenities can help attract tourists and talent. Through regional collaboration and coordination, community leaders can pursue strategic economic development opportunities that embrace the region’s competitive advantages and continue to grow a thriving local economy.
STRATEGIES AND ACTIONS
2.1 Pursue innovative financing options, like external funding opportunities (philanthropic, state, federal), for economic and community development projects. 2.1.1. Form an Economic Development District through the US Economic Development Administration to access more funding opportunities and technical assistance.
• Convene regularly to address regional issues, track metrics, and benchmark peer communities. • Monitor the economic dashboard for early warning signs then proactively address potential disruptions and economic challenges. 2.1.2. Expand the use of financing options, including research-anddevelopment tax credits, new market tax credits, and opportunity zones, to attract investment.
• Ensure projects leveraging federal incentive programs align with neighborhood needs (see Strategy 3.3) and minimize the displacement of communities.
2.1.3. Create and maintain a database to gather all funding opportunities in one place and work with economic development partners to apply for and use external funding more effectively. • Host workshops to educate community leaders, decisionmakers, elected officials, and the media about external funding opportunities and how they work. • Leverage tools such as GrantStation to develop the database. 2.2 Position the region for equitable real estate development, including the development of commercial and industrial space to meet business needs as well as the development of a diverse housing stock to meet the needs of a growing population (see Action 3.3.2). 2.2.1. Ensure the region has adequate commercial and industrial developments, particularly Class B office space, to support business retention, expansion, and attraction efforts. • Market Advantage Spokane’s Real Estate Opportunities to ensure that businesses are fully aware of available real estate space in the region. • Support the development of flexible spaces that accommodate growing startups (see Strategy 4.2). 2.2.2. Launch a land banking project to identify and assemble industrial redevelopment opportunities in underserved areas, including brownfield and greyfield sites. 2.2.3. Invest in mixed-use projects and smaller-scale projects that bring new urban housing, retail sites, restaurant space, and entertainment space (see Strategy 4.3). 2.2.4. Expand and preserve a full range of housing options (owner and rental, using local housing action plans as a baseline) (see Action 3.3.3). • Ensure public and private sector coordination, including the City of Spokane and Spokane County’s public development authorities (PDAs). • Target new housing developments in areas that can easily connect low-income workers with growing employment centers throughout the region. • Explore zoning policy changes to ease processes and reduce barriers to housing development. 2.2.5. Evaluate community land trusts and community investment funds as an innovative mechanism for long-term housing affordability. 2.2.6. Leverage state and federal funds to implement strategies in local housing action plans. 2.2.7. Promote the region’s identity and high quality of life to support tourism, business attraction, and talent attraction and retention.

2.2.8. Partner with Visit Spokane and municipalities on marketing campaigns to raise the region’s profile and assist with business and talent attraction.

2.2.9. Update talent recruitment and retention tools regularly, including materials and programming, that build on the strong presence of the local higher education institutions. • Target young professionals, high-demand occupations, and remote workers to build the region’s talent base.
Image of homes in the Browne's Addition Neighborhood by NJames courtesy of Visit Spokane
CASE STUDY
Imagine Pittsburgh
Location: Pittsburgh, Pennsylvania
More Information: Pittsburgh Passport Approximately 10 years ago, Pittsburgh, Pennsylvania, realized it had a talent problem. Carnegie Mellon University was educating some of the most talented and innovative engineering students in the country, but after graduation, they were leaving in droves for jobs on the East and West Coasts. Community leaders collaborated and identified three key factors. The first was that students did not feel they had any connections to the city. Some never even left campus during their school tenure. The other two factors were the city’s lack of vibrancy and density of innovative jobs to keep graduates. Out of these findings, Imagine Pittsburgh was born, with the primary goal to better integrate students into the local community. After nearly 10 years and investments in quality of place, Pittsburgh has increased student retention and is recognized as a leading innovation hub. Imagine Pittsburgh has continued to evolve, including the addition of the Pittsburgh Passport Summer Internship Series in 2019. The Passport Series offers a wide range of programs, from social events to industry tours, designed to connect students to the city outside of working hours. In today’s competitive talent landscape, the extent to which a region can retain higher-ed graduates is a top consideration for decision-makers when evaluating corporate expansions or relocations. 2.3 Strengthen existing business growth and retention programs and bolster business recruitment efforts, especially around target sectors. 2.3.1. Invite regional workforce development specialists on business retention and expansion (BRE) visits where workforce availability is likely to be a major issue. 2.3.2. Include questions about existing business vendors and suppliers during BRE visits and events to uncover supply chain recruitment opportunities (see Action 1.2.1). 2.3.3. Set a goal of attracting a major anchor institution to support target sectors.
2.4 Engage the Fairchild Air Force Base in regional economic development initiatives that leverage the Spokane region’s aerospace and defense assets. 2.4.1. Continue Forward Fairchild’s work to maintain strong business relationships with the base and to integrate military leaders into the Spokane community. 2.4.2. Connect military personnel separating from service in the region with local aerospace employers. 2.5 Fortify the region’s health and life sciences industry by enhancing sectorspecific workforce development initiatives and business services. 2.5.1. Work with medical education institutions and healthcare systems to increase medical residency positions to retain top health and life sciences talent within the region. 2.5.2. Support Evergreen Bioscience Innovation Cluster’s work to attract health and life sciences entrepreneurs and companies by strengthening the ecosystem of the sector’s business support in the region. 2.5.3. Attract research-and-development investments to support university and college researchers and innovators in life sciences. 2.5.4. Deploy strategies to upskill workers within the health and life sciences industry, as well as build awareness of career opportunities in the sector (see Strategy 3.5). 2.5.5. Encourage career exploration programs for PreK-12 students, especially in science, technology, engineering, and mathematics (STEM) industries (see Action 3.4.1).
