
6 minute read
GOAL 1. RECOVERY AND RESILIENCE

INTRODUCTION
Image of University District Gateway Bridge by Libby Kamrowski courtesy of Visit Spokane While benefiting from a diverse industry base, the Spokane economy can take advantage of a select group of target sectors that have a strong presence in the region. Spokane’s target industries closely mirror those of Washington State, shedding light on how important Spokane’s economy is to the state. Businesses that comprise Spokane County’s target sectors range from microenterprises with just a few employees to the region’s largest employers. Traded sector businesses—enterprises where most of the goods and services are sold outside of the region—tend to make up the majority of companies in the clusters. However, local businesses, especially in the healthcare sector, may also be encompassed in the target sectors. Successful industry clusters must include more than a high concentration of businesses. Strong workforce training, entrepreneurial support, and robust infrastructure systems are essential to cultivate target sector growth. Furthermore, deep ties between clusters, such as those found between agribusiness and life sciences or aerospace and manufacturing, will also strengthen clusters.
Advertisement

The area has a long history supporting agribusiness and can continue that momentum by expanding agricultural exports and food manufacturing, as well as the growing local food movement. Meanwhile, the COVID-19 pandemic exposed an accelerating need to strengthen certain sectors, like energy infrastructure and technology and logistics, to limit supply chain risks and fortify an interconnected economy.
Fostering growth in the health and life sciences by building on the strong foundation provided by the region’s higher educational institutions, the central University District, and local healthcare industry, will continue to advance the economy. Additionally, the region’s robust aerospace and aviation assets find close alignment with the manufacturing and materials sector. Combined, these target industries capitalize on the region’s creative talent pool to drive innovative growth.
The six sectors identified by this analysis demonstrate significant future potential to generate new investment. Focusing business development efforts within these sectors, and across sectors, will continue to build on the region’s successful companies, innovative talent, and high quality of place to support equitable economic growth.
ABOUT THE DATA
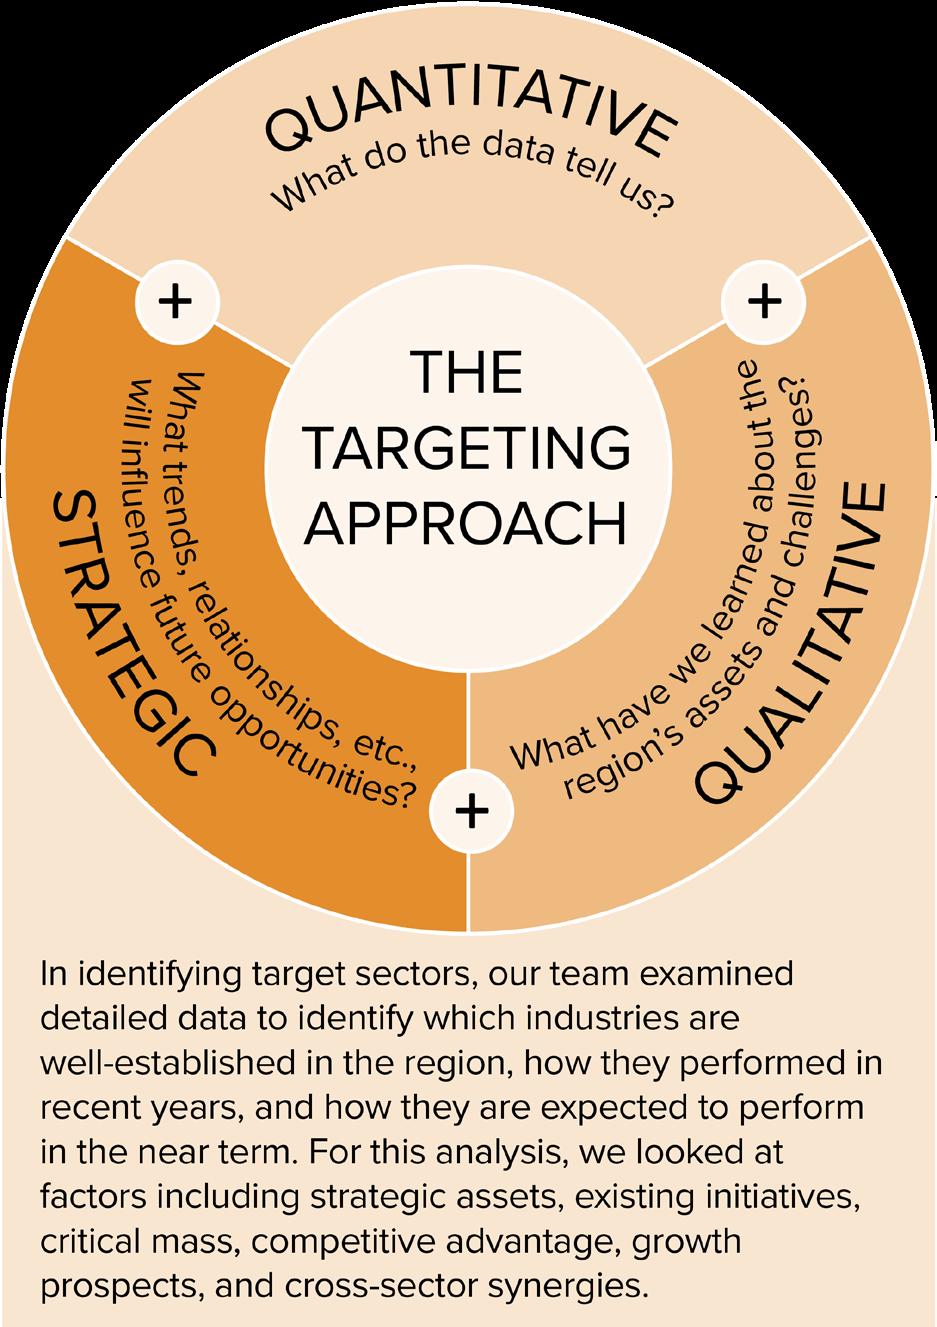

In the first phase of this project TIP Strategies reviewed employment using standard NAICS industry classifications. For the targeting analysis, we take this a step further by filtering employment within an industry cluster framework developed by the US Economic Development Administration in conjunction with the Institute for Strategy and Competitiveness at Harvard Business School (www.clustermapping.us).
Image of Peone Prairie by Libby Kamrowski courtesy of Visit Spokane
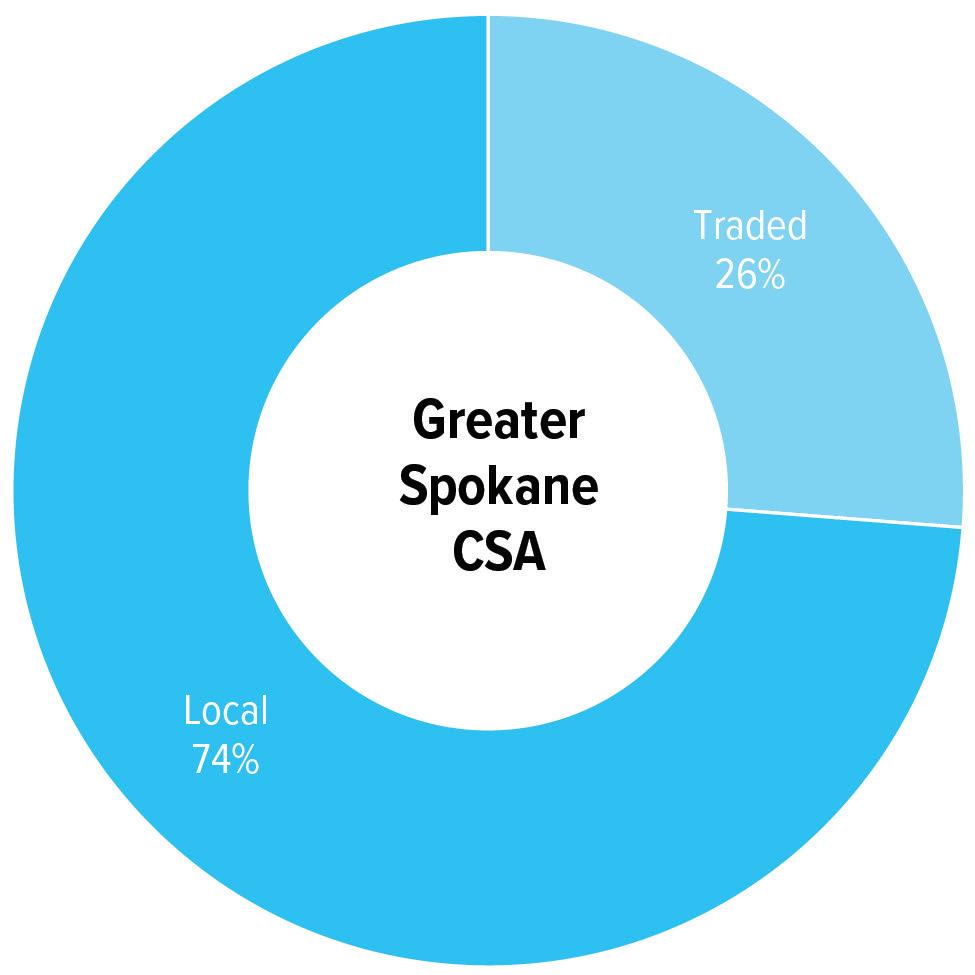
Increasing the ratio of traded-to-local clusters is a common strategy for enhancing economic prosperity. Traded clusters are emphasized by economic developers because they include industries and firms that typically produce goods and services for customers beyond the local region. These traded activities are thus more likely to produce externally generated revenues which can, in turn, help boost local tax coffers. As an example, a dental office might serve local customers exclusively, while a manufacturing plant, a data center, or a hotel would typically serve paying customers beyond the local area. The ability of traded clusters to serve larger markets also presents greater opportunity for employment growth, whereas a dental office might face more finite geographic limits to expansion.
Sources: US Bureau of Labor Statistics; Emsi 2020.3– QCEW Employees, Non-QCEW Employees, and Self-Employed; U.S. Economic Development Administration; Institute for Strategy and Competitiveness, Harvard Business School; TIP Strategies, Inc. Note: The cluster methodology developed at Harvard Business School has been adjusted by TIP Strategies to align with the 6-digit NAICS classifications used by Emsi.
FIGURE 15. EMPLOYMENT CLUSTERS — TRADED VS LOCAL
EMPLOYMENT IN 2020 BASED ON CLUSTER TYPE
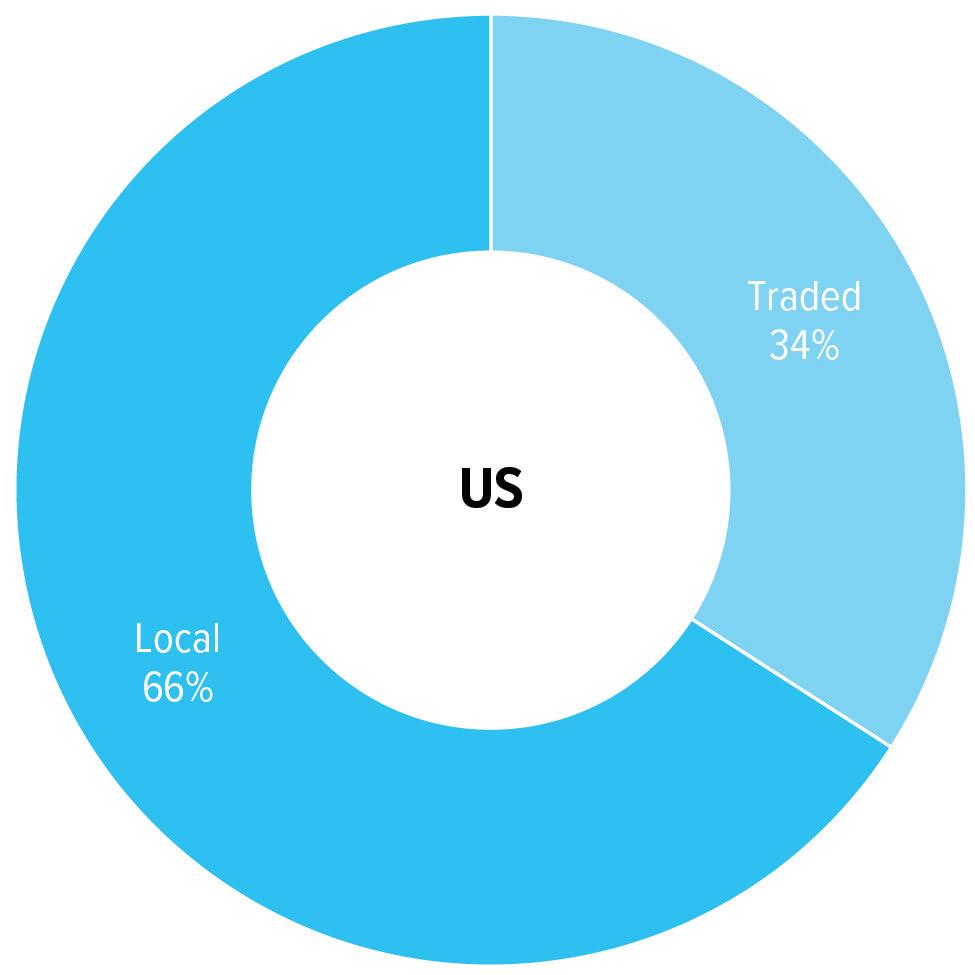
LOCAL CLUSTERS
• Primarily serve local markets. • Present in virtually every market. • Location is not dependent upon competitive advantage.
TRADED CLUSTERS
• Serve outside markets. • Free to choose where they locate. • Tend to be highly concentrated in a few regions that have specific advantages.
FIGURE 16. EMPLOYMENT CLUSTERS — WEIGHT (SIZE & CONCENTRATION)
TRADED CLUSTERS EMPLOYING THE MOST WORKERS LOCALLY IN 2020
LOCATION QUOTIENTS
BELOW AVG ABOVE AVG

While local clusters (such as dental offices) typically account for a similar share of employment across communities of varying size, the share of total employment represented by traded clusters (such as automotive assembly plants) may differ dramatically from one community to the next. Traded clusters that account for a larger-than-average share of total employment can suggest areas of competitive advantage. This figure compares the distribution of employment by cluster in the US (first column) with the local area (second column). The third column uses location quotients (LQs) to convey the intensity of employment locally relative to the US. If a traded cluster represents 1 percent of US employment and 5 percent of local employment, its LQ would be 5.00, meaning that the traded cluster in the local area is 5 times as large as would be expected based on national patterns.
Sources: US Bureau of Labor Statistics; Emsi 2020.3– QCEW Employees, Non-QCEW Employees, and Self-Employed; US Economic Development Administration; Institute for Strategy and Competitiveness, Harvard Business School; TIP Strategies, Inc. Note: The cluster methodology developed at Harvard Business School has been adjusted by TIP Strategies to align with the 6-digit NAICS classifications used by Emsi.
Understanding anticipated job growth in traded clusters is an essential element of the targeting process. This figure compares projected net job gains in percentage terms over a fiveyear horizon for the US (first column) and the local area (second column). The column on the far right shows projections (in numeric terms) for local net job gains in traded clusters in descending order. The last three rows of the exhibit—showing projected job growth aggregated for traded clusters, local clusters, and total employment—can help inform strategic discussions and refine goals for the future.
Sources: US Bureau of Labor Statistics; Emsi 2020.3– QCEW Employees, Non-QCEW Employees, and Self-Employed; US Economic Development Administration; Institute for Strategy and Competitiveness, Harvard Business School; TIP Strategies, Inc. "Note: The cluster methodology developed at Harvard Business School has been adjusted by TIP Strategies to align with the 6-digit NAICS classifications used by Emsi.
FIGURE 17. EMPLOYMENT CLUSTERS — PROJECTED GROWTH
TRADED CLUSTERS WITH THE HIGHEST PROJECTED LOCAL JOB GAINS, 2020-2025
FIGURE 18. TALENT DEMAND INDICATORS
ANALYSIS OF UNIQUE LOCAL JOB POSTINGS DURING CALENDAR YEAR 2020

LOCATION QUOTIENTS
BELOW AVG ABOVE AVG
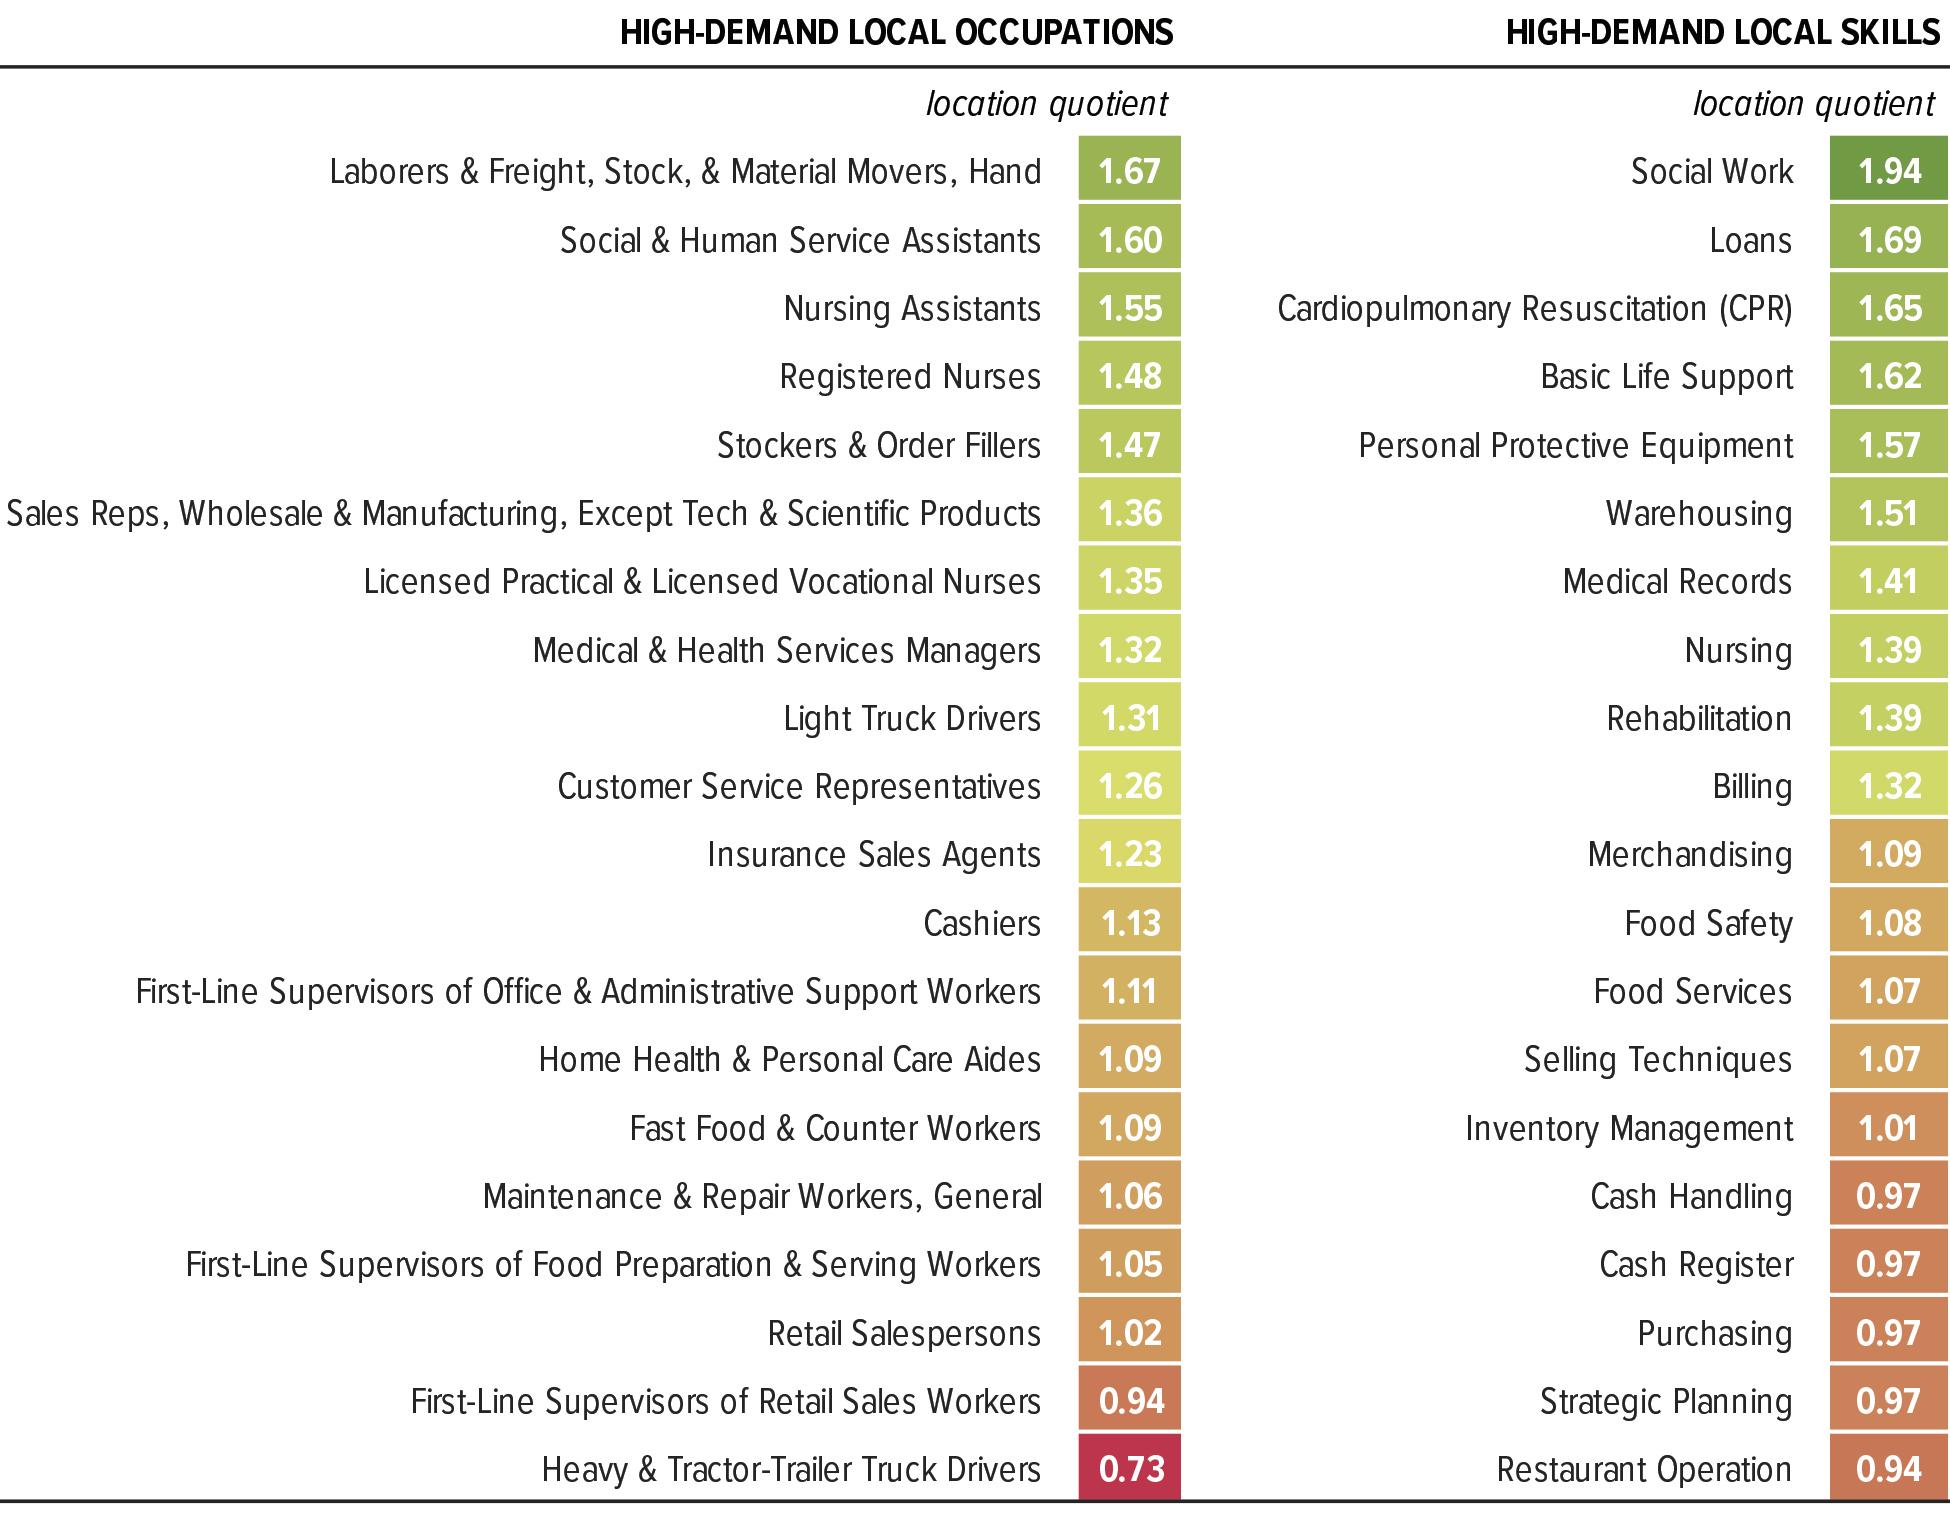
An analysis of job postings can help reframe our understanding of the local job market from the employer’s perspective rather than simply through the lens of government statistics. This back-of-the-envelope analysis uses job postings from the prior calendar year to identify the most sought-out occupations (first column) and the most frequently occurring words and phrases (second column). LQs are used to approximate the local intensity of recruiting efforts and illustrate employer demand for specific hard skills. A help wanted ad that appears locally at 5 times the relative rate as the US would have an LQ of 5.00; likewise a specific skill that appears more frequently in local postings than the national average would have an LQ greater than 1.00, suggesting higher demand in the local market. The results should prompt strategic questions about the alignment of the region’s talent pipeline with the needs of employers and with target (traded) clusters.
Sources: Emsi 2020.3; TIP Strategies, Inc.
