Hydrographic surveying goes green Innovation and adaptation in a changing world


Preparing for sea-level rise thanks to hydrography


Seabed 2030 project quickens pace to meet ten-year target


Exploring shallow lagoons with USV mapping technology


Empowering the subsea survey industry www.hydro-international.com Issue 2 2023 Volume 27
SeaBat T51 a 800kHz


Multibeam Echosounder


Revolutionary Technology - Stunning Performance


Teledyne Marine introduces the revolutionary and unrivalled true 800 kHz technology with the new SeaBat T51-R Multibeam Echosounder from Teledyne RESON. Built on the renowned SeaBat T-series technology crafted from decades of sonar experience, the SeaBat T51-R helps you drive efficiency onboard with fast throughput of exceptionally clean data and precise imagery.
SCAN TO WATCH


Let Senior Hydrographer, Pim Kuus, give you 5 good reasons to consider the SeaBat T51

www.teledynemarine.com
Director Strategy & Business Development: Durk Haarsma
Financial Director: Meine van der Bijl
Editorial Board: Huibert-Jan Lekkerkerk, Mark Pronk, BSc, Marck Smit, Auke van der Werf
Head of Content: Wim van Wegen
Copy Editors: Serena Lyon
Marketing Advisor: Myrthe van der Schuit
Circulation Manager: Adrian Holland

Design: ZeeDesign, Witmarsum, www.zeedesign.nl
Business Development Manager: Jurjen Visser

Hydro International is an independent international magazine published six times a year by Geomares. The magazine and related e-newsletter inform worldwide professional, industrial and governmental readers of the latest news and developments in the hydrographic, surveying, marine cartographic and geomatics world. Hydro International encompasses all aspects, activities and equipment related to the acquisition, processing, presentation, control and management of hydrographic and surveyingrelated activities.
Subscription
Hydro International is available on a subscription basis. You can subscribe at any time via https://www.hydro-international.com/ subscribe. Subscriptions will be automatically renewed upon expiry, unless Geomares receives written notification of cancellation at least 60 days before the expiry date.
Advertisements
Information about advertising and deadlines are available in the Media Planner. For more information please contact our business development manager (jurjen.visser@ geomares.nl) or go to www.geomaresmarketing.com.
Editorial Contributions

All material submitted to the publisher (Geomares) and relating to Hydro International will be treated as unconditionally assigned for publication under copyright subject to the Editor’s unrestricted right to edit and offer editorial comment. Geomares assumes no responsibility for unsolicited material or for the accuracy of information thus received. In addition, Geomares assumes no obligation for return postage of material if not explicitly requested. Contributions must be sent to the head of content wim.van.wegen@geomares.nl.
Jamie McMichael-Phillips, director of The Nippon Foundation-GEBCO Seabed 2030 Project, is steering the project carefully through challenging waters. In a recent interview with Hydro International, McMichael-Phillips provided updates on the project’s progress and current status.
Sea levels are rising in many areas worldwide, posing significant threats to low-lying coastal regions. However, hydrography offers technological and data solutions for monitoring, identifying vulnerable areas, and preparing for the future.


Alaska’s history of devastating landslides and tsunamis creates challenges in assessing communities’ risk without water depth data at the base of unstable slopes. Woolpert developed a web GIS tool that acted as a real-time vessel tracker, allowing NOAA to monitor vessel movement and water depth data collection.

This article takes a closer look at the impact of environment, energy and climate targets on the hydrographic industry, examining both the opportunities presented by the energy transition and the ways in which companies can move towards greener business practices.
Geomares
P.O. Box 112, 8530 AC Lemmer, The Netherlands


T: +31 (0) 514-56 18 54
F: +31 (0) 514-56 38 98 hydro-international@geomares.nl hydro-international.com

No material may be reproduced in whole or in part without written permission of Geomares.


Copyright © 2023, Geomares, The Netherlands

All rights reserved. ISSN 1566-9076
As part of a Catalan government project to improve the management of its marine environment, the Catalan coastal zone was surveyed using airborne Lidar bathymetry. The result was an accurate, detailed topobathymetric elevation model, which will serve as a baseline for effective coastal zone management.

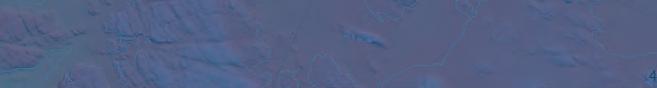
The Gialova Lagoon wetland in Greece is challenging to navigate with crewed vessels. To study the lagoon’s floor, a USV was used. The USV was equipped with sidescan sonars, echosounders, environmental sensors, and waterproof cameras to identify bathymetry, morphology, and submerged vegetation coverage.

The acquisition of bathymetric and sidescan data is essential for the Swiss energy company Axpo to maintain its hydropower infrastructure, especially as debris that glaciers dump into Switzerland’s rivers and lakes can severely damage machinery.

The Denmark Depth Model is a digital bathymetric model covering Denmark’s exclusive economic zone. It was created using hundreds of survey datasets and historical sources. This is the first model released by the Danish Geodata Agency with a 50-meter grid resolution.

5 Editorial
6 Headlines
Cover Story
The front cover of this issue of Hydro International shows a breathtaking display of colourful tropical fish swimming in coastal waters and the vibrant underwater life of a coral reef. To protect the environment, hydrographic and geophysical survey service providers are taking significant and encouraging steps to fulfil their responsibilities. These efforts not only benefit the environment but also prove to be advantageous for their business. (Image courtesy: Shutterstock)
Issue 2 2023 3 Contents Seabed 2030 project quickens pace to meet ten-year target Exploring shallow lagoons with USV mapping technology Preparing for to hydrography Hydrographic surveying goes green Innovation and adaptation in a changing world Empowering the subsea survey industry
10 26 15 19 22
30 35 40


l.ead.me/hydroint23 State-of-the-art Motion & Navigation Solution Navsight Marine Solution Qinertia The Next Generation INS/GNSS Post-processing Software Courtesy of Cadden Making Hydrographers’ Tasks Easier JOIN US at Ocean Business • Booth E4
Celebrate
One of the most exciting events of the coming month is the release of the new GEBCO grid and the announcement by Seabed 2030 of the overall percentage of the seabed that has been mapped. The last known figure is 23.7%, and stems from last summer. In the last 12 months, we’ve seen lots of parties sending their data to Seabed 2030 to fill in the gaps still left, while others are offering help in other ways, for instance in crowdsourcing projects. As I write, a group of dedicated and passionate professionals from all over the globe is pulling the data together and processing it, until it results in a reliable figure that sums up the total area of seabed surveyed. That new figure, which hopefully represents considerable progress compared with last year’s, is to be announced during the IHO Assembly to be held in Monaco from 1–5 May.
The Assembly is the main organ of the International Hydrographic Organization (IHO) and is formed by the representatives of its Member States. It meets every three years to provide general guidance on the functioning and work of the organization, as well as to take decisions of a technical and administrative nature. While Seabed 2030 is a project of the IHO and the Intergovernmental Oceanographic Commission (IOC), this podium is one of the most suitable. Representatives can drive home the urgency to map more, and start negotiating internally and externally about handing over data to Seabed 2030 that might be sitting on the shelves of private or public parties or institutes in their home countries, in order to speed up going forward to 2030. Please read the interview with Jamie McMichael-Phillips, executive
director of Seabed 2030, on page 10 of this Hydro International to familiarize yourself with the project.
Before this largest gathering of the hydrographic community this year in Monaco, the private sector comes together at Ocean Business in Southampton for its biannual exchange of technological novelties. From 18 to 20 April, this port town in the south of England, and more specifically the premises of the National Oceanography Centre, will be buzzing with ocean science and technology professionals. Cutting-edge surveying innovation and the newest marine autonomous crewed and uncrewed systems will drive the conversation, while happy reunions and getting to know new colleagues are also a big part of it. These conversations at Ocean Business will certainly come to the ears of those who make the decisions on the bigger projects, mapping the seabed.
From the waters of the Channel to the Monaco Mediterranean coast is quite a journey, but in this small, thriving, passionate and forward-looking business, it can be sailed in an instant. There are few industries in which the distance between private and public and policy and technology is so small. Policymakers and professionals acquiring and processing data are cut of the same cloth, and they understand each other and what needs to be done. As a result, decisions are often pragmatic with an eye to the common good for the ocean and therefore the planet.
I would be surprised if the total figure of mapped seabed doesn’t hit 30%, but I could be mistaken. Either way, it will be a major accomplishment of Seabed 2030 and everybody who has contributed to it, throughout the business. Let’s celebrate that when we see each other in Southampton or Monaco!
(P.S.: Hydro International and Geo-matching will be at stand A18 at Ocean Business!)
 Durk Haarsma director strategy & business development


Issue 2 2023 5 Editorial
GEOxyz expands with new US office for offshore surveys

GEOxyz, a leading offshore survey services provider, has announced the opening of its first office in the United States. The new office, located in New Brunswick, NJ, will enable GEOxyz to expand its operations and better serve the rapidly growing renewable energy industry on the East Coast, particularly in the development of offshore wind farms.


“The US renewable energy industry is a vital market in full expansion, and we are thrilled to establish a presence here”, said Patrick Reyntjens, CEO of GEOxyz. “We have extensive experience in offshore surveying and are eager to provide our services to support the development of new offshore wind farms on the East Coast.”
Intact shipwreck discovered in Lake Huron with the help of UNH mapping robot

A team of researchers from the University of New Hampshire recently made a groundbreaking discovery in Lake Huron. They were part of a world-renowned team that found an intact shipwreck deep below the lake’s surface. The ship, called Ironton, sank in 1894 and had been preserved in a remarkable state ever since.
The discovery was made possible through the use of UNH’s autonomous surface vehicle (ASV), known as BEN (Bathymetric Explorer and Navigator). BEN provided the team with state-of-the-art underwater mapping technology that was instrumental in the discovery of the shipwreck. The technology allowed the team to explore the lake’s depths with precision and accuracy, uncovering the hidden secrets of Ironton’s final resting place.
During the expedition, UNH collaborated with several search teams made up of scientists, historians and underwater archaeologists, including from the state of Michigan and the Ocean Exploration Trust. The latter was founded by famed explorer Robert Ballard, who is best known for his discovery of the wreckage of the . Together, these teams worked tirelessly to uncover
6 Issue 2 2023
EMPOWERING World leading electric underwater robotics Saab Seaeye saabseaeye.com
GEOxyz’s crew transfer vessel operating at an offshore wind farm project. (Image courtesy: GEOxyz)
UN member states reach groundbreaking agreement to protect high seas
After years of negotiations, the member states of the United Nations have finally reached an agreement on the conservation of biodiversity in the oceans. The High Seas Treaty must protect international waters, which make up about two thirds of the ocean surface.
“The ship has reached the shore”, announced conference president Rena Lee to loud applause at the United Nations Headquarters in New York on Saturday evening local time. The main goal of the conference was to ensure that at least 30% of the world’s oceans are designated as protected areas in the future.
Two thirds of the oceans lie outside countries’ exclusive economic zones and belong to the high seas. These are largely areas outside national jurisdiction. While the good health of marine ecosystems

Greensea unleashes autonomous ROV for underwater exploration
Greensea Systems, a leading provider of marine robotic software solutions, has successfully demonstrated untethered autonomy for remotely operated vehicles (ROVs). The company used a Defender ROV from VideoRay, equipped with batteries, an acoustic modem and the new OPENSEA Edge system, to showcase the untethered operation of an ROV at sea.

OPENSEA Edge, which runs on a dual parallel NVIDIA edge platform, processes data onboard and eliminates the need for a topside computer via the tether. This software handles the sonar and video perception feeds while providing autonomy, navigation, communications and task management for the robot. By reducing the amount and frequency of data being transmitted, Greensea was able to use a lower bandwidth/higher latency communication method, such as acoustic modems.
During recent operations at sea, Greensea demonstrated that the VideoRay Defender equipped with OPENSEA Edge could search, classify, map and inspect during a mock EOD mission while being untethered. The company also used its Safe C2 technology for seafloor to over-the-horizon communications, enabling the ROV to be supervised over low bandwidth and high latency-sparse data connections by an operator using a tablet.
is critical to life on Earth, only 1% are currently protected. The agreement aims to change that and is seen as essential to achieving the goal agreed in December to protect 30% of the world’s land and sea by 2030.
Valeport launches new SWiFT Deep CTD profiler for subsea surveying


Valeport, one of the UK’s leading manufacturers of oceanographic and hydrographic instrumentation, has announced that its popular range of SWiFT profilers has been extended with the launch of a new addition for those requiring conductivity, temperature and depth (CTD) measurements to depths of 6,000m.

According to the subsea sector supplier, the new SWiFT Deep CTD has been designed with the intention of a seamless workflow and offers the highest quality CTD profiles in a compact, robust and portable package. The new profiler provides survey-grade sensor technology coupled with the convenience of Bluetooth wireless technology, a rechargeable battery and an integral GNSS module to geo-locate each profile.
Using Valeport’s high-accuracy sensor technology to combine sensors for multiple profiles in a single drop, the SWiFT Deep CTD can operate to 6,000m, delivering directly measured conductivity, temperature and depth. In addition, the SWiFT Deep CTD will provide computed salinity, density and sound velocity, calculated using the UNESCO international standard algorithm and Chen and Millero equation. Data can be quickly and easily downloaded wirelessly and instantly shared in industry-standard data formats.

7 Headlines Issue 2 2023
The SWiFT Deep CTD, intended for hydrographic and offshore use to depths of 6,000m. (Image courtesy: Valeport)
A new wave of ocean protection is on the horizon with the UN treaty.
Greensea Systems)
Seagrass mapping enhanced by robotics and data investment


HydroSurv has won funding from Innovate UK to continue working with the University of Plymouth to enhance its technique of using uncrewed surface vessels (USVs) to map seagrass coverage on the seabed. Building on previous collaborations with the university and Valeport, the project aims to generate a comprehensive picture of seagrass meadows as well as to characterize the environment in which they are growing, enabling ecosystem health to be determined from the same survey campaign.
The project will see HydroSurv’s low impact, fully electric USV data acquisition platform developed further to deliver comprehensive seagrass monitoring using an acoustic ground discrimination system (AGDS) coupled with video and environmental data collection from new hull-mounted and underwater sensor arrays. These include two specialist cameras and a laser range finder, which is deployed to a constant altitude using an intelligently controlled cast winch on the HydroSurv REAV-28 USV.
Dead Sea coastal erosion research to protect coastlines worldwide


Coastal erosion is reshaping our world, threatening homes, industries and culturally important places. By taking advantage of the unique conditions in the Dead Sea and leveraging modern ADCP technology, scientists in Israel have explored how wind-driven waves and currents shape coastlines and transport sediments along shores. The research could help improve the design of boulder-based breakwaters, which are placed offshore all across the world to absorb wave energy and mitigate erosion.
Every year, around 24% of the world’s sandy shoreline erodes, causing significant financial loss from damage to property and infrastructure. With around 40% of the global population living within 100km of a coast, erosion presents a real and immediate challenge. Coastal erosion is a costly affair: in the USA alone, it causes an estimated US$500 million in property loss and damage every year.
The cutting-edge environmental research in Israel took advantage of new technologies and the unique environment of the Dead Sea to better understand the processes behind coastal erosion and sediment transport. As Haggai Eyal, a PhD candidate at the Hebrew University of Jerusalem, explained: “Understanding coastal eros ion and the transport and sorting of coarse sediments along shores is highly important for assessing coastal stability.” Eyal was supervised by Prof. Nadav Lensky from the Geological Survey of Israel and Prof. Yehouda Enzel from the Hebrew University of Jerusalem.
8 Issue 2 2023
The shore of the Dead Sea is covered in gravels and other sediments of different sizes. Using the Signature1000 ADCP, the researchers unpacked the role of the wave climate in longshore sediment sorting. (Photo: Nadav Lensky)
Doomsday Glacier’s melting forces captured by skinny robot


The Thwaites ice shelf in Antarctica, also known as the Doomsday Glacier, is melting so quickly that it is shattering, leading to a significant rise in sea levels say scientists. They used a four-metre robot called Icefin to explore the grounding line, where the ice first protrudes over the sea, and discovered a critical point where the glacier is breaking up much faster than previously thought. Despite finding that much of the flat underwater area explored by the robot is melting more slowly than anticipated, researchers warn that the melting is still accelerating and will remain a significant issue a century from now.
The glacier earned its Doomsday Glacier nickname due to the massive amount of ice it holds and the potential for sea levels to rise over 60 centimetres if it all melts, which could take hundreds of years. The melting of the glacier is primarily caused by basal melting, where warmer water eats away at the ice’s bottom.


The research is part of a US$50 million international research effort aimed at better understanding Thwaites. The good news is that


researchers found that much of the flat underwater area explored by the robot is melting much more slowly than anticipated. However, this does not change the amount of ice coming off the land and driving up sea levels, according to Peter Davis, an oceanographer at the British Antarctic Survey and a lead author of one of the studies.


Maritime Robotics’ Mariner USV offers eco-friendly freight transport

Maritime Robotics has been given permission to operate uncrewed surface vehicles (USVs) on the freight route between Trondheim and Vanvikan by the Norwegian Coastal Administration and the Norwegian Maritime Directorate. The company’s Mariner USV has already been


used on the newly approved route, which offers a more sustainable and eco-friendly transport solution for goods and equipment. With its headquarters in Trondheim and production premises in Vanvikan, Maritime Robotics is well-positioned to take advantage of this development.
Uncrewed vessels are not only cost-effective and reduce risk assessment, but they also have lower CO2 emissions than their manned counterparts, making them an attractive option for freight transport. The approval is a significant milestone for the establishment of laws and regulations that enable launched drones to participate in ordinary traffic at sea, according to Eirik Hovstein, chief operating officer of Maritime Robotics. He emphasized that Norway is a pioneering country in the development of autonomous vessels, and it’s essential to update laws and regulations to take advantage of new opportunities in this field.
The Maritime Robotics’ uncrewed surface vehicle, the Mariner.


9 Headlines Issue 2 2023
A view of the Thwaites ice shelf in Antarctica, captured from space.
The Science of Sound • Single-beam Echosounder • Side-scan sonar • Autonomous and uncrewed vehicle payloads • Seabed mapping • Acoustic communication & positioning www.sensortechcanada.com info@sensortechcanada.com +1 705 444-1440
Unlocking the potential of private and public datasets for ocean floor mapping
Seabed 2030 speeding up to meet its decade target
 By Durk Haarsma, Hydro International
Seabed 2030 is rapidly approaching its ultimate objective of mapping the entire seabed within seven years. To achieve this goal, the project is actively seeking donations of both public and private datasets. Jamie McMichael-Phillips, director of The Nippon Foundation-GEBCO Seabed 2030 Project, is steering the project carefully through challenging waters. In a recent interview with Hydro International, McMichael-Phillips provided updates on the project’s progress and current status.
Issue 2 2023 10
ideal opportunity to encourage Member States to examine their repositories and consider what more can be released to Seabed 2030 for incorporation in the GEBCO grid.”
Can you give an estimate of the percentage that this data lying on shelves could contribute?
“A conservative guess would be about 15%, but it is perhaps as much as 20% across all sectors in the marine space. That figure has been quoted elsewhere in the last six months, and I think it is probably a good estimate. We have high hopes of help from the UN Ocean Decade and the recent industry working group set up to look at how industry can release more of the data gathered on behalf of clients. If we can use this, we can move forward quickly to increase the total area mapped.”
What are the main reasons not to hand over data that has been acquired but is sitting in closed repositories?
“There are plenty of reasons. Fully understandably, national security issues may play a role. In other cases, it may be commercial sensitivities. And quite often, it is resources. An organization that has gathered data for a specific purpose and in a specific format may not have that data in a suitable format for release. They therefore have to find somebody to process the data into the right format. So my message to all those sitting on data is to first look at what datasets you are holding. Seabed 2030 is not looking for high-resolution safety-of-navigation-standard data. For shallow waters, we are looking for, at best, a 100 x 100-metre box with one depth value, with the box size increasing with depth. I argue that this is not of a high enough resolution for those that are worried about national security or commercial sensitivities. However, because ‘any data is better than no data’, we are happy to receive data at whatever resolution people are comfortable sharing.”
What are solutions when resources are the obstacle?
“I think it is natural in any organization to have a mission, a budget and limited resources to meet those goals. Perhaps for some organizations, it is not their core mission to take on extra work to process data for release to us – that may well affect the financial bottom line negatively. But Seabed 2030 can perhaps help with that; we are grateful to be able to draw occasionally on the expertise of a number of people within the GEBCO community, particularly the 100-plus fellows of the ocean mapping course, The Nippon Foundation-GEBCO Alumni, some of whom may be available to lend a hand. I understand that it is not quite as simple as that: people are not always affiliated with an organization, so getting them onto a processing system, setting up permissions and accounts and so on are issues to overcome. That is a challenge, but quite often there are ways to manage this.”
Do you have a breakdown between the private and public sectors as to how much data they might be able to contribute?
“This is unclear, because organizations that may not have wanted to give us data or that may think it is sensitive in some way, haven’t necessarily declared what their holdings are. And then there is often industry operating for clients in ocean exploration. Sometimes the data gathered by them is in EEZs or territorial seas and may well belong to the coastal state that licences it for use by industry and their clients.”
About Jamie McMichael-Phillips
A hydrographer and former naval officer, Jamie McMichaelPhillips has worked in many military and civilian leadership roles, including chairing IHO’s Worldwide ENC Database Working Group for over nine years. He is now director of The Nippon Foundation-GEBCO Seabed 2030 Project, a collaborative initiative to inspire complete ocean mapping by 2030.
What is the biggest obstacle you are looking at?
“The biggest challenge is the ability to map the ocean quickly. We are very much limited by the speed with which ships can operate multibeam echosounder systems, which is one of the biggest challenges. A vast amount of ocean still needs to be mapped. Even if you take out the 23.4% I mentioned, we still have to map around 277 million square kilometres and incorporate them into the grid. Broadly speaking, this is an area twice the size of Mars, nine times the size of Africa and 36 times the size of Australia.”
Are there any states that you are talking to right now and that are very important in this process?
“Obviously, we talk to a huge number of nations and participate in a number of IHO and IOC meetings and working groups. This means we are speaking to nations on an almost daily basis. There are too many to single out – all are important to us. Of course, being able to draw on the repository that is IHO’s Data Centre for Digital Bathymetry is hugely important; that repository is provided by the United States’ NOAA. We are also currently liaising with some smaller developing states to see how we can work with them. They clearly have a huge interest in mapping their national waters, not just for safety of navigation but for many other uses relating to sustainability and the blue economy.”
Would you call upon specific countries to open up their databases?
“No, I don’t want to name any country specifically and single it out. When countries are not contributing as they could, it is often not unwillingness but the length of the decision-making chain. There are so many boxes to tick before they can go from ‘we’re not sharing data’ to ‘we will share data’. And then it’s shades of grey in between; we can give you some, we can give you much more, we can give you the lot, and that varies from nation to nation. It can all take time; we are always grateful for what we get and I am hopeful we will see more data-sharing in the near future.”
Crowdsourced bathymetry was a big thing a short while ago. Is it still, going forward?
“Crowdsourced bathymetry is an IHO initiative that was kicked off in 2015, and we are a big part of that working group. We’ve also been lucky enough to have some limited funds to provide some relatively inexpensive data loggers to a number of volunteer groups who are at sea on a trial basis. Of course, not every nation is signed up for people gathering crowdsourcing in their waters. The IHO has published a circular letter on their website listing all those nations that have said yes, and that number increases periodically. We’re
Issue 2 2023 11 Interview
talking about data being gathered, on a non-delaying basis, by volunteers in vessels going about their everyday business. We are not really in a position yet to say it will contribute
1%, 2% or 3%, but this volunteer citizen community is growing, and on the basis that every depth value in a blank part of the ocean matters, their work is hugely important
demonstration that you do not necessarily need to be a scientist or a hydrographer to go out and gather data that is going to help us map the ocean floor. We’re seeing much more interest from philanthropy, from super yacht owners to small pleasure craft owners
enough beyond the oceanographic and
“There can always be more recognition. One of the key things for us is to spread the message outside the oceanographic and hydrographic community. We need to ensure that we bring the world with us and that world is more than simply the scientific or hydrographic community: it’s industry, it’s the philanthropists, it’s citizens. This has been helped by the recent climate conferences, the push by the United Nations and other senior leaders at the national government
important the ocean is to our well-being and the stark fact that we need to reverse the decline in ocean health or, preferably, halt it.”
uncrewed technology, and you’ve seen the recent successes in Tonga with Seakit (see Issue 3 2022), the work that Saildrone is doing, and others. I think it’s certainly been a game-changer for us, because it’s eye-catching in the international media and draws attention to the need for ocean mapping. What is also eye-catching is that we could watch a vessel operating in Tonga in totally uncharted and potentially hazardous waters while being controlled from an operations room on the other side of the world, on the east coast of the United Kingdom
hearing and talking about ‘robot boats’, much more than about conventionally crewed ships.”
instance artificial intelligence, to use for statistics, we are using supercomputer

Issue 2 2023 12
and cloud technology. There is a lot of work going on to upload data. One of the challenges for us is calculating how much of the ocean has been mapped, and that is no trivial task. We do this by uploading datasets to the cloud, running them through a supercomputer and generating the statistics. We’re also looking at using cloud technology, and again perhaps going back to some of our Alumni colleagues and looking at opportunities for them to dial in remotely to process data in the cloud. In fact, we’re working with Kongsberg on this initiative, using their Blue Insight platform. This might then help our regional centres surge in their activity in terms of handling data, helping to reduce any backlogs. A ‘surge capability’ helps us work around the challenges that organizations have when they have a limited number of employees and can’t necessarily increase staffing levels, but have to deal with a periodic, yet transient, high level of tasks. But all of that is not really artificial intelligence and I think we’ve still got a way to go with fully AI ocean mapping, and are likely to need human intervention for some time yet.”
How does satellite-derived bathymetry fit in?
“Satellite-derived bathymetry is a huge part of ocean mapping, but at the moment it is depth-limited as it depends on water clarity and depth. It is however a fantastic tool for difficult-to-reach, hazardous, shallow areas where you wouldn’t want to send a vessel. We’ve done a fair bit of work, particularly in the south and west Pacific, using satellite-derived bathymetry to fill in the gaps. That said, it would
be fantastic if there was a technology breakthrough that saw us get deeper water column penetration. That would again be a huge gamechanger.”
You’ve expanded the organization quite a bit. How does that affect the cooperation?


“As an organization, we’re spread over six countries: the United States, Sweden, Germany, the UK, New Zealand and Australia. This means that remote working is daily business. We are trying to maintain team cohesion through regular meetings, either as a group or one-to-ones, breaking out into working groups. In some respects, COVID-19 actually helped with this, as it forced people to work remotely, even those who perhaps weren’t used to it but suddenly had no choice. We’ve come out of that in a very positive way.”
What is your own main professional challenge?
“My professional challenge is to keep it all together, lead the team and make sure we are on track to hit the target in 2030 and not waver from that.”
2030 is only seven years away. Will you be on time?
“We most certainly aim to achieve it, and we need the world to come together to help us get there. We’ve grown enormously, from 6% in 2017 to 23.4% last year, and although the area that we still have to map is about twice that of Mars, look how far we’ve come already. Sure, it is going to take a lot of effort, but it is achievable.”
• lightweight 9.8 kg (20 lbs)
• ideally suited for integration on UAVs


• green laser providing more than 2 Secchi depths water penetration


• measurement rate 50 kHz - 200 kHz


• integrated inertial navigation system and digital camera


Issue 2 2023 13 Interview
LIGHTWEIGHT TOPO-BATHYMETRIC UAV LASER SCANNER www.riegl.com EFFICIENT HIGH RESOLUTION SHALLOW WATER BATHYMETRY FOR COASTAL MAPPING AND RIVER SURVEY Scan this QR code to explore RIEGL‘s performance in topo-bathymetric laser scanning. Austria | USA | Japan | China | RIEGL WORLDWIDE | Australia | Canada | United Kingdom
GL NEW Visit us at April 18 - 20, 2023 Southampton | UK RIEGL booth W38


From nautical charts to marine spatial data
Preparing for sea-level rise thanks to hydrography
By Sam Harper, Mathias Jonas and Sarah Jones Couture, IHO
In many places around the world, data clearly shows a rise in sea level. In lowlying coastal areas, even small increases when coupled with high tides and storm surges can have devastating consequences. Hydrography can provide a range of technological and data solutions for monitoring changes, pinpointing vulnerable areas and preparing for the future. Digital data standards developed by the IHO can also help to tackle the large quantity of ocean data generated.
Sea-level rise coupled with extreme weather events can have far-reaching effects, such as altering coastlines, impacting offshore energy infrastructure and displacing populations. However, not everywhere around the globe will be impacted to the same extent or at the same speed. Many factors determine tides and sea level: the gravitational pull of the sun and the moon, but also the shape and texture of the seabed, which in some cases can magnify the height of tides and waves.
Hydrographic products and services support all activities associated with the oceans, seas and inland waterways and can help address these challenges. Hydrographic surveys collect data on a variety of ocean parameters, including depth (bathymetry), tides and sea level. To integrate this data from different geographic sources, different disciplines and different devices and to ensure it is interoperable, robust international standards are needed. As a result, the standards and frameworks developed by the IHO for navigation are being expanded to cover other applications.
From nautical charts to marine spatial data infrastructure

The provision of hydrographic information has expanded from feeding just nautical charts and services to a much broader range of activities. The digitalization of this information allows hydrographers to provide marine spatial data that can be both mapped and analysed. Digital marine spatial data
was successfully standardized for navigation using the IHO standards and guidelines, and in particular through the IHO data exchange standard S-57 for electronic chart data and IHO INT 1 for the standardization of nautical paper charts.
However, the growing importance of economic and environmental considerations requires a more holistic view. The underlying hydrographic data, only some of which is shown in charts, is therefore in great demand for a much wider range of applications and as such, interoperability of this data is more important than ever before.
Based on the ECDIS/ENC experience, the IHO continues to develop and set standards and issue guidance that ensures that hydrographic information is available and can be delivered to users through appropriate harmonized and interoperable products and services. The development of these new standards is driven by the need to continue to satisfy the SOLAS (Safety of Life at Sea) requirements of enhancing safety of navigation and to support the implementation of e-navigation led by the International Maritime Organization (IMO), the creation of a global tsunami early warning system and the sustainable use of the oceans as part of the UN Ocean Decade. These require easy access to standardized, high-quality digital geospatial information that can support marine spatial management. Accordingly, the IHO is continuing to work on the S-100 framework to support the creation and maintenance of interoperable marine data product specifications compliant with the ISO-19100 series of geographic information standards. S-100-based products including S-102 Bathymetric
Issue 2 2023 15 Feature
Illustration of the next generation of datasets capable of displaying the seabed topography: combination of S-101 ENC and S-102 Bathymetric Surface. (Source: Sandy Hook Pilots)
Surface and S-111 Surface Currents are under initial implementation, testing and evaluation in IHO testbed programmes. The series also includes a product specification for maritime limits and boundaries (S-121) and Marine Protected Areas (S-122).
Nautical charts and digital tidal data
Hydrographic offices around the world monitor tide gauges that provide dynamic data on sea level that helps outline trends in currents and can be displayed in digital maps. However, the root of these applications dates back to the 1980s, when progress

in technology introduced the possibility of a versatile software application that could digitally integrate a number of functions into a partially interactive navigational tool. The IHO and IMO worked together to make this vision a reality by providing specifications and performance requirements for such an application. In 1989, the IMO coined the name ‘Electronic Chart Display and Information System – ECDIS’ for this innovative class of computer-based shipborne navigation devices. To feed ECDIS with official nautical data, the IHO created the first standards for digital nautical maps in the mid-1990s, the ‘Electronic Nautical Charts – ENC’. It took almost two decades before hydrographic offices were capable of establishing the regular provision of ENCs equivalent to paper charts in terms of quality and coverage for their sea areas of responsibility. Today, effectively all navigable waters are covered by ENCs, of which there are approximately 16,000 in total. There are mature distribution systems for ENCs operated in collaboration with industry that also facilitate regular updates via satellite communication.
In the 2000s, user demand for real-time depth information services for navigation in conjunction with the availability of high-resolution bathymetric data prompted a key area of work: the implementation of dynamic tides in the digital environment associated with ECDIS. To this day, the IHO continues to encourage the use of tidal data and the recovery of historical tide gauge records for the study of longterm sea-level change. Some of the recent sea tests with S-100, the Universal Hydrographic Data Model, are also looking at getting near real-time data on the detailed seabed topography and currents.

Issue 2 2023 16
Sea-level measurements taken by Shom in Brest clearly show the level is rising. (Image courtesy: N. Pouvreau, Shom)
Checking tide gauges in Antarctica. (Image courtesy: Land Information New Zealand)
Supporting early warning systems
Hydrographic data can also help anticipate and prepare for extreme weather events and natural disasters such as tsunamis. At COP27 in Sharm el Sheikh, Egypt, UN Secretary-General Mr Antonio Guterres announced a plan to implement early warning systems around the globe within the next five years. The plan will address “key gaps in understanding disaster risk, monitoring and forecasting, rapid communication and preparedness and response.” In order to implement effective systems for the ocean, up-to-date and accurate data is needed to monitor changes in the marine environment and develop more accurate models for future trends. Particularly because the shape and texture of the seabed influence tsunami wave propagation, better information can help pinpoint areas to focus resources.
General Bathymetric Chart of the Ocean (GEBCO)
The IHO is working together with IOC UNESCO to produce a complete and high-resolution map of the seafloor as part of the GEBCO programme. Data is stored at the IHO Data Centre for Digital Bathymetry (DCDB), hosted by NOAA’s National Center for Environmental Information (NCEI) in Boulder, Colorado (US). The DCDB’s bathymetric databank increases by multiple terabytes each year. The resulting freely available GEBCO grid – now updated annually – has evolved to become an interactive mapping tool with query capabilities. The coverage and quality of the grid is however dependent on the incoming survey data on the ocean topography.
The percentage of the global ocean mapped in high resolution by means of the GEBCO grid increased from 6% in 2017 to nearly 25% in 2022. There is however a significant gap in full high-quality coverage. The GEBCO programme is working to improve this through various initiatives. One of these is the joint Nippon Foundation GEBCO Seabed 2030 project, which aims to map 100% of the ocean in high definition by the end of this decade. Seabed 2030 works to discover existing datasets not yet ingested into the DCDB, supports the IHO’s citizen science project to gather depth data (‘crowdsourced bathymetry’) and plans to sponsor the development of new survey technology. The objective is that each grid cell at the defined target resolutions that vary by depth will contain at least one depth sounding. The GEBCO grid released in June 2022 contained significantly more data, particularly in the Arctic and Antarctic regions, where the coverage has increased to approximately 15%. Recognizing its contribution to increased knowledge of the ocean, Seabed 2030 has been endorsed as a UN Ocean Decade Action.
Beside the S-100 standardization framework, the GEBCO grid is one of the most important ways in which hydrography can contribute to a better knowledge of the ocean. In addition to providing baseline data to monitor changes, better data feeds more accurate models for sea-level rise and ocean currents. The accuracy of prediction models for the impact of rising waters in coastal areas is highly dependent on the geometry and texture of the seabed. Hydrography as an applied science is the only discipline to deliver this ocean knowledge.
Building capacity
Capacity-building is an important component of the IHO Work Programme. The goal is to assist States to meet hydrographic, cartographic and maritime safety obligations with particular reference
Sam Harper
Sam Harper is IHO assistant director for Survey and Operations. He was previously head of Hydrographic Programmes at the UKHO and has worked in international development and policy-making in the UK government. He has helped over 25 nations globally to build their national hydrographic infrastructure. As part of his current role, he is the permanent secretary to GEBCO and the IHO representative to the Hydrographic Surveys Working Group.
Mathias Jonas
Dr Mathias Jonas is the secretarygeneral of the International Hydrographic Organization (IHO). Prior to this appointment, he was vice president of the Federal Maritime and Hydrographic Agency and national hydrographer of Germany with responsibility for sea survey and sea cartography. Being a mariner, Dr Jonas has been involved in integrated navigation since the beginning of the 1990s. As one of the responsibilities of his current position, he is chair of the Hydrographic Commission on Antarctica.


Sarah Jones Couture
Sarah Jones Couture is PR and communication officer at the IHO, raising global awareness about its work. She previously worked as a communication consultant at the IAEA Marine Laboratories and ACCOBAMS, and has experience in the private sector as vice-president for communication in the oil and gas industry. Additionally, she helped implement large-scale ethics and compliance awareness programmes for companies that include Shell and BP.
to recommendations in UNCLOS, SOLAS and other international instruments. The scope encompasses safety of navigation, protection of the marine environment, climate change mitigation and adaptation, national infrastructure development, coastal zone management, marine exploration, marine resource exploitation

Issue 2 2023 17 Feature
About the authors
(minerals, fishing, etc.), maritime boundary delimitation, maritime defence and security and coastal disaster management.

More than 1,500 participants from 143 States have benefited from the IHO’s Capacity Building programme’s activities since 2005. The range of activities supported covers a wide spectrum, not only in terms of the type of activities but also in terms of their length. Short-term activities can include Technical Visits to assess the current state of knowledge, workshops, seminars and short courses. Technical Visits help identify the
hydrographic capability required to provide the services to meet the obligations linked to the SOLAS Convention. Workshops, seminars and short courses are dedicated to specific aspects of the obligations, such as those related to Marine Safety Information, specific parts of hydrographic surveying, data processing and management and the production of nautical charts.
The IHO has set up and maintains a system of funded education courses. Since 2009, 27 courses have been made available and completed by 137 students from 56 Member States and have provided an important contribution to the hydrographic capacity around the world.

The IHO Capacity Building programme is funded from the IHO budget and supplemented by contributions from Member States, industry and other partners. This includes ongoing financial support from the Nippon Foundation of Japan and the Republic of Korea. Taking into account the growing demands for IHO CB activities, the Secretariat is continuing its campaign to find additional donor states and funding organizations.

Issue 2 2023 18
Images of ENC coverage of the Channel. (Source: IHO online chart catalogue)
Acquiring and processing bathymetric data before tsunami-generating landslides occur

Overcoming challenges in Alaska’s landslide risk assessment
By David Neff, Woolpert, United States
Alaska’s history of devastating landslides and tsunamis creates challenges in assessing communities’ risk without water depth data at the base of unstable slopes. The US Geological Survey and NOAA’s Office of Coast Survey worked together to gain funding to address this need. Woolpert was contracted in May 2020 to acquire and process bathymetric survey data, which was shared via a GIS tool. This tool enabled NOAA to monitor vessel movement and water depth data collection in real time. The project’s success can be attributed to the collaboration of these agencies and the successful application of advanced geospatial technologies.
When most people envision Alaska, picturesque mountains, dense forests and snow frequently come to mind. Landslides, tsunamis and devastation rarely do, even though the state has a long history of them. However, according to the National Park Service: “In the last century, ten of the 14 highest tsunamis in the world were in glaciated mountains and four were in Alaska parks, which include vast tracts of glaciated terrain” (nps.gov Vol. 18, Issue 1). Two of the most well-known tsunami-generating landslides in the state are those at Lituya Bay in 1958 and Taan Fjord in 2015. Considering the state’s history and trends, it wasn’t surprising when a retreating slope in Barry Arm worried local geologists.
Barry Arm is a glacial fjord 60 miles east of Anchorage, Alaska. The steep, unstable slope in the area has the potential to produce tsunami-generating landslides that could result in catastrophic loss of property and life. However, understanding the risk to neighbouring communities such as Chenega, Whittier, Tatitlek, Valdez and Cordova required data confirming water depths at the base of the slope. This critical information was unavailable because of Barry Glacier’s recent retreat, which exposed more of the seafloor. Still, the US Geological
Survey (USGS) and the Alaska Division of Geological & Geophysical Surveys (DGGS) needed the data to understand the underwater structure of the glacier’s slope, while the National Oceanic and Atmospheric Administration’s (NOAA) National Tsunami Warning Center required it to determine where water displaced by a landslide would go and how it would affect local populations.
The need for foundational insights prompted the USGS and NOAA Office of Coast Survey to fund the acquisition and accelerated processing of bathymetric survey data in May 2020. For the project, the Office of Coast Survey contracted Woolpert to gather approximately 17 square nautical miles of high-resolution, complete coverage, multibeam data extending from the potential landslide base area to the terminal moraine of Barry Arm.
As surveyors navigated through Barry Arm, colour-coded water depths provided accurate, real-time representations of project boundaries. Surveyors were required to gather and process data from water depths extending to the black line. (Image courtesy: Woolpert)

Issue 2 2023 19 Feature
Surveyors had to complete data collection and processing within four months of the contract award. Some organizations require months of preparation to approach a project that focuses on seafloor depth, feature mapping and underwater slope structure imaging. However, because it was critical to acquire and process bathymetric data before any landslides occurred, the project team had to accelerate its emergency response capabilities, including fast mobilization, efficient workflows and expedient delivery of high-value data products.
Rear Adm. (ret.) Shepard Smith, thendirector of the Office of Coast Survey, said of the completed survey: “This multi-agency collaboration will help scientists and officials prepare for this potential hazard and work to keep our mariners and communities safe. I am also very pleased that we were able to establish a hydrographic survey contract so quickly and work with eTrac (which was acquired by Woolpert in 2022) to collect this critical bathymetric data.”
The clock is ticking
Mobilizing vessels, equipment, sonar technology and staff happened within 24 hours of Woolpert’s project award. Still, the most critical components needed to achieve the aggressive state and federal schedule requirements were consistent communication and real-time visibility of vessel movement.
“We developed a web GIS tool that’s a realtime vessel tracker”, said Izzy Kratchman,
hydrographic surveyor for Woolpert. “During the project, NOAA could see the vessel moving and know where it was, and that information was updated every six seconds, making it a great tool for communication.”
If, for example, a vessel was unable to access areas of the project scope because of water depths, NOAA and surveyors could utilize the GIS web tool from different locations, see the issue and discuss potential solutions. This process was especially helpful when considering the alternatives, as surveyors could take screenshots and send them via email, hoping for a timely response.


Additionally, if the surveying team wanted to draw NOAA’s attention to a specific area, they could use the GIS web tool to highlight the area of concern, download the corresponding image and send it to NOAA for their team to view in a web browser. From there, both parties could focus on the same area of Barry Arm. “This was a real-time utility we used to talk about things”, Kratchman said. “When we had a problem with something, we were all looking at it together in real time.”
With consistent communication playing just as essential a role as the emergency response capabilities and quick mobilization, gathering the bathymetric data to help risk mitigators prepare for the future effects of potential landslides became possible within the limited time frame. Processing that data quickly, however, required another unique component to ensure the project’s completion in the race against time.
No time to double back
For this emergency response project, it was imperative to do one thing when processing the data: supply the analytics to a datum. Understanding this step’s purpose is easier when considering the construction industry. In that example, the datum provides visibility into what is being built and to what specifications. This transparency ensures that construction workers are on the same page, regardless of their role in the project. Similarly, surveyors supplied data into a navigation datum called the Mean Lower Low Water (MLLW), which tracks tides and provides water depths at the lowest tide possible to help with navigation.
Afterwards, surveyors used a satellite communication correction service to pinpoint the vertical positional accuracies (within ten centimetres) of vessels anywhere on Earth. Surveyors therefore did not have to set up base stations or coordinate extensive logistics – they simply received corrections through a satellite.
“After getting to a ten-centimetre accuracy using the satellite system, we coupled it with what’s called a separation model”, Kratchman said. “That model took the general GPS position and
Issue 2 2023 20
Retreating glaciers enable the navigation of previously uncharted waters in Barry Arm. This image captures the area where surveyors gathered water depth data.
transformed it to the MLLW datum in real time. When these two things were put together, we could colour in depths on our chart. As our vessel navigated through the water, the colours showed on our screen in real time, enabling us to create an accurate representation of our project boundary and the required depths.”
This process enabled surveyors to visit shoreline areas, collect data at necessary water depths and leave without returning. The method was an upgrade from traditional procedures that require surveyors to collect data, apply GPS corrections, evaluate progress and double back to the project site to fill in gaps. With the streamlined approach, surveyors saved time they couldn’t afford to lose.
Using data to navigate a slippery slope

With the bathymetric data in tow, federal and state partners are taking necessary steps to prepare for potential tsunami-generating landslides in Barry Arm. DGGS is adding the new insights to its high-resolution Lidar dataset for the steep underwater slope and surrounding hillsides. The data will also complement the USGS’s satellite-based radar to ensure scientists can track the slope’s movement.

“The bathymetric data is a critical foundational element of a multiagency assessment of the coastal marine hazard and tsunami threat in Barry Arm and the nearby coastal communities”, said Aimee Devaris, USGS Alaska regional director. “Expedited access to the data will enable USGS and the Alaska Division of Geological and Geophysical Surveys to accurately map the Barry Arm landslide above and below the water in order to evaluate the hazard and aid in the development of a surveillance strategy.”
NOAA is also utilizing the bathymetric data to update its charts. When commenting on the value of the data, Dr James Gridley, director of the NOAA National Tsunami Warning Center, said: “Understanding the depth and shape of the Barry Arm fjord means the National Tsunami Warning Center will have a better grasp of the tsunami risk if and when a landslide occurs. We could not have improved our mission confidence for the Barry Arm threat without this critical dataset.”

About the author
Dave Neff is an ACSM-certified hydrographer and geospatial programme director at Woolpert. Neff has managed hydrographic projects across the US and internationally, and has extensive experience in project management, vessel mobilization, survey planning, data collection and processing, report writing, business development and product generation.
Increasing safety in multiple ways
When a glacial slope is at risk of causing tsunami-generating landslides, the primary goal must focus on acquiring and processing bathymetric data to determine how neighbouring communities will be affected – but what’s the secondary goal? An excellent one is charting newly navigable water that’s only accessible because of the same retreating glaciers that threaten nearby populations. “Cruise and tourism ships were navigating these waters, and it was dangerous because those waterways were uncharted”, Kratchman said. “As a secondary goal, we went into this no man’s land to collect depth data. We were the first people ever to survey there.”
Federal and state partners are using the data to update their charts to provide vessels with the necessary information to increase passenger safety. As relevant parties make critical updates, the bathymetric data will continue to prove valuable for risk mitigators who want to prevent catastrophic loss from retreating glaciers as well as vessels wishing to navigate newly accessible waters made possible by those same receding glacial slopes.

Issue 2 2023 21 Feature
For the project, the project team utilized an R2 Sonic 2024 multibeam echosounder which was mounted on the RV Inverness. The vessel was docked in Whittier Harbor during the project. (Image courtesy: Woolpert)
Barry Glacier during hydrographic surveying in Barry Arm. (Image courtesy: Woolpert)
Innovation and adaptation in a changing world
Hydrographic surveying goes green
By Wim van Wegen, head of content, Hydro International
Amid new climate policies, the global energy transition is in full swing. This is leading companies and organizations to take a variety of measures to make their business operations more sustainable. Service providers focusing on hydrographic and geophysical surveys are taking significant steps to assume their responsibilities, which often proves beneficial for their business as well. This article takes a closer look at the impact of environment, energy and climate targets on the hydrographic industry, examining both the opportunities presented by the energy transition and the ways in which companies can move towards greener business practices.

Issue 2 2023 22
Figure 1: The IHO has created the S-100 Universal Hydrographic Data Model to address future requirements for digital products and services related to hydrography.
Adopted by most countries in 2015, the Paris Agreement sets an ambitious goal to limit global warming to below 2°C above preindustrial levels, with a preference for capping it at 1.5°C. This aims to substantially mitigate the impacts of climate change and calls for immediate action to reduce greenhouse gas emissions. The agreement also aims to reach net-zero emissions by 2050, paving the way for a more sustainable future. Furthermore, it acknowledges the significant contribution of the business community as a nongovernmental actor in tackling the problem.
The hydrographic industry has a significant role to play in reducing CO2 emissions, especially with regards to shipping emissions that have garnered increasing attention. As a result, hydrographic service providers are increasingly expected to contribute by investing in sustainable solutions.
Greening the hydrographic industry

Hydrography is a fundamental discipline for all sea-related activities, as it deals with the physics of the marine environment. In the context of this article, hydrographers play a crucial role in observing and responding to the impacts of climate change. With rising ocean temperatures and melting polar ice, coastlines are shifting and hydrographic data is changing. This underscores the importance of the International Hydrographic Organization (IHO) in leading efforts to mitigate and adapt to the effects of global warming. By taking decisive action, hydrographers can help ensure the sustainability of our oceans and coastal communities for generations to come.
One of the key goals of the IHO is to enhance hydrographic support for safe and efficient maritime navigation, especially in the light of ongoing transformations in the industry. Two crucial aspects in this regard are the development of autonomous shipping and the reduction of emissions, which are driving significant changes in hydrographic services. To address these new requirements, the IHO and its Member States are focusing on a range of hydrographic data products and services based on the Universal Hydrographic Data Model (Figure 1). These efforts aim to support the needs of autonomous shipping and help reduce emissions, as indicated by the IHO 2021 Annual Report.
Decarbonization and the adoption of zero-emission fuels are becoming top priorities for shipping companies and port authorities alike. The ISHY project (Implementation of Ship Hybridization) is a noteworthy European initiative that aims to develop, test and validate technical tools and socio-economic implementation models for hybrid and fuel cell-powered ships. The project also encompasses hydrogen supply aspects in ports. By updating and building several types of ships, the project aims to demonstrate the effectiveness of these approaches in reducing CO2 emissions.
GEOxyz is collaborating in the ISHY project through its GEO Aqua division to develop a green crew transfer vessel that will use hydrogen for the hybrid transportation of technicians and goods to offshore wind farms. The primary objective is to increase the adoption of this low-CO2 technology in the offshore wind industry, thereby promoting a greener supply chain and the use of green energy. Through this project, GEO Aqua aims to significantly reduce the environmental footprint of its vessel fleet.
Wim van Wegen is the head of content at Hydro International and a regular contributor of columns and feature articles. He frequently interviews renowned experts in the geospatial industry. Additionally, he serves in the same capacity at GIM International, a global media brand dedicated to empowering the geospatial community. Van Wegen holds a Bachelor’s degree in European Studies from NHL Stenden University of Applied Sciences in Leeuwarden, the Netherlands.
wim.van.wegen@geomares.nl

Clinton Marine Survey is a leading offshore survey company based in Gothenburg, Sweden. The company specializes in working in extreme shallow to offshore waters and owns a fleet of tailor-made vessels with advanced MBES and SBP systems. Clinton is committed to reducing its environmental impact and achieving ambitious environmental targets every year. The company has implemented various initiatives, such as electrifying vehicles, minimizing travel, waste reduction and recycling programmes. One noteworthy initiative is positioning data processing personnel at the Gothenburg office, which significantly reduced the company’s carbon footprint. These initiatives serve as a prime example of how companies can work towards greater sustainability and innovation in their industry.
Sustainable surveying solutions
Innovation is a critical success factor in the hydrographic industry, especially in terms of sustainability. Geo Plus, a renowned Dutch company that specializes in hydrographic surveys around the world, is dedicated to renewable energy and reducing the use of fossil fuels. To achieve this goal, the company equips all new ships (Figure 2) with energy-efficient hybrid engines, resulting in a 75% reduction
Issue 2 2023 23 Feature
Figure 2: Built by the Royal Niestern Sander shipyard, the Geo Ranger is a support vessel specifically designed for shallow water surveys and serves as the flagship of Geo Plus. The vessel was carefully crafted with both the crew and survey equipment in mind, while placing special emphasis on sustainability. (Image courtesy: Royal Niestern Sander)
About the author
in fuel consumption during surveying operations. This approach aligns with their sustainability goals and provides cost savings for customers.
Ship noise is a major threat to underwater sea life, especially marine mammals such as seals and whales. In response, Geo Plus has developed modern survey vessels that produce significantly less noise than conventional ships. This innovation has numerous positive effects, including dramatic improvements in the quality of the survey data collected by their sensors.
Geo Plus’ commitment to sustainability and innovative technology has allowed it to become a leader in responsible hydrographic surveying, while also improving the quality and accuracy of its work.

Uncrewed surface vehicles (USVs) are a safe, cost-effective and environmentally friendly way to collect ocean data, including mapping the seabed and monitoring the environment. XOCEAN is a leading company that offers turnkey ocean data collection services to surveyors, companies and agencies. It manages the entire process, from mobilization to data delivery, using full uncrewed ‘over-the-horizon operations’ and satellite communications. Each USV transmits real-time images and situational awareness data to an operations centre, where qualified USV pilots monitor and control the vessels 24/7 to avoid collisions.
XOCEAN also partners with universities and research institutions to advance oceanographic research.
Autonomous and uncrewed solutions play an important role in making the sector more sustainable. Duncan Mallace, chief strategy officer at XOCEAN, notes that its USVs emit only 0.1% of the emissions of a typical survey vessel, and don’t require people to go offshore. This approach closely aligns with the values of XOCEAN’s customers and partners, who prioritize remote data collection of the highest quality.
The ocean data acquisition company recently completed its first large-scale seabed survey for Vattenfall using USVs. The surveys were carried out at several of Vattenfall’s offshore wind farms located in Denmark, Sweden and the United Kingdom. The results of the surveys were highly positive, not only from a climate perspective but also in terms of safety. The use of uncrewed vessels has the advantage that it reduces the risks associated with traditional surveys while minimizing the carbon footprint of the operation.
Accelerating the adoption of renewable energy sources is important for mitigating the effects of climate change. Offshore wind farms provide clean and renewable energy that is particularly advantageous due to the stronger and more consistent wind speeds found offshore. Saildrone, a provider of ocean data solutions, offers uncrewed vehicles (Figure 3) that use wind power to support every aspect of an offshore wind farm’s life cycle. This technology has the potential to play an important role in promoting the use of offshore wind energy, which can help to reduce reliance on fossil fuels and promote a sustainable energy mix.
New energy forms create hydrography opportunities
Offshore wind farms offer plenty of opportunities for hydrographic service providers. Geo Plus recently conducted a geophysical survey campaign for the North Irish Sea Array (NISA) Offshore Wind Farm, using two vessels to survey water depths over and under 10m. Geo Plus specializes in seafloor scanning and mapping, including detecting changes in the seabed and locating unexploded ammunition and shipwrecks. It delivered high-quality results with its expertise and state-of-the-art equipment.
Besides offshore wind farms, the hydrogen sector is opening up new opportunities for hydrography, surveying and engineering companies. One of the most exciting examples is the announcement of one of the world’s first large-scale, wind-powered offshore hydrogen production facilities by the Dutch government (Figure 4). The facility will be located in the

Issue 2 2023 24
Figure 3: Saildrone’s fleet of small and medium-sized USVs offer high-quality bathymetry solutions for both near-shore and open-ocean applications that meet, and even surpass, the rigorous standards set by the IHO. (Image courtesy: Saildrone)
Figure 4: Shown here is a 3D representation of a hydrogen-powered offshore energy production plant. (Image courtesy: Shutterstock)
Dutch part of the North Sea, north of the Wadden Islands, utilizing an existing wind farm and natural gas pipeline. The wind farm boasts approximately 500 megawatts of electrolysis capacity and the facilities are slated for completion around 2031. This well-connected location offers potential for easy transport to land and connection to the onshore hydrogen network.
The Netherlands is positioning itself at the forefront of the energy transition with this groundbreaking initiative. The Dutch government has already designated the area as a preferred location, paving the way for swift preparations and providing the sector with clarity to make investment plans. This pioneering project is relatively new to our field, and will require a significant amount of hydrographic survey work.
As the above examples show, with the hydrographic industry’s expertise in surveying and mapping, there are significant opportunities to contribute to a greener future.
Next steps
The recent Exail Maritime Users Conference provided valuable insights into the direction of hydrographic surveying. Exail is a new company that resulted from the merger between ECA and iXblue. During the event, attendees witnessed a remarkable demonstration of DriX. Despite being thousands of kilometres away in the south of France, the USV was operated remotely from the conference room. The presentation showcased several of the vessel’s capabilities, including collision avoidance, which worked flawlessly, and the new autoline option. This feature enables DriX to automatically plan survey lines using various software settings. While some bathymetry clipping was required to create straight lines, the autoline option is an exciting development that brings us closer to autonomous survey operations and sailing capabilities.
Replacing conventional large, crewed inspection and survey vessels with uncrewed alternatives such as the DriX USV (Figure 5) can significantly reduce the carbon footprint of offshore operations.
As climate change and sea-level rise continue to impact daily life, the hydrographic profession is not immune to these challenges. In an exclusive interview, Tion Uriam, the national coordinator for hydrography and charting in Kiribati, sheds light on the daunting obstacles faced by the Pacific Island nations and underscores the critical importance of addressing the root causes of these issues.
Uriam goes on to describe how Kiribati is actively working to educate and raise awareness about the significance of hydrography and the impact of climate change. His insight and perspectives offer invaluable lessons for professionals and individuals alike who are seeking to better understand the ways in which we can address these critical issues.
For those looking to delve deeper into this topic, we highly recommend our full interview with Uriam. It’s the perfect way to wrap up why this article was written, as it aims to explore both the opportunities presented by the energy transition and the practical steps that companies can take to embrace greener business practices.
Conclusion
The hydrographic industry must contribute to a more sustainable world by adopting carbon-neutral policies and promoting research and collaboration. Hydrographic institutes and the academic sector play crucial roles in driving innovation and facilitating the transition to a cleaner, more sustainable energy future. A shared vision is necessary to benefit the sector and the planet, and collective action is needed to tackle the climate crisis.
As the global energy transition gains momentum, hydrographic and geophysical survey service providers are taking steps to make their business operations more sustainable. Some providers are developing green crew transfer vessels with energy-efficient hybrid engines to decrease fuel consumption, while USVs provide a costeffective and eco-friendly way of gathering ocean data.

Issue 2 2023 25 Feature
Figure 5: This photo captures the Exail DriX USV conducting a survey in the Bay of Biscay, as photographed by Bernard Jégou.
A vital step towards effective coastal zone management
Mapping the Catalan coast using airborne Lidar bathymetry
 By Charles de Jongh, Sara Pont and Julià Talaya
As part of a Catalan government project to improve the management of its marine environment, the Cartographic and Geologic Institute of Catalonia (ICGC) cooperated with Field to survey the Catalan coastal zone using airborne Lidar bathymetry (ALB). The result was an accurate, detailed topobathymetric elevation model, which will serve as a baseline for effective coastal zone management.
The Catalan coastal zone is vital for biodiversity and human activities such as tourism, fishing and aquaculture. The Catalan government is therefore producing a ‘Map of the marine habitats of Catalonia’, which will
provide an accurate cartography of the Catalan seabed at the bathymetric, geomorphological, sedimentary and ecological levels, revealing the various habitats and species and their extent and distribution.
This knowledge is essential for good planning and management of the Catalan marine environment. It is particularly relevant in the context of protected marine areas of the Natura 2000 network and compliance with EU directive 92/43/EEC on the conservation of natural habitats and wild fauna and flora.
The acquisition of accurate bathymetry up to 50m depth is the backbone of this project. While the 10–50m depth area was surveyed using ‘traditional’ sonar technology, ICGC chose to survey the area from 50m inland to 10m water depth using ALB.
Suitability of airborne Lidar bathymetry
ALB uses laser light to measure water depths from an airborne platform such as an aircraft. It is usually used to map relatively shallow water bodies such as coastal zones, rivers and lakes. ICGC chose ALB because it is a mature technology that is notable for its accuracy, speed and cost-effectiveness. It also has the unique ability to simultaneously map both underwater depths and topographic elevations on land, creating a seamless elevation model of the coastal zone. This transition zone between land and water is difficult to survey using other technologies such as multibeam sonar, as shallow areas can be inaccessible or dangerous to navigate. Sonar technology is also ineffective in shallow areas as the sonar swath width becomes very narrow, so that it takes a long time to survey the area. With ALB, it is possible to fly over an area with a swath width of about 300m at around 250km/h, which is much more effective. While ALB is a niche market within the hydrographic survey industry, demand is growing due to an increasing global need for better coastal zone mapping, for environmental and economic reasons.
Field sensor and equipment
Through a competitive tender process, the Norwegian geodata collection and analysis company Field was chosen to execute the project. Field is specialized in ALB surveys and is the only European company to use the advanced CZMIL SuperNova bathymetric Lidar sensor. The CZMIL (Coastal Zone Mapping and Imaging Lidar) was developed by Teledyne Optech (now Teledyne Geospatial) in cooperation with the United States’ Joint Airborne Lidar Bathymetry Technical Center of Expertise (JALBTCX). With its strong laser pulse and advanced photon
Issue 2 2023 26
Figure 1: Field’s aircraft flying over Catalonia.
About the authors
Charles de Jongh holds an MSc in cartography and geographical information science. He has 20 years of experience in the marine geospatial field, including several roles at software company CARIS (now Teledyne Geospatial), where he provided services to hydrographic agencies. Charles is based in Oslo, where he works for Field, specializing in airborne bathymetric Lidar services.

charles.deJongh@field.group
Sara Pont graduated in biological sciences from the University of Barcelona. Her professional career has always been linked to the conservation of natural heritage. She first worked in non-profit environmental organizations and later in the Generalitat of Catalonia, in the Natural Environment Planning Service, becoming head of the service in 2016. Her focus is on planning projects, from the more strategic planning of nature conservation to the territorial planning of protected natural spaces.
spont@gencat.cat
Julià Talaya holds a PhD in Applied Mathematics. He has worked for ICGC for 32 years in various management roles, including GNSS positioning, aerial surveys, remote sensing and cartography. He has worked with airborne topographic Lidar surveying for more than 20 years and is deputy director of geodesy and cartography.


julia.talaya@icgc.cat
detection technology, it achieves the greatest depth penetration on the market. Integrated into the SuperNova are an Applanix POS AV GNSS & IMU for precise positioning and a PhaseOne 150 megapixel RGB camera.
Planning for the ALB survey
The depth results that can be obtained during an ALB survey range from a couple of metres to about 60m, depending on the capabilities of the sensor used, the bottom reflectivity and the water turbidity. If water is turbid, there are more particles in the water that scatter and absorb light, preventing the laser light from returning to the sensor to provide a depth measurement. In these conditions, the ALB sensor may not be able to detect the bottom beyond a few metres. As water turbidity has considerable local and temporal variation, it is important to take this into account when planning an ALB survey. The highest turbidity in the survey area was in the Ebro river delta. Summer is generally the driest time in Catalonia, with less river runoff and therefore less sedimentation in the Ebro delta. Available satellite imagery also confirmed that turbidity was lowest in the summer, and so the ALB survey was planned for execution in this period. Further preparations consisted of obtaining flight permits, flight plan optimization, sensor installation and a topographic and bathymetric calibration survey.
Survey execution
Figure 1 is a picture taken from Field’s aircraft flying over Catalonia. The ALB survey covered about 300km2 and was executed in 12 days. With a total 42 hours of data acquisition for two to five hours a day,
about 7km2/h were covered. Note that it would have taken several months for the same survey executed by shipborne sonar.

A requirement from ICGC was an initial survey flight with test lines in the turbid Ebro delta, to assess the obtainable depth results. Apart from an area in the south-west that was too turbid, the results were very positive as 10m depth was reached in most of the area. This was no doubt thanks to the CZMIL SuperNova sensor. Based on the test results, ICGC decided to continue surveying the rest of the Ebro delta
situated in the northern region of Catalonia. The bathymetric d provides complete coverage of the area, with the darkest blue h depths exceeding 30 meters.
Issue 2 2023 27 Feature
as well, resulting in a topobathymetric elevation model conforming to the 10m depth requirements.
In the other, less turbid areas along the Catalan coast, the SuperNova had no trouble obtaining full bathymetric coverage to the required 10m depth. In many areas, full coverage down to 25–30m was reached, with maximum water depths of around 35m. Figure 2 provides a visualization of the bathymetry around the Formigues Islands in northern Catalonia, with depths greater than 30m represented by the deepest shade of blue.
Local differences in the obtained maximum depths can be partly explained by turbidity, but also local bottom reflection: in general, lighter sandy bottoms reflect light better than dark bottoms or areas with a lot of vegetation.
Data processing
Field processed the ALB data with CARIS, using automated processes and deep learning algorithms to make an initial classification of pulse returns as land, water surface or water bottom. Terrasolid software
was then used for further classification, flight line matching and conversion from ellipsoidal heights to the local elevation level used in Catalonia.
The result was a clean and accurate topobathymetric point cloud. While the requirement was at least two points per square metre, the resulting dataset contained more than five points per square metre up to 10m depth in most area. Point density decreases with increasing water depth, but there were still 2–5 points per square metre at depths of 15–20m. Digital terrain models and depth contours were derived from the point cloud data and were part of the deliverables. In addition, about 10,000 high-resolution RGB images were acquired and derived orthophotos were created. The land area was overexposed during the image processing, which gave a good view into the water and is useful for habitat mapping. The imagery colours were also added to the Lidar point clouds.
Figure 3 shows the point cloud of an example area around the Vandellòs nuclear power plant. The map indicates with red the location of this area along the Catalan coast.

The water surface has been removed so that the bathymetry is visible. This is a full topobathymetric model to about 22m depth (not cut off by the depth extension of the sensor but by the area to survey). The first image shows the point cloud coloured based on the orthophoto.
The second image shows the same point cloud based on classification. By using several customized algorithms to distinguish between bottom returns and marine vegetation, Field is able to classify both of them separately. This can be seen in the image with bathymetry in blue and marine vegetation in dark green.


Survey results
ICGC was pleased with the quality and detail of the resulting datasets, such as the submarine discharge outlets along the coast that were seen in the data and the remains of an old lighthouse found underwater in the Ebro delta. An added advantage of the short and efficient coastal zone survey using ALB is that the resulting dataset is more homogeneous and coherent than surveying several patches over longer or multiple periods using sonar.
To check the accuracy of the survey, Tecnoambiente surveyed a test area using multibeam sonar. Figure 4 shows the 0–10m bathymetric Lidar data and the pattern of the multibeam sonar survey, coloured
Issue 2 2023 28
Figure 3: To provide an example, a point cloud of the Vandellòs nuclear power plant’s vicinity is shown here. The first image displays the point cloud with colours based on the orthophoto, while the second image shows the same point cloud with colours based on its classification.
Overview map of Catalonia. The red marker denotes the area shown in Figure 3.
according to the difference between the two datasets. In all the area that is white/yellow, the difference is not more than a few centimeters. The average root-mean-square (RMS) difference value between the datasets was 12cm, which was well within the requirements. Differences are generally larger in the shallows than in deeper areas, which can be explained by the five-month gap between the two surveys as well as the water bottom being more dynamic in the shallow area.

In general, the results confirm for ICGC that ALB is the best technology for surveying the Catalan coastal zone, and it will probably be used more often in the future, for example to monitor changes.
Next steps
ICGC will continue working on the delivered products and create a seamless topobathymetric model for the whole of Catalonia, integrating the newly acquired ALB data with existing topographic Lidar data and the multibeam sonar bathymetry for the deeper areas. This integrated elevation model will serve as a baseline for many purposes, such as modelling the stability of beaches with different scenarios of sea-level rise and an increase in the number of storms. It is therefore an important resource for researchers, policymakers and other stakeholders in supporting decision-making processes for the sustainable management of the Catalan coastline and marine environment.
Subsidy note
This project executed by the Catalan General Directorate of Environmental Policies and the Natural Environment of the Department of Climate Action, Food and Rural Agenda is cofinanced by the European Maritime and Fisheries Fund and the Department of Climate Action, Food and Rural Agenda.
SWiFT Deep CTD

Issue 2 2023 Feature
To find out mor e co nt act sales@v al ep ort.co.uk + 44 18 0 3 869292 | ww w.va le po rt .co. uk
Designed for a seamless workflow. The new SWiFT Deep CTD is the latest in Valeport’s popular range of SWiFT profilers and delivers enhanced accuracy and versatility for those requiring CTD measurements to depths of 6000m. Taking
SWiFT to new depths
Figure 4: The 0-10m bathymetric Lidar data and the multibeam sonar survey pattern are presented here, with differences between the datasets color-coded for visual comparison.
Autonomous and uncrewed mapping of the unique ecosystem of Gialova Lagoon
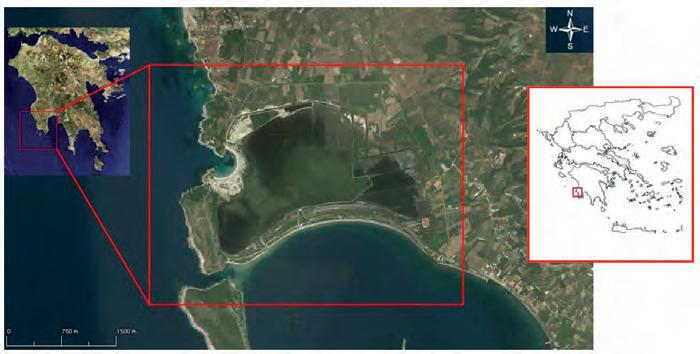
Exploring shallow lagoons with USV mapping technology
By Maria Papakonstantinou, Elias Fakiris, Maria Geraga and George Papatheodorou, Greece
Unmanned surface vehicles (USVs) are increasingly being used for the mapping and management of shallow-water environments such as lagoons, rivers and estuaries, due to their economic and ecological benefits. The Gialova Lagoon wetland in south-west Peloponnesus, Greece, is particularly difficult to navigate using crewed vessels and was therefore studied using a USV to identify the bathymetry, morphology and submerged aquatic vegetation coverage of the lagoon’s floor. The USV platform was equipped with various devices, including sidescan sonars, single and multibeam echosounders, environmental sensors and waterproof cameras. The USV successfully navigated the shallow waters of the lagoon and a ground-truthing survey was conducted based on the collected data.
Background
The increasing use of uncrewed and autonomous surface vessels for the exploration, mapping and management of extremely shallow coastal and transitional waters is helping researchers to discover the natural processes taking place in these challenging shallow underwater environments (lagoons, near shore waters, estuaries, rivers, harbours, artificial lakes, etc.). These environments are largely unmapped, as extremely shallow sections are inaccessible to manned vessels. USVs can offer significant economic and time savings and a single USV can replace a manned vessel as it can navigate extremely shallow environments. Moreover, USVs use eco-friendly survey methods and significantly reduce the impact on the ultra-shallow and transitional environments, in particular ‘fragile’ environments protected under international conventions.
Survey area and objectives
The Gialova Lagoon wetland is one of the few remaining Important Bird and Biodiversity Areas (IBAs) along the south-west coast of Greece and is designated a Special Protection Area (Fig. 1). It is also a Natura 2000 area and fulfils the Ramsar Convention criteria for wetlands. It has a water depth
of less than one metre, covers an area of about 2.5km2 and is connected to the adjoining Navarino Bay via a small artificial channel. It’s extremely shallow waters make it very difficult to navigate using a crewed vessel, which is why a USV was chosen, due to its ability to navigate waters as shallow as 40cm.
The main purposes of the survey were to identify the bathymetry, morphology and submerged aquatic vegetation coverage of the lagoon’s floor and visualize the spatial distribution of its sedimentological characteristics, by means of marine geophysical techniques onboard the USV.
USV platform specifications
USVs have the advantage of hosting various types of equipment, such as sidescan sonars, single and multibeam echosounders, a wide variety of environmental sensors (temperature, salinity, dissolved oxygen, chlorophyll-a) and waterproof cameras. In this study, the USV
Issue 2 2023 30
Figure 1: Location of Gialova Lagoon (Google Earth-based imagery).
About the authors
Maria Papakonstantinou is a research associate at the Laboratory of Marine Geology and Physical Oceanography in the Geology department of the University of Patras. She holds an MSc in Oceanography – Exploration, Mapping and Management of the Marine Environment and an MSc in Ecology, Protection and Management of the Natural Environment. Her main interests include contamination assessment in polluted sediments in transitional waters and marine habitat mapping via remote sensing techniques. She has presented her work at national and international conferences.
Dr Elias Fakiris is a research associate at the Laboratory of Marine Geology and Physical Oceanography in the Geology department of the University of Patras. He has multidisciplinary scientific experience, ranging from passive and active acoustics, acoustic habitat mapping and geophysics to remote sensing, machine learning and hydrodynamical modelling. He has been appointed a visiting scientist at the Centre for Marine Research and Experimentation (CMRE), La Spezia, Italy. He has authored 37 articles in SCI journals and 40 articles in conferences. His work has received 954 citations (h-index: 17).
Maria Geraga is professor of Archaeological Oceanography at the Geology department of the University of Patras and a member of the Laboratory of Marine Geology and Physical Oceanography. Her research interests cover a broad range of topics in marine sciences: marine geoarchaeology, palaeoceanography, paleoclimatology, marine geology, marine pollution and marine habitat mapping. She has published many papers, with more than 2,000 citations (h-index: 25).

George Papatheodorou is professor of Geological and Environmental Oceanography at the Geology department of the University of Patras, Greece, and director of the Laboratory of Marine Geology and Physical Oceanography. His research interests cover a broad range of topics in marine sciences: marine geology, seabed methane seepages, marine pollution, marine habitat mapping and marine geoarchaeology. He has coordinated many national, international and EU-funded research projects and published many papers, with more than 5,000 citations (h-index: 33–41).

platform, which was provided by Intelligent Machines Single Member P.C., along with the accompanied software, was set up to meet the specific requirements of the area. Specifically, the USV platform type was that of a catamaran, offering greater stability in lateral movements. Its small size (1.7m long and 0.6m wide) and light weight (less than 15kg) made it easy to transfer, while it was able to support equipment weighing over 15kg (Fig. 2).
The USV was equipped with the following systems: (i) a highfrequency (455 and 800kHz) sidescan sonar (SSS) and singlebeam echosounder (SBES) system (Lowrance – Elite-5 Ti) for the insonification of the lagoon’s bottom, (ii) a digital high-resolution camcorder placed in a waterproof case for the ground-truthing data (real-time records and snapshots) and (iii) a real-time kinematic GPS (RTK GPS) (Emlid Reach M2) with greater than 10cm accuracy, used to position the USV relative to a base station on shore.
Field survey
In a preliminary phase, an imprint of the lagoon’s perimeter between the 40cm and 60cm isobaths was made onboard a small fishing boat using the high-resolution Lowrance, to delineate the survey area. The

Lowrance operation pulse frequency was chosen at 455kHz, due to the extremely shallow and high turbidity waters. After setting the area boundaries, tracklines were designed in the Mission Planner software (provided by Intelligent Machines Single Member P.C.). The USV operator was therefore able to pre-programme the waylines for the platform to follow. The total length of the SSS tracklines was about 29.5km and the space between surveying lines was 30m, offering a 10m overlap between adjacent sidescan records. The USV operated at a speed of 1m/s (≈ 2 knots) for about nine working hours in total.
Any difficulties encountered during the USV survey were instantly resolved. The main difficulties were plants and sticks becoming entangled in the propellers and obstacles on the programmed route. To deal with these, a plastic net was positioned to protect the propellers and the route was redesigned or the course was changed manually. In some parts of the lagoon, the aquatic vegetation rose above the water surface or was floating, making it impossible for the USV to enter these areas.
Based on the collected SSS data, a ground-truthing survey was designed and conducted that consisted of sediment and submerged aquatic vegetation sampling.
Issue 2 2023 31 Feature
USV performance – line-keeping capability
The log files generated by the mission planning software were used to assess the autotracking performance of the USV along the planned waylines. This can be evaluated by examining the across-track distance of the USV compared to the planned wayline (x-track) and its heading over time. The x-track mean value for the full survey was close to zero with a standard deviation of 5cm and maxima of 40cm, while the mean deviation of the heading was 2 degrees. An example of a log showing x-track and heading versus time is shown in Figure 3.
The performance of the USV was considered satisfactory in terms of auto-tracking fidelity, executing smooth heading (yaw motion) and response to wind and wave drifting forces.


Data processing
The geophysical data was processed at the Laboratory of Marine Geology and Physical Oceanography (Oceanus-Lab, https:// oceanus-lab.upatras.gr/) of the Department of Geology, University of Patras.

Bathymetry
The SBES bathymetric data from the Lowrance echosounder was processed in the Reef Master software environment. Other information acquired by the Lowrance echosounder was the first and second bottom echo returns, which are associated with seafloor ‘roughness’ and ‘hardness’, respectively. Notably, the shape and strength of the echoes depended on the morphological and lithological features of the lagoon’s floor, such as hardness, sediment grain size, compactness and roughness of sediment and submerged aquatic vegetation (SAV).
Issue 2 2023 32
Figure 2. The USV platform with equipment (top) and during operation (bottom).
Figure 3. Graphical example of the auto-tracking performance of the USV. The heading and acrosstrack distance of the USV compared to the planned wayline plotted versus time along a 5min in-duration wayline.
Lagoon’s floor classification
The sonographs (SSS records) were imported into the Reef Master software to apply radiometric and geometric corrections and create a sidescan sonar mosaic. Two approaches were used to classify the lagoon’s floor in distinct floor types based on sediment characteristics and SAV (Fig. 4).
A manual classification of the lagoon floor was made qualitatively using as a background the SSS mosaic, by means of visual observation and verified by the underwater photographs and the video recordings extracted from the camcorder as well as the sediment and SAV sampling. More specifically, classification was made depending on the lagoon floor’s acoustic type characteristics (low or high backscatter intensity and texture characteristics) and the presence or absence and the patchy or continuous spatial distribution of all components recorded in the lagoon’s mosaic (sediment types, submerged vegetation, drainage embankments, etc.).


As a second approach to the floor classification, an unsupervised acoustic classification of the collected SSS data was made by the Matlab toolbox SonarClass, an acoustic classification system based on analysing local backscatter texture characteristics of swath sonar data. The unsupervised classification was made taking into consideration the areas between 3–15m floor range of each SSS recording channel. Specifically, 3m from the nadir zone and 5m from the edges were removed due to acoustic noise in the acquired SSS data.
All maps were generated using ArcGIS 10.6 software and the geographical coordinate system used was GCS_WGS_1984 projected in UTM Zone 34N. Ortho-corrected aerial photographs acquired during 2007 and 2009 and the Google Earth engine were used as a background.
Main results
In total, geophysical data was collected from an area of 0.85km2 in the extremely shallow environment of Gialova Lagoon. The sidescan sonar mosaic is presented in Figure 5, exhibiting considerable seafloor type spatial heterogeneity.
The detailed bathymetry map showed that Gialova Lagoon is an extremely shallow-water body with a maximum water depth of 0.70m. Two very shallow depressions (basins) can be seen, one in the south-west and the other in the eastern part of the lagoon. An elongated ridge can also be seen, running from east to south-west
Issue 2 2023 33 Feature
Figure 4. Workflow chart.
Figure 5. Sidescan sonar mosaic of Gialova Lagoon floor. Dark tones represent low reflectivity and light tones represent high reflectivity.
in the centre of the lagoon, and a less visible ridge running from north to south (Fig. 6).
The SSS mosaic classification was made based on the reflectivity and the alternation of the reflectivity of the sonar records (texture) and resulted in six acoustically distinct types (Fig. 5 and 7). The morphological characteristics of the lagoon’s floor were revealed to be comprised mostly of submerged aquatic vegetation, with a homogenized or patchy spatial distribution, followed by fine sediments, bivalves, ridges and drainage embankments. The spatial distribution of the backscatter coincided well with the morphology and the subaqueous vegetation of the lagoon.
The unsupervised classification results correlated very well with the acoustic type (AT) spatial distribution, as defined by the manual classification procedure, confirming that the lagoon’s floor is most accurately classified in six distinct types (Figs. 5 and 7). AT 1 exhibits the lowest reflectivity in the lagoon with a patchy acoustic pattern that is locally more intense. On the contrary, AT 2 shows the highest reflectivity in the lagoon floor with a patchy pattern and is restricted to the western end of the lagoon.

Acknowledgments
The authors would like to warmly thank Nikos Mavrommatis, founder of Intelligent Machines P.C., Greece, for his valuable support in the field work.
REFERENCES
G. (2009). Sonar Class: A MAΤLAB toolbox for the classification of side scan
Fakiris, E.,
imagery, using local textural and reverberational characteristics. In: Proceedings of the 3rd International Conference on Underwater Acoustic Measurements: Technologies and Results (Εds. Papadakis and Bjorno) Nafplion Greece, 21–26 June 2009, Vol. III, pp. 1445–1450.
AT 3 through AT 5 represent intermediate reflectivity types between AT 1 and AT 2. AT 6 has a linear arrangement and represents a man-made ridge in a SW-NE direction. The groundtruthing survey showed that the reflectivity of acoustic types was mainly affected by the submerged aquatic vegetation density.
Conclusion
The USV survey revealed the bathymetry and floor classification of the lagoon in terms of morphology, sediment granulometry and submerged aquatic vegetation. A USV is a very effective tool for mapping extremely shallow lagoons and hard-to-reach areas and, in the case of Gialova Lagoon, it successfully met the requirements of the field survey. Its small size and light weight, ability to support various types of equipment and sensors, convenient assembly and disassembly, neutrality to local weather conditions and ability to cover large areas in a few hours at a low cost, are just some of the advantages. Most importantly, USVs can be considered as the only means of surveying extremely shallow-water environments and land-locked water bodies, since conventional survey vessels are often unsuitable, inefficient or incapable of completing a successful survey in such environments.
As USVs have zero emissions, the overall carbon footprint of a USV survey is extremely low. The overboard discharge of pollutants and fuel from crewed survey vessels should also be considered. Moreover, conventional research vessels are noisy with significant impacts on marine life. USVs have none of these problems, making them ideal for surveying fragile environments that are vulnerable or sensitive to change or easily damaged, such as lagoons, estuaries and lakes. These advantages become even more critical when it comes to surveying environments that are governed and protected by international conventions (Natura 2000, Ramsar).

Issue 2 2023 34
Papatheodorou,
sonar
Figure 6. Bathymetric map of Gialova Lagoon.
Figure 7. Map showing the lagoon floor acoustic types (AT), as defined by the manual classification based on the sidescan sonar mosaic and the unsupervised classification (SonarClass).
Ensuring the safety and protection of Swiss river and reservoir infrastructure
Bathymetric data optimizes hydropower generation in Switzerland
 By Ephraim Friedli and Francisco J. Gutierrez
The acquisition of bathymetric and sidescan data is essential for the Swiss energy company Axpo to maintain its hydropower infrastructure, especially as debris that glaciers dump into Switzerland’s rivers and lakes can severely damage machinery. The monitoring and measurement of siltation and scouring help to secure optimal power generation, and Axpo’s dam safety department has used an interferometric bathymetric sonar for these purposes since 2019. In 2022, the team received a new AI upgrade for the sonar, which has already been put to use to make sure that the water keeps flowing.

Issue 2 2023 35 Feature
Figure 1a & 1b: Axpo’s new survey boat is small, but importantly features a flat bottom for solid seakeeping and a rigid mount for the installation of the bathymetric sonar and its components.
Today, more than 60% of Switzerland’s electricity is generated by hydropower, and more production capacity is planned to meet growing consumption and negate a potential energy gap. The new capacity will come from major projects and smaller innovations, as well as optimizations and extensions, all of which require accurate bathymetric or sidescan data.
As an example of a smaller innovation, and with an understanding that every kilowatt-hour will count in the future, Axpo installed a small 2.5MW turbine in the water transfer line between the Curnera and Nalps reservoirs. This previously untapped resource came into operation in early 2022 and is expected to produce up to 10 million kilowatt-hours of electricity per year, enough to supply around 2,200 households.
While new capacity is clearly required, maintaining existing capacity is a huge challenge, especially considering the amount of glacier debris that makes its way into the water network, potentially causing severe damage to the machinery at hydropower plants in addition to impacting ecosystems further downstream. Bathymetric and sidescan data are essential to monitor the build-up of these sediments, so that engineers can decide on the best course of action.
Data collection platform
Axpo’s dam safety department is tasked with collecting, distributing, storing, analysing, processing and presenting data that
accurately shows how material collects around the water inlets to the company’s hydropower stations. The department monitors and measures siltation with the aim to inform dredging and other engineering works (including major works such as raising the height of water inlets), to maintain an optimal flow of water with as little foreign material as possible.
While protecting the electricity-generating equipment to avoid shutdowns and reduce longterm fatigue is essential, the data collected also helps engineers to fine-tune the systems based on measured water volumes.
The department’s primary tool for collecting data is a GeoSwath 4 bathymetric sonar provided by UK manufacturer GeoAcoustics Ltd, which has so far collected more than 200km of survey lines covering approximately 75km of river and lakebed across the Axpo network. The dam safety team has spent more than a month in operational days using vessels of opportunity as their survey platform. As of September 2022, however, the entire installation including instruments has been installed in a single frame of reference on a new boat (Fig. 1).

Measuring siltation and scouring
The boat and sonar are now being used to monitor the build-up of silt around important infrastructure such as water inlets and the area of waterway surrounding and including the power generation area, also in the Nalps reservoir. Located 1,908m above sea level and with a dual curve arch dam of 127m and dam crest of 480m, the lake has a water volume of 44.5 million cubic metres. This latest figure was informed by a survey to calculate the siltation levels and the existing reservoir and usable water volumes, which produced the results shown in Figure 2.
Figure 3.1 shows the results of another survey, where the team using the bathymetric sonar acquired fairly granular data on the level of siltation at a weir on the headwater of a river power plant. This data has proven an effective tool for pre- and post-dredging surveys, here and at many other similar features across the rivers and lakes monitored by the Axpo team. The data is used for both engineering purposes and verification at the end of a dredging project, as shown in Figure 3.2.
Issue 2 2023 36
Figure 2: Coloured elevation model of the Nalps reservoir collected to update historical data acquired before the lake was originally filled.
The monitoring of sediment build-up relies heavily on bathymetric and sidescan data
While the sonar measures the build-up of silt and debris at the interface between the river or lake and the hydropower generating facility, it is also used by the Axpo team to measure the effects of a phenomenon known as scouring at critical areas across the network. The main aim is to protect the integrity of key infrastructure such as weirs and water inlets from damage caused by the constant movement of water and debris. While scouring is often measured using sidescan sonar, the bathymetric sonar provides the resolution and quality needed for an accurate view of what is happening, allowing Axpo to monitor and protect underwater infrastructure at various sites.
Artificial intelligence
The dam safety department recently evaluated a new AI data processing solution for the bathymetric sonar that automatically detects and eliminate outliers in the data, making real-time data streaming during a survey possible. At this stage, the benefit of this for the Axpo team has primarily been in speeding up processing to the final product as the AI system produces quality-controlled data that provides a significant head start in post-processing. Axpo has also recognized the potential for the AI to improve survey efficiency, as the streamed data can inform the pilot and surveyors of specific features below the boat in real time.

The AI system has been developed through ongoing partnership with AI specialists at the University of East Anglia and GeoAcoustics’ R&D team. Traditional phase-measuring data filtering relies heavily on an expert user setting up filters over the raw data to ‘clean’ it, so the team set out to automate some very specific technical aspects of the data acquisition process. The result is a system that will help Axpo to acquire clean, presentable data much faster.
Considering that new schemes to improve hydropower capacity across Switzerland will demand a continuous flow of updated bathymetric data, any streamlining of survey processes – such as the use of AI in data processing – are welcome. Axpo’s new survey


About the authors
Ephraim Friedli is an engineering specialist at Axpo Power AG, where he is responsible for bathymetric measurements in the Hydro & Biomass division. He previously worked as a scientific assistant at the Institute of Geodesy and Photogrammetry at ETH Zurich, where he obtained a doctoral degree.
Francisco J. Gutierrez is product specialist for the GeoSwath 4, Pulsar and TOPAS systems manufactured by GeoAcoustics Ltd. He previously worked as a technologist for the Spanish Research Council and as an associate professor of electronics at the University of Cádiz, Spain.

boat will contribute to better efficiency too, as the surveyors can tow it to the river or lake that needs new data or existing data to be verified without having to find an available boat before installing the hydroacoustic package.
The combination of the team’s new boat and AI-upgraded sonar will continue to help support the optimization of existing generating capacity and the build-up of new capacity in the light of the potential energy gap issues during winter and the country’s target to reach net zero carbon emissions by 2050.

Issue 2 2023 37 Feature
Figure 3.1: Elevation model of the headwater of a river power plant.
Figure 3.2: 2021/2022 difference model in the headwater of a river power plant.
Evaluating the impact of offshore wind farms on fish biomass
Offshore wind energy development, which is expanding rapidly along the East Coast of the United States, has the potential to play an important role in US efforts to combat the climate crisis and build a clean energy economy. In the north-east alone – historically a fishing area contributing to the economies of several coastal states and providing a livelihood for thousands of local fishermen – these wind farms will be spread across 2.4 million acres within the next ten years. The installation of fixed and floating turbines will have an effect on the ecology and biology of these areas, as well as on human activities (commercial and recreational fishing).
NOAA Fisheries Northeast Fisheries and Science Center (NEFSC) has been conducting research and monitoring to better understand the potential effects of offshore wind energy development on fish, shellfish, fisheries, protected resources and their ecosystems as well as to provide the US Bureau of Ocean Energy Management (BOEM) and other federal agencies, states, tribes and stakeholders with information on fisheries operations and the potential socio-economic impacts of offshore wind projects on fishing communities.
Observing and monitoring
As offshore wind farms will soon become an integral component of the New England seascape, novel, state-of-the-art methods will be required to survey and monitor the fish that reside in and migrate through these areas. Observing and monitoring the pelagic

ecosystem can often be overshadowed by the demersal and benthic communities, yet it is a critical component of the life history of many commercially and ecologically important species. Limited capability to physically sample the biota with capture gear in and around offshore wind farms necessitates using complementary sampling methods to monitor the pelagic ecosystem. Active acoustic technologies, such as the Exail SeapiX multi-split-beam echosounder, make it possible to survey large areas quickly and efficiently and have a decades-long track record of mapping spatio-temporal distributions and estimating abundance and biomass.
Block Island Wind Farm survey
Exail collaborated with NOAA NEFSC on a four-day acoustic and biological survey of the Block Island Wind Farm – a five-turbine,
38
30MW wind farm located 6km off the coast of Rhode Island that has been operational since 2015 – to gain insight into the spatial distribution of fish species in and around the turbines using the SeapiX multibeam system.
Designed and developed for fisheries research as well as commercial fishing, the SeapiX is a 150kHz solid state multi-splitbeam sonar consisting of dual antennas in a symmetric Mills Cross architecture covering 2° x 120° on several swath.
During the mission, the SeapiX sonar was pole-mounted on NOAA’s R/V Gloria Mitchell, a 72-foot (22m) stern trawler also outfitted with a hull-mounted, downward looking Simrad ES70, a 38/200kHz echosounder. The SeapiX was oriented both downward and sideways to characterize fish aggregation in middle and near surface waters in and around each turbine. A variety of survey designs were conducted, for instance spiral and straight line transect, to map 2D and 3D distribution. The volumetric acoustic data provided compatible data with historical fisheries data of fish aggregation sizes, shape, density and locations. The SeapiX can also estimate avoidance behaviour, which may significantly reduce measurement bias on stock estimates.
Fish were also collected using hook and line to verify the sources of acoustic backscatter and to measure length, sex and diet. It was determined that Black Sea bass (Centropristis striata) was the most commonly caught species and appeared to be the primary constituent of the fish aggregation mapped by the acoustic systems.
The acoustic data was also analysed in reference to the turbines to investigate


utilization of the turbines and/or surrounding areas as habitat. Data was also collected during the day (first three days) and night hours (final day) to obtain pilot data on the spatial and temporal distributions in and around the turbine structures.
The SeapiX sonar, given its frequency range, allows for safe operation in the wind farm areas and offers sufficient resolution to observe animals very close to the turbine structures.
Conclusion

This Block Island Wind Farm survey operation represents the first step in NOAA’s plan to observe and understand fish distributions in a wind farm and to provide answers to the underlying scientific questions on whether wind farm turbines have an aggregation or repulsive effect on biomass, or no effect at all. In the absence of ‘before’ data, it is impossible to offer a definitive conclusion. However, the preliminary conclusions from this study suggest that these structures enhance abundance at the scale of individual turbines but do not have an effect on the biomass on the scale of the wind farm area.
The next step in this study requires surveying a future wind farm construction site, and planning is currently underway to conduct a survey using the SeapiX sonar integrated on Exail’s DriX uncrewed surface vehicle.

Guillaume Matte, R&D manager for SeapiX at Exail commented: “It was a fantastic opportunity to run these tests together with NOAA experts. Marine renewable energy installations require specific assessment surveys to qualify their impact on biomass, and we believe that SeapiX adds real value to this application. It offers a more insightful experience for fish detection and mapping and provides valuable information on fish behaviour as well. We are grateful to the NOAA fishery scientists on-board during this survey for their discerning conversations and for sharing their enthusiasm about SeapiX.”
“SeapiX expanded our ability to map fish distribution in and around turbines and was a great complement to the traditional singlebeam echosounder”, added Michael Jech, research fisheries biologist at NEFSC.

Sponsored Article Issue 2 2023 39
Figure 1: Location of Block Island Wind Farm survey area. A variety of survey designs were conducted: spiral patterns around each turbine, parallel transects orthogonal to the line of turbines, parallel transects parallel to the line of turbines, and exploratory patterns.
Figure 2: A 3D representation showing the spatial position of fish around turbine 5. The trajectory of the survey is represented in green, and the fish detections are represented as points. Some schools were detected near the turbine.
Rationale
A closer look at a new bathymetric model covering Denmark’s EEZ
Introducing the Denmark Depth Model
 By Giuseppe Masetti, Danish Geodata Agency, Denmark
The Denmark Depth Model (DDM) is a digital bathymetric model covering Denmark’s exclusive economic zone (EEZ). It was developed based on hundreds of bathymetric survey datasets and historical sources and is the first model released by the Danish Geodata Agency to cover Danish waters with a grid resolution of 50 metres. In light of increasing environmental concerns, the DDM makes a significant contribution to the United Nations Sustainable Development Goal 14, which aims to “conserve and sustainably use the oceans, seas and marine resources for sustainable development.”

The public availability of several digital bathymetric models (DBMs) may give the false impression that the seafloor bathymetry of the oceans is largely known at full coverage. This impression is however easily disproved by evaluating the content of these models. For instance, the General Bathymetric Chart of the Oceans (GEBCO) lacks actual depth measurements for the majority of its coverage. Although such models incorporate data from both single-beam echosounders (SBES) and modern high-resolution multibeam echosounders (MBES), they largely rely on interpolation and altimetry-derived data.
Furthermore, for model depths based on actual measurements, the density and accuracy of the ‘soundings’ (bathymetric measurements) vary widely, which heavily impacts the reliability
of the estimated depths. Historical depths are mostly derived from lead-lines, and are therefore sparse and obtained from a minimal seafloor area (i.e. the fewcentimetres diameter of the used weight). Compared to lead-lines, SBES provides denser depth measurements. However, although the position of the measured depth is assumed to be at the nadir of the surveying platform, its actual location could be anywhere in the ensonified area.
Issue 2 2023 40
Figure 1: The Denmark Depth Model covers Denmark’s economic exclusive zone at a resolution of 50 metres.
Figure 2: Workflow showing the main steps in the creation of the Denmark Depth Model.
Unquestionably, a modern MBES provides a higher density and resolution than lead-lines and SBES. Unfortunately, however, the collection of high-resolution bathymetry is not only expensive and frequently challenging, but also time-consuming as it is only able to cover relatively small regions at one time.
The adoption of advanced techniques to improve the compilation of the available sparse soundings into a DBM has proven beneficial to many fields, such as geophysics, geology, biology and oceanography. The current poor knowledge of the ocean seafloor represents a limitation to our understanding of critical ocean processes that provide resources and goods for humanity, controlling the climate and more generally sustaining life on Earth. Contributing to overcome this limitation is in line with the United Nations Sustainable Development Goal 14 and represents the main motivation for the creation of the DDM (Fig. 1).
Data management and model creation
Starting in early 2020, the Danish Geodata Agency attempted to organize available bathymetric datasets in Danish and Greenlandic waters into a modern geospatial data management system named DYBDB, and developed elaborate methodologies to compile these data sources into DBMs and other valuable products (e.g. hydrographic survey overviews). The DDM represents the first released bathymetric product created employing DYBDB. By improving the bathymetric coverage in the Danish EEZ, which is currently provided by EMODnet Bathymetry, one of the major motivations for the creation of the DDM was to support environmental studies and other research efforts in the North Sea and the Baltic Sea.
During the processes of model creation and validation, DYBDB provides access to datasets – metadata, point clouds and bathymetric grids – as well as storage for the intermediate products and the finalized model. The overall compilation approach is described in Figure 2. The mechanism for compiling the hundreds of sources reduces the computation time by updating only the model tiles affected by data changes. More generally, the creation of a robust workflow facilitates the integration of new data sources in the DBM while preserving consistency in the presentation of the finalized product. Future work will explore automated procedures to improve the efficiency of the current quality control of the finalized DBM.
The latest EMODnet Bathymetry DTM (released in December 2020) has a grid resolution of 1/16 arc minutes (about 115m). As such, to improve the resolution of the publicly available bathymetry within Denmark’s EEZ, the DDM aimed for a regularly spaced grid resolution of 50 metres. This was judged to represent a reasonable tradeoff between areas covered by high-resolution surveys (e.g. in the Kattegat area) and regions with sparse historical soundings (e.g. a large part of the North Sea).

First release
Official publication of the first release of the DDM took place on 1 November 2022. The downloading services are available on the Danish Geodata Agency website (https://eng.gst.dk/danishhydrographic-office/denmark-depth-model). The DDM is also available in OGC web services (i.e. Web Map Service).
About the author
Giuseppe Masetti
After having served with the Italian Navy as a hydrographic officer, Giuseppe Masetti joined the UNH’s Center for Coastal and Ocean Mapping as a researcher. Masetti has worked at the Danish Geodata Agency since 2019.

The released bathymetric layer covers an area of 232,679km2, and most (~97.5%) of the cells are less than 100m deep. Based on the auxiliary source layer, 18% of the populated grid cells are derived from MBES surveys and about 75% from interpolation. The large variability in data density based on the types and years determined areas in the model with detailed bathymetry derived from MBES surveys and others that were heavily smoothed (because of the interpolation between sparse soundings).
The DDM is generated using an averaging approach, and is therefore not targeted for safety of navigation. However, several of the steps described in the compilation workflow can be re-used for future works targeting the development of a navigation surface to streamline the production of nautical charts.
The adopted interpolation approach based on the Natural Neighbor algorithm shows positive results in preserving the details of the areas with dense MBES data, as well as in transitioning between areas of wildly different density. However, future work may involve exploring alternative interpolation approaches for introducing
Issue 2 2023 41 Feature
Figure 3: Perspective view of the Denmark Depth Model at the Great Belt (facing north).
Future work may involve exploring alternative interpolation approaches for introducing further improvements in the DDM
further improvements in the DDM. Future releases of the DDM are also likely to include additional data to reduce the interpolated areas, extend the coverage of the inner waters (i.e. fjords, rivers and lakes) and reduce all the depth values to a common vertical datum (e.g. mean sea level).
Significantly increasing the percentage of high-density data in the coming years will be resource-intensive, also because the acoustic swath of MBES is limited by the relatively shallow depths surrounding Denmark. This consideration is one of the main drivers for exploring alternative data sources, such as bathymetric Lidar and satellite-derived bathymetry – both limited to shallow waters in coastal areas – and crowdsourced bathymetry (CSB).
Several aspects of marine geosciences, such as seafloor characterization, sedimentary studies or offshore engineering, require a high-quality bathymetric model like the DDM. The metadata and documentation associated with the DDM aim to facilitate its discovery
by researchers when searching for the bathymetry best fitting their specific purposes. The original datasets, which are not distributed with the model, are described in the auxiliary layers to provide clear information about the bathymetric sources locally in use by the DBM.
Facilitating access to marine data is a critical component of the EU Marine Strategy Framework Directive and the EU Marine Knowledge 2020 agenda, including the EMODnet initiative. The released DDM is also a data source for the coming release of EMODnet Bathymetry.
Conclusions
The DDM was created from hundreds of modern datasets (described in the auxiliary layers), historical sources and interpolation. The resulting model represents the first publicly released model covering the Danish EEZ at a resolution of 50 metres.
The DDM significantly improves the bathymetric coverage in Denmark’s EEZ compared to that provided by EMODnet Bathymetry. As such, and in times of increasing environmental concerns, the DDM provides a relevant contribution to conserve and sustainably use the oceans, seas and marine resources for sustainable development, as described in the United Nations Sustainable Development Goal 14.
More information:
• https://eng.gst.dk/about-us/news-archive/2022/explore-the-depths
• https://www.mdpi.com/2673-7418/2/4/26

Multimedia:
• https://eng.gst.dk/Media/638028950196355227/DDM_avg50m_v1_GSTlogo.mp4
Issue 2 2023 42


Discover the HUGIN family kongsberg.com/AUV resolution survey navigation solution with the best Powerful in-mission planning within a compact, lightweight design HUGIN The most successful AUV ever made
SMART SUBSEA SOLUTIONS

Delivering data in most adverse conditions: underwater acoustic modems with advanced communication technology and networking


Accurate USBL and LBL positioning of underwater assets
Modem emulator and other cost-saving developer tools
Autonomous surface vehicle for bathymetry, monitoring, search & rescue, and AUV support


EvoLogics.de Meet us at OCEAN BUSINESS! 18- 20 April 2023 Southampton, UK STAND M4
sales@evologics.de sales-us@evologics.com
