Mixed-reality photogrammetry in focus
Combining photogrammetry, drones and VR/AR technology in real time


Serving society for the benefit of people and planet
AI starts a new chapter for geodata usage
Exploring the potential of videogrammetry
the geospatial community www.gim-international.com Issue 2 2024 Volume 38
Empowering

RIEGL LiDAR for Airborne Scanning Fast. Precise. Efficiently.


75° FOV up to 1.25 MHz meas. rate operating


75° FOV up to 1.25 MHz meas. rate operating altitude AGL up to 5,900 ft*)


60° FOV up to 1.33 MHz meas. rate operating altitude AGL up to 12,800 ft*)


for surveying at mid flight altitudes e.g. corridor mapping, city modeling,
*) operating altitudes AGL given for target reflectivity in excess of 20%


60° FOV -20°/-10°/0°/ 10°/20° NFB up to 2 MHz meas. rate operating altitude AGL up to 7,550 ft*)


NFB (Nadir/ Forward/Backward) Scanning for an optimal coverage of complex and


58° FOV forward/backward and nadir look up to 2.66 MHz meas. rate operating altitude AGL up to 12,800 ft*)


60° FOV regular scan pattern
VQ-1460: up to 2.93 MHz meas. rate
VQ-1260: up to 1.47 MHz meas. rate operating altitude AGL up to 14,450 ft*)
VQ-680


Explore the RIEGL Ultimate LiDARTM Technology www.riegl.com


dual channel turnkey system for high altitude, large scale turnkey system for high altitude large scale mapping for customized system configurations


for surveying at high flight altitudes e.g. wide area mapping of complex environments


 VQ-1560II-S
VQ-480II
VQ-1260 / VQ-1460
VQ-780II-S VQ-580II-S
VQ-1560II-S
VQ-480II
VQ-1260 / VQ-1460
VQ-780II-S VQ-580II-S
Austria | USA | Japan | China | Australia | Canada | United Kingdom | South America | Germany
Director Strategy & Business Development
Durk Haarsma
Financial director Meine van der Bijl
Technical director Huibert-Jan Lekkerkerk
Contributing Editors Dr Rohan Bennett, Frédérique Coumans
Head of Content Wim van Wegen
Copy-editor Lynn Radford, Englishproof.nl
Marketing Advisors Myrthe van der Schuit, Peter Tapken
Circulation Manager Adrian Holland Design ZeeDesign, Witmarsum, www.zeedesign.nl
GIM International, one of the worldwide leading magazines in the geospatial industry, is published five times per year by Geomares. The magazine and related website and newsletter provide topical overviews and reports on the latest news, trends and developments in geomatics all around the world. GIM International is orientated towards a professional and managerial readership, those leading decision making, and has a worldwide circulation.
Subscriptions
GIM International is available five times per year on a subscription basis. Geospatial professionals can subscribe at any time via https://www.gim-international.com/subscribe/ print. Subscriptions will be automatically renewed upon expiry, unless Geomares receives written notification of cancellation at least 60 days before expiry date.
Advertisements
Information about advertising and deadlines are available in the Media Kit. For more information please contact our marketing advisor: myrthe.van.der.schuit@geomares.nl.
Editorial Contributions
All material submitted to Geomares and relating to GIM International will be treated as unconditionally assigned for publication under copyright subject to the editor’s unrestricted right to edit and offer editorial comment. Geomares assumes no responsibility for unsolicited material or for the accuracy of information thus received. Geomares assumes, in addition, no obligation to return material if not explicitly requested. Contributions must be sent for the attention of the head of content: wim.van.wegen@geomares.nl.


The potential of videogrammetry
Videogrammetry can be seen as a natural progression from photogrammetry. So how can videogrammetry improve and enhance data collection for surveying professionals? This article explores its intricacies through case studies, practical examples and analysis of best practices. professionals.


Mixed-reality photogrammetry in focus
Mixed reality in photogrammetry software has resulted in a real-time 3D inspection system that allows users to remotely access, visualize and measure the stereoscopic model all together. An on-site operator runs a drone equipped with a stereo camera, and thanks to VR headsets experts can observe without leaving the office.
5


Machine learning: from innovation to production
The integration of ML into geospatial analysis has been transformed by GeoAI platforms. These advancements have simplified the adoption and deployment process, making it more accessible for organizations. ML is transitioning from an experimental phase to a practical, operational tool.


AI starts new chapter for geodata usage
Many companies in the aerial and satellite imaging sector probably dream of being an AI innovator ‘par excellence’ – of leveraging AI to rapidly convert high-resolution multi-view imagery into high-definition vector maps. With advanced technology, they could perhaps even map an entire continent in a matter of months.

AI-powered solutions for reality capture data
With today’s laser scanners collecting millions of points per second over large areas, the highly detailed point clouds can be overwhelming and difficult to manage. Streamlined workflows incorporating AI help to avoid shifting the time saved in the field to lengthy processing of high-volume data in the office.
Geomares
P.O. Box 112, 8530 AC Lemmer, The Netherlands
T: +31 (0) 514-56 18 54
F: +31 (0) 514-56 38 98 info@geomares.nl www.gim-international.com
No material may be reproduced in whole or in part without written permission of Geomares.
Copyright © 2024, Geomares, The Netherlands
All rights reserved. ISSN 1566-9076


Cover story


Assessing environmental changes with
GNSS reflectometry
An overview of how GNSS can be employed for environmental monitoring, with a particular focus on sea surface height monitoring. This includes examination of the advantages and disadvantages of utilizing a network of permanent GNSS stations for monitoring sea level rise along shorelines.


Surveying professionals and the SDGs
Informed and inspired by the FIG, members of the global surveying community are contributing to the achievement of the SDGs. This article showcases several practical applications and case studies to demonstrate how various FIG Commissions are actively serving society for the benefit of both people and the planet.


How aerial imagery simplifies surveying workflows
Aerial imagery is an essential resource for uncovering unknown insights into how land has been used over time. This article explores the evolution of airborne technology and its impact on the understanding and utilization of Denmark’s ever-changing landscape by chartered surveyors throughout the country.
This time on the front cover of GIM International: an aerial view of the Jardins and Jardim Paulista neighbourhoods, nestled within the subprefecture of Pinheiros in São Paulo, Brazil. This charming tree-lined district is situated near Avenida Nove de Julho, surrounded by towering buildings that characterize the urban setting of the bustling city of São Paulo. (IMAGE COURTESY: SHUTTERSTOCK)
3 Contents Issue 2 2024
Editorial
Headlines
Progressing land management
Report Geo Week 2024 48
6
38
46
Organizations
10 26 14 30 16 34 21 43 Empowering the geospatial community Volume 38 chapter for geodata usage Exploring the potential of videogrammetry Serving society for the benefi of people and planet Mixed-reality photogrammetry in focus Combining photogrammetry, drones and VR/AR technology in real time To subscribe to GIM International go to www.gim-international.com/subscribe


Push the boundaries of 3D laser scanning.

You make the impossible possible—going where others don’t want to go and achieving what others can’t. You lead the way in capturing and documenting the world around us with unparalleled accuracy and detail.
Push the boundaries of 3D laser scanning with powerful in-field automated registration, on-the-fly measurements, and annotations. Trimble® 3D laser scanning systems enable you to visualise and verify your projects before leaving the site, so you can capture complex real-world data with the confidence of getting it right the first time.
out more at:
Find
geospatial.trimble.com/3D-laser-scanning-solutions
© 2024, Trimble Inc. All rights reserved. GEO-229-en-UK (01/24)


Next phase
While visiting Geo Week in Denver earlier this year I was reminded that, in a forwardlooking business, the next step is never far away. Even though many sectors have barely grasped the concept of Industry 4.0, it seems that Industry 5.0 is just around the corner. Industry 4.0 is already a reality in the geospatial industry. We have made good progress in embracing the fourth stage of the Industrial Revolution: realizing the digital opportunities, improving real-time decision-making, increasing productivity, and adding efficiency and flexibility. Think of the advancements in point cloud processing software, enabling enhanced quality and almost instant analysis.
So what is Industry 5.0? To be honest, the next phase is not that different from its predecessor from a technological perspective. However, the outcomes are indeed different. According to the European Union’s definition, Industry 5.0 revolves around “a vision of industry that aims beyond efficiency and productivity as the sole goals. Industry 5.0 should reinforce the role and contribution of industry to society. It places the wellbeing of the worker at the centre of the production process and uses new technologies to provide prosperity beyond jobs and growth while respecting the production limits of the planet”. Furthermore, the EU sees Industry 5.0 as complementing the existing Industry 4.0 approach “by specifically putting research and innovation at the service of the transition to a sustainable, human-centric and resilient European Industry”. That sounds very ambitious, but the EU is no stranger to striving for seemingly ambitious goals (think of the General Data Protection Regulation
[GDPR] or the Digital Services Act). And Industry 5.0 received some attention during Geo Week in Denver, specifically during the keynote session on ‘Geospatial for Good: How is Geospatial Technology Changing the World?’, which included examples of how the geospatial sector is helping to make the world a better place (see the report on page 44).
The theme of this issue of GIM International is artificial intelligence (AI) and machine learning. Relevant articles include the interview that our senior editor Frédérique Coumans held with Abigail Coholic, senior director of Ecopia AI (see page 16). Ecopia follows a dedicated strategy to achieve future-ready critical success factors in the field of artificial intelligence. An anually updated digital twin of the entire world is part of the company’s vision for the future. According to Coholic, AI and machine learning are making this possible. When Ecopia succeeds, it is a perfect example of Industry 4.0. But as Coholic stresses, hopefully the deployment of new technology will not just result in optimizing geospatial analysis possibilities, and therefore in business growth. Instead, she sees AI as an enabler for “improved decision-making that benefits all individuals”. And “some of the biggest geospatial themes we’ve been seeing funded this are equity and accessibility. Highquality and regularly maintained data is one of the foundations for remedying […] exclusions in society”. There are clear echoes of Industry 5.0 in this vision beyond business growth. So take a dive into the short and longerterm future of the geospatial industry in this inspiring issue of GIM International!
Durk Haarsma, GIM International
durk.haarsma@geomares.nl
Issue 2 2024 5 Editorial
Geo Connect Asia 2024 confirms must-attend status
The fourth edition of Geo Connect Asia (GCA), celebrated as the region’s premier trade event and conference for the geospatial, positioning and remote sensing industries, truly delivered during its two-day affair at the esteemed Sands Expo and Convention Centre in Singapore. Co-located alongside Drones & Uncrewed Asia, Digital Construction Asia, and the inaugural Marine & Hydro Asia on 6-7 March 2024, GCA 2024 drew almost 3,000 attendants, representing 52 countries and territories. Under the banner of ‘Geospatial Driven Impacts: Underground, Land, and Sea to Sky,’ GCA 2024 brought together a vibrant mix of experts from local and international companies, institutions, startups and governmental bodies. Through engaging Tech Talks covering the full geospatial spectrum, as well as insightful presentations and dynamic panel discussions featuring 102 speakers, the event fostered crucial dialogues on the far-reaching economic and societal implications of geospatial technologies. Rupert Owen, co-founder of Geo Connect Asia, stated: “The mainstreaming of geospatial technologies has been a major theme of the 2024 event and is one that will accelerate as industry and
governments successfully apply proven solutions. The growing international positioning of Geo Connect Asia assists in exchanging experiences across regions. The additional focus on digital construction, marine & hydro and the UAV marketplaces
also drives focus on the value of data acquisition and sharing to enhance accuracy and the on-time scheduling and delivery of key projects.”


The exhibition area of Geo Connect Asia 2024 was bustling with energy, drawing in 3,000 industry professionals from around the globe who shared a unified vision for the global geospatial community.
Leica Geosystems unveils new airborne Lidar sensor
Leica Geosystems, part of Hexagon, has launched the Leica TerrainMapper-3 airborne Lidar sensor, featuring new scan pattern configurability to support the widest variety of applications and requirements in a single system. The new airborne mapping system provides application flexibility by offering an adjustable field of view up to 60 degrees and
three scan patterns. Continuing Leica Geosystems’ renowned legacy of Lidar efficiency, the TerrainMapper-3 offers three advanced scan patterns to elevate productivity and tailor sensor performance to specific applications. Circle scan patterns excel in enhancing 3D modelling of urban landscapes and steep terrains, while ellipse scan patterns optimize data capture for traditional mapping tasks. Additionally, skew ellipse scan patterns

Leica TerrainMapper-3 enables real-time full waveform recording, enhancing automated point classification. (Image courtesy: Leica Geosystems)
are designed to enhance point density, particularly beneficial for infrastructure and corridor mapping applications. The sensor’s higher scan speed rate allows customers to fly the aircraft faster while maintaining the highest data quality, and the 60-degree adjustable field of view maximizes data collection with fewer flight lines. The TerrainMapper-3 is further complemented by the Leica MFC150 four-band camera, operating with the same 60-degree field of view coverage as the Lidar for exact data consistency. Thanks to reduced beam divergence, the TerrainMapper-3 provides improved planimetric accuracy, while new Multiple Pulses in Air (MPiA) handling guarantees more consistent data acquisition, even in steep terrain, providing users with unparalleled reliability and precision. The new system introduces possibilities for real-time full waveform recording at maximum pulse rate, opening up new opportunities for advanced and automated point classification.

6 Issue 2 2024
NavVis takes new step in global 3D spatial data management
NavVis recently unveiled a substantial enhancement in global 3D spatial technology access and performance. By launching new cloud regions in the Americas and Asia-Pacific (APAC), the company aims to elevate cloud-based reality capture and viewing technology. These strategic additions complement the existing European (EU) region, solidifying its commitment to providing enhanced speed and efficiency for 3D spatial technology professionals across the globe. Aligned with its mission to lead the market with unparalleled global performance, NavVis has embarked on a transformative journey. Through the adoption of a cloud-native Kubernetes (K8s) architecture across its new data centres, NavVis is not only expanding its geographical footprint but also revolutionizing the storage, accessibility and security of 3D spatial data worldwide. This architectural shift ensures scalable, resilient and efficient services, resulting in substantial performance improvements, reinforced security measures and the agility to meet the evolving needs of the 3D spatial technology industry. The introduction of these new locations, coupled with a robust K8s backbone, empowers NavVis users to choose the geographical home for their data. This strategic flexibility not only promises quicker access and reduced latency for interacting with 3D datasets via NavVis IVION, but also ensures compliance with specific regional regulatory standards, underpinning the commitment to data security and sovereignty within a highly secure cloud environment.
Trimble launches MX90 mobile mapping solution


Exyn presents new modular 3D mapping solution
Exyn Technologies, a pioneer in autonomous robotics, has unveiled Exyn Nexys, an innovative modular 3D mapping solution. Designed for professionals in the mining, construction, AEC and geospatial industries, Nexys aims to set a new standard in autonomous mapping technology, offering unparalleled flexibility, speed and accuracy in the most demanding surveying and inspection environments. Nexys’ groundbreaking modular design allows for deployment in various configurations, whether handheld, backpackmounted, vehicle-mounted, drone-integrated or via ground robots. This adaptability makes Nexys an essential tool for comprehensive mapping across diverse environments, from indoor and underground spaces to rugged outdoor terrains. Equipped with the latest technology and Exyn’s proprietary SLAM algorithms, Nexys delivers top-tier data capture speeds and real-time point cloud colourization. Attached to a robot, its Autonomy Level 4 (AL-4)
Trimble has recently unveiled the Trimble MX90 mobile mapping system. Integrating advanced Trimble GNSS and inertial technology with Trimble field and office software, the MX90 offers a comprehensive field-to-finish mobile mapping solution. The solution is presented as a new standard in mobile mapping technology, empowering robust workflows for data capture, processing and analysis. The MX90, mounted on vehicles or trains, swiftly captures detailed laser scans and imagery – panoramic and multi-angle. This data, collected at highway speeds, undergoes rapid processing to produce meaningful deliverables for feature detection and inspections. With peak performance, unrivalled location accuracy and robust cameras, it delivers precise, feature-rich data essential for various workflows. High-resolution immersive imagery, high-density colourized point clouds with accurate colour projections and scene inspection capabilities enable new workflows, such as automatic crack detection. In urban environments or along rail tracks, users can zoom in and easily see small details on street signs, railway signals and other assets or as-built features. In open areas and large cities, they can capture more detail on distant objects, such as electrical or fibre poles.


capabilities facilitate intelligent autonomous navigation through dynamic, complex environments, ensuring thorough coverage even in GPS-denied settings, representing a significant advancement in autonomous mapping.


The Nexys 3D mapping solution comes with a rugged Dell Latitude tablet, streamlining mission planning for autonomous aerial exploration or real-time monitoring during mobile 3D mapping. (Image courtesy: Exyn Technologies)
7 Headlines Issue 2 2024
minimized latency when engaging with 3D datasets through NavVis IVION. (Image courtesy: NavVis)
NASA’s Perseverance rover confirms ancient lake sediment on Mars using groundbreaking radar technology
Using ground-penetrating radar, NASA’s Perseverance rover has uncovered compelling evidence of ancient lake sediment on Mars. This confirms the longstanding hypothesis that the Red Planet was once a warm, wet environment. Perseverance’s ground-penetrating radar, called RIMFAX, played a pivotal role in confirming the existence of ancient lake sediment within the Jezero crater. The rover’s scans and radar observations provided scientists with a cross-section of rock layers up to 20m deep, revealing the remnants of a river that once flowed into the crater. In a study recently published in Science Advances, a team led by UCLA and the University of Oslo uncovered evidence of a crater on Mars that was once filled with water. This ancient lake deposited sediment layers on the crater floor, ultimately giving rise to a significant delta formation as the lake gradually receded. As the lake dissipated over time, it played a role in eroding the crater’s sediments, contributing to the distinctive geological features visible today. The sediment found in the Jezero crater dates back approximately three billion years. This provides new insights into Mars’ ancient past, when the planet exhibited warmer, wetter conditions that could have been conducive to life. This discovery corroborates earlier studies indicating that Mars underwent a
Intermap secures major contract for mapping project in Indonesia
Intermap, a global leader in 3D geospatial products and intelligence solutions, has won a US$20 million contract to map the Indonesian island of Sulawesi this year. The contract is the first phase of the Indonesian national topographic basemap programme to create a national digital basemap as part of the One Map programme, backed by Presidential Decree. Under the One Map programme’s approved technical specifications, the Indonesian government will collect airborne IFSARderived elevation data and cloud-free radar imagery for the entire country at resolutions suitable for 1:5,000 scale mapping. This first phase now awarded to Intermap represents 10% of the country’s land area and 10% of the One Map programme. Work on the remaining 90% is expected to be carried out in the subsequent four years. Indonesia’s national geospatial agency, Badan Informasi Geospasial (BIG), has been mandated to create a national digital basemap. Indonesia is the fourth most populous country and one of the largest and fastest-growing economies in Southeast Asia, strategically positioned on the major trade route through the South China Sea. The country is also home to the world’s largest tropical peatlands and mangrove forests as well as the third largest tropical rainforest. These natural resources are vital in capturing carbon, helping mitigate climate change impacts, and are key resources for supporting Indonesia’s long-term development.


transformation from a warm, wet environment to the cold, arid landscape observed in the present day. In 2022, Perseverance’s analysis of soil samples in the region yielded unexpected outcomes. Instead of encountering the anticipated sediment, the rover discovered lava rock. However, this discrepancy can be reconciled as volcanic rocks displayed signs of exposure to water, suggesting that sediment erosion may have occurred over time.


The Jezero crater contains a fossil river delta, representing a promising area where indications of life may have been concentrated and preserved. (Image
ComNav launches new handheld GIS data collection solution
ComNav Technology has introduced its new handheld P6H. This advanced and rugged device is tailor-made for GIS data collection and outdoor operations. Featuring a GNSS high-precision positioning module, rugged IP67-rated design and six-inch sunlight-readable display, the P6H ensures incredible positioning accuracy, including in harsh environments. Equipped with a SinoGNSS self-developed high-precision K8 board and antenna, it tracks all running and planned constellations with 1,590 channels, including GPS, BDS, Glonass, Galileo, QZAA, IRNSS and SBAS. Its accuracy remains at centimetre or decimetre level. Its IP67 rating offers excellent protection against dust and water, ensuring it offers efficiency and durability even in tough environments. The addition of a 6,600mAh removable battery with quick charging extends its operational capacity, so it is ideal for prolonged outdoor use. Moreover, ComNav’s new device features a sunlightreadable screen with a six-inch display for clear visibility in bright sunlight, reducing glare and reflections. This touchscreen, designed with a five-point capacitive system, not only enhances user interaction by being intuitive, but also accommodates diverse operational needs. It is adept at capturing data in various conditions, whether through the use of a stylus, while wearing gloves, or even with wet hands. Additionally, the device’s ability to withstand being dropped from a height of 1.2m adds to its reliability, especially for professionals who work in challenging outdoor conditions.


8 Issue 2 2024
Visual representation of Indonesia, highlighting elevation details across the archipelago. (Image courtesy: Intermap)
courtesy: NASA/JPL/JHUAPL/MSSS/Brown University)
Headlines
ComNav’s P6H handheld GIS data collector. (Image courtesy: SinoGNSS)
Dublin City University embraces Bentley’s 3D technology in smart city research initiative
Dublin City University (DCU) has partnered with Bentley Systems to spearhead the creation of an advanced digital twin of its campus as a pivotal element of its Smart DCU initiative. This collaborative smart city research project leverages artificial intelligence (AI) and immersive digital twin technology, utilizing DCU’s campus as a testing ground for pioneering smart city solutions, with the overarching goal of forging sustainable, efficient and enjoyable urban spaces on a global scale. In addressing the project’s challenges, the team grappled with an abundance of siloed data, IoT sensors and radar devices, necessitating seamless integration for intelligent monitoring. To harness the full potential of data capture and analysis, a user-friendly platform was indispensable. Bentley’s open 3D and reality modelling technology emerged as the ideal choice, facilitating the creation of a campus model intricately linked with IoT data, resulting in an immersive digital twin on the iTwin Platform. Integrating AI-powered analysis with a user-friendly interface for visualizing complex analytics realized a seamlessly interconnected, smart DCU campus. This facilitates proactive problem-solving, resource optimization and informed decisionmaking, thereby enhancing urban functionality and sustainability. The DCU digital twin stands as a catalyst for numerous environmental and sustainability initiatives, democratizing data visualization and empowering agencies and individuals to implement intelligent processes that actively shape the future of their cities.


Smart DCU integrates AI and digital twin technology, transforming Dublin City University’s campus into a hub for innovative smart city solutions.
Klau Geomatics introduces Brumby mobile mapping system
Klau Geomatics has introduced the Brumby RTK Lidar system, an innovative mobile mapping solution equipped with powerful edge computing capabilities, enabling the generation of highly precise georeferenced point clouds in real time. Brumby can be deployed on uncrewed aerial vehicles (UAVs or ‘drones’), light aircraft or as a mobile mapping system (MLS). It processes data into a georeferenced point cloud instantly upon capture, eliminating the need for post-processing. This seamless workflow allows for immediate integration into analytics, site assessments, volume measurements and any other required tasks. With Brumby, there’s no data backlog. Whatever is captured is ready for immediate use, eliminating delays and streamlining workflows. The Brumby integrates dual-receiver SPAN INS from NovAtel, running NTRIP RTK or Terrastar-C Pro PPP, with custom code to manage coordinate systems and apply precise geoid models to the trajectory. Then, still in real time, the Lidar raw vectors are projected into millions of accurate RTK survey measurements. The Brumby Edge Compute runs chip-level firmware and highly efficient low-level code on
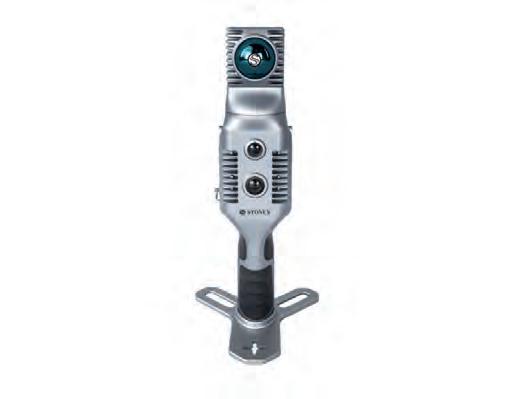
Stonex unveils hybrid mobile real-time mapping solution
Stonex has launched a new SLAM solution for fast and efficient large-area surveys: the X70GO SLAM laser scanner. It combines mobile scanning with a stationary mode to scan with higher resolution, enhancing its overall surveying capabilities. With the brand-new mapping solution, Stonex extends its array of realitycapturing instruments to a more diverse user base. X70GO is a real-time 3D model reconstruction device which integrates an inertial navigation module, high-performance computer and storage system. It is equipped with a 360° rotating head, which, combined with the SLAM algorithm, generates high-precision point cloud data. The built-in 512GB memory disk facilitates the storage of the survey results and the dismountable handle has a 1.5-hour battery life. A 12MP RGB camera provides texture information, while a visual camera enhances the real-time preview with the GOapp. Mapping results are generated immediately inside the scanner, right after scanning. Users can choose to colour them and improve their accuracy during post-processing with GOpost software. The system’s big innovation is the hybrid scanning capability. The X-Whizz mode combines the advantages of SLAM mode with the resolution of a static scan, eliminating the need for multiple scan stations. Users can just move around the scene to collect the entire 3D point cloud, without time-consuming cloud-to-cloud alignment.

The Stonex X70GO is a real-time 3D model reconstruction device which integrates an inertial navigation module, high-performance computer and storage system. (Image courtesy: Stonex)
custom hardware to achieve this outstanding outcome. Unlike SLAM systems that generate real-time data, Brumby data is georeferenced, providing real-world coordinates. This distinction is crucial for detecting changes over time. Without precise georeferencing, multiple models exist independently in space. Only when XYZ frameworks align can the impact of time (T) be analysed. This is vital for assessing ongoing situations, such as identifying persistent road pot holes or monitoring material changes in mining sites. Real-time change detection is especially valuable when addressing current conditions, such as assessing volumes or pinpointing asset locations on military battlegrounds.


The Brumby RTK Lidar system offers a highly adaptable solution for mobile mapping. (Image courtesy: Klau Geomatics)
9 Headlines Issue 2 2024
Practical perspectives for surveyors
Exploring the potential of videogrammetry
By Matija Zupan and Amy Nicol, 3Dsurvey, Slovenia
Videogrammetry can be seen as a natural progression from photogrammetry. So how can videogrammetry improve and enhance data collection for surveying professionals? This article explores its intricacies through case studies, practical examples and analysis of best practices, hardware suggestions and diverse applications of videogrammetry in various sectors of the surveying industry.
Traditionally, surveying relied heavily on manual measurements and ground-based techniques, which were time-consuming, labour-intensive and often limited in scope. With the somewhat recent emergence of photogrammetry, surveying professionals gained access to powerful tools that streamline processes, improve accuracy and unlock new possibilities in data collection and analysis.
How videogrammetry works
Videogrammetry is effectively an extension of photogrammetry; the mechanics are grounded in similar principles. Photogrammetry involves deriving accurate three-dimensional information from two-dimensional images by analysing their geometric properties and spatial relationships. The core of videogrammetry is to separate the video footage into images with regard to sufficient overlap and image quality. The subsequent workflow is almost the same as in photogrammetry. The quality of the output depends heavily on image resolution, frames per second (FPS) and stabilization.
Integration with hardware and software
Central to videogrammetry is the camera system used to capture video footage along with any supporting GPS devices used. Ground-based videogrammetry may utilize smartphone cameras or handheld digital cameras with video capabilities.
While many smartphones and digital cameras have built-in GPS capabilities that geotag photographs with location data, their accuracy is at best 2.5m which is not always optimal for

professional surveying. For this reason, when using a smartphone camera, many surveyors opt for an external real-time kinematic (RTK) antenna with 2cm accuracy. Attaching it to their smartphones enables them to receive correction data from a local NTRIP provider. This is a far more convenient option than placing and measuring ground control points (GCPs) on the terrain in combination with a GNSS device. Some of the well-known smartphone RTK products on the market today include REDCatch’s SmartphoneRTK, ArduSimple’s ZED-F9P RTK receiver, and Pix4D’s ViDoc RTK.
It is important to note that while most smartphones can geotag photographs, not all can geotag video footage. Moreover, those smartphones that can geotag video can only geotag the first frame of the video. For this reason, users may require additional apps (e.g. PIX4Dcatch: 3D scanner) that can embed location data into the video’s metadata so that it can be used for surveying and mapping purposes.
While non-geotagged videos can still be used for 3D model creation in various software solutions, it is recommended to opt for an RTK receiver as a minimum prerequisite for professional applications. At 3Dsurvey, utilization of Google’s Pixel 7a smartphone paired with REDcatch’s external RTK is the preferred option. Later this year, 3Dsurvey is set to release a ScanApp that it has developed to embed RTK correction data into video file metadata, enabling automatic georeferencing for videogrammetry projects. The versatility of videogrammetry: make quick video scans or RTK-georeferenced 3D models.
Issue 2 2024 10

Examples of videogrammetry project approaches
Non-geotagged (using any smartphone or camera)
This can be ideal for the 3D documentation of cultural heritage projects. However, this approach lacks the spatial accuracy necessary for tasks such as outdoor mapping or infrastructure monitoring, which demand precise georeferencing.
• Accurately geotagged using external RTK (using a smartphone)
Accurate geotagging using a smartphone equipped with an external RTK GNSS receiver ensures that the resulting 3D models maintain high spatial fidelity. Therefore, this approach is suitable for applications such as land surveying and small-scale construction monitoring projects where precise positioning is crucial. Examples include mapping manholes, pipes, low-level material piles, dig sites and cables for telecommunication or electricity.
Within a larger photogrammetry/Lidar project
For situations demanding the highest level of accuracy, videogrammetry can fill a gap or add another perspective to the aerial dataset obtained using other technologies, such as groundlevel videogrammetry in combination with aerial Lidar (which lacks oblique views). Videogrammetry can also prove invaluable on site while drone mapping, such as when trees obstruct the flight path or if the project requires capturing details facing upwards. Similar to drone workflows, strategically placed and precisely measured GCPs can significantly improve the overall precision of the generated 3D model. Since videogrammetry usually involves capturing data from low angles, consider using AprilTag targets for superior oblique detection.
Challenges and considerations
Videogrammetry offers immense potential for various applications, yet its implementation comes with a set of challenges. Filming excessive footage can result in software inaccuracies, leading to duplicate surfaces in the 3D model. Therefore, it is important to carefully consider the path taken when filming. Some areas may be challenging to film, but if those areas are not captured in the video, they cannot be included when reconstructing the 3D model. Filming while navigating through obstacles, especially on construction

sites, requires caution and precision on the part of the user. This sometimes gets in the way of creating a perfect video. Weather conditions such as puddles and sunlight can affect data accuracy by creating reflective surfaces and casting shadows, respectively. Filming areas obstructed by roofs, trees or walls can degrade the RTK signal, leading to inaccuracies in the final model.
Tips for accurate data capture
The quality of the output depends on a number of factors, including how the data is captured. The following basic principles can help users to obtain the necessary coordinates when filming so that the 3D model will be as realistic as possible:
1. Move slowly and steadily: To obtain sharp images, maintain slow and smooth movements. This is especially crucial in poor light conditions when the shutter speed is low and video frames are more susceptible to blur.
2. Rotate slowly and move while turning: Just like when towing a trailer, it is necessary to move back and forth rather than trying to turn on the spot.
3. Don’t ‘wall paint’ when scanning vertical surfaces: Standing in one place while tilting the device up and down will generate a lot of images, but they will all have the same coordinates. Instead, move in a lateral direction while recording at different heights.
4. Film in connected/closed loops: Try to ensure that the filming ends precisely back at the starting point.
Advantages of videogrammetry
Videogrammetry offers significant advantages in surveying, particularly when smartphones are leveraged as data capture devices. The portability and convenience of smartphones enables swift, efficient and accessible data collection in a wide range of situations, making it possible to document areas that are either small, rapidly changing, or require close-up details in hard-to-reach places. Moreover, unlike traditional methods requiring specialized equipment and expertise, smartphone videogrammetry empowers more professionals to capture and reconstruct 3D data. The standout feature of videogrammetry is that it eliminates overlap concerns, since the video is continuously shot at approximately 30FPS. This accessibility paves the way for even broader surveying applications.
Issue 2 2024 11 Feature
Land surveyor on site with an RTK-equipped smartphone. Measuring underground utilities and pipes in 3Dsurvey.


Integrating videogrammetry into a data collection toolkit promises to accelerate project timelines, streamline workflows and above all improve responsiveness, since a smartphone is always on site. This makes videogrammetry a cost-effective solution for surveying tasks.
Videogrammetry in practice
These three case studies illustrate the practical application of videogrammetry in various situations, ranging from a simple scenario to a mid-sized construction site. A Pixel smartphone with RTK and the 3Dsurvey ScanApp were used in all cases.
1. Pile volume calculation
Photogrammetry is commonly used to calculate the volume of material piles, but the preflight preparation and planning can be time-consuming. Moreover, drones are bulky and less portable than a smartphone. Therefore, videogrammetry – with a handheld RTK antenna connected to a smart phone – can offer a much faster and simpler alternative. In this project to capture a small pile of material, the smartphone was simply held up high, tilted down and encircled the heap. During a five-minute site visit, a 75-second video was recorded, from which 152 frames were extracted. The processing time amounted to 30 minutes.
2. Preserving cultural heritage
Archaeological excavation sites and statues that require 3D documentation are often located in crowded urban areas which may be subject to strict drone regulations. Some culturally significant items may be located indoors, such as in museums, where photogrammetry is challenging. Moreover, using ground surveying equipment like laser scanners requires highly technical knowledge. This can be an expensive option and therefore unsuitable for such projects. In a project to capture a complete and accurate 3D scan of a dragon statue, a total of 20 minutes were spent on site. 226 frames were extracted from 113 seconds of video. The subsequent processing time was one hour.
3. Underground infrastructure project
Videogrammetry can be successfully used in the context of underground construction and engineering projects, such as when laying pipes into a trench. Compared with documenting the site with traditional equipment, using a smartphone equipped with RTK technology makes the process of documenting remarkably efficient. Just as with drone photogrammetry, multiple mappings can be performed to track progress. As another advantage, videogrammetry makes it possible to get really close and record details that may be hidden from the top-down aerial view. In support of a construction and engineering project for the installation of underground fuel tanks, videogrammetry was used to
Issue 2 2024 12
A sand pile waiting for transport. Underground fuel tank installation site.
A dragon statue on Zmajski Most (‘Dragon Bridge’) in Ljubljana.
document and extract the exact measurements, monitor the width and the depth, calculate the volume and extract profile lines. A 15-minute site visit was sufficient to record 87 seconds of video, leading to 175 extracted frames. The processing time amounted to 45 minutes.
Conclusion
While it should be pointed out that it is not a replacement for established surveying techniques like photogrammetry and laser scans, videogrammetry has emerged as a valuable addition to the surveyor’s toolkit. Overall, this technology offers professionals significant gains in convenience, efficiency and flexibility, because surveyors can capture data using just a smartphone. This allows for faster and more accessible data capture across versatile situations, and provides cost-effective solutions adaptable to specific needs thanks to integrating seamlessly with existing surveying workflows. While filming with a smartphone currently has its limitations that present challenges, continuous advancements in hardware, software and best practices are steadily improving the accuracy and reliability of data collection. This ongoing evolution means that videogrammetry has the potential to contribute to better-informed decision-making and become an indispensable tool for the modern construction professional.


Matija Zupan is a certified drone operator and QA manager at Slovenian geospatial software developer 3Dsurvey. He made his way into photogrammetry through geology, geotechnical engineering, and natural hazard modelling and monitoring. In recent years, with a full focus on photogrammetry, his primary goal has been to find best practices in workflows to achieve optimal results.
Amy Nicol is the sales and marketing assistant at Slovenian geospatial software developer 3Dsurvey. She has over a decade of experience in sales and communication, working in an array of different industries and countries. Her broad knowledge and passion for innovation and tech led her to the geospatial industry, with a focus on photogrammetry.


Issue 2 2024 13 Feature
La Palm Roya l BeachHotel Join us at FIG Working Week 2024! ReGI ste R no W at fig.net/fig2024 AKWAABA –Welcome to Accra! FIG WORKING WEEK 2024 ACCRA,
Accra, Ghana 19-24 May FIG Working Week 2024 Your World, Our World: Resilient Environment and Sustainable Resource Management for All
About the authors
GHANA
Moving machine learning from innovation to production
By Frank de Morsier, Picterra
The integration of machine learning into geospatial analysis, including satellite and drone data, has been revolutionized by geospatial artificial intelligence (GeoAI) platforms. These advancements have simplified the adoption and deployment process, making it more accessible for organizations. As a result, machine learning is transitioning from an experimental phase to a practical, operational tool. As the complexities and high costs associated with machine learning deployment become demystified, a pathway is emerging for organizations to harness this technology for enhanced geospatial imagery analysis. So how can its application be streamlined in daily tasks?
The integration of machine learning into geospatial imagery analysis has brought extraordinary opportunities and significant challenges. Organizations can now extract deeper insights from imagery from satellites and uncrewed aerial vehicles (UAVs or ‘drones’), but implementing these technologies has historically required specialized expertise and substantial resources. No-code GeoAI platforms are changing this dynamic. They simplify machine learning adoption by providing accessible, user-friendly interfaces that require less technical knowledge. This democratization of technology helps organizations overcome the barrier of needing highly specialized teams, thereby reducing the complexity traditionally associated with these implementations.
Strategic steps for successful implementation
Successfully integrating machine learning into geospatial imagery analysis involves several strategic steps to address both technological and organizational hurdles effectively:
• Fostering innovation: Organizations should nurture a culture that welcomes technological advancements and experimentation, promoting an openness to new ideas, investing in employee training, and creating an environment supportive of exploring and adopting novel technologies.
• Partnering with experts: Collaborating with technology providers simplifies the transition, offering access to specialized knowledge, custom solutions and a reduced learning curve, tailored to meet specific organizational requirements.
• Ensuring scalability: It is critical to choose scalable technologies from the start, capable of adapting to the organization’s evolving needs, ensuring efficiency and effectiveness as data volumes grow.
Prioritizing data quality: The foundation of successful machine learning is highquality data. Investing in strong data management practices is essential to ensure accuracy, organization and accessibility of data for analysis.
• Highlighting successes: Demonstrating the positive impacts of machine learning through improved efficiency, accuracy and decision-making supports broader acceptance and encourages continued investment in these technologies.
Adopting these strategies enables organizations to overcome the challenges of integrating machine learning into geospatial imagery analysis, leading to significant operational improvements and the unlocking of new insights.
Need for an organizational transformation
Scalability remains a critical challenge when moving from pilot projects to fully operational models. The good news is that no-code GeoAI platforms offer scalable solutions that efficiently handle increasing volumes of data without proportional increases in resource demands.
To achieve this, however, the shift to machine learning-based analysis demands an organizational transformation. It is not just about adopting new technology, but also about adapting to new workflows and decision-making processes. No-code GeoAI platforms facilitate this transition, easing advanced analytics integration into existing operations. As a result, organizations can unlock unprecedented levels of efficiency and insight, marking a significant shift in the competitive landscape for geospatial imagery analysis.
GeoAI in action for Network Rail
As part of the SHIFT2RAIL programme – a European project aimed at revolutionizing railway systems through technological innovation – Network Rail’s drone use for inspecting switches and crossings presents a compelling case study in applying machine learning to geospatial imagery analysis. Utilizing drones to capture still shots of railway infrastructure, this method leverages advanced software to generate both orthographic (2D) and point cloud images for
Issue 2 2024 14


The benefits are multi-faceted. The high-resolution images captured enable comprehensive inspections without compromising safety; there is less need for human inspectors to be near the tracks, thus lowering accident risks. Moreover, combining drones with machine learning technology offers notable environmental and economic advantages. Drones reduce the carbon footprint compared to traditional methods requiring extensive manpower and equipment. Economically, this approach streamlines the inspection process, leading to cost savings and more efficient maintenance planning.
The Network Rail initiative highlights the potential across various sectors. Industries like mining, infrastructure and land management can all benefit from applying machine learning to geospatial imagery analysis, enabling more precise data collection, informed decisionmaking and sustainable, safe operations.
Streamlining the transition
Integrating machine learning into geospatial imagery analysis presents exciting opportunities and challenges. The rise of no-code GeoAI platforms is streamlining this transition, making advanced analytics more accessible to organizations across diverse industries. The case study of Network Rail employing drones for infrastructure inspections showcases the significant benefits of this approach, including enhanced safety, reduced environmental impact and greater economic efficiency. These advantages are not limited to the railway sector, but are also relevant in mining, infrastructure management and land management.
A strategic approach (see box) is essential for exploiting the full potential of machine learning in geospatial imagery analysis. Emphasizing innovation, scalability and data quality, and establishing effective partnerships are key components. As organizations become more skilled at integrating these technologies, the utilization of data for informed decision-making and advancing industry progress will continue to evolve.


Machine learning holds great promise for geospatial imagery analysis. It is set to revolutionize spatial data interpretation and redefine operational capabilities and efficiencies across a broad spectrum of industries, indicating a transformative future for how we leverage spatial information.
Dr Frank de Morsier, COO and co-founder of Picterra, holds a BSc in Electrical Engineering, an MSc in Information Technology, and a PhD in Remote Sensing Imagery from EPFL, Switzerland. With a background in remote sensing image processing since 2014, he is an expert in AI and pattern recognition for image processing. Additionally, he teaches at EPFL and UNIL, focusing on image processing for Earth observation. At Picterra, he is dedicated to enhancing internal processes and developing AI algorithms for extracting geospatial information from multitemporal and multi-sensor images.
Issue 2 2024 15 PERSPECTIVES
Tree and vegetation monitoring along railway tracks.
Detecting waterbodies in and around mining sites.
thorough examination.
Further information
About the author
Picterra’s no-code GeoAI platform.
Combining beyond-human scale with human-level reasoning for accuracy
Artificial intelligence starts a new chapter for geodata usage
By Frédérique Coumans, senior editor, GIM International
Many companies in the aerial and satellite imaging sector probably dream of being an AI innovator ‘‘par excellence’. They would love to leverage artificial to rapidly convert high-resolution multi-view imagery into high-definition vector maps. With advanced AI technology, they could even map an entire continent in a matter of months, or keep a digital twin continuously up to date with the real world. This could be a possible scenario in the future, but the industry is not quite there yet. It takes a dedicated strategy to achieve future-ready critical success factors, according to Ecopia AI.
Artificial intelligence-based systems stand out in their ability to leverage human-like image interpretation and reasoning to create map features that accurately represent the real world. In a simple example, AI-based systems can infer when a pavement is obscured by tree canopy and produce a full pavement vector layer, whereas other computerbased mapping methods would produce a
fragmented layer. To achieve these results, a neural network must be rigorously trained to mimic what a human can detect in imagery and subsequently deduce from their contextual knowledge and sound reasoning.
Beyond what is humanly possible
Toronto-based Ecopia AI has built up a reputation for superior AI innovation in the
geospatial imaging sector. The majority of the Canadian company is comprised of R&D teams entirely dedicated to training and evolving AI-based systems to ingest new types of imagery and extract highly accurate features for mission-critical applications, such as transportation planning, climate resilience and public safety. Abigail Coholic, senior director at Ecopia, is confident in the

Issue 2 2024 16
Change detection map of Leeds, UK, produced in partnership with Airbus and ESA to understand the impact of land use change on railway infrastructure.
company’s future-proof mapping capabilities. “In the last ten years we’ve developed a robust system. Our AI-powered systems make it possible to scale image interpretation beyond what is humanly possible while retaining the human-level reasoning that is required for accuracy,” she says.
When creating a 3D feature, the standard process is to take reference of all the points across the feature and then determine its height. AI-based systems can take into account millions of reference points across multiple images over time. At this scale, a human would struggle to keep track of all of this data in their brain. Additionally, leveraging AI results in a normalized data output that is not always possible with manual digitization due to inevitable human error. Two GIS professionals could interpret an image and all of the world’s complexities differently, producing inconsistent results. In the case of AI, a computer-based system extracts data across the full area and routinely applies the same definitions and interpretation style. This normalization of feature extraction results is an important benefit of AI. “Coupling this normalization with 3D extraction means that you can now truly track precise changes of your map data at scale instead of re-extracting each time you get imagery and then trying to compare those results,” Coholic explains. Ecopia envisions this AI technology powering a digital twin of the entire world, updated at least every year.
Value for all types of imagery
In Coholic’s experience, the new possibilities that AI and machine learning bring do not change the relative competitive position of aerial photogrammetry and satellite images. “The ideal geospatial ecosystem includes satellite imagery, aerial imagery and AI, as they all provide additional value to each other. For satellite imagery specifically, AI-based mapping is beneficial because of how frequently imagery is captured. It is not humanly possible to manually digitize all of the images being constantly captured by satellites. However, this frequent imagery capture and the subsequent AI-powered feature extraction are essential for understanding the dynamic nature of our world. We can start to monitor change in near-real time,” she continues. “And the same goes for aerial imagery. One of its main benefits is its high resolution, which provides an extremely granular view of the planet. This leads to a similar challenge in manual digitization; there is so much detail to capture that it is not feasible to do manually. So in both cases, and also with drone or street view captures, AI affords imagery providers with the ability to double down on their unique advantages.”
Traditional geospatial data creation was so resource-intensive that most organizations would only update their databases every three to five years. By creating and maintaining map content at scale, geospatial data becomes more accessible. The positive feedback loop that comes with more frequent data creation, plus the increase in end users leveraging this data, leads to increased demand for even more frequent and detailed data creation. “However, there is still a learning curve when it comes to assessing and implementing new geospatial technology. This remains a big bottleneck for growth in our industry,” expresses Coholic. “We need not only to develop innovative technology, but also enable organizations to use it, which comes down to education. End users now have so much to choose from

that they have to spend a lot of time evaluating different sources and determining what innovations are useful. Geospatial companies need to empower their users by sharing new implementation strategies and inform actively on market trends relevant to their core responsibilities.”
Land cover
Ecopia invests heavily in thoroughly understanding the reasons behind the user applications. What are the most essential vecto r features for the analysis their customers need to transform dat a into actionable information? And can they extract them at natio nal or continental scales? As a result, the company has off-the-shel f high-resolution mapping products that include 3D land cover across the USA, Canada, Italy, Australia and Ireland, as well a s in major metropolitan areas around the world. 2D content also includes off-the-shelf building footprint and road data for all of sub-Saharan Africa.
Last year, Ecopia completed the delivery of land cover data to support the Coastal Change Analysis Program from the US National Oceanic and Atmospheric Administration (NOAA). Historically, the data was produced at a resolution of 10-30m, but Ecopia produced a 1m-resolution vector dataset across over 1.5 million square miles. While NOAA leverages the vector version o f this land cover dataset for its own operations, any organizatio n can access the 1m raster dataset for free to support climate resilience analysis. Ecopia is currently expanding the coverage to empower US coastal communities to understand climate risks and develop mitigation strategies to enhance resilience
Issue 2 2024 17


Get ready to celebrate a decade of geospatial innovation at GEO Business! Join 4,000 geospatial professionals to explore the latest advancements, share insights, and make new connections. GeoBusinessShow.com REGISTER NOW FOR FREE CELEBRATING 10 YEARS OF GEO BUSINESS GEO Ad half page copy.indd 1 21/03/2024 14:16
and sustainability. For example, the State of Washington leverages the data for hydrological modelling and flood mapping, and also to optimize the placement of electric vehicle charging stations.
Transportation networks
Over the past year, the company has standardized the extraction of highly detailed transportation features, resulting in planning data solutions for transportation authorities. For instance, the Illinois Department of Transportation and the Chicago Metropolitan Agency for Planning engaged Ecopia to provide transportation agencies across the state with access to routinely updated information about their infrastructure. Information on pavements, pedestrian crossings, intersections, lanes and more is used to advance multimodal analysis, compliance with the Americans with Disabilities Act, Vision Zero objectives, performance-based capital programme monitoring and storm-water and flood management. “I am glad to think that, in doing so, transportation plans – and therefore regions – become safer, more sustainable and more accessible, ultimately improving residents’ lives,” Coholic comments.
Another recent transportation project was in the UK to map Network Rail’s railways and surrounding land: over 20,000 miles of track and more than 30,000 bridges, tunnels and viaducts. Network Rail wants frequent updates on land use changes within a specified buffer around rail infrastructure to assess the impact on travel safety and sustainability. Ecopia highlighted where changes took place. The AI-based mapping systems ingested and compared ESA and Airbus imagery from the first and second halves of 2022, delivering a vector dataset of classified feature layers in the space of just six weeks.
Critical success factors
The monumental success of AI in general in 2023 begs the question, ‘Why isn’t every company in the mapping business doing something like Ecopia?’. It seems easy to ask ChatGPT for some code to create an algorithm for the specific use case. However, as anyone who has tried that in practice knows, actually implementing those algorithms and getting them to improve efficiency is not that simple – particularly in

High-precision land cover map of Spokane, Washington, to inform the state’s climate resilience and sustainability initiatives.
the geospatial industry, where data is used to make highly detailed decisions such as where to plant trees to reduce urban heat islands, or where pedestrian infrastructure is needed to reduce the risk of traffic fatalities. A poorly trained, low-accuracy product will not provide enough value and improvement to surpass traditional methods.
Coholic sees three critical success factors: “First, you need expert knowledge of the domain you are trying to implement a solution for and the AI technology you are applying. Second, you need to invest time in training the algorithms that power that AI, accounting for all edge cases. Third, you need to make a huge financial investment in servers, cloud infrastructure and training data. The imagery datasets used to create high-quality maps are enormous, and processing them requires advanced and resource-intensive infrastructure. It is this commitment to thoroughly understanding the power of map creation, becoming an authority in computer vision, and investing massive amounts of time and money into our systems that have resulted in our industry-leading 3D AI map creation, which is not so simply replicated.”
Additionally, the internal workflow for an average project has evolved immensely over the last two years, according to her. “Each dataset we create requires much less customization than previous projects. We have executed projects in more than 100 countries around the world, and with every one we further advance our AI-based systems to map new features and geographies with greater accuracy and efficiency.”
Meaningful
Looking to the near future, Coholic is hopeful that the next couple of years are going to be particularly meaningful in the field of optimizing geospatial data analysis – and not only in terms of business opportunity or growth. “As the power of AI is harnessed more fully by governments, it will enable improved decision-making that benefits all individuals. Some of the biggest geospatial themes we’ve seen being funded this year are equity and accessibility. High-quality and regularly maintained data is one of the foundations for remedying historic inequities and exclusions in society. I think successes like these will contribute to new professions looking to integrate geospatial data and to existing industries broadening the scope of their work, which will benefit every stakeholder,” she states.
Lastly, she also believes that the Future of Life Institute’s ‘Open Letter to pause AI’ demonstrates the new potential for the public and private sectors as well as non-profits and academia to act as partners. “Together, we can pursue solutions that prioritize the flourishing of humanity over technological competition.” Abigail Coholic concludes: “The fact that so many of the concerns around this technology are being discussed well in advance of its full development, by all leaders of our world, means that we have the opportunity to properly account for all externalities of these advancements and make decisions about where we should never take these technologies collectively.”
Issue 2 2024 19 Feature

How surveying professionals are contributing to the achievement of the SDGs
Serving society for the benefit of people and planet
By Paula Dijkstra, Lydia Najjuma and Marisa Balas, FIG
Informed and inspired by the International Federation of Surveyors (FIG), members of the global surveying community are contributing to the achievement of the Sustainable Development Goals (SDGs). This article showcases several practical applications and case studies to demonstrate how various FIG Commissions are actively serving society for the benefit of both people and the planet.
The 2030 Agenda for Sustainable Development, a comprehensive plan of action for people, planet, prosperity, peace and partnership, serves as a blueprint for a sustainable world (UN General Assembly, 2015). Fundamentally, the 17 Sustainable Development Goals (SDGs) and 169 targets guide the agenda, with urgency emphasized due to pressing issues such as pressure on land and sea, threats of calamities, extreme poverty, inequality, mistreatment of women, warfare, terrorism and the ongoing refugee crisis.
Recognizing the crucial role of professionals in the land and built environment in achieving the 2030 Agenda, the FIG General Assembly established the Joint FIG and the Sustainable Development Goals Task Force (FIG SDGs TF) during the FIG Working Week in Hanoi in 2019. The task force’s primary objective is to integrate the SDGs into FIG and its member associations by 2026 by actively raising awareness. The task force aims to inform and inspire the FIG community to diligently contribute to measuring the targets and indicators outlined in the SDGs, viewing this commitment as a way of serving society for the benefit of both people and the planet. As shown in Table 1, FIG members can be instrumental to the SDGs in two main ways: firstly by creating awareness and contributing to achieving the SDGs and the specific targets, and secondly by collecting relevant data to contribute to the assessment of the targets by using the indicators. Several practical applications and case studies are

showcased below to demonstrate this in more detail.
Achieving gender equality and empowering all women and girls
Despite women being an important contributor to food production and household livelihood, women face various obstacles in accessing land and securing tenure and their representation among landholders is less than 15% (FAO, 2018). Ensuring women’s rights to land is key to advancing their economic independence and greater negotiating and decision-making power. Economically empowered women become less vulnerable to domestic violence and discriminatory practices against them, including as they grow older or become widowed or divorced. Furthermore, they tend to invest in the development of human capital, well-being and the livelihood of the entire family. Moreover, secure access to land, information and technology ensures that women are better positioned to preserve

Acknowledgements
The authors express their gratitude to Rosario Casanova, Anna Shnaidman, Shirley Tendai Chapunza, Søren Brandt Pedersen and Paula Teperino for their valuable contributions to this article.
Issue 2 2024 21 Feature
Figure 1: Women receiving land titles in Uganda and Mozambique after periodic facilitation about land matters.


The FIG Commission can play a role in creating awareness and contribute to achieving the SDGs.
The FIG Commission can play a role in measuring the indicator.
natural resources, adapt to and recover from climate change, and aid in reversing, halting and minimizing soil degradation.
Securing and protecting land rights for all are reflected in six of the targets but contribute to achieving 13 goals, 59 targets and 65 indicators of Agenda 2030 (ILC, 2018; UN Women, 2018). The right for women to own, control and inherit land and other forms of property, as stated in SDG 5, is one of the targets for achieving gender equality. This is emphasized in Target 5a which seeks to undertake reforms to give women equal rights to economic resources, as well as access to ownership and control over land and other forms of property, financial services, inheritance and natural resources, following national laws.
Promoting women’s access to land and land tenure security has been on the FIG’s agenda for several years. FIG members have long been involved, together with its partnering organizations, in developing and implementing various instruments, such as the Fit for Purpose Land Administration (FFPLA) approach, the ISO 19152:2012 Land Administration Domain Model (LADM), the Social Tenure Domain Model (STDM), and the FIG Guidelines for Women’s Land Rights. These instruments help to capacitate, inspire and support the community of land professionals in their efforts to design and implement equitable and inclusive land policies, strategies and processes. Additionally, land professionals are crucial in building gender-sensitive land cadastres with gender-segregated data that support not only the monitoring of the SDGs but also
decision-making. In many African countries, including Uganda, Botswana, Zambia, Benin, Chad, Rwanda, Mozambique and Ethiopia, surveyors have participated in programmes securing the land rights of both rural and urban women where women received their formalized land titles (see Figure 1).
Make cities and human settlements inclusive, safe, resilient and sustainable There is a continuing lack of protection and recognition of tenure rights for informal urban settlements (slums) in developing countries and the pertained rural conditions that drive mass, unplanned urban migration. Target 3 of SDG 11 (Sustainable Cities and Communities) states: “By 2030, enhance inclusive and sustainable urbanization and capacity for participatory, integrated and sustainable human settlement planning and
Issue 2 2024 22
Com. 1 Com. 2 Com. 3 Com. 4 Com. 5 Com. 6 Com. 7 Com. 8 Com. 9 Com. 10 YSN ARN AP RN Standards
Table 1: The contribution of FIG Commissions to achieving the SDGs.

management in all countries.”
A strong case can be made for the role of surveyors with regards to SDG 11 and also SDG 9 (Innovation). Their contribution relates to the use of mobile mapping and community-generated information to support land administration, the application of machine learning techniques and cloud computing to the collected data, and the creation of digital twins, i.e. real-time replicas of the environment. Another example is the establishment of national infrastructure databases that promote smart and efficient exchange of data, policymaking and planning, thus significantly minimizing negative impacts on the environment and society as a whole.
Action to combat climate change and its impacts
Land management and planning are key elements to achieve the goal of combating climate change and its related impacts (SDG 13). Geospatial data plays a crucial role in providing insights, and facilitating informed decision-making processes and the establishment of long-term strategies. Land and geospatial professionals are integral to:
• Producing detailed orthophotos and digital surface models (Figure 2): These are indispensable in the creation of national tree canopy databases that can be used by national and local authorities to efficiently allocate resources and facilitate the adoption of effective tree planting policies, e.g. in cities to combat the phenomenon of urban heat islands.
• Sea level rise analysis: Visualization of sea level rise scenarios on a map-centric platform makes it possible to identify potential hazards and supports informed planning. Furthermore, the utilization of 3D models provides tools for deeper analysis and insights.
• Blue Surveying Initiative: Accurate
hydrographic data is an indispensable tool for advancing targets related to marine biodiversity conservation, sustainable fisheries and the reduction of marine pollution (as outlined in SDG 14). In addition, as sea levels rise and weather patterns shift, the information provided by hydrographic surveys enables effective planning and adaptation to climate change impacts, aligning with SDG 13 on climate action.
Strengthen sustainable development in partnership
SDG 17 recognizes that collaboration is paramount, since no entity can singlehandedly accomplish the goals. Target 16 states: “Enhance the global partnership for sustainable development, complemented by multi-stakeholder partnerships that mobilize and share knowledge, expertise, technology and financial resources, to support the achievement of the Sustainable Development Goals in all countries, in particular developing countries.” In other words, stakeholders need to unite, leveraging shared and complementary knowledge to effectively contribute to the realization of the SDGs. As a member organization, FIG provides a platform for members and stakeholders to inform, discuss, exchange and act towards a more sustainable world.
In pursuit of these goals, the indispensable role of surveyors becomes evident through numerous practical implementations and use cases. Notably, the potency of data visualization, exemplified by maps, emerges as a key catalyst. As the saying goes, “a picture is worth a thousand words, and
a map is worth a thousand pictures”. By translating relevant data into visual maps, as opposed to conventional alphanumeric formats, surveying professionals enhance stakeholders’ ability to gain insights and derive informed conclusions.
Education of surveying professionals
SDG 4 focuses on education. In order to actively engage in and contribute to the achievement of the SDGs, surveying professionals must possess knowledge, awareness and understanding of the goals, including their significance and the roles each person can play. Learning about the goals and targets of sustainable development not only enables surveyors to visualize the impact of their professional activities, but also to make decisions aligned with these objectives.
FIG Commission 2 – Professional Education is in the process of conducting research into worldwide curricula for surveyors. One of its questions is related to the inclusion of the SDGs in each curriculum. From the preliminary results, it can be stated that this subject is poorly included – if at all – in the current education and training offering.
In some instances, however, such as in the case of Uruguay (Figure 3), SDG-related research modules have been integrated into university curricula for surveyors. In Uruguay, these courses introduce students to the SDGs from a geographical perspective, requiring them to examine international methodologies for assessing the sustainable goals indicators, critically review the national measurement methodologies, and develop

Issue 2 2024 23 Feature
Figure 2: Tree canopy cover map. (Image courtesy: Survey of Israel)
Figure 3: Description of education goals in Uruguay.
systematic processes appropriate to their national reality.
Young surveyors pave the way for sustainable development
As the torchbearers of change, young surveyors hold considerable sway in shaping the landscape of global development. The synergy between young surveyors, corporate entities, non-profits and multilateral organizations has created a holistic approach to problemsolving. This spirit of collaboration extends to programmes like the FIG Mentoring initiative, which focuses on soft skills development. Piloted in Africa and inspired by the Geospatial Council of Australia’s mentoring programme, this initiative carries substantial weight in shaping the next generation of surveying professionals. The FIG Mentoring programme not only imparts essential soft skills but also serves as a bridge across generational gaps. By fostering mentorship relationships, it ensures the transfer of knowledge and expertise from seasoned professionals to the emerging talent pool. This approach is fundamental in building an all-inclusive, diverse and equal community within the surveying profession. This comprehensive strategy ensures
Supported by this, young surveyors are also emerging as pivotal factors in pursuit of the global SDGs, driving positive change through innovative approaches and collaborative initiatives. One noteworthy example is the FIG Young Surveyors Network’s Volunteer Community Surveyor Program (VCSP), which has an enormous impact on mapping land rights in marginalized communities across sub-Saharan Africa, Asia and the Pacific (Figure 4). This programme exemplifies the significant contribution of young surveyors to addressing pressing societal issues by leveraging technological prowess.
Partnerships for prosperity have been a hallmark of these initiatives, fostering collaboration between diverse stakeholders. Through such initiatives, young surveyors are actively shaping a more sustainable and equitable future.
About the authors


Members of the Task Force on FIG and the Sustainable Development Goals: Søren Brandt Pedersen, Rosario Casanova, Paula Dijkstra, Ronald Ssengendo, Shirley Tendai Chapunza and Ganesh Prasad Bhatta.


Paula Dijkstra is the chair of the Task Force on FIG and the Sustainable Development Goals. As director of Kadaster International in the Netherlands, she is responsible for the coordination of the organization’s international activities and cooperation projects. She was also the coconference director of FIG’s first e-Working Week in 2021.
Lydia Najjuma is a quantity surveyor at Sigma Immobili Ltd in Uganda. Passionate about achieving inclusive growth and sustainable development through standards, she actively serves on several professional bodies including the Task Force on FIG and the Sustainable Development Goals, Africa Association of Quantity Surveyors (AAQS) Education Research and Training Board, and the International Cost Management Standards (ICMS) Standard Setting Committee.
Marisa Balas is a PhD candidate in the field of Social Sustainability and Development at Universidade Aberta in Lisbon. For the past 15 years, she has been engaged in land reforms, revision of land administration processes, and implementation of land information systems. She is an active member of FIG, including as chair of the Commission 7 Working Group on Women’s Land Rights, and member of the Task Force on FIG and the Sustainable Development Goals.
Issue 2 2024 24
Conclusion
FIG is at the forefront of translating the 2030 Agenda for Sustainable Development into actionable initiatives. The establishment of the Task Force on FIG and the Sustainable Development Goals underscores FIG’s commitment to integrating these goals by 2026 into all commissions’ working plans, addressing urgent global challenges across land and sea pressures, calamities, poverty, inequality and environmental concerns. Surveyors play a crucial role in this agenda, contributing to gender equality, sustainable urbanization, climate action and fostering global partnerships.
Education emerges as a cornerstone of surveyors’ effective involvement in the SDGs, emphasizing the need for awareness and understanding of these goals. Efforts to incorporate SDGs into curricula, as seen in the case of Uruguay, highlight the importance of preparing future professionals to align their decisions with sustainable development objectives. Additionally, the proactive engagement of young surveyors, as demonstrated through initiatives like the FIG Young Surveyors Network’s Volunteer Community Surveyor Program, showcases the transformative potential of emerging professionals in mapping land rights and driving positive change. The collaborative, intergenerational approach within the surveying community ensures a holistic contribution to global sustainable development, shaping a more equitable and inclusive future. It is the decade of action, with surveyors at the forefront.
Further reading
• FAO. (2018). The gender gap in land rights (S. Kaaria & M. Osorio (eds.)). FAO. https://www.fao.org/3/I8796EN/i8796en. pdf
• ILC. (2018). The International Land Coalition and Sustainable Development Goals: Working Together to Realise Land Governance - How can the land community engage in the SDGs process and ensure that no one is left behind.
International Land Coalition.
• UN General Assembly. (2015). Transforming our world: the 2030 Agenda for Sustainable Development. In UN Reports.
https://doi.org/10.1017/s0020818300030393
• UN Women. (2018). Why Gender Equality Matters Across All SGDs. In Turning Promises into Action: Gender Equality in the 2030 Agenda for Sustainable Development.
http://www.unwomen.org/en/digital-library/sdg-report
More

Trimble’s Applanix Direct Georeferencing offers:
l, ON L4B 3B3 Canada 905-709-6027
Issue 2 2024 25 Feature
than just
IMU,
an
a complete solution
Powerful hardware and software integrated solutions
Industry-leading customer support
Reduced costs, improved efficiency of aerial survey
Combining photogrammetry, drones and VR/AR technology in real time
Mixed-reality photogrammetry in focus
By Gerhard Kemper, Çağın Torkut, Devrim Akca and Armin Grün
The use of mixed reality in photogrammetry software has resulted in a real-time 3D inspection system that allows users to remotely access, visualize and measure the stereoscopic model simultaneously. An on-site operator runs a drone equipped with a stereo camera, and thanks to virtual reality headsets experts can observe the object of interest without leaving the office. This improves both cost-effectiveness and safety when inspecting large, critical structures.
Protecting critical infrastructure (such as power grids, transport networks, and information and communication systems) is vital for the security of countries and the well-being of their citizens. The European Commission pays attention to this fact and has launched the European Programme for Critical Infrastructure Protection (EPCIP) to reduce the vulnerabilities of such infrastructure. This is a package of measures aimed at improving the protection of critical infrastructure in Europe, across all Member States and in all relevant sectors of economic activity.
The infrastructure elements are under natural and/or anthropogenic pressure, and their monitoring is necessary for many reasons. Their construction is so complex and cost-intensive that maintenance and inspection is a must. Unexpected damages may cause economic losses and can also yield catastrophic results. Therefore, the monitoring of such objects, e.g. bridges, viaducts, dams, towers, is an important procedure and essential for both the public safety and the rehabilitation of the object.
Rich visualization experience
In 2022, a research project called REALTIME3D was set up. The goal was to design and develop livestreamed, multi-user and 3D stereoscopic view-based mixedreality (MR) photogrammetry software for diverse kinds of inspection tasks. This led to the installation of a stereo camera rig as the image acquisition unit on an uncrewed aerial vehicle (UAV or ‘drone’) (Figure 1). The stereo
base length follows the photogrammetric base-to-height ratio rules in order to get the best network geometry for stereoscopic viewing and mensuration.
The UAV system is operated on-site by an operator, while the inspection is done simultaneously in-office by the experts/engineers wearing virtual-reality (VR) headsets. Using the project’s innovative MR software, multiple users from multiple locations can connect to the system, and visualize the object of interest in 3D stereoscopic view mode with the capability of photogrammetric measurement.
REALTIME3D is a new system in the sense that both data acquisition and photogrammetric image processing is unified and done on the job in real time. The photogrammetric products are interactively and simultaneously shared by the multiple users who can even be in completely different geographical locations around the world. Additionally, REALTIME3D provides a very rich content and visualization experience – much greater than being located at the site itself.
System components
The main components of the REALTIME3D system are a stereo camera-equipped UAV and an MR-based photogrammetry software suite for real-time inspection of critical infrastructure (Figure 2). The entire hardware and software system is merged into a unified pipeline which has online (image) acquisition and (photogrammetric) processing capability. It includes the following components:

Issue 2 2024 26
Figure 1: A UAV equipped with stereo camera for the project.


1. UAV carrying stereo camera and on-board software
2. Mixed-reality photogrammetry application running on VR headsets
3. The backend and the web application running on cloud servers.
Asynchronous monoscopic cameras (photo & video) are widely used onboard UAVs. However, the use of the simultaneous stereoscopic camera systems in the geospatial market is new and uncommon, and the few that are available are limited to academic purposes.
UAV
carrying stereo camera and onboard software

The GGS AeroSpector (AS) 800 UAV is used as the aerial platform for the project. It has a good effective flight time, a good cost/ performance ratio, and standard components in the case of repairs, replacements and modifications (Figure 3).
The AS-800 uses a foldable carbon quadcopter frame for a payload of up to 2kg. It is a complete, ready-to-fly (RTF) drone set with Herelink remote control. The AS-800 has a diameter of 800mm (motor centre to motor centre). This copter achieves a flight time of approximately 70 minutes without payload (and approx. 52 minutes with a 500g payload / approx. 45 minutes with a 1,000g payload / approx. 32 minutes with a 2,000g payload). The weight of the copter including all electronics is only 1,800g. Including a 1,000g payload and 17,000mah GensAce battery, a take-off weight of less than 4.5kg is possible.
Two Alvium cameras are used with a high-resolution image format of 20MP. The camera type is Allied Vision Alvium 1800 U-2040c with
USB 3.1 interface, C-Mount lens connector and a CMOS sensor of 4.512 x 4.512 pixels à 2.74µm pixel size. This camera has a low energy consumption, is lightweight and has very robust sensors typically used for industrial applications. The cameras are equipped with 16mm high-resolution lenses from the same manufacturer.
The cameras are fixed at the two ends of a 1m carbon tray base (stereo rig). The cameras are connected to an onboard PC (Latte Panda 3D) where the onboard software runs for image pre-processing and data transfer. The USB-3 interface is used to power the cameras (Power over Ethernet) and to control the cameras via a software development kit (Vimba SDK). An interfac e to trigger the cameras is connected on a separate port and connected to the UAV controller. GPS-RTK geotags with inertial measurement unit (IMU) data can be streamed with the images in real time if required.
Issue 2 2024 27 Feature
Figure 2: The REALTIME3D system architecture. Each grey-coloured rectangle can be a different location in the world.
Figure 3: GGS AeroSpector 800 UAV.
Figure 4: Camera calibration using Australis control targets.

About the authors

Dr Gerhard Kemper has a background in physics, geography, photogrammetry, mechanics and electronics. He has been CEO of GGS GmbH for more than 35 years and of GGS-France SASU since 2020. GGS is a frontrunner in innovation in system integration for airborne mapping and inspection, technical development and research.


Mixed-reality photogrammetry software running on VR headsets
Calibration of the stereo cameras and their relative orientation is done using Australis photogrammetry software with the calibration targets (Figure 4). Calibration information is passed to the backend software on the cloud server where distortion-free normalized image pairs are generated. These images are sent to the MR photogrammetry application for stereoscopic view generation. Users from multiple locations can access these stereo pairs with their VR headsets and interactively inspect the real-world objects (Figure 5).
The MR photogrammetry software, which has been developed in the Unity 3D engine, visualizes the 3D stereoscopic models for labelling, annotating, measuring and vectorizing the real-world object in detail. A VR native 3D graphical user interface (GUI) is implemented for gathering the data from the backend and displaying it to the user. Rather than the cartographic abstractions (2D maps and 3D models), augmented stereoscopic models are the primary format to be saved and retrieved in the database.
Web application
Data collected by all components can also be visualized and partially


Çağın Torkut is co-founder and tech lead at Red Horizon. As a software architect and developer specialized in online applications and computer graphics, he is experienced in 3D visualization, virtual reality and augmented reality.
Dr Devrim Akca holds a PhD from the Institute of Geodesy and Photogrammetry of ETH Zurich. He is co-founder and shareholder of 4DiXplorer AG, which was started as a spinoff company of ETH Zurich in 2009, and is now an independent SME located in Zurich. He is also a full-time professor in the Computer Engineering Department of Isik University, Istanbul.
Prof Dr Armin Grün was a full professor in Photogrammetry and Remote Sensing at ETH Zurich. Since his retirement in 2009, he has worked on several projects, notably relating to 3D city modelling in Singapore, and coral monitoring with underwater photogrammetry in Moorea, South Pacific. He is co-founder and the current president of 4Dixplorer Inc.
edited with the web application. The cloud-based backend is the central hub for the application pipeline. Users who do not have access to a VR headset are also able to use the software via this web application, and also have access to measurement and annotation functionalities.
Conclusions
The inspection and maintenance of infrastructure elements is often contracted out to service companies. If the team of experts are not based in the vicinity of the infrastructure, they may have to travel some distance to access the site and perform their tasks. Additionally, inspecting the infrastructure can entail checking relevant elements
Issue 2 2024 28
Figure 5: Use of a VR headset to view the MR photogrammetry software.
from up close, such as by climbing walls or pillars or abseiling from the top, with the associated risks (Figure 6).
REALTIME3D provides a technical solution that allows maintenance companies to perform regular infrastructure inspections without traveling to the site and without performing risky tasks. Besid es infrastructure maintenance companies, other target groups for this solution are the public/private bodies and authorities managing the infrastructure, and any other organizations related to monitoring and maintenance services. Any type of generic customer who needs to carry out field visits or on-site observations (for qualitative and quantitative assessments) can also use this system to reduce their travelling and to acquire timely and highly detailed 3D data. As an additional benefit, th e collected images can be stored and used for documentation in case problems emerge over time.
Acknowledgements
REALTIME3D is a research project co-funded by EUROSTARS and the European Commission for the period 2022-2024.
Further information
Communication from the Commission of 12 December 2006 on a European Programme for Critical Infrastructure Protection, COM(2006) 786 final – Official Journal C 126 of 7.6.2007, https://eur-lex.europa.eu/legal-content/EN/TXT/ HTML/?uri=LEGISSUM:l33260
Critical infrastructure protection, EU Science Hub. https:// joint-research-centre.ec.europa.eu/scientific-activities-z/criticalinfrastructure-protection_en
European Programme for Critical Infrastructure Protection, EUR-Lex Access to European Union Law. https://eur-lex.europa. eu/EN/legal-content/summary/european-programme-forcritical-infrastructure-protection.html
Real-time 3D inspection of infrastructure using a stereo camera rig on a UAV. http://www.rtime3d.com/
https://www.photometrix.com.au/australis/


Issue 2 2024 29 Feature
Streamlining point cloud workflows in surveying
AI-powered solutions for reality capture data
By Khrystyna Bezborodova, Trimble
Point cloud classification and feature extraction are the critical building blocks of nearly every reality capture solution. But even with small datasets, traditional manual methods of data extraction are time-consuming and prone to human error. With today’s aerial, terrestrial and mobile mapping scanners collecting millions of points per second over large areas, the highly detailed point clouds can be overwhelming and difficult to manage. Streamlined workflows incorporating artificial intelligence (AI) help to avoid shifting the time saved in the field to lengthy processing of high-volume data in the office. Seamlessly integrating multiple AI techniques and traditional algorithms in one solution simplifies the functionality and improves performance.
Point clouds captured by scanners integrated with processing software and analytical tools form end-to-end workflows for a wide range of applications, such as detailed topographic maps, asset management, pavement inspection, volume computations and more. A modern surveyor benefits from using complementary hardware and software that extracts the most information from the data. Embedded in the software, automated AI-based feature extraction and classification capabilities expedite processing and improve accuracy to fully leverage the value of collected data to address real-world problems.
As a critical part of the solution, AI can work continuously without interruptions,
and the algorithms are consistent and reliable, ensuring information provided to stakeholders is accurate and timely. Rather than replacing a surveyor, it increases the value and efficiency of a surveyor’s skilled work. AI impacts traditional responsibilities by training machines to perform timeconsuming, repetitive activities, leaving humans more time to complete the most valuable components of the workflow, such as data analysis and decision-making based on the deliverables. “Workers appreciate the improvements and benefits of AI,” says Pat L’Heureux, project engineer at Severino Trucking. “We can focus on design work and spend more time analysing data, which leads to smarter and quicker operational decisionmaking.”

Since AI can be quite complex to implement, a user-friendly interface is critical so that surveyors can leverage the advantages without having to be experts in AI technology. The most effective automated classification and feature extraction functionalities rely on the combination of different AI techniques, including 3D and 2D deep learning, machine learning, computer vision, and traditional algorithms.
Advanced classification – the starting point
The first step in almost every information extraction workflow is classification of point clouds acquired by terrestrial laser scanners, aerial Lidar and mobile mapping systems. Classification helps surveyors simplify and organize the point cloud data and provides a convenient visualization of the different elements, from ground to vegetation to structures. The operation also expedites the preparation of data for manual or automated feature extraction workflows. Additionally, classification allows more efficient data sharing between teams, which is especially critical for large datasets.
As an example of the benefits of classification, if the collected data will be used for extraction of poles and signs (point and geometric attributes for each instance
Issue 2 2024 30
Automatic point cloud classification removes trees, people and equipment from UAV point clouds to provide a bare ground dataset.(Image courtesy: Severino Trucking)


of the object), it is much faster to work with just the poles class and signs class rather than the complete point cloud. When the point cloud is already classified, a surveyor can hide all irrelevant classes and work only with the relevant ones. As a further example of classification, a common task of ground surface modeling requires the point cloud to be separated into ‘ground’ and ‘everything else’.
When working with point clouds containing hundreds of millions of points, manual point cloud classification can be extremely time-consuming and cost-prohibitive. If processing is too expensive, it may exceed the value of the collected data. Therefore, accurate automated classification in the modern surveying world is not just ‘nice to have’; it is required to ensure the return on investment (ROI) for any large-scale reality capture project.
Automatic point cloud classification based on a 3D deep learning semantic segmentation model in Trimble Geospatial’s TBC classifies each point into basic classes: ground, buildings, high vegetation, medium vegetation, poles, signs, powerlines, noise (cars, people, scanning artifacts), dividers and steps. 3D deep learning is the most robust solution for point cloud classification. The technology is based on neural networks that allow models to infer probability that a new point belongs to a particular class. The model can make an informed decision when confronted with an unknown object.
With AI doing the labour-intensive classification work, users benefit from a significant reduction in the time it takes to generate separate classes. “The comprehensive information generated adds value and helps us meet and sometimes exceed customer expectations,” says Alex Garcia, national manager mobile solutions at GeoVerra. “After we process mobile mapping data, we classify immediately and send the appropriate files to people just starting the project.”
Customized classification – for ultimate scaling
Generic classification offers great out-ofthe-box functionality for immediate use of basic classes critical to most applications. But sometimes even the greatest deep learning model fails to recognize objects due to unique characteristics. Surveyors also face one-off tasks or recurring projects that require extraction of new objects.
Typically, there are two options for handling this situation: perform manual editing/ classification, or submit a feature request to the software provider. These tactics are expensive and time-consuming, and both options can be unacceptable when trying to meet tight deadlines. Instead, do-it-yourself customization of the classification model can save time and improve performance when extracting nonconforming objects.
Training 3D deep learning models requires not only programming skills, but also extensive knowledge of AI. To provide access to non-AI experts, Trimble has developed a tool that allows users to train their own 3D deep learning model to add new classes or adapt existing classes and apply this classification on top of the generic classification in the base model. This allows a surveyor to take on new projects with more confidence than ever before. With access to customization tools that are easy to learn and use for individual domain-specific needs, the user is not dependent on a software provider’s roadmap and priorities.
Point clouds from terrestrial laser scanners, aerial Lidar and mobile mapping systems are divided into samples which are used to train the classification model. Spherical point cloud samples rapidly created during training contain 25,000 points each. To expedite training, high-density point clouds
Issue 2 2024 31 Feature
Custom classification for transmission towers is applied on top of generic classification. (Image courtesy: GeoVerra)
3D deep learning models are trained to extract features such as kerbs, trash cans, traffic lights and signs. (Image courtesy: GeoVerra)


are reduced, or ‘downsampled’. This process is called voxelization; it divides space into 10cm cubes and picks one point from each cube to reduce resolution. A smaller voxel size means higher resolution and a more precise model.
A user loads annotated data and the model is trained to automate classification of any object. The submitted point clouds with annotated class of interest are divided into training and validation data. Training point clouds are used by the model to learn about a class, and the validation files are necessary for the model to automatically assess its accuracy after each training epoch. All complex training parameters are pre-set. However, a user is advised to select a voxel (3D pixel) size that preserves the shape of the object. Overly aggressive downsampling might result in unrecognizable objects, especially for small items like an insulator on a utility tower. The selected voxel size should also ensure that a model sees not only the object of interest but also the context around it.
Training the model is comparable to preparing for a test, with the training files like textbooks used for learning and the validation files like a pre-test. After studying the textbook (training files) for a certain period of time (one training epoch), it is time to take a pre-test (validation files) to understand how well the model is prepared. If the score is not satisfactory, studying continues for another epoch. In TBC, because the calculated accuracy is divided into training
accuracy and validation accuracy, the user can automatically select an epoch where the model reached its best training and validation accuracies. Training a model might sound complex, but the simplified workflow allows any user to leverage AI without being an expert in the technology.
Delivering information, not data
Classification is an important first step in data processing. However, data alone is not sufficient to support decision-making and produce most deliverables. Improved classification with AI makes it faster and easier to produce useful, actionable information from large volumes of data.
Surveyors often require automated extraction of features as vectors with attributes and automated analysis of data based on the extracted features. Combining AI and traditional algorithms advances the capabilities from simple point and line extraction to decision-making based on the extracted features and their geometric attributes, such as points (sign, pole, manhole, tree) and lines (lane lines, overhead lines, kerbs). Geometric attributes include height and inclination of signs, diameter, height and crown spread of trees, and more. Access to this additional information helps a surveyor understand the state of the asset (e.g. a pole or sign exceeds the allowed inclination angle).
Supervising AI-enabled processes
With AI, the role of a surveyor shifts from performing manual feature extraction to supervising AI-enabled processes with convenient QA/QC tools. In addition to the time saved, the information gathered is more detailed and reliable than when the same task is performed manually. These tools, based on AI and traditional algorithms, are automatic for point extraction or semiautomatic for line extraction. Combining different AI techniques and traditional algorithms is particularly critical for leveraging the collected data from complex systems. For example, mobile mapping systems collect both high-density point clouds and imagery, with each data type requiring different AI techniques to extract information.
For example, multiple techniques must be applied to deliver advanced AI-based tasks such as pavement analysis. This routine
Issue 2 2024 32
Technology simplifies stockpile management and reduces the need for repetitive manual tasks. (Image courtesy: Severino Trucking)
An example of Pavement Inspection functionality, which automatically extracts distresses and calculates the Pavement Condition Index score. (Image courtesy: GeoVerra)

is based on point clouds collected with a mobile mapping system to detect and classify rutting, depression, potholes, bumps and corrugation, while imagery is used to detect cracking. Cracks, especially if not yet severe, are not visible in the point clouds but perfectly visible in imagery. Conversely, rutting might not be visible in the imagery. A set of algorithms extracts certain types of distresses from the point cloud, and 2D deep learning models extract cracks from the imagery. 3D deep learning is used to isolate only the relevant portion (i.e. pavement) of the point cloud.
The AI-driven tool not only provides information faster, it is more accurate than traditional pavement analysis approaches. Calculation of the Pavement Condition Index score for each road segment based on the international ASTM standard enables repairs to be prioritized and crews dispatched with the appropriate equipment.
Stockpile management is another application where automation powered by algorithms furnishes the information needed to make business decisions. Customers don’t use stockpile boundaries and classified stockpile points; they want the stockpile volumes in an easy-to-read report. Traditional methods
involved drawing the boundary by hand, generating surfaces, and finally calculating volumes. “Artificial intelligence is having a huge impact on the work we do, specifically by reducing the time it takes to extract features and classify point clouds,” says René Bundgaard Christensen, land inspector at LE34. “The automated stockpile extraction and calculations in TBC take about half the time compared to manual calculations.”
Significant value to surveyors
As the amount of data being collected and managed continues to increase, streamlining workflows and scaling production with AI-assisted operations is critical for reducing costs and improving quality. AI excels at performing repetitive tasks like point cloud classification and feature extraction reliably and consistently, leaving surveyors free for other or additional field and office tasks.
Remaining competitive today includes offering a wider range of services such as managing assets, inspecting roads, creating digital terrain models (DTMs) and monitoring stockpile volumes at construction or mining sites. The integration of AI and traditional algorithms supports intelligent and confident decision-making by combining and transforming reality capture data into valuable information.
About the author

Khrystyna Bezborodova is a feature extraction product manager at Trimble Geospatial. Her role coordinates across the Trimble Business Center, Trimble Photogrammetry, eCognition, Mobile Mapping, Scanning and Central AI teams to deliver point cloud and image-based geometry and attribute deliverables for survey and construction workflows.
Issue 2 2024 33 Feature
Automated stockpile extraction and calculations streamline the workflow. (Image courtesy: LE34)
A geodetic tool for modelling sea level variations
Assessing environmental changes with GNSS reflectometry
By Mohammad Bagherbandi and Saeed Farzaneh
The utilization of remote sensing observations to monitor essential climate variables (ECVs) has become increasingly important in studying their regional and global impacts, as defined by the Global Climate Observing System (GCOS). Understanding the Earth’s surface conditions, including soil moisture runoff, snow, temperature, precipitation, water vapour, radiation, groundwater and sea surface height (SSH), can positively impact the environment and ecosystems. Here, the authors present an overview of how global navigation satellite systems (GNSS) can be employed for environmental monitoring, with a particular focus on sea surface height monitoring. This includes examination of the advantages and disadvantages of utilizing a network of permanent GNSS stations for monitoring sea level rise along shorelines.
Monitoring sea level rise is crucial to understanding and preparing for the potential impacts of climate change, such as flooding, erosion and saltwater intrusion in coastal areas. It can also affect global ocean circulation patterns and climate. Scientists can provide helpful information to policymakers and stakeholders by monitoring sea level change for informed decisions about land use, infrastructure development and emergency preparedness. Different techniques and sensors can be used individually or in combination to provide a complete picture of sea level changes, including tide gauge stations, satellite altimetry missions, satellite gravimetry techniques, GNSS stations, ocean buoys and acoustic sensors. One of the important applications of SSH monitoring is the study and analysis of tidal frequencies in the context of predicting tides, modelling sea currents, and harbour planning (e.g. breakwater design).
GNSS interferometric reflectometry
GNSS is primarily designed for precise positioning, timing and navigation applications. For precise positioning in geodesy, noises and systematic errors affecting the precise positioning are filtered out, e.g. for establishing reference frames and geodetic networks. Hence, the error sources from the atmosphere (due to the
tropospheric and ionospheric delays), satellite and receiver clocks, satellite orbit data errors, and multipath error (Teunissen and Montenbruck 2017) are the main issues that should be solved for precise positioning applications. For example, the multipath error occurs when the transmitted signals from GNSS satellites are reflected from the receiver’s surrounding areas. These are unwelcome signals for precise positioning and are considered as noises in geodesy (see Figure 1). Therefore, the reflected (indirect) signals should be cancelled out, e.g. by increasing the cut-off-angle and using precise antenna models equipped with a chock ring plate (a metallic plate that can be mounted under the antenna). The reflected signals increase the uncertainty of the positioning. However, the reflected signals can be used for other applications, e.g. environmental monitoring. In fact, the noises contain an imprint of the Earth’s surface conditions. Since the mid-1990s, the reflected signals have been used by scholars in different fields. These signals can be used to detect snow depth, ice thickness, vegetation growth, soil moisture and sea level change by employing the GNSS interferometric reflectometry (GNSS-IR) technique.
Martin-Neira (1993) and Larsen et al (2008) are two pioneer scientists who studied oceanic surface and soil moisture,
respectively, using the Global Positioning System (GPS) signals reflected from the surface for the first time. The reflected signals can be collected using terrestrial techniques (geodetic ground stations) or spaceborne techniques (using receivers mounted on satellites). For instance, the reflected signals can be recorded using onboard spaceborne platforms, e.g. UK-DMC and TechDemoSat-1, which were successfully launched in 2003 and 2014 respectively and used for GNSS-IR applications. In addition, eight microsatellites fully dedicated to GNSSIR for ocean surface and wind monitoring were launched in 2016 by NASA Cyclone GNSS (CYGNSS). And in 2021, a cube satellite (10x10x30cm³) was designed for GNSS-IR applications by the Passive REflecTomeTrY (PRETTY) project. This Austrian consortium, led by RUAG GmbH, relies on results from the former ESA OPS-SAT mission, conducted by TU Graz.
Sea surface height determination using GNSS-IR
Using GNSS-IR, one can estimate the absolute vertical distance from a GNSS antenna to the reflective surface (see Figure 1). This allows the sea level changes to be studied using the GNSS-IR technique. The main advantage of GNSS-IR concerning other methods, e.g. tide gauge stations, is that the GNSS can be used as a multipurpose
Issue 2 2024 34

formula (in which λ is the GNSS signal wavelength):
system. The tide gauge stations relatively record the SSH with respect to the land adjacent to the station. Therefore, a precise vertical land motion model (land uplift or subsidence model) is required for correcting the tide gauge data. For example, the largest land uplift rate (due to the post-glacial rebound) can be seen in Fennoscandia and Laurentia. However, GNSS can be used for land motion monitoring in combination with GNSS-IR to monitor the SSH. The other advantage of using GNSS reflectometry instead of tide gauge for sea level monitoring is that GNSS-IR can provide sea level information over a wider area. Moreover, the tide gauges are often installed in harsh environments, e.g. piers, making them vulnerable to damage from storms or extreme weather events. GNSS-IR is less vulnerable to such damage because the receivers are usually located on stable land. Furthermore, the maintenance of tide gauges can be expensive due to the need for regular calibration. In contrast, GNSS-IR needs less maintenance because the equipment is generally more robust. It is also worth mentioning that satellite altimetry accuracy around the coastlines considerably decreases due to the imperfect reflection of the radar waveforms in the shallow areas (i.e. radar signal reflections from land).
The height parameter of the GNSS antenna to the reflected surface (e.g. sea level) can be obtained using the interference between direct and reflected signals. There are two methods for this purpose: carrier phase, and signal-to-noise ratio (SNR). In the SNR method, the main observation is SNR data collected by the receiver. The SNR measures the signal strength received by a GNSS antenna (i.e. composite signal power and noise power ratio calculated in GNSS receivers). The SNR data is the main input in the GNSS-IR technique to extract the SSH using zenith-looking antenna. It is important to check and ensure the data shows up in the RINEX file.
Challenges associated with GNSS-IR
The main issue in the GNSS-IR method is determining the predominant reflected/multipath frequency in SNR data using different spectral analysis techniques (sophisticated signal processing algorithms) such as Wavelet decomposition, Lomb-Scargle Periodograms (LSP), least squares harmonic estimation, etc. These methods help to find the multipath frequencies in the frequency domain. The relation between the predominant reflected frequency (fM) from the desired surface (e.g. sea level) and the height of the antenna (h) is expressed in the following

Different GNSS carrier phases (signals) can be used for this purpose (see Figure 1). However, the main question is, which GNSS carrier phase signal provides better results for SSH? This question still needs to be investigated to obtain suitable uncertainty for SSH determination using GNSS. One of the challenges associated with using GNSS-IRis that the GNSS signal strength reflected off the ocean surface is typically weak, making detection and accurate measurement difficult. In addition, the signals from GNSS satellites can reflect off several surfaces before reaching the receiver, causing interference and measurement errors (called multipath interference). Moreover, the weather conditions such as rain, fog and cloud cover can affect the strength and quality of GNSS signals, making it more tricky to achieve precise measurements. Also, parameters such as satellite geometry, antenna patterns and internal receiver noises can affect the accuracy and quality of GNSS-IR results.
A toolbox for GNSS-IR
A free Matlab toolbox called GNSS-IR-UT has been developed for SSH studies using the GNSS-R method (Farzaneh et al. 2021). The main advantages of this toolbox with respect to the other code packages are:
1. The existing code packages are not userfriendly. For example, the code packages are Python-based without any user interface, making it difficult for new users, especially those unfamiliar with Python coding.
2. To run the codes, SNR data should be extracted and prepared from RINEX and SP3 (satellite orbit data) files.
The GNSS-IR-UT toolbox involves the following three steps:
• Step 1: The toolbox reads the GNSS data stored in the RINEX file and automatically extracts the SNR of various signals.
• Step 2: GNSS-IR-UT estimates the dominant frequencies using spectral analysis methods.
• Step 3: At the end of the processing stage, it determines the antenna height relative to the reflecting surface for each epoch (observation time). The user can fully control different parameters and tune them easily to obtain the desired
Issue 2 2024 35 Feature
Figure 1: GNSS-IR and its applications.
result. For example, the user can define which GNSS system should be used for the processing. In addition, different spectral analysis techniques can be applied to determine the predominant reflected/multipath frequency.
Assessment using tide gauge stations
The obtained SSH time series can be assessed using other SSH monitoring methods e.g. tide gauge stations. In a comparison study, the hourly and daily data results were compared over three months using GNSS (station ID: MERS) and tide gauge stations in Erdemli, Turkey. The GNSS station’s distance from the tide gauge station was about 524m (at 36.563737 latitude, 34.255305 longitude). The GNSS receiver and antenna types were Leica GR50 and Leica AR10, respectively. The GNSS receiver could collect different GNSS carrier phases, i.e. GPS: L1/L2/L5, Galileo: L1/L5/L7/L8, GLONASS: L1/L2, BeiDou: L2/L7.
The results (see Figure 2) show that the high temporal and spatial resolution measurements of sea level altitude can be made using GNSS signals that are reflected from the water. So which GNSS signal provides better SSH results? The results showed that the SSH measured by the L1 signal of GPS, GLONASS and Galileo satellites provided a better and more accurate solution than other GNSS systems systems (Gholamrezaee et al. 2023). However, the BeiDou L2 signal provided a better outcome for the SSH. As can be seen in Figure 2, some of the GNSS signals showed poor SSH retrieval performance, so the root mean square errors (RMSEs) are larger than 1m. In other words, the large RMSEs are due to the signal structure and the antenna and receiver tracking method. For example, the GPS signals originated from the same oscillator; hence GPS L2 signal is contaminated by the GPS L1 signal. There are two tracking methods, i.e. Z-tracking and squaring methods, to track the signals (e.g. GPS
Further reading
Wang, X., He, X., Xiao, R., Song, M., & Jia, D. (2021). Millimeter to centimeter scale precision water-level monitoring using GNSS reflectometry: Application to the South-to-North Water Diversion Project, China. Remote Sensing of Environment, 265, 112645.
Farzaneh, S., Parvazi, K., & Shali, H. H. (2021). GNSS-IR-UT: a MATLAB-based software for SNR-based GNSS interferometric reflectometry (GNSS-IR) analysis. Earth Science Informatics, 14(3), 1633-1645.
Larson KM, Small EE, Gutmann E, Bilich A, Axelrad P, Braun J (2008) Using GPS multipath to measure soil moisture fluctuations: initial results. GPS Solut 12(3):173–177
Martin-Neira M (1993) A passive reflectometry and interferometry system (PARIS): Application to ocean altimetry. ESA J 17(4):331–355
Teunissen, P. J., & Montenbruck, O. (Eds.). (2017). Springer handbook of global navigation satellite systems (Vol. 10, pp. 978-3). Cham, Switzerland: Springer International Publishing.
Gholamrezaee, S., Bagherbandi, M., Parvazi, K., & Farzaneh, S. (2023). A study on the quality of GNSS signals for extracting the sea level height and tidal frequencies utilizing the GNSS-IR approach. GPS Solutions, 27(2), 72.
L2P signal). The performance of the Z-tracking method depends on the precision of the W code obtained from L1. The squaring method also depends on squaring the L2 signal and bandpass filter, which can cause a loss of 20-30dBHz and weaken the SNR. Therefore, the SSH retrieval performance using the GPS L2 signal will be weak (cf. Wang et al. 2021).

Issue 2 2024 36
Figure 2: Comparison of different GNSS signals and observation types using GNSS-IR and tide gauge data at MERS station (D = Daily and H = Hourly).
A similar comparison was performed using different stations, i.e. GTGU (Onsala Space Observatory, Sweden), MCHN (Michipicoten Harbor, Ontario, Canada), MARS (Marseille, France), TGDE (Tregde, Norway) and AT01 (St Michael, Alaska, USA), and obtained similar results.
Conclusion
In conclusion, while GNSS-IR and tide gauge are both useful techniques for monitoring sea level height, GNSS-IR offers several advantages. GNSS-IR can provide more accurate and continuous measurements of sea level height, even in areas with complex topography or limited access. Additionally, GNSS-IR provides complementary information on other geophysical parameters, such as soil moisture, vegetation and snow depth, particularly in areas where traditional monitoring methods are difficult or impractical. Therefore, considering the challenges and limitations of tide gauge measurements, it can be concluded that GNSS-IR is a more suitable technique for sea level height monitoring.
About the authors


Mohammad Bagherbandi is a professor at the University of Gävle, Sweden, and a researcher (docent) at the Royal Institute of Technology (KTH), Stockholm, Sweden. His professional interests include geodetic surveying, precise positioning, satellite geodesy, Earth observation using satellite sensors, physical geodesy and geodynamics. His background is in land surveying engineering. He is currently pursuing multidisciplinary research combining directions such as geophysics, geodesy and land surveying (applied geodesy).
Saeed Farzaneh received his MSc degree in Geodesy from the University of Tehran in 2009 and a PhD in Geodesy from the University of Tehran, Iran in 2015. He is now an associate professor in the faculty of the School of Surveying and Geospatial Engineering, the University of Tehran. His research focuses on atmospheric modelling, satellite geodesy and GNSS positioning.

Issue 2 2024 37 Feature
Progressing land management
LADM: digitally transforming the land administration ecosystem
By Anthony Beck and Lu Xu
The revision of the Land Administration Domain Model (LADM) is significantly changing the scope of the ISO 19152 standard. The focus is shifting from the architectural requirements of the agency, to the architectural requirements of the ecosystem. At the same time, the LADM is recognized as being pivotal to the next phase of digital transformation, where policymakers expect increased operational and process alignment between agencies in the ecosystem. This article summarizes how the LADM can support the digital transformation of the land administration ecosystem.
Land and property are characterized by the interplay of complex rights relationships formalized through different land administration stakeholders. The legitimacy of the rights can be expressed socially and legally. Formal processes generally require legal legitimacy. Land administration is the process of determining, recording and disseminating information about the ownership, value and use of land when implementing land management policies. Land administration reflects the activities
of different authoritative agencies that collectively create an ecosystem. This tends to include the following types of land- and property-related functions:

Figure 1: Authoritative agencies sharing data and concepts in an integrated ecosystem. The network demonstrates authoritative relationships between party identity systems, company registration, land registration, and power of attorney. In a digital system dynamic data is commonly exposed through Application Programming Interfaces (APIs). (Image courtesy: Anthony Beck under a CC-BY licence)
Issue 2 2024 38


• Land and property titling (land registry) – managing rights registration and the subsequent transaction, and maintenance of the land register
Development (planning department) – regulating land and property development
• Use and conservation (various departments) – regulating the use and conservation of land
Finance and valuation – valuing property and framing how revenue is generated from land and property through sales, leasing, and taxation
• Disputes and conflict resolution – land tribunals and other adjudicating agencies to resolve conflicts concerning the ownership and use of land
Collectively these agencies provide the mechanism through which tenure is formalized. In addition, each agency has a mandate and powers to deliver that mandate. This includes holding ‘authoritative data’ – officially recognized data than can be certified and is provided by an authoritative source, and is therefore implied to be up to date, credible, accurate, assured, well-governed and trusted. An efficient
Issue 2 2024 39 Feature
Figure 2: The modular arrangement of rights relationships describing conventional incidents (framing the conveyancing process) and reserved incidents (re-used under a CC-BY licence from Anthony Beck).
Figure 3: Conceptual representation of permit creation using Business Process Modelling Notation (BPMN). Note the agency relationships described in the process (re-used under a CC-BY licence from Anthony Beck).

and effective land administration ecosystem will use authoritative data as a core reference that can be re-used throughout the ecosystem. This is referred to as the ‘once-only principle’ (UNECE, 2021, p. 11).
Lack of digital integration
Unfortunately, for the majority of jurisdictions, the products, services and processes of these agencies are not digitally integrated (UNECE, 2021, p. 11). This is generally because the ecosystem has never been re-architected to capitalize on digital systems; rather, agencies have evolved independently. This often results in the duplication of capabilities and inefficient intra-ecosystem processes. In other words, many current land administration ecosystems are represented by agencies operating predominantly within digital silos. This makes for an inefficient digital ecosystem. The
policy expectation is that the capabilities of agencies will evolve and become increasingly integrated (see Figure 1). This requires digital transformation, which is considered to be the key megatrend in the short-medium term (UNECE, 2021, pp. 3-4). So how can the LADM play a role within this context?
Rights duality
The LADM approach to restrictions and responsibilities frames encumbrances in terms of their impact on a land owner rather than the benefit that the right holder has over land owned by someone else. The distinction is subtle but important, reflecting a concept called ‘rights duality’. The implication of rights duality is that a registered right that is legitimately held (and has corresponding tenure security) imposes a duty (either a restriction or responsibility)
on the property owner. The duality represents two relationships:
1. The positive or negative duty owed by the affected land owner
2. The interest held by a third party
The duality of rights and duties provides a finely nuanced mechanism to define relationships between parties framed through land. In this manner, reserved incidents are rights controlled by authoritative agencies which create duties in the form of restrictions and responsibilities on any affected property. This has important ramifications when considering the whole land administration ecosystem.
The paradox in an integrated ecosystem
Rights duality dictates that if a land register records a duty (as a restriction or
Issue 2 2024 40
Figure 4: Transactions associated with land and property based on LADM concepts: (1) a transfer of party, (2) an alienation of right, and (3) variation of land. (Image courtesy: Anthony Beck under a CC-BY licence)
responsibility), then within the land administration ecosystem there exists a specified third party or authoritative agency which holds the corresponding right. What should be registered: the right (the benefit for the right holder), the duty (the encumbering restriction or responsibility against the property), or both? This is a difficult question and, in part, the answer depends upon the maturity of the ecosystem and the level of data, service and process integration between authoritative agencies. The once-only principle demands efficient recording. It does not matter whether it is the right or the duty which is recorded. What matters is that other agencies have the ability to infer the respective right or duty from the information which is exposed in the ecosystem. However, where an agency has a mandate, then it manages the right or duty relationship and produces the associated authoritative data. No other agency has the legitimacy to authoritatively manage this specific data. Unfortunately not all ecosystems are mature and most do not rigorously deploy the once-only principle. While such jurisdictions are being reformed, it is important that rights duality is embraced. The authoritative agency should also record any appropriate ancillary data which is required so that the right or duty can be effectively re-used by other actors in the ecosystem. It is only by understanding the operational requirements of the ecosystem at a holistic level that the once-only principle can be effectively implemented. This is not an easy task.
Revision of the LADM to focus on an ecosystem
The revision of the LADM extends the scope of the 2012 standard towards addressing the needs of the broader land administration ecosystem (Lemmen et al., 2023). This revision has the potential to do more than provide semantic interoperability between jurisdictions; it can support the delivery of integrated e-government services. As
What is the Land Administration Domain Model?
The Land Administration Domain Model (LADM) offers a structured approach to understanding land rights by focusing on parties, rights and land parcels. The first edition of the LADM was published in 2012 and focused principally on the needs of the land registration community. The LADM is currently being revised. Edition II will extend the scope of the 2012 standard towards addressing the needs of the broader land administration ecosystem, so that this framework will continue to provide a comprehensive basis for effective land administration and management by ensuring clarity and efficiency in handling land-related matters.
a standard, the revised LADM should be foundational to the digital transformations required to deliver integrated services. So how is this to be applied to the land administration domain (which is, after all, a subset of the broader government ecosystem)?
Each jurisdiction is unique in the way it determines the social value of rights which are defined in property law. Property law also describes the powers that a right holder has to grant, license, alienate, discharge or vary a right. While the specific details relating to powers depend on the type of tenure, legal tradition and social need expressed in a jurisdiction, the broad nature of powers are generic. In summary, the relationships between parties and rights may be unique to a jurisdiction, while the abstract operations available through powers to change rights are broadly generic across jurisdictions.

Issue 2 2024 41 Feature
Figure 5: How transactions can change party, rights and land relationships. (Image courtesy: Anthony Beck under a CC-BY licence)
The role of the LADM in generic operations To support transparency and interoperability transactional operations should be grounded in the standard LADM primitives. This can be illustrated by alienation, for example, which can occur through a party, right or land dimension (see also Figures 4 and 5 and FAO 2002, p. 10):
• A Transfer of Party (ToP) transaction: A right to alienate all rights to the entire holding (e.g. through sale). A transfer of all or a proportion of the ownership to specified third-parties. Fragmented shares held by different parties can be consolidated using a ToP operation.
A Variation of Land (VoL) transaction: A right to alienate all rights to a portion of the holding (e.g. by subdividing it). A subdivision of a cadastral unit to create two or more cadastral units or the consolidation of multiple cadastral units to create a single cadastral unit.
An Alienation of Rights transaction: A right to alienate only a portion of the rights (e.g. through a lease). Rights can be separated from the body of a property (and subsequently transferred to third-parties).
At first glance, these operations appear only applicable for land registration. However, the authoritative agency that manages reserved property has powers to alienate rights and transfer them to third parties. This allows these agencies to create permits and other waivers that benefit third parties using these generic operations.
Conclusion
The authors have argued that policy initiatives and the LADM standard are both moving from the architectural requirements of the agency to the architectural requirements of the ecosystem. This represents a significant change in perspective. The challenge is in how to frame and deliver such transformation from the perspective of developing well-defined generic processes grounded in legal, operational and standards-based concepts.
Property law describes both the range of registrable rights and the powers that a right holder has to grant, license, alienate, discharge or vary a right. While the relationships between parties and rights may be unique to a jurisdiction, the abstract operations available through powers to change rights are broadly generic between jurisdictions. To reflect this, the authors propose that generic transactions in the ecosystem can be framed through core LADM primitives. A transfer is a transaction in the party dimension, a subdivision or consolidation is a transaction in the land dimension, and a rights alienation or amalgamation is a transaction in the rights dimension.
The change in focus from the agency to the ecosystem highlights the importance of rights duality in delivering the once-only principle. While it is clear that the mandated agency should manage authoritative data, in a once-only ecosystem that agency also has the burden of ensuring the once-only data is suitable for re-use scenarios outside its mandated remit. Such understanding requires transparent communication between stakeholders. It is only by understanding the operational requirements of the ecosystem at a holistic level that the once-only principle can be effectively implemented. This requires significant social engineering. The LADM is pivotal to establishing and supporting these ecosystem-wide principles. The LADM revision should provide clarity in terms of the foundational concepts, implementation patterns and generic business logic. While the LADM
was designed to provide interoperability between jurisdictions, the revision should support interoperability between agencies within a functioning ecosystem. This is essential to achieve the digital reforms envisaged by UNECE, FAO and FIG (UNECE, 2021).
Further reading
FAO. (2002). Land tenure and rural development (Issue 3). Food and Agriculture Organization of the United Nations. https://www.fao.org/publications/card/en/c/c6ded0bb-c0525802-9659-b93746c82019/ FAO. (2022). Voluntary Guidelines on the Responsible Governance of Tenure of Land, Fisheries and Forests in the Context of National Food Security. FAO. https://doi.org/10.4060/i2801e
Lemmen, C., Oosterom, P. V. A. N., Kara, A., Kalogianni, E., & Alattas, A. (2023). Overview of Developments of Edition II of the Land Administration Domain Model. FIG e-Working Week 2023. https://www.fig.net/resources/proceedings/ fig_proceedings/fig2023/papers/ts03i/TS03I_lemmen_van_ oosterom_et_al_12245.pdf
UNECE. (2021). Scenario Study on Future Land Administration in the UNECE Region. United Nations. https://doi. org/10.18356/9789210011204
Video presentation: Digital transformation within the land administration ecosystem. FIG C7/C2 Annual Meeting 2023, Deventer, the Netherlands
Video presentation: Digital automation of generic operations within the land registration domain. 11th International FIG Workshop on the Land Administration Domain Model & 3D Land Administration 2023, Gävle, Sweden
About the authors


Dr Anthony Beck is a geospatial and analytics professional with a strong mix of technical, commercial, academic and policy skills. He is interested in approaches that improve registration automation and first-order logic modelling of the registration domain.
Dr Lu Xu is senior lecturer in property law at Lancaster University, UK, with research interests in apartment ownership and management, land registration, and comparative studies of land law. He has worked as a member of technical advisory teams for both the Law Commission and the Scottish Law Commission on commonhold and tenement law reforms.
Issue 2 2024 42
Helping to understand and utilize the ever-changing landscape
How aerial imagery simplifies surveying workflows in Denmark
By Martin Kjelgaard Rosengreen, Hexagon’s Geosystems division
Aerial imagery is an essential resource for uncovering unknown insights into how land has been used over time. This article explores the evolution of airborne technology and its impact on the understanding and utilization of Denmark’s ever-changing landscape by chartered surveyors throughout the country.
High-resolution aerial imagery has become an indispensable tool for land administrators and chartered surveyors. It enables accurate measurement and mapping of land features that aid in infrastructure and land-use planning, property boundary determination, and even resolving property disputes. One good example is Denmark’s Digital Orthophoto (DDO) project, which has been a reliable historical record of Denmark’s geography since 1995. For nearly three consecutive decades, the collection has provided detailed aerial orthoimagery to chartered surveyors, municipalities and other land professionals in Denmark. Conducted every two years, the DDO programme has consistently documented Denmark’s development of landscapes, urban centres and infrastructure. Initially, the first collection was created to support a major infrastructure project. Since then, the DDO series has become part of the HxGN Content Program’s expansive data library, which anyone worldwide can access.
The advancement of airborne technology
The geospatial data industry has seen rapid technological advancements: from

film cameras that capture black-and-white photos, to high-performance airborne sensors that simultaneously collect multiple datasets. The innovations also had an impact to the DDO collection, significantly evolving how the national aerial images are updated and shared with customers. In the beginning, the process of collecting aerial
imagery using film cameras was complex and time-consuming work. Thousands of photos had to be developed, scanned and manually processed to create orthorectified images positioned precisely on a map. Photos were delivered to customers on CDs, presenting extensive data management challenges. Nowadays, software enhances every stage

Issue 2 2024 43 Feature
Aerial image of Denmark’s agricultural land area captured in 2022. (Image courtesy: Hexagon)
Aerial photo of Copenhagen Airport taken using a film camera in 1954. (Image courtesy: Hexagon)


of the process. Flight planning software enables the immersive planning of flights with a virtual 3D world view. While in the air, a flight management and control system automates sensor configuration and release, system monitoring and logging, and flight guidance as part of an integrated and complete system to increase productivity. The only thing software cannot augment during the flights is the weather (which can prove challenging in Denmark, even during the summer!). The data captured by airborne sensors fully integrates with postflight processing software, producing a large number of datasets: orthoimagery, point clouds, elevation data, 3D mesh models and more.
Greater accuracy and accessibility
Today’s technology allows vastly more detailed images to be processed. Where once the country was covered by just 6,000 photos, the DDO programme now captures hundreds of thousands of images without concern. The airborne sensors used for the programme offer 12.5cm-resolution imagery, giving land administrators and surveyors greater detail than ever before. High-resolution aerial images provide an accurate view of the world, making it easier to present findings compared to the technical maps used previously.
A key advantage of the DDO programme is that the data is always collected during the summer, ensuring consistent seasonal conditions for like-for-like comparison. Although the Danish government provides lower-resolution imagery for free, Torbjørn Mandahl Pedersen, Partner at LE34, has found the DDO imagery to be more visually appealing. “Hexagon’s aerial
imagery is intuitive and aligns with people’s real-world perceptions,” says Pedersen. “And because the images are taken during the summertime, the green trees make for a nice backdrop when presenting to our clients.” Accessing the DDO series is straightforward. As soon as new editions are processed, the refreshed data is uploaded to servers where users can gain access immediately within their GIS application. Users can choose between different vintage layers of the DDO programme, making it simple to compare changes over time.
Visualizing boundary markings
Historical aerial imagery plays a vital role in documenting land and property changes over time, and the availability of highaccuracy aerial data is transformative in simplifying mapping processes and clarifying boundary disputes. For this reason, the DDO collection is leveraged by many of the over 1,400 members of the Danish Association of Chartered Land Surveyors (PLF).
Customers of the PLF surveying firms include private homeowners, developers, utilities, municipalities and government agencies requiring guidance on land management, land-use potential and boundary delineation. Chartered surveyors conduct cadastral surveys to determine boundaries between plots of land, and aerial data provides an intuitive basemap to help clients visualize boundary markings and proposed changes.
“Before we had access to aerial images, LE34 relied on technical maps, which were more challenging for clients to understand. We find that a lot of customers struggle to interpret traditional maps. With the aerial image in front of us, we can talk to the customer as if we were in the field together,” states Pedersen.
The DDO programme plays a critical role in land claim validations. Michael Stærk, Partner at Skel.dk, utilizes aerial imagery to compare property boundaries with the actual on-ground situation when advising homeowners or businesses, as mandated by Danish regulations. “The resolution and the placement accuracy are crucial. We often find mismatches between the registered property borders and the actual situation in the aerial imagery – discrepancies that the respective owners need to resolve through negotiation,” explains Stærk.
Morten Knudsen, a chartered surveyor at Kjær, comments: “Working with a dataset that
Issue 2 2024 44
Aerial orthoimage taken of Copenhagen in 1995, which is when the DDO programme started. (Image courtesy: Hexagon)
Aerial orthoimage taken of Copenhagen in 2022. (Image courtesy: Hexagon)
spans almost three decades allows us to document historical land use – a crucial feature considering the Danish legal landscape. Under Danish law, if an individual or entity has occupied and used a plot of land for over 20 years, they can claim it, irrespective of whether they are the registered owner.”
A multipurpose visual record
The DDO series has won supporters in other surveying arenas. Comprehensive datasets of high-resolution aerial imagery can play a role in negotiations with landowners during infrastructure projects involving the laying of new pipes, for example. The images are likewise an important quality assurance tool, verifying that everything within a given area has been measured accurately. In land management, the DDO collection provides valuable insights for assessing vegetation health, monitoring changes in land use, and supporting conservation efforts. Archaeologists can use the data to examine the structure and elevation of land, and agriculturalists can detect discrepancies in how a crop grows in different areas. The online accessibility of the aerial images enhances their utility, offering immediate references when exploring new areas.
Picturing the future of aerial data
As technology continues to transform possibilities for data gathering and visualization, the DDO project shows how innovations can enable
a more intuitive understanding of land conditions over time. 3D mapping, which integrates imagery and Lidar technology, holds the potential to revolutionize how chartered surveyors and planners access and utilize land data, optimizing spaces and informing datadriven decisions.
About the author

Martin Rosengreen has more than 20 years of experience in the geospatial industry, with a background in remote sensing and geophysics. Currently, he is a business developer in the Geospatial Content Solutions business unit within Hexagon’s Geosystems division. He is also the product manager of the Danish Digital Orthophoto programme.

Issue 2 2024 45 Feature
Geo Week in Denver
Industry 5.0 and converging technology
By Durk Haarsma, GIM International
Geo Week has clearly established itself as the main industry event in the USA. The latest edition, from 11-13 February 2024, attracted around 3,000 geospatial professionals to the Colorado Convention Center in Denver, the ‘Mile High City’. The exhibition area featured more than 200 companies showcasing solutions for the built environment, including advanced airborne/ terrestrial technology and commercial 3D applications. Besides that, there was a conference programme with more than 50 sessions, demos and workshops. Together with partners such as ASPRS, ISPRS and MAPPS, the conference and exhibition are expected to continue to grow.


In line with tradition, Geo Week 2024 started on the Sunday with a round of ‘Product Previews’. This year, 19 companies presented their latest products and workflows in quick 15-minute sessions. They included Matterport, TopoDOT, Blue Marble Geographics, RIEGL, Bentley Systems, Trimble, Hexagon, SBG Systems, Nearmap, Phase One, 3DSurvey, Esri, Prevu3D, Teledyne Geospatial and Pix4D. Also on the Sunday, the kick-off keynote featured thought leaders from Dodge Data & Analytics, Bentley Systems, Foth, Skanska, The National Institute of Building Sciences, and Hensel Phelps. The panellists engaged with one another and the audience in an interactive discussion on how to approach technology adoption, including a brainstorm on technology convergence, Industry 5.0 and the role of artificial intelligence (AI) in it all.
Discussion, thought leadership and networking
The keynote session signalled the start of a jam-packed 2.5-day programme characterized by discussion, thought leadership and networking. Topics for the sessions ranged from the latest industry

Issue 2 2024 46
Impressions of the Geo Week 2024 conference. (Image courtesy: Diversified Communications)

updates for surveying and mapping, new features for bathymetric Lidar, and the potential of augmented reality, virtual reality (AR/ VR) and mixed reality for the industry, to the role of sustainability in development of the business, reality capture challenges, and the application and scaling of digital twins.
Monday 12 February was ‘World Lidar Day’, so the technology was fittingly celebrated both on the show floor and in the conference sessions. The morning kicked off with a keynote called ‘Geospatial for Good: How is Geospatial Technology Changing?’. This highlighted the role played by GIS in real-life projects such as Oregon’s COVID-19 vaccination programmes, wildfire relief in Canada, and post-flood insights in Derna, Libya.
Accomplishing more together
Another standout session during the 2.5-day event was the joint plenary panel of the World Geospatial Industry Council (WGIC) and the Management Association for Private Photogrammetric Surveyors (MAPPS). The session explored the concept of connections, and the belief that private industry, governments and non-profits are able to accomplish a lot more when they put their minds together. The private sector will eventually be subject to more government regulation, and it was emphasized how important it is to have a seat at the table in order to participate in – and even start – discussions about how the guidelines should look, before they take effect.
In the ‘Pitch the Press’ session on Monday afternoon, companies had the opportunity to pitch their latest products and ideas to a panel of high-profile press representatives at Geo Week. Out of the 16 rapidfire two-minute presentations, the panel chose Oxford Technical Solutions (OxTS), LidarSwiss Solutions and Exyn Technologies as the three winners. These solutions were deemed to represent the cutting
edge in autonomous UAV technology, Lidar georeferencing and boresight calibration, and real-time Lidar processing.
Academic Showcase and awards
One new feature this year was an Academic Showcase poster session, where students and faculties enthusiastically shared innovative projects and case studies that applied Lidar and other technologies to understand the world. The projects ranged from taking on multi-dimensional mapping projects with many different stakeholders, to mapping underground spaces for flood risk, and from identifying previously missed archaeological features in the desert, to applying synthetic aperture radar (SAR) to detect environmental hazards, and more. Meanwhile, the Geo Week Awards celebrated excellence across the geospatial industry. Accolades went to Blue Marble Geographics, Singapore Housing & Development Board, US Army Corps of Engineers, and A&T State University. Dimitrios Bolkas, associate professor at Pennsylvania State University, won the Young Geospatial Professionals award.
There is a strong social aspect to Geo Week, and both the Sunday and the Monday ended with a ‘happy hour’ in the exhibition hall to allow attendees to network with their peers. The last day of Geo Week is traditionally a half day, leaving enough time to travel home in the afternoon. The geospatial community from within the USA and abroad will convene again in Denver around the same time next year (10-12 February 2025).
Issue 2 2024 47 Report
More information www.geo-week.com
The skyline of the ‘Mile High City’, as Denver is known. (Image courtesy: Shutterstock)


COP 28 spurred collective action on climate change and resilience against environmental challenges, with geospatial and land management professionals at the forefront.
How geospatial and land management professionals can drive climate action
FIG Climate Compass Task Force
members Naa Dedei Tagoe from Ghana and Simon Ironside from New Zealand delve into the key highlights of COP 28, and explore the pivotal role that professionals in the geospatial and land management industry can play in shaping the global climate agenda.
The FIG Climate Compass Task Force was established for the term 2023-2026 to support surveyors to engage with the climate crisis. One of the standout achievements of COP 28 was the historic agreement signalling the ‘beginning of the end’ for the fossil fuel era, a critical driver of climate change. This landmark consensus, reached for the first time in almost three decades of international climate negotiations, underscores the urgent need for a swift transition to renewable energy sources and sustainable land management practices. While not directly within the realm of geospatial and land management, this transition highlights the crucial role of geomatics and geospatial data in identifying suitable locations for renewable energy infrastructure and monitoring the ecological impacts of energy transitions.
Additionally, COP 28 saw the operationalization of funding arrangements for addressing loss and damage caused by climate change. This development presents significant opportunities for
geomatics, surveying and spatial information professionals to contribute to risk assessment, disaster preparedness and post-disaster recovery efforts. Geospatial technologies can play a vital role in assessing the extent of damage caused by climaterelated events and identifying vulnerable areas prone to loss and damage.
Spatial data in resilience-building
Furthermore, parties at COP 28 agreed on targets for the Global Goal on Adaptation (GGA) and its framework, highlighting the importance of adaptation planning and strategies supported by geospatial data and remote sensing technologies. Geospatial professionals can make substantial contributions to resiliencebuilding efforts by providing spatial data for vulnerability assessments, land-use planning and infrastructure development in climatesensitive areas.
By emphasizing the crucial link between climate action and biodiversity conservation, COP 28 underscored the significance of conserving and restoring ecosystems. This presents unique opportunities for professionals to leverage remote sensing data for forest monitoring, biodiversity assessments and carbon mapping. Geospatial professionals play a pivotal role in monitoring changes in land cover, deforestation rates, and carbon stocks, thereby supporting efforts to conserve natural resources and mitigate climate change.
Poised to drive meaningful change
In conclusion, COP 28 served as a rallying call for collective action to address climate change and build resilience in the face of environmental challenges. Geospatial and land management professionals are poised to lead this charge, armed with the necessary tools and expertise to drive meaningful change. Collaboration, innovation and advocacy will be paramount as we navigate the complexities of climate change. Together, let us rise to the challenge and seize the opportunity to create a healthier, more resilient planet for generations to come.
More information
FIG Working Week 2024 (19-23 May 2024), which will include several sessions with a climate agenda: www.fig.net/fig2024
FIG Climate Compass Task Force: https://www. fig.net/organisation/tf/climate_compass/
48 Issue 2 2024

A new year full of opportunities for cartography
The year 2024 is full of opportunities for cartography and the International Cartographic Association (ICA). With the advent of artificial intelligence and more and more digitalization in all parts of our lives and societies, the function of maps as instruments that bring some kind of order to complex phenomena, help us gain spatial awareness and provide illustrative and trustworthy information intuitively is potentially more important than ever.
The digital information era is fundamentally changing science and society. Maps and other cartographic tools, which communicate information tailored to human users through various media, play a key role in this. Also, more spatial data than ever is being produced, as numerous sensors of all kinds measure values and store them in databases that are linked to other databases embedded in spatial data infrastructures, following standards and accepted rules. We are not short of ever more modern technologies for all steps of the spatial data handling process, including data acquisition (e.g. UAVs), data modelling (e.g. service-oriented architectures, AI) and data visualization and dissemination (e.g. augmented reality), which allow us to acquire, store, link and process more and more data.
The problem is often not that we do not have enough data, but rather too much. We need to make more and more of an effort to deal with all this data efficiently, to mine the relevant information and to link and select the appropriate information for a particular scenario. Ultimately, this should allow the safe, effective and efficient use of data.

Maps and cartography will play a key role in this, as cartography works with abstraction, narrations and holistic views to allow for efficient and effective interfaces between data and humans.
The ICA seeks to pro-actively foster research, education and exchange in the domain of cartography and GIScience through all its channels, such as the commissions, publication instruments and conferences, in order to contribute to and steer research in the related areas.
Regarding the latter, 2024 brings a number of excellent opportunities to meet, exchange ideas, present new insights and learn from scholars as ICA has taken patronage or expressed endorsement for the following events:
3–6 Jun 2024, Columbus (USA) CAGIS + UCGIS Symposium 2024 (https://cartogis. org/conferences/ cagis2024/)

16–21 Jun 2024, Nessebar (Bulgaria) 9th International Conference on Cartography and GIS (https://iccgis2024.cartography-gis. com/)

9–11 Sep 2024, Vienna (Austria) EuroCarto 2024 (https://eurocarto2024.org/)

8–10 Dec 2024, Hong Kong (China) AsiaCarto 2024 (https://asiacarto.org/2024/)

The call for submissions is open for all conferences, which allow excellent opportunities to network, learn, exchange and simply advance our discipline further. I look forward to meeting you there!
Prof. Georg Gartner georg.gartner@tuwien.ac.at
More information
Research Group Cartography
Department of Geodesy and Geoinformation Vienna University of Technology A-1040 Vienna, Austria
49 Issue 2 2024


An overview of the ISPRS Technical Commissions’ Mid-term Symposia
One of the paths for ISPRS to achieve its missions is to convene international congresses, symposia and other meetings with lectures, communications, discussions and, as appropriate, tutorials, exhibitions, technical visits and social events. Another is to ensure wide international circulation of the results of research through the publication of The International Archives and ISPRS Annals of the Photogrammetry, Remote Sensing and Spatial Information Sciences, which also serve as a record of the results of congresses and symposia, and other scientific meetings of the society.
The symposium (also called the ‘Mid-term Symposium’) is the most important event organized by each ISPRS technical commission in the even-numbered years between two congresses. The diverse cutting-edge topics are related to the field of each commission. The symposium provides a unique opportunity for the participants to meet highly distinguished scientists, practitioners, engineers, pioneers and leaders in the field to discuss recent research breakthroughs, technical advances, existing opportunities and emerging technologies.
For the term 2022-2026, the Mid-term Symposia will take place this year. All five technical commissions have preparations running in full swing for their symposium, and will provide everyone with a wonderful academic feast. Together with the commission presidents and the organizers, ISPRS Council hopes to meet you at one of these coming events.
Overview of the Mid-term Symposia in 2024
ISPRS TC I (Sensor Systems)
Title: Intelligent Sensing and Remote Sensing Application
Date: 13-17 May 2024
Place: Changsha, China
Website: http://www.isprs2024tc1.net/
ISPRS TC II (Photogrammetry)
Title: The Role of Photogrammetry for a Sustainable World
Date: 11-14 June 2024
Place: Las Vegas, USA
Website: https://www.isprs.org/tc2-symposium2024/index.html
ISPRS TC V (Education and Outreach)
Title: Insight to Foresight via Geospatial Technologies
Date: 6-8 August 2024
Place: Manila, Philippines
Website: https://www.isprs.org/tc5-symposium2024/index.html
ISPRS TC IV (Spatial Information Science)
Title: Spatial Information to Empower the Metaverse
Date: 22-25 October 2024
Place: Perth, Australia
Website: https://www.isprs.org/tc4-symposium2024/index.html
ISPRS TC III (Remote Sensing)
Title: Beyond the Canopy: technologies and Applications of Remote Sensing
Date: 4-8 November 2024
Place: Belem, Brazil
Website: https://selperbrasil.org.br/events/belem-2024-tc3symposium/
By Jiang Jie, secretary-general, ISPRS
More information
https://www.isprs.org/calendar/default.aspx
50 Issue 2 2024

SMART SUBSEA SOLUTIONS
• Delivering data in most adverse conditions: underwater acoustic modems with advanced communication technology and networking
• Accurate USBL, LBL and hybrid positioning of underwater assets, navigation for divers
• Modem emulator and multiple cost-saving developer tools
• Sonobot 5 - the autonomous surface vehicle for bathymetry, monitoring, search & rescue, and AUV support
• Quadroin - the novel bionic AUV for surveys and monitoring


sales@evologics.com
sales-us@evologics.com EvoLogics.de
NEW DIVER NAVIGATION SYSTEM
AVAILABLE NOW
