

INTERNATIONAL THE GLOBAL MAGAZINE FOR GEOMATICS WWW.GIM-INTERNATIONAL.COM ISSUE 6 2022 • VOLUME 36 UAV PHOTOGRAMMETRY TO SUPPORT THE ENERGY TRANSITION INTERVIEW WITH DR NADINE ALAMEH, OPEN GEOSPATIAL CONSORTIUM VIDEO GAMES AS AN EMERGING APPLICATION FOR NAVIGATION DATA From Raw Data to End Product Modelling and Simulating Cities with Digital Twins
DIRECTOR STRATEGY & BUSINESS DEVELOPMENT
Durk Haarsma
FINANCIAL DIRECTOR Meine van der Bijl
TECHNICAL EDITOR Huibert-Jan Lekkerkerk
CONTRIBUTING EDITORS Dr Rohan Bennett, Frédérique Coumans
HEAD OF CONTENT Wim van Wegen
COPY-EDITOR Lynn Radford, Englishproof.nl
MARKETING ADVISOR Myrthe van der Schuit
BUSINESS DEVELOPMENT MANAGER Jurjen Visser
CIRCULATION MANAGER Adrian Holland
DESIGN ZeeDesign, Witmarsum, www.zeedesign.nl
GIM INTERNATIONAL
GIM International, one of the worldwide leading magazines in the geospatial industry, is published eight times per year by Geomares. The magazine and related website and newsletter provide topical overviews and reports on the latest news, trends and developments in geomatics all around the world.
GIM International is orientated towards a professional and managerial readership, those leading decision making, and has a worldwide circulation.
SUBSCRIPTIONS
GIM International is available eight times per year on a subscription basis. Geospatial professionals can subscribe at any time via https://www.gim-international.com/subscribe/print.
Subscriptions will be automatically renewed upon expiry, unless Geomares receives written notification of cancellation at least 60 days before expiry date.
ADVERTISEMENTS
Information about advertising and deadlines are available in the Media Planner. For more information please contact our marketing advisor: myrthe.van.der.schuit@geomares.nl.
EDITORIAL CONTRIBUTIONS
All material submitted to Geomares and relating to GIM International will be treated as unconditionally assigned for publication under copyright subject to the editor’s unrestricted right to edit and offer editorial comment. Geomares assumes no responsibility for unsolicited material or for the accuracy of information thus received. Geomares assumes, in addition, no obligation to return material if not explicitly requested.
Contributions must be sent for the attention of the head of content: wim.van.wegen@geomares.nl.
P. 10 Interview with Dr Nadine Alameh, Open Geospatial Consortium
In this interview, Dr Nadine Alameh, CEO of OGC, reflects on the progress that has been made over the past three decades, and what still needs to be done to make geospatial information truly ‘findable, accessible, interoperable and reusable (FAIR)’ for the good of society as a whole.

P. 14 Modelling and Simulating Cities with Digital Twins
The digital twin concept has virtually exploded in recent years, but within the built environment the traditional term has long been ‘3D city model’. However, the digital twin concept is increasingly gaining acceptance as a useful concept that extends beyond 3D city models for not only modelling but also simulating cities. So what are digital twins, how are they being used, and what challenges are involved?
P. 19 Digital Twin Supports Accurate Renovation Planning
In recent years, digital twins that are capable of depicting both the current status and future stages of a building have become a reliable source of information during the planning phase. This article outlines the challenging workflow of deriving an initial digital twin for a health clinic comprising approximately 100,000m² in support of subsequent constructional changes.
P. 22 How Drones and Photogrammetry Can Support the Energy Transition
The team at London-based architectural consultancy studio WDS-LAB have created a novel workflow using drone technology and photogrammetry to estimate the amount of solar energy that can be captured in urban environments. Improved understanding of the amount of solar energy that could be gathered directly from roofs can support the complex task of transitioning existing low-density residential areas to renewable energies.

P. 28 Soil Mapping with Drones
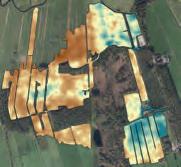
In the Earth sciences sector, sensors for measuring properties of the Earth are rapidly becoming adapted for drone use now that new developments in technology have led to an increase in the size and payload of UAVs. This article presents two studies that explore the opportunities for adding a gamma-ray spectrometer to a drone in order to map the texture or contamination of soil.
P. 41 How India Leverages Geospatial Technologies for Urban Management
Geomares
P.O. Box 112, 8530 AC Lemmer, The Netherlands
T: +31 (0) 514-56 18 54
F: +31 (0) 514-56 38 98
gim-international@geomares.nl www.gim-international.com
No material may be reproduced in whole or in part without written permission of Geomares.

Copyright © 2022, Geomares, The Netherlands
All rights reserved. ISSN 1566-9076
This article explores how some government initiatives in India are utilizing geospatial technologies for better outcomes. The rapid pace of urbanization in India has been an instrument of socioeconomic, political and cultural progress, but has also thrown in multiple challenges. Recognizing the need for efficient management of urban spaces, the government of India has responded with robust measures and programmes that leverage geospatial and other information technologies.

COVER STORY
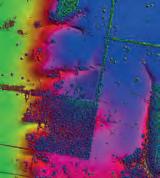
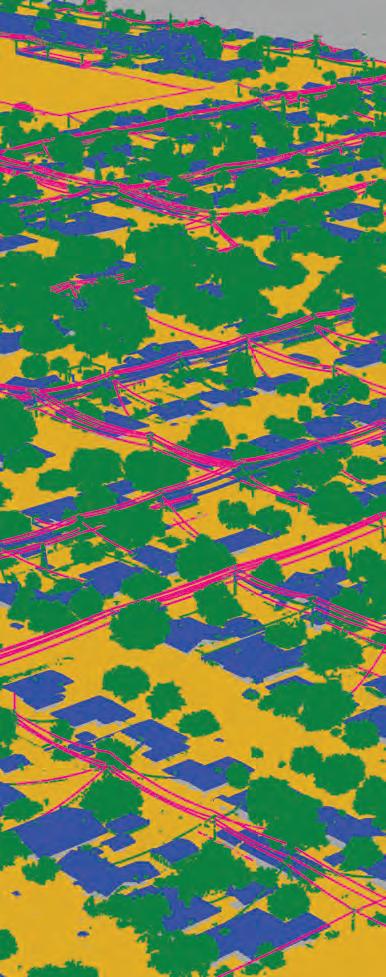
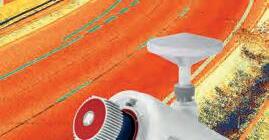
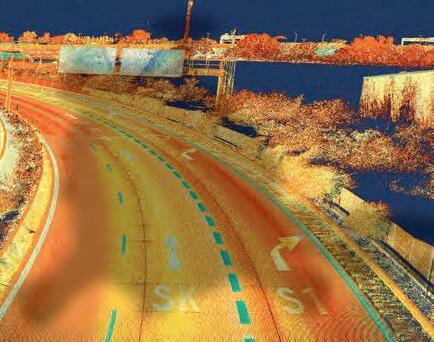
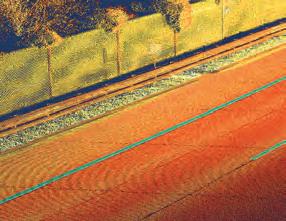
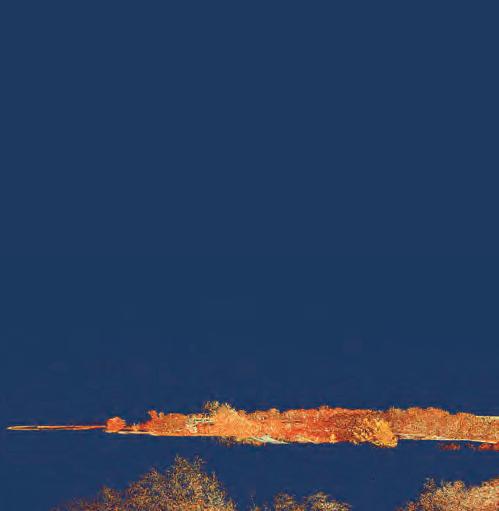
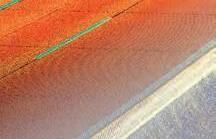
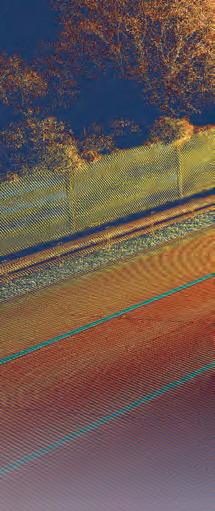
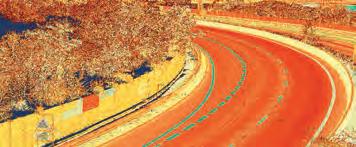
edition’s front cover shows colourful
full waveform analysis. This combination allows
ideally suited for the aerial survey of complex
CONTENTS 3ISSUE 6 2022 | INTERNATIONAL |
P. 5 Editorial P. 6 Headlines P. 27 Perspectives P. 33 Topographic Mapping for Snow Avalanche Hazard Modelling P. 37 Video Games as an Emerging Application for Navigation Data P. 46 Report on HxGN Live 2022 P. 52 Report on Twelfth UN-GGIM Session P. 56 Mapping Seagrass with Airborne Bathymetric Lidar P. 59 Lidar Data Reveals Hidden History of Hawaiian Islands P. 65 GIS Data is Indispensable for UN Migration Agency P. 73 Organizations To subscribe to GIM International go to www.gim-international.com/subscribe
This
Lidar imagery captured with advanced long-range airborne laser scanners which make use of a powerful laser source, multiple-time-around processing and digital
operation at varying flight altitudes and is therefore
terrain. (Image courtesy: Aerometrex) INTERNATIONAL ISSUE 2022 VOLUME 36 UAV PHOTOGRAMMETRY TO SUPPORT THE ENERGY TRANSITION INTERVIEW WITH DR NADINE ALAMEH, OPEN GEOSPATIAL CONSORTIUM VIDEO GAMES AS AN EMERGING APPLICATION FOR NAVIGATION DATA From Raw Data to End Product Modelling and Simulating Cities with Digital Twins
KNOWLEDGE IS POWER
See clearly and accurately where vegetation is encroaching.
MITIGATE RISK WITH OPTECH GALAXY
Galaxy lidar sensor captures all features within transmission and distribution wire zones, in a single pass, at high altitude and without compromise. Get the highest resolution on wires, poles, and encroaching trees. Ideal for inspections, vegetation management and as-built surveys.

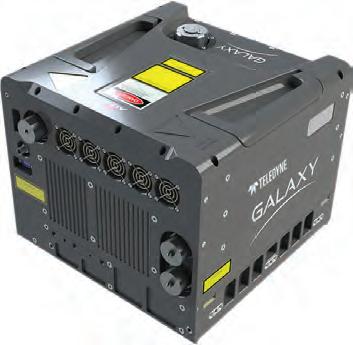
•Up to 2 million measurements per second
•High fidelity resolution of cross arms, insulators, transformers and all key small features
• Exceptional vegetation penetration
•Complete detection of dark wires, roofs and roads
FOR MORE INFORMATION:
www.teledyneoptech.com/galaxy
Teledyne Geospatial Imaging Solutions for Land and Water
© 2022 Teledyne Optech and Teledyne CARIS, are both companies of Teledyne Technologies Inc. All rights reserved. Specifications are subject to change.
Image courtesy of Merrick & Company and Aerial Surveys International
Where?
Geospatial is always about the ‘where’. The digital maps, databases and other end products produced by the professionals in our industry make the ‘where’ of almost everything in our lives visible on a daily basis. If we extend the concept of the ‘where’ to the geospatial industry right now, we can’t pinpoint the sector’s position with coordinates. However, we can evaluate the maturity of geospatial technology and the industry’s importance in policymaking. And based on those two factors, amongst others, I think we can safely say that the geospatial sector is in a good place.
Intergeo, the largest exhibition in our industry, is taking place this month. In Essen, visitors from numerous countries will be able to see that the technology is growing more mature every day and that the number of application areas for geospatial is growing too. I had the privilege to attend the 12th session of the UN-GGIM Committee of Experts Meeting at the United Nations headquarters in New York this summer, and I saw evidence that the frameworks that UN-GGIM has continuously worked on over the last decade are beginning to deliver. Best practices and use cases based on successful implementations in various Member States are convincing others to put the frameworks in place too, resulting in geospatial information becoming the centre point of policymaking in ever-more states. Also during UN-GGIM, it became clear that the Sustainable Development Goals are very important, and that geospatial information will play a key role in helping to achieve, monitor and assess those goals. For other key takeaways from the 12th session, see page 52.
So with mature technology and a place right at the heart of policymaking – supporting a set of goals that are crucial to the future of our planet – it is hard to deny that ‘geospatial’ is indeed well-positioned. But are we doing everything right? The answer to that question has to be ‘No’, of course, because there is always room for improvement. In an interview with our editor Lynn Radford, Dr Nadine Alameh, CEO of the Open Geospatial Consortium, concludes that data is still not being
used to the extent it could to improve people’s lives on this planet (see page 10). She points out that in the case of both the wildfires in California and also the flooding in Germany earlier this year, for example, homes and lives were destroyed because the right data was not readily available and accessible. She calls for more business leaders to adopt a mindset of working together. The friendly and collaborative atmosphere within UN-GGIM shows that we can achieve much more through cooperation and multilateralism than when we only act in our own best interests.
Here at GIM International, we have worked hard to produce the thickest issue of this year, bursting with feature articles, news and reports from all over the globe. Besides the interview with Dr Alameh and the report on UN-GGIM, just some of the other highlights include a review by our Head of Content Wim van Wegen of the HxGN Live gathering earlier this year, an article on drone-based soil mapping by Ronald Koomans, Han Limburg and Steven van der Veeke from Medusa Explorations, and a feature by Megha Datta and Sakshi Singh from the Association of Geospatial Industries on how India is leveraging geospatial data for urban management. Plus there’s much more for you to explore in this edition.
Personally, I am really looking forward to attending Intergeo and meeting customers, contacts and friends, exploring ideas and discussing how we can work together in the future. We will be out in force with our whole team and we’re keen to hear your stories, suggestions and feedback, or even just to have a friendly chat, so feel free to stop by our booth (G2.002). See you in Essen!


Durk Haarsma


EDITORIAL 5ISSUE 6 2022 | INTERNATIONAL |
durk.haarsma@geomares.nl eSurvey 2 Blue Marble 54 CHCNav 68 Comnav 75 Evologics 26 FOIF 58 Geo-matching 64 Gexcel 68 Gintec 72 Hypack 31 Kolida 67 NavVis 18 Phase One 48 Presagis 44, 69 RIEGL 8 SBG 45 Smart Geo Expo 71 SOUTH 40 Teledyne Geospatial 4, 62 TI Asahi 36 Trimble 76 Vexcel 13 YellowScan 32 Zoller+Fröhlich 39 Advertisers
Leica Geosystems Unveils New Leica DMC-4 Airborne Imaging Sensor
Leica Geosystems, part of Hexagon, has launched the Leica DMC-4, a highly efficient airborne imaging sensor providing unsurpassed image quality for various applications and complex mapping environments. With the new system, Leica Geosystems aims to continue its tradition of combining industryleading optics with precision mechanics to deliver the highest mapping performance. According to the geospatial solutions provider, the sensor provides superior image fidelity by leveraging the CMOS-based Leica MFC150 camera module with Leica Geosystems’ innovative mechanical forward motion compensation (FMC). The production-proven technology extensively used in Hexagon’s Content Program has already surveyed 1.2 million square kilometres and delivers crisp, full radiometry at faster aircraft speeds across various operating conditions. With over 31,500 pixels across swath, the DMC-4 maximizes acquisition efficiency and significantly improves performance to cover larger areas with fewer flight lines. Standard (S) and high (H) focal length configurations enable excellent airspace flexibility, providing a comprehensive solution for demanding applications and use cases. The DMC-4 was designed with application versatility in mind, supporting photogrammetry, remote sensing, terrain extraction and vector mapping.
UAV Surveys Help Port of Rotterdam to Expand

Van Oord is using Marlyn Cobalt survey drones to ensure design conformance and increase safety for those involved in a project at the Port of Rotterdam, the largest container port in Europe. The Dutch port is currently expanding its quays and retaining walls to increase its container transshipment capacity. Building a new harbour comes with many challenges. Container quay construction requires sustainable, smart choices, so that the impact on the environment and nature is limited as much as possible. A project of this size requires the use of heavy equipment and a large number of employees at the construction site. Sustainable construction and safety are central during the implementation of the entire project. Unmanned aerial vehicles (UAVs or ‘drones’) can largely increase the efficiency in such projects while at the same time improving safety for the people involved. To ensure design conformance while keeping track of all the site development, Van Oord is using Marlyn Cobalt survey drones designed by Atmos to take accurate weekly snapshots for detailed progress monitoring.
Diane Dumashie Elected as New President of FIG

Dr Diane Dumashie won the final vote at the FIG Congress 2022 in Warsaw and will serve as the next president of FIG for the next four years. She stated that she is looking forward to four years of fruitful collaboration ahead, with this year’s successful edition of the FIG Congress as an excellent starting point. In an interview with GIM International earlier this year, Dumashie shone her light on the future of the surveying profession, the role FIG should play within the geospatial community
and how the sector worldwide can be encouraged to become actively involved in solving the societal challenges with its knowledge and innovation.

Vodafone and Topcon to Develop Mass-market Precise Positioning System


Vodafone and Topcon Positioning Group have committed to the development of a new mass-market precise positioning system that will locate Internet of Things (IoT) devices, machinery and vehicles with a greater degree of accuracy than using only individual global navigation satellites systems (GNSS). Vehicles, scooters and even robot lawn mowers can be securely monitored in real time to within a few centimetres when connected to Vodafone’s global IoT network and using technology from Topcon which corrects inaccuracies from navigation satellite signals. Location accuracy is improved from a few metres to just centi metres using Topcon’s dense European network of thousands of GNSS reference stations, especially when vehicles and devices are fitted with suitable antennas and receiver equipment. Vodafone and Topcon have agreed to advance customer trials and Vodafone is now inviting select customers to join pilot activities in Germany, Spain and the UK. The companies aim to test the service, called Vodafone GNSS Corrections, using a wide variety of devices connected to Vodafone’s global IoT network –
 support safe vehicle-to-anything (V2X) applications.
Dr Diane Dumashie will be the FIG president for the next four years.
Frank Reynhout (Van Oord) with the Marlyn Cobalt.
| INTERNATIONAL | ISSUE 6 20226 HEADLINES Leica DMC-4 airborne imaging sensor.
support safe vehicle-to-anything (V2X) applications.
Dr Diane Dumashie will be the FIG president for the next four years.
Frank Reynhout (Van Oord) with the Marlyn Cobalt.
| INTERNATIONAL | ISSUE 6 20226 HEADLINES Leica DMC-4 airborne imaging sensor.
FARO Acquires Mobile Mapping Pioneer GeoSLAM
FARO has announced the acqui sition of one the world’s mobile scanning market leaders: GeoSLAM. With proprietary highproductivity simultaneous locali zation and mapping (SLAM) software to create 3D models for use in digital twin applications, the addition of GeoSLAM will put FARO in an excellent position to signifi cantly expand and accelerate market growth opportunity in the mobile scanning space. With the purchase of GeoSLAM, FARO now offers an impressively broad set of 4D data capture solutions, ranging from 360° camerabased images to mobile scanning and stationary high-accuracy laser scanning, allowing customers to balance the need for accuracy, speed and detail depending on the requirements for their applications and workflows. When combined with the recently announced FARO Sphere cloud-based collabo ration platform, these capture technologies provide the foundation for the 4D digital reality-based SaaS offering that will allow customers to access multiple 4D data sources for visualization and analysis through a single-user experience.


MariaDB Strengthens Geospatial Capabilities with Acquisition of CubeWerx
With powerful SLAM technology at its heart, the ZEB Discovery can be used in areas with poor GPS.
YellowScan and FIXAR Present Integrated Lidar and UAV Solution
In a new partnership with YellowScan, a leading designer of next-generation Lidar solutions, FIXAR has upgraded the FIXAR 007 with a YellowScan Lidar system. The FIXAR 007 is the company’s flagship model among its unmanned aerial vehicles (UAVs or ‘drones’). It is an autonomous vertical take-off and landing fixed-wing drone, dedicated to outdoor VLOS and BVLOS missions and customizable with diverse sensors to handle aerial photography, video monitoring, laser scanning, dispensing and more. The YellowScan Mapper+ is the next generation of integrated Lidar solutions that YellowScan offers. This particularly lightweight system with long-range capabilities, high-end point density, as well as advanced accuracy and precision, makes the UAV Lidar mapping tool very suitable for fixed-wing integrations – all in an OEM package. The agnostic design philosophy of all YellowScan solutions allows for easy integrations for OEM partners that want to combine their products with the benefits of Lidar technology.
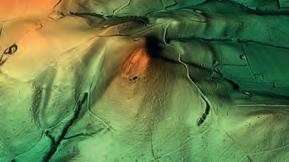
Geospatial data in the form of a digital terrain model (DTM) showing the Lipper Bergland, a range of hills in the German state of North Rhine-Westphalia. (Image courtesy: Rouven Meidlinger)
MariaDB has acquired CubeWerx, a leader in geospatial solutions, for an undisclosed amount. With this acquisition, MariaDB adds cloud-native, scalable geospatial capabilities that the company plans to offer through its fully managed cloud service MariaDB SkySQL. Applications that leverage geospatial data are truly transformative,
enabling businesses to offer new products or services that are highly engaging and tailored to end users. “We’re taking a unique, developercentric approach to delivering geospatial capabilities that no other database vendor has taken,” said Jags Ramnarayan, vice president and general manager for SkySQL at MariaDB. “While other databases such as PostgreSQL and Oracle have added geospatial capabilities directly into the database, we are taking a modern cloud-native approach of managing virtually infinite amounts of geospatial data on low-cost, durable cloud storage and providing OGC standardsbased REST APIs to access the data. We believe this approach will allow MariaDB to leapfrog the database world for geospatial application development.”
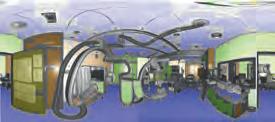
BMW Digitalizes Plants with NavVis Reality Capture Solutions

NavVis, a German provider of reality capture and digital factory solutions, is capturing BMW Group’s worldwide plants and making the photorealistic panoramic images, floor plans and point cloud data available to all the car manufacturer’s sites via its web-based platform, NavVis IVION Enterprise. The Munich-based mobile scanning specialist is supporting the BMW Group in the digitalization of its production network with its Digital Factory Solution. Since the project began in November 2020, NavVis has already scanned nearly four million square metres of BMW’s plants using the wearable mobile mapping system NavVis VLX and other drone scanning systems. This includes complete coverage of Plant Spartanburg, BMW Group’s plant in South Carolina, USA, with over one million square metres of indoor space and over 4.5 square kilometres of outdoor areas. Additionally, Plant Munich with 575,000 square metres and the production facilities at Plant Regensburg have already been successfully scanned.
NavVis is capturing BMW’s worldwide plants.
The FIXAR 007 fixed-wing UAV has been upgraded with a YellowScan Lidar system.
GIM-INTERNATIONAL.COM
7ISSUE 6 2022 | INTERNATIONAL |
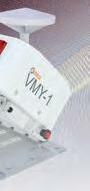
125 scan lines/sec 300 kHz eff. meas. rate


up to 4 cameras including spherical camera
typ. point density 550 points/m² on pavement surface @ 80 km/h
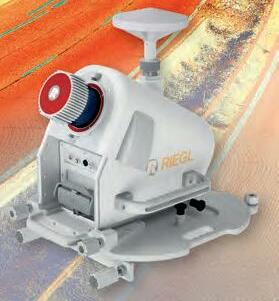
250 scan lines/sec 600 kHz eff. meas. rate


up to 4 cameras including spherical camera
typ. point density 1,100 points/m² on pavement surface @ 80 km/h
250 scan lines/sec 1.8 MHz eff. meas. rate up to 4 cameras including spherical camera


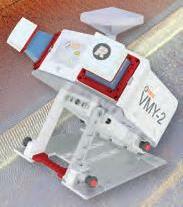


multiple swivel positions for improved scan pattern in multipass applications


typ. point density 3,200 points/m² on pavement surface @ 80 km/h


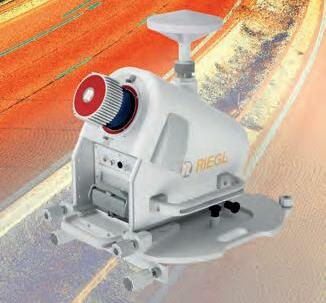
500 scan lines/sec 3.6 MHz eff. meas. rate
up to 9 cameras including spherical camera and up to 2 highspeed pavement cameras simultaneous capturing of spherical and directional imagery with a total resolution of up to 1370 MP/sec


typ. point density 6,400 points/m² on pavement surface @ 80 km/h


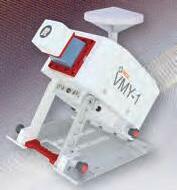
 VMY-1
VMQ-1HAVMY-2
A broad system portfolio serving all levels of applications: transportation infrastructure mapping, city modeling, GIS mapping & asset management, road surface management, open-pit mine surveying, rapid capture of construction sites and bulk material, HD mapping for autonomous vehicles
VMY-1
VMQ-1HAVMY-2
A broad system portfolio serving all levels of applications: transportation infrastructure mapping, city modeling, GIS mapping & asset management, road surface management, open-pit mine surveying, rapid capture of construction sites and bulk material, HD mapping for autonomous vehicles
VMX-2HA
CHOOSE THE SYSTEM THAT PERFECTLY MEETS YOUR REQUIREMENTS TO SATISFY YOUR CLIENTS’ TASKS! RIEGL MOBILE MAPPING SYSTEMS Visit us at ENHANCED PERFORMANCE ENHANCED PERFORMANCE Explore the full portfolio of proven RIEGL LiDAR Sensors and Systems at www.riegl.com Austria | USA | Japan | China | RIEGLWORLDWIDE | Australia|Canada | United Kingdom
OGC Joins New Metaverse Standards Forum as Founding Member

The Open Geospatial Consortium (OGC) has announced that it is a founding member of the newly launched Metaverse Standards Forum. This forum, hosted by Khronos Group, brings together leading standards organizations and companies for industry-wide cooperation on interoperability standards needed to build the open metaverse. The forum will explore where the lack of interoperability is holding back metaverse deployment and how the work of standards developing organizations (SDOs) to define and evolve the necessary standards may be coordinated and accelerated. Everything OGC does can be applied to the metaverse. The geospatial community can contribute expertise in 3D, modelling and simulation, artificial intelligence, streaming, augmented and virtual realities, routing, mapping and more – all at scale. As such, and in addition to OGC’s membership of the Metaverse Standards Forum, OGC is currently in the process of forming an OGC Metaverse Domain Working Group. This will have its inaugural meeting this October at the 124th OGC Member Meeting in Singapore, which is based around the theme of digital twins and the metaverse.


Phase One Addresses Key Aerial Mapping Challenges with New Solution
Professional aerial camera company Phase One has launched its P3 Smart Focus.
The new Smart Focus Features range addresses key challenges where contrastbased focus fails to deliver robust and consistent results.
The features are purpose-built for the inspection of complex high-volume industrial assets such as wind turbines or power towers. “With our new Smart Focus Features we are providing our customers with a unique capability that ensures that all the data is captured every time,” said Michael Messerschmidt, portfolio director drones/UAVs. “High data quality in complex operating environments is business critical for most of our customers who inspect remote or inaccessible assets where re-flying a mission is not always an option.” All features are based on the P3’s 100Mp medium-format sensor, highquality AF lens range and the integrated laser-based focusing system. The superior performance is delivered by increasing focusing robustness in low-contrast environments and increasing focusing consistency for complex assets with a small surface area.
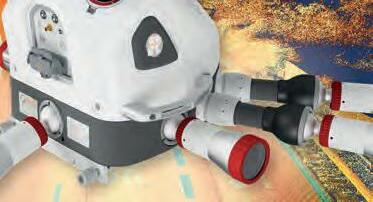
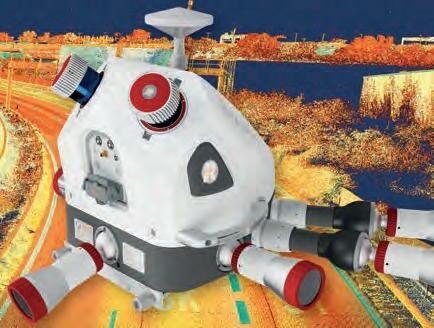
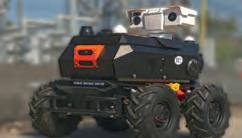
NV5 Introduces Multifunctional Rugged Robot
NV5 Geospatial has announced the debut of the ARIS II Rover, its upgraded robotic electric substation monitoring system. After five years of in-field implementation and testing, the rover meets the industry’s most exacting standards for ruggedness and reliability. NV5 Geospatial is one of North America’s most comprehensive geospatial science data firms. The remote-controlled wheeled rover has a modular design and is custom-fitted with advanced thermal sensors, imaging and audio/video technology. It allows utility companies to protect assets and limit liability while speeding up reaction times. “Geographic and personnel limitations, combined with aging infrastructure, present significant challenges for utility companies when it comes to maintaining their substations,” said Ian Birdie, vice president of innovation at NV5 Geospatial. “With our extensive experience in these substation environments, NV5 Geospatial has customized the ARIS II Rover for the unique needs of utilities. We built our next-generation robot on a rugged platform that can exist remotely and deliver the information and insights utilities need to maintain their networks proactively.”
NV5 Geospatial has customized the ARIS II Rover for the unique needs of utility companies.
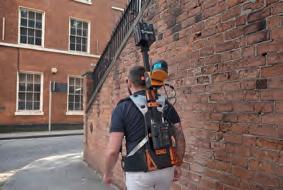
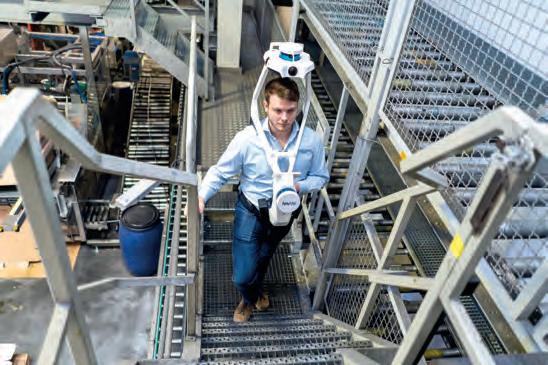
Exploring the State of Mobile Mapping
What is the current state of acceptance of mobile mapping, and what are its most common applications? A worldwide survey commissioned by NavVis, and supported by GIM International and other publications, was recently conducted to find out. Here, we highlight some of the key findings and share the reactions from a number of suppliers of mobile mapping products.
The NavVis VLX wearable mobile mapping system in action.
9ISSUE 6 2022 | INTERNATIONAL | GIM-INTERNATIONAL.COM
INTERVIEW WITH DR NADINE ALAMEH, CEO, OPEN GEOSPATIAL CONSORTIUM (OGC)

“Geospatial Data is Still Not Being Used Sufficiently to Improve People’s Lives”
By the mid-1990s, geographic information system (GIS) software was increasingly being used in the natural resources and defence domains. However, the high costs, inflexibility and inability to share geospatial data between systems were causing severe frustration, because users were forced to use inefficient, time-consuming and error-prone data transfer methods. This led to the foundation of the Open Geospatial Consortium (OGC) to develop international standards for interoperability. Today, the OGC community’s standards form the basis for building open interfaces and encodings into location-based products and services for use around the world. In this interview, Dr Nadine Alameh, CEO of OGC, reflects on the progress that has been made over the past three decades, and what still needs to be done to make geospatial information truly ‘findable, accessible, interoperable and reusable (FAIR)’ for the good of society as a whole.
The Open Geospatial Consortium was founded in the mid-1990s. How has the geospatial sector evolved since then?
To be honest, geospatial data has become so broadly used and is more cross-disciplinary than ever across so many industries, functions and domains that I’m not sure that there is such a thing as ‘the geospatial sector’ anymore. You can’t see it as a standalone
industry – geospatial is everywhere. But for geospatial data to be truly useful, it always has to be related to a specific problem in a specific domain, such as transportation, aviation, agriculture or others. Global society is facing some major challenges, many of which are related to climate change, and geospatial data can play an important part in helping to address many of these. But no one has all
the data, so we need to exchange it with each other. At the same time, BigTech companies now often have better data than governments. This is creating an interesting dynamic, forcing national mapping agencies to reinvent themselves and open themselves up to more collaboration as they realize that innovation has to come from public-private partnerships (PPPs). I think this makes it the best time to be in geospatial!
How is OGC keeping pace with this?
When we were founded 28 years ago, the aim was to create a neutral forum for government, academia and industry to collaborate on open standards for increased geospatial interoperability across all systems. The focus was mainly on the technical aspects of linking different systems in order to exchange data.
But if you don’t change, you fail, so OGC has kept changing over the years, although for a long time we were still mainly known for our standards. Since I came on board three years ago, we have made a deliberate effort to shift away from the ‘what’ and focus more on the ‘why’: helping our members to collectively solve problems using geospatial data based on standards and innovation. Taking their
| INTERNATIONAL | ISSUE 6 202210
BY LYNN RADFORD, GIM INTERNATIONAL

problems as the starting point, we then look at which standards we already have, and which we still need to develop – because everything is all so new that relevant standards sometimes don’t even exist yet. Beyond that, we fill interoperability gaps with best practices on how to use the standards, and compliance tests to ensure that products or solutions are indeed using the standards properly. We are also intensifying our commitment to lowering the barriers so that people can leverage geospatial data across all industries. For example, we’ve now become cloud native, in recognition of how ‘the cloud’ is triggering a fundamental shift in how geospatial data is stored, shared, accessed, integrated and analysed. Overall, we’re working to modernize the foundation of our standards to make them more developer-friendly – more mass-market –so that you can mix and match geospatial APIs with other data to support your decision-making without being a geospatial expert. We hope that computer scientists, software developers and many others who have so far known it as ‘location data’ rather than ‘geospatial data’ learn to see us as the leading community with the tools, knowledge and data that can make it easier for them to connect the dots.
How is all this altering your membership base?
Our membership base is not only growing –from 450 to 580 in the past year – but also diversifying. In the past, industry, governments and academia each used to account for a third of the total, but now 42% of our members come from industry, and a lot of them are startups. We need to be as inclusive as we can, because geospatial is no longer in a corner. And this mix of young, innovative businesses along with the bigger, more traditional companies and governments will ensure that we keep moving forwards.
How is OGC contributing to the use of geospatial data for the good of society?
Well, geospatial data is critical in so many aspects of society; think of predicting and responding to climate change and natural disasters, for marine spatial data infrastructures to protect our oceans, and of course we all saw its role in monitoring and managing disease-spread during the COVID-19 pandemic. Our worldwide cross-disciplinary forum connects people, communities and technologies to help them solve these global challenges and address everyday needs. And our mission of making
the building blocks – i.e. geospatial data –‘Findable, Accessible, Interoperable and Reusable (FAIR)’ using standards makes this concrete. Above all, because our standards are open to all other people and organizations besides just our members, OGC ends up accelerating the benefits for everyone. On average, 70% of the time in data-integration projects is spent on preparing the data, so by making it easier for organizations – and even non-geospatial experts – to access usable data to solve these problems, we’re saving them tons of money and tons of time. Besides that, I think it’s important to point out that having so much data also comes with a certain responsibility. We’re proud of being one of the first organizations to sign the Locus Charter, which promotes the responsible use of location data, and we regularly hold sessions to create awareness of the ethical use of data among our members and flag areas that could be abused.
But I guess your organization can’t do this alone?
That’s right! We’re the experts in geospatial, but we can’t be the experts in every domain. Take a smart city project, for example; it involves a wide range of aspects like sensors, weather, energy and moving features. Therefore, besides our members, we have around a hundred alliance partners: both at the technical level and domain experts. This way, we can involve the relevant specialist partners right from the start. Moreover, issues like climate change are not limited to the developed world, so we’re keen to help developing countries get up to speed too. This entails working at the highest level of government, such as with ISO, IHO, USGS, NASA, ESA and UN-GGIM. But while we’re active on a global level, the immediate problems are usually local. This is where our regional forums come in, supporting conversations and actions on things like the Green Deal and Horizon 2022
INTERVIEW 11ISSUE 6 2022 | INTERNATIONAL |
in Europe, the new Geospatial Data Act in the USA, the Arctic SDI in Canada, capacity building and the translation of documents in Latin America, and so on. Besides that, we host around 70 different working groups across multiple domains, from disasters and climate to digital twins. This approach enables our members to find others with similar issues and objectives, come together and dig deeper or share insights into specific use cases – whether in their domain or in their region. As part of our commitment to openness and knowledge sharing, any employee of any member organization – large or small – can use the portal to search for other members, attend the quarterly member meetings around the globe –which are great for networking in addition to the actual sessions, by the way – and join any of the working groups. I’ve noticed that startups particularly are benefiting from being part of this community in terms of gaining greater credibility and trust. Plus complying with recognized international standards makes it easier for potential customers to connect with them, both technically and non-technically.
How well is the geospatial industry currently helping to make data FAIR? And what more needs to be done?
Technology is continuing to advance rapidly and innovations are increasing – such as cloud computing, edge computing, 5G, IoT, artificial intelligence and space exploration –
the extent it could to improve people’s lives on this planet. ‘FAIR’ summarizes the reasons why: information is often still hard to find, hard to access, hard to integrate and it’s hard to repeat what has worked in the past. This was very evident during the recent flooding in Germany and wildfires in California; homes and lives were destroyed simply because the right information wasn’t available in time, or if it was, nobody knew what to do with it fast enough.
I think one of the reasons we’re not making enough progress is that many companies are still too opportunistic and led by the quest for a short-term return. We can achieve a lot more by working together, but still too few business managers think like this. So we need more leadership; it’s about taking a long-term view. This holds true for governments too, by the way, who are still the largest customers for geospatial projects. Ideally, they should be more assertive in encouraging the companies they fund – and especially the startups – to join organizations like OGC so that whatever they’re working on fits into the larger ecosystem before it all becomes a big mess. Because interoperability isn’t a short-term problem. Let’s be honest… it’s pretty easy to build something that will work as a standalone solution, but then we just end up with multiple data sources that don’t talk to one another. We’re seeing single-mission satellite projects, for example. But where’s the big-picture
make the data interoperable at some point, and it’s easier to do it now rather than in five years’ time when it will be more costly. That requires more commitment to collaboration upfront and more engagement so that the right kind of people can be involved in developing the standards from the start. Only then can we start harmonizing the silos and ensuring they can talk to one another. This will accelerate innovation and grow the pie for everybody.
What does the process for developing a new international standard entail?

Producing an OGC standard used to involve a very formal and pretty lengthy international consensus-based process of technical content-development followed by intense review and formal vote, managed by four committees. However, things are moving so fast in 2022 that no one can afford to waste any time nowadays, so we’ve flipped the process and made it a lot more agile. In our Innovation Program, a standard can be initiated by any group of members. They get together and work in a collaborative R&D process on real-world geospatial challenges in a series of sprints, on a series of testbeds or pilot projects. The documentation of their work becomes a developer-friendly standard, including code, examples and reusable snippets. The testbeds are for technical experimentation like API development, AI and machine learning, streaming of 3D data, coordinate reference systems for space, sensor integration and cloud-native experimentation – it’s some pretty futuristic stuff! This allows experts worldwide to accelerate innovation by testing their products and ideas in practice. And the ultimate aim is of course to develop a blueprint so that, in the case of a flood or other natural disaster, you can access decision-ready information under time pressure so that you don’t have to start from scratch each time. We currently have 30 different members who are working on developing such a blueprint for flooding, and there are plans to do the same thing for wildfires, droughts and pandemics.
What is OGC’s involvement in the Metaverse Standards Forum that was launched earlier this year?
The metaverse is perhaps the ultimate distributed digital twin of the world: not just simulating the real world in 3D, but actually replicating it in a fully immersive 4D environment that blurs the lines between real and synthetic. However, the metaverse is not a single thing but, like the internet, is
12
a collection of platforms and technologies. As such, to ensure everything interoperates to form a cohesive whole, open standards, knowledge and best practices will be absolutely fundamental to its success. However, being a novel technology, many of the standards that will be needed to solve problems in the metaverse don’t exist yet. That’s why we co-founded the Metaverse Standards Forum. Geospatial data will be essential in the metaverse: Earth observation data, 3D elevation data, transportation data, building information, tree counts, digital twins of the ocean, of urban areas and so on. And the OGC community can contribute expertise in 3D, modelling and simulation, AI, streaming, augmented and virtual realities, routing, mapping and more – all at scale. Therefore, we are starting a Geo for Metaverse working group to facilitate conversations with designers and developers in the metaverse community about the use of real-time geospatial data, including in gamification applications. From the wind blowing through the trees to the waves on the water, the effects can be based on real data rather than just a
replica… the possibilities are huge and very exciting.

What are your ambitions for the future?
I want OGC to be seen as the home for everything related to geospatial data – a place where you can connect with others, decide which tech to use, find new startups, help to shape government strategies and contribute to developing standards… where you’re an active part of a community. I would like to see our membership double or even triple – not just for the numbers, but because a wider membership base will support the much larger ecosystem. And ultimately, I would like OGC to be known for our impact rather than our standards. Whether in the context of the climate or pandemics, I want us to accelerate the world’s understanding and resilience by ensuring that geospatial data is FAIR so that the scientists can focus on what they do best. If we can succeed in creating a foundation for cloud-native geospatial standards together, imagine the radical simplification of the effort and cost needed to share and use geospatial information. Imagine the
explosion of innovation thanks to making the power of geospatial accessible to everyone. And imagine how capturing best practices for analysis-ready data and decision-ready information workflows in blueprints could improve avoidance and mitigation efforts to protect more people on our planet from future disasters!
ABOUT DR NADINE ALAMEH
Dr Nadine Alameh has been the CEO of the Open Geospatial Consortium (OGC) for the past three years.
She graduated from MIT with a PhD in Information Systems Engineering, and two master’s degrees in Civil Engineering and Urban Planning with a concentration in Geospatial Information Systems. She also holds a BSc in Computer Engineering from the American University of Beirut. Prior to OGC, Dr Alameh’s industry roles included chief architect for innovation at Northrop Grumman, CEO of an aviation data startup and senior advisor to NASA. She is a member of the US National Geospatial Advisory Committee (NGAC) and sits on the board of the UN Committee of Experts on Global Geospatial Information Management (UN-GGIM) Private Sector Network.
THE NEST
INTERVIEW 13ISSUE 6 2022 | INTERNATIONAL |
ABOUT TO LEAVE
October 2022
FROM RAW DATA TO END PRODUCT
Modelling and Simulating Cities with Digital Twins

The digital twin concept has virtually exploded in recent years, but within the built environment the traditional term has long been ‘3D city model’. However, the digital twin concept is increasingly gaining acceptance as a useful concept that extends beyond 3D city models for not only modelling but also simulating cities. So what are digital twins, how are they being used, and what challenges are involved?
The digital twin concept has virtually exploded in recent years, as evidenced by the exponentially growing number of scientific articles making use of the concept. The concept originates from the manufacturing industry where the use of CAD models enables the creation of exact digital replicas of components and products. The earliest use of the term dates to 2003 and is often credited to Grieves and Vickers, but earlier references
to the concept can be found; certainly, the understanding that mathematical and, more recently, digital models of physical systems are of enormous importance to both science and engineering dates back centuries.
DEFINING THE DIGITAL TWIN
What is then a digital twin? In both the scientific literature and, even more so, in commercial narratives, ‘digital twin’ is a quite
elastic concept used to label technologies or systems that may or may not live up to all the criteria of a digital twin. Does a digital twin need to include a 3D model? Does a digital twin need to include real-time sensor data? Does a digital twin need to include mathematical modelling and simulation?
It is instructive and interesting to look at some of the many definitions that have been proposed for the digital twin concept, since there seems to be some convergence towards a universally accepted definition. For example, most definitions now agree that a digital twin is a model of a physical system that mirrors the physical system in real time and enables analysis and prediction of the physical system. The digital twin can thus be used to both analyse the physical system (‘what is’) and to predict its future behaviour under given assumptions (‘what may be’).
This definition is partly overlapping with that of Rasheed et al. (2020): “A digital twin is defined as a virtual representation of a physical asset enabled through data and simulators for real-time prediction, optimization, monitoring, controlling and improved decision-making.” A similar definition is used by IBM: “A digital twin is a virtual representation of an object or system that spans its lifecycle, is updated from real-time data, and uses simulation,
Figure 1: Detail of the boundary of a 3D tetrahedral volume mesh generated from cadastral and point cloud data.
| INTERNATIONAL | ISSUE 6 202214
machine learning and reasoning to help decision-making.” These latter two definitions emphasize two technologies that may be used to enable the predictive function of the digital twin: simulation and machine learning.
A definition often seen in earlier literature on digital twins is that by Glaessgen and Stargel (2012): “A digital twin is an integrated multiphysics, multiscale, probabilistic simulation of an as-built [...] system that uses the best available physical models, sensor updates, [...], to mirror the life of its corresponding [physical] twin.” A somewhat simpler definition is given on Wikipedia: “A digital twin is a virtual representation that serves as the real-time digital counterpart of a physical object or process.”
In the domain of digital cities, Stoter et al. (2021) emphasize the use of 3D city models as an essential part of a digital twin: “[A digital twin] should be based on 3D city models, containing objects with geometric and semantic information; it should contain real-time sensor data; and it should integrate

a variety of analyses and simulations to be able to make the best design, planning and intervention decisions.” This definition is a reminder of the long tradition within the built environment of creating 3D models of cities and buildings, which may be enriched with semantic data and used as a basis for analysis, including, e.g., daylight and energy analysis, as well as simulation of things like traffic, wind comfort or air quality. Within the built environment, the traditional term is ‘3D city model’, and it is only very recently that the digital twin concept has started to gain acceptance as a useful concept and something that extends beyond 3D city models.
RAW DATA
The starting point for the creation of a digital twin of a city is access to raw data. This data may be created from aerial scans in the form of point clouds. The point clouds are then processed to create 2D or 3D city models. Access to data varies between countries and may not always be open or freely available. In Sweden, Lantmäteriet,


the Swedish mapping, cadastral and land registration authority, provides (for a fee) a range of datasets including both point clouds and 2D maps for the whole of Sweden. Meanwhile, more detailed and higher-quality datasets, including 3D models, are owned by the local municipalities. In the Netherlands, the situation is different. The 3D Baseregister Addresses and Buildings (BAG) provides free and open access to 3D models for all ten million buildings in the country. Moreover, the dataset is regularly and automatically rebuilt to provide an up-to-date 3D model of the entire country.
DATA MODELS
To build a digital twin of some complexity and use, it is essential to consider which data model is used to define the digital twin. Note that this is different from the mathematical model(s) used for simulation and prediction. The choice of data model dictates which data may be represented, and which use cases that may be supported by the digital twin. The data model is the implementation of a certain ontology, defined either explicitly or implicitly by the implementation. The ontology defines how the data of the digital twin may be described and understood, in terms of classes, attributes and relations. Several data models and corresponding exchange formats have been proposed for city modelling. One of the most prominent is CityGML, which is a standard of the Open Geospatial Consortium (OGC). The related CityJSON format (also an OGC standard) is a simplified and much more programmer-friendly encoding of the CityGML model.
Common to many data models for city modelling is the concept of level of detail (LOD). This concept enables the data model to store different representations of the city with varying levels of detail (geometric resolution) for
Figure 2: Preliminary results from the simulation of urban wind comfort by the DTCC (rendered in Unreal Engine).
Figure 3: Visualization of a digital twin of the campus of Chalmers University of Technology in Gothenburg (rendered in Unreal Engine).
Figure 4: Visualization of a road network as part of a digital twin of an area in central Gothenburg (rendered in Unreal Engine).
FEATURE 15ISSUE 6 2022 | INTERNATIONAL |
BY ANDERS LOGG AND VASILIS NASERENTIN, SWEDEN
different purposes. The coexistence of several levels of detail in a digital twin emphasizes that the digital twin is indeed a model of the physical system it mirrors, and that the digital representation as well as its accuracy are dictated by both the use cases the digital twin is designed for, the quality of data and the available computational resources.
DATA GENERATION
Different use cases of a digital twin will often require very different data representations. For the modelling of a city, the understanding of what constitutes a high-quality 3D model may differ widely if one were to ask an architect or a computational scientist. For the architect, a high-quality 3D model may mean a detailed set of surface meshes describing the topography of the city and the geometry of its buildings. The surface meshes may be both non-conforming and non-matching since the meshes will mostly be used for visualization and simple calculations like daylight analysis. For a computational scientist, on the other hand, a high-quality 3D model may mean a low-resolution, boundary-fitted and conforming volume mesh that may be used to run things like computational flow dynamics (CFD) simulations.
The team at the Digital Twin Cities Centre (DTCC) in Sweden is currently developing an open-source platform for representation and generation of high-quality data models for digital twins of cities. One of the key steps is the high-performance generation of high-quality surface meshes and tetrahedral
volume meshes from cadastral and point cloud data (Figure 1). This allows for simple and efficient generation of 3D models for any part of Sweden (or any other part of the world that has compatible data). The mesh generation is currently limited to LOD1 models, meaning that the buildings are represented as polygonal prisms (flat rooftops). However, work is underway to extend the mesh generation to LOD2 models, including non-flat rooftop shapes based on segmentation of rooftops from orthophotos using machine learning techniques.
MODELLING AND SIMULATION
With computational meshes readily available for any city, it is natural to consider the use of physics-based modelling and simulation to enable advanced analysis and prediction. Examples of physical phenomena that may be of relevance in the study of cities include urban wind comfort (wind conditions at street level), air quality, noise, and electromagnetic fields (for network coverage analysis).
One example of such a simulation currently being investigated at the DTCC is the simulation of urban wind comfort. The simulation uses an immersed boundary method for the Reynolds Averaged Navier-Stokes (RANS) equations using IPS IBOFlow. The current focus is on verification and validation of the simulation results for a selection of benchmark cases of city wind simulation that have previously been studied in wind tunnels. Some preliminary results are shown in Figure 2. Other examples of physics-based modelling and simulation
currently being investigated at the DTCC include simulation of air quality, street noise, crowd movement, and geotechnical simulation based on elastoplastic models of the soft clay that constitutes much of the underground of Gothenburg.

VISUALIZATION
Data visualization on the urban scale is itself a field of ongoing research. Physical information, such as wind flow and air quality (i.e., concentration of pollutants), needs to be represented in a way that is understandable to the end-user, but without overly simplifying scientific results. Effective communication of results requires several design iterations where both researchers, developers and end-users/stakeholders are involved. The DTCC actively collaborates with major stakeholders such as the Swedish Transport Agency in research projects that explore how to best communicate simulation results to different user groups. The ongoing research projects within the visualization domain focus on different solutions for data derivation, preparation, bundling, homogenization and propagation. Different graphical engines are tested and employed, e.g., Unreal Engine and OpenGL, as well as various web application implementations based on Mapbox, CesiumJS and Babylon.js.
TECHNICAL CHALLENGES
There are many challenges involved in crea ting a digital twin of something so complex as a city. Since the city itself is a complex system involving not only the streets and buildings
Figure 5: Visualization of volumetric data as part of a digital twin of an area in central Gothenburg (rendered in Unreal Engine).
| INTERNATIONAL | ISSUE 6 202216
of the city, but also its inhabitants, the cars driving on the streets, the interaction with the surrounding environment (wind and water), as well as the infrastructure below ground –which is sometimes overlooked yet very substantial – it is only natural that the creation of a digital twin of the city is equally complex. The task of building the digital twin is therefore by necessity a project that must involve experts from many different disciplines. The technical challenges involved in building the digital twin will the involve both interdisciplinary challenges in the collaboration between team members from vastly different disciplines, as well as already established intradisciplinary or domain-specific technical challenges such as how to implement a finite element solver most efficiently for one of the many mathematical models that together constitute the multiphysics model that is the digital twin.
NON-TECHNICAL CHALLENGES
Setting the technical challenges aside, the main challenges experienced so far at the DTCC are all related to data:
1) Data ownership across organizations: Data is often neither free nor open. Organizations, even municipalities, are reluctant to share their data freely since they at some point made a substantial investment in collecting and curating it. This differs in different parts of the world; in some cases (like in the Netherlands), the data is indeed free and open.
2) Data quality across disciplines: As in the abovementioned example of a mesh for use by an architect versus a computational scientist, a certain dataset may be regarded as being of high quality for a particular use case but may be of very low quality for another use case.

3) Data sustainability across time: The creation of a digital twin must be understood as a process rather than as a project. There are many examples of cities, municipalities and other organizations that invest in projects for the creation of a 3D model or even a digital twin, only to realize a few years (or even just months) later that the digital twin no longer mirrors the physical twin since reality is constantly changing. The only way to reconnect the digital twin with the physical twin is then to invest in a new and costly project. Therefore, the process of creating the digital twin must instead be automated so that it can be continuously rebuilt and regenerated.
ACKNOWLEDGEMENTS
This work is part of the Digital Twin Cities Centre supported by Sweden’s Innovation Agency Vinnova under Grant No. 2019-00041. The authors would like to thank Epic Games for co-funding parts of this work with an Epic MegaGrant. Moreover, they gratefully acknowledge Sanjay Somanath, Daniel Sjölie, Andreas Rudenå and Orfeas Eleftheriou for providing the images included here. This article is based on ‘Digital Twin Cities: Multi-Disciplinary Modelling and High-Performance Simulation of Cities’, first published in the June 2022 edition of the ECCOMAS newsletter.
FURTHER READING
B. Ketzler, V. Naserentin, F. Latino, C. Zangelidis, L. Thuvander, and A. Logg. Digital Twins for Cities: A State of the Art Review. Built Environment, 46(4):547–573, December 2020.

DOI: 10.2148/benv.46.4.547.
A. Rasheed, O. San, and T. Kvamsdal. Digital Twin: Values, Challenges and Enablers From a Modeling Perspective. IEEE Access, 8:21980–22012, 2020. ISSN 2169-3536.
DOI: 10.1109/ACCESS.2020.2970143. Conference Name: IEEE Access.
J. Stoter, K. A. Ohori, and F. Noardo. Digital Twins: A Comprehensive Solution or Hopeful Vision? GIM International, October 2021.
ABOUT THE AUTHORS
Anders Logg is a professor of computational mathematics at Chalmers University of Technology in Gothenburg, Sweden, and director of its Digital Twin Cities Centre, a Vinnova Competence Centre devoted to the study and development of the digital twin concept for city modelling and simulation. His research interests are adaptive finite element methods, high-level automating software systems for solution of PDE, domain-specific languages and compilers in scientific computing, augmented and virtual reality, and applications in biomedicine, general relativity, architecture and geoinformation – in particular the combination of modelling, simulation and visualization to create digital twins of physical systems.
Vasilis Naserentin is the lead developer at the Digital Twin Cities Centre hosted by Chalmers University of Technology in Sweden. His research is focused on digital twins of the urban scale with the use of high-performance computing, and he is keen on employing state-of-the-art software and computer engineering technologies (including general-purpose computing on graphic cards, mixed reality, cloud integration) into different aspects of scientific research. Lately his focus is on combining multi-physics modelling and simulation with sensor data integration to create digital twins of the built environment.
 Figure 6: Visualization of a digital twin of a Gothenburg suburb (rendered using WebGL).
FEATURE 17ISSUE 6 2022 | INTERNATIONAL |
 BY DANIEL WUJANZ
MAPPING AN OPERATIONAL MEDICAL CLINIC IN 3D
BY DANIEL WUJANZ
MAPPING AN OPERATIONAL MEDICAL CLINIC IN 3D
Digital Twin Supports Accurate Renovation Planning
Renovating existing buildings remains a challenging task for the construction industry since the work of planners is often hampered by missing, incomplete or out-of-date construction plans. In recent years, digital twins that are capable of depicting both the current status and future stages of a building have become a reliable source of information during the planning phase. This article outlines the challenging workflow of deriving an initial digital twin for a health clinic comprising approximately 100,000m² in support of subsequent constructional changes.
This digital twin project was conducted at a clinic on a medical university campus in Germany. The clinic, which has been in operation since 1987, is now due to undergo substantial core refurbishment of the eightstorey building. The renovation project is expected to take at least 17 years, including the planning stage, and the budget is a total of

€ 590 million. In order to avoid cost overruns, and to stick to the building schedule as well as to maintain quality assurance, building information modelling (BIM) was chosen as one of the planning strategies.
The challenges of this project are manifold, ranging from the sheer size of the building to the
high demands for accuracy due to the complex nature of the technical equipment inside the building – particularly in the 17 operating theatres. The scope of this project is to provide data for use in the planning stage within the realm of BIM over the course of the complete renovation process. In terms of geometric quality and level of accuracy, the client requires
Figure 1: Detected planes within a single scan that were used for registration. The colours indicate the orientation of planes within a scan’s local coordinate system.
FEATURE 19ISSUE 6 2022 | INTERNATIONAL |
AND BENJAMIN SATTES, GERMANY
LOA30, meaning an accuracy of 5mm at close range and 15mm over the entire building.
DATA ACQUISITION
The foundation of this project was established by a tacheometric network consisting of 103 well-distributed ground control points that were determined within a superior coordinate system. Data was recorded using a GeoMax Zoom90 total station with an angular accuracy of one second, while the observations were optimized in a geodetic network adjustment. Apart from determining point coordinates, individual point accuracies were computed based on error propagation that serve as weights in the following processing stages. The network coordinates featured a global accuracy of better than 3mm.
Due to the high accuracy demands, static laser scanning was chosen for 3D data acquisition instead of kinematic laser scanning systems. In order to ensure rapid data acquisition, four identical static laser scanners were used, namely the Zoller + Fröhlich IMAGER 5010 X series. Deviations of individual calibrations are a critical issue when using several systems in one project. Hence, all systems were regularly checked using a plane-based calibration routine (Rietdorf et al. 2004) that assesses the quality of the configuration of the scanner’s axes.
The initial status of the building was captured before any renovation measures were undertaken. This involved six weeks of scanning and establishing the tacheometric network. In close coordination with the clinic management, scans were captured primarily during the day by four survey crews in parallel. A total of 12,932 laser scans were captured, comprising a raw data volume of 540GB (*.zfs format). A key challenge in projects of this size is how to organize all the scans. In this case, a naming convention was applied based on the 14 architectonical entities of the building.

DATA SECURITY
According to the law in Germany, just as in many other countries, healthcare institutions fall under the category of critical infrastructure. Hence, to avoid the risk of prosecution, data security was a key factor in this project; cloud-based or external dataprocessing and data-storage solutions were strictly forbidden. Instead, all computations had to be performed on local computers, and the data was stored on a protected in-house server.
POINT CLOUD REGISTRATION

The vendor-neutral software Scantra 3.0 was used to register the approximately 13,000 scans. Since Zoller + Fröhlich grants third-party developers direct access to its
proprietary file format *.zfs, there was no need to convert the original scans prior to processing. This saved considerable time and disk space. The chosen software follows a sequential data substitution process that supports projects of this size (Wujanz et al. 2018). In general, the following procedure was deployed:
1. Data import of static laser scans including inclinometer readings and ground control points
2. Detection of planes and local targets
3. Pairwise registration between scan pairs and point matching
4. Network adjustment/quality assurance
5. Export of the registered point clouds
In this project, pairwise registrations were computed based on identical planes between scan pairs. Figure 1 illustrates detected planes within a single scan that substitute the original point cloud and hence drastically reduces the memory requirement. Apart from plane parameters, every plane receives covariances that serve as weights during pairwise registration.
NETWORK OPTIMIZATION
In practice, a common method is to break up a project into individual clusters that are linked together by ground control points. A notable disadvantage of this ‘Frankensteinian’ course
 Figure 2: Bird’s-eye view of the network graph, with circles representing single scans and arrows representing pairwise registrations.
| INTERNATIONAL | ISSUE 6 202220
of action is that transition areas are inevitable between individual groups. In order to avoid this, all scans were optimized in one common adjustment. Key in this enormously ambitious task was the aforementioned data substitution strategy.
The data volume of the entire project was narrowed down from 540GB of raw data volume to 4.6GB of geometric information and 10.4GB of visual information in the form of images for every scan. Only geometric information is required for the block adjustment, which minimizes discrepancies between pairwise registrations, inclinometer readings and ground control points.


Optimizing the final network with 24,706 pairwise registrations and 408 point identities to ground control points required just over three minutes on an ordinary Dell laptop with 64GB RAM and 2.3GHz with eight processors. A maximum of 1.4GB RAM had to be provided by the computer. Figure 2 illustrates a bird’s-eye view of the network graph.
QUALITY ASSURANCE & DELIVERABLES
A typical measure to verify the quality of a network in the 3D mapping community is to provide residuals (or statistics thereof) to ground control points. Since these measures can be easily manipulated in one’s favour (Wujanz 2022), individual geodetic quality measures were provided for every single scan based on error propagation. These metrics are also referred to as ‘stationing error’ and quantify how much a single scan is statistically ‘shaking’ with respect to ground control points. Note that these measures
vary considerably depending on the given survey configuration. Figure 3 illustrates such variations in a complex exterior part of the project that consists of 338 scans. It can clearly be seen that the vast majority of stations are positioned in the range of 2.5 to 4.9mm (1σ), yet this notably drops off in some parts. This can be explained by the façade, which mostly features glass elements and which was heavily vegetated in some parts with very limited views for tacheometry.
The identification of errors is a timeconsuming process in laser scanning. Hence, a procedure was applied that identified outliers based on the outcome of network adjustments. This produced a shortlist of statistically suspicious observations. As a result, only a few observations needed to be inspected rather than all of them, which saved a substantial amount of time. Registration of this huge dataset required three weeks in total. After the final quality assurance was completed, the registered scans were voxelized and filtered by range in order to minimize the data volume for the client.
The resulting *.E57 files occupied 2.3TB of memory. Besides the point cloud itself, the client also received a network overview which helps to identify scans that are required in the planning process.
CONCLUSION

This article outlines a 3D mapping project of a large-area clinic that was captured by static laser scanning. The resulting digital twin will serve as a basis for BIM-based planning during the 17-year renovation period and had to satisfy LOA30. Challenges during
this project included the size and complex architecture of the building, which resulted in a large static laser scanning network. As a consequence, a huge dataset consisting of nearly 13,000 scans had to be processed by means of plane-based registration and a network adjustment. After registration, the project point cloud was exported and submitted to the client in form of *.E57 files.
FURTHER READING
Rietdorf, A., Gielsdorf, F., & Gruendig, L. (2004). A concept for the calibration of terrestrial laser scanners. In Proceedings of INGEO 2004 and FIG Regional Central and Eastern European Conference of Engineering Surveying. Bratislava, Slovakia (Vol. 11, p.13).
Wujanz, D., Schaller, S., Gielsdorf, F., & Gründig, L. (2018). Plane-based registration of several thousand laser scans on standard hardware. International Archives of the Photogrammetry, Remote Sensing & Spatial Information Sciences, 42(2).
Wujanz, D. (2022). Taming errors... pt. 10: What residuals to geodetic control points ARE NOT telling you…. https://www.linkedin.com/pulse/taming-errorspt-10-what-residuals-geodetic-control-points-wujanz/ (Accessed: 05.09.2022)

ABOUT THE AUTHORS
Daniel Wujanz entered the world of geodesy as a surveying technician in 2002. After that he studied geoinformatics and surveying at Mainz University of Applied Sciences, Germany, where he was introduced to laser scanning in 2004. His first appointment after graduation in 2008 took him to Australia where he continued working with laser scanners in the realm of deformation measurement, registration and quality assurance. In 2018 he joined technet GmbH, the company behind Scantra. In parallel with that, he teaches laser scanning at Würzburg University of Applied Sciences in Germany.
Figure 3: Variation of individual stationing errors in an outdoor part of the project. Triangles denote ground control points, while arrows represent pairwise registrations between scans and circles individual scans. The colour filling of circles highlights their individual stationing error.
Benjamin Sattes started his geodetic path in 2001 as a surveying technician. He then pursued this direction by studying surveying at HFT Karlsruhe, Germany. Right after graduating in 2009, he founded 3D WELT Vermessung GmbH and was appointed as its CEO. Apart from his duties within the company, he has been an external lecturer at HFT Stuttgart in Germany since 2016, and is also the chairman of the professional board of surveyors in his home state.

FEATURE 21ISSUE 6 2022 | INTERNATIONAL |
CALCULATING ACCESS TO SOLAR ENERGY IN LOW-DENSITY RESIDENTIAL AREAS
How Drones and Photogrammetry Can Support the Energy Transition
The team at London-based architectural consultancy studio WDS-LAB have created a novel workflow using drone technology and photogrammetry to estimate the amount of solar energy that can be captured in urban environments. Improved understanding of the amount of solar energy that could be gathered directly from roofs can support the complex task of transitioning existing low-density residential areas to renewable energies.
To fulfil the Paris Agreement, keep global warming below 1.5°C and achieve ‘net zero’ in 2050, CO2 emissions in residential areas must be reduced by at least 78% over the following decade. In 2020, according to the Sub National Electricity and Gas Consumption Statistics Report provided by the Department of Business Energy and Industrial Strategy, the mean annual domestic
electricity consumption in Great Britain was 3,750kWh, while the median domestic electricity consumption was 2,900kWh (Figure 2). However, according to the British Climate Change Committee, around 29 million UK homes have outdated construction systems and are responsible for wasting vast amounts of energy on heating and/or cooling throughout the year. Solar energy can play a

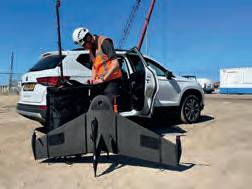
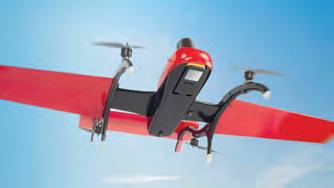
Figure 1: A DJI Mavic Enterprise Advanced drone with dual lens and DJI Air 2S were used for the project.
 Figure 2: Distribution of domestic electricity consumption in Great Britain (courtesy of the Department of Business Energy and Industrial Strategy).
| INTERNATIONAL | ISSUE 6 202222
BY CARLOS BAUSÁ MARTÍNEZ, WDS-LAB, UNITED KINGDOM
crucial role when retrofitting those homes to help them achieve a considerable percentage of their energy requirement from renewables directly on site.
The team at WDS-LAB conducted a study to estimate the amount of solar energy that can be captured in urban environments. The team relied on unmanned aerial vehicle (UAV or ‘drone’) imagery for this study because it is an affordable solution. Moreover, it enables 3D photogrammetry models with higher resolution and accuracy than satellite imagery does. 3D mesh model accuracy was an important factor in this project in order to construct an accurate model of the residential buildings and obtain the right inclination of the roofs in order to calculate how much solar energy would reach them. This was done using the appropriate geometry classification method. Once the solar photovoltaic panel specifications are known, it is possible to accurately forecast the amount of electricity generated by a solar panel array per month. This information is potentially interesting for local councils and other government authorities as well as homeowners. The initial test studies were carried out over neighbourhoods in London, but in theory this survey technique can be applied anywhere in the world.

3D PHOTOGRAMMETRY MODEL
The methodology developed by WDS-LAB to quantify the energy reaching the roofs considers the amount of area that could be suitable for fitting commercial rectangular photovoltaic (PV) panel arrays. For the purpose of producing the photogrammetry model, a commercial DJI Enterprise Advanced drone was used equipped with a dual lens: one lens for the thermal spectrum and one for the visible light spectrum (which was able to obtain 48MP images). The procedure to capture images for the photogrammetry model relied on creating a preprogrammed drone mapping flight mission so that images could be gathered automatically with a uniform distribution and a zenith camera angle. The high resolution of the drone optics meant that the drone could be flown at the maximum altitude of 120m, in line with the airspace regulations in London, allowing coverage of a wider area in less time.
After gathering the image dataset, the team assembled the images using the Agisoft Metashape photogrammetry software and obtained a detailed textured 3D model. Using
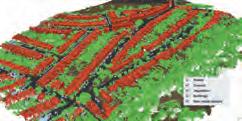
the machine learning algorithm for automatic point cloud classification, it was possible to separate the buildings from all other features (e.g. trees, streets and ground elements), which simplified the subsequent steps of running solar exposure analysis on the roof geometry.

CUSTOM SOLAR ANALYSIS ALGORITHMS
Due to the architectural background of the WDS-LAB team, they relied on 3D mesh modelling tools outside of the typical surveying software realm. Rhinoceros 3D was used since it is common among architects and urban designers. It allows 3D mesh
Figure 4: Sun path diagram and results of the solar exposure on roofs created with Rhinoceros 3D and Grasshopper.
Figure 3: Point cloud classification with Agisoft Metashape.
FEATURE 23ISSUE 6 2022 | INTERNATIONAL |
treatment, rendering and texture visualization. It is also equipped with an impressive visual programming platform that allows the creation of complex algorithms for 3D environmental data analysis (Grasshopper 3D) with local weather databases taken into consideration.
The resulting algorithms were able to automatically slice the mesh and classify the roof geometries, separating them from the rest of the building surfaces. This reduced the number of polygons that needed to be analysed by the solar analysis engine. Solar access analysis quantified how many hours of sun and incident solar radiation a geometry could receive in a given time period and calculated its accumulation in each mesh face. This process took into account hourly global horizontal irradiance
values and the shadows that any adjacent element could cast on them. It was a computationally heavy operation, but the slicing and classification made the whole analysis process much faster than trying to analyse everything at once.
THE ROOF AREA FOR SOLAR PANELS
Residential roofs often have irregularities such as chimneys and telecommunication features or other elements that could make it difficult to integrate commercial rectangular solar panels measuring 1x1.7m. Nevertheless, it was estimated that 80% of the roof surfaces would be geometrically suitable for allocating PV panels, which meant that a total area of 17,000m 2 of solar panels could be fitted on the roofs in the sampled neighbourhood (Figure 6).

THE ENERGY FROM THE PANELS
For this study, the team used standard databases for solar photovoltaic panels and assumed the values that can be seen in Figure 11. The calculations of the energy produced annually showed that the whole array of solar panels, if placed horizontally looking upwards, would receive a total of 2,335,016kWh of energy. Based on the annual median household consumption in Great Britain according to the Department of Business Energy and Industrial Strategy (2,900kWh per year per household), this amount of solar energy gathered directly from the roofs would be able to power 800 households annually, providing that batteries were used to store the energy for use at nighttime. Since the sampled neighbourhood had 258 residences, it was concluded that the roofs could gather an estimated three times the amount of energy needed from solar if the energy produced throughout the year could be accumulated.
CONCLUSIONS
The use of architectural environmental simulation tools on photogrammetric models captured with drones has proven to be a fast and reliable system that can help energy assessors and architects to better understand the potential for locally tapping into renewable energy sources in urban environments. Thanks to this experimental workflow, WDS-LAB estimates that PVs allocated on the roofs of a neighbourhood like the one studied could generate more energy from renewables than needed. Excess energy could be used to power other buildings and create a balance
 Figure 5: Image showing the process of classification and extraction of the roofs.
Figure 6: The estimated area of solar panels that would fit on roofs in the neighbourhood.
Figure 5: Image showing the process of classification and extraction of the roofs.
Figure 6: The estimated area of solar panels that would fit on roofs in the neighbourhood.
| INTERNATIONAL | ISSUE 6 202224
with other areas with higher residential density, thus helping a city like London to reduce its carbon footprint.

Drones and photogrammetry are great tools for studying new ways to integrate renewables in urban contexts, helping to obtain more accurate geometries and consider the existing ‘as-built’ situation. This brings more accuracy to the process than when using simplified massing CAD models available online from different organizations. These are not updated regularly and generally do not consider


SUMMARY OF RESULTS
potential alterations on the surfaces of buildings and surrounding context elements.
The WDS-LAB team will continue to study more urban areas to expand the database and evaluate the full potential that London neighbourhoods could have for the installation of PV panels to help the city transition to renewables. There is no doubt that urban solar energy will play an important role in reducing carbon emissions. Studies like this help to raise awareness that the roofs of people’s homes can offer valuable access to renewable energy.
Average annual household energy consumption 2,900 kWh
Neighbourhood energy consumption for 258 households (annually)748,200 kWh
Solar radiation received per solar panel (m2) 1,090 kWh/m2

Total estimated area of roofs suitable for PV panels 17,686 m2
Active solar panel area efficiency 95%
DC-AC inverter efficiency 85%
Solar panel efficiency 15%
Total energy gathered by the PV panels (annually) 18,313,853 kWh
Renewable energy generated (annually) 2,335,016 kWh
Percentage of consumption covered by the PV system (annually) 312%
ABOUT THE AUTHOR
Carlos Bausá Martínez is a Spanish architect and energy assessor who is based and ARB-registered in the UK. He specializes in urban and architectural environmental analysis and computational design. He is the founder of WDS-LAB, a London-based architectural consultancy studio that focuses on researching how new technologies can help to create more sustainable and resilient neighbourhoods and reduce the climate change potential. He has also worked for Foster and Partners and Zaha Hadid Architects, where he is currently the sustainability team lead. carlos.bausa@wds-lab.com
 Figure 7: The classified geometries extracted from the photogrammetry model.
Figure 10: The monthly contribution of the solar array. The calculations were validated by comparing the results using two different engines (Ladybug Legacy and Climate Studio).
Figure 11: The results based on standard values for solar photovoltaic panels.
Figure 8: The textured neighbourhood photogrammetry 3D model before the roofs were sorted for solar analysis.
Figure 9: The average sun hours per roof, resulting in a heat map of solar distribution.
Figure 7: The classified geometries extracted from the photogrammetry model.
Figure 10: The monthly contribution of the solar array. The calculations were validated by comparing the results using two different engines (Ladybug Legacy and Climate Studio).
Figure 11: The results based on standard values for solar photovoltaic panels.
Figure 8: The textured neighbourhood photogrammetry 3D model before the roofs were sorted for solar analysis.
Figure 9: The average sun hours per roof, resulting in a heat map of solar distribution.
FEATURE 25ISSUE 6 2022 | INTERNATIONAL |
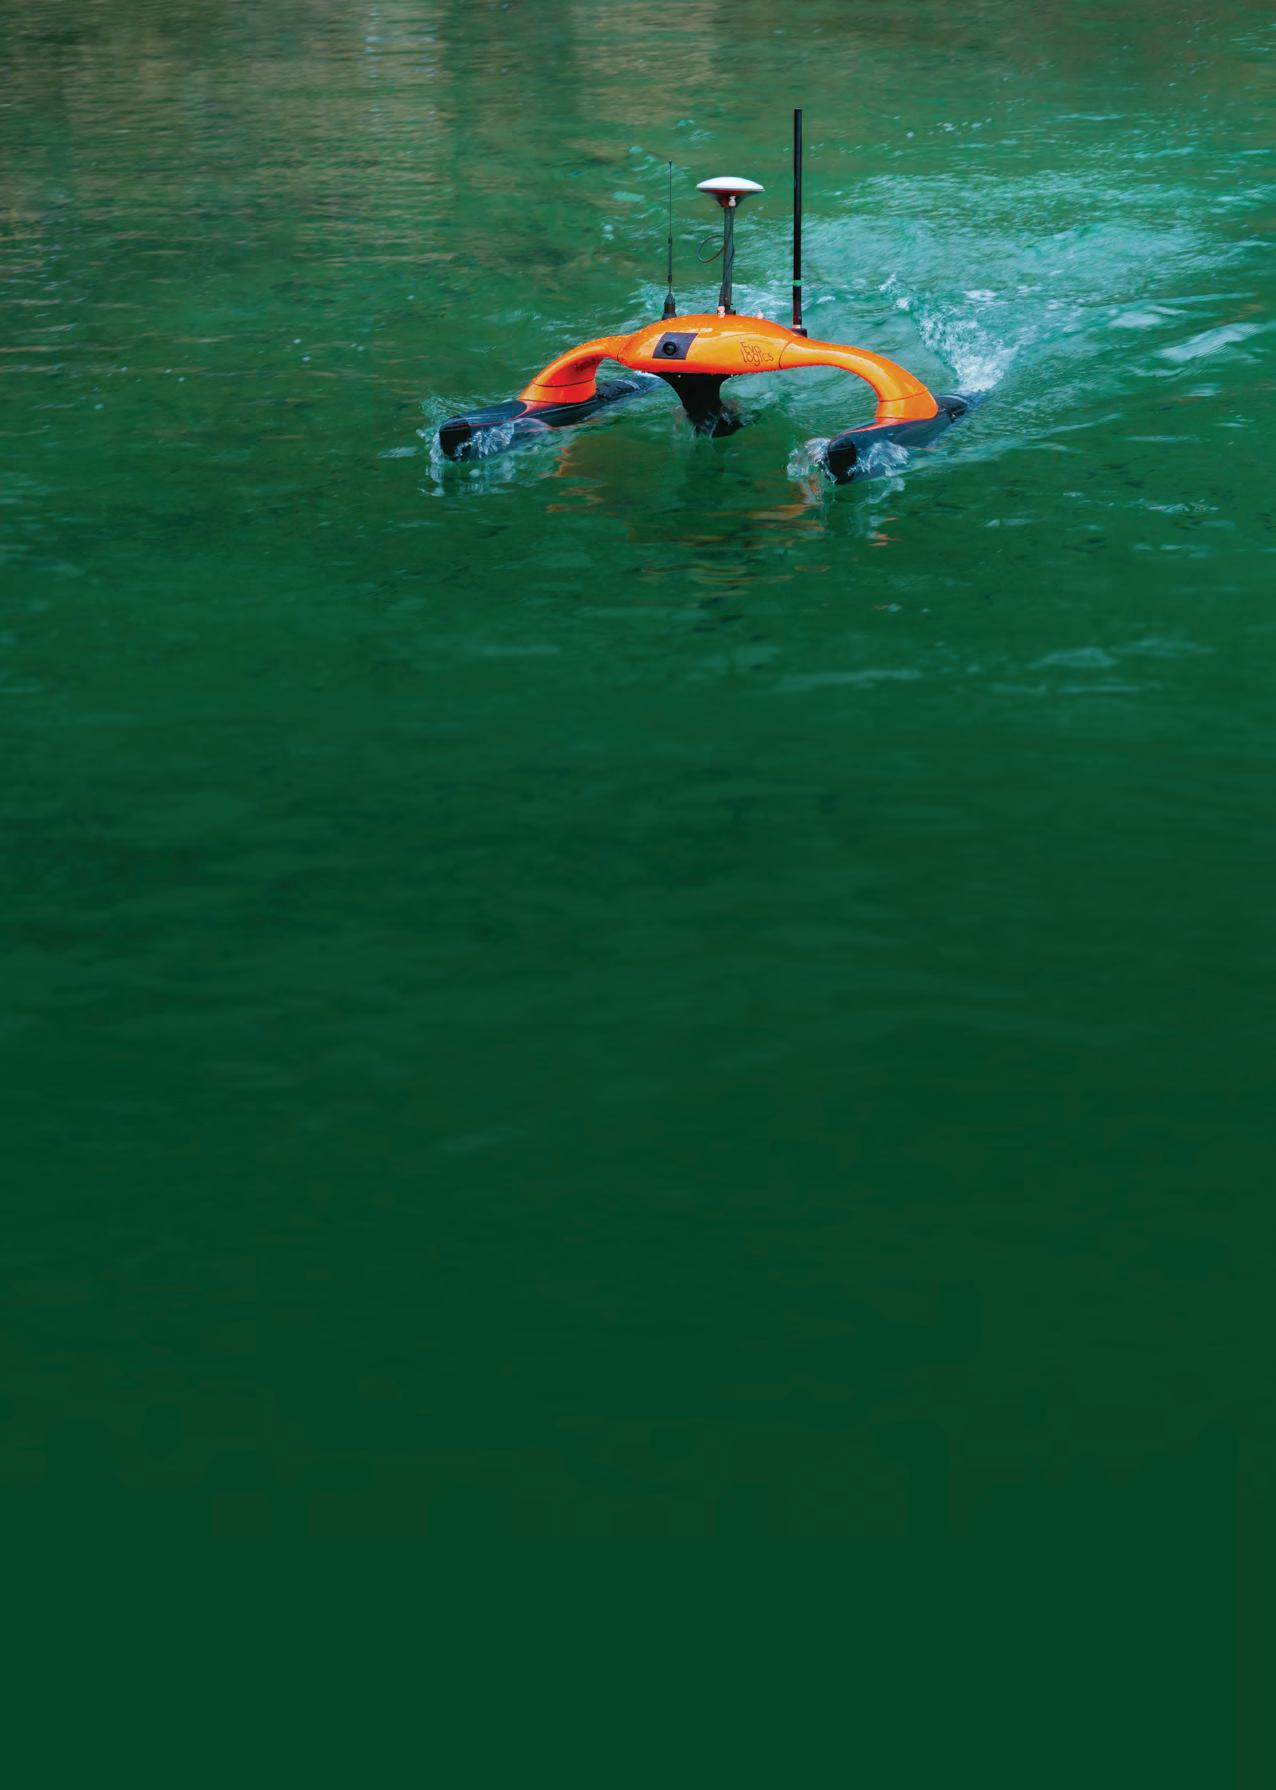
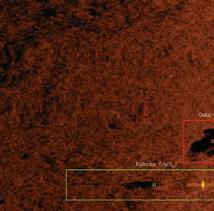
sales@evologics.de EvoLogics.de SONOBOT 5 UNCREWED SURFACE VEHICLE • Accurate georeferenced bathymetry and cartography missions, search and survey in hard-to-reach areas • Autonomous and remotely-controlled operation • Data logging and real-time acquisition over redundant mesh network • Exchangeable battery packs for 9+ hours of operation • System software for planning, execution and data evaluation • High-precision measurements and recordings, different GNSS and sonar options available • Rapid system deployment, excellent maneuverability and area coverage with powerful and efficient drives OBJECT RECOGNITION • objects of interest are detected and highlighted live during the mission • AI-based system as an extra module that runs directly onboard the vehicle and analyses raw dataMeet us at INTERGEO 2022! 18 - 20 October Essen, DE STAND A3.129
BY TIMOTHY W.
New Lease of Life
During the FIG Congress 2022 in Warsaw, Poland, all the attendees participating in the various sessions had a cautiously optimistic look on their faces. While some local, state and regional meetings and conferences had been held worldwide in the past months, this was the first in-person FIG Congress for this group of surveying and geospatial professionals in three years. In the interim period, all interaction had been limited to emails, video meetings and conference calls. Could this be the start of getting back to normal? Or do we even know what the new normal will truly be like?
The Merriam-Webster Dictionary defines the term ‘hibernation’ as: “To be or become inactive or dormant”, and I think this aptly describes the overall state of the promotion and advocacy of the international surveying community in recent years. Actual surveying and geospatial activities have continued to gather speed over the last few years, but that has been due to a combination of economic growth and the pandemic. In fact, one could say the pandemic drove the surveying profession’s productivity to greater heights, simply because people had little else to do in their lives. Vacations, business trips and family visits were postponed due to travel restrictions. Many educational activities were cancelled, so there was no need to knock off early for the afternoon to see their children participate in sporting events or other schoolrelated occasions. Surveying professionals threw themselves deeper into their work, and why not? The recession of 2008-2012 was still on many surveyors’ minds, so they were keen to seize the opportunities to make money while they could.
That brings me onto the state of ‘hibernation’ regarding professional associations and volunteerism at the international level. While there was some degree of optimism at the start of 2021, the shock of the COVID-19 pandemic lingered throughout the year. The FIG Planning Committee faced some tough questions as the virus continued to hold the planned location for the FIG Congress 2022 –Cape Town, South Africa – in its grip. What will the world look like in June 2022? And will the virus subside enough for us to hold the congress there? It was a hard choice, but the Planning Committee decided to be cautious and postponed the hosting of the congress in Cape Town until the next scheduled event in 2026. This meant a new site must be chosen.
Planning started right away for a meeting process that normally takes two to three years to complete. After a thorough search and vetting of several sites, the Association of Polish Surveyors (SGP) was selected to host the FIG Congress 2022 in Warsaw, Poland. It was also decided to delay the congress until September, as the usual dates for the gathering conflicted with many previously scheduled events. Despite the compressed timeframe for planning, the FIG and SGP teams proposed a full on-site schedule with some larger sessions being live-streamed for limited hybrid viewing.
Then on 24 February 2022, one of Poland’s neighbours – Ukraine – was invaded by Russia. It is estimated that over 1.5 million Ukrainian refugees have fled their homeland to temporarily reside in Poland. In view of the additional need for humanitarian efforts, would Warsaw be an appropriate place for an international surveying and geospatial conference at that time? The answer: the FIG Congress 2022 was a wonderful antidote to the professional pains that we all endured during the ‘pandemic years’.
From the pre-event technical classes to the Opening Ceremony and Technical Paper Programme and through to the final General Assembly and Farewell Reception, the FIG Congress 2022 was the perfect cure for the ‘COVID-19 hangover’ we had all been suffering. The exhibition hall was nicely sized with just the right mix of vendors and professional information. This congress was about bringing an international community of like-minded surveying and geospatial professionals and students together to share their own struggles with the pandemic and how fellowship rules at the end of the day. Lots of old relationships were rekindled, while even more new ones
blossomed like an abundant spring meadow. Young and old found plenty of common ground during many of the sessions and networking opportunities, so there is hope that mentoring is alive and well. We collectively experienced a renewed bonding with our contemporaries and this will fuel our journey towards our meeting at the FIG Working Week 2023 in Orlando, Florida, USA, next May.
The FIG Congress 2022 did not break any records for attendance, nor did it tick every box for accomplishments at the level of each commission. But it will be remembered as the event that brought us back together after a long hibernation period. It reunited an international community that was in desperate need of the professional equivalent of a ‘group hug’ – and for that, we must give thanks to FIG and the Polish Surveyors. Bravo to the organizers, but also bravo to all of us; we have weathered a terrible storm and have come through the other side filled with a new lease of life. All it took was a little hibernation and a little networking follow-up. Orlando, here we come!
ABOUT THE AUTHOR
is the new executive director of the USA’s National Society of Professional Surveyors (NSPS), having been involved with the organization for more than 20 years as a member of the Certified Survey Technician Board, Joint Government Affairs and ALTA/NSPS Land Title Survey committees. Tim was recently named as chair of the FIG Commission 1 –Working Group 1.1 (Professional Ethics) and will serve as chair for the overall Commission 1 (Professional Standards) starting in 2023. He is a professional land surveyor, licensed in the states of Illinois and Wisconsin.

PERSPECTIVES 27ISSUE 6 2022 | INTERNATIONAL |
BURCH, NSPS, USA
THE USE OF GAMMA-RAY SPECTROMETERS IN AIRBORNE SURVEYS
Soil Mapping with Drones
In the Earth sciences sector, sensors for measuring properties of the Earth are rapidly becoming adapted for drone use now that new developments in technology have led to an increase in the size and payload of unmanned aerial vehicles (UAVs or ‘drones’). This article presents two studies that explore the opportunities for adding a gamma-ray spectrometer to a drone in order to map the texture or contamination of soil.
Gamma-ray spectrometers have a long tradition of use as a geophysical tool for mapping soil and sediment properties, but their large size and weight has so far prevented these sensors from being used in drone applications. However, recent developments in sensor hardware, combined with data processing algorithms that enable the extraction of every last piece of information from the acquired data, have resulted in gamma-ray spectrometers that weigh as little as 3kg. This substantial weight reduction means that it is now feasible to attach them to drones and opens up a new range of applications for the use of gamma-ray spectrometers in airborne surveys.
FROM SENSOR TO SOIL MAP
A gamma-ray spectrometer directly measures the concentrations of radionuclides present in the environment, whether naturally occurring radionuclides such as potassium, uranium and thorium or man-made radionuclides such as caesium (137Cs). These measurements provide the input for application models which correlate the concentrations of the radionuclides with the soil property or contaminant of interest. To do this, it is of great importance that the field measurements provide quantitative and accurate results. Therefore, proper sensor calibration and the proper selection of the sensor size in relation to its application are a must.
Gamma-ray sensors can be used for soil mapping, environmental studies and mining based on a three-step approach (Figure 1). This starts with attaching a sensor under a
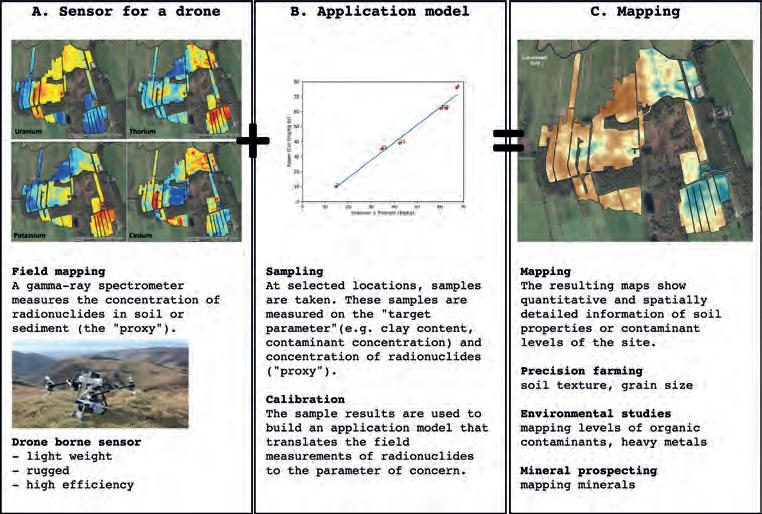
WHAT IS A GAMMA-RAY SPECTROMETER?
A gamma-ray spectrometer measures the concentration of radioactive elements in the Earth. All rocks, soil and sediments contain tiny but measurable traces of naturally occurring radionuclides such as potassium (40K), uranium (238U) and thorium (232Th). The radiation emitted by these nuclides carries infor mation on the mineralogical composition of the rocks and soils. This phenomenon is used, for instance, in oil & gas and mineral prospecting to gain a qualitative image of the mineral composition of an area or rock matrix. It is important to note that, in contrast to many other geophysical technologies, gamma-ray spectrometers are passive sensors. Rather than emitting radiation, they capture it. The capture proba bility, and thereby the detection efficiency, is directly proportional to the volume of the detector. Therefore, a bigger detector means better efficiency. This size dependency is the reason that, in traditional airborne surveying, large, multi-crystal detector ‘packs’ of 80kg are used. However, recent developments have resulted in much lighter sensors, making it feasible to use gamma-ray spectrometers beneath drones.
Figure 1: The three-step approach for sensor-based mapping, developing an application model and generating a map for an end-user.
| INTERNATIONAL | ISSUE 6 202228
BY RONALD KOOMANS, HAN LIMBURG AND STEVEN VAN DER VEEKE , MEDUSA EXPLORATIONS, THE NETHERLANDS
drone to measure the radionuclides. Next, an application model is developed that translates the measured data into soil parameters. The maps of the properties of interest can then be generated.
SOIL MAPPING COMPARISON STUDY
For mapping soil composition, a gamma-ray spectrometer is often applied using a groundborne vehicle such as a tractor, gator or quad. However, the use of a drone makes it possible map the soil properties of terrain that is difficult to access, such as when the land is covered in vegetation or when access to the field is undesirable.
To evaluate the quality of the resulting maps measured by a gamma-ray spectrometer mounted under a drone, the authors designed a comparison study to predict the physical soil properties of 40ha of farmland in Flevoland, the Netherlands. In the project, measurements using a gamma-ray spectrometer (an MS-2000 sensor from Medusa Radiometrics) mounted on a tractor were compared against measurements from a drone-borne gamma-ray spectrometer (an MS-1000 sensor from Medusa Radiometrics) and against traditional soil samples. The MS-1000 is a low-power, lightweight and robust gamma-ray detector system specially designed for use with drones. The sensor, which weighs 7.7kg, was mounted under a standard, commercially available drone (DJI M600 PRO). The drone flew at an average elevation of 14m with survey lines 30m apart.
The application model in the study was based on 14 soil samples taken and analysed in the lab on radionuclide content and clay fraction. The model (Figure 2) was used to translate the field values of 232Th into a map showing the concentration of fines (<50µm).
Figure 3 shows the resulting maps when this application model was used to translate the spatial 232Th concentration to spatial grain size variation. The ground measurements show the variation in clay content when it was measured with an MS-2000 detector on a tractor. The airborne map shows the clay content based on the measurements using the MS-1000 drone-borne detector. A separate set of 44 soil samples were taken and were used for independent statistical validation.
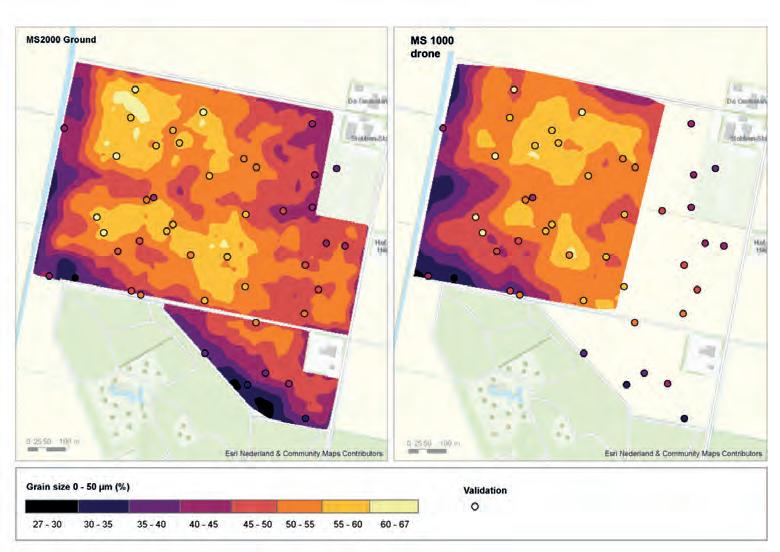
The maps of the ground-borne measurements and the drone-borne measurements are a
close match, but the results from the drone are ‘smoother’ and show a lower spatial resolution. This difference in the size of spatial structures is to be expected as the drone captures radiation from a larger area and thereby has a larger footprint. Closer analysis and validation of the maps revealed that the quality of the drone-borne map is on a par with the ground-borne survey, and that both approaches are as good as soil sampling.
MAPPING SOIL CONTAMINATION
Environmental contamination due to human activity is recognized as one of the modern dangers of society’s industrial advancements. This contamination involves organic contaminants and heavy metals due to historic releases by current and former industrial practices. Since the contaminants can enter the food chain by uptake in biota, the environmental restoration or closure of contaminated sites is a priority.
The current approach to managing and monitoring contaminated sites involves invasive and often labour-intensive methods, particularly in order to collect samples to quantify and map the distribution of contaminants. As a result, the contours of the contaminant distribution based on the samples are subject to a number of potential errors depending on sample size and intersample spacing, with the risk that ‘hotspots’ remain unmapped.
Figure 2: The application model was used to translate the thorium concentration (Bq/kg) into the clay fraction, defined as the grain size <50µm.
Many contaminants are adsorbed to clay particles. This means that contaminant in aquatic sediments levels are strongly correlated to the composition of these sediments when underwater, or of the soil when the sediments are deposited on floodplains. At Spittelwasser Creek, one of the tributaries of the River Elbe in Germany, the floodplains had been used as stacking basins for heavily contaminated wastewater during flood events, causing them to become
Figure 3: Grain size map derived from a ground-borne survey (left) and an airborne survey (right). The dots represent the independent sample points used in the validation.
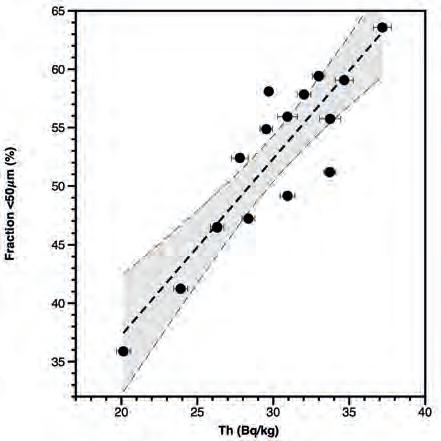
FEATURE 29ISSUE 6 2022 | INTERNATIONAL |
contaminated with organic chemicals such as dioxins. The floodplains had already been the subject of numerous investigations dealing with the contamination of sediment and soil. The decision was taken to conduct a drone-borne mapping survey, partly because some of the areas were difficult to access physically and partly because the landowners were unknown for some areas, which meant
that access permits could not be acquired.
For the airborne survey, the MS-1000 was mounted under a DJI M600 drone. The drone flew at an average elevation of 7m with survey lines 10m apart, enabling the 50ha site to be mapped in just three days.
The survey resulted in integral maps of sediment contaminant levels (Figure 5)
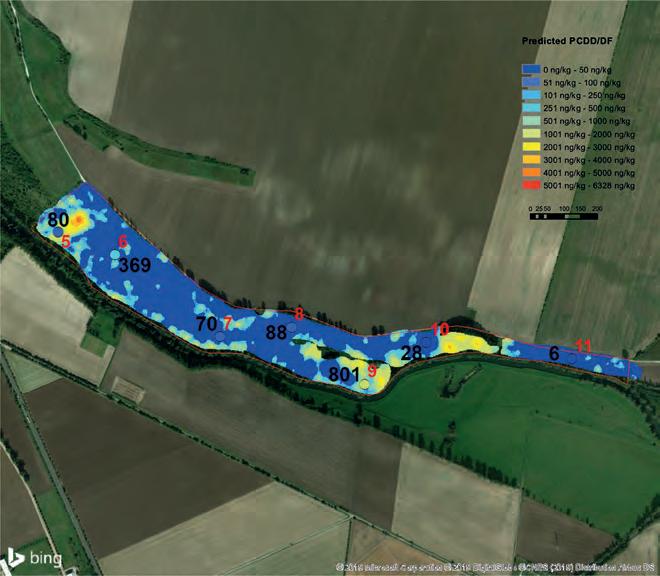
showing that the majority of the area has relatively low concentrations of contaminants, but that there are some hotspots. This data provides the government with detailed information on the contamination on a riverbasin scale, which is crucial for defining proper remediation measures.
CONCLUSIONS
The geospatial mapping industry has changed considerably in recent years due to the use of drones for generating maps of the surface of the Earth. So far, the use of drones in the geophysical domain has been limited and most of this work is done with groundborne surveys or surveys from larger aircraft. However, the geophysical industry continues to evolve and sensors have become smaller, lighter and more user friendly. These smaller sensors can now be used in combination with drones to map soil texture and soil contamination at high spatial resolution.
Both of the drone-borne surveys presented in
FURTHER READING
www.medusa-radiometrics.com
Drone-borne gamma-ray - Medusa Wiki - The Medusa Institute; https://the. medusa.institute
van der Veeke, S., Limburg, J., Koomans, R.L., Söderström, M., de Waal, S.N., van der Graaf, E.R., 2021. Footprint and height corrections for UAV-borne gamma-ray spectrometry studies. J. Environ. Radioact. 231. doi:10.1016/j. jenvrad.2021.106545
van der Veeke, S., Limburg, J., Koomans, R.L., Söderström, M., van der Graaf, E.R., 2021. Optimizing gamma-ray spectrometers for UAV-borne surveys with geophysical applications. J. Environ. Radioact. 237, 106717. doi:10.1016/j.jenvrad.2021.106717
van Egmond, F.M., van der Veeke, S., Knotters, M., Koomans, R.I., Walvoort, D.J.J., Limburg, J., 2018. Mapping soil texture with a gamma-ray spectrometer : comparison between UAV and proximal measurements and traditional sampling : validation study. Wageningen, the Netherlands. doi:10.18174/466037
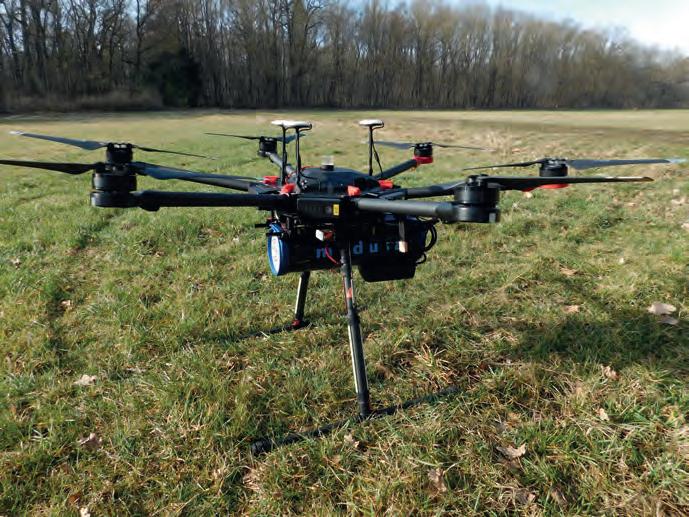 Figure 4: MS-1000 gamma-ray spectrometer mounted under a standard commercial DJI M600 drone.
Figure 5: Dioxin (PCDD/DF) concentrations in one area of the floodplains. The points represent the sample locations, and their colour scale is identical to the map’s colours.
Figure 4: MS-1000 gamma-ray spectrometer mounted under a standard commercial DJI M600 drone.
Figure 5: Dioxin (PCDD/DF) concentrations in one area of the floodplains. The points represent the sample locations, and their colour scale is identical to the map’s colours.
| INTERNATIONAL | ISSUE 6 202230
this article were executed using an off-theshelf drone and a gamma-ray spectrometer. The first study demonstrated how soil texture can be mapped using such a setup. The second study showed that the same setup can be used to map contaminants with an unpreceded spatial resolution. These results demonstrate that gamma-ray sensors are ready to be routinely applied in droneborne mapping projects. This opens up the possiblitiy to perform high-resolution mapping surveys of soil texture and soil contamination in areas that would otherwise be inaccessible.
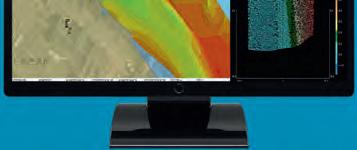
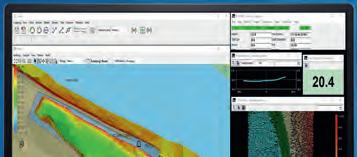
ABOUT THE AUTHORS


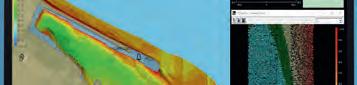


Ronald Koomans studied geology at Utrecht University and did his PhD at the nuclear physics lab of the University of Groningen on the application of an underwater gamma-ray spectrometer to study the transport of sediments in the coastal zone. Together with Han Limburg, Koomans founded Medusa Explorations in 2000. Koomans is an expert on applying gamma-ray sensors and developing application models for mapping grain size, texture and contamination of soil and sediment.
Han Limburg studied physics at the University of Groningen and completed his PhD (cum laude) in the atomic physics group of the nuclear physics lab there. Limburg subsequently worked at the nuclear physics lab on the commercialization of an underwater gamma-ray spectrometer before founding Medusa Explorations together with Ronald Koomans in 2000. Limburg is focused on the technical development by creating gamma-ray survey systems for geophysical applications using new detector materials and novel data analysis methods to make detectors smaller, more robust and user friendly.
Steven van der Veeke studied applied physics at the University of Groningen and is currently an R&D engineer at Medusa Radiometrics. He combines this role with a PhD position at the University of Groningen, where he is conducting doctoral research to investigate the scientific questions that arise when using a drone as the platform for gamma-ray measurements. His thesis will address issues including height corrections, the footprint, spectral analysis optimization and radon correction methods. This work will result in a first draft of the ‘Guidelines for drone-borne radioelement mapping’.

FEATURE 31ISSUE 6 2022 | INTERNATIONAL |
HYPACK® Surveying and processing software for Single Beam, Side Scan, ADCP, Sub-bottom, and Magnetometer systems. Your Sensors. Our Software. Survey The World. HYSWEEP® Surveying and processing software for Multibeam, Backscatter, and LiDAR systems. sales@hypack.com • www.h ypack2023.com DREDGEPACK® Dredging control software on Cutter Suction, Hopper, Excavator, Bucket Dredges, and more. NEW SOFTWARE · WATER QUALITY · GEOPHYSICS · ECHO HYPACK 2023 Training Event Panama City Beach, Florida January 9-12, 2023 ACKNOWLEDGEMENTS The mapping projects described were conducted for Landesanstalt für Altlastenfreistellung (LAF) of Sachsen Anhalt, Germany, and for Wageningen Environmental Research, the Netherlands.

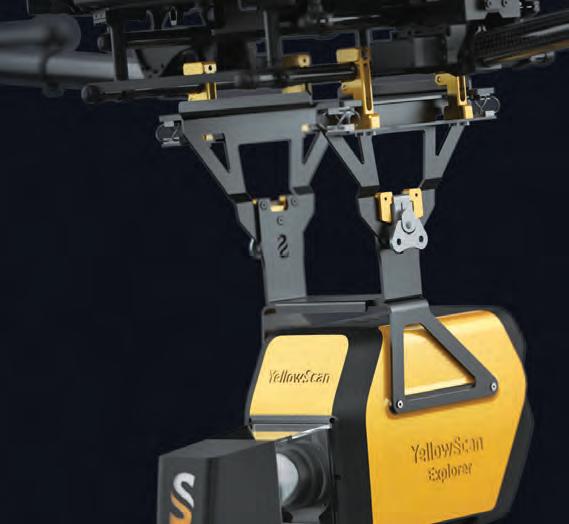

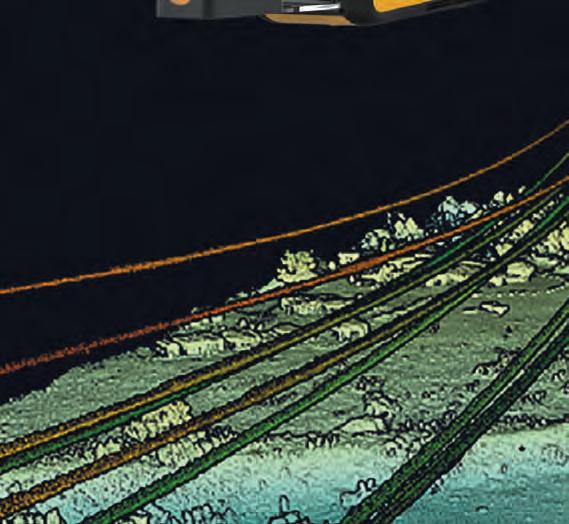


 BY AUBREY MILLER, PASCAL SIRGUEY AND SIMON MORRIS, NEW ZEALAND
THE USE OF INNOVATIONS IN SATELLITE PHOTOGRAMMETRY AND LIDAR IN NEW ZEALAND
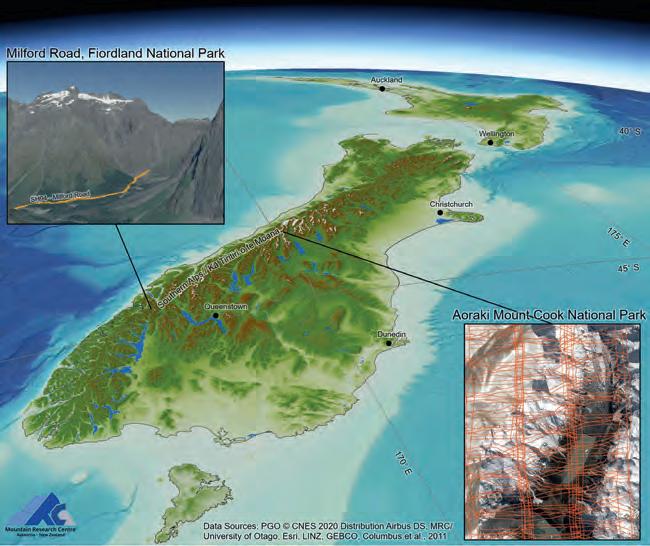
Topographic Mapping for Snow Avalanche Hazard Modelling
A project in Aotearoa/New Zealand, is combining the use of high-quality DEMs from satellite photogrammetric mapping (SPM) with Lidar technologies to model hazards such as snow avalanches. The resulting topographic mapping can improve planning and preparedness to deal with mass movements of snow and debris in alpine regions.
Mass movements such as snow avalanches and debris flows pose risks to people and infrastructure in alpine regions around the world. These hazards can be simulated with advanced modelling software to support decision-making and risk mitigation, which requires accurate high-resolution digital elevation models (DEMs) to make results meaningful. Advances in satellite photogrammetric mapping (SPM) are bringing
high-quality DEMs to many alpine regions previously lacking modern digital topography. At the same time, Lidar technologies are used to calibrate hazard models and offer rapidresponse capacity to quantify the impact from hazards such as snow avalanches.
Ongoing research in Aotearoa/New Zealand, is highlighting the importance of topographic mapping in snow avalanche planning and preparedness.
MAPPING TECHNOLOGIES
The development of open-source tools like NASA’s Ames Stereo Pipeline (Beyer et al., 2018) has greatly improved satellite photogrammetric mapping (SPM) workflows. Ongoing research at the Mountain Research Centre (MRC) aims to automate the SPM workflow to produce high-resolution digital elevation models (DEMs) accurate to the image ground sample distance, without the need for ground control surveys. The MRC is developing tools to automate 3D-change detection with repeat mapping for landscape monitoring and mapping hazards like snow and rock avalanches with an increasing range of satellite constellations including Pléiades (PHR, Neo), Worldview and SkySat (Figure 1). For example, a 2m DSM produced from 0.5m Pléiades PHR stereoimagery has been used to quantify snow depth distributions (Eberhard et al., 2021). Next-generation sensor constellations such as the 0.3m Pléiades Neo reduces revisit time, thus improving the level of detection and accuracy achieved by SPM.
SPM can fill a gap in knowledge of landscape dynamics by repeatedly mapping large areas (>400km2) of challenging topography in a single acquisition. It is now efficiently complemented by very-high-resolution (VHR) mapping technologies operating closer to the ground. Terrestrial laser scanning (TLS) and UAV-Lidar are used for resolving fine detail in extreme terrain, as well as for rapid
Figure 1: Examples of SPM in Aotearoa/New Zealand, with the Pléiades PHR sensor. The orange polygons show the individual frames from a SkySat acquisition before SPM processing.
FEATURE 33ISSUE 6 2022 | INTERNATIONAL |
deployment to document natural hazards. Used together, advances in topographic mapping are enabling hazard researchers to gain both new insights into the sensitivity of hazard models to topographic representation, and unprecedented validation data for the modelling.
TOPOGRAPHIC REPRESENTATION IN AVALANCHE MODELLING
Dynamic hazard models like Rapid Mass Movement Simulation (RAMMS) simulate mass movements such as snow avalanches on real terrain, represented by a DEM. The hazard model outputs help prepare for extreme events and assist in the design of mitigation structures such as berms to decrease the risk to people and infrastructure from avalanches. For example, models are used for hazard indication mapping and the design specifications for buildings and roads sited in areas at risk from a 100-year or 300-year avalanche event. The dynamic hazard models are sensitive to the accuracy and resolution of the underlying DEM. Artefacts from DEM production and interpolation, or from outdated topography,
can lead to consequential errors in the hazard model outputs. At the same time, higherresolution DEMs (e.g. 1 or 2m) capture higher surface roughness compared with their low-resolution counterparts, which affects how avalanche flow is simulated over the same terrain.
Subtle differences between DEMs due to sensor technology and mapping technique can also impact hazard modelling. For instance, the use of a digital surface model (DSM) versus a digital terrain model (DTM) may introduce additional surface roughness in the model when the terrain includes significant vegetation. Also, when mapping steep terrain, the orientation to the sensor impacts on derivative topographic representation and accuracy. Larger base-to-height ratios in SPM will improve precision, but at the expense of an increased probability in terrain obstruction. Terrestrial scanning can resolve extremely steep terrain, but multiple scans may be needed to mitigate obstructions. Unmanned aerial vehicle (UAV or ‘drone’) platforms can help fill the gaps between satellite and terrestrial topographic mapping.
TERRESTRIAL LIDAR AND AVALANCHES IN FIORDLAND
A team of dedicated avalanche mitigation specialists manage snow avalanches hazards on Milford Road in Fiordland, New Zealand, using a variety of tools, including a network of alpine weather stations, HD webcams and a RIEGL VZ-6000 ultra-long-range scanner (Figures 2 and 3). The scanner is used to produce a snow-free DEM of avalanche terrain in summer as well as repeat mapping in winter to estimate snow depths. The scanner is also used for documenting avalanche paths after an event to calibrate the RAMMS avalanche model.
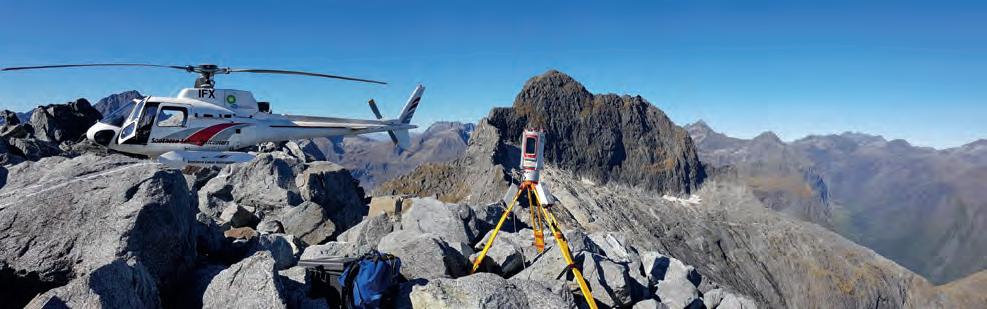
The scanner’s range provides a detailed view of the snow released in an avalanche, as
well as the snow left behind. For example, technicians used the Lidar intensity in the near-infrared range to characterize the snow layering in the crown wall left after an avalanche released in the McPherson path in 2020 (Figure 4) from up to 2km away, thus providing valuable snowpack data used in the modelling. The pulse density, averaging 468 points/m2, resolved intricate layers in the snowpack and enabled the fracture height to be measured from a safe distance.
The scanner is also used alongside SPM to generate DEMs for hazard modelling. A composite of 24 scans totalling three billion points was used to generate a 0.5m DSM over 5km2. Recent research (Miller et al., 2022) characterizes how subtle differences in the terrain representation in the McPherson avalanche path between the TLS and SPM DSMs govern the way the hazard model replicated the real avalanche, with implications for how hazard modellers select the appropriate DEM for given terrain. Figure 4 depicts a 0.5m hillshade from the TLS on top of the previously best-available DEM for the area (15m). The avalanche in 2020 was released with explosives from a helicopter to mitigate the hazard to the highway. The modelling suggested over 70,000 tonnes of snow would be released within three seconds and would travel at velocities of over 200km/h, going airborne over a cliff and stopping short of the highway. Accurate high-resolution topographic mapping was required to model the physics of the large avalanche flowing in extreme terrain.
UAV-LIDAR AND AVALANCHES IN NATIONAL PARK
The use of UAVs to map avalanches provides a new level of detail in estimating debris volumes. These estimates are used to replicate the real event with a computer simulation. Once calibrated, modelled scenarios (i.e. What if the avalanche was larger? What if a powder cloud was
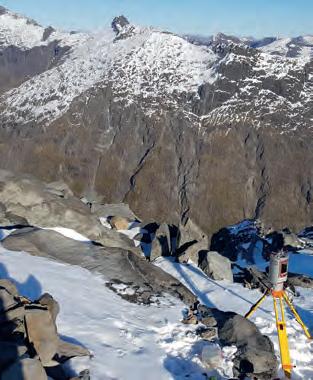 Figure 2: RIEGL VZ-6000 scanner mapping avalanche terrain in Fiordland, New Zealand. (Image courtesy: Downer Ltd, Milford Road Alliance)
Figure 3: Scanning alpine terrain (which is only accessible by helicopter) in summer. (Image courtesy: Downer Ltd, Milford Road Alliance)
Figure 2: RIEGL VZ-6000 scanner mapping avalanche terrain in Fiordland, New Zealand. (Image courtesy: Downer Ltd, Milford Road Alliance)
Figure 3: Scanning alpine terrain (which is only accessible by helicopter) in summer. (Image courtesy: Downer Ltd, Milford Road Alliance)
| INTERNATIONAL | ISSUE 6 202234
generated?) can assist planners to mitigate the risks posed by future avalanches. Both SPM and UAV-Lidar surveys provide DEM of Difference maps (DoDs) and volume estimates for avalanche debris.
A widespread avalanche cycle in New Zealand’s Aoraki Mount Cook National Park in July 2022 generated some of the largest avalanches observed in the park in decades. A UAV survey commissioned by the Department of Conservation mapped the debris from a large snow avalanche close to Mt Cook Village where a berm was recently constructed to divert avalanches away from roads and buildings. A DJI Matrice 300 series UAV, with real-time kinematic (RTK) positioning and DJI L1 Lidar sensor, mapped 35ha with 531 points/m2. The 0.5m DSM was differenced with a 2m SPM DSM derived from Pléiades PHR to estimate the volume of avalanche debris (175,860 ±11,386m 3 ),
FURTHER READING
which was used to calibrate the RAMMS model and assist in the assessment of the risk posed to the village by future avalanches. Figure 5 shows orthoimages and example DoDs from two avalanche events in Aoraki Mount Cook National Park, as measured by UAV-Lidar in July 2022 and SPM – a 2m DSM generated from 0.5m SkySat imagery in October 2021. The UAV-Lidar point cloud can be efficiently and interactively visualized thanks to webGL platforms such as Potree (see Further Reading).
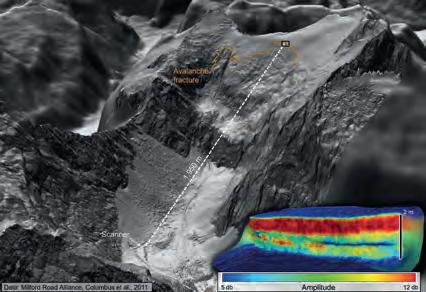
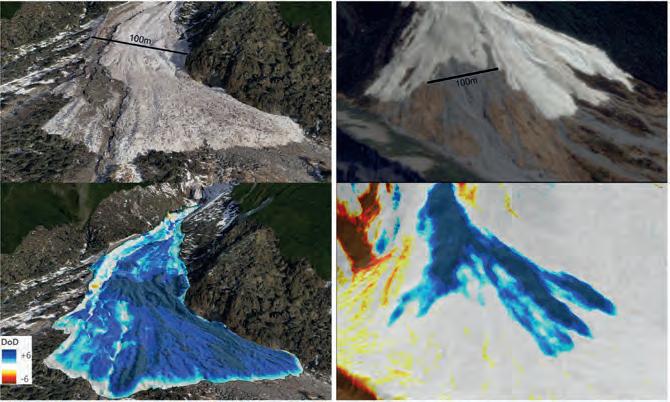
CONCLUSION
Innovations in satellite photogrammetric mapping (SPM) enable high-resolution topographic mapping of challenging alpine terrain previously lacking such data. At the same time, advances in Lidar technologies from terrestrial scanners and UAVs are providing rapid-response capacity to map and document natural hazards in unprecedented
Beyer, R. A., Alexandrov, O., and McMichael, S.: The Ames Stereo Pipeline: NASA’s Open Source Software for Deriving and Processing Terrain Data, Earth Space Sci., 5, 537–548, https://doi.org/10.1029/2018ea000409, 2018.
Eberhard, L. A., Sirguey, P., Miller, A., Marty, M., Schindler, K., Stoffel, A., and Bühler, Y.: Intercomparison of photogrammetric platforms for spatially continuous snow depth mapping, The Cryosphere, 15, 69–94, https://doi.org/10.5194/tc-15-69-2021, 2021. Miller, A., Sirguey, P., Morris, S., Bartelt, P., Cullen, N., Redpath, T., Thompson, K., and Bühler, Y.: The impact of terrain model source and resolution on snow avalanche modelling, Nat. Hazards Earth Syst. Sci., 22, 2673–2701, https://doi.org/10.5194/nhess-22-26732022, 2022.
WebGIS for Milford Road: https://arcg.is/0fqHS4 The Kitchener avalanche point cloud: https://www.otago.ac.nz/surveying/potree/ projects/20-001_Kitchener_avalanche.html
detail. Snow avalanche modelling relies on high-quality DEMs to simulate events on realworld terrain, providing data used to mitigate the risks posed to people and infrastructure from large avalanches. Future improvements in accuracy, resolution, coverage and revisit capacity of topographic mapping technologies will provide improved planning and preparedness for mass-movement hazards in alpine regions.
ABOUT THE AUTHORS
Aubrey Miller is a senior professional practice fellow at the School of Surveying, University of Otago, and member of the Mountain Research Centre in Aotearoa/New Zealand. He teaches and conducts research in the areas of geospatial science and natural hazards, with an emphasis on using geospatial tools to improve snow avalanche modelling.
Dr Pascal Sirguey is an associate professor at the School of Surveying, University of Otago, and member of the Mountain Research Centre in Aotearoa/New Zealand. His research focuses on remote sensing and photogrammetry, with an emphasis on satellite

Simon Morris is a senior avalanche technician for the avalanche control programme for the Milford Road along State Highway 94, New Zealand. The avalanche programme is run by the Milford Road Alliance, a partnership between the New Zealand Transport Agency and Downer New Zealand. His special interest is terrestrial laser scanning of avalanches and snow.
 Figure 4: A 0.5m hillshade (TLS) draped on 15m hillshade (NZSoSDEM) with an example of Lidar return amplitude from avalanche fracture nearly 2km from scanner.
Figure 5: Example DoDs for avalanche debris, between DSMs generated from UAV-Lidar and SPM (left) and SkySat and Pléiades DSMs generated from SPM (right). Orthoimages from DJI Matrice and SkySat in upper left and right, respectively. (Data: Department of Conservation)
Figure 4: A 0.5m hillshade (TLS) draped on 15m hillshade (NZSoSDEM) with an example of Lidar return amplitude from avalanche fracture nearly 2km from scanner.
Figure 5: Example DoDs for avalanche debris, between DSMs generated from UAV-Lidar and SPM (left) and SkySat and Pléiades DSMs generated from SPM (right). Orthoimages from DJI Matrice and SkySat in upper left and right, respectively. (Data: Department of Conservation)
FEATURE 35ISSUE 6 2022 | INTERNATIONAL |


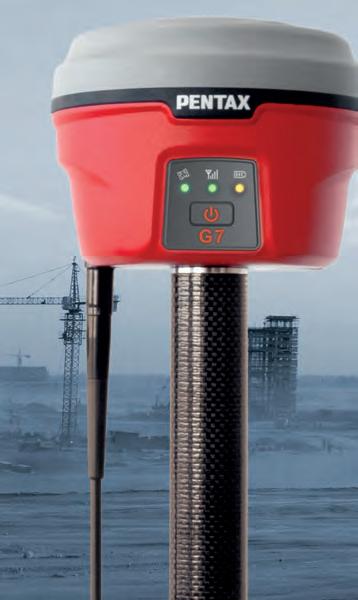


Focusing on true performance TI Asahi Co., Ltd. International Sales Department 4-3-4 Ueno Iwatsuki-Ku, Saitama-Shi Saitama, 339-0073 Japan www.pentaxsurveying.com/en/ Tel.: +81-48-793-0118 Fax: +81-48-793-0128 E-mail: International@tiasahi.com An all-constellation GNSS Smart Antenna with a MEMS sensor for Tilt Compensation. GNSS Receiver Total Station G7N A reflectorless Total Station from 1” accuracy with dual display panels for precise angles and ranges. R-2500NS Series
BY GEOFF BESBRODE, OXFORD TECHNICAL SOLUTIONS OXTS,
THE RISING POPULARITY OF 3D POINT CLOUDS AMONG DEVELOPERS
Video Games as an Emerging Application for Navigation Data
Perhaps surprisingly, video game development is becoming an increasingly popular use case for navigation and Lidar data. However, it is often overlooked amidst the almost endless possible applications for 3D point clouds, such as autonomous vehicle navigation, object detection or geospatial surveying. As personal computers (PCs) and gaming consoles become ever-more powerful, users demand more immersive experiences, particularly those that allow them to autonomously navigate around environments that they already know. This article discusses how navigation data is being used to aid video game development, and in turn allowing Lidar to take a leading role in this billion-dollar industry.
Lidar actually dates back to the 1960s, However, it is only since the acceleration of the digital world that the use of the technology has skyrocketed. As with any new technology, when it was first brought to market the cost per unit was high to enable the recovery of research and development costs. Over time, the price has come down as the technology has matured. This has put the technology into the hands of a much wider audience and, as a result, the number of new and innovative use cases has also increased.
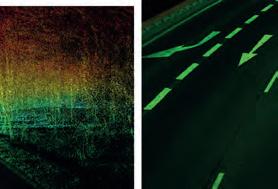
Lidar, or more specifically automotive-grade Lidar, in its purest form is most well-known for its use in the autonomous vehicle industry, where it is used for real-time object detection and collision avoidance. However, from a surveying and mapping perspective, it can also be a useful tool for video game developers.
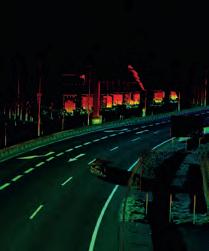
THE VERSATILITY OF THE POINT CLOUD

The point cloud enables the real-time Lidar data from previously scanned objects to be retained and used to build up a picture of the environment that can be analysed at a later stage. To create a 3D point cloud, users must combine the measurements
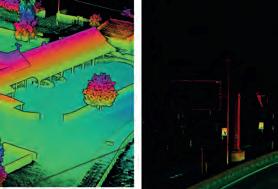
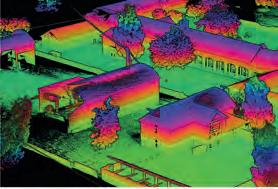
from an inertial navigation system (INS) with raw Lidar data (Figure 1). It is impossible to create a 3D point cloud without accurate INS data because the Lidar sensor needs to know where it is (position), its orientation and heading (navigation) and when in time it is (timing). This can be difficult to achieve without a sound understanding of coding. However, various software applications, such as OxTS Georeferencer, enable users to avoid complicated software engineering work. Once
georeferencing is complete, the software will create a Packet Capture (PCAP) file that users can view in many point cloud viewer software applications.
Point clouds are useful for many wide and varied reasons. Autonomous vehicle developers may use point clouds to build up digital maps of cities to further aid object detection and avoidance, while geospatial surveyors may want to use a point cloud to
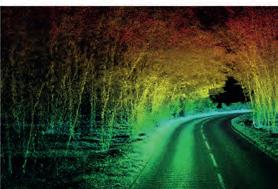 Figure 1: A selection of point clouds created using an OxTS INS and Lidar sensor.
FEATURE 37ISSUE 6 2022 | INTERNATIONAL |
UNITED KINGDOM
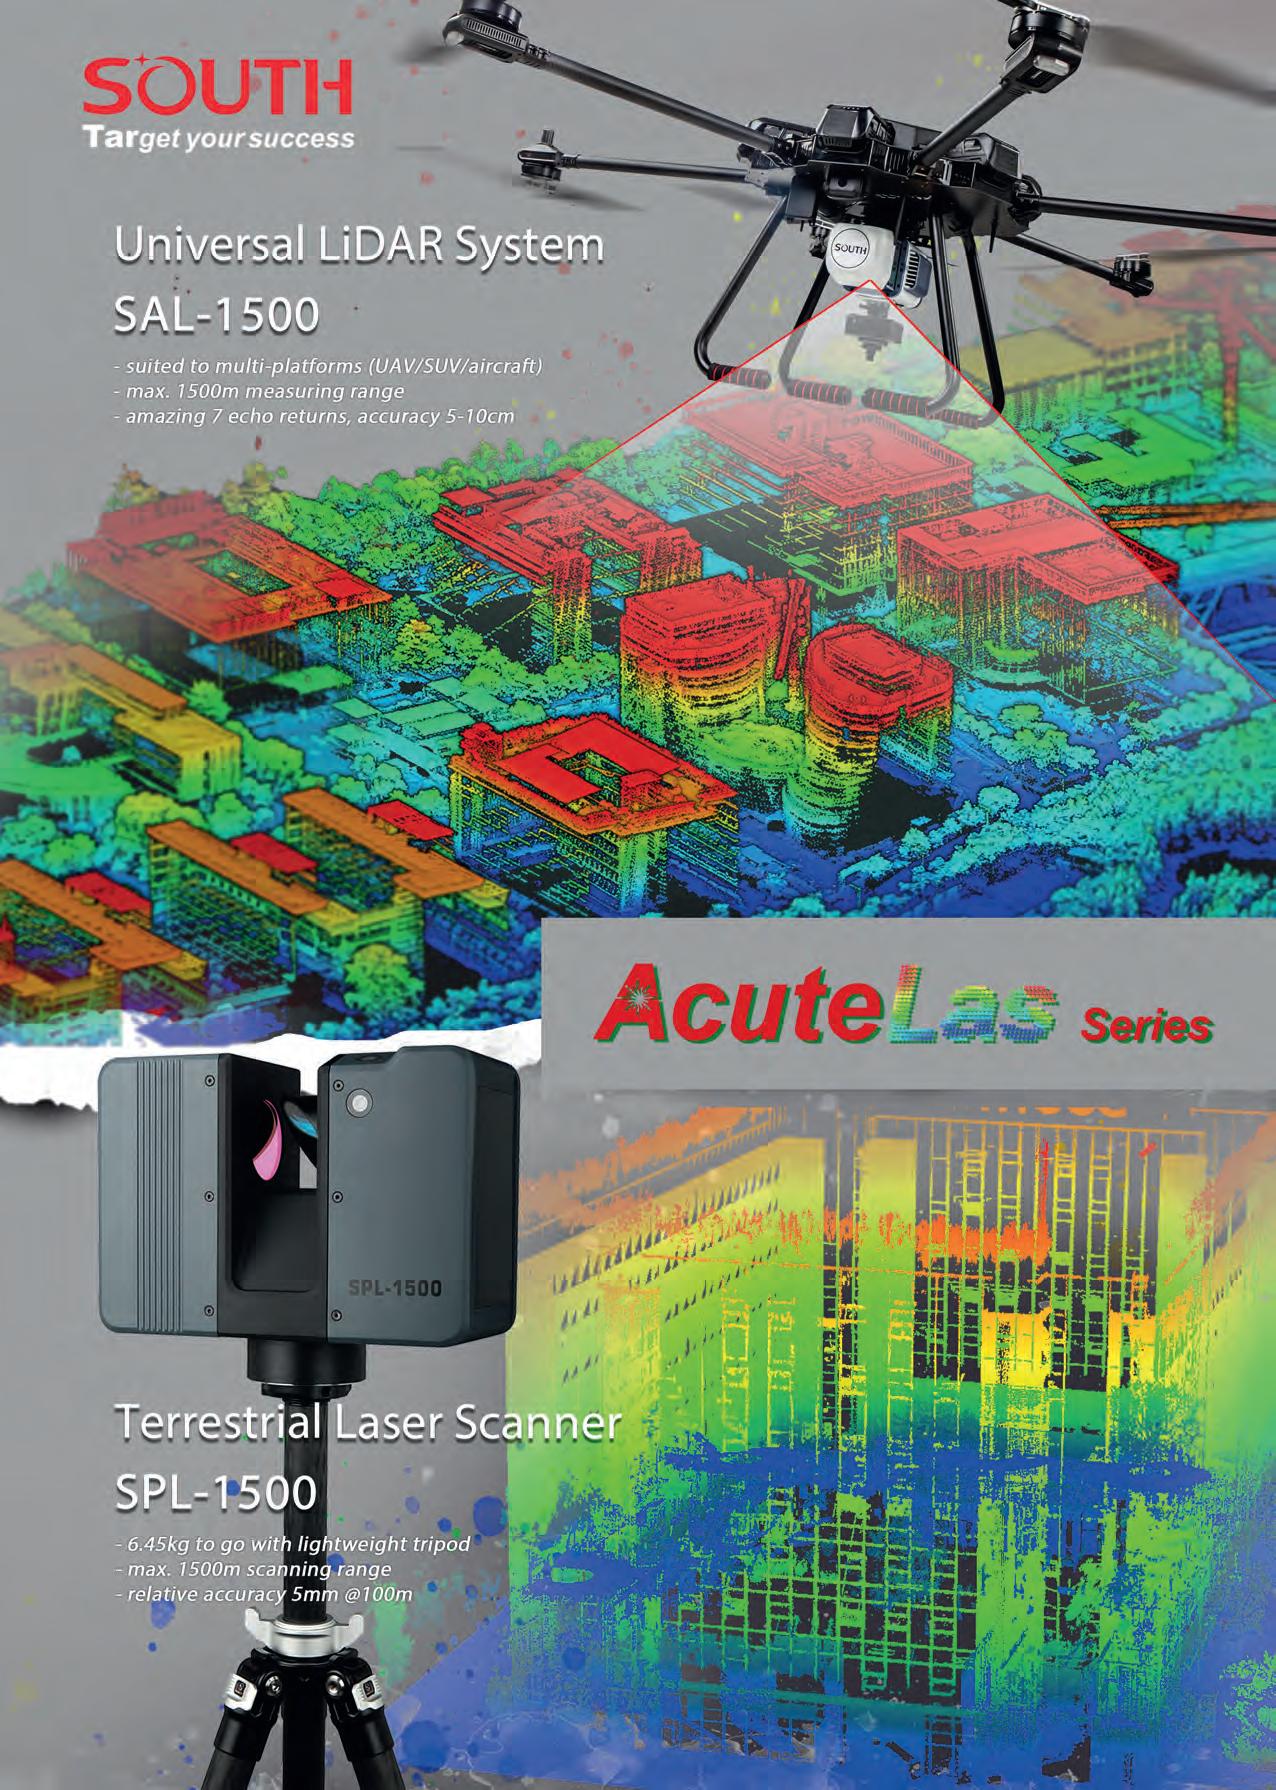 BY MEGHA DATTA AND SAKSHI SINGH, ASSOCIATION OF GEOSPATIAL INDUSTRIES, INDIA
KEY INSIGHTS FROM INDIA’S NATIONAL URBAN PROGRAMMES AND USE CASES
BY MEGHA DATTA AND SAKSHI SINGH, ASSOCIATION OF GEOSPATIAL INDUSTRIES, INDIA
KEY INSIGHTS FROM INDIA’S NATIONAL URBAN PROGRAMMES AND USE CASES
How India Leverages Geospatial Technologies for Urban Management
This article explores how some government initiatives in India are utilizing geospatial technologies for better outcomes. The rapid pace of urbanization in India has been an instrument of socioeconomic, political and cultural progress, but has also thrown in multiple challenges. Recognizing the need for efficient management of urban spaces, the government of India has responded with robust measures and programmes that leverage geospatial and other information technologies.
India’s inevitable transition in the 21st century from a predominantly rural society to a thriving urban society is beset with multiple challenges. These include heavy pressure on public utilities, poverty, unemployment and social evils (Figure 1). In its ‘Reforms in Urban Planning Capacity in India’ report published in September 2021, the NITI Aayog – India’s apex public policy think tank – highlighted that no Indian city features among the top 50 cities in global rankings.
KEY ISSUES FOR URBAN GOVERNANCE IN INDIA

Data fragmentation, obsolete and arbitrarily updated development control regulations as well as inadequate involvement of innovators and experts at the grassroots level is to blame. Added to these factors is the deficit of human resource capacity at the lowest rungs of urban governance, where the actual fieldwork has to take place. Interestingly, such challenges are also behind the visible push for sustainable infrastructure development in the country, steering world-class urban systems with geospatial technologies as the keystone.
APPLICATIONS OF GEOSPATIAL TECHNOLOGIES IN INDIAN URBAN-SECTOR PROGRAMMES
The government of India is keenly liberalizing geospatial data collection and distribution in the country, and has drawn up a number of proposals including the Geospatial Guidelines,
Draft Geospatial Policy, Drone Rules and Remote Sensing Policy. These conducive steps are helping to unleash the technology’s true potential and giving the geospatial sector a much-needed boost. Several national initiatives within the urban domain that are leveraging geospatial technologies in India are outlined below.
1) Smart Cities Mission Launched in 2015, the Smart Cities Mission
sustainable environment, and the application of smart solutions in a hundred cities.
Geospatial Applications
• Proposed preparation of 40-layer GIS mapping of all cities.
• Smartnet knowledge-sharing platform launched for exchange between cities, practitioners, academia, researchers and technologists.
Slums on the shores of the metropolis of Mumbai against the backdrop of skyscrapers. (Image courtesy: Andrey Armyagov/Freepik)
FEATURE 41ISSUE 6 2022 | INTERNATIONAL |
ICCCs were transformed into COVID-19 war rooms to deal with the pandemic response.
• Information on food distribution centres, shelter homes and kitchens collated and made accessible via Google Maps.
• A Geospatial Management Information System (GMIS) – a ‘smart cities dashboard’ – containing data of 100 cities and 6,000 projects was launched to collate information from varied sources, compare performance between cities, monitor progress and predict project milestones.
• India Urban Observatory: a GIS-enabled interactive showcase of multi-parameter city insights. Data is collected through Internet of Things (IoT), APIs, open-source databases, sensors and third-party sources including citizens and social media.
• National Urban Digital Mission (NUDM) was launched in February 2021 with an array of digital infrastructure and tools for smart cities, including:
• Smart Cities Open Data Portal (SCODP): Single-point data-sharing platform for open datasets enabling smart city stakeholders to generate actionable insights.
• Smart Code: To serve the software development demand of cities developing data and solutions for various urban problems.
• India Urban Data Exchange (IUDX): Easy-to-adopt open-source platform based on an underlying framework of openstandard APIs, data models, security, privacy and accounting mechanisms.
• Urban Platform for delivery of Online Governance (UPYOG): Aimed at helping municipal bodies improve service delivery mechanisms, information management and participative governance initiatives.
• Urban Outcomes Framework 2022: Aimed at developing a transparent and comprehensive database based on crosscity outcomes for time-series analysis and progress tracking.
2) Atal Mission for Rejuvenation and Urban Transformation (AMRUT)
Launched in 2015, the AMRUT mission focuses on 11 reforms and 52 milestones to be implemented by 500 mission cities in different states. The five focus areas of the mission are:
1. Water supply
2. Sewerage facilities and septage management
3. Stormwater drains to reduce flooding
4. Pedestrian, non-motorized and public transport facilities, and parking spaces
5. Enhancing the amenity value of cities by cleaning and upgrading green spaces, parks and recreation centres, especially for children.
Geospatial Applications
• Sub-scheme of preparation of masterplan using GIS launched with three major components: geospatial database generation, masterplan formulation and capacity building.
• Urban geodatabase to be created at a scale of 1:4,000. Final geodatabase of 104 towns and draft geodatabase for 104 towns prepared up until 2020/21.
• Sub-Scheme of Local Area Planning & Town Planning Scheme was launched on a pilot basis for 25 cities, involving detailed area survey, mapping of physical and social infrastructure on a GIS platform, land use mapping and ground penetrating radar (GPR) assessment.
Figure 1: Statistics reflecting the problems of urban development in India.
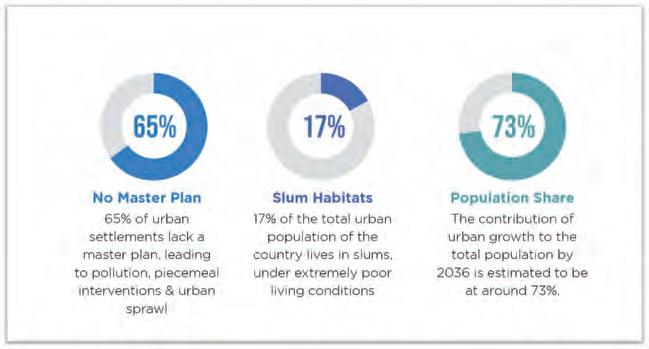
Figure 2: Key issues for urban governance in India.
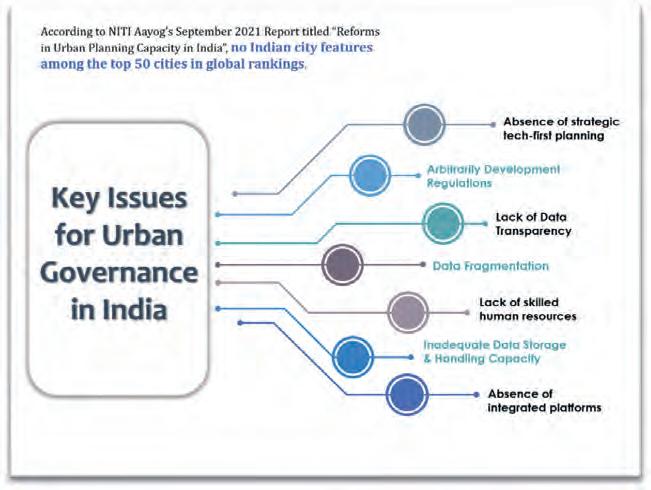
• AMRUT 2.0 proposes GIS-based masterplans for Class-II towns with populations of 50,000-99,999.
• Capacity building at three levels.
3) Swachh Bharat Mission (SBM)/Clean India Mission
Launched in 2014, Phase 1 of the Clean India Mission lasted until October 2019, while Phase 2 is being implemented until 2025 to help cement the work of Phase 1. The mission is aimed at achieving an ‘open-defecation free’ (ODF) India through the construction of toilets. The second phase of the mission aims to sustain the open-defecation-free status and improve the management of solid and liquid waste, while also working to improve the lives of sanitation workers.
Geospatial Applications
• Bharat Maps (India Maps) – a multi-scale, multi-resolution, multi-layer GIS platform built on a service-oriented framework by National Informatics Centre (NIC) launched
| INTERNATIONAL | ISSUE 6 202242
to integrate API-based OGC-compliant (WMS, WFS, etc.) map services with governance workflows associated with flagship government programmes, including SBM.
• Self-attested geotagged photographs being used for final verification of constructed household toilets. Photographs are uploaded to SBM (Urban) MIS and monitored by urban local bodies (ULBs) and states.
• A partnership between the Ministry of Housing and Urban Affairs (MoHUA), the government of India and Google to map all public/community toilets on Google maps including unique IDs.
• Compendium and dynamic GIS portal launched by MoHUA showcasing innovative practices for effective solid waste management (SWM) practices from across India.
• Cleanliness surveys entirely integrated with GIS in 2021 with two distinct components of data collection through mobile app and monitoring of the complete project progress.
4) Pradhan Mantri Awas Yojana (PMAY)/Prime Minister Housing Scheme
Launched in 2015, this scheme aims to provide affordable housing for first-time homeowners. The target is to build 20 million ‘pucca homes’ (solid or permanent dwellings) with basic amenities like gas, electricity and water by 2022.
Geospatial Applications
• Bhuvan-MoHUA Web Geoportal was developed to monitor the progress of the beneficiary houses at five different stages under the scheme.
• PMAY (Urban) Management Information
System integrated with BHUVAN Portal of NRSC and BHARAT MAP of NIC for monitoring the construction progress of individual houses through geotagging.
• Geotagging of photographs depicting the completed stage of construction used to deploy Direct Benefit Transfers to beneficiaries of the beneficiary-led construction vertical of the mission by states/union territories.
5) Urban Transportation
The National Urban Transport Policy (2006) and Metro Rail Policy (2017) have given impetus for states to develop integrated urban mobility options for citizens. As a result, many cities are working on metro rail projects. As of January 2021, India had 760.62 kilometres of operational metro lines and 540 stations.
A further 1,016 km of metro and rapid rail transport systems are under construction in 27 cities.
FURTHER READING
Geospatial Applications
• A digital twin with an asset management system implemented by Maharashtra Metro Rail Corporation Ltd to eliminate information loss over the project lifecycle.
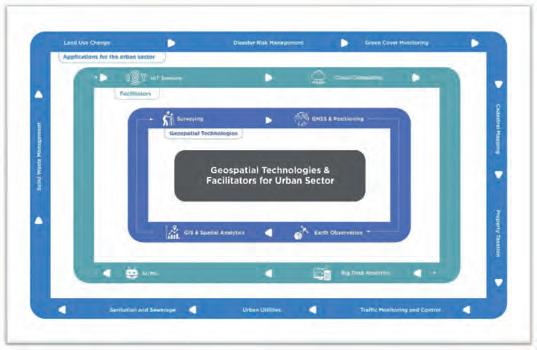
Location of each of the 500,000 assets recorded to enable single-click viewing on a map, leading to estimated savings of INR 1,658 crore (approx. US$2 million) over 25 years of operation of the metro rail system.
• Advanced mapping completed by Kochi Metro Rail Limited (KMRL) using Lidar and bathymetric surveys to study social impact assessment and water quality for canal regeneration project.
• 3D mapping of all stations undertaken by the Delhi Metro Rail Corporation (DMRC) to combat terror threats in the Delhi metro.
• DMRC and Google Maps collaborate to add metro routes, fares, platform details and connectivity information on the platform for passenger convenience.
Role of Geospatial Technologies for Urban Affairs in India, Association of Geospatial Industries, India, August 2022: https://agiindia.com/industry-reports/
VIDEOS
Overview of Urban Report by Mr Pramod Kaushik, president of AGI and MD of Hexagon India https://youtu.be/H3SLcwPn0DU
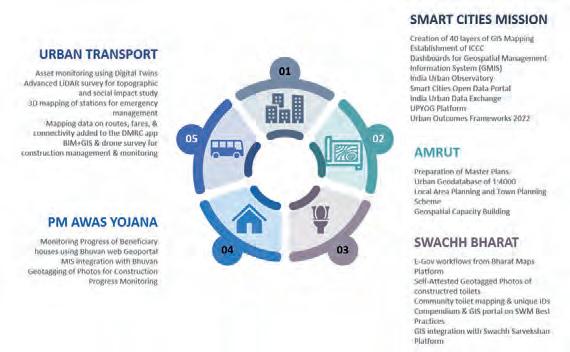
Address by Mr Mahendar Singh Tanwar, IAS, Municipal Commissioner, Ghaziabad Municipal Corporation: https://youtu.be/-brRGLr3g_w
Panel discussion on overcoming critical urbanization challenges with geospatial solutions: https://youtu.be/ZI7iK4EwDs0
Other recordings from AGI India Urban Meet (4 August 2022) – Why geospatial is fundamental to urban initiatives; from data to ecosystem approach: https://youtube.com/playlist?list=PLJZgK8nZr6CaKz83ncWwS8Z4v3D_s-p51
Figure 3: Geospatial technologies and facilitators for the urban sector. Figure 4: Major urban-sector programmes in India and the role of geospatial technologies.
FEATURE 43ISSUE 6 2022 | INTERNATIONAL |


• DMRC uses Revit and building information modelling (BIM) supported by drone surveys for generating accurate topographic maps with orthophotos, base maps and volumetric analysis to manage construction and assets.
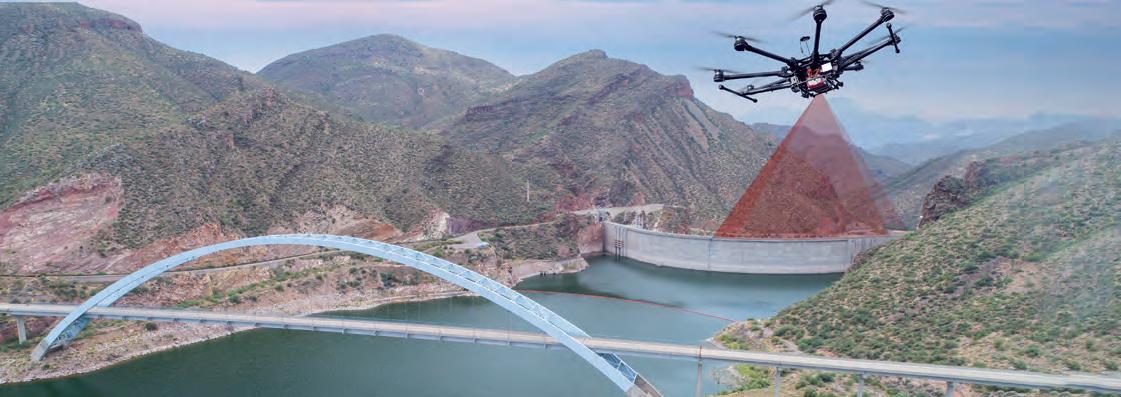
INSIGHTS AND WAY FORWARD
Together with a conducive policy regime, the government of India’s active adoption of geospatial technologies across urban governance programmes is significantly boosting the adoption of technology in the country. Urban stakeholders now need to ensure that the vision of a sustainable urban machinery is suitably backed by geospatial technologies from the bottom up. The need of the hour is a connected quality data ecosystem with efficient outcomes – one that is continually updated and shared with contributions from the industry, researchers and civil society. Urban officers need to be oriented on the larger value of geospatial technologies in both the short and long term. Efforts are also needed towards the capacity development of urban professionals
across levels to ensure better understanding, adoption, integration and implementation of geospatial technologies. Rather than being viewed in isolation, geospatial applications


need to be seen as a fundamental layer upon which to build key solutions. The industry must step forward and act as hand-holding agencies towards this vision.
Megha Datta has been associated with the geospatial industry for 19 years, where she has built strong relationships with national governments, development organizations, multilateral agencies and private industry to demonstrate the value of geospatial technologies for societal and economic growth. Megha has contributed to the global geospatial agenda through participation at the UN-GGIM: Private Sector Network. Currently, she works as the director of market development at the Association of Geospatial Industries in India, which is the apex industry-led not-for-profit body. She has a master’s degree in psychology from Delhi University.

Sakshi Singh is a content manager at the Association of Geospatial Industries in India, where she contributes to editorial curation and design, research and documentation, marketing and outreach, and stakeholder engagement through networking events, sessions and seminars. Sakshi also runs an independent pro-bono digital digest with a focus on leadership, sustainability and innovation in the Indian architecture, engineering and construction (AEC) industry. She holds a bachelor’s degree in architecture from the Indian Institute of Engineering Science and Technology (IIEST), Shibpur.

FEATURE 45ISSUE 6 2022 | INTERNATIONAL |
» Tactical grade IMU: 0.8°/h Gyro Bias Instability » Robust to Vibrating Environments » Post-processing with Qinertia PPK Software 0.02° RTK Roll/Pitch RTK/PPK Position 1 cm RTK Heading 0.06° Outstanding Performance/ SWaP-C www.sbg-systems.com JOIN US at Intergeo • Hall 3, Stand E3.024 QUANTA MICRO
A Journey into the New Reality
In which direction is the geospatial industry heading? Which core activities will companies focus on? How will the rapidly progressing technological advances shape the future? The recent edition of HxGN LIVE Global in Las Vegas formed an important hub for professionals who wanted to get a clear picture of what lies ahead in the field of mapping and surveying – and also, as became apparent during the event, increasingly outside of it.
Hexagon is unquestionably a digital reality solutions powerhouse, so it came as no real surprise that attendees were immersed in the very latest in sensors, software and autonomous technologies at the company’s flagship conference, HxGN LIVE Global 2022, earlier this year. Everything was dazzlingly showcased, with the packed auditorium being addressed by passionate Hexagon executives on a huge stage supported by stunning audiovisuals. The billion-dollar company’s vision of the future was interspersed with updates, product launches and other announcements. But what is the philosophy
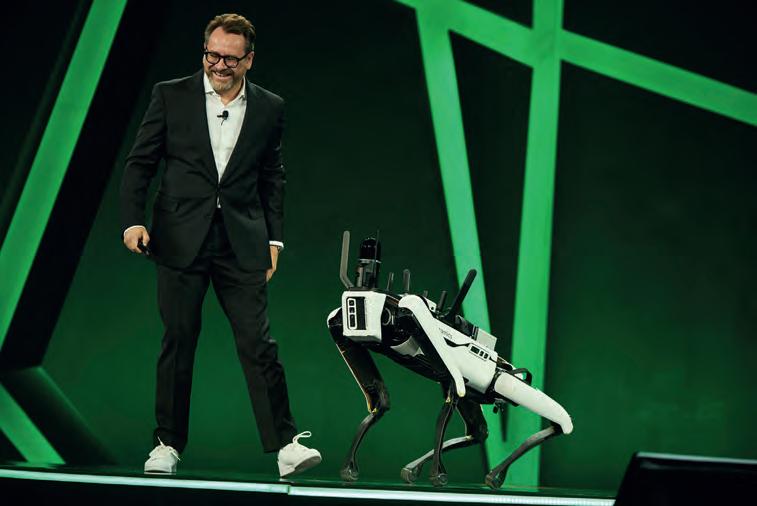
behind the technological developments, and how will they influence the surveyor’s work?
METAVERSE
HxGN LIVE Global 2022 was held at The Venetian Resort in Las Vegas, USA, from 20-22 June. The key buzzword this year was definitely ‘metaverse’. One problem with buzzwords is that they often conceal the real meaning rather than conveying it efficiently. However, in Las Vegas, the discussions fortunately went deeper. According to the Open Geospatial Consortium, the metaverse is “the internet transformed by real-time 3D
technologies, but the impact of real-time 3D is also transforming geospatial. In the metaverse, the real world and the internet will merge –and geospatial information and technology will be key to that combination.” In a keynote on this topic, called ‘Where the Metaverse Meets Business’, Hexagon CTO Burkhard Boeckem likewise emphasized that geospatial and the metaverse are intertwined. He described the metaverse as “a journey into the new reality” that is transforming the industry. That journey goes hand in hand with new technology created by Hexagon, he explained, as he zoomed in on all the ingredients needed to create a smart digital reality – ranging from advanced photogrammetry and remote sensing solutions enriched with artificial intelligence (AI) and robotics, to GIS and building information modelling (BIM).
SUSTAINABILITY
For this keynote, Boeckem was joined on stage by Erik Josefsson. He is CEO of R-evolution, Hexagon’s sustainable innovation and green-tech investment subsidiary aimed at reinventing and empowering the industry to address complex environmental risk. According to Josefsson, sustainability is “the biggest business opportunity of the century”. He backed up this statement with examples of digitalizing solar energy production and capturing data about CO2 in seagrass forests. Earlier that morning, Ola Rollén had hosted a breakfast briefing for the media representatives who were covering the event. Rollén, who from 31 December will be succeeded as president and CEO of Hexagon by Paolo Guglielmini, outlined four
Burkhard Boeckem described the metaverse as “a journey into the new reality” that is transforming the geospatial industry. (Photo: Gil Riego Jr)
| INTERNATIONAL | ISSUE 6 202246
IMPRESSIONS FROM HXGN LIVE GLOBAL 2022
BY WIM VAN WEGEN
major shifts that he believes will change the geospatial industry and the work of surveyors over the next decade: from purchase to subscription, from automation to autonomy, from fossil fuels to renewables, and from digital twin to smart digital reality. By ‘smart digital reality’, Hexagon means that a virtual model has the potential to be much more than merely a digital copy of the outdoor space. The interplay of static and live data sources together can show what actually happens in reality.
THE DEMOCRATIZATION OF GEOSPATIAL
Traditionally, the geospatial industry was dominated by land surveyors and GIS professionals. Based on data acquired using high-tech devices mounted on terrestrial, airborne or mobile platforms, they deployed their specialist knowledge and skills to locate and map real-world elements. The resulting insights were mainly used to support architecture, engineering and construction (AEC) projects or to solve land management challenges. However, recent technological advancements have made it easier to gather larger volumes of much more detailed and accurate geospatial data. Moreover, it is now possible to combine multiple data sources to create 3D models of environments, including buildings and other physical features – and even digital twins of entire cities – at a much lower cost than ever before. The wider availability of such data has opened up countless new possibilities for the application of geospatial solutions in a whole range of previously unexplored sectors. This democratization of geospatial has profound implications for the future direction of companies like Hexagon, and this became increasingly apparent during HxGN LIVE.
DIGITAL TWINIZATION
While the metaverse was a common thread running through the conference, many of the topics discussed during the numerous sessions were related to digital twins and the underlying geospatial technology. This makes sense, because digital twins can be regarded as an important building block of the metaverse in terms of making the physical world accessible in a virtual environment. But what does this mean in practice? How is ‘digital twinization’ benefiting everyday life and society in general? At HxGN LIVE, Hexagon’s long-standing experience of combining inputs from reality-capture sensors with advanced visualization software and tools to enable remote, location-based intelligence clearly shone through. The company demonstrated
how smart digital realities can be used to enhance on-site situations and activities, improving performance and efficiency.
For example, while working with an asset, mechanics and engineers can gain direct access to step-by-step instructions on how to repair it. This can help to streamline maintenance tasks while reducing material waste and re-work.
PEOPLE-CENTRIC
There is no doubt that digital technology is irreversibly changing the face of mapping and surveying. But despite the shift from automation to autonomy, skilled professionals are still badly needed. For instance, now that digital twins are moving to the forefront, they will increasingly be called upon to deliver meaningful information from the model back to the physical world. Therefore, in the midst of this celebration of some mind-blowing technological advancements – many of which sparked a truly enthusiastic reaction from the audience, who had travelled to Las Vegas from all over the globe – it was refreshing to see a people-centric message presented in one of the primetime sessions.
“In a world of technology, people make the difference,” said Thomas Harring, president of Hexagon’s Geosystems division, in a joint keynote together with Craig Martin, president of the company’s US/Canada and ANZ arm.

“Nobody knows what surveyors are doing, until they don’t do it anymore,” stated Martin. Their well-attended keynote focused on the need for a new generation of surveyors and geospatial experts, and how to attract them to the industry. They likened the surveying
profession to computer programming, which used to have a stuffy image; it was only for nerds. Now, many years later, programming has evolved into a hip and trendy job. So how can we ensure that surveying/geospatial data professionals become perceived as cool too? Harring concluded the session with a call to action for the industry: spread awareness and create enthusiasm. Does getting kids into surveying seem like an unattainable goal? Is it pointless to try to tempt more youngsters to study geomatics? To quote Ola Rollén during his keynote on ‘What Stands in the Way Becomes the Way’: “The day before something is truly a breakthrough, it’s a crazy idea.”
NEXT-GENERATION LASER SCANNER: THE NEW LEICA BLK360
Hexagon seized the opportunity of HxGN LIVE 2022 to announce the all-new Leica BLK360, designed to significantly streamline reality capture and facilitate the fast creation of meaningful deliverables. This advanced precision imaging laser scanner from Leica Geosystems is equipped with rapid scanning and visual inertial system (VIS) technology that automatically combines scans on-site. As a result, it takes just 20 seconds to capture a full Lidar scan with spherical images, making it more than five times faster than the original BLK360. The new BLK360 can be controlled using the Leica Cyclone FIELD 360 mobile app. Full data synchronization between Wi-Fi-enabled devices supports automated workflows, resulting in quicker production of complete datasets.
Ola Rollén kicked off HxGN LIVE 2022 with a keynote on ‘What Stands in the Way Becomes the Way’. (Photo: Gil Riego Jr)
GIM International’s Wim van Wegen got his hands on the all-new Leica BLK360 laser scanner solution during its launch at HxGN LIVE 2022.
47ISSUE 6 2022 | INTERNATIONAL |
A Change in the Future of High-risk, Critical Asset Inspections
Fast, Effective and Safe Aerial Power Line Inspection in a Fraction of the Time and with Real Cost Savings
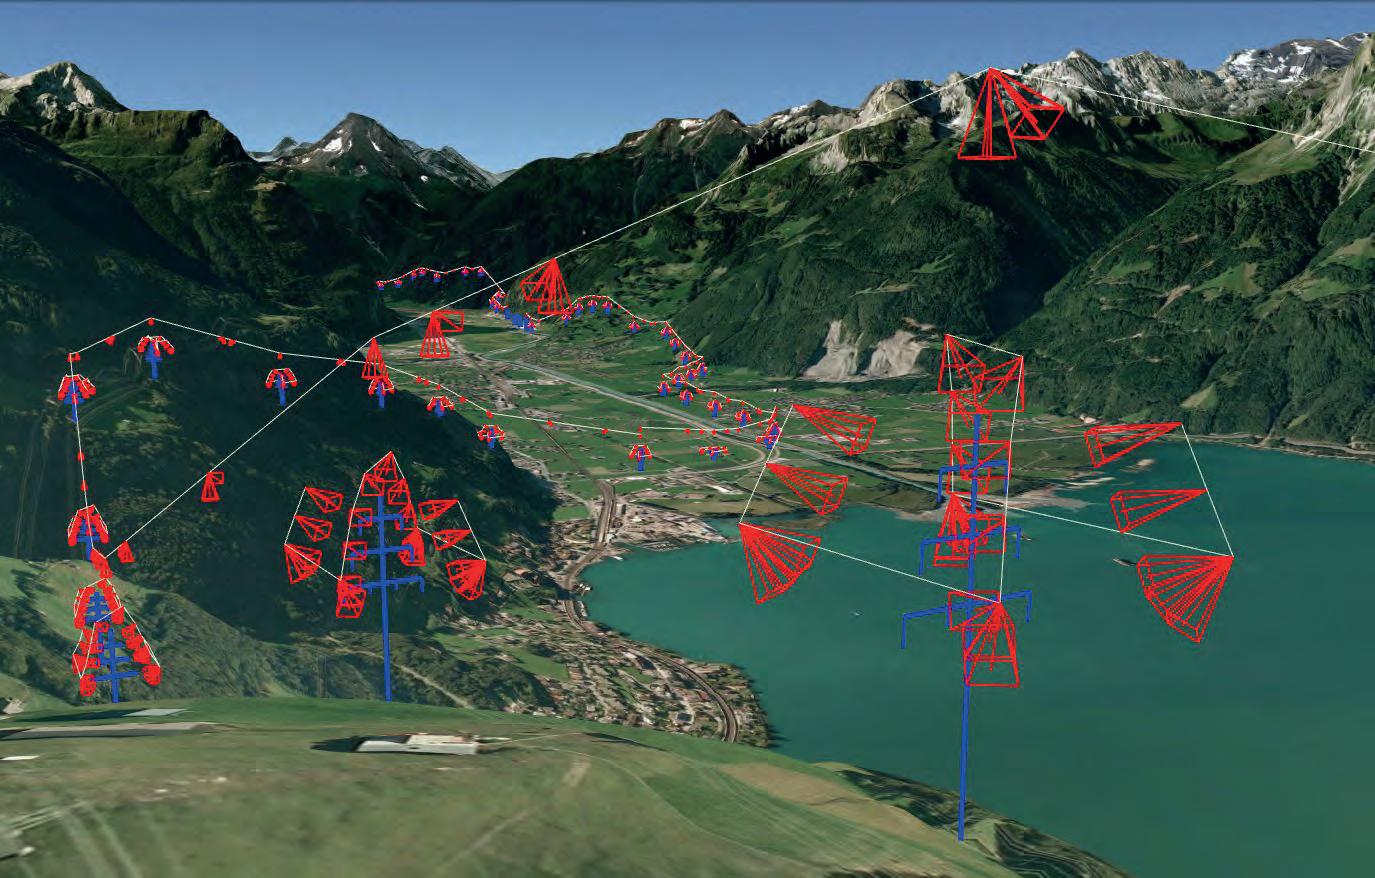
Mandatory asset inspection is crucial for utilities. Employees are often challenged with hard-to-access areas, heights or risky terrains. The traditional examination methods such as on-foot patrols, helicopters or industrial climbers are costly and time-consuming. Read more to learn how Axpo tackled these challenges by using the latest P3 Payload sensor technology from Phase One and LINIA’s drone software for automated power line inspection.
ENSURING SUPPLY AND SECURITY
People rely on their nation’s power supply. They like knowing that when they flip a switch or need to charge our phone battery, the power is there to make it work the way that they expect it to. Delivering that power to each house involves several thousand kilometres of power lines that make up the backbone of the power supply. But with power lines, there is a risk of failure. For the
power grid to keep supplying consistent power, companies must regularly check the power lines to ensure that there are no damaged areas that could cause failure in the future.
While these inspections were previously done manually by special visual inspection teams, this meant that employees were required to work at heights and in dangerous
circumstances. In addition, manual inspection not only resulted in huge logistical efforts using cherry pickers and cranes and created work grounding and periods of going off grid, but it also posed a great risk of occupational hazards. Thankfully, one way to make power line inspections safer and more efficient is the use of unmanned aerial vehicles (UAVs or ‘drones’), high-resolution sensors and drone automation software.
Figure 1: Example of a flight route (red/white) and a digital tower model (blue). The red pyramids indicate the direction and field of vision of the camera.
| INTERNATIONAL | ISSUE 6 202248
AXPO – PROVIDING CLIMATE-FRIENDLY POWER FOR SWITZERLAND AND BEYOND
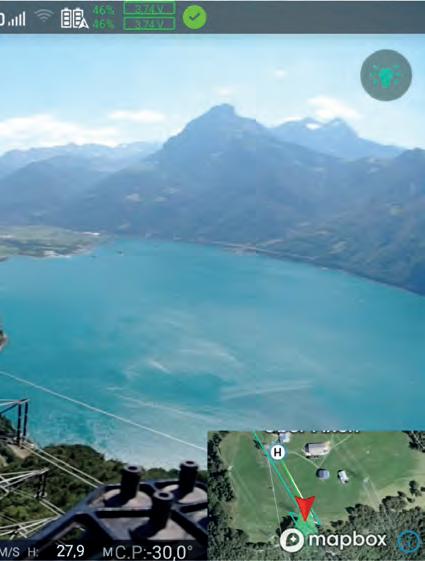
Together with its partners, Axpo operates more than a hundred power plants. The company’s climate-friendly Swiss electricity mix features reduced CO2 emissions and consists of hydropower, biomass, solar, wind and nuclear energy. Axpo is not only Switzerland’s largest producer of hydropower but also its largest producer of renewable energy, supplying customers with up to 3,200MW of capacity via a 2,200km distribution line (110, 50 and 16 kilovolts). Axpo has over 5,000 employees worldwide, over a hundred years of experience and operates in more than 30 countries.
TAKING THE NEXT STEP FOR A FASTER, SAFER AND MORE EFFICIENT INSPECTION
Stretching 2,200km with 7,500 masts, the Axpo distribution lines require a significant effort to regularly inspect all parts of the vast grid to ensure stability. In addition to masts, isolators and rooftops, inspection tasks also include bird protection hoods, wires and screws.
Before purchasing the Phase One P3 Payload with the iXM100 sensor, Axpo used common drones with standard sensors for asset
inspection. This was associated with several downsides, including time needed, unsafe distances to power lines and masts, and inadequate data quality.
To achieve a ground sampling distance (GSD) of 0.5mm/px, it was sometimes necessary to
maximum of just four images are needed to show the mast completely. Meanwhile, the high-resolution iXM 100MP camera provides a better and more detailed shot, while allowing the flight to be conducted at a greatly increased and much safer distance. Thanks to gaining distance without losing
fly as little as three metres from the systems, which posed a substantial safety risk. In addition, six or more images were needed to be able to fully inspect the concrete poles. For much larger transmission system operator (TSO) systems, at least twice the number of images was needed for a full inspection, plus the greater safety distances required made it impossible to achieve the necessary GSD of 1.0mm/px.
HOW PHASE ONE’S P3 CAN HELP TO STREAMLINE EFFORT AND IMPROVE QUALITY AND SAFETY
With the Phase One solution, Axpo can easily tackle these challenges. Firstly, a
the information on the image (in fact, more information is likely to be available), Axpo is able to use standardized flight patterns and thus improve both productivity and quality. The P3’s integrated laser rangefinder allows Axpo to exactly determine all distances and adjust them if necessary to ensure that the focus remains the same – even in the case of lattice masts, which have openings due to the lattice structure.
Thanks to the iXM 100MP, Axpo can now generate high-resolution and detailed photos with no loss of information when using the zoom function. These photos enable off-flight control and can also be viewed
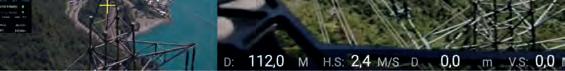
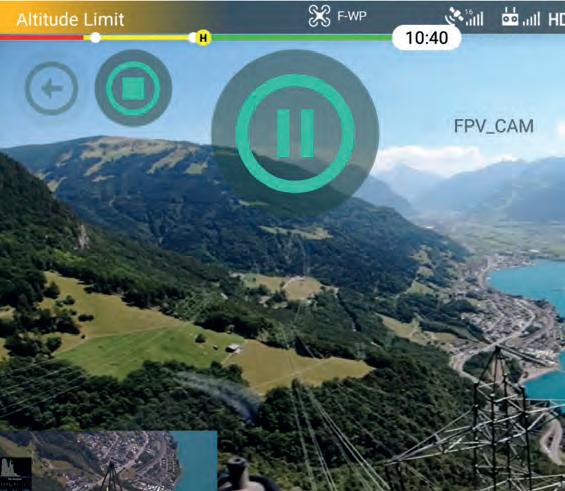 Figure 2: Screenshot from LINIAair with the main screen showing the view from the drone’s FPV cam. Bottom left: PhaseOne view. Bottom right: Map with flight route. The app allows toggling between different views.
ANOTHER BENEFIT OF THE P3 IS THAT THE SERVICE –FLIGHT AND EVALUATION – CAN NOW BE CARRIED OUT COMPLETELY IN-HOUSE, WITHOUT HAVING TO INVOLVE A THIRD PARTY
SPONSORED ARTICLE 49ISSUE 6 2022 | INTERNATIONAL |
again at a later point in time, enabling full documentation of the condition and development of the grid over time and offering in-depth insights into operational data.
Another benefit of the P3 is that the service – flight and evaluation – can now be carried out completely in-house, without having to involve a third party, again adding to efficiency and cost savings. While handling large volumes of image data initially posed a challenge for Axpo, the company has since decided on new approaches for data storage, display and image processing, further streamlining the workflow and efficiency.
LINIAAIR DRONE APPLICATION
ENABLES A FAST, STRUCTURED AND RELIABLE DATA ACQUISITION PROCESS
A drone pilot can easily capture data of a single power line tower. The challenge arises when a thousand or more towers need to be inspected in a short period of time. How can consistent, safe and well-structured data acquisition be ensured?
LINIA automatically calculates flight routes, b ased on digital line models (Figure 1). The drone app called LINIAair is designed to facilitate a smooth inspection process
SUMMARIZING THE BENEFITS
Effective maintenance
The P3 and the iXM 100MP sensor have put efficiency at the forefront of Axpo’s activities. The company can now capture a series of high-quality images from different angles, detecting technical malfunctions and determining the precise GPS location of the assets. This supports predictive asset assessments, minimizing maintenance costs and disruptions to service.
Faster restoration of power supply
Compared to traditional methods, Axpo can now significantly reduce the time it takes to identify the fault and restore power in case of outages. Utilities can clearly see the problem via the imagery data provided, pinpoint the location using GPS and start working on a solution.
Significant cost reduction
Inspections are significantly faster and much more cost-effective, since the userfriendliness of the drone minimizes the labour involved and the number of site visits by trained professionals. Additionally, preventive repairs avoid unwanted (and costly) shutdowns.
Improved asset management
Better observation, detailed and long-term documentation and timely preventive repairs of critical areas are all crucial for long-term asset management. By significantly improving the quality of inspections, Axpo can ensure it has all the information it needs to manage and operate a first-class working energy infrastructure.
Eliminating inspection hazards
With the P3, Axpo can now safely inspect assets at dangerous heights, in high-voltage areas and in hard-to-reach locations without putting employees at risk.
Figure 3: Metadata is included in the photo name as line/tower number, crossarm identifier and perspective.
| INTERNATIONAL | ISSUE 6 202250
(Figure 2). Brief instructions for drone pilots are sufficient to simplify the data capture process. On site, pilots select the corresponding flight routes on the drone app and press ‘Start’. The drone, equipped with Phase One’s P3, automatically captures data until the battery runs low. Even the lens focus is automated, which guarantees that there are no blurred photos. During the flight, the pilot’s main task is to monitor the drone and the surroundings in case of emergency. One pilot and one drone are sufficient to do the job, but line inspections are often performed with two people for safety reasons. In this case, to increase productivity, the team can split up during the flight (when the topology allows it), with one person monitoring the drone and the second one driving the car.
One advantage of automated drone flights is the speed aspect. Depending on the size of the tower, it takes between three and five minutes to capture 20-30 images of a single TSO tower (220/380kV) and two to three minutes for a DSO tower (110kV). This means that the photos of three TSO towers or four to six DSO towers can be acquired during a single flight with 15-20 minutes of airtime. Lorenzo Arizzoli-Bulato, founder of LINIA, states: “The daily capacity is limited by the time a pilot needs to relocate along the line. Last year, I once inspected 80 132kV-towers in a single day, although that was in very flat and easy terrain. In Alpine terrain the daily output is around 20 TSO towers per day, and in flat areas between 25 and 40 towers per day. These are good numbers, considering that manual drone inspection takes up to 20 minutes for a single tower, and this potential will further improve in the future when drones develop longer flight capabilities and the technology better supports BVLOS (beyond visual line of sight, Ed.) flights.”
However, speed is not the only advantage of automated line inspection. Other benefits include:
• Repeatability: The flight routes are repeatable in new inspection cycles. The images are very comparable because of the
same position and perspective. This enables predictive maintenance.
• Structure: There is a standard structure for how the images are acquired. This structure provides full coverage of the whole tower and makes all imagery look similar, which is helpful for further data analysis.
• Linking between photos and objects: The flight routes are based on digital line models. That connection is used to link objects, such as insulators, directly with photos. More specifically, each photo is renamed so that the name consists of information about the line, tower, crossarm and perspective (Figure 3). This metadata is used for further processing and enables proper data storage.
MORE INFORMATION
Phase One: Carsten Wieser, cwi@phaseone.com
Axpo: Kevin Geiger, kevin.geiger@axpo.com
LINIA: Lorenzo Arizzoli-Bulato, lorenzo@linia.ch
ABOUT PHASE ONE
• Safety: Assessing the distance between the line and the drone is very challenging from a remote position, so there is always the possibility of human error when flying the drones manually. LINIAair is designed for line men, which means that basic drone knowledge is sufficient to execute safe drone operations. Automated and approved flight routes minimize the risk of mishandling the drone and improve the overall flight safety.
Kevin Geiger, digital engineer drones at Axpo, comments: “Thanks to the Phase One P3, we can increase the efficiency of our power line inspections. We need fewer images, but we get more information and higher image quality. All this and more is available in our ‘Insights Inspection’ data dashboard which allows a detailed zoom function without loss of the high resolution. Moreover, the integrated rangefinder feature ensures precise and fast focusing on every shot, thus enabling better standardization.”
Phase One A/S is a leading researcher, developer and manufacturer of medium-format and large-format digital cameras, software and imaging solutions. Founded in 1993, Phase One is a pioneer of digital photography. The company has developed core imaging technologies and a range of digital cameras and imaging modules. Phase One provides the world’s highest image quality in terms of resolution, dynamic range, colour fidelity and geometric accuracy. As such, Phase One has grown to become the leading provider of high-end imaging technology across many business segments. This includes both hardware and software for aerial mapping, industrial inspection and cultural heritage digitization, as well as serving the world’s most demanding photographers. Based in Copenhagen, Denmark, and with regional offices in New York, Denver, Cologne, Tel Aviv, Tokyo, Beijing, Shanghai and Hong Kong, Phase One nurtures long-term relationships with customers, technology partners and its global network of distributors, often playing the role of digital imaging partner to customers with special requirements. It is with this passion for service that Phase One continually exceeds expectations and drives the imaging industry forward.
www.phaseone.com
ABOUT AXPO
Axpo is driven by a single purpose – to enable a sustainable future through innovative energy solutions. As Switzerland’s largest producer of renewable energy and an international leader in energy trading and the marketing of solar and wind power, Axpo combines the experience and expertise of more than 5,000 employees driven by a passion for innovation, collaboration and impactful change. Through cutting-edge technologies, the company innovates to meet the evolving needs of its customers in over 30 countries across Europe, the US and Asia.
www.axpo.com
ABOUT LINIA
LINIA, a Swiss startup based in Zurich, is on a mission to increase the security of supply of power grid operators. With integrated software solutions, LINIA enables a digitalized inspection process that raises the inspection quality, speed and structure to a whole new level. As a result, grid operators save money and CO2 by reducing tower climbs and helicopter flights.
THE PHOTOS OF THREE TSO TOWERS OR FOUR TO SIX DSO TOWERS CAN BE ACQUIRED DURING A SINGLE FLIGHT WITH 15-20 MINUTES OF AIRTIME
SPONSORED ARTICLE 51ISSUE 6 2022 | INTERNATIONAL |
TAKEAWAYS FROM THE TWELFTH UN-GGIM SESSION IN NEW YORK
Powerful and Multilateral UN-GGIM is Rescuing the SDGs
The twelfth session of the United Nations Committee of Experts on Global Geospatial Information Management (UN-GGIM) was held from 1-5 August 2022 at the United Nations headquarters in New York, USA. This year’s session drew delegates from 73 Member States, amounting to a total of 256 official representatives from all over the globe. A further 105 delegates attended the session as official observers to the UN-GGIM initiative, and an unknown number of viewers followed the sessions online. Over the past 12 years, UN-GGIM has established itself as the most overarching and multilateral body overseeing the implementation of geoinformation right at the heart of policymaking. Geoinformation will be key in achieving the Sustainable Development Goals, especially in the current times in which the Member States are facing numerous crises, including wars, economic uncertainty, climate change and the need to accelerate the energy transition.

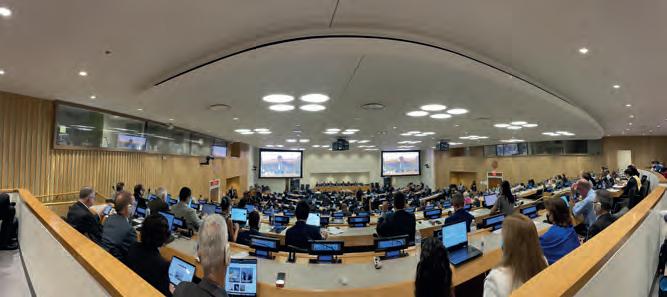
SIDE EVENTS
The 12 th session of the UN-GGIM Committee of Experts was divided into two parts. The first part of the week was packed with side events, such as meetings of the regional committees including UN-GGIM Europe, Arab States, Americas and Asia and the Pacific. There were also meetings for special interest groups, which included ‘Women in Geospatial’, ‘Bringing Land and Sea Together’, ‘Mobilizing Sustainable Funding’ and ‘Digital Twin: Best Practices and Recommendations to Governments and Industry’. The side event on ‘The Future Geospatial Information Ecosystem’
generated a particular buzz, introducing the ‘geoverse’ as the all-encompassing system that could be even bigger than the metaverse.
FORMAL FRAMEWORKS
The formal part of the 12 th session started on the Wednesday and set out to cover 19 items in the space of three days. Co-chairs Ingrid Vanden Berghe (Belgium), Tulu Besha Bedada (Ethiopia) and Paloma Merodio Gómez (Mexico), helped by the wonderful staff from the UN-GGIM Secretariat, kept progress through the agenda items running smoothly and efficiently. The Integrated
Geospatial Information Framework (IGIF) is one of the key initiatives of the UN-GGIM. This framework, when implemented at country level, is an ambitious and forward-looking directive for Member States. UN-GGIM concluded that the IGIF continuously needs to be communicated to promote the positive outcomes and impacts that implementation of the framework will have at country level. An extensive library of IGIF case studies will help this process.
On the technical side, the Global Geodetic Reference Frame (GGRF) has been on the agenda for many of the past sessions. This has led to the plan to establish a Global Geodetic Centre of Excellence at the United Nations Campus in Bonn, Germany. This centre will be instrumental in addressing the needs of the international community in sustaining the GGRF. Relevant technical experts in Member States were urged to contribute to the centre in Germany in any way they can. Another framework developed by UN-GGIM, the Global Statistical Geospatial Framework (GSGF), has already been implemented in several Member States. Several delegates shared their experiences
| INTERNATIONAL | ISSUE 6 202252
KEY
during the 12 th session in New York, stating that the GSGF has been helpful in, for instance, their national census planning. One noteworthy plan came from the Working Group on Marine Geospatial Information, which is keen to address issues relating to the land/sea interface and coastal zones by integrating the maritime, terrestrial and cadastral domains.
THE ‘WHERE’
UN-GGIM is essentially about the ‘where’ of it all, and location was especially significant this year because it was the first time in three years that the delegates could gather again in person at the UN headquarters. Besides being a very productive meeting, the 12 th session of the UN-GGIM Committee
of Experts was therefore also a reunion of familiar faces – proof once again that while online meetings are good, ‘in-real-life’ ones are even better. The social aspect obviously plays an important role at the fringes of every conference and formal gathering, and the UN-GGIM is no exception. Both the Industry Reception and the Welcome Reception were very well attended and a nice way to conclude a day of knowledgesharing and debate.
FUTURE
The UN-GGIM had clearly listened to the Secretary-General of the United Nations, who earlier this year called on the international community to rescue the Sustainable Development Goals (SDGs) and make them
 BY BY DURK HAARSMA , GIM INTERNATIONAL
MAPPING FOR A SUSTAINABLE WORLD
The book titled Mapping for a Sustainable World, written by Menno Jan-Kraak, Robert Roth, Britta Ricker, Ayako Kagawa and Guillaume Le Sourd, and jointly published by the International Cartographic Association and United Nations, was introduced during the 12th Session of UN-GGIM. It offers guidelines for mapping cartographic datasets related to the Sustainable Development Goals. It introduces basic principles of map design and use, best practices and conventions, all with the aim of supporting understanding of the SDGs. The book, which contains almost 150 pages, is heavily illustrated with helpful examples of maps. It is divided into four sections: on SDGs and Geospatial Data, Map Design Considerations, Maps & Diagrams, and Map Use Environments. This publication is intended as a reference work for everybody in the field of making or using SDG-related maps to help create a sustainable world. The book was distributed in printed format during the UN-GGIM session, and is available as a download via the following link: https://digitallibrary.un.org/record/3898826.
It is unfortunately not possible to report on all 19 agenda items here. To read more details about all the topics covered during the 12th session of UN-GGIM, go to: https://ggim.un.org/
a top priority in these uncertain times of pandemic, war and economic insecurity. The transformational role of geospatial information in overcoming data gaps and data (un)availability was repeatedly mentioned in the debates. Member States were urged to implement the frameworks that UN-GGIM has been developing over the last few years, not only to meet national priorities but also to measure and monitor the SDGs. In that sense, it is fitting that the government of India is hosting the Second United Nations World Geospatial Information Congress, based around the theme of ‘Geo-enabling the Global Village: No one should be left behind’, from 10-14 October in Hyderabad. The 13th session of the UN-GGIM will be held at the UN headquarters in New York in early August 2023.
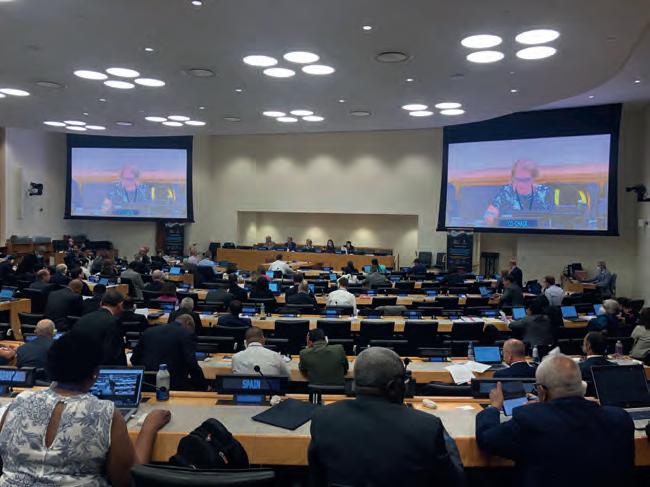
REPORT 53ISSUE 6 2022 | INTERNATIONAL |
Top New Features in Global Mapper Pro v24
Established as an advanced and comprehensive geospatial software, Global Mapper Pro excels in terrain analysis, point cloud editing, drone-collected image processing and much more. Recent versions of the programme have worked to broaden this functionality to include Python programming language integration, assisted manual classification with Point Cloud Segmentation and manual elevation grid editing with Terrain Painting. Version 24 of Global Mapper Pro continues this work by expanding workflow optimization methods, the Lidar analysis toolset and vector and point cloud advanced analysis and data creation methods. Check out the main new and exciting features in Global Mapper v24 below.
SCRIPT BUILDER
Global Mapper Script, a proprietary and textbased method to automate workflows, is not new to Global Mapper. However, in Global Mapper Pro v24 a new Script Builder tool makes the creation of workflow scripts more accessible. Through this new tool, Global Mapper Script commands are recorded based on tools used in the Global Mapper Pro user interface.
Enabled from the File menu, the Script Builder records actions and steps taken in the Global Mapper Pro user interface, transforming movements and tool setups to Global Mapper Script. Each command recorded by the builder appears as a line in the dockable tool interface and provides the user with options to edit individual parameters or open a sequence

of commands in the Script Editor for manual editing and saving.
Along with the new tool for Global Mapper Script building comes a button option to Copy Script, now appearing in many analysis tool dialog boxes. This new option works separately from the Script Builder but allows users to copy the script command with parameters and values that mirror the tool setup applied in the Global Mapper Pro user interface. This new option dispersed throughout the Global Mapper Pro analysis tools again increases the ease with which users can begin using Global Mapper Script to optimize workflows.
VARIOGRAPHY AND KRIGING
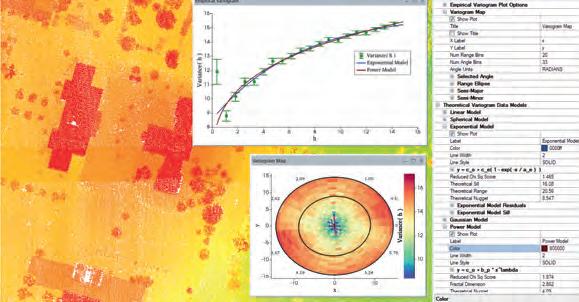
By recording actions taken in the Global Mapper Pro user interface, the Script Builder helps create a Global Mapper Script for a workflow.
An advanced method for data densification and prediction, the Variography and Kriging tool in Global Mapper Pro v24 is opened from the Analysis menu. Consisting of multiple dockable windows, the Variography and Kriging tool first displays an empirical variogram for the input vector point or point cloud data, allowing the user to select the input attribute used in the analysis as well as granting full control over the variogram plot through the tool settings. After plotting the calculated variance throughout the dataset, a variogram map and associated values can be displayed and explored.
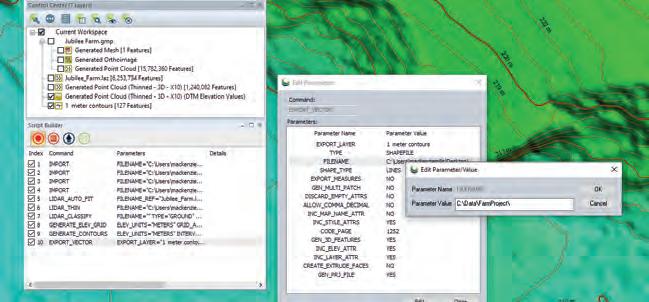
The Variography and Kriging tool in Global Mapper Pro accepts point cloud or vector point data as an input.
Moving toward the kriging process and data creation, a number of theoretical models are then fitted to the data-driven empirical variogram plot, and users can compare the calculated values and formulas to determine the best fitting theoretical model to use in generating krige estimates. Using the selected theoretical data model, derived
| INTERNATIONAL | ISSUE 6 202254
The kriged estimates are generated as a point cloud with options to generate a gridded layer and mesh.
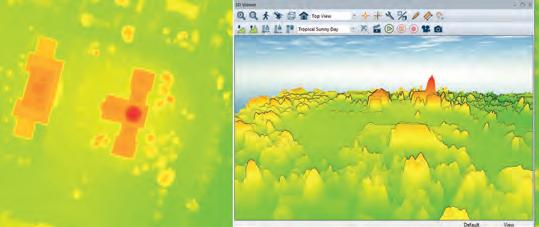
from the input data variance, a kriged prediction layer is created in the workspace containing the estimates alongside an uncertainty measure for each point. With the output layers generated, the estimated values, referred to as generic values, and uncertainty can be visualized through the use of specialized Lidar Daw Modes.
MOBILE DATA MERGING
While Global Mapper Pro is a powerful application, it is an installed programme designed to run on a desktop or laptop that provides the necessary processing power for advanced operations. To use and collect data in the field, Blue Marble produces Global Mapper Mobile, a mobile app available on Android and iOS, as part of the Global Mapper Suite of programmes. In a previous release of Global Mapper, a new Mobile Data Management tool took great strides in streamlining the integration between Global Mapper desktop and Global Mapper Mobile with support for wireless data package transfer. Global Mapper Pro v24 takes this tool even further, introducing a data merging component that assists users in combining collected data from multiple Global Mapper Mobile Package (*.gmmp) files.
Designed as a data merging tool, the Package File Import tab of the Mobile Data
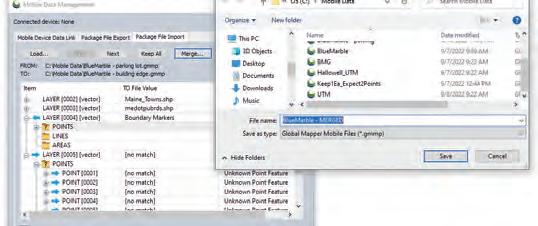
A new Package File Import tab in the Mobile Data Management tool allows users to more easily merge data from two different package files.
Management tool in Global Mapper Pro prompts the user for two files, one to pull data from and the other to merge data to. With the files selected, a table view shows users the differences between the designated FROM and TO files tracked by unique GMMID values generated in saved package files from Global Mapper v24 and the latest version of Global Mapper Mobile.
Clearly marked by icons in the list of data items, users are able to make decisions about differences between the TO and FROM files, marking which entries to keep and discard from each input package file. With all differences resolved, the data can be merged and exported to Global Mapper Mobile Package (*.gmmp) format before being loaded into the open workspace.
SWATH SEPARATION IMAGE CREATION Adding to the set of Lidar analysis tools available in Global Mapper Pro v24 is Swath Separation Image creation. A functionality requested by users of Global Mapper Pro, the Swath Separation Image tool is found on the Lidar toolbar and generates an image of a point cloud showing the vertical separation between overlapping collection swaths or layers. The generated image depicts the intensity value of the point cloud and shades overlap areas
with specific colours to display separation at designated vertical offset thresholds.
A simple to execute tool, Swath Separation Image creation in Global Mapper Pro v24 aligns with the USGS base Lidar specification and automatically exports the generated image to GeoTIFF (*.tif), JPG (*.jpg), JPG2000 (*.jp2), ECW (*.ecw) or PNG (*.png) format at a user-specified location. The saved file is then automatically loaded into the Global Mapper workspace, allowing the swath separation to be explored for data quality assurance purposes.
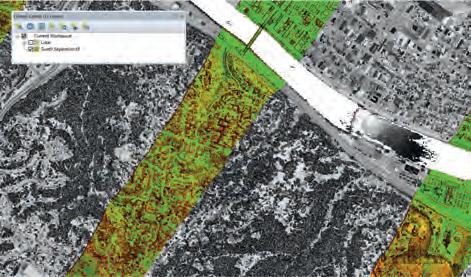
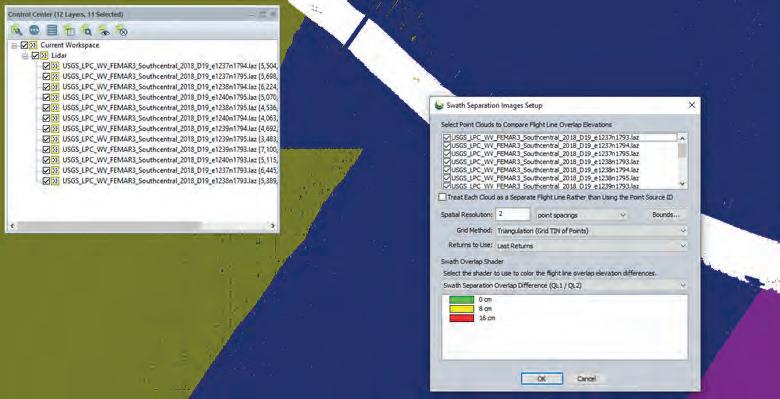
Providing users at all skill levels with advanced tools, Global Mapper Pro continues to be an affordable all-in-one GIS software solution. As a programme used throughout many industries, the new tools available in version 24 are sure to increase the indispensability of Global Mapper Pro as a tool for teams worldwide.
To check out the exciting new functionality in Global Mapper Pro v24, download a free 14-day trial from www.bluemarblegeo.com today! If you have any questions, please contact us!
A swath separation image is created in Global Mapper Pro from layers of Lidar data. The generated swath separation image uses designated colours to show the vertical offset between Lidar swaths.
SPONSORED ARTICLE 55ISSUE 6 2022 | INTERNATIONAL |
DISCOVERED BY TIGER SHARKS, VALIDATED BY TECHNOLOGY
How Airborne Bathymetric Lidar Helps to Protect Marine Environments
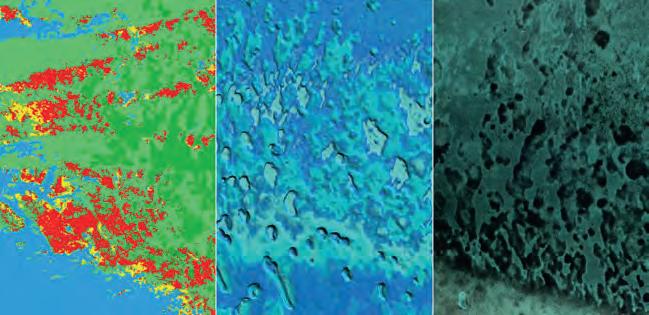
Hexagon is working with Beneath The Waves, a conservation NGO, to help protect marine environments in the Bahamas. Using bathymetric airborne Lidar solutions, researchers are able to map, study and quantify the region’s endangered seagrass ecosystem. This process can determine the extent, composition and condition volume of seagrass, allowing the team of researchers to plan conservation of the ecosystem as a ‘blue carbon’ habitat. This project will potentially launch one of the world’s most impactful nature-based mitigation efforts while protecting biodiversity in the Caribbean islands.
R-evolution, Hexagon’s sustainability business venture, is leading the way in accelerating the transition to a sustainable global economy by identifying and attracting capital to finance business opportunities that benefit the environment and society. For one project, R-evolution takes advantage of cutting-edge airborne bathymetric solutions from Leica Geosystems, part of Hexagon, to promote decarbonization, the protection of coastal ecosystems and the preservation of biodiversity.
The world has seen an exponential increase in carbon emissions, resulting in drastic changes to the climate and threatening life on Earth. Carbon sinks are one powerful resource nature has at its disposal for keeping carbon
dioxide levels at bay. For too long, however, the carbon discussion has centred around land-based carbon sinks, such as forests, while neglecting the biggest and most global storage depot on Earth: the ocean.
BLUE CARBON HABITATS
‘Blue carbon’ ecosystems refer to coastal and marine vegetated habitats – such as seagrass meadows, salt marshes and mangrove forests – that sequester and store carbon from the atmosphere and ocean. Seagrass, in particular, captures carbon dioxide more efficiently than land-based forests do. Moreover, since most carbon is stored in soil and sediments, it can remain there for millennia if left undisturbed. Nevertheless, despite their crucial role in mitigating climate
change, seagrass meadows remain among the least recognized and least protected ecological habitats. The lack of data on the distribution of seagrass meadows poses a significant obstacle to conservation and restoration efforts.
SHARK STUDY REVEALS UNEXPECTED INSIGHTS
In the Bahamas, home to a large seagrass ecosystem and also a designated shark sanctuary, scientists were studying sharks’ movements on behalf of the conservation NGO called Beneath The Waves. Their research unexpectedly revealed that tiger sharks spend a large portion of their life patrolling and foraging dense seagrass meadows. Using this insight, the organization leveraged a combination of sensor-tagged sharks, satellite data, marine vessel surveys and scuba divers to further investigate and map the extensive seagrass meadows of the Caribbean. This mapping project was an essential first step in learning more about the little-known ocean habitat. However, to protect and restore the blue carbon sinks, the conservancy’s findings needed to be validated with high-positional accuracy and datasets that can provide efficient, year-on-year change detection and monitoring.
Mapping large areas with vessels, divers and sharks is such a long and resource-heavy
elevation model (middle) and machine learning generated a sea-bed classification raster (right).
| INTERNATIONAL | ISSUE 6 202256
process that it is not an option for largescale projects. To map, study and quantify the threatened seagrass meadows of the Caribbean islands at scale, Beneath The Waves teamed up with R-evolution. This sustainability business venture leverages airborne bathymetric Lidar technologies from Leica Geosystems, part of Hexagon, to capture details about the vital habitat, including its extent and composition.
Bathymetric surveying supports environmental monitoring by mapping and classifying submerged vegetation and habitat to assess aquacultures and study marine ecology and hydrodynamics.
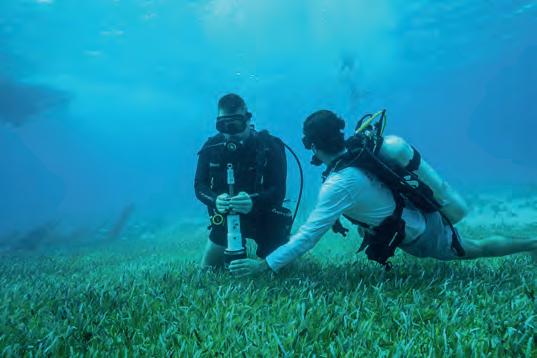
THE BENEFITS OF AIRBORNE SURVEYS

Airborne surveys could improve the efficiency, resolution and accuracy of the mapping process, covering the same area in just a few days and thus offering a more time-efficient and cost-effective solution. Because it is easily repeatable, it also forms an excellent basis for year-on-year change detection and monitoring. In addition, Lidar point clouds provide 3D elevation and land classification information with higher positional accuracy and spatial resolutions compared to the data quality generated with, for example, satellite imagery. Airborne bathymetry systems are optimized for shallow-water data collection, so they are ideal for mapping seagrass which grows primarily in water depths of 30 metres or less.
Collecting high-quality bathymetric data with the Leica Chiroptera airborne Lidar sensor was routine for the team at Hexagon, but it was key to leverage that data to generate the insights required for this project. A development team had been researching ways to automate the processing of the acquired data. Apart from the bathymetric data the sensor collects, the initial project
team had other sources of information on hand: researchers on the vessel gathered luminosity data, the divers could provide information about the seabed such as the type of vegetation and collect coring samples, and the sharks that had been equipped with cameras provided additional photo imagery.
LOSS COMPENSATION AND NORMALIZATION
After the data capture, the bathymetric Lidar full-waveform information fused with image radiometric information from the Chiroptera sensor systems was compensated for losses in the atmosphere, water surface and water volume and thereafter normalized with the measured depth. The result was a high-resolution, consistent seabed dataset that included both radiometric and spatial information of the vegetation. By feeding this data into deep-learning artificial intelligence (AI) classification algorithms, the team were able to identify different seabed types, vegetation species and density. The sediment core samples provided information about the amount of carbon each vegetation type stores. By combining this information, they could map the carbon captured by the seabed automatically and at scale.
In December 2021, the team used the Chiroptera 4X to map the area. Leica
BY ANDY WADDINGTON, HEXAGON
Geosystems has since introduced the high-performance airborne sensor Leica Chiroptera-5, which offers a 40% higher point density, a 20% increase in water depth penetration and improved topographic sensitivity compared to previous generations so that future surveys of this and other regions will generate even more detailed hydrographic maps at even faster speed.
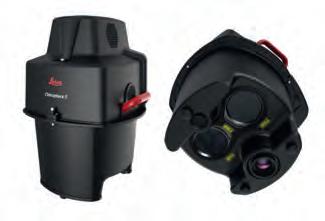
The preliminary results look very promising, and the team hopes that the accuracy and resolution of the bathymetric Lidar will provide an invaluable new data source for seabed carbon mapping. Combining the marine expertise of Beneath The Waves with the innovation and technological know-how of Hexagon, the collaborative project expects to yield groundbreaking results for blue carbon conservation and to potentially launch one of the world’s most impactful nature-based mitigation efforts. This offers an opportunity to protect biodiversity in the marine habitats of the Caribbean islands and generate new value streams simultaneously.
ABOUT THE AUTHOR
Andy Waddington, vice president of bathymetric services at Hexagon, is a hydrographer and an experienced mariner. During his 25 years in the Royal Navy he was active in the transition to multibeam echosounders, the universal adoption of GNSS as the primary positioning system and the introduction of ROVs as a major survey tool. Over the past ten years he has turned his attention towards other emerging survey techniques and has been involved in the development and operation of bathymetric Lidar, satellite-derived bathymetry and USVs.
 Leica Chiroptera-5 bathymetric Lidar system.
The R-evolution and Beneath The Waves team in front of the survey aircraft. Seabed sediment coring for analysis of carbon content.
Leica Chiroptera-5 bathymetric Lidar system.
The R-evolution and Beneath The Waves team in front of the survey aircraft. Seabed sediment coring for analysis of carbon content.
FEATURE 57ISSUE 6 2022 | INTERNATIONAL |


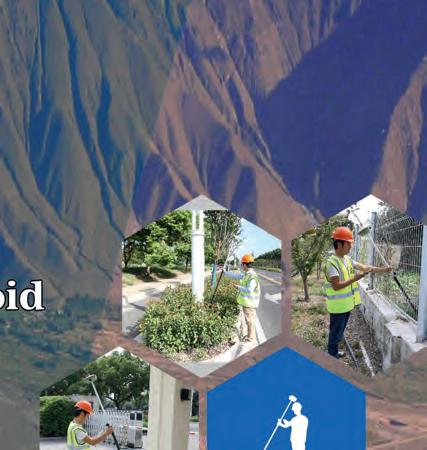
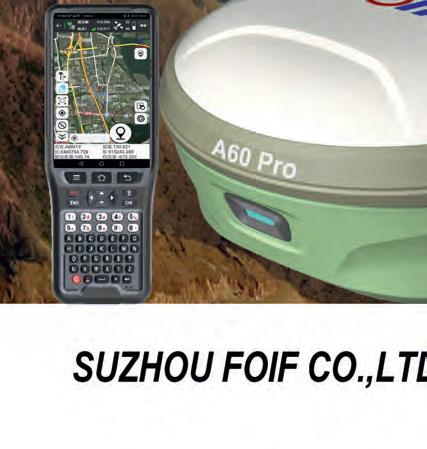
 BY MARK D. MCCOY, SOUTHERN METHODIST UNIVERSITY, USA
MAPPING THE MONUMENTS AT A ROYAL CENTRE
BY MARK D. MCCOY, SOUTHERN METHODIST UNIVERSITY, USA
MAPPING THE MONUMENTS AT A ROYAL CENTRE
Lidar Data Reveals Hidden History of Hawaiian Islands
A mapping project combining terrestrial and airborne Lidar has helped to reveal the largest structure built in the Kingdom of Hawai‘i. The Kealakekua Royal Centre, constructed in 1640 and known to have been used by King Kamehameha in 1810, had remained hidden in plain sight for centuries.
In 1810, the king of Hawai‘i Island, Kamehameha, cemented his legacy in history by becoming the first to rule over all the islands in the archipelago. For centuries, the Hawaiian Islands had been divided into four or five independent kingdoms, each with their own ruling family. An island’s king, or queen, often moved their court around to different locations, but there were times, such as special ceremonies or when gathering an army to launch a campaign against a rival, when they needed to hold court in a single place. These special places were known as ‘royal centres.’
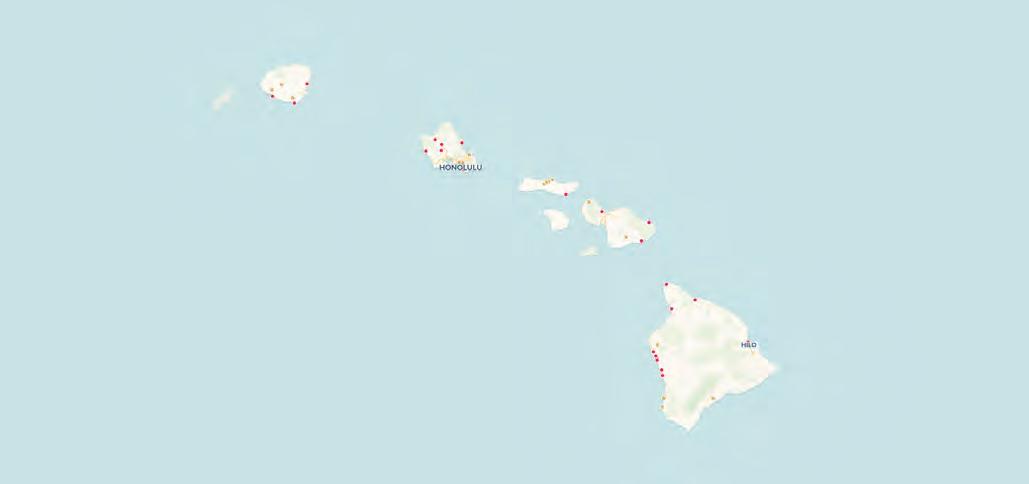
Today, royal centres are among our best windows into what society was like in the Hawaiian Islands centuries ago, but they
are rare. It is estimated that only about two dozen royal centres were built. Each had a unique layout, but commonly included massive temples, special locations set aside for gatherings such as for sports or feasts, and residential precincts for the royal family and their entourage. The care for these sites likely fell to priests who held a great deal of authority in old Hawai‘i and sometimes had their own special precincts.
The monuments at royal centres suffered damage over the years. After the unification of the islands, a capital was established in Honolulu. In 1819, religious practices were abolished by royal decree and the priestly class was disbanded. While there was active and passive resistance to this
decree, royal centres were likely damaged in an iconoclasm that targeted all types of religious symbols. In the years that followed, the care of these places fell mainly to the local community. Since the 1960s, there has been a push to repair and reconstruct royal centres as a way for contemporary people to better appreciate the grandeur of Hawaii’s traditional architecture. At the Pu‘uhonua o Hõnaunau Royal Centre, for example, the US National Park Service, along with traditional stewards, has restored examples of buildings created by carefully stacking unmodified stone supporting wooden poleand-thatch structures. The largest of centre’s reconstructed architecture is the ‘Great Wall.’
In its fully reconstructed form, it is 305m long and 5.2m wide by 3.6m tall. The wall likely
Figure 1: Map of the locations used as royal centres before the unification of the Hawaiian Islands into a single kingdom in 1810.
FEATURE 59ISSUE 6 2022 | INTERNATIONAL |
served many purposes including to demarcate an especially sacred area.
KEALAKEKUA ROYAL CENTRE
Another royal centre was based in Kealakekua Bay on Hawai‘i Island’s west coast, where Captain James Cook ordered the two ships under his command to drop anchor in 1779. When he did, he had no idea it would become the setting for his veneration, on par with the treatment of the island’s king, followed soon after by his own death. We know a great deal about this dramatic early contact between Hawaiians and Europeans, some of which occurred on and around the important temple known as Hikiau Heiau. The setting for the brief encounter is described in Western accounts as well as a
few sketches, and a map focused on the bay and shoreline.
Unfortunately, the Kealakekua Royal Centre was slow to gain the attention of cartographers, leaving major architectural elements – including a Great Wall around Hikiau Heiau – poorly, or incompletely, described. In 1883, more than a century after Cook’s visit, Lt. George E. Gresley Jackson, an officer of the Hawaiian Royal Navy, mapped Kealakekua Bay with an eye toward capturing some of the features of the then-abandoned royal centre. His map shows a massive wall south of Hikiau Heiau. A 1906 map by the Bishop Museum’s John Stokes shows the wall as two-sided and located west and north of the temple. It was
not until the 1980s that archaeologists from Hawaii’s State Parks made a complete field map of the Great Wall at Kealakekua. By that time, even the best intact sections of the wall were collapsed and covered in thick vegetation, with some damaged or destroyed by development.
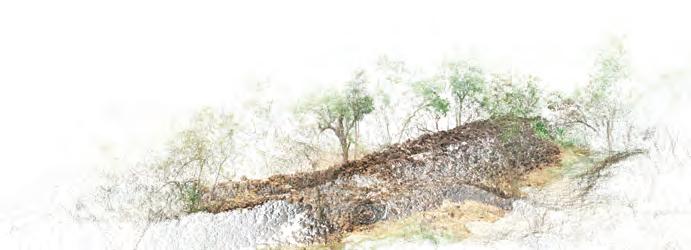
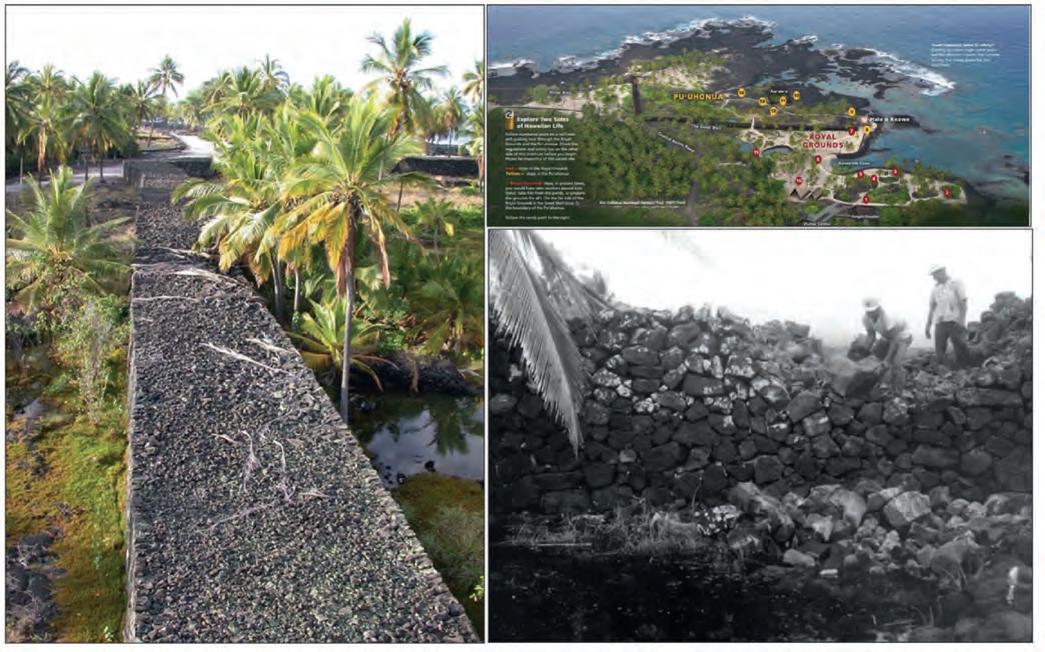
MONUMENTS AND ANCIENT SOCIETIES
One of the puzzles that has drawn archaeologists to the Hawaiian Islands has been the question of why the ancient society that formed there, in relative isolation from cultures outside the Pacific, is so seemingly like others around the world? Why was it that when Cook stepped foot on Hawai‘i Island, he was greeted by a king whose role in society, and power over his subjects, was not unlike
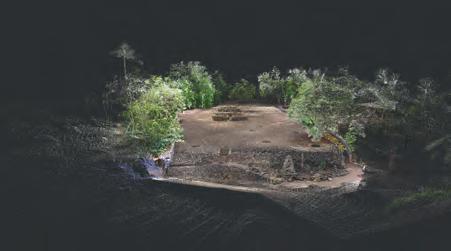 Figure 3: Terrestrial Lidar of the temple Hikiau Heiau at Kealakekua. (Image courtesy: Sketchfab)
| INTERNATIONAL | ISSUE 6 202260
his own monarch in the United Kingdom?
Archaeologists rely on physical evidence to reconstruct the past and so will often look to the remains of monuments as one avenue to try and account for the similarities, and differences, between societies living in different times and places. But, for the Hawaiian Islands, the uneven documentation and preservation of royal centres presents a challenge for making these kinds of comparisons.
LIDAR: A POWERFUL TOOL FOR DOCUMENTING MONUMENTS
A group of archaeologists, motivated by the need for a more complete archive of the monuments in Hawaii’s royal centres, decided to use Lidar to map Kealakekua. The project was led by the author together with Thegn N. Ladefoged (University of Auckland) and Jesse Casana (Dartmouth College). They received support from State Park archaeologists Tracy Tam-Sing and Martha Yent and, crucially, worked in collaboration with Ho‘ala Kealakekua, a 501(c) non-profit community group. At first, terrestrial Lidar was used to create a realistic 3D model of Hikiau Heiau – a stone platform close to the size of a football field – and well-preserved sections of the massive wall that surrounds the temple. Next, an unmanned aerial vehicle (UAV or ‘drone’) mounted with Lidar was flown to determine the extent and current condition of features at a much higher resolution (30 points per square metre) than previously piloted airborne Lidar (one point per square metre). Finally, small careful excavations were conducted at the base of Kealakekua’s Great Wall to try and place its construction on the larger timeline of Hawaii’s cultural history.
RESULTS
Combining three sources of Lidar data –piloted airborne Lidar, UAV-Lidar and tripod-mounted terrestrial Lidar – resulted in a complete and high-resolution model of the Great Wall at Kealakekua. But this surface model told only part of the story. Excavations on either side of the wall showed that the lowest courses of stone were obscured, buried by years of soil erosion building up next to the wall. In addition, a substantial amount of the upper courses of stone had fallen over the years, and some had become buried. It was only after accounting for these buried portions of the wall and other sections removed due to development that a clear picture of the true size of the wall emerged. The project, which had begun with the modest intent of creating a modern map of a royal centre, unexpectedly revealed the largest structure built on the island in the period before Cook’s visit: the Great Wall at Kealakekua was more than 3m tall, 5m wide and 400m long.
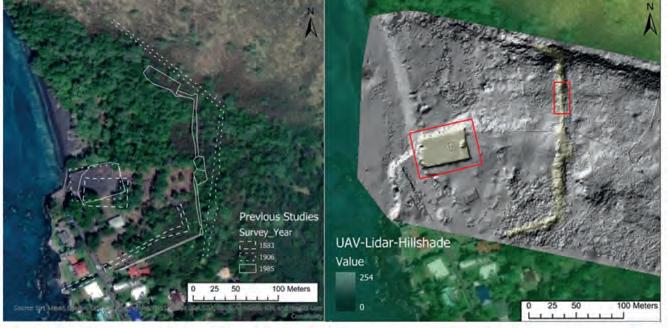
The question of when Kealakekua’s impressive architecture was completed has been a matter of speculation. Excavations under the Great Wall uncovered remnants of everyday life: charcoal from cooking fires, small fragments of animal bone and shell, and broken tools made of stone. These deposits may represent houses that had to be cleared to make way for the wall. Radiocarbon dating of charcoal from under the wall and other deposits that had accumulated on top of the wall suggests that construction began around AD 1640. Based on this date, along with the Lidar survey, we can say with confidence that, when it was built, the Great Wall at Kealakekua required more stone material to construct than any other structure on Hawai‘i Island.
SIGNIFICANCE
A geospatial revolution is underway in archaeology, spurred on by a constellation of technological advances and especially the application of Lidar. As Lidar becomes a regular part of the archaeologist’s toolkit, it is contributing to a better, more complete archive of the physical remains of the human past. Even in a place like Hawai‘i, where the locations of royal centres are already well-known, Lidar has proven its value for effectively and efficiently mapping monuments in a fashion that makes it possible to make comparisons within and beyond the islands.
FURTHER READING
Kirch, P.V. with M.D. McCoy. (2023) Feathered Gods and Fishhooks: The Archaeology of Ancient Hawai’i. Second edition. University of Hawaii Press.
McCoy, M.D. (2020) Maps for Time Travelers: How Archaeologists Use Technology to Bring Us Closer to the Past. University of California Press.
McCoy, M.D., Casana, J., Hill, A.C., Laugier, E.J., Mulrooney, M.A. and T.N. Ladefoged. (2021) Unpiloted Aerial Vehicle Acquired Lidar for Mapping Monumental Architecture: A Case Study from the Hawaiian Islands. Advances in Archaeological Practice 9(2):160–174.
Map of the locations used as royal centres: https://markmccoy.carto.com/builder/e9e34295-babd48d6-9aca-5b645bd94d44/embed
Terrestrial Lidar of the temple Hikiau Heiau at Kealakekua: https://skfb.ly/6YSFw and https://skfb.ly/6UXGr
ABOUT THE AUTHOR
Mark D. McCoy is an anthropological archaeologist and an expert in the use of geospatial technology in archaeology, including geographic information systems, laser scanning and remote sensing. His research centres on the development of ancient societies on Pacific Islands, especially Hawai‘i and New Zealand, and the relationship between people and their island environments. He is an associate professor in the Department of Anthropology at Southern Methodist University, USA, and before that faculty at San Jose State University in California, and the University of Otago in New Zealand. He holds a PhD in Anthropology from the University of California, Berkeley, as well as an MA from the University of Auckland in New Zealand and BA from the University of New Mexico. mdmccoy@mail.smu.edu
 Figure 4: The UAV-based Lidar survey clearly shows the current state of the largest structures at the Kealakekua Royal Centre: the temple site Hikiau Heiau and the Great Wall. Red box shows areas where terrestrial Lidar was used to measure the volume of stone used in constructing monuments. (Image courtesy: McCoy et al. 2021)
FEATURE 61ISSUE 6 2022 | INTERNATIONAL |
Get More out of Hydrographic Survey Missions
Withtheadditionofamobilelaserscannerfor3Ddataacquisitionabovethewaterline
Hydrographers are increasingly aware of the added value that a Lidar (Light Detection and Ranging) scanner can bring to bathymetry survey operations. The Teledyne Optech Polaris Laser Scanner, for example, has a mobile option that enables it to be mounted to a moving platform, such as a survey vessel, to record 3D point clouds above the waterline. At the same time, the multibeam echosounder sensors collect the underwater topography. Obtaining such data simultaneously, with a seamless join between the above and below waterline point clouds, is becoming a priority for some hydrographic agencies, who need to accommodate coastal management and monitoring demands associated with factors such as climate change and sea-level rise.
“The Lidar delivers precise data that is complementary to the type of data that is usually collected by a survey boat,” says Travis Hamilton, product manager at Teledyne Geospatial. “Really, it’s combining the acoustics and the optics; both are point clouds, and the data that comes out of them is very similar, so you get a fuller picture above and below the waterline.” Looking at a bridge, for example, both above-water details and the supporting piles underneath can be brought into focus, without bringing in a new workflow and with minimal investment in terms of operator and equipment time. The result is a more efficient data acquisition overall.
SAFETY FIRST
Beyond the efficiency gains, use of a laser scanner has safety benefits. Mapping nearshore features such as rocks and shoals traditionally requires surveyors to go out in a small launch with a handheld GPS. The job can be dangerous due to turbulence and rocks, and yields low-resolution results because of the limited number of points they can feasibly obtain. “Instead of having just a few GPS points around the perimeter, now with Lidar you can have a point every centimetre effectively, resulting in much higher detail.”
Range is another advantage of using a laser scanner from a survey vessel. With the Optech Polaris, the coastline can be mapped from a distance of up to 2 km. This
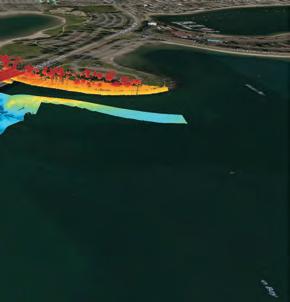
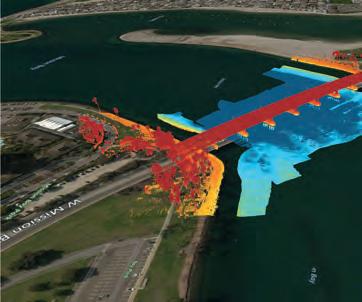
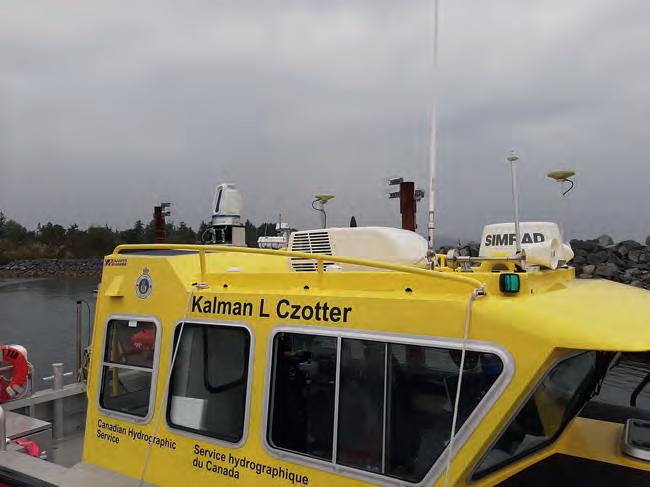 Example installation of the Optech Polaris laser scanner on a coastal survey vessel. Image courtesy of the Canadian Hydrographic Service.
Example of combined multibeam and lidar coverage of a bridge and adjoining shoreline in Mission Bay, California. The Optech Polaris is equally capable as a terrestrial scanner (static or mobile) and can be used for additional scanning for complete coverage on the topside of the bridge.
Example installation of the Optech Polaris laser scanner on a coastal survey vessel. Image courtesy of the Canadian Hydrographic Service.
Example of combined multibeam and lidar coverage of a bridge and adjoining shoreline in Mission Bay, California. The Optech Polaris is equally capable as a terrestrial scanner (static or mobile) and can be used for additional scanning for complete coverage on the topside of the bridge.
| INTERNATIONAL | ISSUE 6 202262
is considerably farther than the 100-300 m offered by some systems on the market. The ability to work from afar is particularly useful where the seabed has a very gradual slope, making it hard to get close. “You can stay out in safer waters and still be able to rely on the Lidar to pick up, for instance, rocks and shoals,” says Hamilton. It’s as simple as aiming the laser scanner at the shoreline or field of interest while the vessel is conducting the multibeam sonar operations.
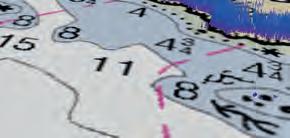
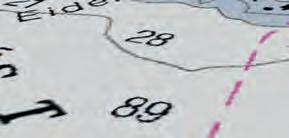
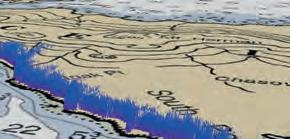
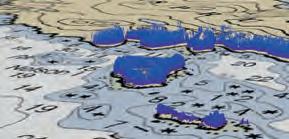

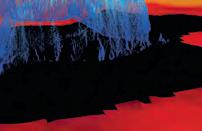
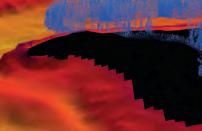
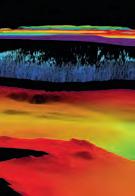
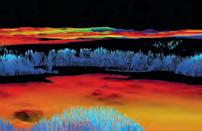
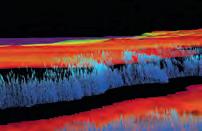
WORKFLOW INTEGRATION
“It’s actually quite easy to integrate into current workflows if you have a multibeam survey vessel because the auxiliary equipment you need is already there,” says Hamilton. The main external components are a Global Navigation Satellite System (GNSS) and Inertial Measurement Unit (IMU) to provide position, motion and timing information. Because that equipment is all part of a multibeam echosounder setup, the Optech Polaris can just make use of the existing sensors. For the physical setup, the operator needs only to find a suitable place to mount the Optech Polaris – usually on top of the survey vessel – and then attach the three provided cables for power, timing and an ethernet link to the ship’s network.
The Optech Polaris was originally designed for engineering measurements on land, so it is survey grade. That means it offers much greater accuracy and resolution than many systems designed for marine use, which are mapping grade. It collects 54 vertical lines of data per second – equivalent to the approximately 50 swaths per second collected by a high-end multibeam
echosounder. With its unique oscillating mirror scanner, the scan rate of the Optech Polaris can be increased by reducing the vertical field of view to provide high resolution even at higher survey speeds. When integrated on a marine survey vessel, the unit is fully controlled through dialogue boxes in the data acquisition software.
DIFFERENT PHYSICS, BUT AN ALMOST IDENTICAL END PRODUCT
Though the physics of collecting the acoustic and optical data is different, the end product is almost identical. That means data from the Optech Polaris fits into the same workflows that operators are already using for the marine data. The same software and the same types of processes are applied. “The acquisition software is already running on the vessel for the multibeam data. The operator just needs to add an additional device for the Optech Polaris. There are no big hurdles or roadblocks to get up to speed on it,” says Hamilton.
BETTER THAN A DRONE
An alternative to the use of vessel-mounted laser scanners for shoreline mapping is aerial; for example, using a drone for data collection. However, this adds a whole other platform that has to be launched, bringing an entirely different workflow. “It’s definitely harder to manage the aerial data collection process, then try to integrate it with the multibeam data,” says Hamilton. “With Lidar on the vessel, the data is collected together and processed together. It is almost seamless.”
Teledyne Geospatial is part of Teledyne Imaging, a group of leading-edge technology companies united under the Teledyne umbrella. Teledyne Geospatial is made up of Teledyne Optech and Teledyne Caris. Travis Hamilton is the product manager for engineering survey solutions.

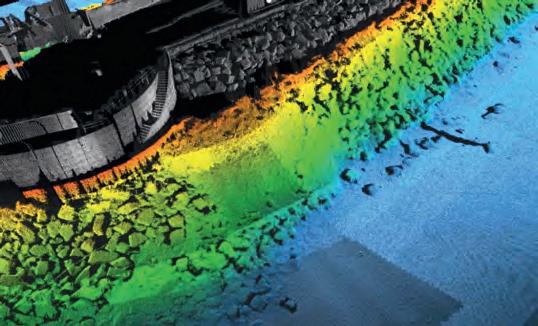 Combined Lidar scanner and multibeam dataset covering the harbour wall and erosion defences used for engineering inspection work. This image demonstrates how the two different sensors produce nearly identical products in terms of quality and resolution.
Example of Lidar scanner data along the coastline of Spruce Island, Alaska. Several small islands and rocks are also mapped in the Lidar dataset. Data is overlaid on a nautical chart, allowing existence and position of shoreline features to be verified. Chart and data courtesy of NOAA.
Example of combined multibeam sonar and Lidar scanner coverage around islands in a narrow inlet near Spruce Island, Alaska. Data courtesy of NOAA.
Combined Lidar scanner and multibeam dataset covering the harbour wall and erosion defences used for engineering inspection work. This image demonstrates how the two different sensors produce nearly identical products in terms of quality and resolution.
Example of Lidar scanner data along the coastline of Spruce Island, Alaska. Several small islands and rocks are also mapped in the Lidar dataset. Data is overlaid on a nautical chart, allowing existence and position of shoreline features to be verified. Chart and data courtesy of NOAA.
Example of combined multibeam sonar and Lidar scanner coverage around islands in a narrow inlet near Spruce Island, Alaska. Data courtesy of NOAA.
SPONSORED ARTICLE 63ISSUE 6 2022 | INTERNATIONAL |
 BY
BY
ASSISTANCE AND SOUND POLICYMAKING
GIS Data is Indispensable for UN Migration Agency
The International Organization for Migration is a heavy user of GIS data. Accessible, reliable and timely geospatial data is indispensable in its work in today’s fast-changing world, in which more than a hundred million people were displaced globally in May alone. Harnessing the power of geospatial data is not only essential for migration-related policymaking, but also to support informed decision-making and effective action on the ground in a humanitarian crisis.
The International Organization for Migration (IOM), which is part of the United Nations System, provides services and advice to realize humane and orderly migration for the benefit of all governments and migrants. Geospatial information systems (GIS) and data management are extremely important for IOM’s mission. “Geospatial data is completely linked into the fields of migration and internal displacement, which are entirely locationbased,” states Mohamed Bakr, geographical
information systems officer at IOM’s head office in Geneva, Switzerland. GIS tools have a broad range of applications for IOM, in particular for its Displacement Tracking Matrix (DTM) covering the whole world.
TRACKING DISPLACED POPULATIONS
The DTM is used to gather and analyse data to disseminate critical multi-layered information on the mobility, vulnerabilities and needs of displaced populations. The matrix
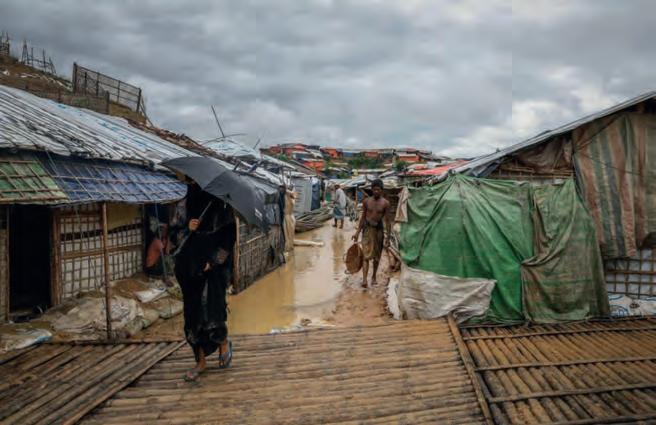
provides IOM and other stakeholders with evidence-based data so that they can make informed decisions about aid and recovery planning in affected communities. “We systematically manage geospatial information on human mobility patterns across the globe. With more than 7,000 data collectors and over 600 technical experts serving in over 80 countries, the worldwide presence of the Displacement Tracking Matrix is immense. Our published output – reports, maps and datasets – has been downloaded nearly 1.5 million times. It improves operational efficiency, especially in humanitarian crises in which reliable and up-to-date data on displacement dynamics can have lifesaving consequences,” he continues. Needless to say, GIS online visualizations display key results and indicators on easy-to-read maps and statistical products for a broad audience. For example, in response to the COVID-19 pandemic, DTM’s Geospatial Analytics team supported geospatial visualization of COVID-19 impacts on human mobility at global, regional and country levels.
Besides the DTM, geodata is also collected for IOM’s Missing Migrants Project, which was implemented in 2014 to document deaths and disappearances during migratory journeys worldwide. “Each location represents an incident of a migrant death or disappearance.
A refugee camp in Bangladesh. Elevation data from UAV imagery allows IOM to analyse shelters at risk from future floods and landslides. (Image courtesy: IOM)
FEATURE 65ISSUE 6 2022 | INTERNATIONAL |
BETTER CONTEXT-SPECIFIC
FRÉDÉRIQUE COUMANS, CONTRIBUTING EDITOR, GIM INTERNATIONAL
Migration routes are being monitored in several regions, including the Mediterranean route shown here. IOM has recorded a total of 25,000 migrants dead or missing on this route since 2014. (Image courtesy: IOM)
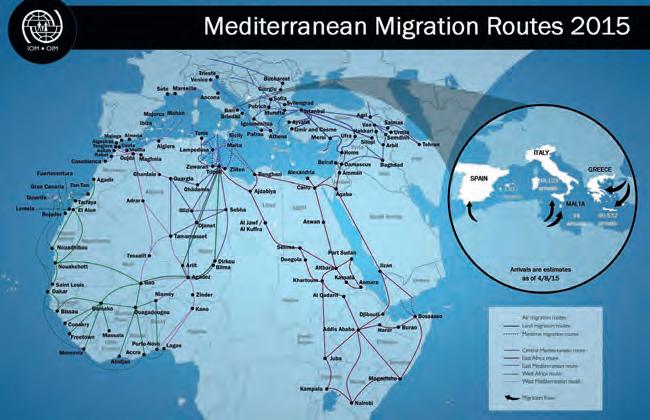
Each number represents a person, as well as the families and communities that they leave behind. The recorded geolocations of incidents are estimations, but they are key to mapping the risks that people who leave their homes in search of a better life face during their journeys,” says Bakr. “We recently reached the grim milestone of 50,000 recorded deaths during migration. The many data challenges of documenting deaths during irregular movements mean that many more remain undocumented.”
CHALLENGES
He and his 25 fellow GIS experts worldwide assist IOM’s operations by ensuring the effective use of systems and data infrastructure, especially during emergencies. It is also their responsibility to coordinate the DTM Central Data Warehouse and to ensure smooth data flow from different assessments and geospatial data collections to the IOM/DTM websites, geoportals and other applications.
There are specific data-management challenges to tackle since it often concerns regions where – certainly at that moment –the only geodetic data available is unreliable. “Fast territorial changes due to natural disasters or unavailability of official administrative boundaries make it difficult to have a solid base to collect and visualize data at the lowest administrative level,” explains Bakr. “We mostly work around this by developing operational boundaries to ensure data is collected with proper quality. These
operational boundaries are only for limited use for the purpose of informing the humanitarian community of the most accurate displacement and migration trends.”
Another special concern is the access to data about the actual situation. Satellite imagery and GIS maps are key to providing the disaster response teams with the necessary information for assessments and monitoring. Given the difficulty of obtaining the most recent, high-resolution imagery in a timely manner, it can be challenging for the teams on the ground to prioritize interventions and ensure effective response. “To tackle this, we request satellite imagery from different
providers at the same time, in the hope of having these images available for analysis as soon as the event takes place. In many cases we can foresee that they will happen, only we don’t know exactly when.”
REMOTE SENSING
In cooperation with other humanitarian organizations, Bakr and his team would like to put in place an infrastructure for utilizing remote sensing to support rapid response, risk reduction and planning in places that are not mapped or are in inaccessible locations. “We are very interested in the responsible implementation of remote sensing using UAVs (unmanned aerial vehicles, Ed.) and satellite imagery in combination with artificial intelligence and machine learning. That makes it possible to quickly disseminate information which enables decision-makers and aid workers to provide the migrating populations with better context-specific assistance,” he states. One example is a monitoring programme set up in Bangladesh which tracks needs and vulnerabilities through a broad information management framework. The locations where people found shelter during the recent flooding are tracked and mapped using machine learning (in collaboration with the United Nations Satellite Centre). The data for the map showing the temporary whereabouts is based on UAV imagery analysis. High-resolution elevation data from the UAV imagery has allowed IOM (in cooperation with NASA) to model future floods and landslides. “This will also enable us to analyse the shelters at risks in these areas and support adequate response.”
ABOUT THE INTERNATIONAL ORGANIZATION FOR MIGRATION
Established in 1951, the International Organization for Migration (IOM) is the leading intergovernmental organization in the field of migration. The organization is part of the United Nations System and counts 174 member states, 8 states with observer status, and offices in over 100 countries. The organization is dedicated to promoting humane and orderly migration for the benefit of all. It has a budget of US$2.5 billion and 17,761 staff operating across 523 locations. IOM assists in the search for practical solutions to migration problems and provides humanitarian assistance to migrants in need, including refugees and internally displaced people. Last year, despite the impacts of the COVID-19 pandemic, IOM’s humanitarian aid reached 31.7 million people. The organization also stands for the advance of international migration law, policy debate and guidance, protection of migrants’ rights, migration health and the gender dimension of migration.
This article is focused on GIS and IOM’s displacement tracking. In 2021, data on population mobility was collected, analysed and disseminated in 78 countries. With geospatial analysis of displacement and flow data, the Displacement Tracking Matrix (DTM) has resulted in the publication of over 2,400 reports, mapping products and datasets, and its products have been downloaded 1.5 million times. In addition to being systematically deployed in humanitarian response operations, recovery and return processes, the DTM is also highly effective as a preparedness tool, e.g. for mapping potential evacuation and displacement sites.
| INTERNATIONAL | ISSUE 6 202266
When asked about the priorities for next year, Bakr answers: “Priorities are ruled by what we see happening. But for us as geoinformation experts, we will pay special attention to providing live feeds of migration
trends and other relevant data into the UN Network Geospatial Data Hub. We will share our geospatial analytics methods with all UN agencies. This will strengthen the global availability of evidence-based geospatial
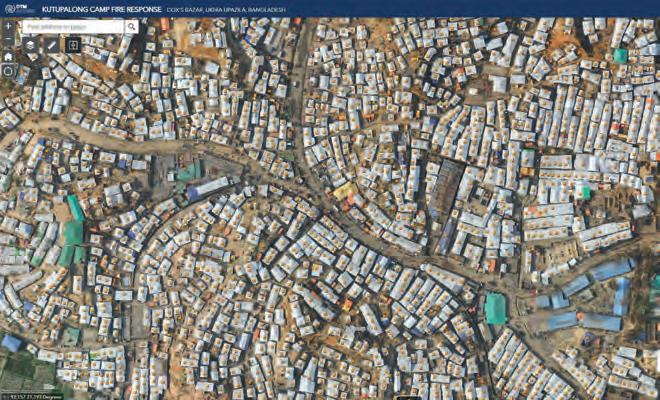
data on migration and displacement. If that enhances better-informed decisions, the positive impacts for migrants and society as a whole can be huge.”
FURTHER READING https://www.iom.int https://displacement.iom.int
ABOUT THE AUTHOR
Frédérique Coumans lives in Belgium and is a contributing editor for GIM International. She has been covering all aspects of GIS, spatial data infrastructures and data mining for nearly 30 years, including as editor-in-chief of various trade magazines. fcoumans@vbb.nl

 UAV imagery analysis can be used to identify and monitor new temporary camps (there are 7,604 shelters in this camp). Users can switch between maps from different dates to track the evolution over time. (Image courtesy: IOM)
FEATURE 67ISSUE 6 2022 | INTERNATIONAL |


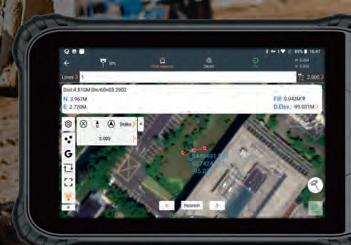
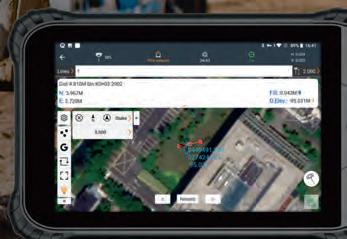


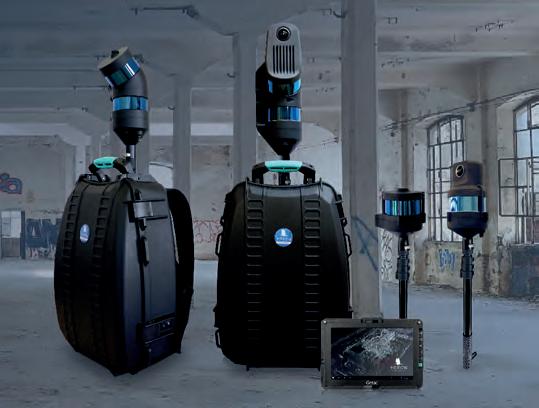


Nationwide Digital Twin Generated in Three Days with VELOCITY 5D
A national mapping agency in Europe needed to create a 3D digital twin of its entire country from a collection of geospatial data in varying scales and formats. A primary goal of the project was to build a repeatable, automated workflow to rapidly produce new digital twins in the future to identify and visualize changes in infrastructure and terrain resulting from unexpected events, either natural or man-made.
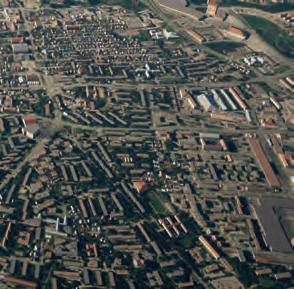
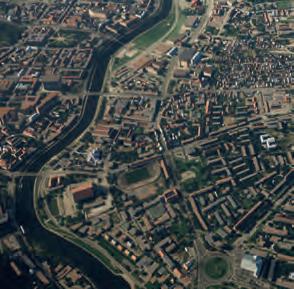
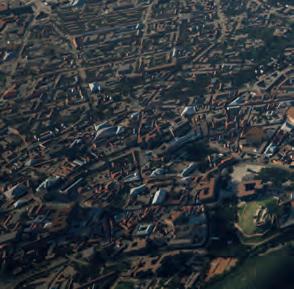
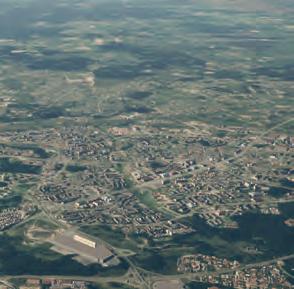
The project was complex, with several additional key objectives outlined by the agency:
• The automated workflow had to generate a nationwide digital twin in 72 hours or less.
• The digital twin had to be created in an open-source Open Geospatial Consortium Common Database (OGC CDB) format to support application of advanced computer simulations for training and preparation purposes.
• The initial workflow had to determine whether readily available open-source
vector data or high-resolution satellite imagery should be used to ensure production of the most accurate 3D digital twin possible.
The agency contracted Presagis of Montreal, Canada, to build the repeatable workflow, generate the nationwide digital twin, and perform the requested analyses using its VELOCITY 5D (V5D) cloud-based platform. Leveraging its decades of experience producing high-fidelity 3D environments for GEOINT, defence, and security applications, Presagis developed V5D specifically to build 3D digital twins from diverse 2D geospatial datasets for the purposes of visualization and simulation.
MULTIPLE, DIVERSE SOURCE DATASETS
As is true for many national mapping agencies, the client in this project had accumulated GIS vector layers, satellite imagery, and terrain data, but the files were of inconsistent formats, quality, and coordinate systems. Although this agency was a sophisticated GIS user, the variety of datasets covering a land area exceeding 65,000 square kilometres presented an ongoing challenge in delivering a multitude of derivative map products to its in-country customers – much less a single seamless digital twin.
With this common challenge in mind, Presagis had developed its platform with automation
 Large scale view of generated imagery that illustrates the vast amount of data the platform is capable of processing.
SPONSORED ARTICLE 69ISSUE 6 2022 | INTERNATIONAL |
from end to end, which meant the front of the ingestion process performed the data cleanup, standardization, and transformation. For this nationwide project, the mapping agency merely had to deliver its geospatial datasets to the Montreal firm for ingestion.


These datasets included nationwide 0.5m multispectral satellite imagery, 30m Shuttle Radar Tomography Mission terrain data, OpenStreetMap (OSM) vectors, and other proprietary GIS source data, all totalling 1TB in size.


PLANNING FOR THE UNPLANNED
The 72-hour turnaround time for the digital twin creation was not an arbitrary deadline. The mapping agency determined that in the aftermath of an unplanned incident, it would need to generate a new digital twin – either for the entire country or at least a region of it – in less than three days to assess and analyse change. This information would have to be delivered to responders for informed deployment of resources following an incident.
The agency understood that a significant advantage of digital twin technology is that a new one can be analysed against the existing baseline digital twin using artificial intelligence (AI) algorithms to rapidly find post-event differences in the landscape or infrastructure. AI technology is built into the V5D platform for change detection, feature extraction, and other uses.
Throughout the generation of the nationwide digital twins, Presagis tracked the processing time required for completion of tasks.
LEVERAGING AI FOR BUILDING FOOTPRINT EXTRACTION


An important comparison was made during the project to determine which input datasets resulted in the best quality digital twins. The two source datasets used in the comparison were a publicly available country-wide OpenStreetMap (OSM) file and the border-toborder 0.5m multispectral satellite imagery.
The accuracy with which building footprints were derived from each dataset was used as the determining factor in judging overall digital twin quality. This was considered a reliable point of comparison because extraction of building footprints is a critical
component in the generation of nearly all 3D digital twins.
The V5D platform provided the flexibility for generation of the digital twin from both the OSM and satellite image source data. In developing the platform, Presagis was aware that not every customer has access to expensive sub-meter satellite imagery covering a large geographic area, which is why it built the cloud solution to create digital twins successfully from a variety of different datasets.


The footprint extraction process leveraged proprietary embedded AI algorithms developed by Presagis specifically for automated object identification in V5D. Unique to the digital twin generation platform, this AI technique utilizes U-Net semantic segmentation architecture with dense blocks. Attention mechanism is employed to ensure important features produced from the blocks are retained and prioritized.
The results of applying the AI-based extraction technique to the provided high-resolution satellite imagery proved far superior to the automated creation of building footprints from the OSM file, which does not use AI. For the entire nation, the digital twin was generated with a total of 1,341,227 footprints from the imagery versus 1,285,799 from OSM – a difference
 PRESAGIS VELOCITY 5D interface showing a digital twin output of Montreal.
Close up image capture of small area showing details.
PRESAGIS VELOCITY 5D interface showing a digital twin output of Montreal.
Close up image capture of small area showing details.
| INTERNATIONAL | ISSUE 6 202270
of 55,428 footprints. Not only did the AI find significantly more buildings, it also placed their locations more accurately on the chosen digital twin coordinate system.
More importantly, the digital twin generation with the AI-satellite imagery technique required only 60.5 hours of run time versus 68 hours for the OSM process – both well within the 72 hours requested by the mapping agency. In both cases, the total time included data preparation and ingestion.
SIMULATION-READY OUTPUT
For the national mapping agency, the next most important aspect of the project was the output format for the digital twin data. Since the agency already used a preferred third-party simulation software for the variety of situations and scenarios it planned to visualize with the digital twin, it requested output in the simulation-ready OGC-CDB format.
Given the fact that Presagis has its roots in the simulation world, it had developed
V5D with the capability of outputting data in numerous formats for compatibility with most simulation packages on the market today. The company’s own simulation applications utilize the OGC-CDB format, so it is a default output for the platform. However, the digital twin generation software could also produce files in I3S for Esri, 3D Tiles for Cesium, and FBX for Unity or Unreal.
Producing the nationwide OGC-CDB output file took roughly seven hours for both the OSM and AI-imagery processes once the digital twin was generated.
CONCLUSION
Moving forward, the national mapping agency will use the 65,000-square-kilometer digital twin for multiple applications. On a routine basis, the single digital twin will serve as a central GEOINT repository from which a variety of charts and maps in 2D and 3D will be created – aeronautical, maritime, topographic, elevation models, geodesic and others. The digital twin can continually
be updated with new and different types of geospatial data.
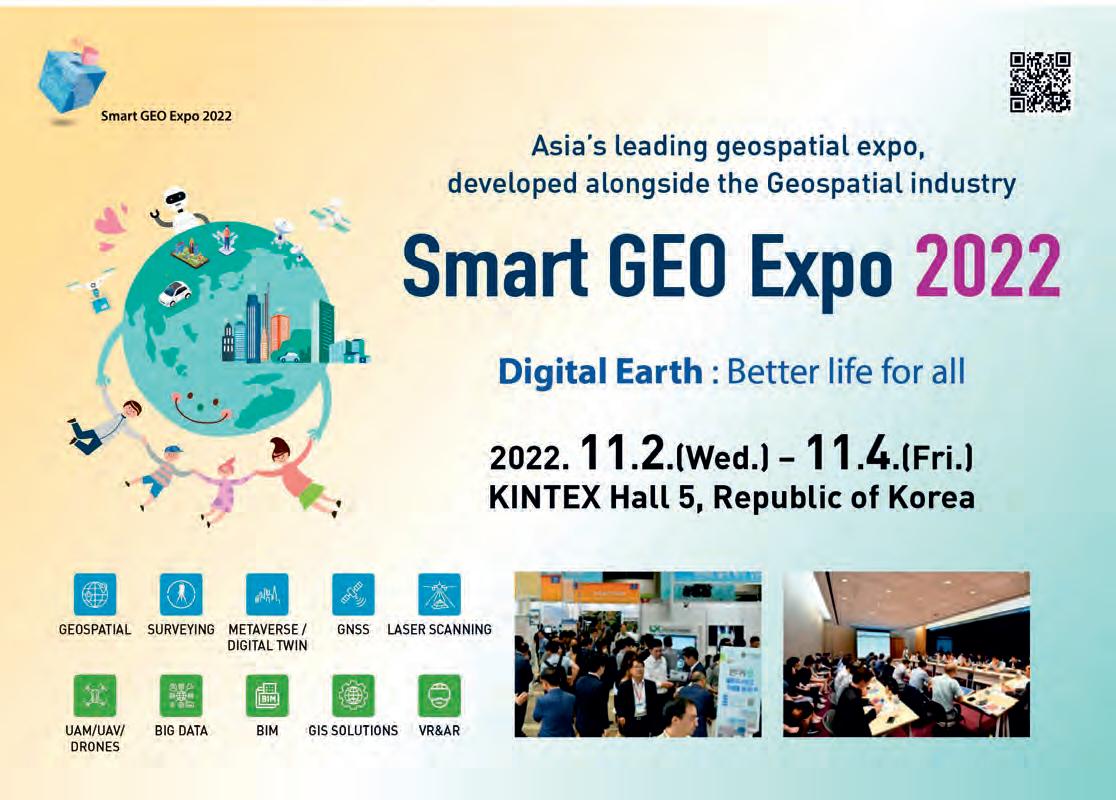
The most important application for the digital twin, however, is to assist the national mapping agency in simulating and preparing for unplanned events such as natural or man-made disasters. If such an incident occurs, the agency will likely acquire new remote sensing imagery either by satellite or aircraft to create a new digital twin for the entire nation or just a small area.
Regardless of whether the imagery is from the same sensor as that used to generate the original 3D twin, V5D can be deployed to use its AI algorithms to detect and assess damage to the landscape or infrastructure. As requested, this can be done on a nationwide scale in as little as three days or at the smaller scale of a city within a matter of hours.
Whatever the scenario and scale, the national mapping agency is now better prepared than ever to respond and safeguard its citizens.
SPONSORED ARTICLE 71ISSUE 6 2022 | INTERNATIONAL |


Ultra-Small and Light Design Posi�oning Precision <2cm IMU/GIS Support Laser Measuring Support Affordable Top Quality 9 Hours Long Life Ba�ery MG1 High-performance GNSS handheld receiver 125mm 40mm Detachable Antenna +Laser Design works on any Android devices NEW CHOICE NEW FUTURENEW CHOICE NEW FUTURE http://www.gintec.cn Email: overseas@gintec.cn WWW.GEOMARES-MARKETING.COM
Protecting Our World, Conquering New Frontiers
FIG Working Week 2023, 28 May to 1 June 2023

Orlando (Florida), USA

Next year, the FIG annual conference will be held in the Americas for the first time in over 20 years. With the theme ‘Protecting Our World – Conquering New Frontiers’, the conference will bring together surveying and geospatial professionals from around the world, with a special emphasis on attracting professionals from the Americas.
As our world and climate changes around us, we can leverage our knowledge base and tools for measuring, monitoring and forecasting how to improve the outlook for our future generations. Our profession has the opportunity and responsibility to help lead in these endeavours. We will share our knowledge and expertise through education, sharing and networking with key elements at the local, national and global level. These include the United Nations and its specific subsidiaries and programmes such as the World Bank, Food and Agriculture Organization (FAO), UN Initiative on Global Geospatial Information Management (UN-GGIM), UN Human Settlement Program (UN-Habitat), Global Land Tool Network (UN-Habitat/GLTN) and UN Division for Sustainable Development (UN DSD).
NATIONAL AND INTERNATIONAL SUPPORT
The national host of FIG Working Week 2023 is the National Society of Professional Surveyors (NSPS), with the conference supported by the surveying associations of the Americas, American Association for Geodetic Surveying (AAGS), Association of Pan American Surveying and Topography Professionals (APPAT), Canadian Institute of Geomatics (CIG) and Professional
Assessing Officers (IAAO), International Right of Way Association (IRWA) and Urban and Regional Information Association (URISA).
WIDE-RANGING PROGRAMME
With the programme coordinated by the ten FIG technical commissions, this working week will share ideas, provide training for new techniques and methodologies, and offer attendees an opportunity to see the latest in technology from worldwide vendors. The technical sessions will offer opportunities for professionals from many disciplines – including cadastre, geodesy, GIS, hydrography, land records and photogrammetry – to interact with fellow geospatial professionals on a wide range of topics in various settings. Continuing Education Units (CEUs) will be awarded for attendance and participation in the technical sessions.
OPPORTUNITIES FOR YOUNGER GENERATIONS
We also encourage the younger generations
schools to visit and learn about the many opportunities and advantages of joining the surveying/geospatial profession.

The FIG Working Week 2023 will be held at the Signia by Hilton Orlando Bonnet Creek/ Waldorf Astoria Orlando. The entire venue is under one roof, with accommodation located only minutes from the conference centre. The event will also feature social and tourist opportunities related to the Orlando area’s attractions, both technical (Kennedy Space Center, etc.) and social (theme parks, etc.).
Additionally, plans are in the works to hold the first FIG charity golf tournament. So, join us for what will be an extraordinary week!
More information https://fig.net/fig2023
ORGANIZATIONS 73ISSUE 6 2022 | INTERNATIONAL |
FIG Working Week 2023 Orlando, Florida USA 28 May – 1 June Protecting our World, Conquering New Frontiers r ando 2023 Working Week


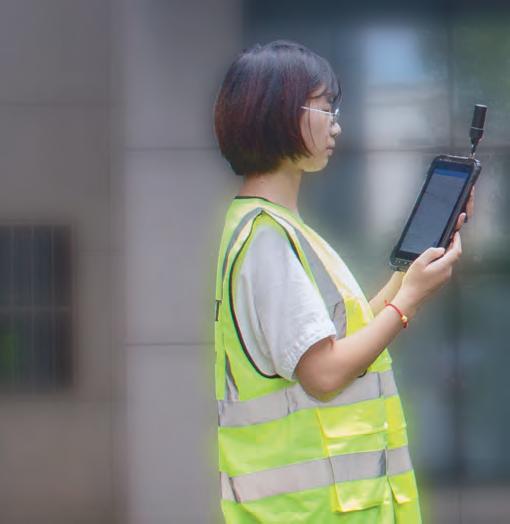


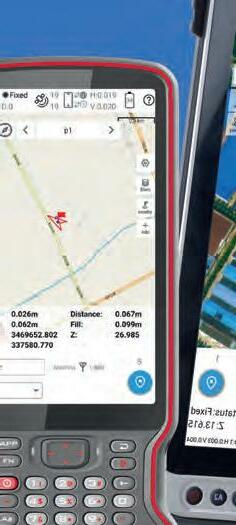


Scanning

Each project requires the right tools. Trimble’s range of 3D laser scanning solutions empower you to accurately capture, analyze, model, and deliver data you can trust.


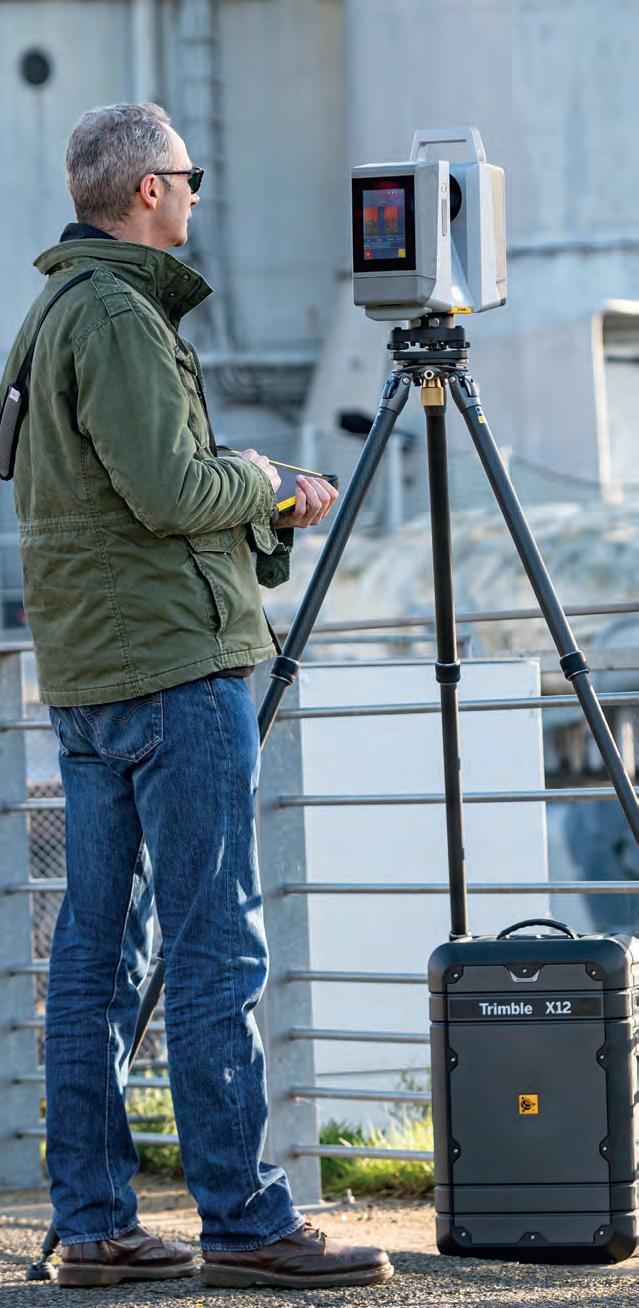
Superior hardware to suit your needs Intuitive, highly productive field software Powerful and connected office software © 2022, Trimble Inc. All rights reserved. (08/22) GEO-216 Find out more at: geospatial.trimble.com
Quality in, quality out for everyone
