Uncovering the competitive advantages of aerial

How

Empowering the geospatial community www.gim-international.com Issue 3 2023 Volume 37
sensing for fit-for-purpose land administration Lidar technology for scalable forest inventory
down barriers: advancing AEC
Lidar
Remote
Breaking
with
surveying
airborne geospatial data has
for
become a powerful tool
understanding the world


Director Strategy & Business Development
Durk Haarsma
Financial director Meine van der Bijl
Technical director Huibert-Jan Lekkerkerk
Contributing Editors Dr Rohan Bennett, Frédérique Coumans
Head of Content Wim van Wegen
Copy-editor Lynn Radford, Englishproof.nl
Marketing Advisor Myrthe van der Schuit
Business Development Manager

Jurjen Visser
Circulation Manager Adrian Holland
Design ZeeDesign, Witmarsum, www.zeedesign.nl
GIM International, one of the worldwide leading magazines in the geospatial industry, is published eight times per year by Geomares. The magazine and related website and newsletter provide topical overviews and reports on the latest news, trends and developments in geomatics all around the world. GIM International is orientated towards a professional and managerial readership, those leading decision making, and has a worldwide circulation.
Subscriptions
GIM International is available eight times per year on a subscription basis. Geospatial professionals can subscribe at any time via https://www.gim-international.com/subscribe/ print. Subscriptions will be automatically renewed upon expiry, unless Geomares receives written notification of cancellation at least 60 days before expiry date.
Advertisements
Information about advertising and deadlines are available in the Media Planner. For more information please contact our marketing advisor: myrthe.van.der.schuit@geomares.nl.
Editorial Contributions
All material submitted to Geomares and relating to GIM International will be treated as unconditionally assigned for publication under copyright subject to the editor’s unrestricted right to edit and offer editorial comment. Geomares assumes no responsibility for unsolicited material or for the accuracy of information thus received. Geomares assumes, in addition, no obligation to return material if not explicitly requested. Contributions must be sent for the attention of the head of content: wim.van.wegen@geomares.nl.
Lidar technology for scalable forest inventory

There is a critical need for rapid, rigorous, reproducible and scalable forest inventory tools to support data-driven policies and management practices in response to challenges including deforestation and climate change. Lidar technology offers an alternative for automated forest inventory.
Remote sensing for land administration


Advances in remote sensing and geospatial information science are driving the development of innovative methods for data acquisition, processing and maintenance. This article looks at how these can support fit-for-purpose land administration.
Lidar in the AEC industry
This article discusses the challenges that laser scanning professionals and surveyors face in the AEC industry, and offers insights on how they can overcome these challenges and stay ahead of the competition by adopting new technologies.


The competitive advantages of aerial surveying

This article aims to help readers gain a better understanding of the differences and similarities between crewed and uncrewed aerial vehicles (UAVs) and satellites used in aerial surveying. Comparing these platforms’ technical aspects can reveal differences and overlaps.
Geomares
P.O. Box 112, 8530 AC Lemmer, The Netherlands
T: +31 (0) 514-56 18 54
F: +31 (0) 514-56 38 98 gim-international@geomares.nl www.gim-international.com
No material may be reproduced in whole or in part without written permission of Geomares.


Copyright © 2023, Geomares, The Netherlands

All rights reserved. ISSN 1566-9076
Supporting urban spaces with UAV mapping and 3D modelling


Various data acquisition methods are being explored for urban spatial mapping and management, aiding urban regeneration. A Greek team researched the use of UAVs, collecting data and using 3D modelling to better understand the urban environment.
Reality capture trends shaping an autonomous future
Population growth, urbanization, and digitalization pose challenges and opportunities for the geospatial industry. Reality capture is essential and accessible with advancements. The move towards autonomous reality capture is paving the way for smart digital realities.
AI analytics SaaS start-up in the EO market
Geoalert has developed an AI-powered SaaS platform called Mapflow.ai and promotes streaming services for Earth observation data. The company is based in Uzbekistan and was incorporated in the USA in 2023. The company actively supports open geodata activities in Central Asia.
Scanning and 3D modelling for efficient highway surveys

Thanks to rapid improvements in aerial laser scanning systems, they offer great potential in road surveying compared with traditional methods. Using the high-density 3D point clouds resulting from aerial scanning, highway surveyors can reconstruct accurate 3D models of road pavements and lateral terrain.
5 Editorial
6 Headlines
41 Organizations
Cover story
Thanks to advancements in cameras and sensors, surveyors can now acquire highly accurate geospatial information for a wide range of purposes. In this issue of GIM International, you will discover captivating examples of how sensor-based technology – including imagery and Lidar – is driving faster, more cost-effective data services while enhancing the precision and spatial resolution of the final products.
(Image courtesy: Arnaud Denisot, MSDI)
Issue 3 2023 3 Contents
9 29 13 33 18 36 23 38 www.gim-international.com Remote sensing for fit-for-purpose land administration Lidar technology for scalable forest inventory Breaking down barriers: advancing AEC with Lidar Uncovering the competitive advantages of aerial surveying How airborne geospatial data has become a powerful tool for understanding the world To subscribe to GIM International go to www.gim-international.com/subscribe
Theme Weeks
Sponsorship Package

EUR 2,200

To drone or not to drone…?
During my career, I have worked on numerous coastal engineering surveying projects. The main challenge in such projects is what is called the ‘surf zone’, where it is too wet to properly perform land surveying and too dry to float a boat. Surveying the final result to prove it has been built as designed can be more difficult than one would think, because the dry zone and the wet zone each have their own peculiarities. Take a dike constructed with rocks of a certain size range or ‘gradation’. The reference method for surveying such a structure is to use a semi-spherical footstaff in a regular grid of 1x1m, simply because this is very similar to the reference used for the engineering design (and hydraulic testing) of stone constructions. However, this method is not only time-consuming and actually dangerous for the surveyor (who has to walk in the surf zone) but also not even necessary, because the structure could be surveyed from a safe distance using Lidar or photogrammetry instead – right? Well, not entirely! The semispherical footstaff is designed to obtain a level which is roughly 10-15% beneath the tops of the rocks. In contrast, the Lidar (or photogrammetrical cloud) will digitize all visible points including the sides and the gaps between the rocks (to a certain extent). As a result, the average levels obtained by Lidar in a 1x1m grid will be lower than those obtained using the reference method. Without knowing this difference, neither Lidar nor photogrammetry can be used to establish the constructed levels with any certainty. To determine these differences, a large series of mainly bathymetric tests were conducted using multibeam echosounders in the Maasvlakte 2 Port Extension project in 2009-2010. Additionally, tests were
performed using static, car-mounted and crane-mounted Lidar as well as airborne laser scanning. This was insufficient to draw definite conclusions about laser systems, but it was enough to give a clear indication that the levels obtained with Lidar were significantly lower and were related to the median rock diameter. Back then, photogrammetry and drones were not yet mainstream, so they were not tested. Today, however, clients regularly ask me whether they can use a drone for coastal engineering surveys (and when they say ‘drone’, they often mean Lidar or photogrammetry). My answer is twofold: Yes, you can, but no, you probably shouldn’t... or at least not without investing in additional tests to determine the difference between the obtained levels and the reference level. So most clients decide to stick to more traditional methods, probably due to a lack of time and money to conduct those tests. However, in my role as a lecturer, I now hope to contribute to breaking this vicious circle. A small group of my students will perform a survey of a rock construction using both the semi-spherical reference method and drone-based photogrammetry. This should give greater insight into the obtained levels and verify whether photogrammetry follows a similar pattern as Lidar and multibeam echosounders. In fact, one of my graduation students has just developed a method to determine the gradation of rocks using a camera-equipped drone so that even rocks that are already in place should be measurable. Hopefully, this will allow us to take a small step towards using Lidar and photogrammetry for determining reference levels of rock in the surf zone, in which case aerial mapping will become an even more versatile tool.
Huibert-Jan Lekkerkerk, technical editor


Issue 3 2023 5 Editorial
Maxar unveils 3D digital twin for VR and simulation

Maxar Technologies and Blackshark.ai have collaborated to develop SYNTH3D, a synthetic 3D digital twin of the Earth’s surface that is highly compatible and visually pleasing for use in gaming, simulation, entertainment, virtual reality (VR), smart city and metaverse applications. This high-performance 3D model, created using Blackshark.ai’s patented generative artificial intelligence (AI) technology and Maxar’s Vivid imagery basemap, is procedurally generated with geotypical textures to replicate the architectural style of a given region, offering a lifelike model. SYNTH3D offers developers and creators a comprehensive solution to simulate and visualize 3D environments representative of real-world locations. The model has been designed to be highly compatible and visually pleasing while accurately representing the geographic and building features of a specific area. Ideal for commercial and government applications where aesthetics and performance are key, the digital twin solution will revolutionize how various industries build and interact with VR environments.
GIS portal enhances collaboration for UK nuclear power station

EDF, a French electric utility company, has partnered with Esri UK to implement an enterprise GIS for Hinkley Point C (HPC) nuclear power station, one of the largest and most complex construction projects in Europe. The GIS portal has enabled better collaboration and streamlined digital workflows by providing a central source of all spatial data, maps, apps and dashboards for over 1,500 users including employees and contractors. The GIS portal provides an interactive primary site map with over 100 different data layers, from BIM models and CAD data to construction operations, temporary works, utilities, logistics and emergency preparedness. According to Jon Dolphin, construction project manager and GIS lead at HPC, the clarity of construction data is critical to the success of the project, and the GIS portal provides a single view of the data, driving collaboration among the teams.

Esri’s GIS solution has replaced manual paper-based methods for collecting data out in the field with new digital workflows that are enhancing productivity and safety on site. Emergency planning data is now collected on tablets and appears in the GIS portal in real time.
GNSS receiver for precision surveying


ComNav Technology has introduced a new product called Venus Laser RTK, which allows positioning without the need for a range pole. For the prism-free total station, the principle behind this technology is that the laser beamer on the total station sends a laser pulse towards an object and measures the time taken for the pulse to be reflected off the object and returned to the transmitter. This enables the distance between the transmitter and object, as well as the coordinates of the object, to be determined. The Venus Laser RTK GNSS receiver is equipped with a centimetre-level laser rangefinder on the bottom, with which it determines the distance between the RTK and the object. It can obtain centimetre-level positioning results through the CORS network. Furthermore, the IMU sensor allows tilt compensation within 60° tilt, making it easy to obtain accurate coordinates. This feature solves problems such as mapping dangerous or obstructed areas, breaking the usual limitations. In terms of laser safety, the laser is Class 3R, which is considered safe when handled carefully.

Issue 3 2023 6
Venus Laser RTK, equipped with a millimetre-level laser, eliminates the need for a range pole during stakeout and measurement, expanding the scope of work and ensuring user safety. (Image courtesy: YouTube/ SinoGNSS)
Big Carl, the world’s strongest land-based crane, looms over Hinkley Point C nuclear power station. It is capable of hoisting a staggering 5,000 tonnes in a single lift. (Image courtesy: EDF)
Buildings in Paris as displayed in SYNTH3D. The detected buildings are transformed into realistic, region-specific architecture with lifelike textures. (Image courtesy: Maxar)
Presagis unveils new V5D plugin for Unreal Engine
Presagis recently released the V5D plugin for Unreal Engine, which lets users load GIS-generated V5D digital twins into Unreal Engine. This integration enables the creation of highly realistic visualizations and simulations of entire cities and countries, offering new possibilities for digital twin applications with unparalleled detail and accuracy. “The primary application of the Unreal Engine plugin will be in 3D visualization applications covering large geographic areas because of V5D’s unmatched ability to produce 3D digital twins from massive geospatial datasets,” said Jean-Michel Briere, president of Presagis. The V5D plugin for Unreal Engine is expected to have a significant impact on a variety of industries, including aviation, aerospace, urban planning, disaster preparedness and defence simulations that require expansive geographies. It will also benefit visualizations that involve long linear distances, such as transportation and utility corridor design.


Kadaster and ITC renew cooperation agreement
Kadaster and ITC have renewed their cooperation agreement during an official signing ceremony at the University of Twente’s ITC campus. Freek van der Meer, dean of ITC at the University of Twente, and Frank Tierolff, chairman of the board at Kadaster, both underlined the wish to continue their collaboration, and to bundle their knowledge and experience, in order to actively contribute to the Sustainable Development Goals (SDGs). Kadaster (The Netherlands’ Cadastre, Land Registry and Mapping Agency) and the University of Twente’s Faculty of Geo-information Sciences and Earth Observation (ITC) have been actively collaborating since 2006, for example through the ‘School for Land Administration Studies’, with the aim of building capacity in the field of land administration. Courses aimed at knowledge transfer and innovation have supported the development of land professionals from low- and middle-income countries. There has also been joint work on education, innovation and research. The active and intensive cooperation between Kadaster and ITC has contributed to further development of the domain of land administration, both in the Netherlands and abroad. Thanks to the renewed agreement, this cooperation will now continue.

Concordia researchers develop new technique for creating precise 3D models
Concordia University researchers have developed a faster and m accurate technique for creating highly detailed 3D models of large-scale landscapes. With this technique, digital replicas of real-world environments can be created down to the pixel level, making it easier for people to explore and navigate various areas. This innovation makes creating digital twins of the real world more accessible for various applications. The new technique is called HybridFlow and utilizes highly detailed aerial images captured from aircraft flying at altitudes exceeding 30,000 feet (approx. 9,000m) to generate precise 3D models of cityscapes, landscapes mixed areas, achieving a typical resolution of over 200 megapixels per image. By employing advanced processing techniques, the resulti models accurately represent the appearance and structure of the environment, down to the individual colours of structures. Unlike conventional 3D reconstruction methods that rely on identifying visual similarities between images to construct models, HybridFlow’s advanced approach mitigates issues such as occlusion and repetition, resulting in extraordinary accuracy.


Issue 3 2023 7 Headlines
The V5D for Unreal Engine plugin allows 3D fly-throughs and immersive simulations of GIS-based digital twins.
Fragment of a reconstructed point cloud of Montreal, Canada. (Image courtesy: DRDC Valcartier)
Frank Tierolff, chairman of the board at Kadaster, and Freek van der Meer, dean of ITC, are pictured signing the renewed cooperation agreement, alongside Jaap Zevenbergen, head of the PGM department at ITC. (Image courtesy: Job Duim)
NavVis and NVIDIA collaborate for large-scale reality capture data streaming

A new collaboration between NavVis, a global leader in reality capture and digital factory solutions, and NVIDIA Omniverse – a platform for building and operating industrial metaverse applications – is aimed at enabling streaming large-scale reality-capture data for factories. This will allow not only physically accurate, computer-designed models, but also accurate 3D representations of the ever-changing real world to be used in Omniverse simulations. This will be achieved by integrating the company’s mobile mapping system, NavVis VLX, and spatial data platform, NavVis IVION, with NVIDIA Omniverse. The partnership will provide enhanced capabilities for industrial applications, paving the way for advanced, immersive digital twin experiences. “We strongly believe in the promise of the industrial metaverse, especially when it focuses on addressing hard problems that real users are facing with advanced capabilities such as physics-based simulations and AI,” said Dr Felix Reinshagen, CEO and co-founder of NavVis. “We see, however, that simulations cannot just rely on existing libraries of computer-generated models but need to be complemented with an accurate, large-scale, always up-to-date 3D representation of the real world to ensure actionable results. NVIDIA is a global leader in this new space of the industrial metaverse, and we’re very excited about this collaboration.”

Exploring Amazon forest loss through Sentinel-1’s radar data cube
The ‘Sentinel-1 for Science: Amazonas’ project, led by ESA, supports the monitoring and mitigation of climate change-related impact on forests by processing radar images to detect forest loss. The project employs a transparent approach to estimate loss via space-time data cube design, extracting statistical information at each radar time-series point. This powerful tool tracks changes and enables conservation efforts. Accurate and timely data supports decision-making in addressing climate change and preserving ecosystems. Forests hold a vast amount of Earth’s terrestrial carbon and play an important role in offsetting anthropogenic emissions of fossil fuels. Since 2015, the world’s tropical forests can be observed regularly at an unprecedented 6 to 12-day interval thanks to the Copernicus Sentinel-1 mission. Millions of gigabytes of synthetic aperture radar (SAR) data are acquired both day and night, regardless of cloud cover, haze, smoke or aerosols. This allows deforestation and forest degradation to be monitored at least biweekly. The challenge, however, lies in finding adequate methods to extract meaningful indicators of forest loss from the vast amounts of incoming radar data, such that anomalies in the time series can be regularly and consistently detected across tropical forests. Such forest-monitoring methods should be transparent and easily understandable to the wider public, enabling confidence in their use across various public and private sectors.
The Sentinel-1 constellation, comprised of two satellites, provides a wealth of valuable data and imagery. (Image courtesy: ESA)

Mach9 launches high-speed geospatial production software
The Mach9 software platform produces 2D and 3D maps from mobile Lidar 30 times faster than existing solutions, according to the North American company. This is the first product launched by Mach9, but the company is already preparing for future growth by upgrading its website, hiring key engineering and sales leaders, moving into new headquarters in Pittsburgh’s Bloomfield neighbourhood, and establishing a presence in Silicon Valley. The new product leverages artificial intelligence (AI) and computer vision to produce 2D and 3D CAD and GIS engineering deliverables faster than ever before, according to Mach9. This product launch comes amidst the company’s pivot to a softwarefirst business model – a move driven by the rising demand for tools that accelerate geospatial data processing and analysis for infrastructure management. “The organizations that own and manage our infrastructure are dependent on high-quality maps. New mapping technologies, like mobile Lidar, have transformative potential for engineering and construction firms, departments of transportation, electric utilities, railroads and other government


entities. However, the high costs and long wait times required to generate mapping deliverables are hampering the broad adoption of these tools,” says Alexander Baikovitz, co-founder and CEO. “Our goal at Mach9 is to unlock this potential by creating a geospatial production platform for those that need high-quality maps and actionable data fast.”

Issue 3 2023 8
Headlines
Mach9’s geospatial production software streamlines the conversion of complex 3D geospatial data into 2D and 3D engineering models, with a user-friendly interface and fast processing speeds. (Image courtesy: Mach9)
Evaluating the trade-o s between various Lidar platforms
Lidar technology for scalable forest inventory
 By Ayman F. Habib, Purdue University, USA
There is a critical need for rapid, rigorous, reproducible and scalable forest inventory tools to support data-driven policies and management practices in response to challenges including deforestation and climate change. Lidar technology on board different platforms offers an alternative for automated forest inventory at various scales, but each platform has trade-offs in terms of cost, efficiency, coverage, resolution or more. So what is the solution?
Forests are a globally dominant ecosystem, covering nearly 40% of the Earth’s land area. They provide critical services such as fibre, timber, fuel, carbon dioxide removal, water supply filtering, flood erosion control, recreation and biodiversity sustenance. However, they are constantly challenged by various stressors. As the human population continues to grow, deforestation activities are on the rise to meet the need for material, agricultural land and urban developments. Such stressors are exacerbated by intensified climate change. These challenges are calling for immediate attention, which was raised by the United Nations Department of Economic and Social Affairs in its Global Forest Goals Report, 2021. In this report, six goals are set to ensure global forest sustainability. It was emphasized that meeting these goals requires data-driven policies and management practices, powered by accurate/comprehensive inventory.
Examples of essential forest data for proper management include tree count, species, health, height, stem diameter, straightness, taper affect, branch number and branching order/angle. This information is essential for forecasting wood production, timber value, and carbon sequestration rates. Traditionally, inventory of such traits has been conducted manually, which is expensive and timeconsuming. Just as an example, the United States Forest Inventory and Analysis (FIA) programme spends close to US$100 million annually to inventory 18,000 acres, which
corresponds to only 0.002% of the total US forest area. Other than the USA and EU, forest inventory programmes are almost non-existent around the globe. Therefore, there is a critical need for rapid, rigorous, reproducible and scalable inventory tools.
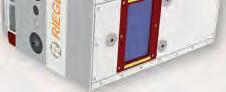
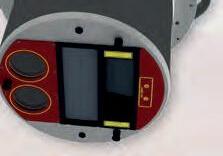
With advances in sensor and algorithmic technologies, remote/near-proximal/ proximal sensing – including imaging and Lidar systems onboard space/aerial vehicles, stationary terrestrial laser scanners (TLS) and terrestrial mobile Lidar – has recently been explored as an alternative for automated forest inventory at various scales. These sensors/platforms have trade-offs in terms of cost, field survey efficiency, spatial coverage, spatial resolution and level of detail of the acquired information. Figure 1 shows two examples of potential data acquisition systems (near proximal and proximal) for fine-scale forest inventory.
Space and airborne imagery/Lidar
Space imagery and Lidar data facilitate global and national forest inventory. However, limited spatial and temporal resolution would not allow for fine-scale inventory at the single tree level. Photogrammetric processing of images acquired by spaceborne and crewed aerial systems has attracted the attention of the forestry research community for estimating inventory attributes such as tree height, stem volume and basal area. However, image-based point cloud generation is challenged by the difficulty in identifying corresponding points in overlapping images over forest landscape during both leaf-on and leaf-off conditions. Moreover, derived point clouds from imagery only capture the outer envelope of the forest canopy. Airborne Lidar provides large spatial coverage, fine resolution and the ability to represent the outer envelope and belowcanopy structure. Lower-canopy mapping
Issue 3 2023 9 Perspectives
Figure 1: UAV-Lidar (left) and backpack-Lidar (right) for fine-scale forest inventory.
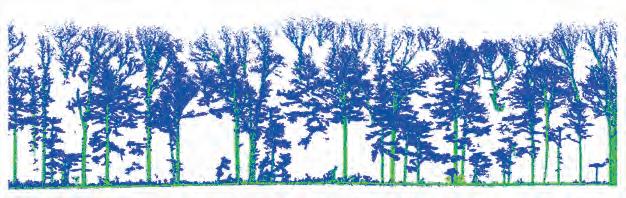
is facilitated by the fact that Lidar energy can travel through gaps among the trees/leaves and derive returns from tree trunks and terrain. Such ability makes Lidar an attractive modality for deriving ground slope and aspect, stem map, canopy height, crown dimension and leaf area index (LAI), to name but a few traits. The point cloud in Figure 2 illustrates the level of detail that can be discerned in forest Lidar data captured by an airborne remote sensing system.


The large majority of airborne Lidar systems are based on linear Lidar technology, which is characterized by a high-power signal emission and a low-sensitivity receiver for detecting echo returns. Linear Lidar is based on emitted laser pulses with some nanosecond pulse width at wavelengths from 500nm (for bathymetric Lidar) to 1.5μm (for topographic Lidar). The echo returns are then digitized by the receiver. To discriminate signal return from noise, linear Lidar utilizes a single-detector receiver that requires a flux of hundreds or thousands of photons. Such characteristics of linear Lidar impose constraints on the flying height, platform speed and lateral distance between neighbouring flight lines to ensure the delivery of point clouds with reasonable point density.
Beyond the constraints of linear Lidar

Recent developments in Lidar technology are alleviating these constraints. For example, Geiger-mode Lidar (GM-Lidar) has a low power signal emission coupled with a high-sensitivity receiver. GM-Lidar has a large beam divergence angle leading to a sizable laser beam footprint. The returning signal from the footprint covers the entire field of view (FOV) of a 2D receiver, which consists of an array of Geiger-mode Avalanche Photodiode (GmAPD) detectors. The GmAPD detectors are designed to be extremely sensitive in
that they can record the reflected energy at the single photon level. These characteristics allow for data acquisition at a much higher altitude/flying speed while providing relatively high point density, thus reducing the cost of the data acquisition and product delivery. However, airborne Lidar data from crewed aerial vehicles might not have the necessary resolution for fine-scale forest inventory (e.g. DBH, stem map and woody debris detection).
Pros and cons of UAV-Lidar
Compared to crewed aerial systems, uncrewed aerial vehicles (UAVs) have a clear advantage in terms of their low cost, ease of deployment, rapid acquisition, ability to deliver fine-resolution products and higher frequency of field surveys. UAV imagery and orthophoto mosaics can be used to derive some inventory traits (e.g. tree count, species, height). However, they are still lacking due to their limited belowcanopy mapping ability. UAV-Lidar has the same advantages as airborne Lidar captured by crewed aerial vehicles except for reduced spatial coverage. UAV-Lidar data has been used for segmenting individual trees and estimating canopy cover, tree height, DBH, woody debris volume and above-ground biomass. Nevertheless, with above-canopy flights, the ability of UAV-Lidar to map below-canopy features is limited by tree density and leaf cover. Detailed belowcanopy mapping – which is necessary for deriving accurate estimates of critical forest biometrics such as DBH, woody debris volume and under-canopy structure – is not always guaranteed.
The use of terrestrial systems
Terrestrial systems, including terrestrial laser scanning (TLS) and terrestrial mobile Lidar, can capture detailed below-canopy information. High-quality data from TLS can be used for deriving forest structural metrics at the stand level. However, large field surveys and data post-processing using TLS are complex and timeconsuming, so limited spatial coverage is the norm. Terrestrial mobile systems, on the other hand, can manoeuvre within the site to obtain large spatial coverage while mitigating occlusions. The backpack system in Figure 1 is an example of such mobile ground Lidar. Lidar data derived from such systems can be used for stem map generation, DBH estimation, crown segmentation and woody debris detection. However, point clouds from ground systems are prone to occlusions owing to terrain and above-ground objects. In addition, obstacles on the forest floor can restrict platform movement. Therefore, complete coverage of a forest stand using terrestrial mobile Lidar would require careful planning of the system’s path during the data acquisition campaign. To derive meaningful point cloud data from terrestrial mobile Lidar, the platform’s position and orientation (i.e. trajectory) must be accurately estimated. Trajectory
Issue 3 2023 10
Figure 3: Reconstructed Lidar data exhibiting ghosting effects due to lower quality trajectory of a terrestrial mobile Lidar caused by GNSS signal outages.
Figure 2: Sample Lidar point cloud data over a forest stand.
Figure 4: Reconstructed Lidar data after trajectory enhancement for a terrestrial mobile Lidar.
estimation can be directly established using an integrated global navigation satellite system/inertial navigation system (GNSS/INS).
The main challenge in using GNSS/INS for trajectory estimation is the intermittent access to the GNSS signal, which is crucial to deriving accurately georeferenced mapping products from the onboard sensors. For short GNSS signal outages, the onboard INS can bridge such gaps leading to reasonable trajectory, whose quality is governed by the grade of the INS inertial measurement unit (IMU). For longer GNSS signal outages, the system trajectory will lead to non-meaningful point clouds (see Figure 3). To mitigate such deterioration, the research community has been focusing on establishing Lidar-based simultaneous localization and mapping (Lidar-SLAM) algorithms (see Figure 4). However, relying on SLAM only would produce point cloud data that might not be well georeferenced in a global sense. Therefore, SLAM-based strategies for terrestrial mobile Lidar aided by airborne datasets would ensure the positional quality of the mapping product.
Evaluating the platform trade-offs
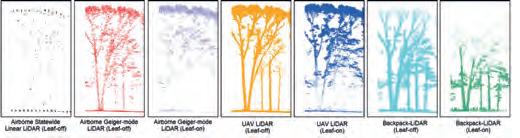
In summary, spaceborne, airborne and terrestrial mobile Lidar all provide above and below-canopy point cloud data. However, there are trade-offs between the resolution, acquisition cost and extent of covered area depending on the platform used. For example, data acquisition using crewed airborne systems is quite expensive and cannot collect data at a reasonable temporal resolution. Meanwhile, UAV-based Lidar surveys are cost-effective, but cannot provide high-resolution forest metrics at the single tree level for largearea coverage. Compare this with static terrestrial Lidar systems which, while providing high-resolution data, suffer from occlusions and require extensive fieldwork to cover small areas. In contrast, terrestrial mobile Lidar systems can only cover small areas and suffer from GNSS signal outages, which impact the quality of derived products. Figure 5 illustrates Lidar point clouds for the same tree captured by different platforms leading to varying level of details that could be discerned from such data.
The solution to such challenges can only be achieved through effective fusion of spaceborne, airborne and terrestrial platforms. For example, machine learning strategies can be developed using fine-scale terrestrial mobile Lidar data. These strategies can be then scaled up to deal with airborne and spaceborne datasets. This scaling up would only be possible through ensuring the georeferencing quality of these multi-scale/platform/temporal datasets (Figure 6). Ensuring the georeferencing quality and developing efficient data processing algorithms allow for the derivation of point clouds for fine-scale representation (i.e. digital twinning) of the individual trees, as can be seen in Figure 7. Although Lidar data can provide a high

level of detail for fine-scale inventory, it still lacks in terms of providing the necessary spectral information for tree species identification and forest health analysis. Recent developments in hyperspectral imaging and multispectral Lidar technologies will be quite valuable in this regard.


Issue 3 2023 11 Perspectives
Ayman Habib, Thomas A. Page Professor of Civil Engineering at the Lyles School of Civil Engineering of Purdue University in Indiana, USA, is leader of the Digital Photogrammetry Research Group (DPRG). He is also co-director of the Civil Engineering Center for Applications of UAS for a Sustainable Environment (CE-CAUSE), and associate director of the Joint Transportation Research Program.
About the author
Figure 5: Illustration of the captured level of detail in a point cloud by different Lidar systems/platforms.
Figure 7: Fine-scale representation of an individual tree based on a high-resolution Lidar point cloud.
Figure 6: Well-georeferenced Lidar point clouds from multi-sensor/ platform/temporal data acquisitions.
RIEGL AIRBORNE LASER SCANNERS & SYSTEMS


RIEGL WAVEFORM LiDAR TECHNOLOGY FOR TOPOGRAPHY CHOOSE THE SCANNER EXACTLY RIGHT FOR YOUR SPECIFIC SURVEYING MISSION!
75° FOV up to 1.25 MHz meas. rate operating altitude AGL up to 3,900 ft*)
May 2 - 5, 2023


Rotterdam
75° FOV up to 1.25 MHz meas. rate operating altitude AGL up to 4,400 ft*)

60° FOV up to 1.33 MHz meas. rate operating altitude AGL up to 12,800 ft*)


for customized system configurations


58° FOV forward/backward and nadir look up to 2.66 MHz meas. rate operating altitude AGL up to 12,800 ft*)
dual channel turnkey system for high altitude, large scale mapping

60° FOV regular scan pattern


VQ-1460: up to 2.9 MHz meas. rate VQ-1260: up to 1.46 MHz meas. rate operating altitude AGL up to 14,400 ft*)
turnkey system for high altitude large scale mapping

for surveying at high flight altitudes e.g. wide area mapping of complex environments


Also explore RIEGL‘s proven LiDAR sensors for UAVs and for BATHYMETRY www.riegl.com


 VQ-1560II-S VQ-1460 / VQ-1260
NEW NEW
VISIT US AT
| The Netherlands
RIEGL booth 17
Austria | USA | Japan | China | RIEGLWORLDWIDE | Australia|Canada | United Kingdom
*) operating altitudes AGL given for target reflectivity in excess of 20%
Innovations based on remotely sensed data
Remote sensing for land administration
By Mila Koeva, Rohan Bennett and Claudio Persello, ITC/University of Twente, the Netherlands
From drones and satellites to airborne-based sensors and Lidar, advances in remote sensing and geospatial information science are driving the development of innovative methods for data acquisition, processing and maintenance. This article looks at how these can support fit-for-purpose land administration.

Land administration (LA) systems, including cadastre and land registration systems, seek to support the management of land value, land tenure, land development and land use planning. These systems are essential for the achievement of the United Nations Sustainable Development Goals (SDGs). Innovative methods for data acquisition, processing and maintenance are being developed to support fit-for-purpose land administration (FFP-LA). These utilize advances in remote sensing and geospatial information science and include uncrewed aerial vehicles (UAVs or ‘drones’), satellite and airborne-based sensors, as well as Lidar – all with high spatial, spectral, radiometric and temporal resolutions. Automatic image
orientation, surface reconstruction, scene analysis, change detection, classification and automatic feature extraction – with the help of artificial intelligence, spatial statistics and machine learning – are also being developed.
Proven
track record
European countries first showed the capability to use photogrammetry to create detailed cadastral maps over a hundred years ago (Figures 1 and 2). Any doubts about the use of photogrammetry and remote sensing for land administration are now hard to justify. That said, ground methods are still predominantly used in many regions. Whether this is because of resistance to change, sector self-interest or cost-benefit analysis is open to debate. Meanwhile, sensor data acquisition, cloud computing and image processing have seen tremendous developments in recent years. Taking all this into account, the surveying communities in different countries must strive to find the best way to integrate imagery-driven cadastral mapping with ground-based methods.
Recent developments demonstrate that ground-based and photogrammetric/remote-sensing techniques are converging. Thanks to digitalization, the distinction between ground and air methods is becoming blurred, with the tools, techniques, data and maps produced, as well as the training programmes, being increasingly integrated.
Remote sensing techniques do not always require intensive technical fieldwork (although a level of face-to-face consultation and sensitization with owners and land users is always necessary). Satellite images or aerial photographs can be employed as base maps for participatory mapping activities where physical features that represent property boundaries – such as roads and paths, connected parcels or buildings –are identified. Studies confirm that boundaries can be located on plotted satellite images and demarcated or outlined via manual or
Issue 3 2023 13 Feature
Figure 1: Origins and developments of photogrammetry and remote sensing applied in land administration. (Adapted from Bennett RM et al., https://doi.org/10.3390/rs13214198)
automated feature extraction methods. The resolution of the images must be suitable for the terrain and land use. Satellite images may have drawbacks like inadequate resolution for urban settings, lengthy and costly processing times, or difficulty in obtaining temporally up-to-date data because of frequent cloud coverage, especially in tropical regions. UAVs can help overcome some of these issues and are therefore seen as a viable solution to capture aerial images for further boundary delineation.

In remote sensing for land administration, consideration of ‘invisible boundaries’ is essential. These are legal boundaries that are not visible on the ground (i.e. there are no monuments). Because they effectively exist in the minds of people, they are currently impossible to detect with remote sensing techniques, although further research on this may incorporate prediction of possible locations of invisible boundaries, combined with ground truth survey and human expert knowledge. Despite this challenge, the use of imagery in these contexts is very valuable. Land administration has long recognized the different representations that cadastral boundaries have. They are variously represented as physical natural features, person-made features (stakes or monuments), legal authority, social recognition, textual descriptions (metes and bounds), graphical depictions (be they scaled accurately or not), numerical or coordinated descriptions and, more recently, digital representations. No technological approach can cover all of these aspects. However, remote sensing and photogrammetry can certainly support in some of them.

Rise of UAVs

Over the past decade, UAVs have been a great advantage for both scientific and commercial purposes. Over the past five to six years, the cost and size of UAVs have decreased dramatically, making them a cost-effective way to conduct mapping and research in a short period of time. They have quickly gained importance as a tool for fast collection of high-resolution imagery as base data for cadastral mapping.
UAV-based mapping requires a UAV, pilots and legal permission for the flight mission. The mission consists of three phases: planning the flight, acquiring data, and processing the data. Although the UAV flight is

Issue 3 2023 14
Figure 2: Remote sensing and photogrammetry applied to land administration: review results depicted geographically. (Adapted from Bennett RM et al., https://doi.org/10.3390/rs13214198)
Figure 3: Distribution of GCPs for experimental assessment of the spatial accuracy.(Source Stocker C. et al., https://doi.org/10.3390/rs12213625)
Figure 4: Reference and classification maps obtained by the investigated techniques. The visible boundary references are the green lines, the invisible are the red lines, and the detected boundaries are the yellow lines. (Source: Xia X. et al., https://doi.org/10.3390/rs11141725)
the centrepiece, it takes up only 20% of the total time for the mission; reference data collection and image processing can be two to three times more labour-intensive. Nevertheless, it has been proven that the flight configuration has a significant effect of on the quality of UAV data collected for creating and updating cadastral maps.
Experiments in Europe and Africa have assessed the impact of land cover, the setup of ground control points (GCPs) and flight plans on the accuracy and completeness of automatically detected cadastral features. The results indicate that each of these factors has a major influence on the final data quality. The accuracy and completeness of automatically detected cadastral features can vary greatly between orthophotos generated from different flight plans.
Improving UAV data collection
Some of the key recommendations for land professionals for improving existing and future UAV data collection workflows are summarized as follows:
- Land use can greatly influence the number of tie points in an image. For scenes with a high percentage of vegetation, such as trees or forests, an overlap of 80-90% is necessary to ensure sufficient image correspondences.
- Regardless of the size of the study area, the level of error in planimetric and vertical residuals is consistent when seven GCPs are evenly distributed (as outlined in Figure 3) and the forward overlap and side overlap are both at least 70%. Since additional GCPs do not significantly alter the absolute accuracy, seven GCPs are the optimal survey design.
- The quality of reconstructed thin cadastral objects, such as concrete walls, is highly dependent on the flight configuration. Increasing the image overlap improved the reliability of generated orthophotos. On the other hand, the delineation results of rooftops showed less sensitivity to the flight configuration.
- Checkpoint residuals may indicate a high absolute accuracy of an orthophoto. However, it is important to measure them in the generated orthophoto in addition to after the bundle block adjustment (BBA) in order to accurately assess the reliability of reconstructed scene objects, particularly in adverse conditions with large variations in the height component.
The findings of this analysis have major implications for the use of UAVs in land administration tasks. There is the risk that UAVs are used without an understanding of the photogrammetric principles and the available options to customize flight configurations. This can lead to good-quality end products, but with spatial offsets, deformations or poor reconstruction results of relevant features going undetected. At the same time, however, the results of this analysis opened up immense opportunities for customizing UAV workflows. Different flight configurations and various reference data provide a range of options to fit the data collection task to the financial, personnel and time capabilities, while also meeting customer needs and requirements in the land sector. This makes UAV workflows a viable and sustainable tool to deliver reliable and cost-effective information for current and future cadastral challenges.
GeoAI and deep learning
The concept of using remote sensing imagery to delineate visible cadastral boundaries has been gaining interest in recent years.
Mila Koeva is an associate professor at the University of Twente, International Institute of Geo-Information Science and Earth Observation (ITC) in the Netherlands. Her main areas of expertise include photogrammetry and remote sensing for cadastral mapping, urban planning, 3D modelling and digital twin creation, among others. She leads FIG VII/4 AI4LA, ISPRS IV/WG 9 on digital twins, and the Digital Twin Geohub.

Rohan Bennett holds or has held roles as a land administration advisor (Kadaster, the Netherlands), an associate professor (Swinburne University of Technology) and chair of Commission 7 of the International Federation of Surveyors (FIG).

Claudio Persello is an adjunct professor at the Faculty of GeoInformation Science and Earth Observation (ITC) of the University of Twente. His main research interests are in the context of machine learning and deep learning for information extraction from remotely sensed images and geospatial data. The activities include investigating and developing dedicated deep learning techniques for various remote-sensing sensor data and multiple applications, focusing on societal and environmental challenges.
This has resulted in increased activity in automated methods for extracting such boundaries. Recent research on artificial intelligence (AI), machine learning or even more particularly on deep learning and remote sensing imagery for the purpose of cadastral boundary extraction has been encouraging. The traditional unsupervised methods heavily rely on parameter tuning such as the shape, colour and size of the desired segmented objects. These were developed by combining several parameters as input – including scale, compactness, layer weight and shape/colour – to predict segmented vector polygons. A variety of outputs have been explored based on these methods, such as images in which every pixel value represents a probability of boundary or output is in the form of closed pixel contours. In contrast to the traditional unsupervised methods, supervised methods use trainable networks that take labelled data as model input. The effectiveness of traditional unsupervised and supervised methods has been demonstrated, particularly when input

Issue 3 2023 15 Feature
About the authors
data is limited. On the other hand, when large datasets are available, deep learning is often the more appropriate choice.
Deep learning models are composed of multiple layers that learn data representations at different levels of abstraction, starting from
pixels, corners and edges and progressing up to complex spatial patterns. One deep learning architecture often used in image classification is the convolutional neural network (CNN). A special type of CNN is the so-called fully convolutional network (FCN), which is designed to perform semantic image segmentation. Both methods have been proven to be promising for boundary delineation, However, the success of the final result highly depends on the visibility of the physically demarcated boundaries on the image. A comparison between different methods for automatic boundary extraction also indicated the outperformance of the machine learning methods (Figures 4 and 5).
Compared with traditional methods, the most significant advantage of deep learning models is that all representations are learned in a supervised way and not handcrafted by a human operator. There is a clear need for further method development, especially in the direction of detection or prediction of the location of invisible cadastral boundaries.
A new role for Lidar
Significant work has looked at the role of Lidar in cadastral mapping. In Poland, an automated system for extracting outlines of building rooftops was proposed based on a modified U-Net deep learning algorithm. This algorithm was designed to provide accurate rooftop segmentation with a limited number of training images. The feature map size of the U-Net architecture used was 416 × 416 × 1, and the analysis was performed with publicly available data, consisting of orthoimagery and densely classified Lidar data in a digital surface model (DSM).

The utilization of deep learning techniques, high-resolution aerial imagery and land administration data (from laser scanning) can provide an efficient and cost-effective method for obtaining building outlines for cadastral purposes. Although the automatically extracted outlines cannot be directly implemented into the cadastral data due to discrepancies between the ground and roof outlines, they can still be utilized in the process of cadastral modernization. The experiment revealed that the proposed approach produces satisfactory results and is adaptable when the parameters are adjusted to the region’s

Issue 3 2023 16
Figure 5: Comparison of predicted land boundary map: (a) predicted boundary map retrieved with U-Net, threshold ‘boundary’ ≤ 0.9; (b) predicted boundary map retrieved with ENVINet5. (Source: Fetai B. et al., https://doi.org/10.3390/rs13112077)
Figure 6: Methodology for building extraction from high-resolution aerial orthoimagery and airborne Lidar. (Source: Wierzbicki D., https://doi.org/10.3390/rs13040611)
buildings. However, this may not be applicable to other areas with different building characteristics.


Cost-effective and fairer
Taking another case application beyond cadastral or tenure boundaries, property valuation – a fundamental element of land administration – is usually determined by a range of factors such as geographic location, physical characteristics, legal implications and economic considerations. While property valuation is essential for economic growth, many developing countries often lack official regulations or specific data requirements. Therefore, a study in Rwanda explored the effectiveness with regards to taxation of three remote sensing technologies: 1) aerial images captured with a digital camera, 2) WorldView2 satellite images, and 3) UAV images obtained with a DJI Phantom 2 Vision Plus quadcopter. UAVs were shown to offer the most promising method for collecting data to support property valuation for taxation. They could provide accurate and upto-date information, which is essential for fair taxation.
Although past trends may not be reliable predictors of future progress, the expanding use of remote sensing technologies in land administration appears to be undeniable. Digital transformation is lowering the legal and institutional barriers to change, allowing start-ups and other land administration service providers to enter the market more easily. AI and feature extraction techniques will


continue to be utilized and fused with other data sources, such as statutory and non-statutory as well as social and environmental data, to create more advanced boundary recognition algorithms. That said, people will remain central to the processes. In the end, it is they who must determine, use and enforce boundaries.


Issue 3 2023 17 Feature
Figure 7: Coverage of the remote sensing data in the Nyarutarama neighbourhood of Rwanda for property valuation based on remote sensing data. (Source: Koeva. et al., https://doi.org/10.3390/rs13183563)
GIMInternational isatrusted sourceof independent informationfor thegeomatics industry.Stayupto-datewiththe latestglobal insightson technologyand managementby subscribingto ournewsletter.
How narratives and visuals can propel laser scanning professionals

Lidar in AEC: overcoming obstacles and unlocking opportunities
By Bert Azizoglu, NUBIGON Inc.
Offering laser scanning services is rarely as glamorous as corporate brochures imply. It can be tricky to fund equipment costs, manage client demands and develop a successful pricing policy. To stand out from the growing competition, service providers must keep up with the latest technological trends while excelling at communications and consultancy. This is hard, especially for small and medium-sized firms. This article discusses how laser scanning professionals and surveyors can tackle these challenges, helping them accelerate new-tech adoption in the architecture, engineering and construction (AEC) sector and thereby future-proof the built environment.
Working with thousands of reality capture specialists in over 60 countries since 2018 has revealed a common pain point: the downward spiral of price competition. The story goes like this: as reality capture equipment gets more powerful, affordable and easy to use, this lowers entry barriers
and draws in new players with differing levels of expertise. Clients are excited about the promise of laser scanning and digital twins but are often not knowledgeable enough to effectively separate good offers from the bad. The insufficient differentiation among service providers and lack of transparency in
pricing policies make it even harder for the client to make an informed decision. So, all too often, it all comes down to the price. The ensuing ‘race to the bottom’ dampens output quality and, consequently, the benefits of reality capture for the client.
Lidar professionals transform the promises of new reality capture technologies into material benefits for their clients. As change agents, they play a crucial role at the forefront of tech adoption in AEC. It is, therefore, in the industry’s interest to foster an environment where clients can easily match up with high-quality service providers. This will help motivate service providers to compete based on quality rather than price alone. Improving communication between service providers and clients is critical to this endeavour. Two elements deserve particular attention: the power of narratives, and visuals.
The power of narratives
It is often said that “technology is about storytelling”. This suggests that technology
Issue 3 2023 18
Murals in a palace, Morocco.
is not just about the nuts and bolts of hardware and software, but also about how these tools can be used to make a difference in the world. In other words, technology is not just a set of tools, but a way to change lives, solve problems and create new possibilities. This idea reflects the growing importance of narrative and storytelling in techheavy industries as companies seek to capture the imagination of their audiences. Let’s look at the takeaways of this approach for laser scanning professionals and surveyors:
• Know your audience: As new prospects develop an interest in reality capture technologies, successful service providers focus on learning about those new target segments, their technical expertise, interests and communication preferences. This helps them tailor communication to the audience’s needs and ensure they understand the benefits of reality capture. In a recent correspondence, Elaine Ball, one of the leading voices in geospatial marketing, put it bluntly: “Only those survey service providers that focus on their customers are – and will be – progressing”.

• Drop old habits: In laser scanning, innovations have long been expressed as technical specs of hardware equipment or feature lists of software products. Even the presentation of services often follows the same mindset. At a time when the market is rapidly growing, and ever-more prospects who are novices to the field are showing interest, this approach is no longer viable. Addressing wider audiences a attracting new prospects requires a more accessible language.
• Offer a narrative: A narrative arc, such as a case study, can help prospects to imagine reality capture and digital twin workflows, the project outcomes and their value proposition. The more finetuned these case studies are to the prospect’s use case, the more enlightening they will be. Helping prospects envision the process will also allow service providers to address potential questions before they become issues and improve long-term customer satisfaction.
• Focus on outcomes: All too often, price negotiations revolve around quantifying the input by laser scanning professionals. While there is merit to this discussion from a transparency standpoint, it detracts attention from the benefits to the client. When outcomes are defined in metrics that make sense for the client, it becomes easier for them to estimate the overall value of the services and justify their cost. While collecting information about these metrics may not always be easy, service providers are often best positioned to do so thanks to their proximity to the beneficiary of their services.
Show and tell

Another common saying is “A picture is worth a thousand words,” and this is especially true when communicating complex technical information. Whether it’s an image, a video or an immersive experience, visual content fuels the viewer’s imagination, clarifies value propositions and engages audiences. Coupled with enticing narratives, visuals can dramatically improve how Lidar professionals communicate their services.
Architectural marketing offers a viable blueprint., 3D rendering has become an indispensable marketing tool for architects since the early 2000s. This was due to the increasing availability of affordable 3D modelling and rendering software, as well as the growing demand for

Bert Azizoglu is CEO of NUBIGON Inc. He and his team provide high-performance point cloud visualization and animation software solutions to laser scanning professionals, surveyors, equipment manufacturers and resellers, along with other stakeholders of the AEC industry involved in reality capture. Since 2018, he has co-led the team developing and distributing the point cloud rendering software NUBIGON which has been used in more than 60 countries. His affection for the outdoors and surveying dates back to his time as a surveyor’s assistant.
high-quality visualizations and animations. Today, 3D rendering is an essential part of the architectural design process. It allows architects and designers to create realistic visualizations of their designs, which can be used for everything from client presentations to virtual reality. The technology continues to evolve, with advancements in real-time rendering, augmented reality and other areas making 3D visualization easier to implement and experience.
In contrast, visualizing laser scanning deliverables for marketing has yet to reach its full potential. The Lidar industry has only recently started to appreciate the importance of visual marketing content. This is heavily driven by software advances. Select point cloud rendering solutions like NUBIGON, which was used to render all the images featured in this article, can deliver marketing-ready images, animations and immersive experiences with point clouds and related CAD/BIM deliverables. At the same time, intensifying competition between service providers and the growing importance of social media, coupled with a gradual mindset change, motivates laser scanning firms to focus more on developing marketing content.
Issue 3 2023 19 Feature
Lyndhurst Mansion, New York.
About the author
The real-world impact of visual marketing
According to Antonio Tomecich, a partner at the 3D scanning and as-built modelling firm DCMS operating across North America, the power of visuals in promoting services cannot be overstated. “Visuals simplify complex information, evoke emotions and increase engagement. They help us to explain our technologies, workflows, deliverables and services to clients and prospects,” he says. “Visuals are a powerful tool to showcase our value proposition. , and offer a significant ROI. They simply improve the likelihood of prospects converting into clients.”
Szymon Bloch, the CEO of Scan 3D, a rapidly expanding 3D scanning and BIM modelling firm with offices in Poland and Germany, concurs: “Our 3D scanning services are becoming increasingly popular. To a large extent, we owe this to easily produced, fantastic visualizations demonstrating the tangible benefits of our services.”
Animations are a noteworthy category of marketing visuals. At a time when audiences are inundated by information through social media, emails or trade shows while struggling with shrinking attention spans, service providers only have a short window in which to communicate their value proposition and leave an excellent first impression. “Using animations to demonstrate scan-to-BIM services is a highly effective way to communicate complex information to clients who may not be familiar with technical aspects. In our animations, our clients can see all project deliverables at once, which helps to create a better understanding of the project as a whole and generates more interest and engagement,” states Tomecich. Bloch goes a step further, saying: “Visualizations and animations allow you
to convince the most opposed engineers or architects. It helps that these visualizations sometimes look like works of art.”

Immersive experiences boost engagement

Images and animations are great ways to grab the audience’s attention and leave a positive first impression. The next step in the marketing funnel is to drive the prospects’ engagement with curated immersive experiences. Applications that go beyond plain web-based viewers and feature gamification, augmented reality (AR) and virtual reality (VR) offer exciting new ways to help prospects explore laser scanning deliverables.
Elaine Ball points out the importance of geospatial expertise for VR/AR: “These technologies allow businesses to create immersive experiences for customers, where they can interact with products and services in real time, using geospatial data to provide location-based information and recommendations. The integration of geospatial data and technologies into marketing campaigns is likely to continue to grow in importance, with surveyors playing a vital role in providing accurate and reliable data to support these efforts. So these service providers can take advantage of their very own data to market their profession.”
The importance of strategic planning
Strategic planning is crucial when putting the lessons outlined in this article into practice. To bear fruits, efforts to learn more about target segments, frame the value proposition as a narrative with quantifiable outcomes, and boost attention and engagement with visual aids must all be coordinated. When implemented effectively, they deliver returns and can even help the service provider to redefine their profile.
One standout success story is Michal Gula’s journey throughout 2022. At the start of the year, as the CEO of a small local surveying and laser scanning firm in central Europe with 800 followers on LinkedIn, he was coming to terms with the fact that his job as a reality capture professional would be changed heavily by robots and AI in the next five to ten years. “If I want to stay relevant, I need to move from daily outdoor scanning into a high value-added position. I started with networking, researching new hardware
Issue 3 2023 20
A historic power plant, Istanbul.
A commercial building facade, Leeds.
and software solutions, and posting daily on social media – mainly LinkedIn,” he says.

By blending animations from his laser scanning and reality capture projects with innovative, industry-relevant tech content, he accumulated a dedicated following of 20,000 industry professionals by the end of 2022. When asked about the return on this effort, he responds: “This helped me to get more known in the industry worldwide, to expand internationally with our core business and to start collaborations across the world with training and consultations. I feel much more prepared for the future.”
Pushing the
limits of reality
capture Another service provider who successfully leverages the power of visual marketing is Derek Lawrence, a UK-based reality capture specialist and chartered engineer. After leaving his position as associate director at international industry giant ARUP, Lawrence started a reality capture consultancy firm, Twindl Limited. Soon after, he began working with GeoSLAM and other industry stakeholders, exploring new avenues to deploy reality capture technologies. He captures extraordinary sites to test hardware and software products and regularly showcases his experimental projects through videos on his social media accounts.
He finds that surveyors are beginning to recognize the transformation of their job profile, “as their traditional data capture
roles move more toward consultancy about data manipulation for their clients. This is timely, as technology advancements make surveying more accessible for non-surveyors, increasing the demand for data processing, management and visualization skills.” This new job profile, he argues, bears great potential in bringing about long-needed efficiency gains in the AEC industry. “Giant leaps in efficiency can be made in this sector through the multi-purpose use of survey data. You may have historically carried out a Lidar scan to establish the location of objects in a space with millimetre accuracy. However, this data can be used for all sorts of things like staff onboarding, asset management, lighting analysis and so on. Visualization of this data is the common ground where people with different skills can quickly see what has been captured and ask questions about how that data might be used for their purposes. Before you know it, a piece of work captured for one use has multiple outputs, improving the efficiency but also making the cost to collect the data more reasonable – to a point where it becomes business as usual.” It appears that a focus on data visualization not only helps communicate current laser scanning services more effectively, but is also a powerful step towards the future of reality capture.

Issue 3 2023 21 Feature
The Roman Forum, Rome.
Lakewood Ranch, Florida.
GOING THE EXTRA MILE SO YOU CAN, TOO!
The UltraCam Eagle 4.1 delivers the efficiency, flexibility and photogrammetric-grade quality you need to succeed in today‘s rapidly evolving market: Over 28,000 pixels across the flight strip, three exchangeable lens kits, high-resolution PAN sensors and multi-directional Adaptive Motion Compensation (AMC).

LEARN MORE in our free webinar:
• Accurate georeferenced bathymetry and cartography missions, search and survey in hard-to-reach areas
• Autonomous and remotely-controlled operation
• Data logging and real-time acquisition over redundant mesh network
• Exchangeable battery packs for 9+ hours of operation
• System software for planning, execution and data evaluation
• High-precision measurements and recordings, different GNSS and sonar options available

• Rapid system deployment, excellent maneuverability and area coverage with powerful and efficient drives
OBJECT RECOGNITION
• objects of interest are detected and highlighted live during the mission
• AI-based system as an extra module that runs directly onboard the vehicle and analyses raw data
See it in action at OCEAN BUSINESS!
NEW
MULTIBEAM
SONAR AVAILABLE
18- 20 April 2023
Southampton, UK STAND M4
sales@evologics.de
sales-us@evologics.com


EvoLogics.de

How airborne geospatial data has become a powerful tool for understanding the world
Uncovering the competitive advantages of aerial surveying
By Ada Perello, EAASI
What are the primary technical differences between crewed and uncrewed aerial vehicles and satellites? Where do they overlap, and where do they diverge? By comparing and contrasting the various aerial surveying platforms, this article helps readers to gain a better understanding of the distinctive advantages and limitations of each tool, and how they can be utilized in various situations.
Geospatial technology has transformed our understanding of the world over the last few decades. Aerial surveying, which has been in existence for a century, has progressed in tandem with aviation to become a crucial tool for capturing high-quality data. In addition to the conventional methods of aerial surveying, such as photography, Lidar, thermal, hyperspectral and radar, uncrewed aerial vehicles (UAVs or ‘drones’) and satellites have become ubiquitous tools for capturing images of the Earth’s surface.
Showing us the world from above
In the 1920s, Heinrich Wild invented the first photogrammetric aerial camera, the C2. Over the next 80 years, the industry progressed from analogical to digital cameras, giving photogrammetrists the ability to create detailed maps faster than ever before. With the objective to streamline the process and handle a larger amount of data, allowing users to receive more detailed and accurate datasets faster, the aerial surveying industry was an early adopter of digitalization. As a
consequence, the first digital cameras and Lidar sensors appeared around the year 2000.
Subsequently, advances in cloud computing have meant that more accurate data than ever can be obtained quickly. The digitalization of processing, in combination with an increase in demand by the digitalizing of societies, has accelerated adoption of the aerial survey as a business model in the private sector. Nowadays, there are around
Issue 3 2023 23 Feature
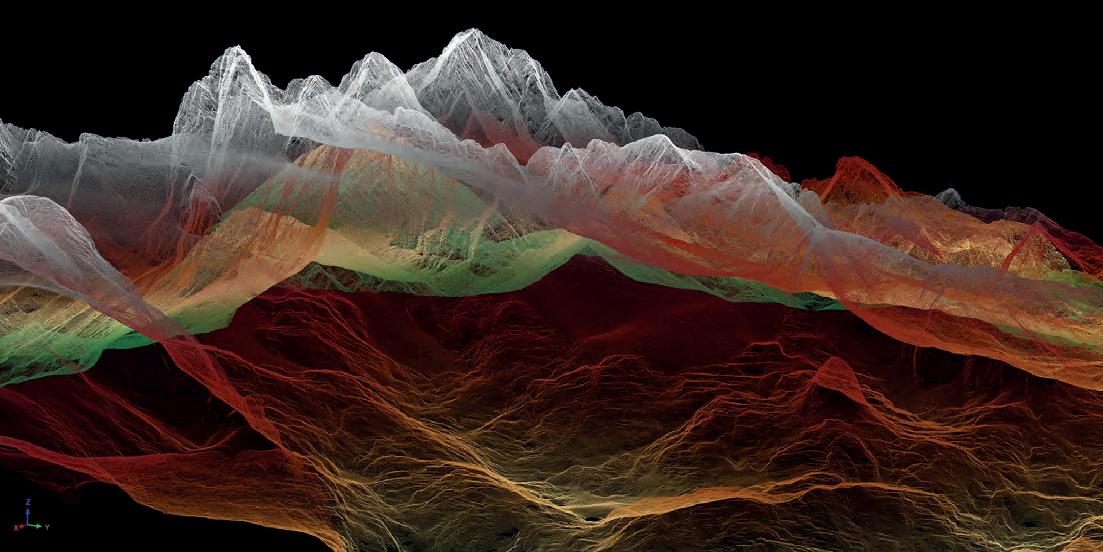
Semi-transparent 3D view of the Dachstein mountain range, Austria. (Image courtesy: RIEGL)
60 aerial surveying companies in Europe, according to the European Association of Aerial Surveying Industries (EAASI).
On the other hand, satellites have been used for Earth observation (EO) since the launch of Vanguard 2 (USA, 1959). In 2021, over 950 EO satellites were in orbit, recording data with both passive and active sensors and acquiring more than ten terabits of data daily. Satellite images are used nowadays for mapping, environmental monitoring, agriculture, disaster response, climate research, urban planning, defence and security, and natural resource management. Meanwhile, drones have evolved rapidly since the 1990s, with advances in technology enabling them to perform a wide range of tasks.
Image resolution: where do we stand?
In terms of resolution, despite the significant technical developments, satellites offer the lowest resolution. Commercial satellite operators are currently able to provide imagery with a ground sample distance (GSD) of a maximum of 30cm, which in some cases is resampled. On the other hand, drones can capture images with much higher resolution than satellites. The


resolution of drone images depends on the above ground level (AGL) flying height of the drone, with lower heights resulting in higherresolution images. For example, a drone flying at the height of 100m can capture images with a GSD of around 2cm. But does this mean that drones are more efficient?

Crewed airborne platforms, such as aeroplanes and helicopters, can capture images with similar resolution to drones, but can do so by flying at a higher AGL due to the utilization of higher-quality optics. Image sizes are larger due to higher-resolution cameras, resulting in footprints on average six times bigger. Nowadays, photogrammetric cameras carried by aeroplanes provide an average of 300Mpx arrays, while drones provide 50Mpx on average. The combination of bigger sensors with higher speeds (180 knots for aeroplanes versus 44 knots for drones) and prolonged flying time (five hours for aeroplanes versus 40 minutes for drones) allows aeroplanes to capture more extensive areas in a single mission, which leads to higher productivity and efficiency. In addition, the smaller size of sensor arrays of drone-mounted sensors results in a much higher number of images. In cases of corridor mapping (e.g. highway planning, powerlines), data capture with an aeroplane may be resolved with one flight line, whereas it may require several lines when using drones.
The quality of the optics plays a significant role in the sharpness of images captured by aeroplanes. Aerial images faithfully represent terrain and objects and are used as input for cartographic processes. Camera optics and sensors (CCD or CMOS) are never perfect. Optical projections are not uniform across the image (focal plane), so the sensors must be calibrated to correct existing distortions. Large-format cameras are ‘metric’, meaning that they have been calibrated in the manufacturer’s laboratory. They are built to keep distortion very low and stable over time, guaranteeing that images can be processed with high accuracy. Smaller cameras used on drones are in most cases ‘non-metric’ or ‘semi-metric’, meaning that they use self-calibration software. Their distortions are more prominent and change dramatically due to environmental conditions like temperature. These variations cannot be corrected completely, and measurements lack the accuracy of large-format aircraftmounted cameras.
Issue 3 2023 24
Hyperspectral image of an alpine forest in Italy. (Image courtesy: AVT Airborne Sensing)
Ada Perello is the communications manager at the European Association of Aerial Surveying Industries (EAASI), which was established in 2019 to unite companies generating geographic data from crewed aerial platforms and has experienced rapid growth ever since. Prior to joining EAASI, Perello worked in external communications for organizations like IMO, FAO and the private sector. She holds a master’s degree in Journalism and International Business Administration.

Sensor integration
In the case of crewed airborne surveys, the aircraft can carry a range of complex and multiple sensors, making it a highly versatile tool for mapping large areas. Lidar is a highly accurate and efficient technology that can create detailed 3D maps of terrain, vegetation and other features. It can be used as a single sensor or in combination with photogrammetric sensors (oblique/ nadir RGBI imagery), providing a more comprehensive view of the surveyed area. Aerial survey companies are using a Lidar technology that allows data capture while flying at from a few hundred metres up to 6,000m AGL, providing more accurate results than those provided by solid-state Lidars which are used in many drones.

Furthermore, piloted aircraft can capture a range of non-visible data such as infrared, thermal, synthetic-aperture radar (SAR) and multispectral imagery, using them alone or combined. Sensors used in aircraft not only have higher resolution and are metrically calibrated, but they use better-performing inertial navigation systems (IMUs) that allow direct georeferencing of the sensors with three to four times better precision than the smaller solid-state IMUs used on drones. Crewed aircraft have enough room to mount sensors on gyro-stabilized platforms that keep the camera axis vertical (within certain limits) against deviations caused by wind and turbulence more precisely than the gimbal stabilizers used on drones. Considering that crewed aircraft are much less sensitive to wind and turbulence than drones, this results in less motion blur, improved image quality and more uniform flight lines.
As for Lidar, whose dependence on direct orientation is much greater than in photography, the difference in IMU precision is particularly relevant, as well as the difference in power, pulse frequency, laser range precision, number of returns and other features. Therefore, Lidar for aircraft outperforms drone systems by factors of from two to ten. Additionally, aircraft can be used for bathymetric Lidar surveys, which are conducted solely by aeroplanes due to their ability to carry the necessary equipment and power supply. This combination of features and functions is essential for applications such as environmental monitoring, where non-visible data can provide critical insights into the health and well-being of ecosystems. For instance, a piloted aircraft equipped with a thermal imaging camera can identify areas of
Issue 3 2023 25 Feature
About the author
neighbourhood produced from ITRES thermal imagery. (Image courtesy: MyHeat)
Point cloud of the Château de Chambord captured by a small light aircraft. (Image courtesy: YellowScan)
What the manufacturers say
A number of partners of EAASI were asked for their views on the current competitive advantages of crewed airborne systems and the future of the aerial survey industry.
Layton Hobbs – Product Line Director for Airborne Solutions, Leica Geosystems, part of Hexagon
“We’ve seen that the aerial survey industry has been able to adapt to (and adopt) technology changes since the early days. Today, aerial surveyors use sophisticated digital sensors coupled with highly complex inertial and GPS measuring systems, lasers and time-of-flight sensors capable of measuring the speed of light over only a few metres. In the near future, we see sensor systems continuing to integrate different modalities into a single platform, allowing for new types of remote sensed data to feed artificial intelligence (AI) and machine learning (ML) analysis. We expect sensor performance to continue to increase, but also for sensor capabilities to expand and offer richer 3D data with more information stored for each measurement on the ground.”
Alexander Wiechert – CEO, Vexcel Imaging
“Each technology has a reason to exist, with benefits and downsides. I see more potential threats for crewed aerial surveying coming from drones than from satellites in the near future. However, drone operation is currently heavily limited, and the payload is still small. This is why the current use of drones is a niche to survey points of interest and small-scale areas. The situation may change in the future as we advance in general towards a more automated operation in technologies, but it will take time as the airspace regulations will need to change, and this is usually a slow process.”
Philipp Grimm – CEO, IGI Systems
“I think that disaster response is one particular example of the competitive advantages of aerial surveying versus drones or satellites. For instance, during the German floods two years ago, many of our clients were flying to collect information about the status of the disaster area. Emergency response teams, firefighters and police needed to obtain this information fast to organize assistance on the ground, decide where to place bridges, etc. These specific situations demand a quick flight response and fast image processing that is only possible with crewed aircraft.”
Peter Rieger – Manager, Airborne Laser Scanning Business Division, RIEGL
“The development of drones and other aerial platforms is also likely to expand the applications of aerial surveying beyond traditional industries in the next five to ten years. For example, drones can be used for environmental monitoring, disaster response and search and rescue operations. This could lead to new opportunities for surveying companies and other businesses in the industry.”
Thibaud Capra – Product Manager, YellowScan
“In any Lidar data acquisition for surveying purposes, it’s all about the scale and cost of operations, while meeting the mission requirements and scope of work. Aerial missions are ideal for larger-scale operations, which would be too tedious for UAV flights while keeping a better resolution and level of detail than satellite imagery. It also has a flexibility of data quality as you can fly lower to improve the point density, for instance. Moreover, it is safer as you have no boots on the ground, and you’re able to survey large areas that can be too risky to crawl in or access with the necessary equipment, batteries, etc.”
heat loss in buildings and monitor wildlife populations that may be invisible to the naked eye. Projects of this kind are sensitive to changes in ambient temperature, so the thermal imagery needs to be obtained quickly. The more homogeneous the temperature is during the shot, the better. It is almost impossible to execute this type of project with a drone in relatively large urban areas.
The weight factor also plays an important role. Sensors, together with the stabilized platform and control equipment, amount to between 90 and 120kg as a complete system. Currently, there is no civilian drone that can handle that weight – and even if there were, it would be extremely expensive considering that a drone capable of carrying a payload of 40kg can cost half a million euros.
Fast supply of data
Another advantage of crewed aerial surveying is the time needed to obtain the data. When covering smaller areas (e.g. a few hundred square kilometres) or flying specific corridors, aircraft offer greater efficiency and speed, even when flying in overcast conditions below the clouds. This is because satellites cannot easily change their scheduled orbit or capture clear images in bad weather conditions. And while drones could offer more flexibility, they cannot access urban environments easily due to current flight restrictions. Furthermore, drones are susceptible to adverse climatology.
The human element
The human element is one of the key factors in crewed aerial surveying. A human operator can provide more nuanced decision-making in complex scenarios. At the same time, the pilot can respond to real-time changes in the environment. For example, changing weather conditions, air traffic, snow on the ground and leaves on trees can all affect the quality of aerial data. The crew can adjust the flight path or altitude immediately to ensure the data collected is of the highest quality. Airborne data offers technical advantages in addition to the differentiating factor of flexibility. Furthermore, human decisionmaking is important for ensuring data quality by identifying and correcting errors in real time and for managing risks and challenges that may arise during data collection.
Issue 3 2023 26
Excellent examples of the relevance of human judgment are those projects in which external factors determine the mission, such as tidal changes when working on coastal projects for instance.
Key advantages of each platform
We are witnessing a complex panorama in continuous evolution. Technological advances and ambiguous marketing statements lead us to a scenario where the differences between images obtained by satellite, drone and aerial mapping are quickly blurred. Key advantages of drones include their relative affordability, ease of operation and their capability to fly at a lower altitude and closer to structures than crewed aircraft. This makes them particularly useful for applications such as building inspections, transmission tower surveys and small network surveys.
Satellites offer the advantage of being able to collect data on a global scale and over large areas, as well as a high revisiting rate and not
being affected by air traffic limitations. This makes them particularly useful for applications such as climate monitoring and land use mapping, where frequent, large coverage is prioritized over high resolution and accuracy.
It is important to consider the legal reality, especially regarding drones, as they face flight restrictions limiting their use in most countries. In Europe, drones are generally not allowed to fly above 120m in height, beyond the operator’s visual line of sight (BVLOS) or more than 500m horizontal distance. Moreover, drones are not allowed to fly in restricted areas such as airports, emergency areas, densely populated urban areas and other areas as determined by local authorities. Therefore, their general use for urban mapping is not allowed currently.
Conclusion
In conclusion, crewed aerial surveying offers a unique set of advantages for collecting highresolution, timely and accurate data in a wide range of conditions. While drones and satellites have their own advantages, crewed aerial surveying remains a valuable tool for a variety of geospatial applications. The human element is also a critical competitive advantage since it allows greater flexibility in obtaining data and rapid adaptation to real changes.
However, all types of platforms (UAV, aerial and satellite) will provide crucial and useful data at various levels of quality and scale. It has been proven that using data from combined sources leads to better results in many projects. It is vital that clients and end users know and understand in detail the differences between the data sources, which allows them to choose the platform that will best fit their technical requirements.

Issue 3 2023 27 Feature

Unexplored promotion and management tools for urban regeneration
Supporting urban spaces with UAV mapping and 3D modelling
By Alexandros Skondras, Ifigeneia Skalidi, Ioannis Tavantzis and Efstratios Stylianidis, LabGeo, AUTh, Greece
The management of urban spaces has been a focal point in participatory planning due to the plethora of new technologies that have emerged. A team from the Laboratory of Geoinformatics at the Aristotle University of Thessaloniki (AUTh), Greece, explored the contribution of UAVs to the spatial mapping process in urban environments. The collection of quantifiable and qualitative information and the usage of 3D modelling enable a more comprehensive understanding of the urban environment and facilitate the urban regeneration process.
The urban environment consists of bordering areas of anthropogenic artificial surfaces used for transport, trade, production, administration and housing, and vegetation surfaces that are intensively managed and directly influenced by the artificial cover. For a better understanding of the urban system, extensive mapping and monitoring of the built environment are required. Nevertheless, achieving high accuracy in these tasks is challenging due to the impervious and complex nature of constructed surfaces and buildings. Photogrammetry with the use of uncrewed aerial vehicles (UAVs or ‘drones’) is a fastdeveloping approach that aims to tackle this problem.
Data acquisition
A team from Aristotle University of Thessaloniki, Greece, commenced a study of the use of aerial imagery to achieve wide coverage of a predefined geometrical area of interest. The selected area, which spanned a total of 81,000m2, was mapped utilizing Pix4D Capture software. Images were acquired with the drone camera, with the flying height set at 93.34m above ground.


The predefined route (Figure 1) was flown twice to guarantee the collection of highquality images. Each flight lasted 20 minutes, amounting to two hours for the entire data acquisition process. In total, 231 geotagged images were acquired with 80% overlap.
Generating the 3D model
The 3D model was achieved by using Pix4Dmapper software and by following a typical photogrammetric workflow:
- Selection of appropriate geotagged images for processing
- Optimization of the key points and computation of the photo matches
- Tie points analysis
- Generation of dense point cloud and 3D textured mesh (Figure 2)
- Interpolation of point cloud points for the generation of the digital surface model (DSM)
- Orthorectification on the DSM, producing the final orthomosaic (Figure 4).
Issue 3 2023 29 Feature
Figure 1: Drone path used for mapping the area.
Figure 2: The 3D texture mesh generated from the collected data.
Texture mapping and rendering
Blender was used to deliver a photo-realistic rendering of the 3D model, and the team succeeded in tying the triangles of the model with the source image. When this process was prevented by physical obstacles such as trees, plants, lighting poles or a lack of overlapped images captured by the UAV, a similar-looking position and a curb of points were utilized instead (Figure 3).

The area of interest could finally be visualized with a low percentage of footprint deviation. The level of detail (LOD) of the 3D model achieved from the production workflow was LOD1, a suitable level for utilization in participatory planning research. The built environment, urban voids and the boundaries of the area could be accurately detected using the 3D texture mesh and the orthomosaic generated from the collected data (Figure 4).
Urban and participatory planning enhancements
The resulting 3D model enables a comprehensive understanding of the urban environment. It elevates the visualization and presentation of the area, and it facilitates the area’s integration and measurements into the context of smart cities, environmental applications, and strategic urban and participatory planning (Figures 5 and 6).
The process focused on measuring and describing spatial problems and conflicts, as well as prioritizing shortcomings of the area. This makes it possible to scope and appraise a potential range of results, to identify and seek alternative solutions, and
to monitor, implement and revaluate the potential of different strategic design processes and detailed design solutions. The action phase of the design implementation of the research is still speculative and the research does not integrate the practical demonstration and usage of the models obtained in the process, because the scope of the research limits providing new means for information needs in spatial participatory planning. Nevertheless, the geospatial information processed in the study can provide both impact and counter models that can address location, resources and conflicts of events, potential models to plan operations in the area, and spatial visualization and possible intervention scenarios.
The results can be used for crowdsourcing in participatory decision-making processes and for exploring the consequences these have on the built environment. They can also be used as a new way to involve citizens in local decision-making processes. Even untrained parties can better understand the ramifications of every strategic impact on their community, made possible by the potential of 3D modelling of the urban space.
Complementing mapping products with 3D models
Models obtained by utilizing photogrammetric workflows (using UAVs) can complement models obtained by terrestrial laser scanning. UAVs enable data collection from nadir points of view. This overcomes the shortcomings of the terrestrial method, namely that many of the points cannot be reached without time-consuming and costly ground techniques which are also subject to strict regulations and private ownerships. Aerial images efficiently produce photorealistic 3D models, thus reducing the time and cost involved in any project.
Moreover, 3D modelling by means of photogrammetry is also beneficial for participatory planning. Data collected about the built environment is easily integrated into local spatial knowledge databases and can produce georeferenced and scaled models. It can also accelerate future administrational projects within the surveyed area, assisting with the brainstorming about subsequent implementations relating to the evolution of public space, such as land use, community gardening, pocket parks and cultural ephemeral spaces. The derived information reinforces the identification and analysis of the participatory problems and can advocate the priorities and the systematic exploration of potential solutions. Furthermore, through joint monitoring, it can provide feedback on the activities, and address collaborative design between stakeholders and participants.

Issue 3 2023 30
Figure 3: Rendered image of the mapped research area showing the nadir view.
Figure 4: Urban analysis of the research area using the data collected from the final orthomosaic.
Conclusions
3D modelling provides rich datasets which facilitate the creation of automated urban analysis. The suggested approach, with the use of UAV photogrammetric data, analyses and validates quantitative and qualitative urban parameters and provides stakeholders with a photogrammetric point cloud that has a higher point density than Lidar point clouds.


The resulting wide and detailed contextual views of the urban environment can be scaled, from views of buildings and streets to views of whole neighbourhoods. Therefore, they can be used for multiple purposes, ranging from a single building or block to a whole neighbourhood or territorial department of the city. The oblique and overhead views can support conceptual graphics and overlays for site analysis, thus providing an important amount of material for architects and urban planners. This material, and especially the captured images, can also be marketed in order to support general projects in the built environment as well as the progress of infrastructure construction in both the public and private sector (by using ‘before’ and ‘after’ images). Additionally, the inspiring videos and images can be used to foster public engagement from within local
Further reading
communities. Importantly, due to the accuracy and reliability of the obtained information (even in inaccessible areas), this approach also facilitates the automation of urban analysis, assisting in the regular, periodic performance of urban monitoring tasks.
The application of UAV photogrammetric mapping and 3D modelling in the urban space will significantly increase in the near future, as UAVs will become more affordable. In addition to that, their use will have major impacts on numerous areas in the field. As the surveying and urban and participatory planning research communities continue to embrace these new technologies, their use in the urban space can become standard procedure in those sectors.
Acknowledgements
This research was realized thanks to the contributions of the PhD candidates and researchers at the Laboratory of Geoinformatics, Aristotle University of Thessaloniki, Greece, especially Elena Valari, Eleni Karachaliou, Nikolaos Tokas and Giovanni Bouvet.
Issue 3 2023 31 Feature
Skondras, A.; Karachaliou, E.; Tavantzis, I.; Tokas, N.; Valari, E.; Skalidi, I.; Bouvet, G.A.; Stylianidis, E. UAV mapping and 3D modeling as a tool for promotion and management of the urban space. Drones 2022, 6, 115. https://doi.org/10.3390/ drones6050115
Van der Linden, S.; Okujeni, A.; Canters, F.; Degericx, J.; Heiden, U.; Hostert, P.; Priem, F.; Somers, B.; Thiel, F. Imaging spectroscopy of urban environments. Surv. Geophys. 2018, 40, 471–488.
Figure 5: Rendered image of the mapped research area from the oblique view, showing the addition of new buildings to improve the urban space.
Figure 6: Rendered image of the mapped research area from the oblique view, showing the addition of new buildings to improve the urban space.

Reality capture trends shaping an autonomous future
 By Jürgen Mayer, Hexagon’s Geosystems Division
Population growth, urbanization and rapid digitalization all represent global challenges. However, they also offer opportunities for the geospatial industry, because reality capture technology is an essential part of the puzzle to solve them. With the barriers to adoption getting lower every year due to various technological advancements, we are moving ever closer to autonomous reality capture, paving the way for smart digital realities.
On 15 November 2022, the global population hit eight billion, and experts project the number of people on this planet to reach ten
billion by 2050. This population growth will require us to manage the increased pressure on natural resources and infrastructure as
well as the expanding demand for individual mobility. The fact that more and more of the world’s population are living in urban areas –
Issue 3 2023 33 Perspectives
A mobile mapping vehicle of Dutch digital twin specialist RISE3D on the streets of Rotterdam, the Netherlands, equipped with the Leica Pegasus TRK700 mobile mapping system.
predicted to reach more than 70% by 2050 – is driving demand for new infrastructure and building construction, necessitating the refurbishment and improved maintenance of existing buildings. Meanwhile, rapid digitalization means an exponential increase in the volume of data we create daily, with virtually every aspect of life being captured and stored in digital form. We need to ensure we create value from all the data we collect.
These three megatrends – population growth, urbanization and digitalization – clearly represent challenges, but also offer opportunities to find innovative ways to address them. Reality capture technology is an essential part of the puzzle.

Taking digital twins to the next level
To appreciate the importance of reality capture, you need to understand the concept and impact of digital twins, i.e. digital representations of the real world. Digital twins allow you to conduct tests in the virtual environment to derive valuable insights before money is spent or resources are wasted. They have actually been around since the 1960s when NASA created
digital twins to run simulations. These were a lot more efficient than risking the destruction of spaceships and onboard technology.
Today, we use different types of sensors to capture reality and deploy advanced software to create 3D digital models. However, the digital twin is a snapshot. Its next iteration – what we in Hexagon’s Geosystems Division refer to as the ‘Smart Digital Reality’ – fuses the digital world with the real world to create one frequently updated, data-enriched and AI-enhanced reality. Consider a building construction project. As part of building information modelling (BIM), you create and constantly update a replica of the current state of your construction project. You can compare the model to the design to check whether the as-built situation corresponds to the plans and whether the project is progressing as scheduled. Such information enables project leaders to react in a timely manner and correct errors, adjust schedules and manage material flows based on the actual on-site situation. The adjustments are then tracked again within the digital model. This results in a continuous feedback loop between the virtual world and the real world.

Putting data to work
Smart digital realities move reality and its digital twins closer together and put data to work in ways that go far beyond what was ever thought possible. They represent one reality, consisting of two closely connected worlds, where processes become more autonomous. These augmented digital realities allow you to automate the process outlined above. For example, a robot moves autonomously through a building and sends up-to-date data to the cloud, where artificial intelligence (AI) analyses and labels the data for use in the real world.
The information exchange between the virtual and the digital worlds could take place, for example, in the form of augmented reality that places a layer of information on the real environment. You may see information displayed in the real world that tells you where specific items are located or where you need to move. Going beyond individual buildings, you can create digital twins of cities and even nations. You can then simulate how new buildings will affect the airflow or how development measures will affect traffic, for instance, plus much more.
Issue 3 2023 34
The all-new Leica BLK360 is a prime example of how technological innovation is putting reality capture within reach for a larger range of professionals.
The technology behind digital reality capture
Reality capture technology has become more intuitive and userfriendly, so the barriers to adoption are getting lower every year. 3D laser scanning is one of reality capture’s core technologies. Over the years, two technologies for laser distance measurements have become especially important: long-range, high-accuracy pulse scanners, and short-range, ultra-high-speed phase scanners. As scanning technology continues to mature, these two technologies have merged into 3D laser scanners that now combine the best characteristics of the technologies. At the same time, they have become smaller, lighter, more portable and easier to use. A broad range of products – from static terrestrial laser scanners to mobile scanners and even handheld, scanners – makes the technology suitable for a variety of different requirements.
A number of technological innovations are putting reality capture within reach for an even larger range of professionals. Simultaneous localization and mapping (SLAM) technology makes it possible to map large outdoor areas while keeping track of the location within that area. SLAM allows surveyors to capture large and complex areas quickly using autonomous robots, aerial laser scanners or vehicles. The technology is highly versatile; for example, the video game developer iRacing currently uses mobile mapping systems to capture NASCAR race tracks in 3D. It feeds the 3D data into simulation
About the author
Jürgen Mayer serves as the president of Hexagon’s Geosystems Reality Capture Division, drawing on his knowledge from his MSc in Surveying and Engineering from the Technical University of Vienna, Austria, as well as a Master of Business Administration from the University of Strathclyde, Scotland. He has held various positions at Leica Geosystems and Hexagon since August 1999, and his focus remains on driving digitalization and shaping smart change across industries through the implementation of reality capture technologies.
to make sense of the data and to extract relevant information from images and point clouds. AI-enhanced software can automatically recognize, classify and label objects, which is a significant first step towards automating the entire modelling process.
Three characteristic results of reality capture innovations make the technology attractive for new users in several ways:
• Completeness: The latest reality capture technologies enable professionals to capture complex environments in their entirety with high accuracy to facilitate the mapping of areas that were previously impossible to map.
• Speed: Capturing environments at high speed does not merely lead to enhanced productivity but, in some environments, also enables professionals to record details of a scene more safely.
software that helps racing drivers familiarize themselves with the track, just like a pilot practicing in a flight simulator. The same mobile mapping systems can capture long stretches of highway to simulate autonomous driving behaviour.
The latest sensors in the industry combine laser-based distance measurement technology with camera-based imaging technology. In the future, the data-capturing process will likely become less linear. Professionals will use a combination of different sensors to create visual representations – perhaps using a handheld imaging laser scanner to capture the interior of a building as they walk, a 3D laser scanner or an aerial laser scanner to capture its exterior, and then merging the collected data within one 3D model. Humans might operate some sensors while autonomous robots may cover areas that are difficult or dangerous to access such as, for example, nuclear power plants.
Bridging the data leverage gap

3D laser scanning devices collect a large amount of data within a very short time. Artificial intelligence is now being used to close the data leverage gap so that unprocessed data is transformed into valuable and accessible information. AI applications help to clean datasets,
• Visualization: Reality capture deliverables facilitate intuitive representations and enable immersive experiences that help nonexperts grasp crucial information intuitively.
Moving from automation to autonomy
The next big step will be automating the entire process, from capturing through preparing and analysing to presenting the data. Autonomous reality capture will rest on robotic carriers, laserbased sensors and AI-based software. Technology that combines the benefits of laser-based technology with imaging to allow for the automatic positioning and autonomous movement of robotic carriers will be crucial. Collaboration platforms which provide access to cloudbased storage and visualize reality capture and geospatial data are central to fulfilling these autonomous capabilities.
After connecting the physical world to the virtual world, the next step will be linking the smart digital reality to the metaverse. Although the metaverse is popularly known as a virtual environment for social interaction, in Hexagon’s Geosystems Division we see it more broadly as the next evolutionary step of the internet towards a universal and immersive virtual world that connects people to real places, people and things. What may seem like science fiction today will likely become a reality sooner than we think.
Issue 3 2023 35 Perspectives
Smart digital realities move reality and its digital twins closer together and put data to work
Actively supporting open geodata activities in Central Asia
Being an AI analytics SaaS start-up in the Earth observation market
By Georgy Potapov and
Pirogov,
What is it like to be a start-up in the Earth observation market? Geoalert has developed an AI-powered SaaS platform called Mapflow.ai and promotes streaming services for Earth observation data. After being established in Russia in 2018, the company relocated to Uzbekistan in 2022 and was incorporated in the USA in 2023. The company actively supports open geodata activities in Central Asia.
Analytic services and Earth observation (EO) data would appear to be well matched, as it’s all about the interpretation of a large number of pixels and extracting information about real-world objects. Moreover, the development of big-data tech has unlocked opportunities for cost-effective solutions and implementations into many business processes, contributing to overall market growth. However, the Euroconsult Report (2021) says that there is still poor adoption: Earth observation accounts for about about 2% of all downstream applications vs 14% of upstream, which means that the data services from the growing number of sensors are far exceeding the capacity of the applications market. Therefore, building a software-as-a-service (SaaS) product seems like a viable and reasonable strategy.

Data distribution via streaming services
The SaaS model heavily depends on data as a service (DaaS) and both significantly contribute to market development by increasing data consumption and leveraging the use of geospatial imagery. Data providers like Maxar moved their most recent archives to the cloud, so every data analyst or developer can now connect online to the latest, updated high-resolution imagery. In Geoalert’s experience, however, the traditional imagery distribution model (files by FTP) still prevails in the customer mindset, especially among customers in the governmental sector.
Platform as a business model
For Geoalert, as for many companies, the SaaS business model is a trade-off between maximizing the revenue and investing in product development for company capitalization. When it comes to SaaS and analytics, Geoalert’s business model broadly covers data distribution and analytics, but does not extend to sales distribution. The start-up has two revenue streams: subscriptions to the platform (Mapflow Premium) and integrated solutions (Mapflow Custom). The first category comprises all customers who purchase standard plans and require little to no customization. The second category constitutes customers who require Mapflow to be extended or integration with external products as a custom solution.
“Usually, it comes down to the adoption of the current AI analytics models to the customer’s domain,” states Georgy Potapov, CEO of Geoalert. “Our optimistic forecast is based on the assumption that
Issue 3 2023 36
Andrey
Geoalert, Uzbekistan/USA
Building detection and classification with Mapflow Buildings model.
the contribution of Mapflow subscriptions (SaaS model) will rise with the increase in the number of clients, while the share of tailored projects will diminish as Mapflow’s functionality evolves and starts covering more cases.” To this end, Geoalert provides a Mapflow API to encourage more partners to leverage geospatial imagery analysis and mapping for their own solutions and applications. Image Search API allows external developers to search for the available imagery while the Mapflow integration with the data streaming providers enables instant processing of the selected imagery with an AI model. The Data API is designed to manage the user’s own data, organize it into collections (mosaics), reuse it for future processing, and preview it as an XYZ/TMS layer.
AI implementation matters

“We see the growing interest in the idea of AI-assisting tools that help to reduce costs for imagery and human work and speed up the whole thing many times,” comments Andrey Pirogov, Geoalert’s CMO. “However, when it comes to investing in the modification of traditional workflows, business users are somewhat reluctant. To facilitate companies in this integration, we have developed various tools for interacting with the core platform.”
Different stages of the mapping workflow differ in terms of labour costs. For example, an aerial survey can be done in just a couple of hours, while satellite images can be purchased online. Orthomaps can be generated with a high degree of automation using today’s photogrammetric software. The final stage is the most labour-intensive due to manual vectorization. To achieve maximum effectiveness of AI implementation at the next stage, mapping companies usually need to start with a semi-automatic approach based on GIS integration.
According to Geoalert, the basic approach to fine-tuning and customizing the model to meet extended project requirements can be described as follows:
1. Study the specific area patterns with different models and data sources to prepare samples,
2. Agree on the best-fit-possible output to analyse and decide whether further finetuning of the model is required.
3. Agree on all the terms and kick off the project. At this stage, AI-generated data can be validated by cartographers; the more accurate it is, the less validation is required at the next stage.
4. Achieve fully automatic processing with sufficient quality on a large scale.

Custom fine-tuning of Mapflow
Whatever neural network architecture is used, the output results depend on the quantity and quality of the training samples. Geoalert’s approach is to go for a ‘best-fit baseline model’ that can be quickly fine-tuned with additional training sets. These fine-tuned models are integrated into the platform to be selected by the recommendation algorithm with adjusted processing parameters based on the user input data. Around a year ago, the Geoalert team implemented the feedback option into Mapflow.ai, allowing users to rate the processing results by simply scoring them from 1 to 5. As the visual patterns and image conditions change substantially, this user feedback helps them to identify the problematic areas where the current models perform poorly as well as the areas where they can showcase the best of Mapflow performance. By reviewing this feedback, the Geoalert developers concluded that SaaS users consider it to be a useful communication channel.
Powerful imagery integrations
Unlike many EO analytics projects, Geoalert didn’t start with free Landsat and Sentinel
data. Due to low resolution, these sources are not suitable for detailed topographic mapping. Instead, Mapflow is connected to default basemaps like Mapbox Satellite and to commercial imagery streaming services like Maxar SecureWatch. The core Mapflow machine learning (ML) models (Buildings, Forests, Roads, Construction Sites, Fields) were trained with a ground sample distance (GSD) of 50cm, and the new Aerial models are optimized for 10cm resolution. This kind of image resolution makes it possible to train models to detect and map relatively small objects such as rooftop structures or single trees. That works for topomap creation (for scales from 1:500 to 1:25,000), radio frequency network design, classification of vegetation in rural and urban areas, and many other applications.
What’s next?
In terms of next steps to develop the platform, Geoalert has drawn up an ambitious AI-mapping plan:
- To provide the mapping and research community with AI-assisted mapping tools accessible via UI and API.
- To perform AI-mapping on a global scale thanks to the processing engine and active learning framework.
- To enable best-fit imagery selection at the highest possible time rate for rapid change detection and the respective mapping updates.
“The map is never complete,” as they used to say in the OpenStreetMap community –not only because of the blanks or incompleteness of the map features, but also because changes are happening every minute, all over the world. Geoalert’s mission is to ensure they are detected in a timely manner and interpreted intelligibly to provide a clear and current view of the Earth.
Start Up
Issue 3 2023 37
Urban Green Patterns, Amsterdam. Extracted with Mapflow Forest model.
How high-density 3D point clouds
Scanning and 3D modelling for efficient highway surveys
 By Yuzhou Zhou, Bisheng Yang and Zhen Dong
Thanks to rapid improvements in aerial laser scanning systems, they offer great potential in road surveying compared with traditional photogrammetry-based methods. Using the high-density 3D point clouds resulting from aerial scanning, highway surveyors can reconstruct accurate 3D models of road pavements and lateral terrain. This supports road safety inspections and highway expansion planning with higher accuracy and less heavy labour. This article provides inspiring insight into the use of laser scanning point clouds in highway surveys.
Due to the increasing number of vehicles and the changes in people’s transportation needs, upgrading existing highways has become an important issue worldwide. Drawing up practical construction plans and estimating potential costs both rely on high-quality surveys which traditionally require considerable human labour, whether for GNSS field surveys or manual lane digitization. The popularization of mobile laser scanning has drastically changed this situation for surveyors. Aerial laser scanning (ALS) collects large-area point clouds with a point density of up to 10-50pts/m2. Thanks to intelligent point cloud processing techniques, these can be used for automated digital terrain model (DTM) reconstruction and
pavement feature calculation in easy-to-use 3D models of highways.
In general, the workflow starts with fusing multi-source point clouds and recognizing terrain points and road pavement areas. Road alignments and terrain models are then digitized accordingly, facilitating the construction analysis and simulation (Figure 1).
Fusing multi-source point clouds
Fusing multi-source point clouds by transferring them to a unified coordinate system is fundamental to practical applications because this process directly determines the global accuracy of point clouds. The horizontal root mean square
error (RMSE) of original ALS point clouds can reach over 20cm. The fusion contains error adjustments between flight strips, registration of multi-platform data (Figure 2) with overlapping regions, and global coordinates refinement with control point restrictions. In a highway laser scanning project, terrestrial laser scanning (TLS), vehicle mobile laser scanning (MLS) or even backpack laser scanning (BPLS) will sometimes be used as a supplement to ALS, to present detailed point clouds at key elements including bridges, tunnels and interchanges. These scanning techniques including ALS show very different point cloud features (density, distribution, accuracy, etc.) which can pose serious challenges to
Issue 3 2023 38
Figure 1: Highway alignments and 3D models.
their fusion. To overcome the drawbacks of traditional point-to-point registration methods, feature-level registration methods can be applied to overlapped multi-platform point clouds. Another merit of integrating multi-platform point clouds is that it brings control points into global coordinates refinement. To overcome the difficulties associated with ground control points in ALS point clouds, TLS targets can be placed on control points and picked up in the point clouds. Constructing and optimizing a pose graph with ground control point restrictions allows multi-platform point clouds to be globally fused and refined. The RMSE of refined ALS point clouds is within 50mm horizontally and 35mm vertically, which is valid for highway surveying.
Recognizing terrain and pavement points
Original ALS point clouds of highway corridors contain plenty of offground points such as vegetation, vehicles, buildings and roadside fences, but these points are regarded as noise in terrain and pavement modelling. Most existing point cloud processing software solutions offer implemented off-ground point filtering algorithms to output segmented ground points, which constitute the basic data layer for DTM reconstruction. Based on these ground points, pavement areas can be recognized according to the distinct geometric and reflectance features of highways. Pavement point recognition (Figure 3) based on point cloud feature extraction generally calculates regional smoothness, intensity and connectivity, or detects road boundaries. Moreover, the ability and potential of applying deep learning-based point cloud semantic segmentation methods have been shown to simultaneously recognize terrain and pavement points. These automated point cloud classification techniques have strongly accelerated the development of highway inspection and surveying based on laser scanning.


Highway alignments extraction: a novel optimization model
Highway alignments, defined as a specific series of parametric curves, indicate typical geometric characteristics of highways such as curvature, gradient and superelevation. Horizontal alignments consist of circular arcs, straight lines and clothoids, while vertical alignments
Yuzhou Zhou received an MSc degree in Photogrammetry and Remote Sensing from Wuhan University, China, in 2022. He is currently a DPhil student in the Department of Computer Science at the University of Oxford, UK.

Prof Bisheng Yang is currently a professor of Geomatics Engineering and the vice-director at the State Key Laboratory of Information Engineering in Surveying, Mapping, and Remote Sensing of Wuhan University. His research expertise includes laser scanning and photogrammetry, point cloud processing and GIS applications.
Prof Zhen Dong is currently a professor at the State Key Laboratory of Information Engineering in Surveying, Mapping, and Remote Sensing of Wuhan University. His research interest lies in the field of 3D computer vision, particularly including 3D reconstruction, scene understanding and point cloud processing.

contain straight lines and parabolas. Extracting highway alignments based on pavement point clouds requires localizing curve segments and calculating their curve parameters. Various highway structures that clearly reflect the highway alignments include pavement boundaries and lane markings, both of which can be delineated from pavement point clouds. To increase the robustness when facing complex scenes and scanning conditions, a multi-constraint optimization model is designed for calculating highway 3D alignments parameters. This model incorporates highway alignments design specifications – fitting residuals from reconstructed alignments to road boundaries and lane markings – and smoothness between adjacent curve segments, and therefore finds the globally optimized

Issue 3 2023 39 Feature
Figure 2: Multiplatform laser scanning point clouds.
Figure 3: Recognized highway pavement points.
About the authors
highway alignments through iterative optimization. With this model, the 3D alignments extraction results achieved 15cm accuracy, with correctness and completeness exceeding 99.25%, thus satisfying the needs of highway design and construction. Moreover, experiments show that this method is effective at highway interchanges with little human intervention, where complex curve segment combinations exist.
Conventionally, surveyors are burdened with manually delineating road boundaries. Despite the improvements in point cloud semantic segmentation, the gap between discrete road marking and boundary points and the parametric representation of as-built highway geometry still limits automation. This highway alignments extraction method evidently increases the working efficiency and quality.
Highway 3D model reconstruction
Highway 3D models are high-resolution digital representations of highways and their surrounding terrain. Conventionally, road surveyors used to interpolate 3D models with sparse ground GNSS measurements, which is time-consuming and costly and limits the accuracy of the 3D models. ALS point clouds provide much denser data points at centimetre-level accuracy. Nearly all recent studies concerning the generation of highquality models have mentioned the necessity of extracting terrain break lines as constraints to better presenting terrain features. Besides that, in highway scenes, the road boundaries are in accordance with the road alignments. With the result of alignments extraction and the road boundary points, smooth road boundaries are supposed to be supplemented as additional break lines. Without the


constraints of the extracted alignments, the generated 3D model will be over-smoothed near the boundary of highways. Experiments report that, with the supplemented highway alignment restrictions, the RMSE of the 3D model near road boundaries is significantly reduced from 31.9cm to 2.6cm. The RMSE of the generated 3D model is 2.4cm on pavement and 5.8cm on hills and slopes. Figure 4 shows the highway alignments and 3D models at interchanges.
Software development and applications
To make it more convenient for highway designers and constructors to use these results, not only should the point cloud processing software implement the aforementioned automated algorithms, but it also needs to produce customized output that conforms to user habits. The most important are the highway centrelines and cross-sections (Figure 5), and the interpolated terrain grid model. Engineering applications include driving safety analysis, road visibility simulation, designing and earthworks estimation for highway extension.
Conclusion
To summarize, laser scanning is being increasingly used in highway surveying to increase the quality and efficiency of 3D modelling. Key considerations include the fact that the fusion of multi-source point clouds with ground control points is essential in practical applications because this determines the absolute accuracy of data. Similarly, effectively segmenting terrain and pavement points is fundamental for highway 3D modelling. Road alignments extraction presents the detailed geometric feature parameters of highway pavement. Highquality highway 3D models can be reconstructed with centimetre-level precision to support construction analysis. Last but not least, it is important to offer customized digital output according to the habits of designers and constructors.
Acknowledgements
This study was jointly supported by the National Science Fund for Distinguished Young Scholars (No. 41725005) and the National Natural Science Foundation Project (No. 42130105).
Further reading
• Zhou Y, Huang R, Jiang T, et al. Highway alignments extraction and 3D modeling from airborne laser scanning point clouds. International Journal of Applied Earth Observation and Geoinformation, 2021, 102: 102429.
• Dong Z, Liang F, Yang B, et al. Registration of large-scale terrestrial laser scanner point clouds: A review and benchmark. ISPRS Journal of Photogrammetry and Remote Sensing, 2020, 163: 327-342.
• Zhou Y, Han X, Peng M, et al. Street-view imagery guided street furniture inventory from mobile laser scanning point clouds. ISPRS Journal of Photogrammetry and Remote Sensing, 2022, 189: 63-77.
Issue 3 2023 40
Figure 4: Highway alignments and 3D models at interchanges.
Figure 5: Highway cross-sections.
Newly established ISPRS Working Groups for the 2022-26 term
The new Working Groups (WGs) of the International Society for Photogrammetry and Remote Sensing (ISPRS) were approved by the ISPRS Council based on the proposals received from each of the five Technical Commission Presidents (TCPs) elected at the XXIV ISPRS Congress, which was held in June 2022. The topics and the Terms of Reference (ToR) of the WGs have been prepared in coordination with the ISPRS Resolutions, which were approved by the General Assembly, and have been reviewed by the International Science Advisory Committee of ISPRS.

As the basic work units of ISPRS, the WGs are under the direction of the respective commissions and are responsible for the scientific work of the society. They organize
scientific activities such as workshops, research, tests, case studies, questionnaires, tutorials and publications. The activity of each WG is reviewed and evaluated by the TCP.
WGs for 2022-26
There are a total of 52 WGs for the 2022-26 term, including 9 Inter-Commission WGs (ICWGs) jointly managed by more than one technical commission:
• Commission I (Sensor Systems) has 8 WGs and 1 ICWG, including (near-)real-time indoor and outdoor mapping; embedded version, onboard processing and cooperative navigation and mapping; and small satellite systems and constellations.
• Commission II (Photogrammetry) has 9 WGs and 2 ICWGs, including machine learning; algorithmic developments to support autonomous platforms; and integrative and generalizable artificial
intelligence and machine learning.
• Commission III (Remote Sensing), has 9 WGs and 3 ICWGs, including new methods and techniques for processing multi-dimensional remote sensing imagery; remote sensing applications; and geospatially-enabled monitoring of UN SDGs.
• Commission IV (Spatial Information Science) has 11 WGs and 2 ICWGs, including multi-dimensional and semantically rich data models; spatial analysis and advanced visualization; and information services and applications.
• Commission V (Education and Outreach) has 6 WGs and one ICWG focused on education, training and resource-sharing. Each WG is led by one WG chair, a maximum of two co-chairs and a WG secretary. More
www2.isprs.org/commissions
Protecting our world, conquering new frontiers
FIG Working Week
2023, 28 May to 1
June 2023 Orlando (Florida), USA
A sustainable agenda for planet and people is a universal agenda. If we are to achieve economic, social and technological progress, it is imperative that this occurs in harmony with nature. As survey professionals from the land, the built and natural environment and the geospatial sectors, we have a key role around the world to lead and contribute to make this sustainable development agenda happen. ‘Protecting our World, Conquering New Frontiers’ is the overall theme of this year’s FIG Working Week which will be held in Orlando, Florida, for three conference days from 29-31 May. This theme is intended to inspire surveying and geospatial professionals in land management, land survey and land administration and to seek to expand our presence through technology, experience, collaboration and goodwill for a better
tomorrow. As our world and climate changes around us, we aspire to leverage our knowledge base and tools for measuring, monitoring and forecasting how to improve the outlook for our future generations. The theme is strategically aligned with the United Nations 2030 Sustainable Agenda as articulated in the Sustainable Development Goals (SDGs).
Three plenary sessions around planet, people and partnerships
The conference theme draws upon the FIG vision to serve people and planet and to work in partnership for societal benefit. This will be reflected in the three plenary sessions that will set the scene for each of the three conference days.

Drawing from ‘planet’, the first plenary session on Monday 29 May will focus on ‘Protecting our World’, in which especially the relationship between climate change and sustainable development will be on the agenda. The climate focus is now the foundation of sustainability and underpins everything we do in our professional work. Keynote speakers will relate this to the leading role
surveyors can play in a land management, land administration and geospatial context to contribute to the understanding of how we can take urgent action on climate change to support the needs of the present and future generations. Later in the day, FIG’s Task Force on Climate will deliberate further.
Drawing from ‘people’ and our profession, the second plenary session [on Tuesday 30 May has ‘Conquering New Frontiers’ as the main topic. Mankind has forever embarked on progressing through and finding new frontiers. Our professional members throughout the generations are no different – we were all the future at one time. Interpretations of the new frontiers from our keynote speakers will consider smarter working in digital transformation and the impact of geospatial infrastructure, space research and development. In addition, we will hear perspectives from our young surveyors in relation to what this means to them and what it means to be at the forefront of the current generational frontier, as well as upcoming generations who are yet to choose surveying as their profession. Later in the day, FIG’s Task
info
Issue 3 2023 41
Force on Diversity and Inclusion will deliberate further, along with FIG’s Geospatial Task Force. Drawing on people and partnerships, the third and final plenary session on Wednesday 31 May will elaborate on the overall action-oriented theme for this current term of leadership: ‘Tackling the Global Challenges’. Surveyors have much to contribute in society and should highlight, advocate and above all act to ensure change that builds on a sustainability agenda. In this plenary, our keynote speakers will elaborate further on selected challenges that are at the
forefront of thinking and highlighted in some of the FIG Commission’s working groups. Driven by the need for sustainable development and to be fit for the future, this includes: an introduction to the new reference frame system/datum that is being introduced in the USA and which is leading up to a special National Geodetic Survey (NGS) Day/Track; disaster responsiveness highlighting the sustainability of island states, given the challenges that the small islands are facing (which will also be a special topic in the technical sessions); and technologically
sustainable applications for the development of urban areas.
At the FIG General Assembly and in the Opening Ceremony on Sunday 28 May 2023, FIG President Diane Dumashie will set the scene. She will also explain the thoughts behind the FIG Vision and the overall theme for the term 2023-2026 that will be reflected throughout the conference days.
More info
www.fig.net/fig2023
Recent developments at the International Laser Ranging Service
The IAG’s International Laser Ranging Service (ILRS) collects satellite laser ranging (SLR) data processed by its Analysis and Combination Centers into official products supporting the Global Geodetic Observing System (GGOS). SLR data is collected from low orbiters up to geosynchronous altitudes and the moon, with numerous geodetic products delivered to the community. ILRS releases a daily network snapshot based on seven-day arcs, using the data from the two LAGEOS and two Etalon satellites, and once a week it releases an Earth-centre fixed orbit of these satellites. Last year’s launch of a second LARES satellite, LARES-2 (Ciufolini et al., 2023), provided a new target that is currently in testing and will soon be added to the other four, to support the International Terrestrial Reference Frame (ITRF) products. Every five to six years, all of the data from 1983 up to the most recent complete year is reanalysed using state-of-the-art models and submitted to the International Terrestrial Reference System (ITRS) for updating the global ITRF model. The most recent reanalysis was completed in 2021 and supported the development of ITRF2020, released early last year.

During that reanalysis, great attention was paid to the identification and elimination of systematic errors. A complete reanalysis of the data, with the simultaneous estimation of station positions, Earth orientation parameters (EOPs) and a weekly averaged
systematic bias for each system, resulted in a series of weekly biases for the entire network over the 1993-2020 period. The time series were examined to identify stable periods and mean biases were calculated, forming the a priori bias model. The model was pre-applied in the solutions submitted for ITRF2020 development. The new approach eliminated most of the systematic errors, enhancing the long-term stability of the technique. The elimination of systematic errors was the primary benefit for the ITRF, with the secondary benefit being the strengthening of the solution by eliminating nuisance parameters without the loss of rigorousness (Luceri et al., 2019).
Accurate modelling
The accurate modelling of the target signature for each satellite-station pair separately was another major improvement. The initial analysis indicated that biases were lopsided with respect to an expected zero mean. This forced a complete reevaluation of the model resulting in a significant reduction of the long-term mean biases and their random distribution about zero (Rodríguez et al., 2019).
The improved reanalysis approach with accurate modelling of the satellite target signature resulted in ILRS establishing a totally new scale for the technique, more than 1ppb different from previous ITRFs. Additionally, the scales of SLR and very-long-baseline interferometry (VLBI) were aligned to 0.15ppb – less than 1mm at the equator! When the ITRS combined all the contributions of these techniques in developing ITRF2020, the scale was set as the average of the SLR and VLBI
scales, bringing SLR to -0.075ppb from the official ITRF2020 scale.
The ILRS’s official contribution to ITRF2020 is publicly available at the ILRS Data Centers. Anyone using it is kindly requested to acknowledge the combined effort of the various entities and individuals by referencing the DOI associated with these products:
doi: 10.5067/SLR/slr_itrf20200_ repro2020_001
More info
The combined SINEX products for ILRS REPRO2020 follow the ILRS filename convention: https://cddis.nasa.gov/Data_ and_Derived_Products/SLR/slr_itrf20200_ repro2020_001.html
Ciufolini, I., A. Paolozzi, Pavlis, E.C., J. Ries, R. Matzner, C. Paris, E. Ortore, V. Gurzadyan, and R. Penrose (2023). ‘The LARES 2 satellite, general relativity and fundamental physics’, Eur. Phys. J. C 83, 87, https://doi.org/10.1140/ epjc/s10052-023-11230-6
Luceri V., Pirri, M., Rodríguez, J., Appleby, G., Pavlis E. C. and Müller, H. (2019). ‘Systematic errors in SLR Data and their impact on the ILRS products’, J Geod, SpringerVerlag GmbH, https://link.springer.com/ article/10.1007/s00190-019-01319-w.
Rodríguez, J., Appleby, G. and Otsubo, T. (2019). ‘Upgraded modelling for the determination of centre of mass corrections of geodetic SLR satellites: impact on key parameters of the terrestrial reference frame’, J Geod, SpringerVerlag GmbH, 93, pp. 2,553–2,568.
Issue 3 2023 42
Focusing on True Performance
Total Station V-100N Series


• Extended Reflectorless range: About 1000m


• Quicker measurement time: Less than 1 second

• Longer operation time: About 50 hours with dual/hot-swap batteries

Positioning System G2U


• Powerful GNSS engine compatible with all GNSS systems: GPS, GLONASS, Galileo, Beidou and QZSS.


• Integrated battery for easy power charge via USB cable.


• Compact, light-weighted and robust housing.
• Intergated tilt compensation function.


V-101N I V-102N I V-102NL (V-101N, V-102N) TI Asahi Co., Ltd. International Sales Department 4-3-4 Ueno Iwatsuki-Ku, Saitama-Shi Saitama, 339-0073 Japan www.pentaxsurveying.com/en/ Tel.: +81-48-793-0118 E-mail: International@tiasahi.com
New New
• The design and specifications of the products are subject to change without notice.
HERON Flex 3D Mapping Systems


• All-in-one SLAM systems


• 4-lens/8K RGB proprietary pano camera
• Smart and detachable controller driven by a wi-fi PDA


