2023–2024
2023–2024
CITY OF ORLANDO COUNCIL
Mayor Buddy Dyer
Jim Gray, District 1 Commissioner
Tony Ortiz, District 2 Commissioner
Robert F. Stuart, District 3 Commissioner
Patty Sheehan, District 4 Commissioner
Shan Rose, District 5 Interim Commissioner
Bakari F. Burns, District 6 Commissioner
CITY OF ORLANDO STAFF
Sherry Gutch, Director of Placemaking
Brooke Bonnett, Economic Development Director
Lillian Scott-Payne, Economic Development Deputy Director
Timothy Johnson, Economic Development Deputy Director
Eric Ushkowitz, Business Development Services Division
Manager
Kim King-Maysonet, Business Development Services
Assistant Division Manager
ORLANDO MAIN STREETS
EXECUTIVE DIRECTORS
Jennifer Marvel, Audubon Park
Mike Griffin, City District
Amelia Harrison, College Park
Stephanie Ziglar, Curry Ford West
Amil Cordova, Gateway District
Allex Englett, Ivanhoe Village
Angie Folks, Milk District
Joanne Grant, Mills 50
Misty Heath, SoDo District
Lisa Cuatt, Thornton Park District
Justin Kinsey, West Lakes District
Natasha Gaye, Parramore District City of Orlando
Orlando, FL 32801

246.2821 GAI CONSULTANTS’ COMMUNITY SOLUTIONS GROUP (CSG)
Peter Sechler, Vice President, Director of CSG
Laura Smith, Urban Analytics Director
Natalie Frazier, Urban Analytics Manager
Hannah Hollinger, Senior Planner

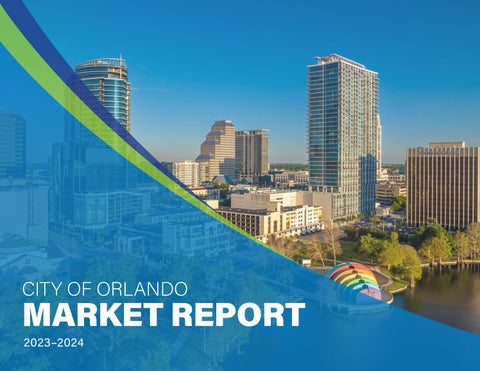
The City of Orlando has invested in creating this Market Report to highlight and promote the City's twelve (12) Main Streets as well as the Lake Nona District, all located within the City of Orlando.
This Market Report includes an economic outlook for both the United States and the State of Florida, along with a comprehensive overview of the City of Orlando, highlighting its historical and current residential and commercial market characteristics and employment trends. This report also introduces the Main Street America Program and outlines the benefits these Main Street districts provide to the community.
Additionally, this Market Report presents a data-driven analysis of historical and current commercial market trends in the
Lake Nona District and the 12 Orlando Main Street Districts. The commercial markets specifically examined as part of this Market Report include the office, retail, industrial/ flex, for-rent multi-family, and hotel sectors within each district. Each district overview includes highlighting the district’s unique characteristics, anchor developments, and priority projects.
The purpose of this Market Report is to serve as a tool for promoting and marketing the City of Orlando’s Main Street Districts and the Lake Nona District, helping the City and interested third parties understand the complex marketdriven statistics, performance indicators, and historical trends occurring within each of these defined districts.
The beginning of the latest recovery from the COVID-19 induced recession was officially announced by the National Bureau of Economic Research (“NBER”), with the Business Cycle Dating Committee of NBER announcing in July 2021 that a trough in monthly economic activity occurred in the U.S. economy in April 2020. The previous peak in economic activity occurred in February 2020, marking the beginning of the current business cycle. The recession lasted two months, which makes it the shortest U.S. recession on record. The NBER chronology does not identify the precise moment that the economy entered a recession or expansion. In the NBER’s convention for measuring the duration of a recession, the first month of the recession is the month following the peak and the last month is the month of the trough. Since the most recent trough was in April 2020, the last month of the recession was April 2020, and May 2020 was the first month of the subsequent expansion.
The broadest measure of the U.S. economy, real gross domestic product (GDP), increased at an annual rate of 2.8% in the second quarter of 2024 (“2Q24”) following a GDP increase at annual rate of 1.4% in the first quarter of 2024 (“1Q24”). Increases in GDP are reflected by increases in consumer spending (both services and goods), private inventory investment, nonresidential fixed investment. Within services, the leading contributors were health care, housing and utilities, and recreation services. Within goods, the leading contributors were motor vehicles, recreational goods and vehicles, furnishings and durable household equipment, and gasoline and other energy goods. Private inventory investment increased primarily reflect increases in wholesale and retail trade industries that were offset by a decrease in mining, utilities, and construction industries.
U.S. inflation, as measured by the 12-month change in the Consumer Price Index (CPI), fell to 3.0% in June 2024 after reaching a 12-month peak of 3.7% in August 2023. Since early 2023, the CPI has been fluctuating
slightly while steadily declining overall. CPI measures the change in prices paid by consumers for goods and services such as food, clothing, shelter, fuels, transportation, doctors’ and dentists’ services, drugs, and other goods and services that people buy dayto-day. The CPI is expected to continue its downward trend through 2024 although at a slower pace.
The Federal Reserve (Fed) adjusts Fed Fund Rates in response to the economy, while also trying to achieve conditions that satisfy their dual mandate, as set by Congress: keep prices stable and maximize employment. The Fed raises rates when the economy starts experiencing too much inflation, and cuts rates when the economy has too high unemployment. Other data that factor into Fed monetary policy decisions include gross GDP, consumer spending, industrial production, and major events like a financial crisis,
global pandemic, or a massive terrorist attack. Since August 2023, the Fed left the target for the Fed Funds Rate unchanged at 5.25%-5.50%, although it has signaled that rates may be held “higher for longer” if inflation remains persistent.
The economy is still evolving at unprecedented rates. Personal saving was $703.0 billion at the end of 2Q24, compared with $671.0 billion at the end of the 1Q24. The personal saving rate—personal saving as a percentage of disposable personal income—was 3.4% at the end of 2Q24, noticeably up when compared with 3.2% at the end of 1Q24. In the 2Q24, personal income increased $50.4 billion in June 2024 compared with an increase of $122.0 billion in March 2024, and Disposable Personal Income (DPI) increased $37.7 billion, or 0.2%, in June 2024, compared with an increase of $104.0 billion, or 0.5%, in March 2024.
Sources: Federal Reserve Economic Data (FRED); GAI Consultants.
The “Great Global Work-From-Home Experiment” created by the COVID-19 pandemic has changed how employees work and expect to work far into the future. As organizations ease back into office life, employees and employers are navigating a new chapter in this experiment. One that is now blending remote work flexibility and on-site work. This new chapter is still being written as 2024 progresses and more employees return to the office for at least part of their week. While the Bureau of Labor Statistics (BLS) collects annual data on the location of work for full-time employees, data was not collected in 2020 due to the COVID-19 pandemic. However, BLS data from 2016-2019 indicates that on average roughly 82% of full-time employees worked at their workplace compared to an average of roughly 23% of full-time employees who worked at their home (some or all the time). Comparatively, 2022 BLS data showed that roughly 69% of full-time employees worked at their workplace compared to an average of 35% of full-time employees who worked at their home.
With the Fed in the process of raising interest rates at the most aggressive pace since the 1980s, the risk of recession remains a concern. Rising prices and the monetary policy response add uncertainty to the U.S. economic outlook. Factors including elevated inflation, high interest rates, dissipating pandemic savings, lower government spending, and the resumption of mandatory student loan repayments are fueling expectations that GDP growth will likely fall below 1.0% in 2024. Inflation and interest rates should gradually normalize, and quarterly annualized GDP growth should converge toward its potential of near 2% in 2025.
The unemployment rate, at 4.1%, has begun to slowly tick up since the end of 2Q24 and is expected to continue throughout the year. Labor market tightness will moderate somewhat over the coming quarters but will remain acute relative to previous economic downturns, reflecting persistent labor shortages in some industries and labor hoarding in others. This should prevent overall economic growth from slipping
Florida’s economy outperformed the nation during the pandemic, with activity up 11% from the end of 2019 to 2022—more than double the 5% increase recorded nationally. A much stronger demographic profile will help Florida keep an edge over the nation, but the outperformance gap is expected to shrink as growth in the state shifts into lower gear. Signs of a slowdown are evident, with employment growth shifting more in line with the national pace recently. Some deterioration in the labor market is anticipated, with a slower economic backdrop putting upward pressure on the unemployment rate. Over the near-term, the challenges for Florida will continue to center on labor supply. The unemployment rate currently stands at 3.2%—only marginally above 2.4% all-time low at the start of 2006. Strong population growth will continue to lend a hand by adding more workers to the market.
From 2023-2026, Florida’s economy, as measured by Real Gross State Product (RGSP), is anticipated to expand at an average annual rate of 1.2%. RGSP is projected to decelerate during the economic slowdown with growth slowing to 0.8% in 2024 and 2025, then accelerating to just over 1.5% by 2026. Personal income growth is projected to average 2.2% through 2026. Following the inflation-driven contraction in 2022, growth is expected to average 2.9% through 2025 and 2026, likely reaching 3.0% by year end 2026. Florida’s average growth will likely be about 0.2 percentage points higher than the national rate through 2026.
Payroll job growth in Florida will falter with a slowdown in the U.S. economy, but not in every sector. After yearover-year growth of 4.6% in 2021 and job growth of 5.3% in 2022, payroll employment in 2023 decelerated
too deeply into contractionary territory and facilitate a rebound in the following months. Forecasts indicate that overall growth will return to more stable prepandemic rates, inflation will drift closer to 2%, and the Fed will likely lower rates to near 5%. However, due to an aging labor force we expect tightness in the labor market to remain an ongoing challenge for the foreseeable future.
The Fed’s efforts to restore inflation back to 2% will slowly tighten household and business spending, likely generating a mild downturn by the end of 2024. As inflation continues to steadily return to its prepandemic levels, CPI has remained surprisingly stable but is expected to continue to subside to an annual rate of 2.7% by the end of 2024. This will in part be due to the Fed’s aggressive inflation reduction efforts, but also because of easing demand for goods and services, the pass-through from softer housing price inflation, and cooling wage growth leading into 2025.
to 2.6% and has continued to grow at a 2.1% year-overyear rate in March 2024. This, however, is expected to contract by 0.5% in 2025. Job growth will likely returns to a positive condition in 2026.
Housing starts will be suppressed by the slowdown and higher mortgage rates. Total starts of 158,349 in 2020 jumped to 193,049 in 2021 and held at 192,213 in 2022—although higher interest rates and a slowing economy resulted in housing starts falling to 125,270 in 2023. Housing starts are expected to further decline in 2024 before climbing to 147,100 in 2025 and 149,000 in 2026. Rapid house-price appreciation has been largely corrected, with demand dampened by rising mortgage rates, decreasing affordability, and the slowing economy.
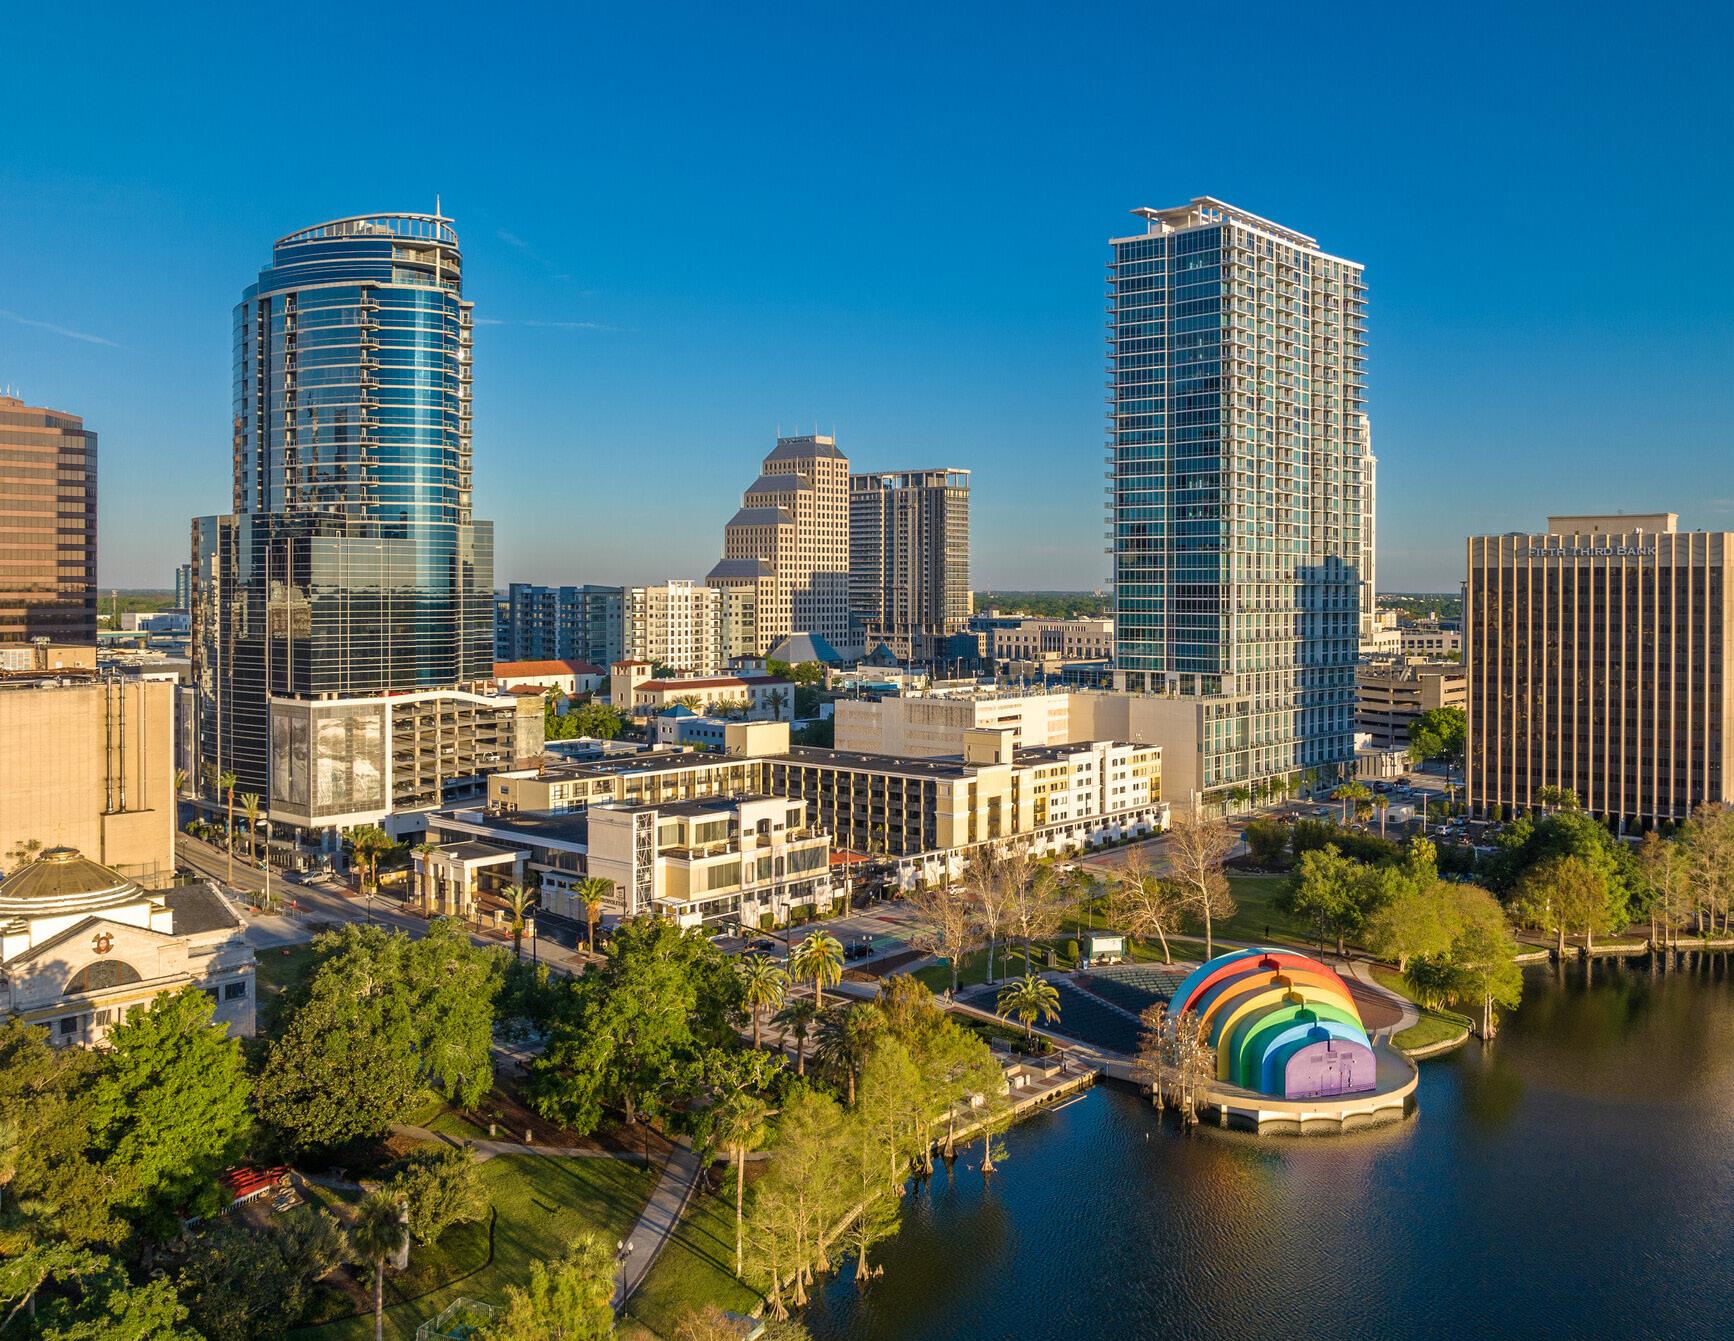
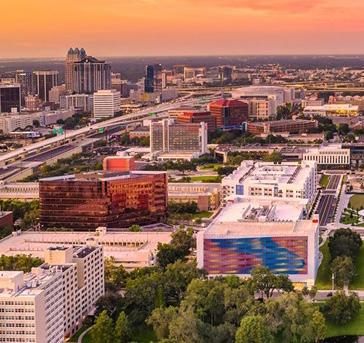
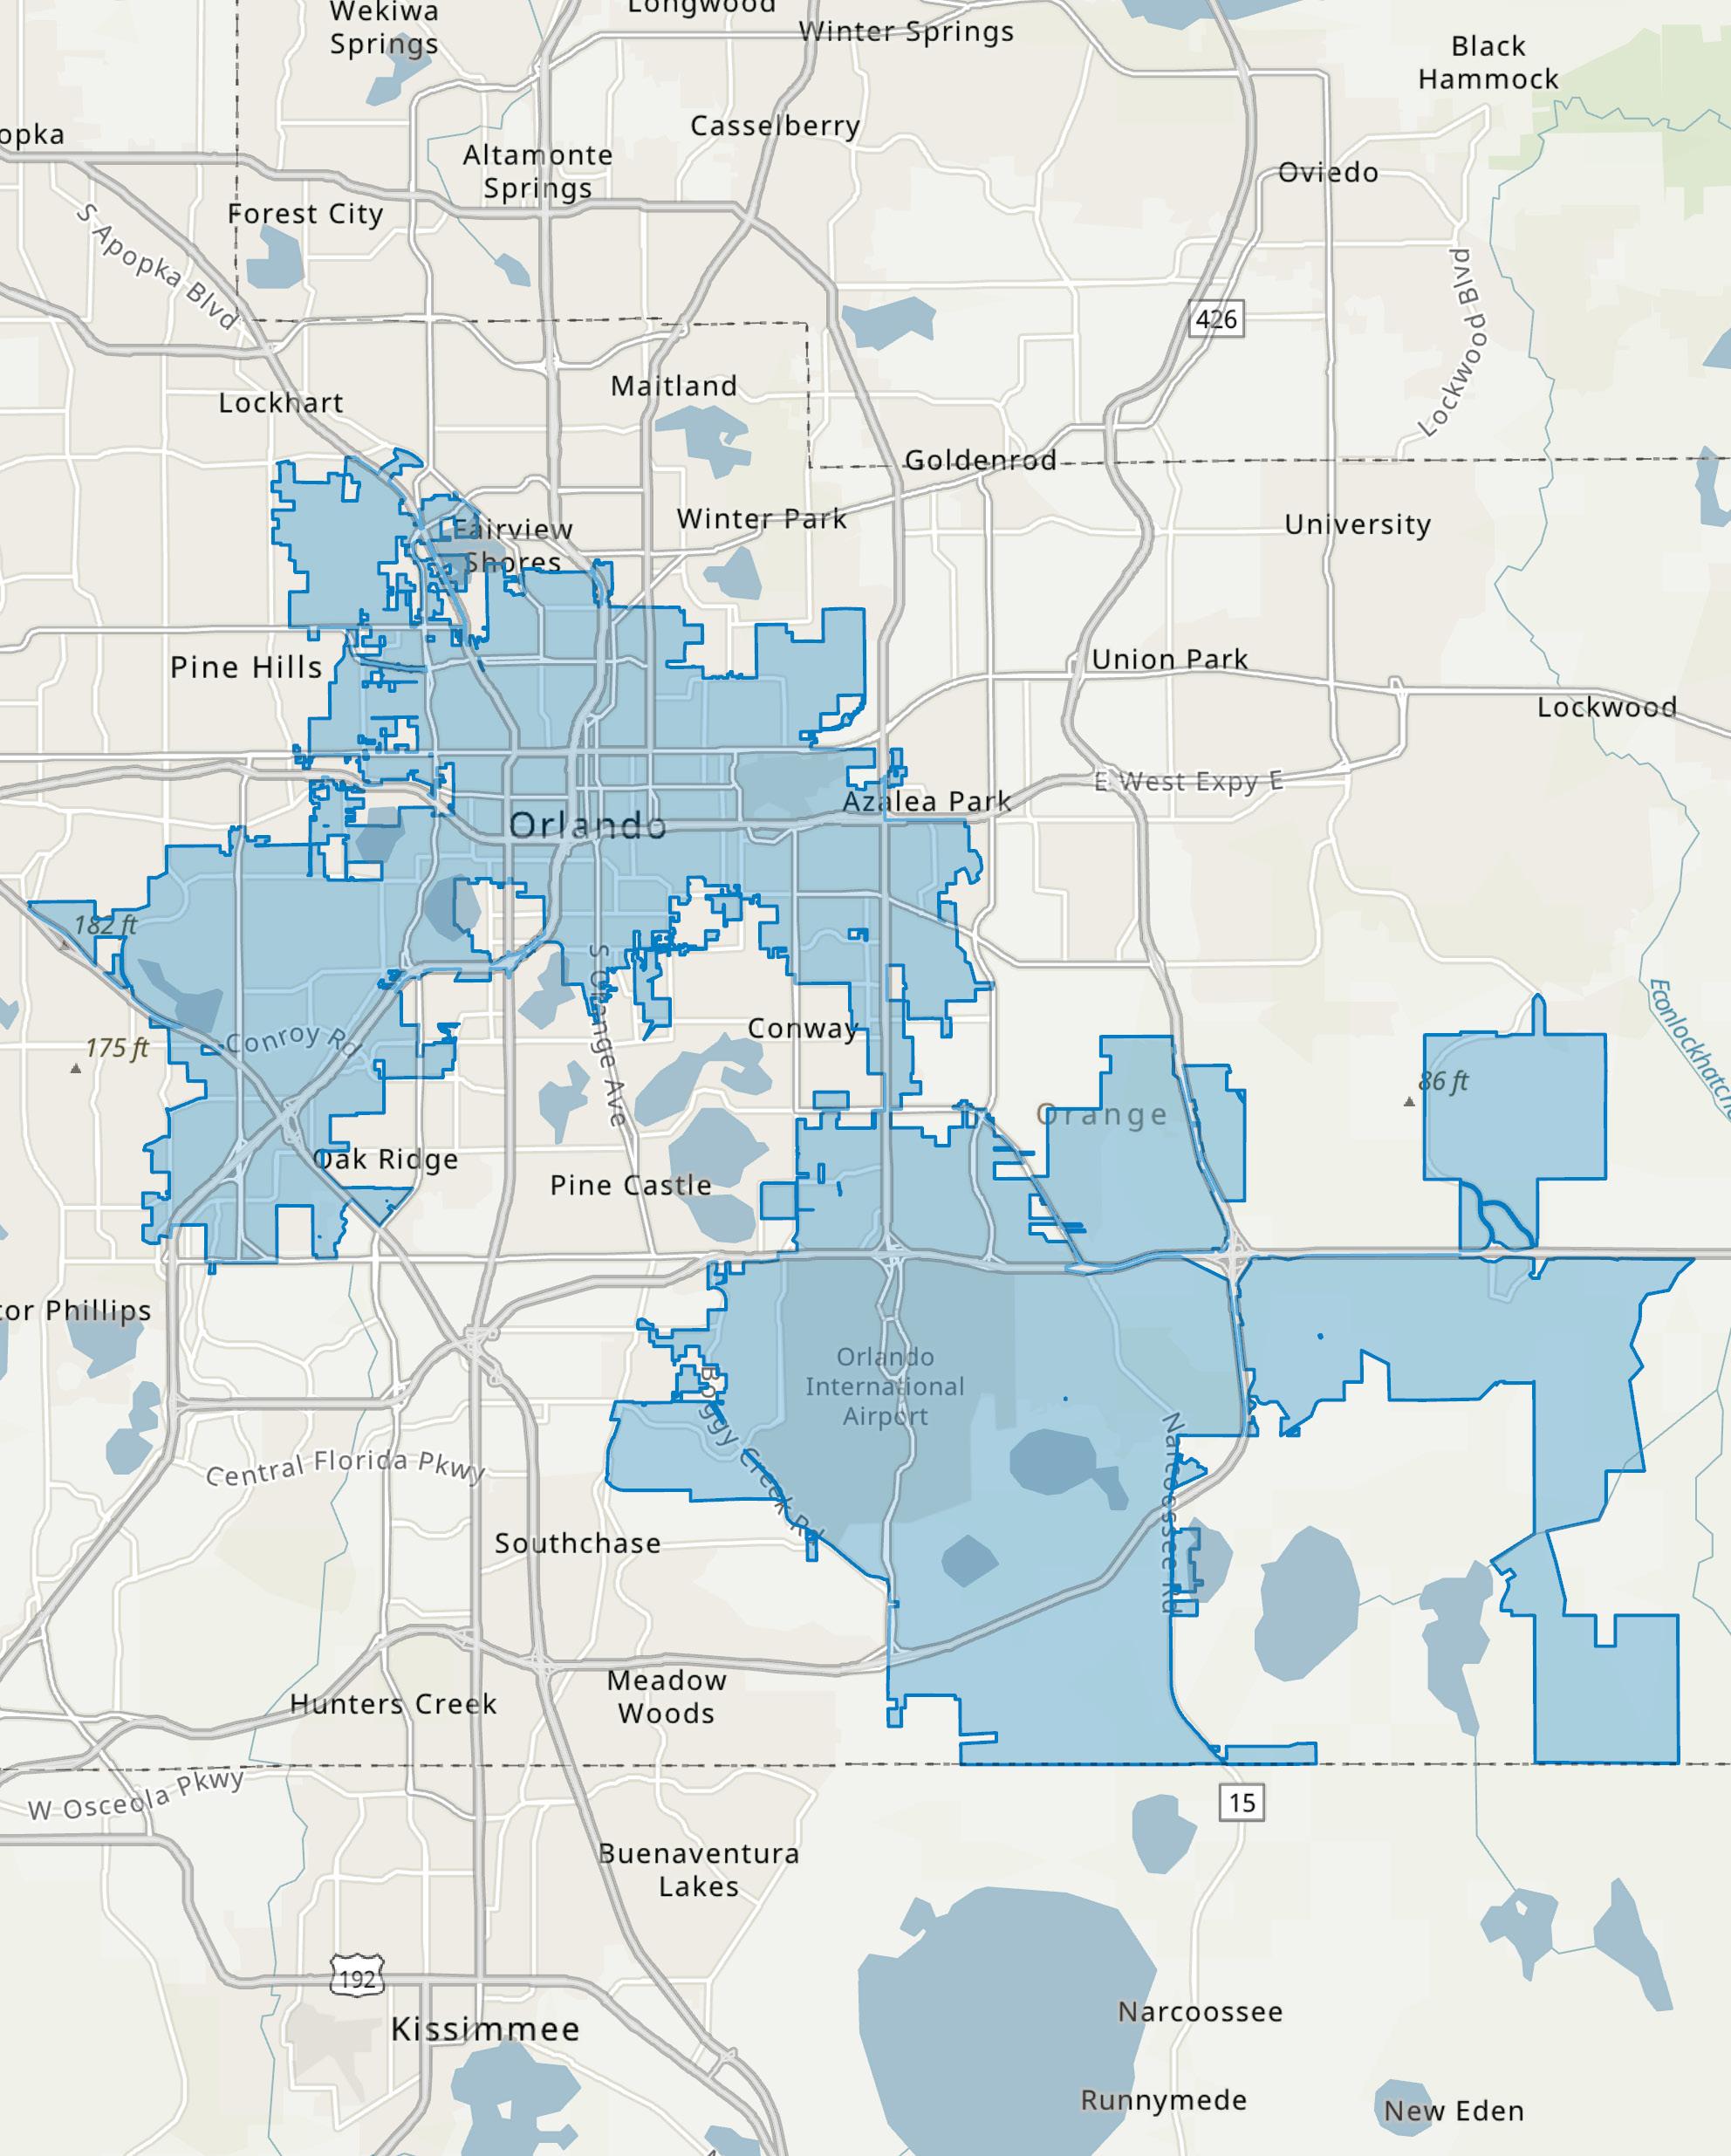
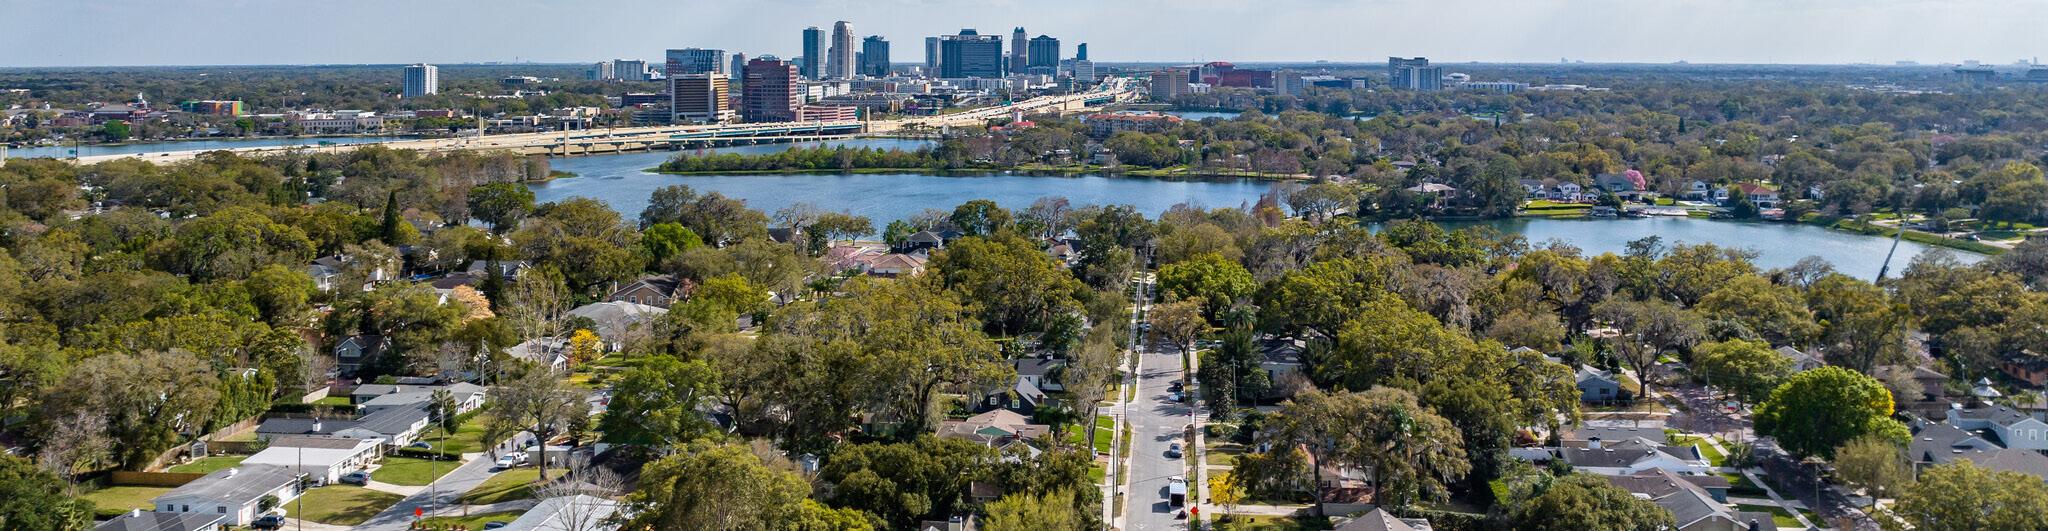
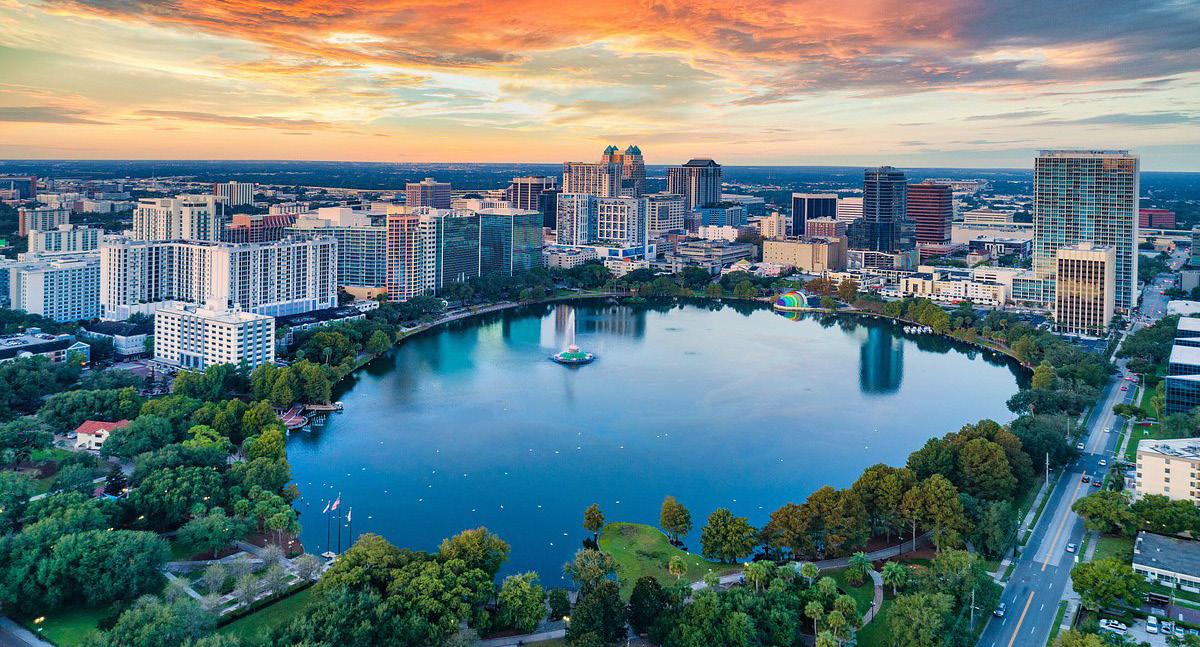
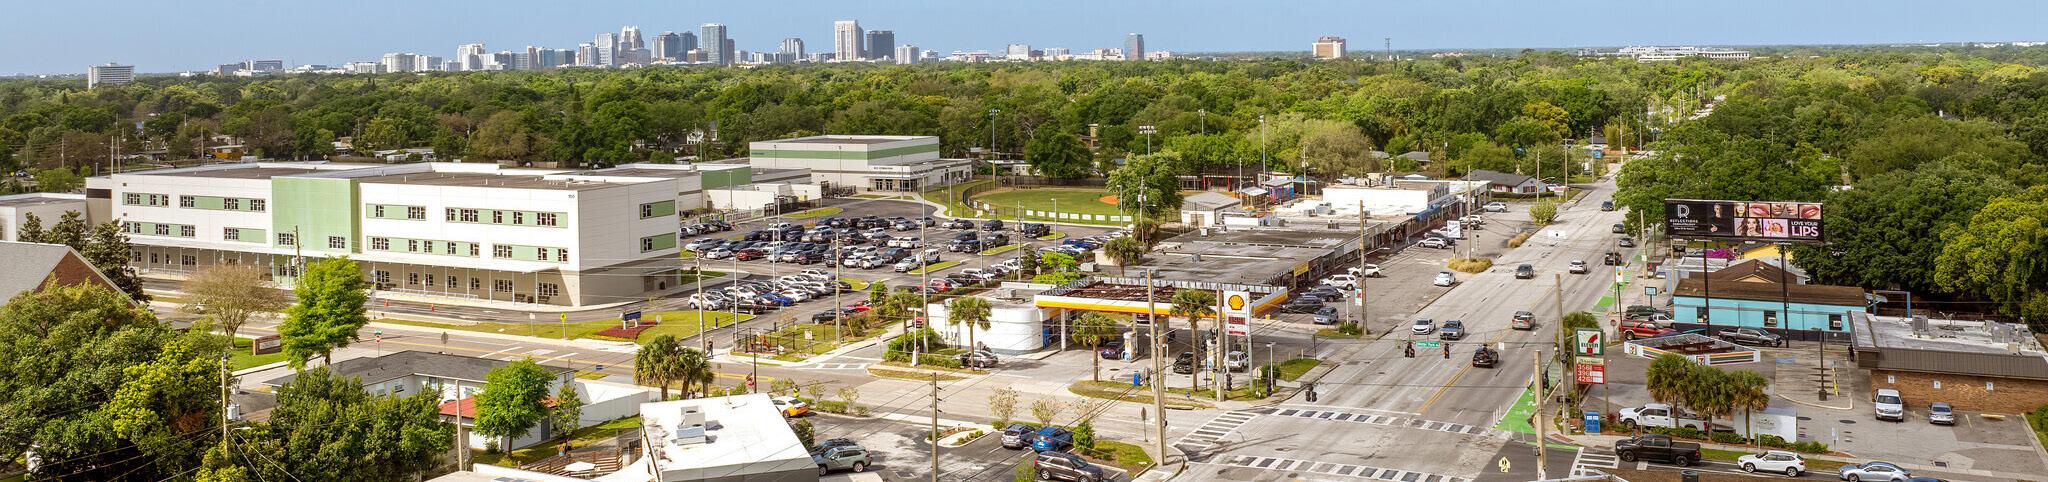
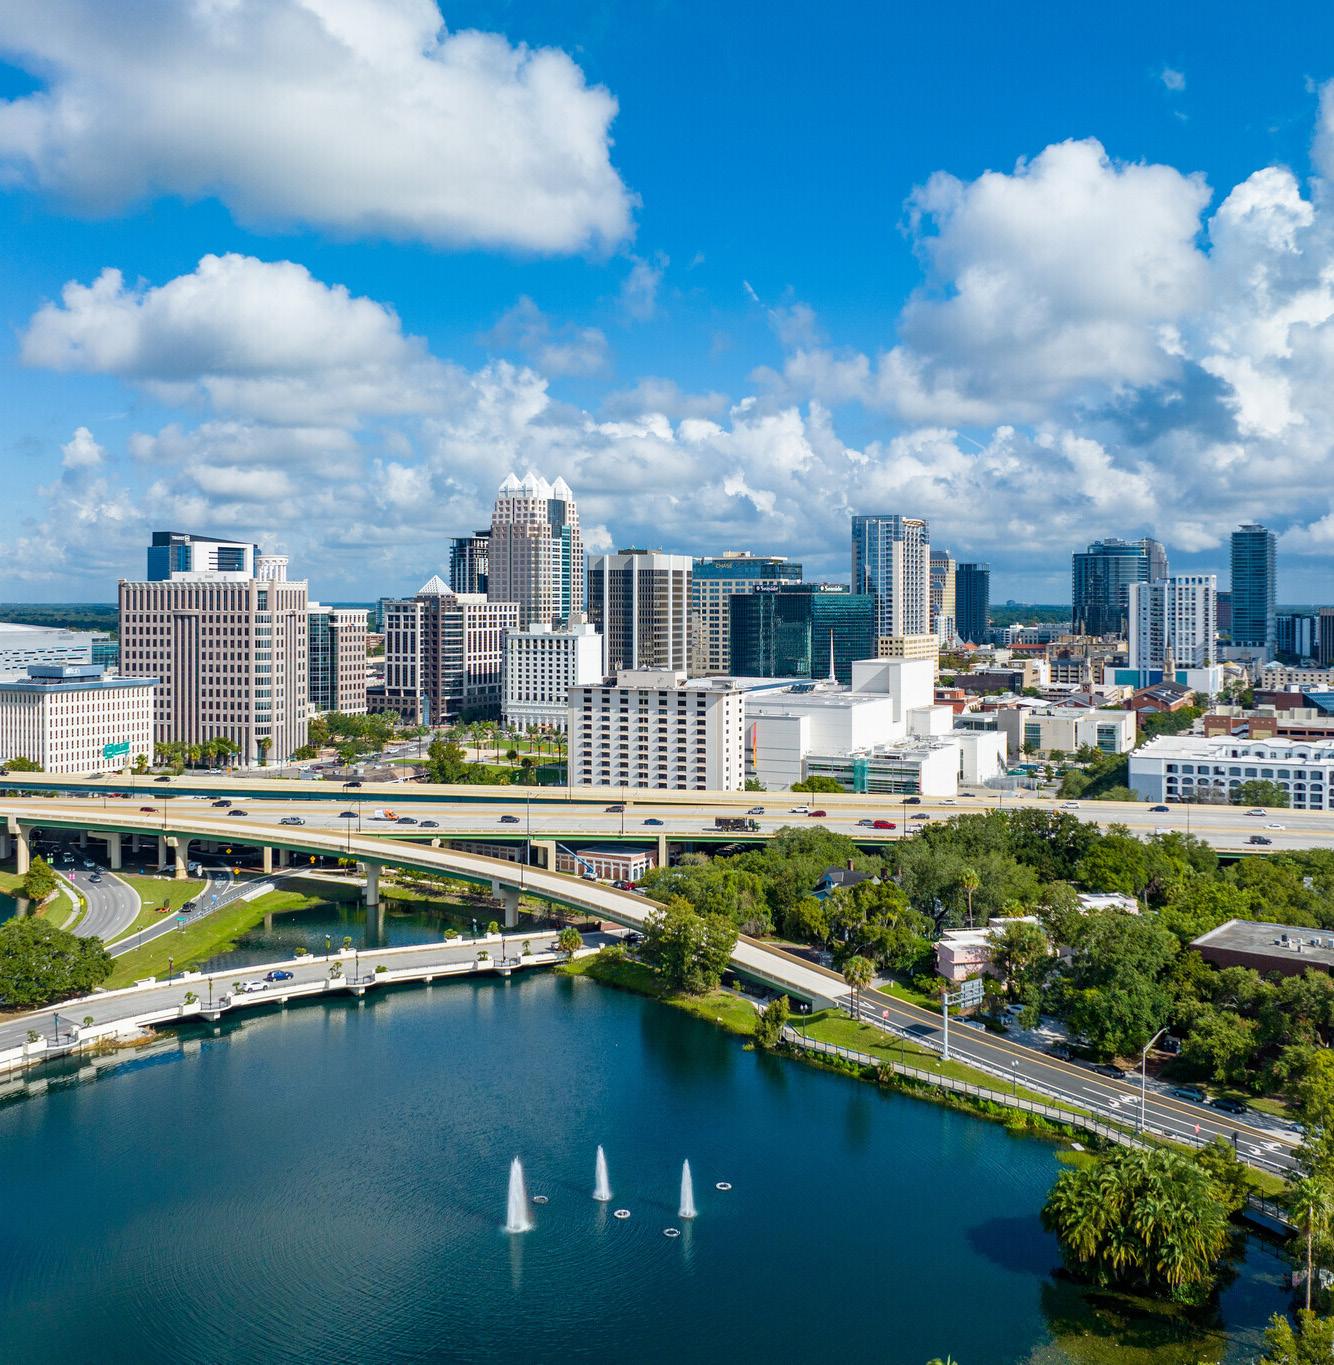
The City of Orlando, often called “The City Beautiful,” is renowned for its world-class attractions, diverse culture, and thriving economy. As the county seat of Orange County, the City spans approximately 119 square miles and is home to over 325,000 residents. Centrally situated in Central Florida, the City is strategically positioned at the crossroads of major thoroughfares, including Interstate-4 and State Road 408, ensuring convenient access for commuters and travelers. Additionally, the Orlando Executive Airport and Orlando International Airport significantly enhance the City’s domestic and international connectivity.
Recognized as the heart of the four-county Metropolitan Statistical Area (MSA) known as the “Orlando MSA,” the City includes its home county, Orange, along with Lake, Osceola, and Seminole Counties. With a population exceeding 325,000, the City stands as the largest city in both Orange County and the broader four-county MSA.
The City operates under a Mayor/City Council government structure and offers a comprehensive array of municipal services to its residents. These services include police and fire protection, landuse planning and zoning, code enforcement, neighborhood improvement, street and drainage construction and maintenance, traffic engineering, recreational and cultural activities, refuse collection, and stormwater and water reclamation.
The City’s rich history reflects its significant progress. From its beginnings as a citrus industry hub in the 19th century to becoming a tourism destination in the 20th century, the City has continually evolved. Today, the City is an inclusive community with a high quality of life, supported
by industries such as academic research, computer simulation and training, and hospitality. The City’s ability to adapt and grow in response to market demands ensures its status as a world-class city.
Renowned for its iconic theme parks, including Walt Disney World Resort and Universal Orlando Resort, the City draws millions of visitors from around the globe each year. While globally famous for its theme parks, the City’s identity extends far beyond tourism. Its economy is diverse, with significant growth in technology, healthcare, and aerospace sectors. The City has made substantial efforts to diversify its economic base, moving from its roots in the citrus industry to becoming a hub for high-tech, high-wage careers. Key industries now include digital media, life sciences, and modeling, simulation, and training.

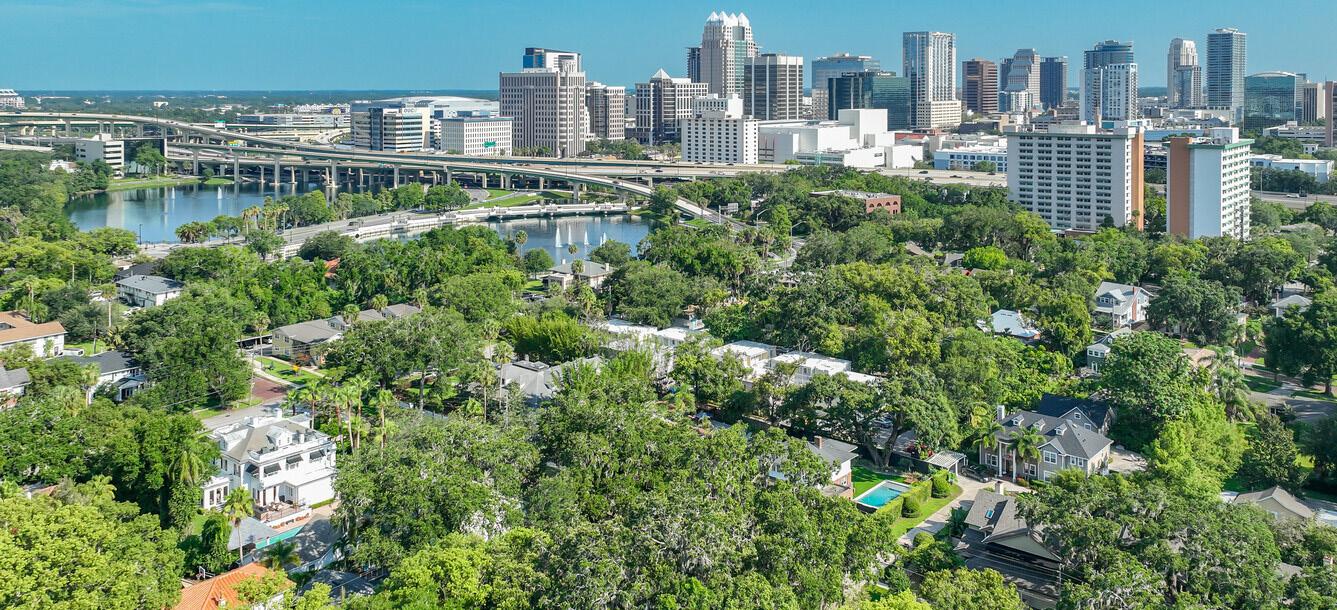
Beyond its famous attractions, the City boasts a rich cultural scene, with numerous museums, theaters, and art galleries. The Dr. Phillips Center for the Performing Arts and the Orlando Museum of Art are just a few examples of the City’s commitment to the arts. Downtown Orlando is a bustling hub of activity, featuring a variety of dining, shopping, and entertainment options.
The City’s vision is to become the premier futureready city in the United States. This vision is supported by proactive strategies to stay ahead of opportunities and ensure that the City remains a global destination where everyone can thrive. The City’s leadership is committed to fostering an inclusive environment with a high quality of life and a robust economic foundation.
As a leader in the 21st-century innovation economy, the City is home to Lake Nona, a 7,000acre master-planned community developed by Tavistock Development Company, which serves as an international hub for health and biotech services. The 2020s have brought exciting developments, such as video game developer Electronic Arts relocating its Florida headquarters to Downtown Orlando’s Creative Village. Additionally, the City has partnered with Dr. Phillips Charities to develop The Packing District, a 202acre neighborhood featuring mixed-use residential hubs, a 40-acre urban farm, and over 1 million square feet of retail and office space.
The City’s economy is diverse, with strong sectors in tourism, technology, healthcare, and education. Orlando is also a major center for conferences and conventions, hosting numerous events at the Orange County Convention Center. The City’s strategic location and excellent transportation infrastructure, including Orlando International Airport, make it a key gateway to the rest of Florida and beyond.
Residents of the City enjoy a high quality of life, with access to beautiful parks, recreational facilities, and a warm, sunny climate year-round. The City’s commitment to sustainability and innovation is evident in its numerous green initiatives and smart city projects. Orlando is much more than its famous theme parks. It is a dynamic city with a diverse economy, a forward-thinking vision, and a dedication to innovation and inclusivity. Whether visiting for its attractions or considering it as a place to live and work, the City of Orlando offers a unique blend of opportunities and experiences.

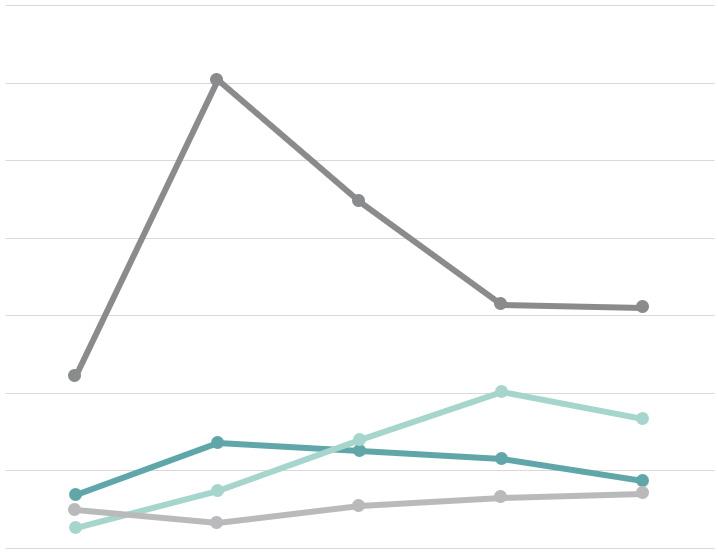
As of year-end 2023, the City of Orlando’s total employees compose approximately 40% of the total employment within Orange County. The City’s employment sector is primarily dominated by the health care and social assistance, educational services, transportation and utilities, and professional services industries, as illustrated in the table below.
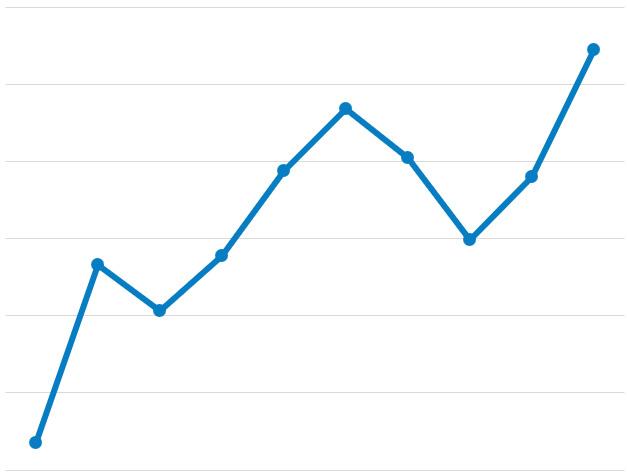
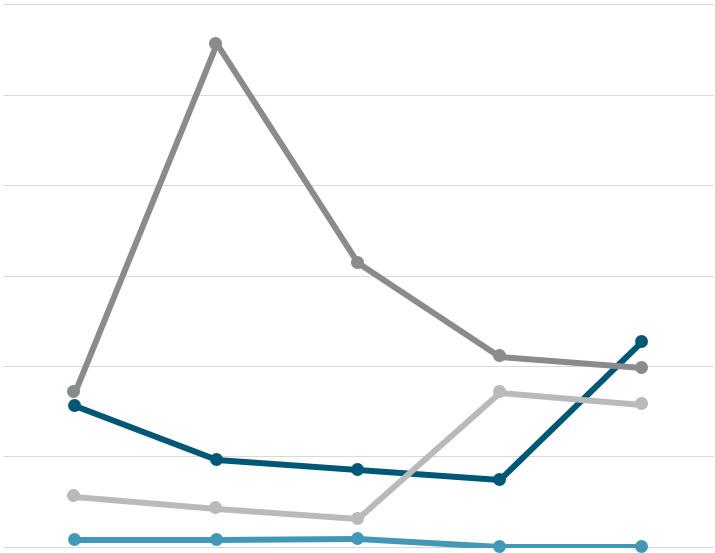
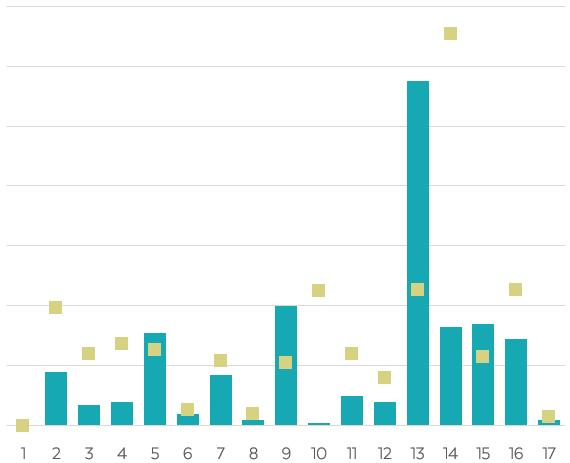
Over the 10-year period, from 2014 to 2023, the City’s total employment has experienced a compound annual growth rate (“CAGR”) of 2.3%. The figure above illustrates the City’s total annual employment trends from 2014 through 2023.
In addition, the City’s total employment increased from 300,203 employees in 2014 to 332,864 employees in 2023—resulting in a net increase of 32,661 total employees. The increase in employment was primarily driven by increases in the transportation and utilities, educational services, finance and insurance, health care and social assistance, and public administration industries.
For year-end 2023, the total sales tax collections in the City were over $3.0 billion, experiencing an increase of 3.0% from the prior year, 2022. The sales tax collections within the City were primarily stimulated by a sales tax levy against auto dealers, hotel/motel accommodations, and admissions and recreation services—combined, composing 38% of the City’s total sales tax collections for 2023. The City’s capture of sales tax collections within the County is 69%, which remained unchanged from the prior year. The table below reflects the top 10 sales tax collections, represented in millions (“M”) by Kind Code for the City as of year-end 2023.
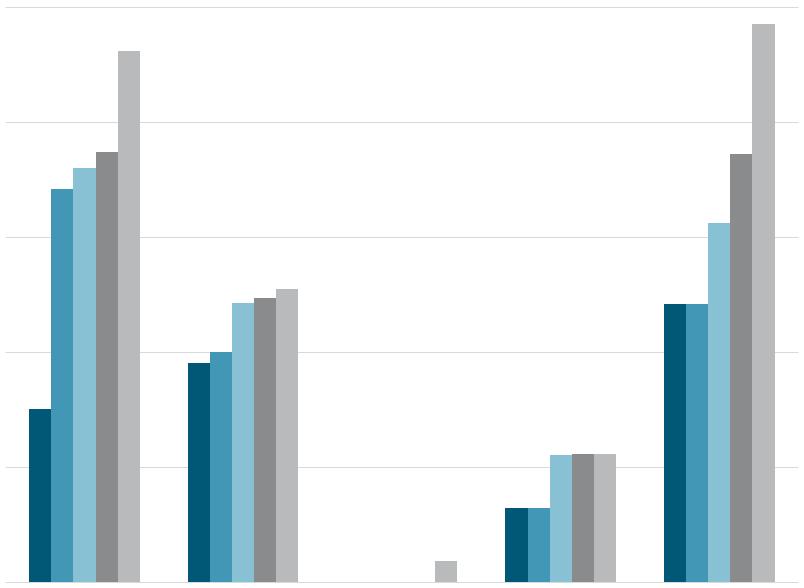
As of year-end 2023, residents of the City spent an estimated $11.421 billion, with 34% allocated to housing, 30% to retail goods, 12% to food (both away from home and at home), 7.5% to health care, and 4.0% to entertainment and recreation. This spending pattern highlights the dominance of housing and retail, which together account for 64% of total expenditures. Additionally, food and health care make up 19.3% of the consumer spending budget, while entertainment and recreation represents the smallest portion of consumer spending. Within the broader context, total expenditures within the City make up approximately 23.7% of the consumer spending within the County, with over $48.251 billion in total expenditures as of year-end 2023.
As of year-end 2023, the City of Orlando’s forsale residential market included 80,147 residential units. Single-family homes made up the majority, at 64%, while residential condominium (“condo”) accounted for 36% of the total. The City’s residential units represent approximately 15% of the total single-family residential units and 55% of the total residential condos within Orange County.
As of year-end 2023, the average single-family residential assessed value and taxable value per unit, at $294,947 and $255,520, respectively, were both greater than those of residential condo units—with an assessed value and taxable value per unit of $149,530 and $137,241, respectively.
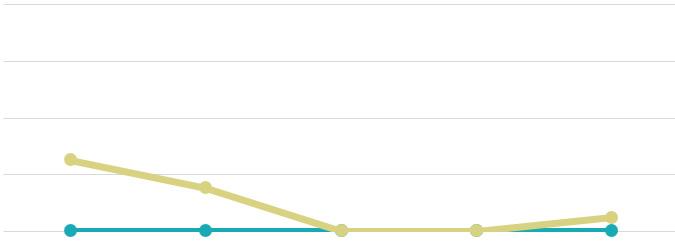
Year-over-year, year-end 2022 through year-end 2023, total single-family units and residential condo units within the City saw an increase of 2.0% and 0.2%, respectively. Over the past five years, 2019 through 2023, total inventory of forsale residential units within the City experienced an increase of 13% with the addition of 5,058
new single-family residential units and 4,149 new residential condo units. The following figures illustrate the change in annual inventory for both single-family residential units and residential condo units from 2019 through 2023.
In addition, the City experienced a total of 1,819 single-family unit sales and 1,304 residential condo unit sales in 2023, as illustrated in the table below.
By the end of 2023, the total sales price for singlefamily residential units reached approximately $991.7 million, while residential condo unit sales amounted to around $321.9 million. The average sales price per sq. ft. for single-family homes in the City was $346.26 per sq. ft.; this was significantly greater than the City’s average sales price per sq. ft. for residential condo units, at $222.78 per sq. ft. during the same period.
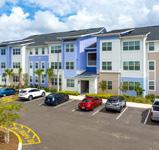
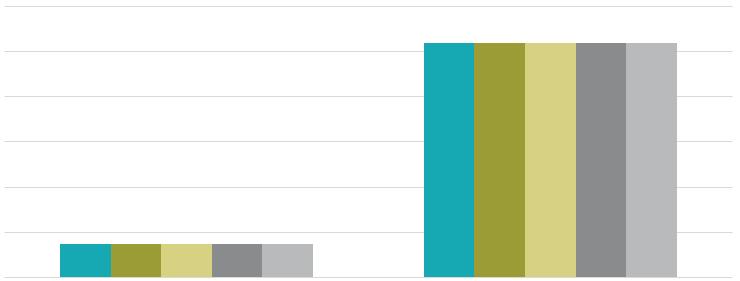
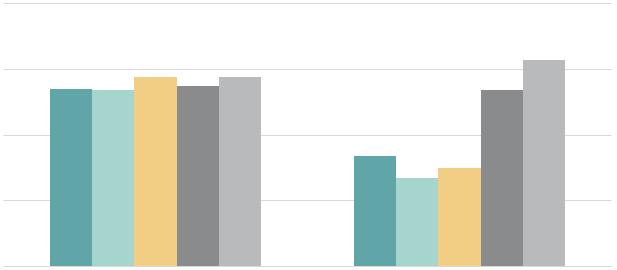
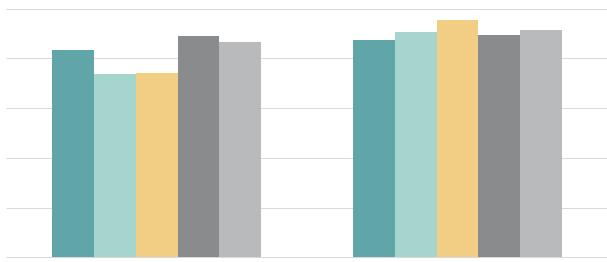
As of year-end 2023, the City’s commercial real estate market composed nearly 123.5 million square feet (“sq. ft.”) of office, retail, and industrial/ flex space, in addition to 30,620 hotel rooms, and 71,050 for-rent multi-family residential units, as illustrated in the market characteristics table below.
Industrial/flex space composed the majority of the City’s office, retail, and industrial/flex inventory at 51% of the total share, following by office and retail space with 26% and 23%, respectively, of the total, as of year-end 2023. Specifically, the office space within the City consisted of 42% Class A space, 35% Class B space, and the remaining portion as Class C space.
Industrial/flex properties within the City had the highest occupancy rate compared to the City’s retail and office properties as of year-end 2023. Moreover, occupancy rates for both the City’s hotel and for-rent multi-family markets were approximately 75% and 92%, respectively. In addition, average rental rates for retail properties were slightly higher than those for office properties and significantly higher than those for industrial/ flex properties within the City as of year-end 2023.
There were 767 lease transactions that occurred in the City’s office, retail, and industrial/flex markets—resulting in a total of 5.10 million sq. ft. leased during 2023. Leasing activity refers to the volume of square footage that is committed to and actually signed in a given period of time, including direct leases, subleases and renewals of existing leases.
Gross absorption measures the total sq. ft. occupied within existing buildings over a given period, without accounting for vacated space. As of year-end 2023, there was a total of 5.06 million sq. ft. absorbed into the City’s office, retail, and industrial/flex markets, in addition to 1,732 units absorbed into the City’s for-rent multi-family residential market during this same time frame. The City’s industrial/flex market composed the greatest amount of gross absorption at 57% for year-end 2023, followed by office space with 30% of the total share.
The following pages illustrate major development activities, year-over-year snapshots, and five-year annual trends for the City’s commercial real estate market.

Office space increased 2.6% from the prior year, from 31.7 million sq. ft. to 32.5 million sq. ft.
Vacancy rates increased 1.5 percentage points from 6.0% to 7.5%.
Average rental rates per sq. ft. increased 4.7%, from $25.83 to $27.04 per sq. ft.

Leasing activity of
By the end of 2023, the City saw the addition of approximately 1.87 million sq. ft. of new office, retail, and industrial/flex inventory across 24 buildings, in addition to 2,871 forrent multi-family units within 11 properties and 315 hotel rooms within 3 properties.
Within the City, there is approximately 75,000 sq. ft. of office space, 36,160 sq. ft. of retail space, 2.47 million sq. ft. of industrial/flex space, 4,482 for-rent multi-family units, and 285 hotel rooms currently under-construction within the City as of year-to-date 2024, through August 2024. During this same time frame, there is approximately 9.63 million sq. ft. of proposed office, retail, and industrial/ flex space; as well as 13,340 proposed forrent multi-family residential units, and 1,360 proposed hotel rooms within the City as of year-to-date 2024, through August 2024.
Retail space decreased 1.5% from the prior year, from 28.3 million sq. ft. to 27.9 million sq. ft.
Vacancy rates decreased 0.2 percentage points, from 3.2% to 3.0%.
Average rental rates per sq. ft. increased 1.9%, from $27.98 to $28.51.
Leasing activity of retail space decreased 46%
Industrial/flex space increased 1.9% from the prior year, from 61.9 million sq. ft. to 63.1 million sq. ft.
Vacancy rates increased 0.8 percentage points, from 1.5% to 2.3%.
Average rental rates per sq. ft. decreased 3.2% from $12.66 to $12.26.
Leasing activity increased 552%.
Over the past five years, 2019 to 2023, total inventory of commercial space within the City experienced increases of nearly 2.7 million sq. ft. of office space, 178,800 sq. ft. of retail space, and 4.4 million sq. ft. of industrial/flex space. During this same time frame, total hotel and multi-family inventory also increased by 3,268 rooms and 11,967 units, respectively, within the City.
Comparatively, new inventory within the City over the past five years accounted for 33% of the County’s new commercial space (including office, retail, and industrial/flex space), 38% of new hotel rooms, and 36% of new for-rent multi-family units.
Hotel inventory increased 1.4% from the prior year, from 30,201 rooms to 30,620 rooms.
Vacancy rates for hotel properties decreased 0.2 percentage points, from 25.5% to 25.3%.
Average daily rate (“ADR”) for hotel rooms decreased 2.3%, from $148.86 to $145.39.
Vacancy rates in the City saw significant increases over the past five years: 1.6 percentage points in the office market, 3.6 percentage points in the hotel market, and 2.2 percentage points in the rental multifamily market. Rising vacancy rates are likely due to a shortage of desirable rental spaces and rental costs exceeding what the local market can afford.
In contrast, City’s retail and industrial/flex markets experienced a decline in vacancy rates over the past five years by 0.4 and 0.2 percentage points, respectively. A decline in vacancy rates may be attributed to an increase in healthy spending and demand for rentable spaces within the City.

For-rent multi-family units increased 5.8% from the prior year, from 67,128 units to 71,051 units.
Vacancy rates increased 1.1 percentage points from the prior year, from 7.0% to 8.1%.
Average rental rates per unit decreased 2.6%, from $1,717 to $1,673.
Over the past five years, 2019 to 2023, the average rental rates per sq. ft. for commercial space within the City experienced increases of 17% for office, 31% for retail, and 54% for industrial/flex. Additionally, average daily rates for hotel rooms and average rental rates per unit for multi-family increased 12% and 22%, respectively. Increases in average rental rates may be attributed to rising operating and fixed costs, as well as properties in desirable locations or with premium amenities that can command higher rents.
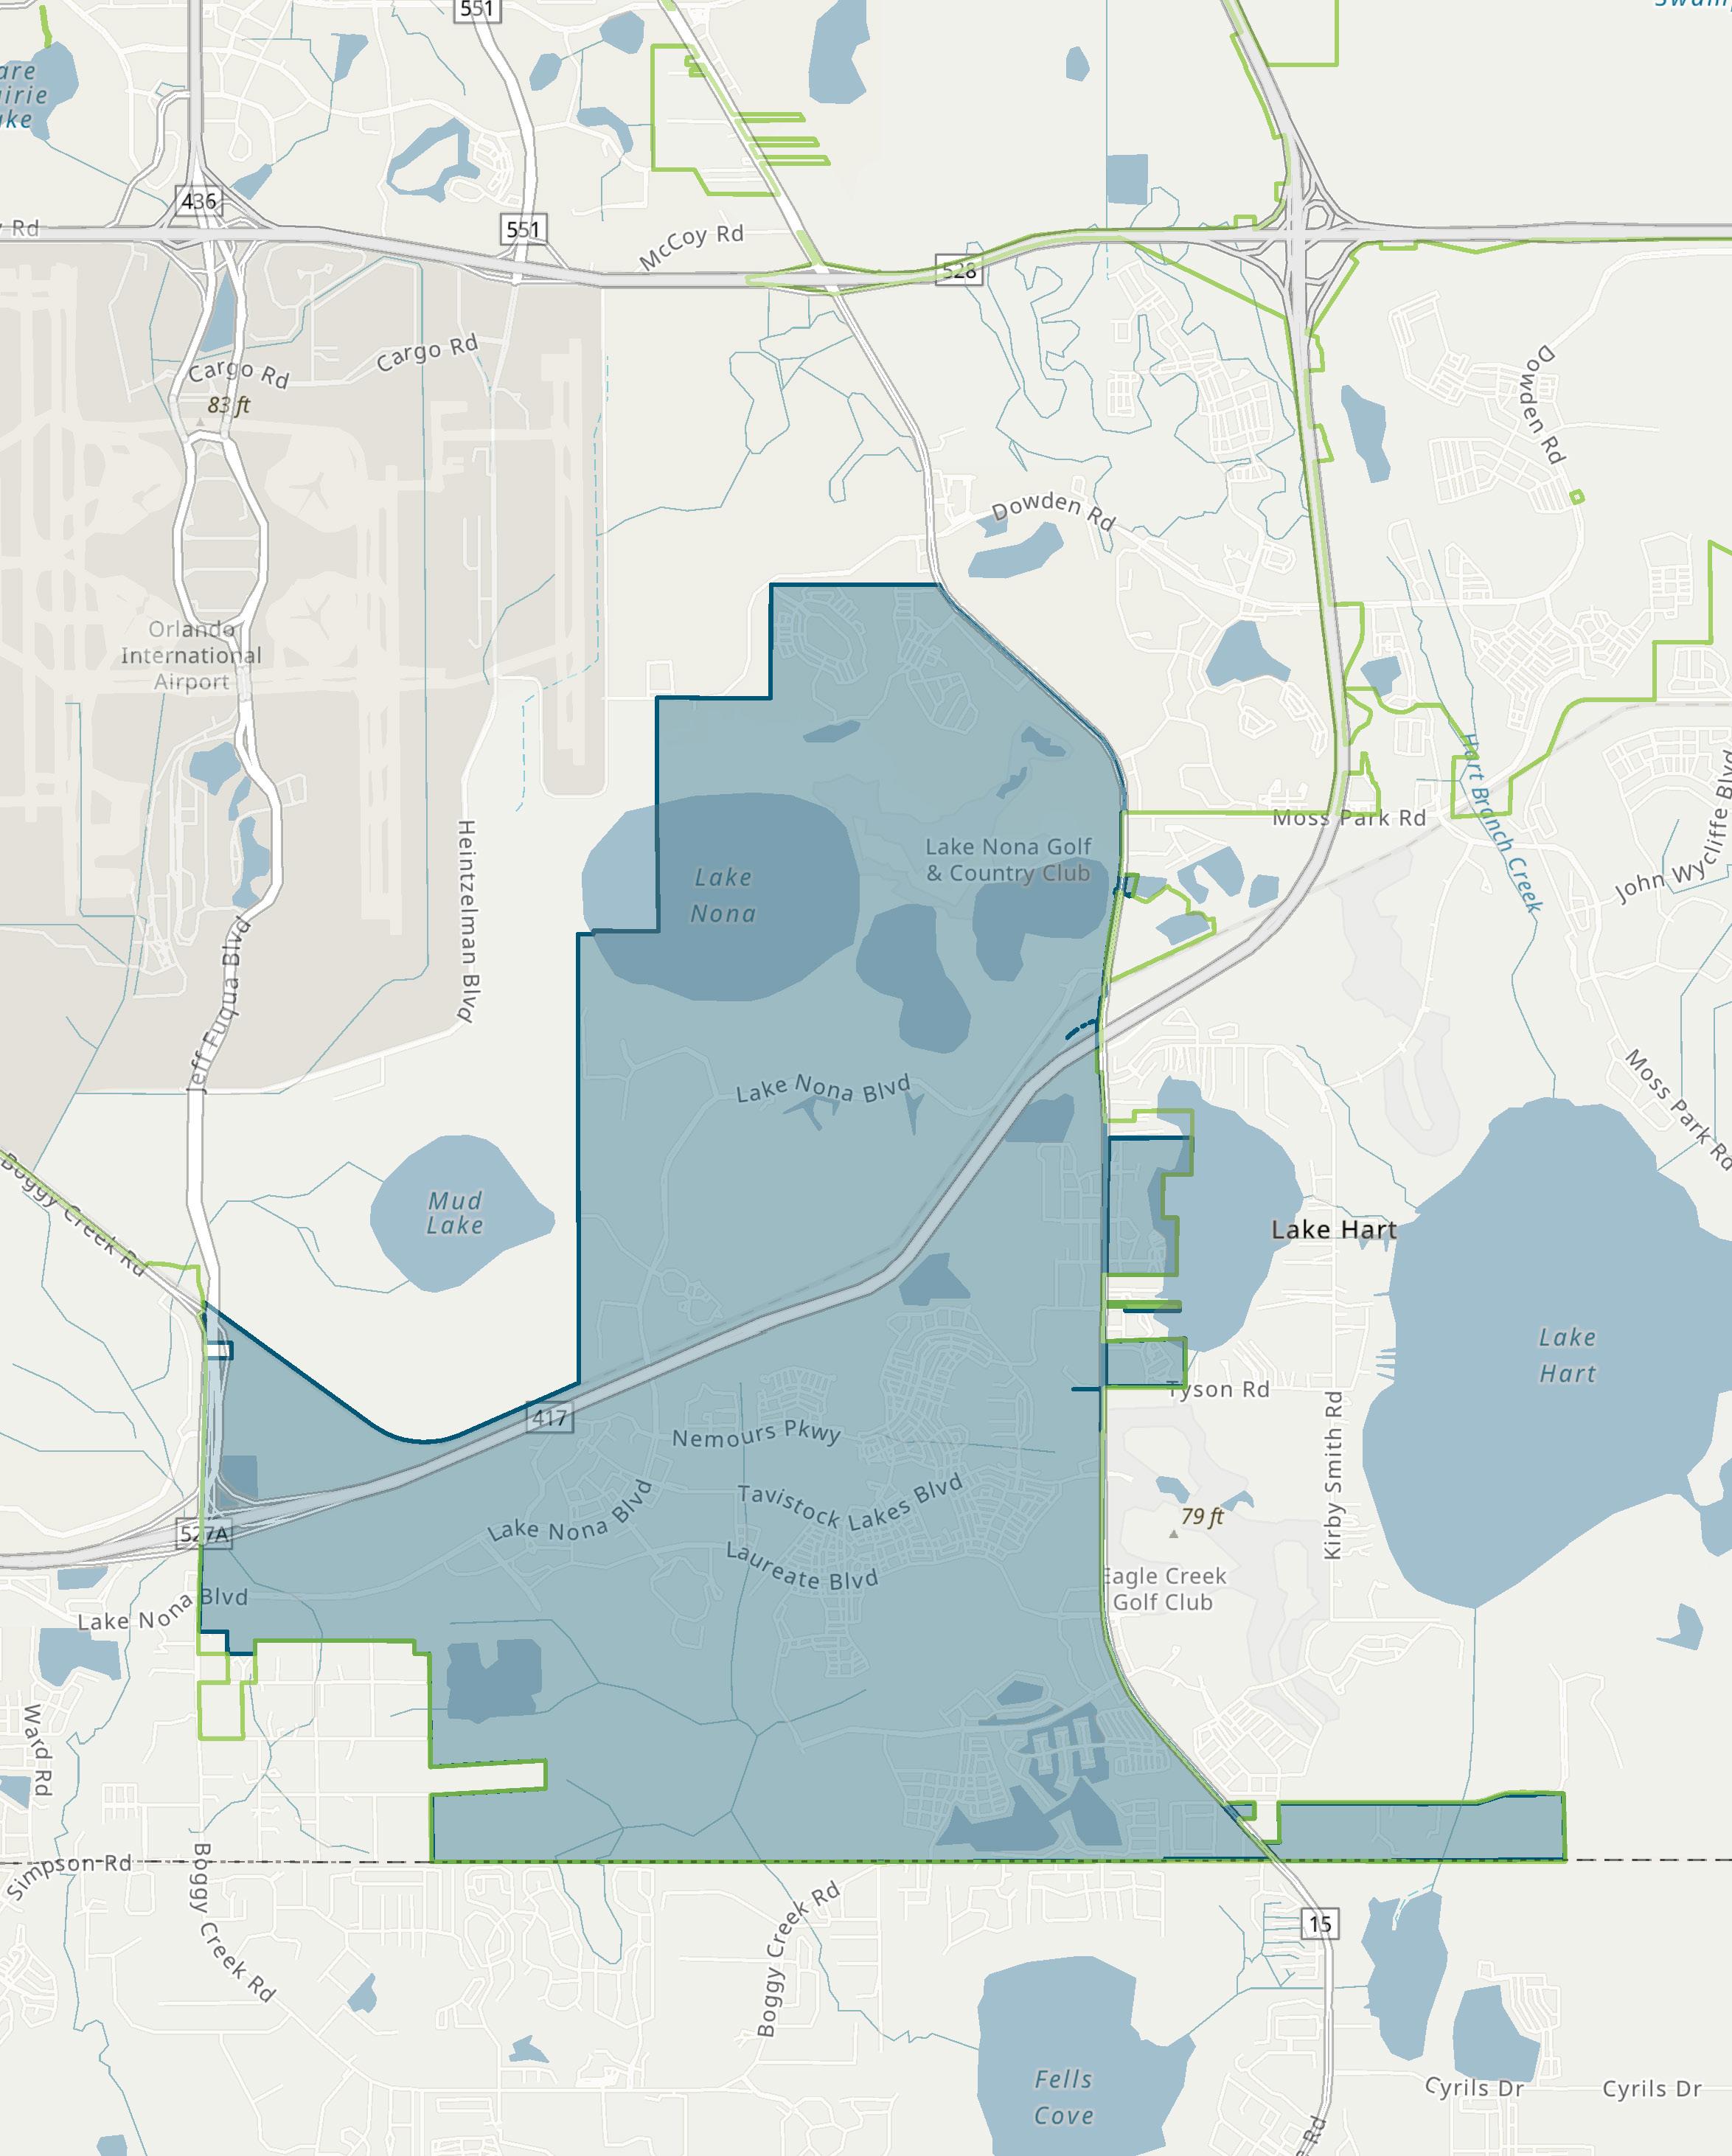
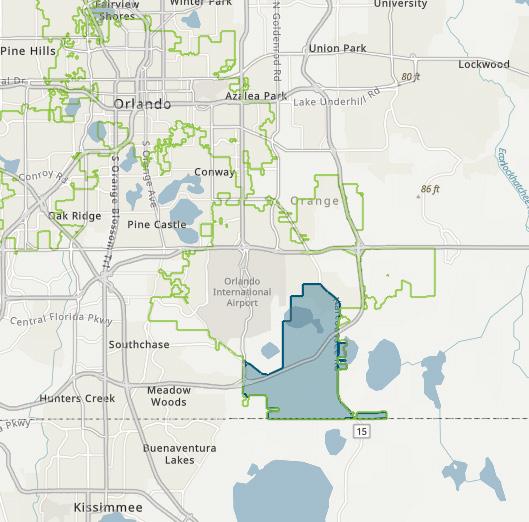
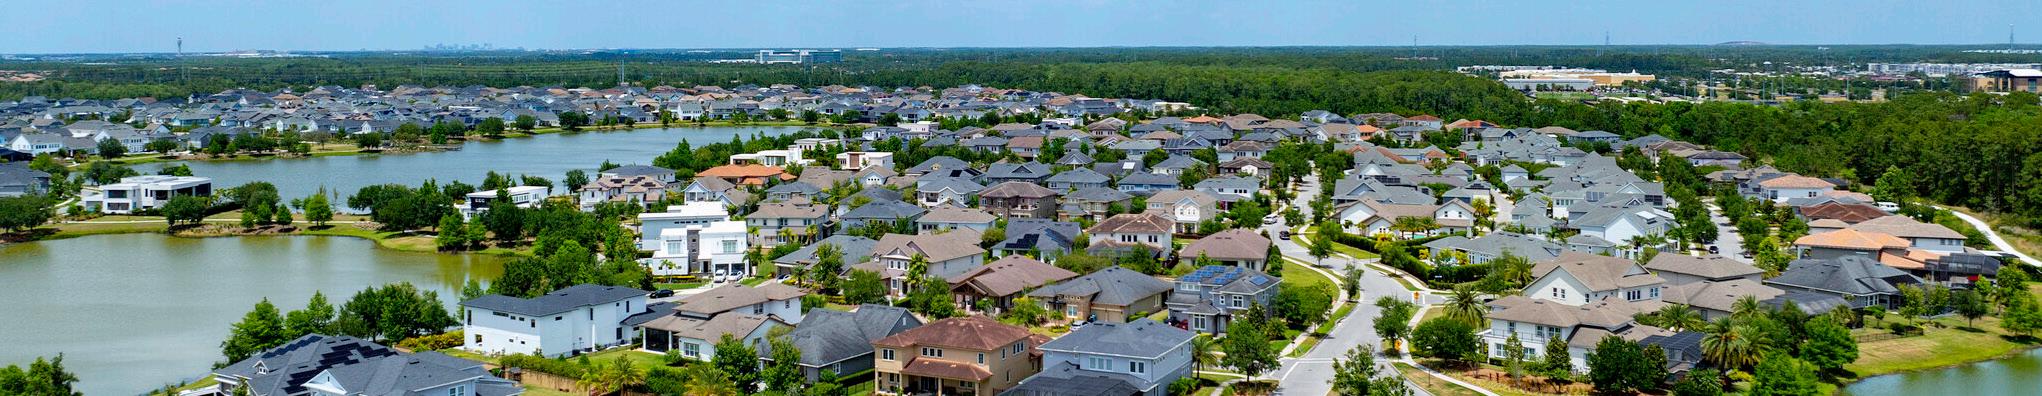
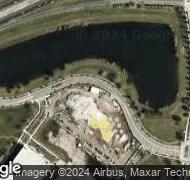
The Lake Nona District (“Lake Nona”) is a masterplanned community developed by Tavistock Development Company, located in southeastern Orlando. Spanning approximately 17 square miles, Lake Nona is conveniently located near major thoroughfares, including State Road 417 and Narcoossee Road, as depicted in the map on the following page. Lake Nona’s proximity to Orlando International Airport further enhances accessibility for both residents and visitors.
Recognized as one of the fastest-growing communities in the nation, Lake Nona is celebrated for its well-designed neighborhoods, top-tier educational institutions, thriving business and research hubs, vibrant retail and entertainment centers, and diverse workspaces.
Prioritizing collaboration and innovation, Lake Nona’s mission is to create the ideal place that inspires human potential. From a growing health and life sciences campus to groundbreaking connectivity, engaging community events and dedicated investment in the arts, Lake Nona’s vision is to create an environment designed for people, institutions, and businesses to thrive.
Supporting both the mission and vision, Lake Nona prioritizes the goal of fostering a collaborative ecosystem by strategically locating organizations and businesses close to one another. Currently, the focus is on two key ecosystems: health care and human potential. Additionally, Lake Nona is dedicated to integrating community art into its developments, aiming to create unique and memorable experiences for both residents and visitors.
At the heart of Lake Nona lies its acclaimed “Medical City,” which hosts a cluster of world-class medical and research institutions such as Nemours Children’s Hospital, the Orlando Veterans Affair (“VA”) Medical Center, and the University of Central Florida (“UCF”) College of Medicine, and UCF Academic Health Sciences Campus. In addition, the Guidewell Innovation Center is also located within Lake Nona, featuring a medical innovation hub for start-ups and healthcare entrepreneurs. Complementing its healthcare focus, Lake Nona offers robust educational opportunities through institutions such as Lake Nona High School, and Valencia College’s Lake Nona Campus.
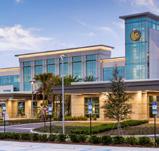
Residents can also enjoy a vibrant lifestyle with numerous shopping and entertainment destinations including the Lake Nona Town Center
featuring a walkable urban center with a variety of retail, dining, entertainment, and other amenities. Lake Nona also boasts a sports and performance district that is dedicated to sports and human potential, including facilities like the U.S. Tennis Association National Campus, one of the largest tennis facilities in the world with a state-of-the art training center. In addition to these sports facilities, Lake Nona features numerous parks, trails, and the exclusive Lake Nona Golf & Country Club.
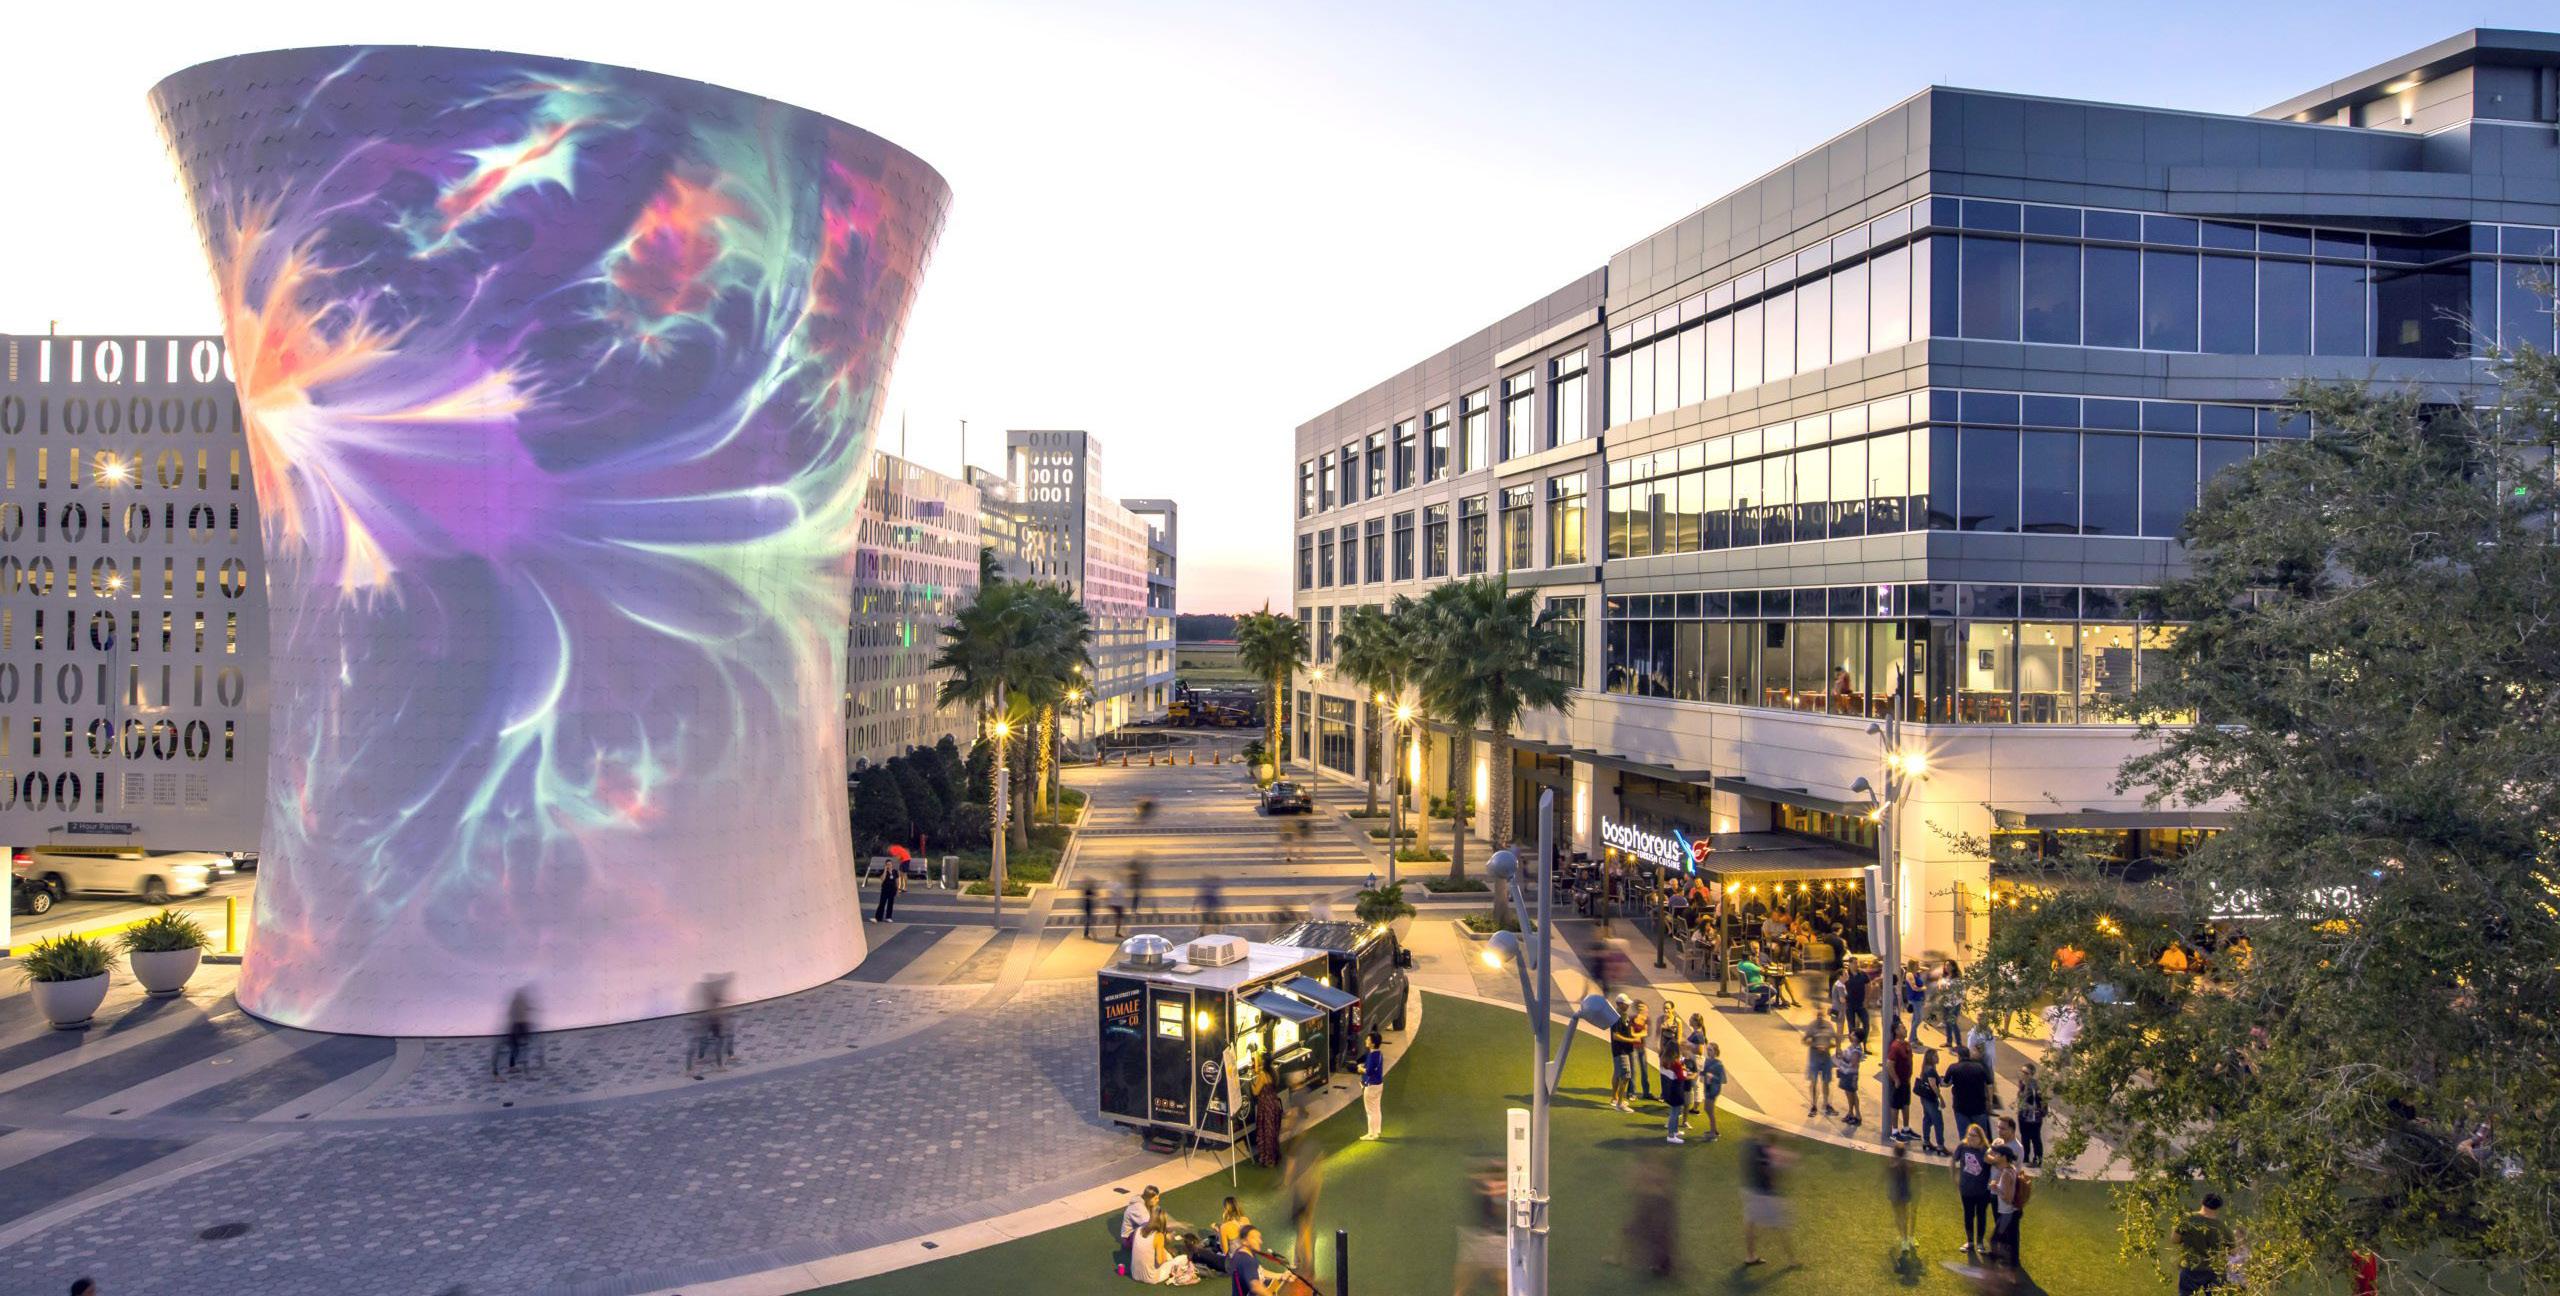
Moreover, visitors to Lake Nona can stay at the Lake Nona Wave Hotel. Having opened in December 2021, this central landmark features a distinctive curved glass façade inspired by energy wavelengths. The hotel offers 216 guest rooms, 16 one-bedroom suites, and two penthouse suites.
City of Orlando
Lake Nona District
Lake Nona aims to foster a sustainable, innovative, and connected community that maximizes human potential and enhanced infrastructure. Key priority projects and programs within Lake Nona include:
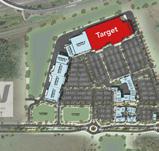
Lake Nona West — A new lifestyle shopping center currently under development. Once complete, the project will feature Target as its anchor tenant, along with a mix of shops, restaurants, and entertainment spaces.
Medical City — Lake Nona’s Medical City is continuously evolving with several new projects, including hospital expansions such as AdventHealth Lake Nona and UCF Lake Nona Hospital, as well as ongoing enhancements and expansions to Nemours Children’s Hospital.
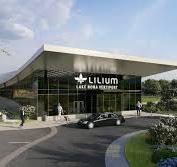
Advanced Technologies — Lake Nona plans to further integrate advanced technologies, including smart city infrastructure and renewable energy solutions, to promote a sustainable and efficient living environment. Some of these key advancements include: the autonomous shuttle program, a driver-less transportation option that use technology to navigate, and the Lilium Veriport; in partnership with Greater Orlando Aviation Authority (“GOAA”), Lake Nona is constructing the nation’s first high-speed, electric air mobility hub.
Lake Nona’s emphasis on top-tier education and business development will attract leading institutions and companies. By prioritizing collaboration, cultural enrichment, and environmental stewardship, Lake Nona aims to create a thriving, forward-thinking community.
As of year-end 2023, Lake Nona’s total employees compose approximately 2.3% of the total employment within the City. Lake Nona’s employment sector is primarily dominated by the health care and social assistance, accommodation and food services, and retail trade industries, as illustrated in the table below.
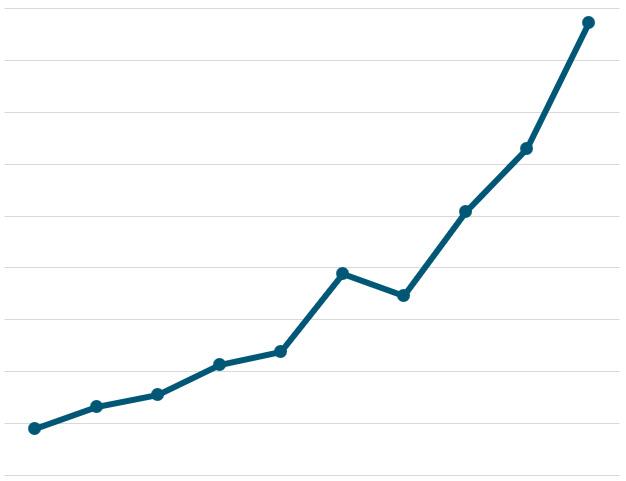
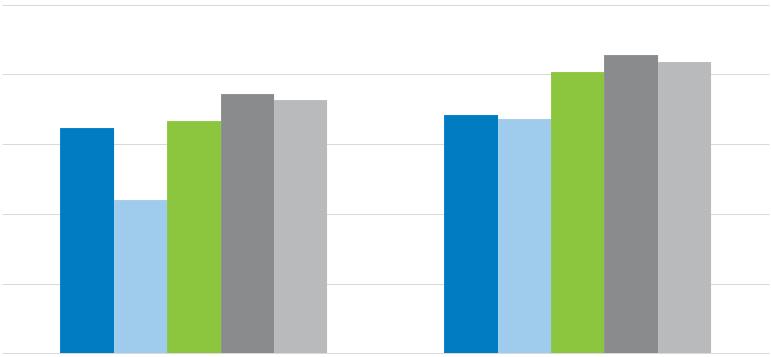
Over the 10-year period, from 2014 to 2023, Lake Nona’s total employment has experienced a compound annual growth rate (“CAGR”) of 26%. This growth rate is significantly higher than the City’s 2.3% CAGR during the same period. The figure above illustrates Lake Nona’s total annual employment trends from 2014 through 2023.
In addition, Lake Nona’s total employment increased from 892 employees in 2014 to 8,732 employees in 2023—resulting in a net increase of 7,840 total employees. During this same time frame, Lake Nona has captured approximately 10% of the City’s total growth in employment.
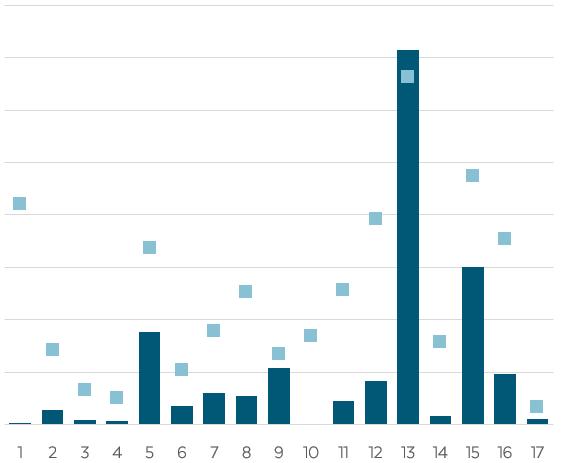
A location quotient (“LQ”) is an analytical statistic that measures how concentrated a particular industry is within an area. The above figure illustrates the concentration of employment by industry sector within Lake Nona, as compared to the concentration within the City for year-end 2023. Lake Nona has a higher concentration of industry professionals (LQ greater than 1.0) in the agricultural and mining, retail trade, educational services, health care and social assistance, accommodation and food services, and other services (excluding public administration) industries. However, there are no industries in which Lake Nona and the City are equally specialized (LQ equals 1.0).
As of year-end 2023, residents of Lake Nona spent an estimated $1.0 billion, with 33% allocated to housing, 31% to retail goods, 11% to food (both away from home and at home), 7.5% to health care, and 4.2% to entertainment and recreation. This spending pattern highlights the dominance of housing and retail, which together account for 64% of total expenditures. Additionally, food and health care make up 18.5% of the consumer spending budget, while entertainment and recreation represents the smallest portion of consumer spending. Within the broader context, total expenditures within Lake Nona make up approximately 8.8% of the consumer spending within the City, with over $11.421 billion in total expenditures as of year-end 2023.
As of year-end 2023, Lake Nona’s for-sale residential market included 6,017 residential units. Single-family homes made up the majority, at 98%, while condominium (“condo”) accounted for just 2% of the total. Lake Nona’s residential units represent 11.5% of the total single-family residential units and 0.4% of the total condos within the City.
Lake Nona encompasses two condo properties, including the Gatherings on Lake Nona and Kensington Shores. Lake Nona also boasts several single-family residential neighborhoods such as Laureate Park, Isles of Lake Nona, Summerdale Park, Laurel Pointe, Somerset Crossings, Enclave at Village Walk, Village Walk, Somerset Park, and NorthLake Park.
Year-over-year, year-end 2022 through year-end 2023, total single-family residential units within Lake Nona saw an increase of 2.1%. Comparatively, total condo units within Lake Nona remained unchanged during this same time period. Over the past five years, 2019 to 2023, total inventory of forsale residential units within Lake Nona experienced an increase of 24% with the addition of 1,156 new single-family residential units and 27 new condo units.
The figures below illustrate the change in annual inventory for both single-family residential units and condo units from 2019 to 2023.
As of year-end 2023, the average single-family residential assessed value and taxable value per unit at $516,180 and $465,303, respectively, were both greater than those of residential condo units—with an assessed value and taxable value per unit of $422,370 and $235,090, respectively.
In addition, Lake Nona experienced a total of 361 single-family unit sales and 16 condo unit sales in 2023. Lake Nona’s residential unit sales represent 4.4% of the total single-family residential unit sales and 1.1% of the total condo unit sales within the City, as illustrated in the table below.
By the end of 2023, the total sales price for singlefamily residential units reached approximately $292.7 million, while condo unit sales amounted to around $10.0 million. The average sales price per sq. ft. for single-family homes in Lake Nona was slightly lower than the City’s average, at $346.26 per sq. ft. In contrast, the average sales price per sq. ft. for condo units in Lake Nona was significantly higher than the City’s average, at $222.78 per sq. ft. during the same period.
As of year-end 2023, Lake Nona’s commercial real estate market composed nearly 3.7 million square feet (“sq. ft.”) of office, retail, and industrial/flex space, in addition to 560 hotel room and 2,430 forrent market-rate multi-family residential units, as illustrated in the market characteristics table below.
Office space composed the majority of Lake Nona’s office, retail, and industrial/flex inventory at 63% of the total share, followed by retail space with 35% of the total, as of year-end 2023. Specifically, the office space within Lake Nona consisted of 90% Class A space, 8.8% Class B space, and the remaining portion as Class C space.
Although office space composed the majority of commercial inventory within Lake Nona, office properties had a significantly lower occupancy rate compared to the retail and industrial/flex properties, both of which were fully occupied as of year-end 2023. Moreover, occupancy rates for both Lake Nona’s hotel and for-rent multifamily markets were approximately 80% and 84%, respectively. Additionally, average rental rates for retail properties were significantly higher than those for office and industrial/flex properties within Lake Nona as of year-end 2023.
In addition, Lake Nona’s average rental rates for its commercial real estate markets were greater than those for the City as of year-end 2023.
There were 11 lease transactions that occurred in Lake Nona’s office, retail, and industrial/flex markets—resulting in a total of 36,680 sq. ft. leased during 2023. Leasing activity refers to the volume of square footage that is committed to and actually signed during a given period of time, including direct leases, subleases and renewals of existing leases.
Gross absorption measures the total sq. ft. occupied within existing buildings over a given period, without accounting for vacated space. As of year-end 2023, industrial/flex space composed the majority of commercial gross absorption within Lake Nona, closely followed by office space. In addition, there were 503 units absorbed into the Lake Nona for-rent multi-family residential market during this same time frame.
The following pages illustrate major development activities, year-over-year snapshots, and five-year annual trends for Lake Nona’s commercial real estate market.
Office space increased 23.5% from the prior year from 1.87 million to 2.31 million sq. ft.
Vacancy rates for office properties increased 15 percentage points, from 7.5% to 22.7%.
Average rental rates per sq. ft. decreased 6.0%, from $37.00 to $34.78.
Leasing activity of office space decreased 84%
By the end of 2023, Lake Nona saw the addition of approximately 543,870 sq. ft. of new office, retail, and industrial/flex space across 6 buildings, along with 566 rental multi-family units within 2 buildings. Some of the major development activity throughout the past year is illustrated in the graphic below.
Within Lake Nona, there is approximately 83,490 sq. ft. of office space, 8,000 sq. ft. of retail space, and 887 rental multi-family units currently under-construction as of year-to-date 2024, through August 2024.
Retail space increased 3.2% from the prior year, to 1.28 million sq. ft.
Vacancy rates for retail properties decreased 0.1 percentage points, from 0.1% to 0.0%.
Average rental rates per sq. ft. increased 7.3%, from $42.84 to $45.95.
Leasing activity of retail space decreased 53%
Industrial/flex space increased 100% from the prior year, from zero sq. ft. to 95,000 sq. ft.
Since industrial/flex space was created in Lake Nona in 2023, there is no year-overyear performance data available for this property use.
Hotel inventory remained unchanged from the prior year, at 558 rooms.
Vacancy rates for hotel properties decreased 1.3 percentage points, from 21.1% to 19.8%.
Average daily rate (“ADR”) for hotel rooms decreased 2.7%, from $190.17 to $185.01.
Over the past five years, 2019 through 2023, total inventory of commercial space within Lake Nona experienced increases of nearly 1.6 million sq. ft. of office space, 322,400 sq. ft. of retail space, and 95,000 sq. ft. of industrial/flex space. During this same time frame, total hotel and multi-family inventory also increased by 235 rooms and 1,220 units, respectively, within Lake Nona.
Comparatively, the new inventory in Lake Nona over the past five years accounted for 4.7% of the City’s new commercial space (including office, retail, and industrial/flex space), 7.2% of new hotel rooms, and 10.2% of new rental units.
Over the past five years, Lake Nona saw vacancy rate increases of 7, 3, and 10 percentage points in the office, hotel, and for-rent multi-family markets, respectively. Rising vacancy rates are likely due to a shortage of desirable rental spaces and high rental costs exceeding what the local market can afford. However, notable increases from 2020-2022 may also be a result of the COVID-19 pandemic. In contrast, Lake Nona’s retail market experienced a 1 percentage point decline in vacancy rates over the past five years, which may be attributed to an increase in spending, demand for rentable spaces, and a growing population residing in Lake Nona.
For-rent multi-family units increased 30.4% from the prior year, to 2,430 units.
Vacancy rates decreased 1.3 percentage points for multi-family properties, from 17.1% to 15.8%.
Average rental rates per unit decreased 2.1%, from $2,188 to $2,141.
Over the past five years, 2019 to 2023, the average rental rates per sq. ft. for commercial space within Lake Nona experienced increases of 35% for office and 28% for retail. During this same time frame, average daily rates for hotel rooms increased 48% and average rental rates per unit for multi-family increased 20%. Increases in average rental rates may be attributed to rising operating and fixed costs, as well as properties in desirable locations or with premium amenities that can command higher rents.
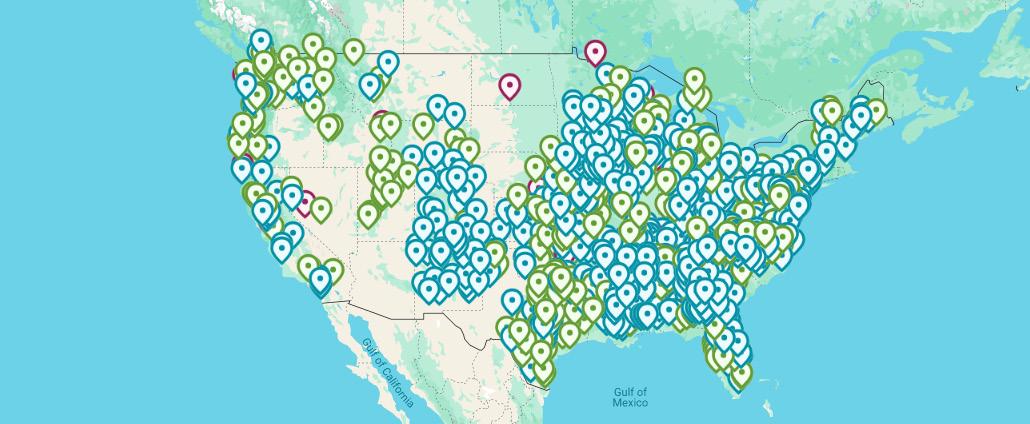
Everyone should have access to an inclusive and resilient Main Street—a place with a vibrant local economy, rich character, and welcoming spaces that cater to both residents and visitors. For over four decades, Main Street America has been revitalizing downtowns and neighborhood commercial districts. Established in 1980 as the National Main Street Center, a program of the National Trust for Historic Preservation, the network has facilitated more than $101 billion in local reinvestment, rehabilitated 335,000 buildings, created 782,000 new jobs, and launched 175,000 new businesses in over 2,000 communities, as depicted in the map below.
Main Street America leads a collaborative movement with partners and grassroots leaders that advances shared prosperity, creates resilient economies, and improves quality of life through place-based economic development and community preservation in downtowns and neighborhood commercial districts across
the country. The Main Street America network comprises small towns, mid-sized communities, urban commercial districts, and thousands of organizations, individuals, and local leaders, all of which embody the rich diversity that makes this country unique.
Working in collaboration with thousands of local community partners across the nation who share their commitment to advancing shared prosperity, creating resilient economies, and improving quality of life, Main Street America partners with a range of nationally recognized corporations, foundations, government entities, and organizations to deliver grants and technical services to support thriving local economies and inviting public spaces. Partnerships include American Express, T-Mobile, Grow with Google, GM, The Hartford, the Truist Foundation, U.S. Department of Transportation, and many more.
Main Street America supports communities nationwide through its “Main Street Approach” and comprehensive programming. This approach offers a practical, adaptable framework for community-based revitalization, tailored to local conditions. It helps communities start and grow their revitalization efforts with the help of the Main Street America team.
Central to this approach are Transformation Strategies, which provide a focused plan for revitalizing and strengthening a downtown or commercial district’s economy. These strategies are implemented through activities in four key areas, known as the Four Points:
Economic Vitality — Focuses on capital, incentives, and other economic and financial tools to assist new and existing businesses, catalyze property development, and create a supportive environment for entrepreneurs and innovators that drive local economies.


Design — Supports a community’s transformation by enhancing the physical and visual assets that set the commercial district apart.
Promotion — Positions the downtown or commercial district as the center of the community and hub of economic activity, while creating a positive image that showcases a community’s unique characteristics.
Organization — Involves creating a strong foundation for a sustainable revitalization effort, including cultivating partnerships, community involvement, and resources for the district.
The Orlando Main Streets Program is a comprehensive initiative aimed at revitalizing and strengthening neighborhood commercial districts within the City of Orlando. Established in 2008 by Mayor Buddy Dyer and the Orlando City Council, the program recognizes the vital role that these districts play in the overall health of the City’s neighborhoods. The Orlando Main Streets Program provides annual financial support, technical assistance, and intensive training to help these Main Street districts thrive and become vibrant centers of commerce and community life.
As a Main Street America Coordinating Program, the Orlando Main Streets Program is part of a larger grassroots network that includes over 40 Coordinating Programs and more than 2,000 neighborhoods and communities across the country. This network is dedicated to creating high-quality places and building stronger communities through preservation-based economic development. The program aligns with Main Street America’s mission to provide technical expertise, education, resources, and support to designated Main Street districts. It guides these districts in developing asset-based economic development strategies that achieve measurable results such as investment, business growth, and job creation. The program operates according to the “Main Street Approach”, aligning with the Four Points: economic vitality, design, promotion, and organization.
The vision for the Orlando Main Street districts is to be organizationally sound, economically viable, and vibrant centers of commerce. These districts aim to inspire community and visitor engagement, creating a unique sense of place and local business
prosperity through collaborative partnerships with businesses, stakeholders, and residents. Each district develops an individual work plan envisioned and implemented by a non-profit Board of Directors, ensuring that the initiatives are community-driven and reflective of local needs and aspirations.
The Orlando Main Street districts receive ongoing technical assistance and training in the Main Street Approach from both the Orlando Main Streets Program and Main Street America. Each district employs a full-time Executive Director who oversees the implementation of programs and initiatives. These districts also raise matching funds, incorporate their organizations, and develop annual work plans to guide their efforts.
In addition, the Orlando Main Streets Program plays a crucial role in enhancing the economic and social vitality of the City of Orlando’s neighborhoods. By providing the necessary support and resources, it helps create dynamic and attractive places for residents and visitors alike. The program’s focus on asset-based economic development strategies has led to significant outcomes, including increased investment, business growth, and job creation within its Main Street districts. Overall, the Orlando Main Streets Program contributes to the prosperity and quality of life in the City of Orlando.
The Orlando Main Streets program was established to support and enhance the city’s neighborhood commercial districts. Launched in 2008 by Mayor Buddy Dyer and the Orlando City Council, this initiative aims to create, define, and strengthen these districts through financial support, technical assistance, and intensive training. Each district develops its own work plan, guided by a nonprofit Board of Directors, to foster local business growth and community engagement.
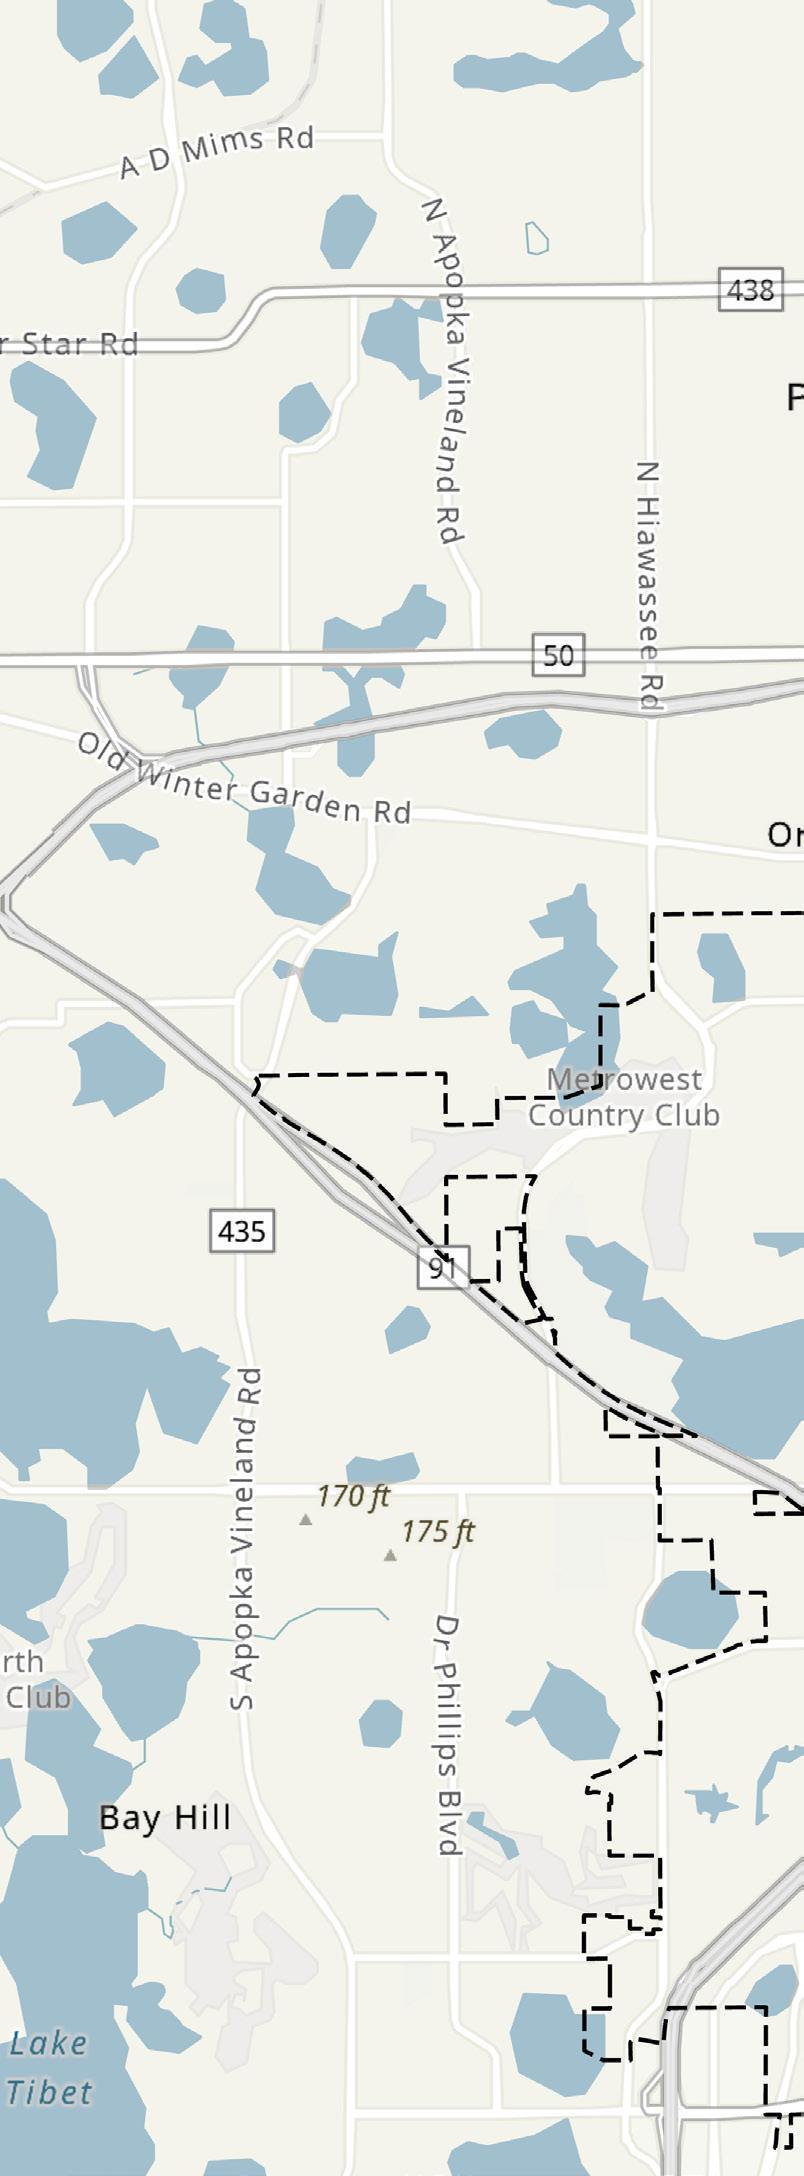
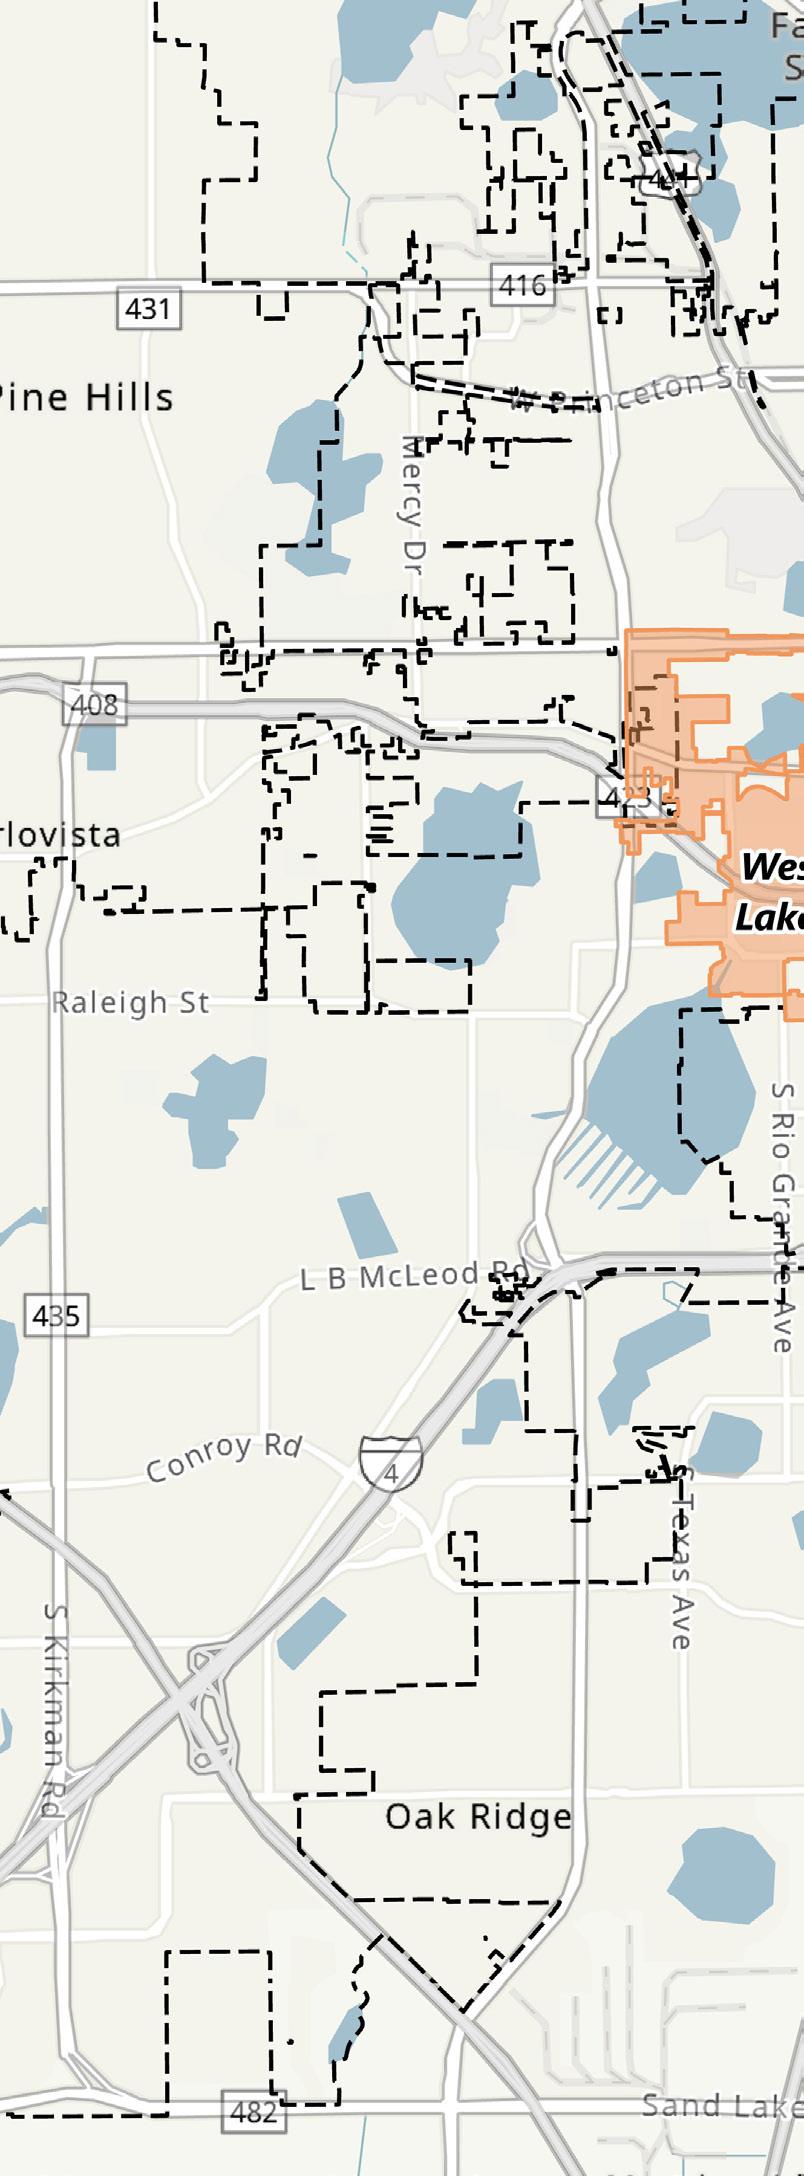
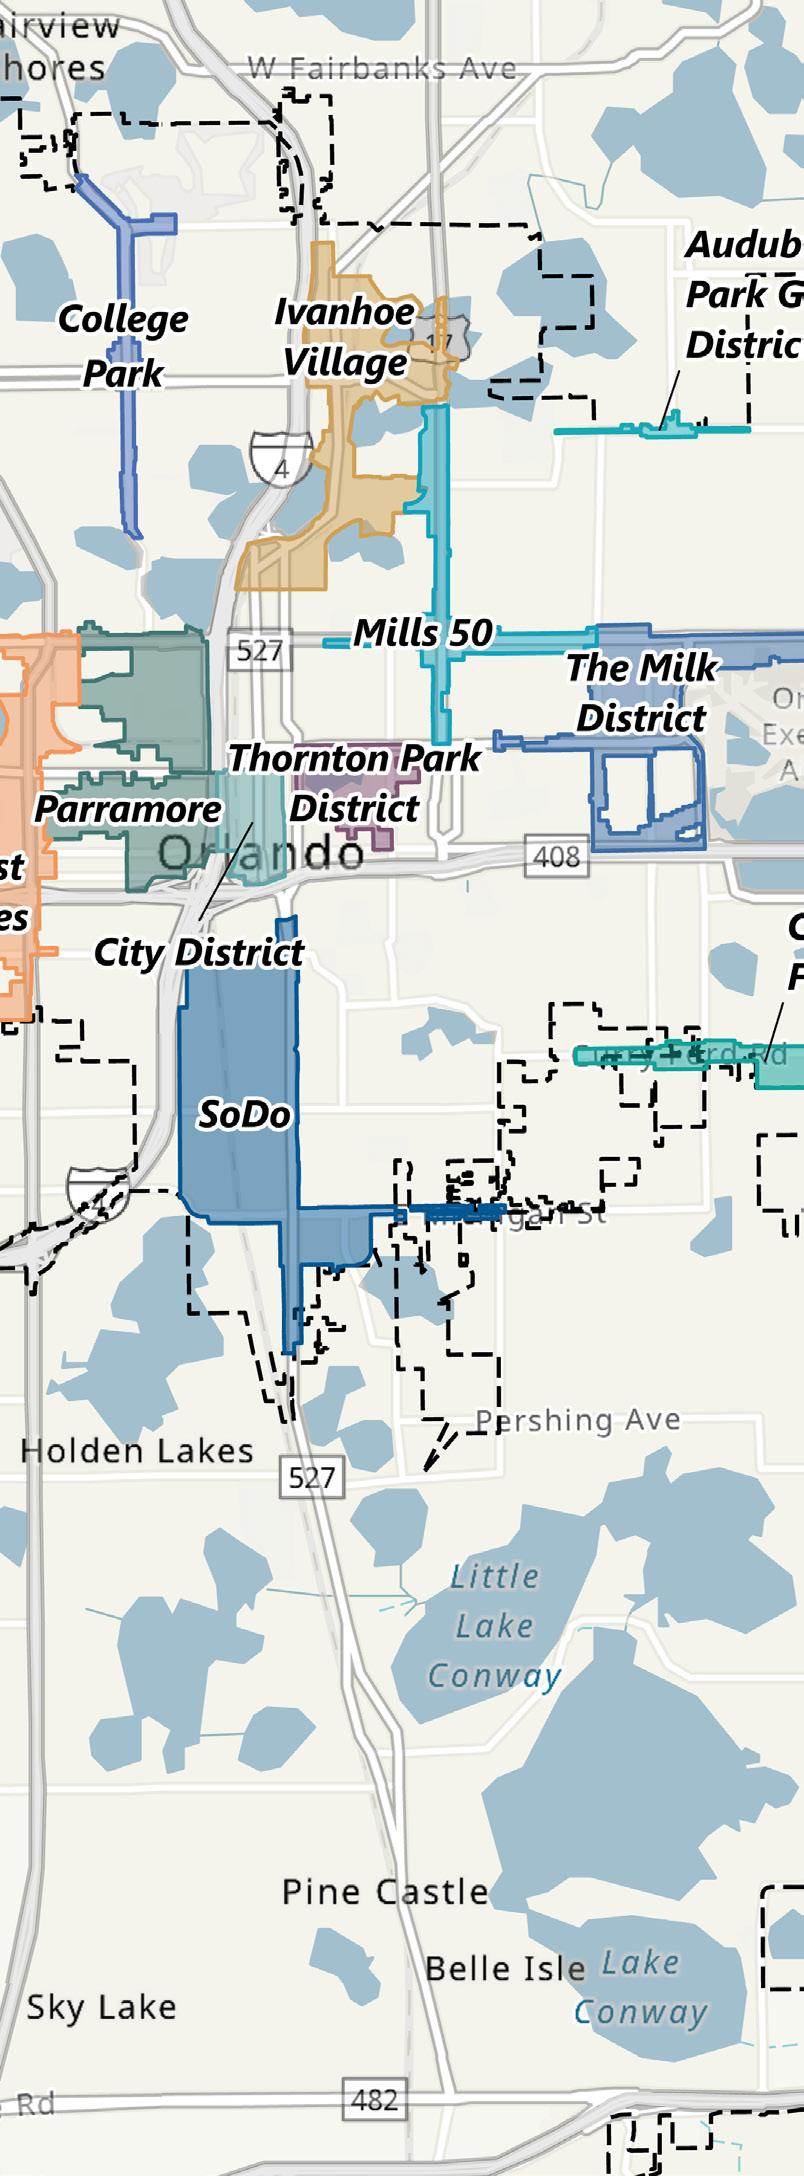
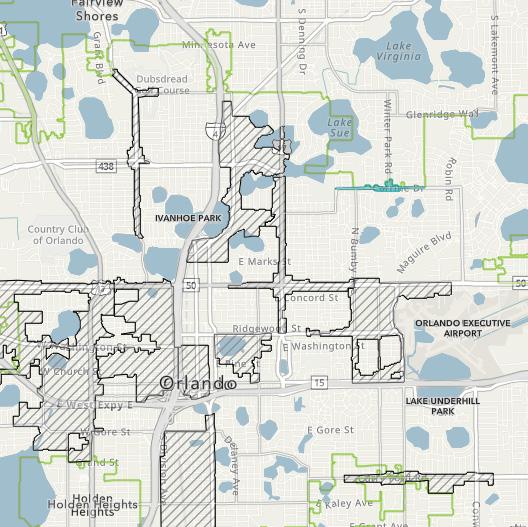
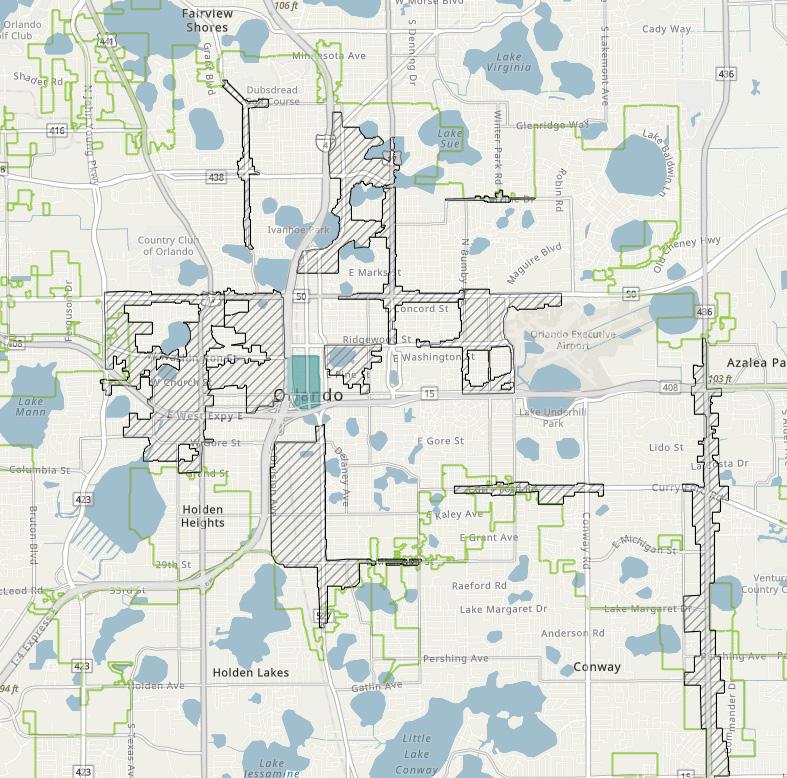
The program emphasizes the importance of community involvement and collaboration, ensuring that revitalization efforts are inclusive and sustainable across all twelve (12) of the Orlando Main Street Districts, listed below and illustrated in the adjacent map:
▪ Audubon Park Garden District
▪ City District
▪ College Park
▪ Curry Ford West
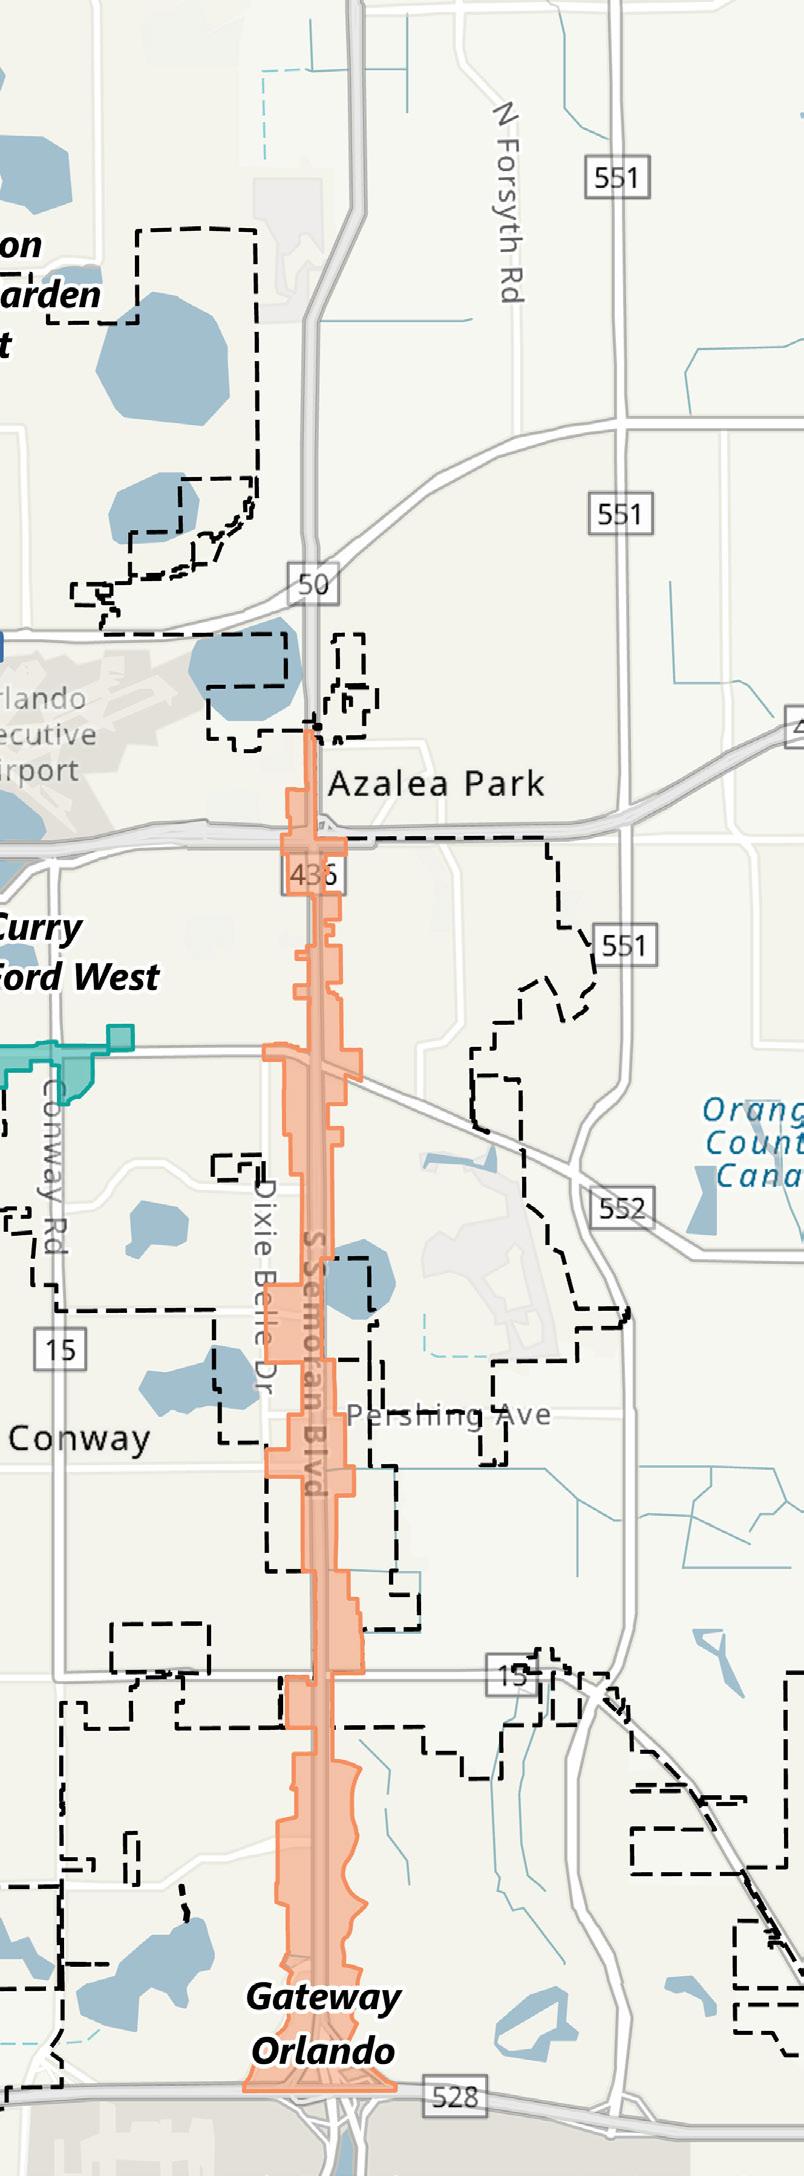
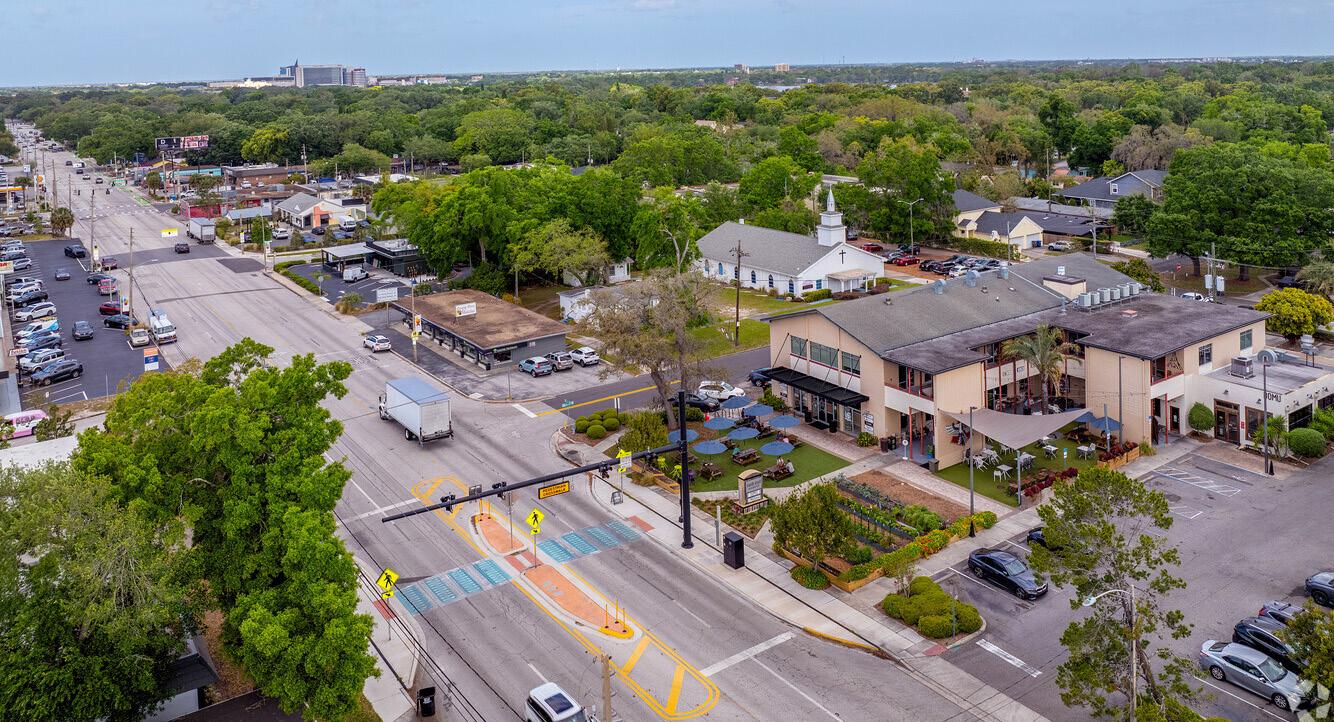
▪ Gateway Orlando District
▪ Ivanhoe Village
▪ The Milk District
▪ Mills 50 District
▪ SoDo District
▪ Thornton Park District
▪ West Lakes District
▪ Parramore District
Residents have several ways to get involved in their local Main Street Program, contributing to the vibrancy and growth of their neighborhoods. Some key ways to participate include:
Volunteer: Join committees or participate in events organized by the local Main Street district. Volunteering is a great way to meet neighbors and make a positive impact on the community.
Attend Events: Support local businesses and enjoy community events such as festivals, markets, and cultural activities. These events often need volunteers and attendees to be successful.
Join a Board or Committee: Many Main Street programs have boards or committees that guide their activities. Residents can apply to serve on these boards, playing a crucial role in decisionmaking and strategic planning. By participating, residents help ensure their district meets the community’s needs and aspirations.
Become a Member: Some districts offer membership programs for residents and businesses. Membership often includes benefits such as networking opportunities, discounts, and the chance to have a say in district initiatives.
Support Local Businesses: Frequenting local shops, restaurants, and services helps to strengthen the local economy and supports the goals of the Main Street program.
Stay Informed: Sign up for newsletters or follow the local Main Street district on social media to stay updated on news, events, and opportunities to get involved.
By participating in these activities, residents can play a crucial role in enhancing the quality of life and economic vitality of their neighborhoods.
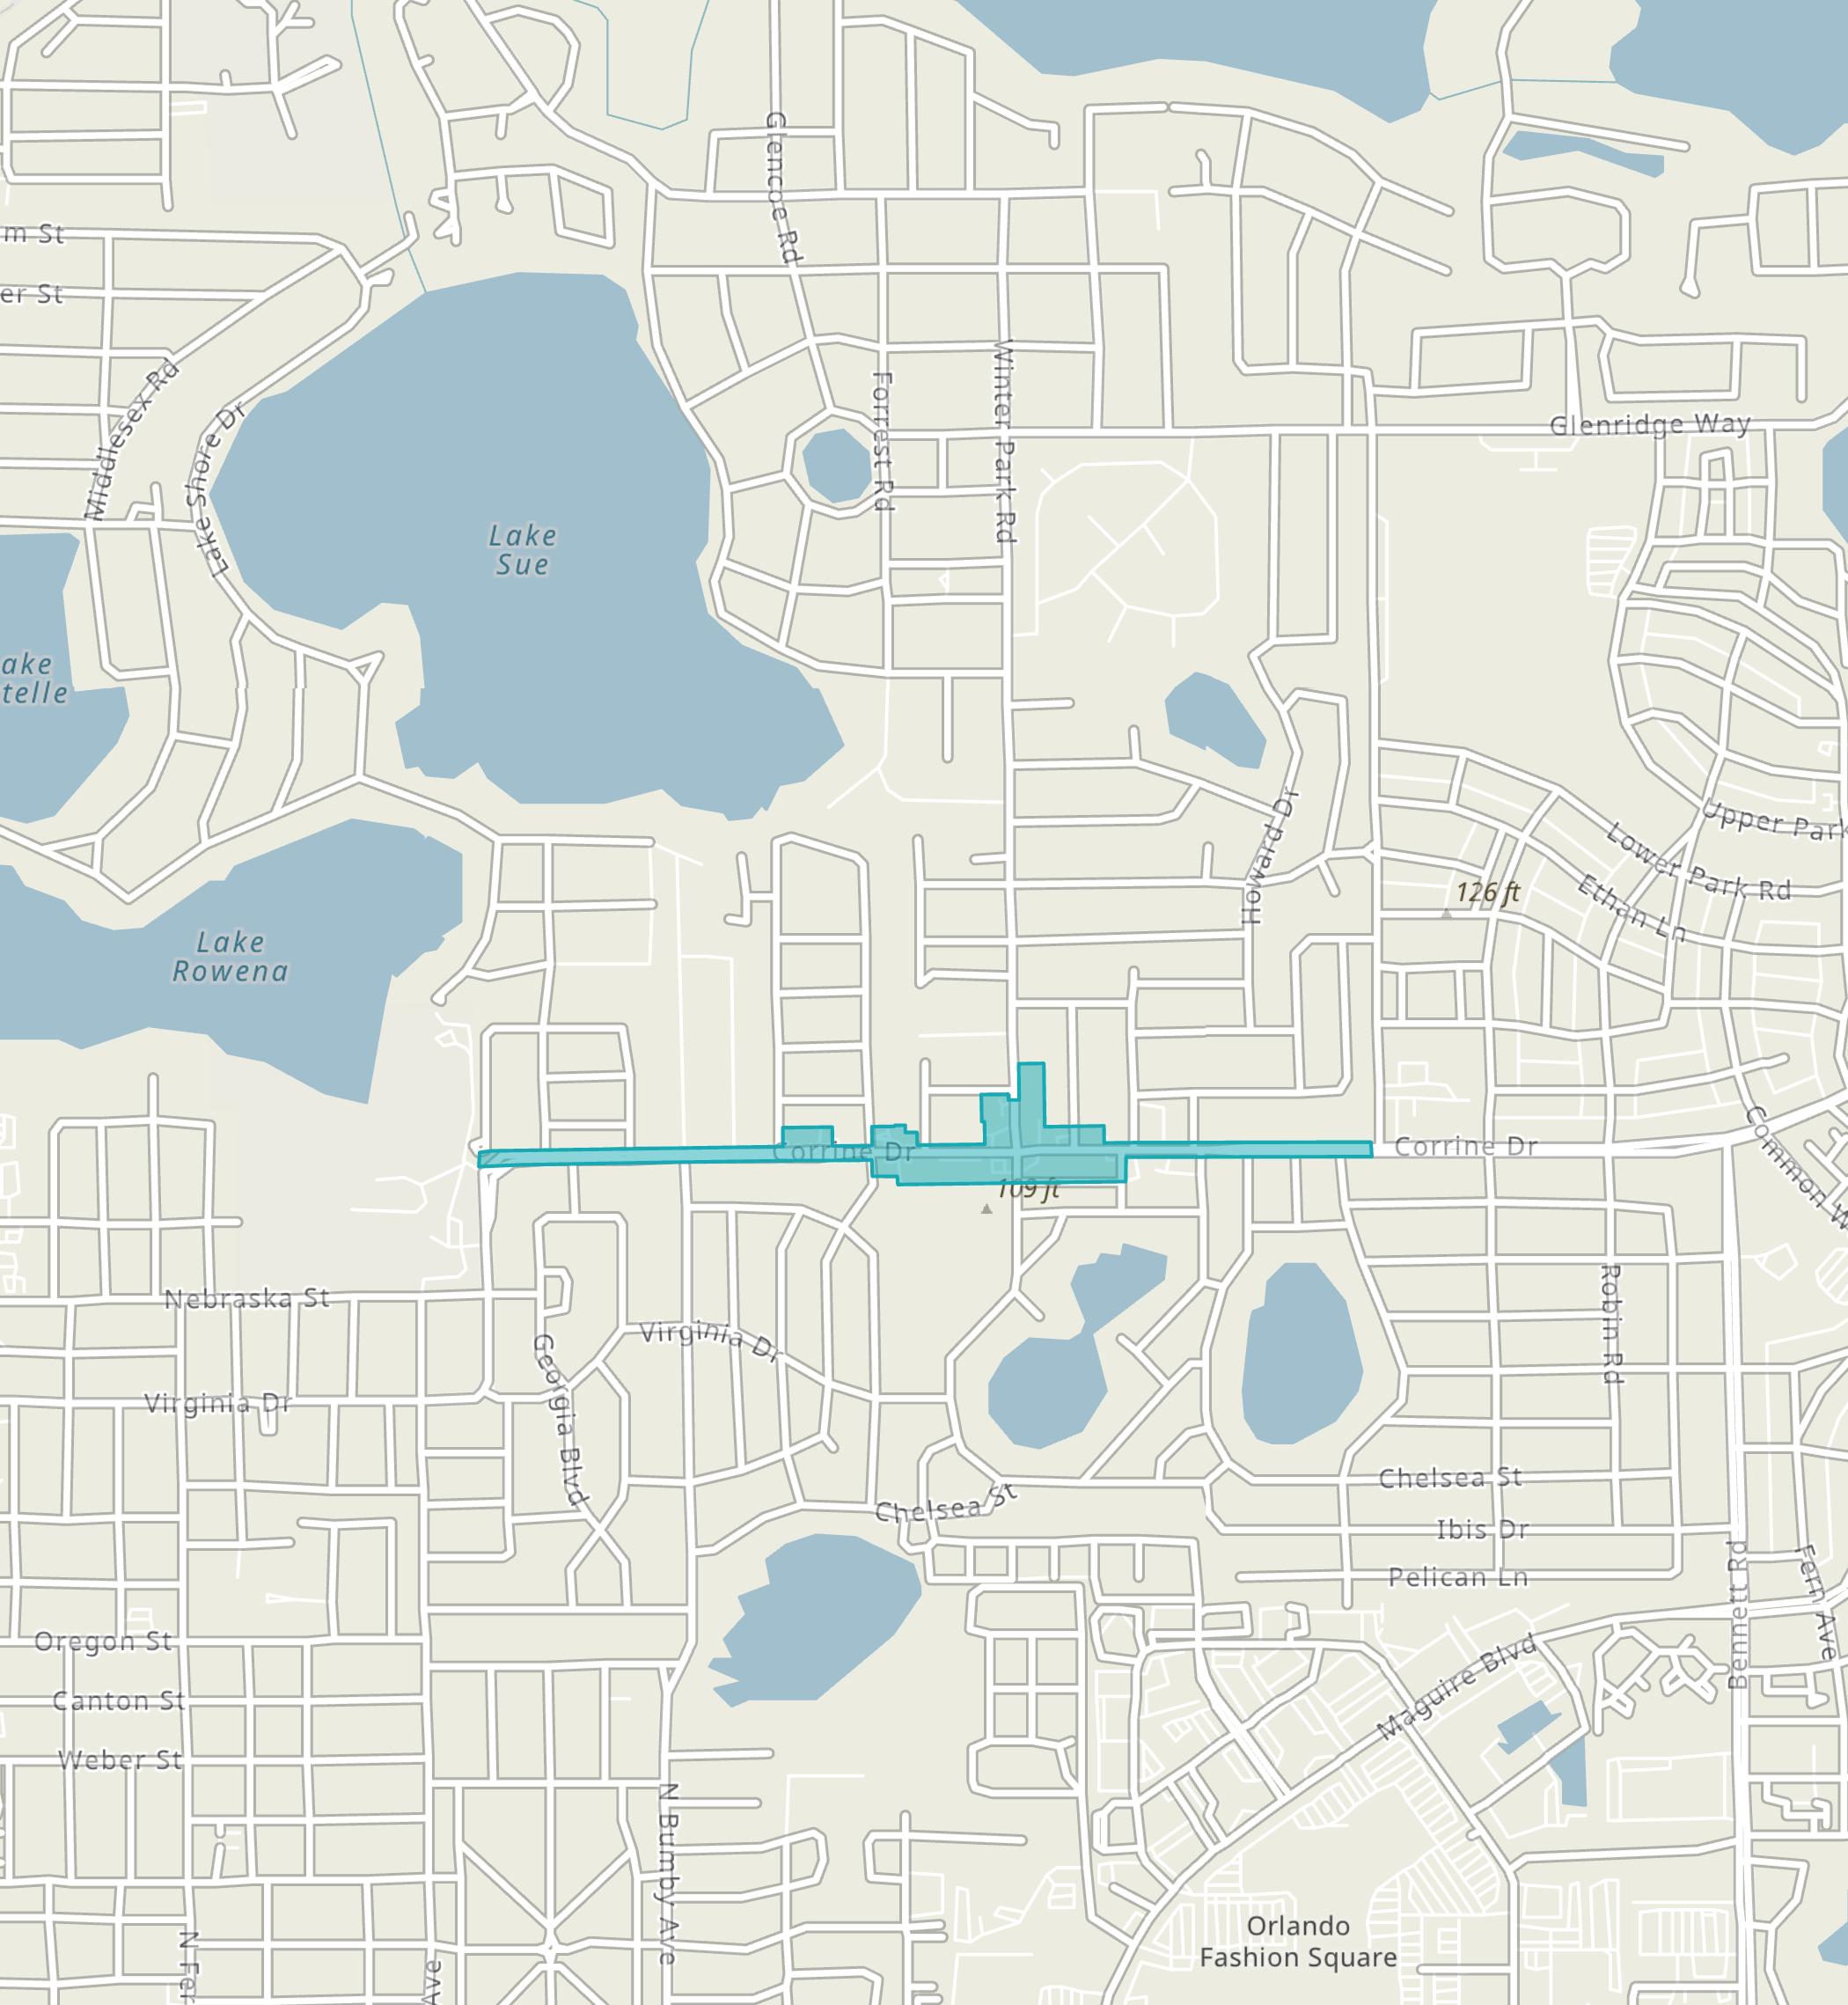
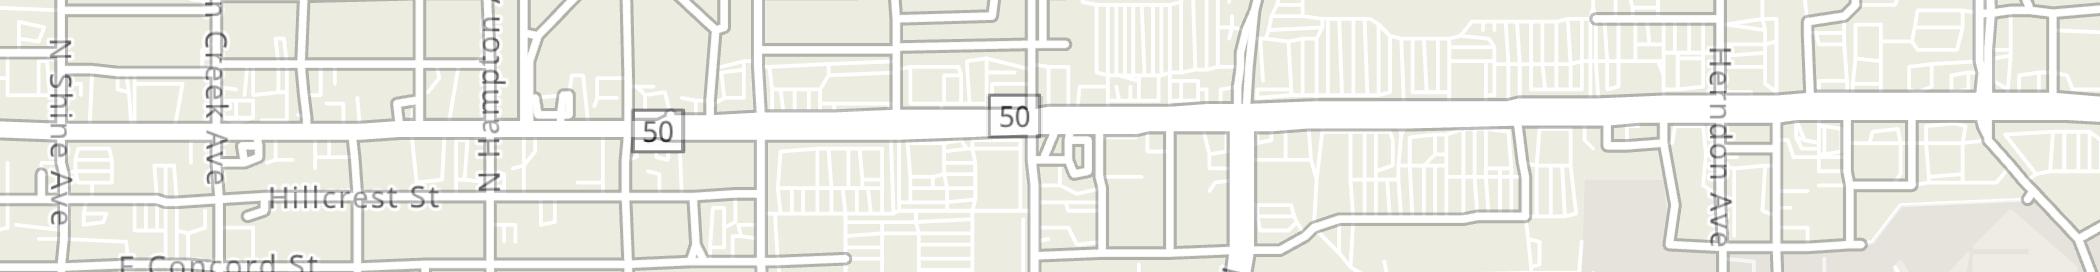
The Audubon Park Garden District (“Audubon Park”), part of the Main Street America program, is an award-winning Eco-District renowned for its unique shopping and dining experiences. Covering roughly 19.2 acres along Corrine Drive, Audubon Park is conveniently located near major thoroughfares like U.S. Highway 17 and State Road 50 (Colonial Drive), as shown on the map on the following page. This vibrant district is celebrated for its eclectic mix of vintage shops, cafes, bakeries, music venues, bookstores, craft beer spots, boutiques, urban farmlettes, and top-notch professional services. Located near Winter Park, Leu Gardens, and downtown Orlando, Audubon Park offers some of the best shopping, dining, services, and activities in Central Florida.
Originally developed in the 1950s and 1960s to serve the nearby Orlando Air Force Base and later the Naval Training Center Orlando, Audubon Park has since blossomed into a lively community filled with distinctive businesses and numerous events. In 2017, Audubon Park was designated a Community Wildlife Habitat by the National Wildlife Federation (“NWF”), becoming the first neighborhood in Central Florida and the 18th in Florida to earn this recognition. This designation reflects the community’s commitment to creating wildlife habitats in yards, schoolyards, business properties, community gardens, and other local spaces. Since 2008, Audubon Park has been instrumental in planting over 1,000 native and Florida-friendly trees, shrubs, ground covers, and perennials within the community.
Focusing on creativity and sustainability, Audubon Park’s mission prioritizes promoting its community, culture, and businesses through local events, cultural celebrations, and neighborhood
improvement projects, with an emphasis on sustainability and the arts. A key part of this mission is collaborating with local agencies to enhance walkability and bikeability along Corrine Drive.
At the heart of Audubon Park is the East End Market, a neighborhood market and food hall that showcases some of Central Florida’s top food entrepreneurs, artisans, and chefs. This two-story building houses a dozen merchants, a private event space, an incubator kitchen, offices, retail shops, a cocktail lounge, and a world-class ramen restaurant. The property is beautifully landscaped with Floridafriendly plants and includes a working market garden. East End Market serves not only as a hub for local food and culture but also as a community space that fosters creativity and collaboration.

Nearby Audubon Park, Leu Gardens and the Historic Leu House Museum can also be found. This 50acre property is filled with diverse plant species and charming artifacts. The gardens feature various themed areas, such as the white garden with snowwhite orchids, the arid garden with cacti, and Mary Jane’s Rose Garden, which boasts 215 varieties and 650 plants. Leu Gardens also showcases magnolias, palms, hibiscus, bananas, bamboo, ferns, azaleas, and fruit trees throughout the property.
Audubon Park’s 2023 Annual Report highlights that Audubon Park Main Street invested over $255,800 into the district, with 50% coming from private investments. The district also created 11 new jobs, and benefited from 563 volunteer hours contributed by residents and business owners.
Audubon Park aspires to be Orlando’s premier destination neighborhood and Eco-District, embodying the community’s creativity, vibrancy, and unwavering commitment to sustainability and diversity. Key priority projects and programs within Audubon Park include:
Eco-District Initiative — Audubon Park became Central Florida’s first Eco-District, obtaining the Community Wildlife Habitat certification in 2017 by the NWF. Since then, numerous sustainability and Eco-friendly projects have been completed, example of these include:
Song Bird Park - In collaboration with GreenUp Orlando and local volunteers, Audubon Park transformed Song Bird Park into an urban bird sanctuary. Completed in 2016, this small pocket park is now hosts a variety of bird species.
Monarch Initiative - In 2018, Monarch Butterfly habitats were planted throughout Audubon Park, in tandem with The HIVE, which sponsored and planted a native plant demonstration garden. These initiatives aimed to raise awareness about the value of nature and promote conservation action. It also included digital campaigns with tailored content on online platforms.

Audubon Park Community Market — To promote community and provide a space for locals to interact with small businesses, every Monday, Audubon Park organizes a community market. Since 2009, the Audubon Park Market has brought together visitors and fellow neighbors to promote the community.
Legend
City of Orlando
Audubon Park
Main Street District
Orlando Main Streets
As of year-end 2023, Audubon Park’s total employees compose approximately 0.1% of the total employment within the City. Audubon Park employment sector is primarily dominated by the health care and social assistance, professional services, and accommodation and food service industries, as illustrated in the table below.
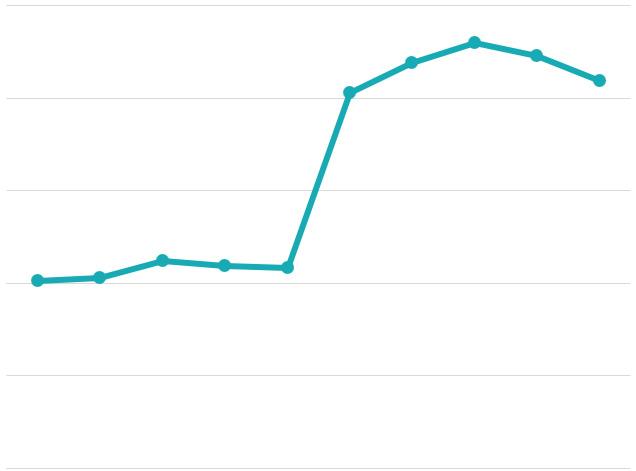
Over the 10-year period, from 2014 to 2023, Audubon Park’s total employment has experienced a compound annual growth rate (“CAGR”) of 3.6%. This growth rate is slightly higher than the City’s 2.3% CAGR during the same period. The figure above illustrates Audubon Park’s total annual employment trends from 2014 through 2023.
In addition, Audubon Park’s total employment increased from 251 employees in 2014 to 359 employees in 2023—resulting in a net increase of 108 total employees. During this same time frame, Audubon Park has captured approximately 0.1% of the City’s total growth in employment.
A location quotient (“LQ”) is an analytical statistic that measures how concentrated a particular industry is within an area. The above figure illustrates the concentration of employment by industry sector within Audubon Park, as compared to the concentration within the City for year-end 2023. Audubon Park has a higher concentration of industry professionals (LQ greater than 1.0) in the construction, management of companies, health care and social assistance, arts, entertainment, and recreation, and other services (excluding public administration) industries.
As of year-end 2023, the Audubon Park area has no residents, making consumer spending data unavailable.
As of year-end 2023, Audubon Park’s commercial real estate market composed nearly 118,564 square feet (“sq. ft.”) of office and retail space, as illustrated in the market characteristics table below. To note, Audubon Park does not contain any industrial/flex space, hotel rooms, or multi-family residential units.
Retail and office space composed 88% and 12%, respectively, of Audubon Park’s commercial inventory as of year-end 2023. Specifically, the office space within Audubon Park consisted of zero Class A space, 17% Class B space, and 83% Class C space. Additionally, retail properties had a slightly lower occupancy rate compared to office properties which were fully occupied as of year-end 2023. In addition, Audubon Park’s average rental rates for both office and retail markets were greater than those for the City as of year-end 2023.
Leasing activity refers to the volume of square footage that is committed to and actually signed in a given period of time, including direct leases, subleases and renewals of existing leases. In contrast, gross absorption measures the total sq. ft. occupied within existing buildings over a given period, without accounting for vacated space. As of year-end 2023, there was zero leasing activity, gross absorption, or new development construction within Audubon Park’s commercial real estate market.
The subsequent figures illustrate the year-over-year snapshots and five-year annual trends for Audubon Park’s commercial real estate market.
It is important to note, as of year-end 2023, the Audubon Park area has no residential units, making for-sale residential data unavailable.
Office space remained unchanged from the prior year, at 14,794 sq. ft.
Vacancy rates for office properties remained unchanged from the prior year, at 0.0%.
Average rental rates per sq. ft. increased 5.0%, from $29.39 to $30.86.
Retail space remained unchanged from the prior year, at 103,770 sq. ft.
Vacancy rates for retail properties increased 1 percentage point from the prior year to 1.2% vacancy.
Average rental rates per sq. ft. decreased 1.1%, from $30.35 to $30.00.
Over the past five years, 2019 to 2023, total inventory of Audubon Park’s commercial space remained unchanged.
Vacancy rates in Audubon Park’s retail market decreased 5 percentage points, while the office market remained unchanged. A decline in vacancy rates may be attributed to an increase in healthy spending behaviors, as well as an increase in demand for rentable spaces within the district.
From 2019 to 2023, Audubon Park’s average rental rates per sq. ft. increased by 30% for office space and 1.9% for retail space, which may be attributed to rising operating and fixed costs to upkeep a property.
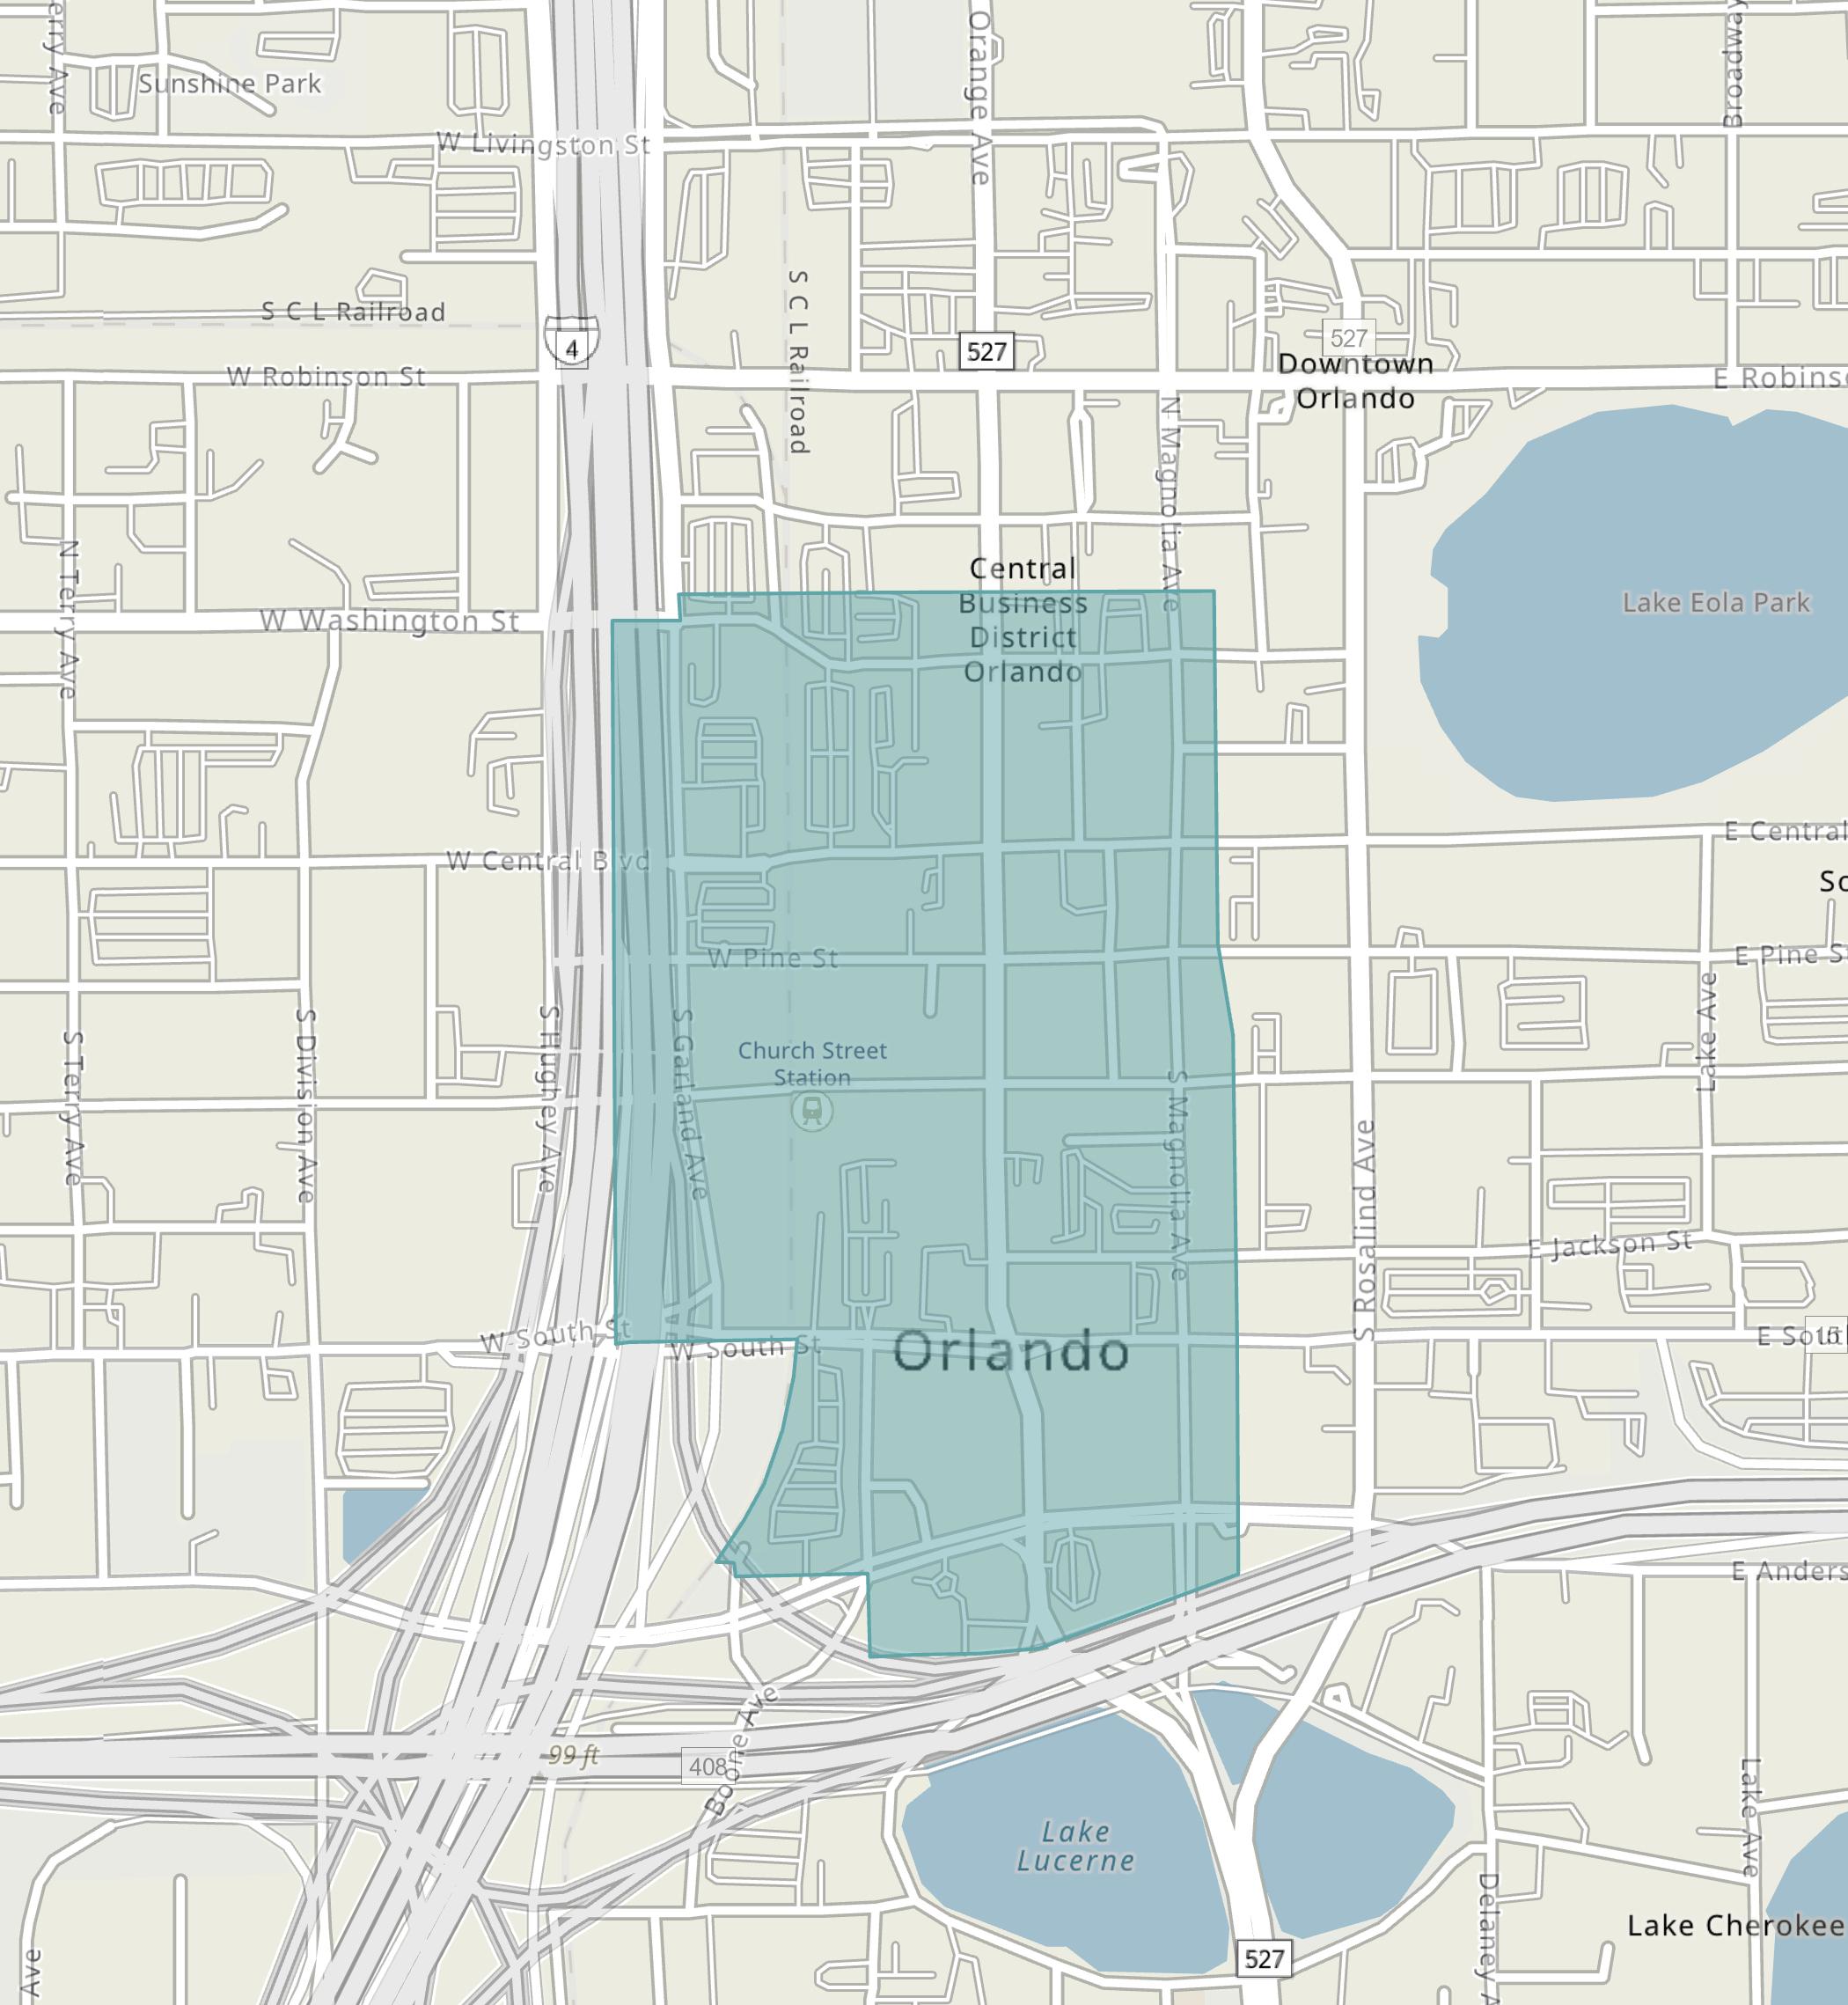
The City District Main Street (“City District”), part of the Main Street America program, is a hub of diversity and authenticity. Formerly known as the Church Street District, the City District spans approximately 102 acres in Downtown Orlando, encompassing Downtown’s historic Central Business Art and Entertainment Districts. It is situated near major thoroughfares, including Interstate-4 and State Road 408, as depicted in the map on the following page.
Established during the Great Recession through a collaborative effort among business owners, the City District was created to strengthen economic development in downtown Orlando. With ongoing support from local merchants, the City District has continued to grow.
The City District serves as a policy influencer and a catalyst for business and community enhancement, ensuring economic stability through event programming, design, marketing, and promotion. Its strategic programs and initiatives aim to transform downtown Orlando into a dynamic hub that blends history, culture, and events. Since its inception, the City District has welcomed over 300 new businesses and, in 2023, invested over $100,000 into programming within downtown Orlando.
Focusing on local business and urban living, the City District positions itself at the crossroads of business, nightlife, dining, arts, and entertainment, where the rhythm of the workday transitions into the vibrant beat of nightlife. Both visitors and residents can enjoy street cafes, immerse themselves in the arts, and explore Downtown Orlando’s walkable green spaces while visiting nearby shops. The district’s primary goal is to shape the heart of Orlando into
a place that captures the essence of its past while building a promising future. This commitment to preserving its heritage is evident in the upkeep and continued use of many historic buildings, including the First National Bank, the Tinker Building, the Beacham Theater, the Angebilt, and the Metcalf Building.
At the heart of Downtown Orlando, the First National Bank Building at 190 South Orange Avenue/1 West Church Street stands as a testament to the city’s history and architectural elegance. Nestled among towering structures like the former SunTrust Center and the Truist Building, it remains a focal point of these Orlando landmarks.
While sports in Downtown Orlando are often associated with major teams like the Orlando Magic and the Orlando City Soccer Club, and their impressive venues like the KIA Center and Inter&Co Stadium, the Tinker Building at 16-18 West Pine Street holds its own legendary status in the city’s sports history.
The Beacham Theater, constructed in 1921 by Braxton Beacham Sr., is another iconic venue in Orlando. Initially hosting vaudeville stars in the 1920s, it has since evolved into a thriving nightclub and live music destination, featuring artists like B.B. King, Ray Charles, and The Police, and reflecting a rich tapestry of history and cultural significance. The Angebilt Hotel at 37 North Orange Ave, now home to The Bellhop and Parlay on the ground floor with offices above, has a dramatic history marked by financial challenges, natural disasters, and celebrity visits, contributing to its century-long presence in Downtown Orlando.

Finally, the Metcalf Building, located at the southwest corner of Orange Ave and Pine St., was constructed in 1923 as one of Downtown Orlando’s first high-rise buildings. Purchased by real estate investor Henry W. Metcalf in 1930, the building’s historical significance continues today, serving as home to various offices and businesses.
The City District’s 2023 Annual Report highlights that the City District Main Street invested nearly $27.2 million into the district, with 0.5% coming from private investments. The district also welcomed 110 new businesses, created 403 jobs, and benefited from 1,105 volunteer hours contributed by residents and business owners.

The City District strives to activate streets, attract, assist and promote local businesses, nurture nightlife, dining, arts and culture, and preserve its history. Key priority projects and programs within the City District include:

City District Traffic Art Program — community-driven initiative strives to promote local art and enhance the urban environment. Local artists are invited to submit proposals for transforming traffic signal boxes into vibrant pieces of art which are displayed throughout the area. This program not only beautifies public space but also fosters community pride and support for local culture.
Third Thursday Orlando — Partnering with CityArts, the Downtown Arts District, the History Center, and local businesses, this monthly event features art, music, markets, history, food, and entertainment—offering a diverse cultural experience. Enjoy a free art gallery, live music, complimentary admission to the history center, and various food and drink specials from local vendors.
Business of the Month — This Award celebrates outstanding Downtown Orlando businesses for their significant contribution and positive impacts on the community.
New Programs Coming Soon — Additional programs coming soon to the City District include a Retail Incubator, revitalizing downtown retail by offering small businesses space and essential education; and Window Wraps, a collaboration between property owners and local artists to bring life to vacant building windows through vibrant vinyl wraps.
City of Orlando
City District
Main Street
Orlando Main Streets
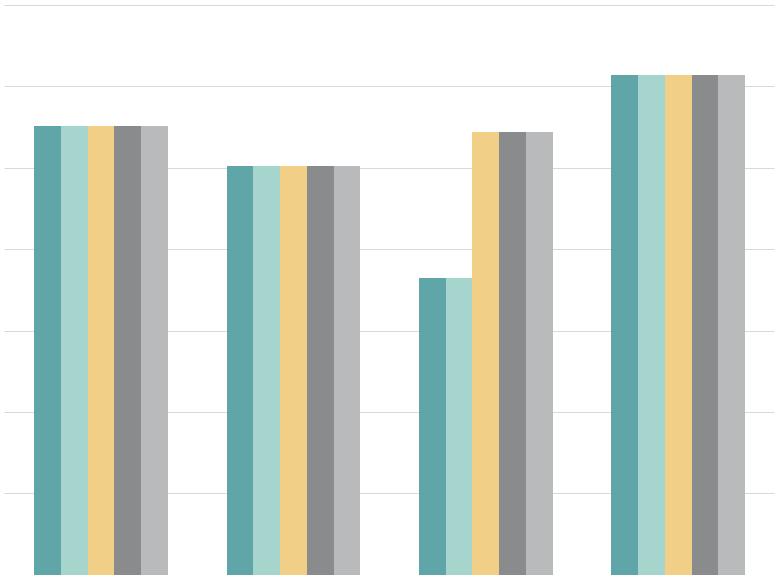
As of year-end 2023, the City District’s total employees compose approximately 6.0% of the total employment within the City. The City District’s employment sector is primarily dominated by professional services, public administration, and real estate and leasing industries, as illustrated in the table below.
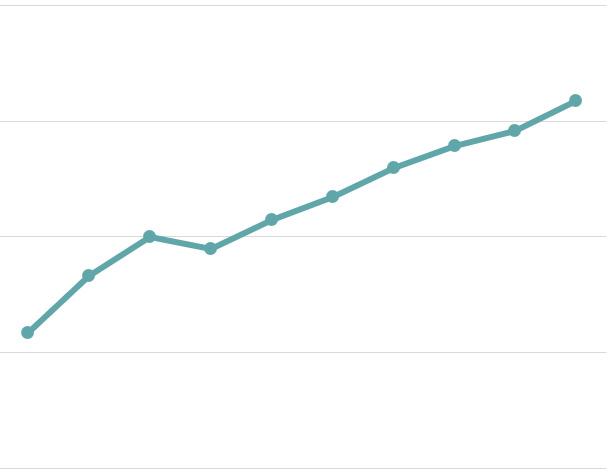
Over the 10-year period, from 2014 to 2023, the City District’s total employment has experienced a compound annual growth rate (“CAGR”) of 4.5%. This growth rate is slightly higher than the City’s 2.3% CAGR during the same period. The figure above illustrates the City District’s total annual employment trends from 2014 through 2023.
In addition, the City District’s total employment increased from 14,657 employees in 2014 to 22,694 employees in 2023—resulting in a net increase of 8,037 total employees. During this same time frame, the City District has captured approximately 11% of the City’s total growth in employment.
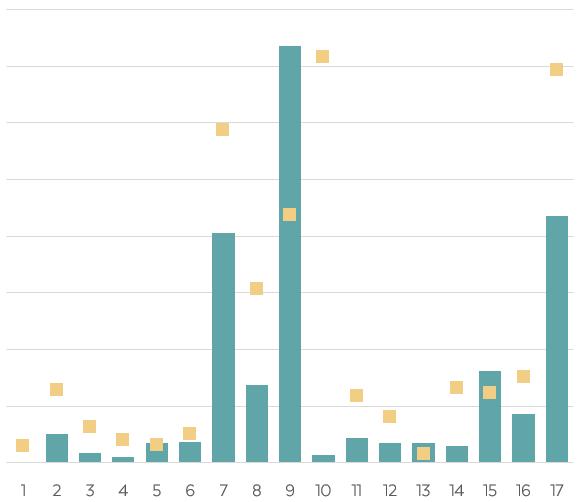
A location quotient (“LQ”) is an analytical statistic that measures how concentrated a particular industry is within an area. The above figure illustrates the concentration of employment by industry sector within the City District, as compared to the concentration within the City for year-end 2023. The City District has a higher concentration of industry professionals (LQ greater than 1.0) in the management of companies, public administration, information and finance, professional services, and real estate and leasing industries.
As of year-end 2023, residents of the City District spent an estimated $63.3 million, with 34% allocated to housing, 29% to retail goods, 12% to food (both away from home and at home), 6.9% to health care, and 3.9% to entertainment and recreation. This spending pattern highlights the dominance of housing and retail, which together account for 64% of total expenditures. Additionally, food and health care make up 18.8% of the consumer spending budget, while entertainment and recreation represents the smallest portion of consumer spending. Within the broader context, total expenditures within the City District make up approximately 0.6% of the consumer spending within the City, with over $11.421 billion in total expenditures as of year-end 2023.
As of year-end 2023, the City District’s forsale residential market included 305 residential condominium (“condo”) units. To note, there are zero single-family homes located within the City District as of year-end 2023. The City District’s residential condo units represent 1.1% of the total residential condos within the City.
The City District encompasses one residential condo property, the Solaire at the Plaza. Total inventory of residential condo units within the City District has remained unchanged over the past five years, 2019 through 2023. As of year-end 2023, the average assessed value per unit was $238,780 and the taxable value per unit was $217,430 for all residential condo units within the City District.
In addition, the City District experienced a total of 27 residential condo unit sales in 2023; representing 1.8% of the total residential condo unit sales within the City, as illustrated in the following table.
RESIDENTIAL SALES ACTIVITY
By the end of 2023, the total sales price for residential condo units exceeded $9.9 million. Furthermore, the average sales price per sq. ft. for residential condo units in the City District, at $361.03 per sq. ft., was significantly higher than the City average, at $222.78 per sq. ft., during the same period.
As of year-end 2023, the City District’s commercial real estate market composed about 6.0 million square feet (“sq. ft.”) of office and retail space, in addition to 545 hotel rooms, and 614 for-rent market-rate multi-family residential units, as illustrated in the market characteristics table below.
To note, the City District does not contain any industrial/flex space as of year-end 2023.
Office space composed the majority of the City District’s office and retail inventory at 91% of the total share, followed by retail space with 9% of the total, as of year-end 2023. Specifically, the office space within the City District consisted of 75% Class A space, 19% Class B space, and the remaining portion as Class C space.
Office properties within the City District had a slightly higher occupancy rate compared to that of retail properties as of year-end 2023. Moreover, occupancy rates for both the City District’s hotel and for-rent multi-family markets were approximately 69% and 93%, respectively. In addition, average rental rates for retail properties were slightly higher than those for office properties within the City District as of year-end 2023. In addition, the City District’s average rental rates for its commercial real estate markets were greater than those for the City as of year-end 2023.
There were 64 lease transactions that occurred in the City District’s office and retail markets— resulting in a total of 254,192 sq. ft. leased during 2023. Leasing activity refers to the volume of square footage that is committed to and actually signed in a given period of time, including direct leases, subleases and renewals of existing leases.
Gross absorption measures the total sq. ft. occupied within existing buildings over a given period, without accounting for vacated space. As of year-end 2023, total gross absorption of office and retail space within the City District was approximately 404,330 sq. ft., with office space composing the majority of commercial gross absorption within the City District at 92%. In addition, the City District’s for-rent multifamily residential market experienced a negative absorption of 3 units during this same time frame.
The following pages illustrate major development activities, year-over-year snapshots, and five-year annual trends for the City District’s commercial real estate market.
Office space remained unchanged from the prior year at 5.52 million sq. ft.
Vacancy rates for office properties decreased 3 percentage points, from 11.5% to 8.7%.
Average rental rates per sq. ft. increased 4.6%, from $27.55 to $28.81.
Leasing activity of office space decreased 39%
Over the past five years, 2019 through 2023, the City District saw the addition of 180 hotel rooms and 449,676 sq. ft. of office space within one building, the Truist Plaza at Church Street Station, which was completed in 2019— featuring the AC Hotel Orlando Downtown, which opened in 2021.
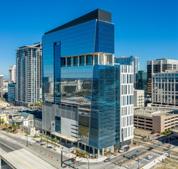
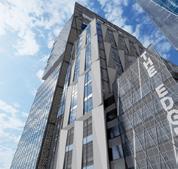
Within the City District, there is zero sq. ft. of commercial inventory under-construction as of year-to-date 2024, through August 2024. However, during this same time frame, there is one proposed development project within the City District, the Edge at Church Street Station, which will feature approximately 198,000 sq. ft. of office space and 240 multi-family rental units. Major development activity throughout the past five-year period and proposed development activity is illustrated in the graphic below.
Retail space remained unchanged from the prior year at 502,240 sq. ft.
Vacancy rates for retail properties decreased 4 percentage points, from 20% to 16%.
Average rental rates per sq. ft. increased 17%, from $26.87 to $31.38.
Leasing activity of retail space decreased 2%
There is zero industrial/ flex space located within the City District as of year-end 2023, therefore performance data is not available for this property use.
Hotel inventory remained unchanged from the prior year, at 545 rooms.
Vacancy rates for hotel properties decreased 0.4 percentage points from 31.4% to 31.0%.
Average daily rate (“ADR”) for hotel rooms decreased 3.0%, from $178.66 to $173.25.
Over the past five years, 2019 through 2023, the City District’s commercial space (i.e., office and retail space) did not experience any increase in inventory.
During this same time frame, total hotel rooms increased by 180 rooms, and multi-family inventory also remained unchanged within the City District.
Comparatively, the new hotel inventory in the City District over the past five years accounted for 5.5% of the new hotel rooms within the City.
Vacancy rates in the City District saw significant increases over the past five years of 2 percentage points in the office market, 14 percentage points in the retail market, 9 percentage points in the hotel market, and 2 percentage points in the rental multi-family market. Rising vacancy rates are likely due to a shortage of desirable rental spaces and high rental costs exceeding what the local market can afford. However, notable increases from 2020-2022 may also be a result of the COVID-19 pandemic.
For-rent multi-family units remained unchanged from the prior year at 614 units. Vacancy rates increased 0.5 percentage points for multi-family properties, from 6.5% to 7.0%.
Average rental rates per unit increased 2.1%, from $1,793 to $1,831.
Over the past five years, 2019 through 2023, the City District’s average rental rates per sq. ft. experienced increases of 6.7% for office and 87% for retail. During this same time frame, average daily rates for hotel rooms increased 3.9% and average rental rates per unit for multi-family increased 4.6%. Increases in average rental rates may be attributed to rising operating and fixed costs, as well as properties in desirable locations or with premium amenities that can command higher rents.
The College Park Main Street (“College Park”), part of the Main Street America program, is a vibrant neighborhood located just outside of downtown Orlando, offering the charm of small-town living within an urban environment. Spanning about 96 acres along Edgewater Drive, College Park is situated between major thoroughfares, including Interstate 4 to the east, State Road 50 to the south, and U.S. Highway 441 to the west, as shown on the map on the following page.
College Park is home to some of Central Florida’s finest local retailers, award-winning restaurants, and small businesses. The area offers a lively lifestyle with a range of services, charming bungalow-style homes, brick-lined streets, and numerous parks and lakes, making it an inviting and comfortable place for residents to call home.
College Park features a vibrant main street, Edgewater Drive, lined with shops, restaurants, unique art displays, and hosts community events. The neighborhood, known for its distinctive 1900s bungalow homes, is surrounded by lakes and parks that reflect the community’s rich history. This pride is evident in the annual events, which showcase the vibrancy and shared values of College Park.
With a focus on quality of life, College Park envisions a thriving community anchored by a robust business district. As one of the 12 Orlando Main Street Programs, College Park is dedicated to maintaining the area’s economic integrity while fostering a strong sense of community. To achieve this vision, the district aims to revitalize and promote the business area, preserving its unique character and nurturing a vibrant local community.
Directly adjacent the College Park Main Street is the Dubsdread Golf Course. In 1925, Carl Dann, the owner of the largest real estate management business in the area, decided to build a golf course after a falling out with the Country Club of Orlando in 1923. Dubsdread Golf Course quickly became a popular spot for the rich and famous, attracting both professional and amateur golfers, as well as gamblers. During World War II, it served as a social club for officers from the Orlando Army Air Force Base. The Dann family owned Dubsdread until the City of Orlando purchased it in 1978. Today, it remains a thriving golf course.
Edgewater High School, located along College Park Main Street, is a cornerstone of the community. Known for its strong academic programs and vibrant extracurricular activities, the school plays a significant role in shaping the lives of local students.
Other historical sites along College Park Main Street include the John Young Home at 815 W. Princeton Street, the childhood home of astronaut John Young, the first American to travel to space six times. This home is recognized as a Florida Heritage Site with a historical marker dedicated in 1999. Additionally, the Kerouac House at 1418 Clouser Ave, where author Jack Kerouac lived during some of his most creative years, has operated as a non-profit since 2000, hosting writers for three-month residencies to complete their projects.
College Park’s 2023 Annual Report highlights that the College Park Main Street invested over $1.6 million into the district, with 17% coming from private investments. The district also welcomed 12 new businesses, created 61 jobs, and benefited from 1,249 volunteer hours contributed by residents and businesses.
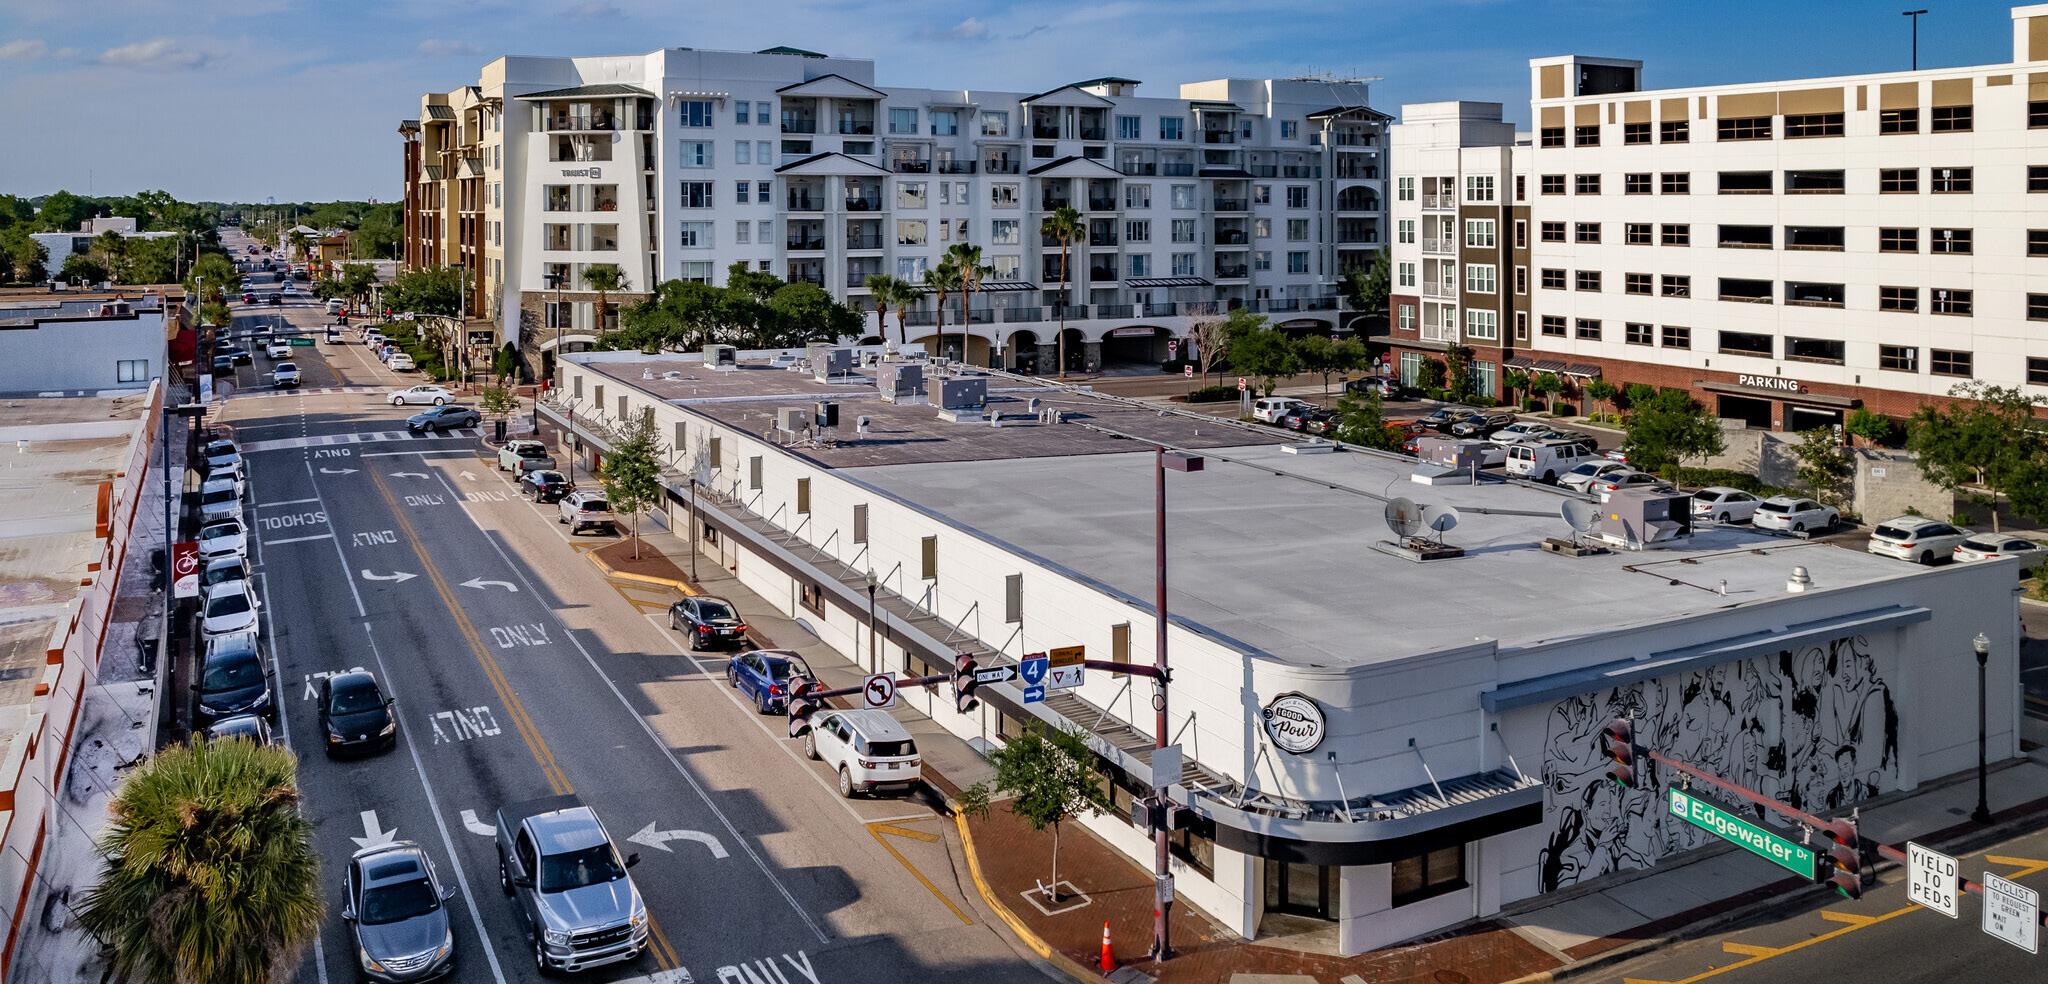
Legend City of Orlando College Park Main Street
Orlando Main Streets
College Park aims to enhance the vitality of its thriving business community that is engaged in creating a great quality of life for all of its residents for both work and play. Key priority projects and programs within College Park include:
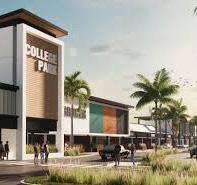
Façade Improvement Grants — These Façade Grants, offered to qualifying businesses, help cover façade rehabilitation, stucco restoration, exterior painting, new doors and windows, historically appropriate building features, signs, awnings, and exterior lighting. This support helps improve the community’s aesthetic and economic vitality.
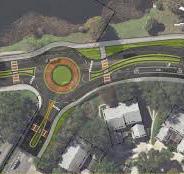
Edgewater Drive Complete Street Project — This project aims to redesigning Edgewater Drive from Lakeview Street to Par Street, by enhancing safety for pedestrians, drivers, cyclists, and scooter riders, with features like a proposed roundabout at Lakeview Street. The plan includes ADA-compliant sidewalks, improved accessibility to local shops and eateries, wider sidewalks, new decorative lighting, streetscape elements, and Floridafriendly landscaping.

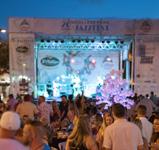
College Park Cleanup — Hosted by the College Park Design Committee, the cleanup is held twice annually to help cleanup and improve the Edgewater Drive streetscape.
College Park JazzFest — One of College Park’s most beloved traditions, College Park JazzFest, the annual flagship event of College Park Main Street, is still going strong. Established in 2002, College Park JazzFest features 3 stages with 12 live bands performing jazz, R&B, rock, and more.
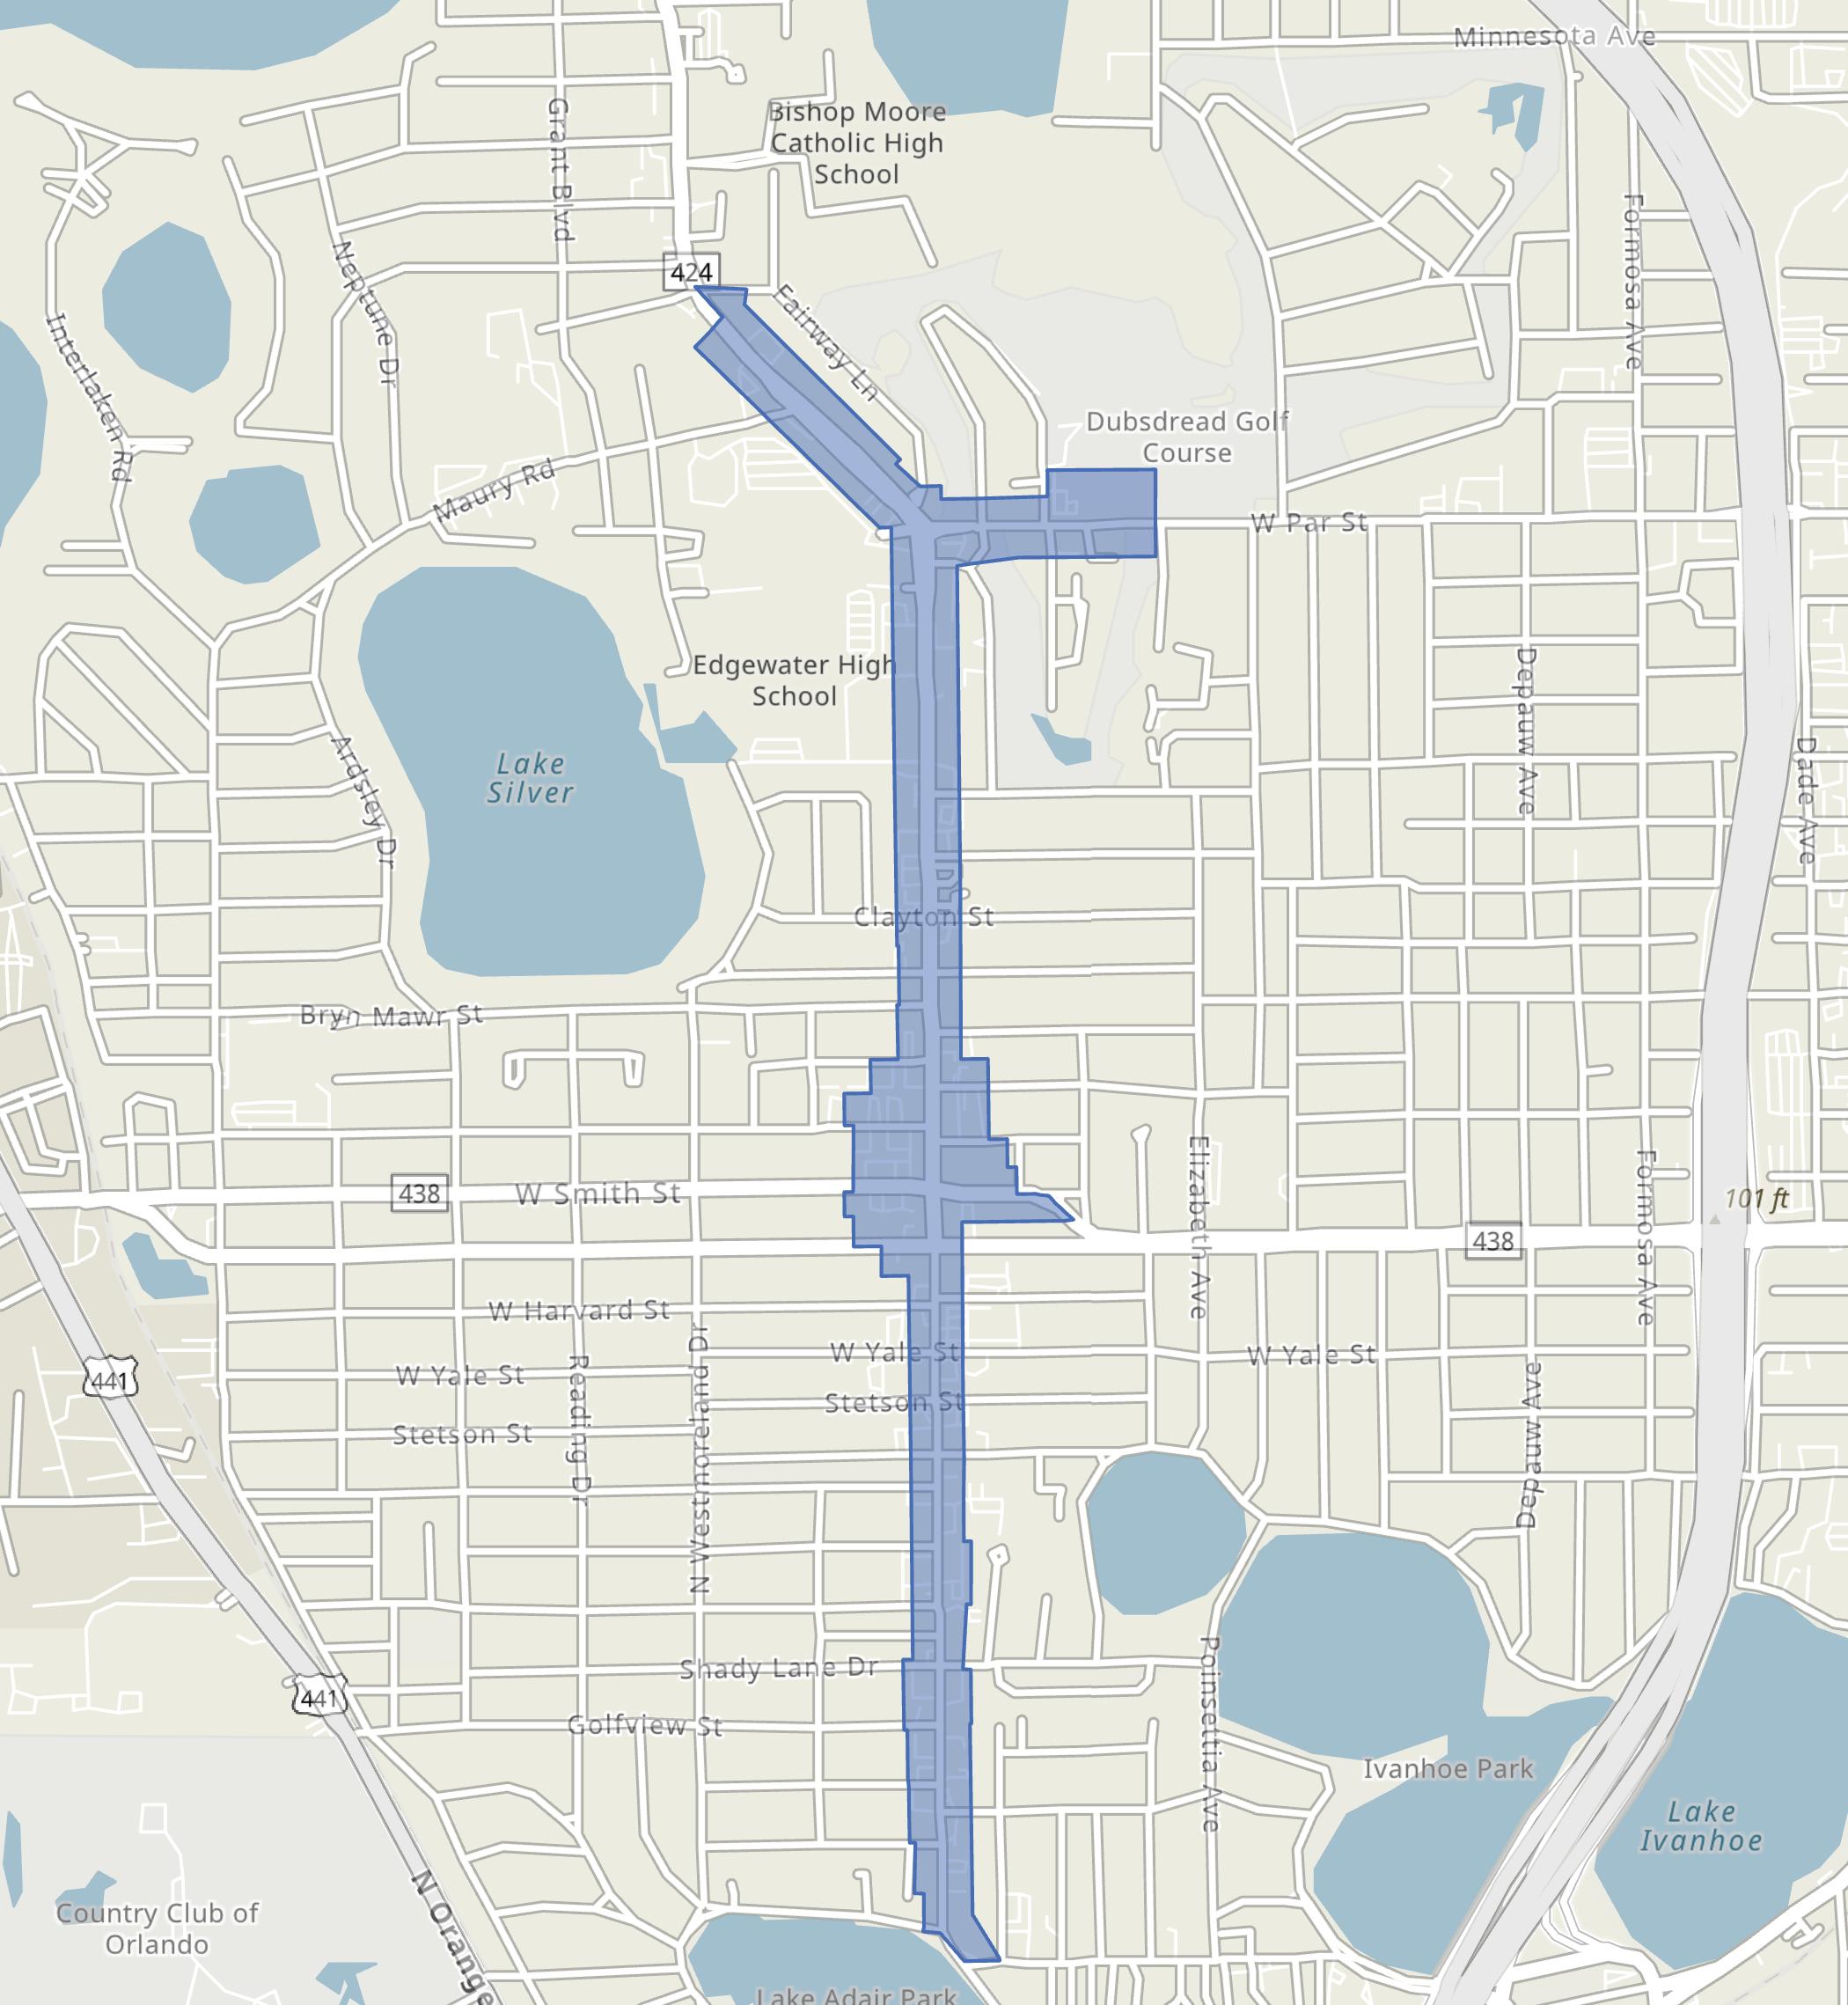
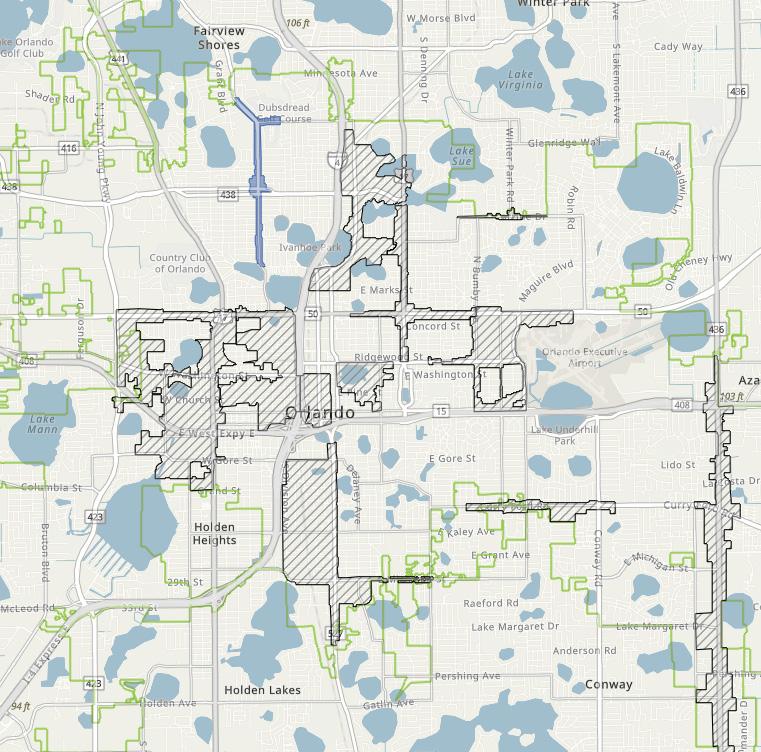
As of year-end 2023, College Park’s total employees compose approximately 0.2% of the total employment within the City. College Park’s employment sector is primarily dominated by the retail trade, professional services, and accommodation and food services industries, as illustrated in the table below.
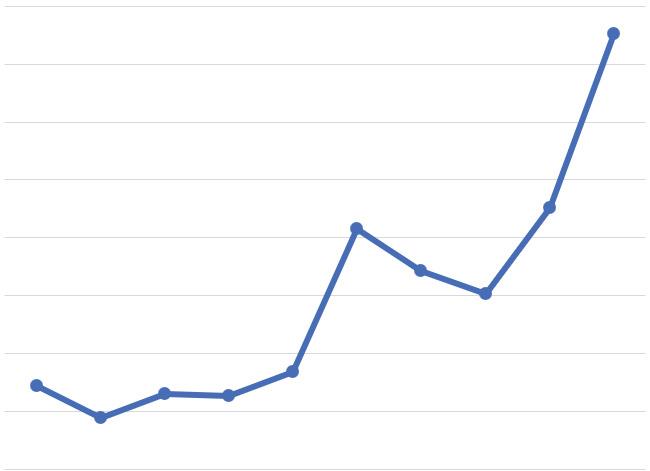
Over the 10-year period, from 2014 to 2023, College Park’s total employment has experienced a compound annual growth rate (“CAGR”) of 7.8%. This growth rate is slightly higher than the City’s 2.3% CAGR during the same period. The figure above illustrates College Park’s total annual employment trends from 2014 through 2023.
In addition, College Park’s total employment increased from 272 employees in 2014 to 576 employees in 2023—resulting in a net increase of 304 total employees. During this same time frame, College Park has captured approximately 0.4% of the City’s total growth in employment.
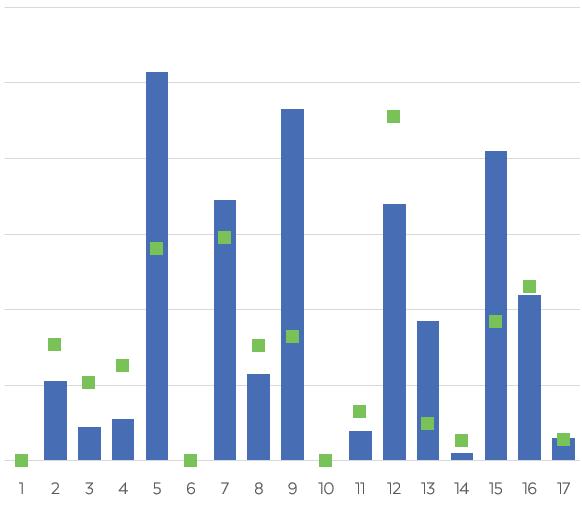
A location quotient (“LQ”) is an analytical statistic that measures how concentrated a particular industry is within an area. The above figure illustrates the concentration of employment by industry sector within College Park, as compared to the concentration within City for year-end 2023. College Park has a higher concentration of industry professionals (LQ greater than 1.0) in the education services, information and finance, retail trade, other services (excluding public administration), accommodation and food services, and professional services industries. College Park and the City are equally specialized (LQ equals 1.0) within the construction and real estate and leasing industries.
As of year-end 2023, residents of College Park spent an estimated $26.4 million, with 33% allocated to housing, 31% to retail goods, 11% to food (both away from home and at home), 7.7% to health care, and 4.1% to entertainment and recreation. This spending pattern highlights the dominance of housing and retail, which together account for 64% of total expenditures. Additionally, food and health care make up 19.1% of the budget, while entertainment and recreation represents the smallest portion of consumer spending. Within the broader context, total expenditures within College Park make up approximately 0.2% of the consumer spending within the City, with over $11.421 billion in total expenditures as of year-end 2023.
As of year-end 2023, College Park’s for-sale residential market included approximately 185 residential units. Residential condominiums (“condo”) made up the majority, at 92%, while single-family homes accounted for only 8% of the total. College Park’s residential units represent 0.03% of the total single-family residential units and 0.6% of the total residential condos within the City. College Park encompasses two residential condo properties, including Wellesley Condominium and Oaks at Dubsdread Condominium. Total inventory of single-family and residential condo units within College Park have remained unchanged over the past five years, 2019 through 2023.
As of year-end 2023, the average single-family residential assessed value per unit at $376,380 and taxable value per unit at $329,820 were both greater than those of residential condo units—with an assessed value per unit of $292,310 and a taxable value per unit of $256,080.
In addition, College Park experienced a total of 10 residential condo unit sales in 2023. College Park’s residential condo unit sales represent 0.7% of the total residential condo unit sales within the City, as illustrated in the following table.
By the end of 2023, the total sales price for residential condo units was about $3.7 million. Additionally, the average sales price per sq. ft. for residential condo unit sales in College Park, at $341.04 per sq. ft., was significantly higher than the City, at $222.78 per sq. ft.
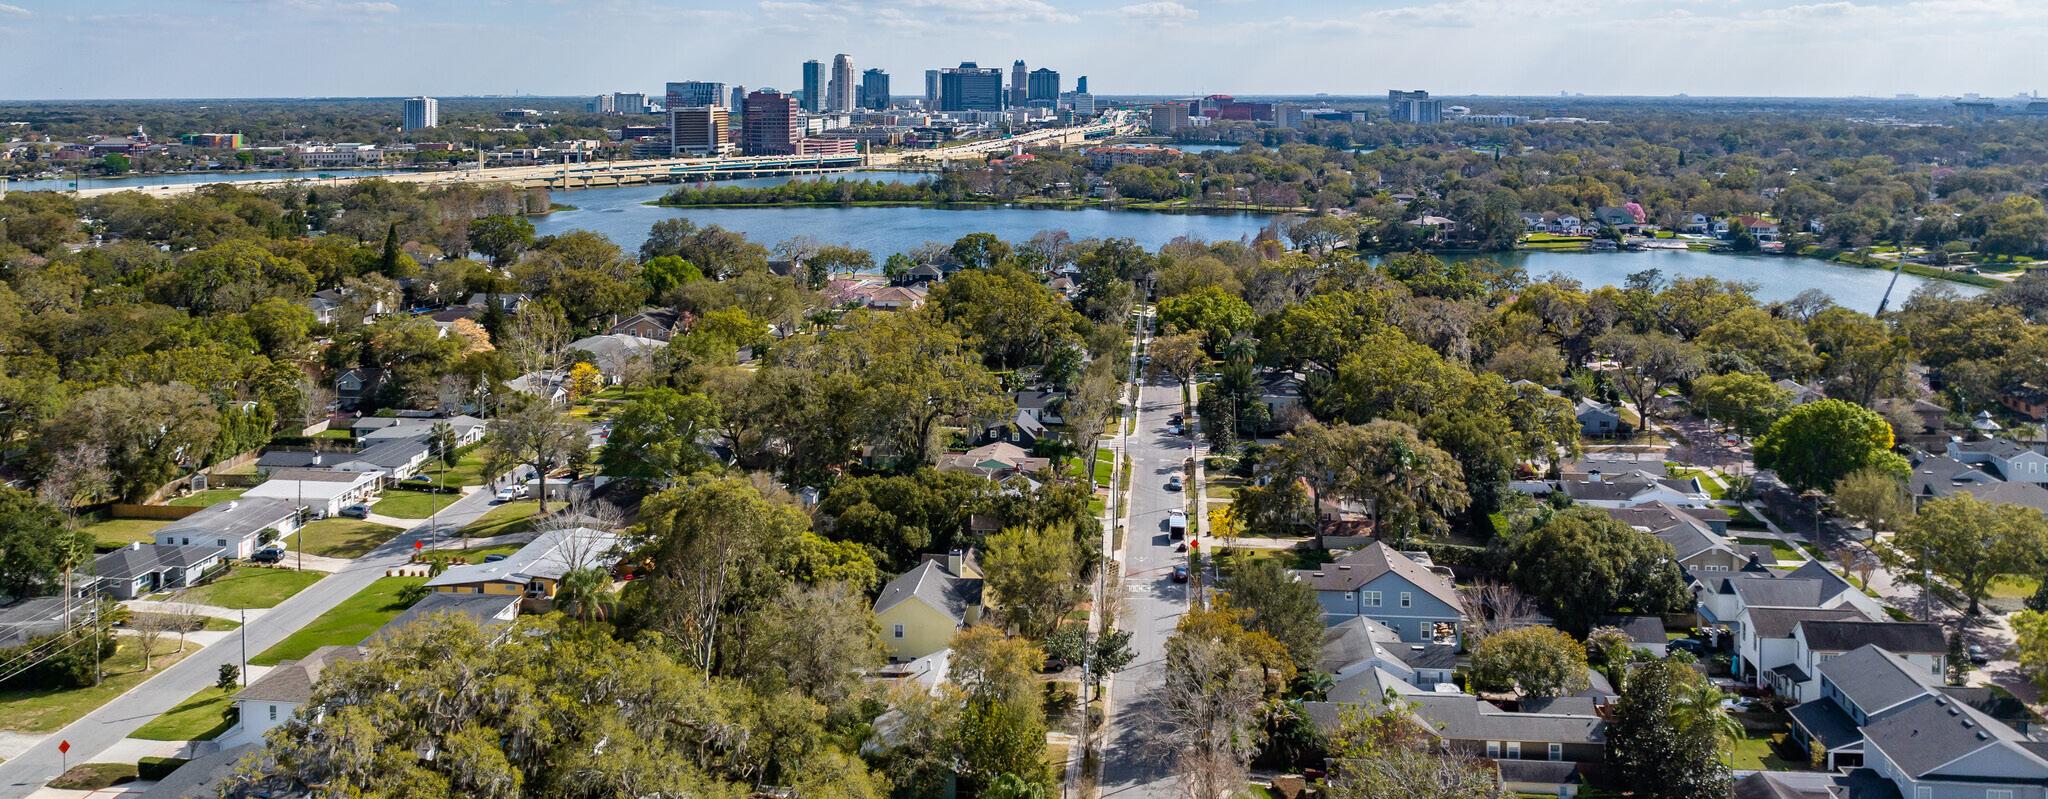
As of year-end 2023, College Park’s commercial real estate market composed nearly 621,024 square feet (“sq. ft.”) of office, retail, and industrial/ flex space, in addition to 206 for-rent market-rate multi-family residential units, as illustrated in the market characteristics table below. To note, there were zero hotel rooms within College Park as of year-end 2023.
Retail space composed the majority of College Park’s office, retail, and industrial/flex inventory at 56% of the total share, followed by retail space with 39% of the total, as of year-end 2023. Specifically, the office space within College Park consisted of zero Class A space, 44% Class B space, and 56% Class C space.
Office properties within College Park had a significantly lower occupancy rate compared to the retail and industrial/flex properties, both of which were fully occupied or close to fully occupied as of year-end 2023. Moreover, occupancy rates for College Park’s for-rent multi-family market was approximately 95.8% during this same period.
In addition, average rental rates for both retail and office properties were significantly higher than those for industrial/flex properties within College
Park as of year-end 2023. In addition, College Park’s average rental rates for all its commercial real estate markets were greater than those for the City as of year-end 2023.
There were 10 lease transactions that occurred in College Park’s office, retail, and industrial/flex markets—resulting in a total of 44,736 sq. ft. leased during 2023. Leasing activity refers to the volume of square footage that is committed to and actually signed during a given period of time, including direct leases, subleases and renewals of existing leases.
Gross absorption measures the total sq. ft. occupied within existing buildings over a given period, without accounting for vacated space. As of year-end 2023, retail space composed the majority of commercial gross absorption within College Park, closely followed by office space. In addition, College Park’s for-rent multi-family residential market experienced a negative absorption of 6 units during this same time frame.
The following pages illustrate major development activities, year-over-year snapshots, and five-year annual trends for College Park’s commercial real estate market.
Office space remained unchanged from the prior year at 244,970 sq. ft.
Vacancy rates for office properties increased 6 percentage points, from 4.1% to 10.5%.
Average rental rates per sq. ft. increased 9.6%, from $27.74 to $30.41.
Leasing activity of office space increased 126%
Over the past five years, 2019 to 2023, College Park did not experience any increase in inventory in its commercial real-estate markets. However, the Princeton at College Park, a 206-unit market-rate apartment property was completed in 2019.
In addition, there is zero sq. ft. of commercial inventory construction as of year-to-date 2024, through August 2024. However, during this same time frame, there is one proposed development project within College Park, located at 1717 Edgewater Drive, which will feature approximately 9,900 sq. ft. of office space. Notable development activity throughout the past five-year period and proposed development activity is illustrated in the graphic below.
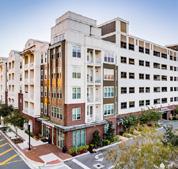
Retail space remained unchanged from the prior year at 346,770 sq. ft.
Vacancy rates for retail properties decreased 0.6 percentage points, from 2.4% to 1.8%.
Average rental rates per sq. ft. increased 28.4%, from $24.16 to $31.03.
Leasing activity of retail space increased 1,748%
Industrial/flex space remained unchanged from the prior year at 29,286 sq. ft.
Vacancy rates remained unchanged at 0.0%.
Average rental rates per sq. ft. increased 11.9%, from $15.44 to $17.28.
Leasing activity remained unchanged at 0 sq. ft. from the prior year.
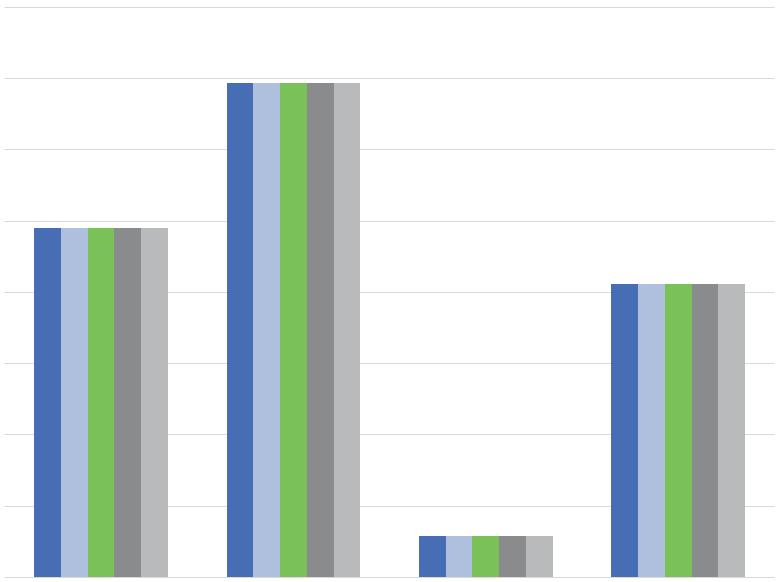
Over the past five years, 2019 to 2023, College Park’s commercial space (i.e., office, retail and industrial/flex space) did not experience any increase in inventory. During this same time frame, total for-rent multi-family inventory also remained unchanged within College Park.
There are zero hotel rooms located within College Park as of year-end 2023, therefore performance data is not available for this property use.
For-rent multi-family units remained unchanged from the prior year at 206 units.
Vacancy rates increased 2.8 percentage points for multi-family properties, from 1.4% to 4.2%.
Average rental rates per unit increased 5.5%, from $1,921 to $2,026.
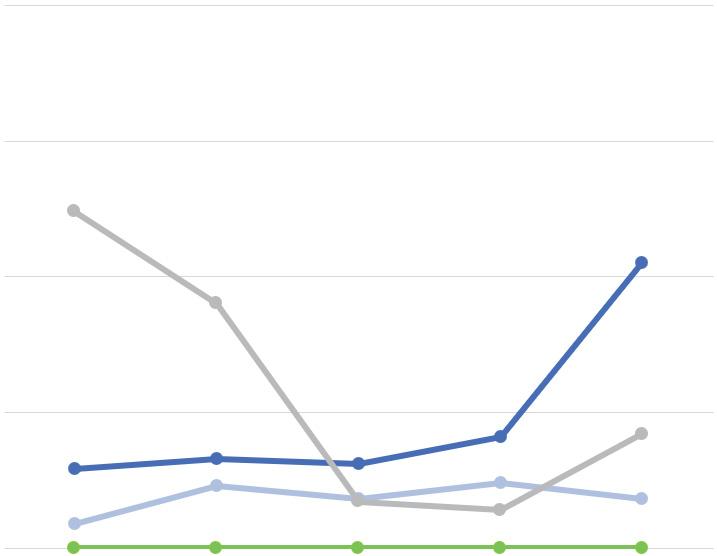
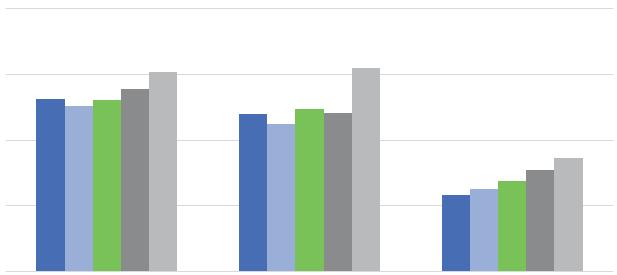
Vacancy rates in College Park saw increases over the past five years of 8 percentage points in the office market and 1 percentage point in the retail market. Rising vacancy rates are likely due to a shortage of desirable rental spaces and high rental costs exceeding what the local market can afford. However, notable increases from 2020-2022 may also be a result of the COVID-19 pandemic. In contrast, College Park’s for-rent multi-family market experienced a decline in vacancy over the past five years by 8 percentage points, which may be driven by an increase in demand for multi-family units within College Park.
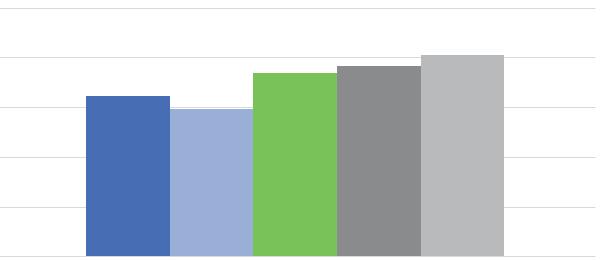
Over the past five years, 2019 to 2023, the average rental rates per sq. ft. for commercial space within College Park experienced increases of 16% for office, 30% for retail, and 48% for industrial/flex. During this same time frame, average rental rates per unit for multi-family increased 26%. Increases in average rental rates may be attributed to rising operating and fixed costs, as well as properties in desirable locations or with premium amenities that can command higher rents.
The Curry Ford West Main Street (“Curry Ford West”), part of the Main Street America program, is one of Orlando’s newest accredited Main Street Districts. Covering about 109 acres along Curry Ford Road, the district is bordered on the east by major thoroughfares such as State Road 15 (Conway Road) and State Road 552 (Curry Ford Road), as illustrated on the map on the following page.
The Curry Ford West has long been a neighborhood rooted in community and rich local culture. Known for its welcoming spirit and family-run establishments, the area has always held a strong sense of belonging and connection among its residents and businesses.
Today, Curry Ford West offers a vibrant mix of modern and historic establishments that continue to reflect its community-first ethos. The district’s longstanding appreciation for diverse, locally crafted food is evident in its variety of dining options, from authentic Mexican, Cuban, Greek, Peruvian, and Italian cuisines to cozy coffee shops and beloved bakeries. Curry Ford West is home to specialty markets, yoga and fitness studios, and boutique salons, which all contribute to the neighborhood’s distinct, dynamic lifestyle.
This thriving, walkable community remains a gathering place for residents and visitors alike, where local events and initiatives celebrate the spirit of Curry Ford West. Grounded in its heritage yet open to new possibilities, Curry Ford West embodies a unique blend of tradition and fresh energy, making it a model for community-driven revitalization in Orlando.
The mission of Curry Ford West is to create a diverse, thriving community where the commercial district serves not just as a destination, but as a gathering place where multi-generational families of all
backgrounds can flourish. To achieve this mission, Curry Ford West focuses on economic development initiatives that preserve the area’s unique character while promoting sustainable growth and supporting local businesses.
Four key transformational strategies guide Curry Ford West’s efforts: (1) foundation building, which addresses the essential elements needed to grow a successful program; (2) beautification initiatives and design, aimed at enhancing the visual appeal of the residential and commercial districts; (3) placemaking, which focuses on creating an inclusive environment that brings the community together; and (4) community serving, which seeks to develop an entrepreneur-friendly environment that incentivizes business growth.
Located at the westernmost end of the Curry Ford West is the neighborhood redevelopment initiative known as The Hourglass District. This project has revitalized existing buildings and brought new businesses to the area. This redevelopment has transformed this portion of the district into a convenient, walkable, and family-friendly destination,

offering a mix of small businesses that reflect the unique culture of Curry Ford West. Visitors and locals alike can enjoy a variety of options for dining, lifestyle activities, and entertainment, all within a compact, accessible area.
One highlight within the Hourglass District development is The Tamale Co., a family-owned gem that began as a popular food truck. Known for its dedication to quality and authentic flavors, Beyond serving exceptional food, they actively contribute to the neighborhood by hosting events, markets, and live music nights, creating gathering spaces for residents and visitors. Curry Ford West and its local businesses work together to bring engaging, community-centered events to the area, fostering a vibrant environment that celebrates local culture and supports small businesses.
Curry Ford West’s 2023 Annual Report highlights that the Curry Ford West Main Street invested nearly $219,000 into the district, with 38% coming from private investments. The district also created one new job and benefited from 641 volunteer hours contributed by residents and businesses.

Legend City of Orlando
Curry Ford West Main Street
Curry Ford West envisions to become more than just a destination, but a legacy for current and future generations to live, grow, and thrive. Key priority projects and programs within Curry Ford West include:
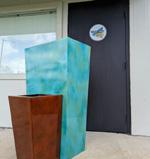
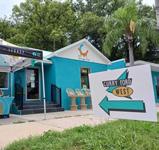

Orlando Main Streets
Mayf a ir Cir
C i r
O x f o r d S t
P i c k f a r S t
C e m e t e r y
Beautification Projects — Numerous beautification projects are being sponsored to enhance the aesthetics and image of Curry Ford West. Funded projects include: public murals, painted traffic boxes, decorative bike racks, and placemaking banners.
Orlando Fire Station 11 — In May 2024, the community celebrated the grand opening of the new Orlando Fire Station 11, also known as “The Beast of the East.” This state-of-theart facility, located on East Curry Ford near Conway, marks a significant enhancement in our local emergency response capabilities, and features advanced technology aimed at promoting firefighter wellness.
Community Events — Curry Ford West hosts four Annual Events with many smaller popup events. The annual events include the Little Entrepreneur Fair, a fun way to support “small” businesses by connecting with locals and families with children every Spring; the Dress Like A Dad Pub Crawl, an annual event that includes a costume runway show and a stand-up dad joke contest as attendees and participants make their way across Curry Ford; Trunk or Treat, a staple annual event that allows residents to trick-or-treat with local businesses; and Santa Sleighs the Ford, the newest holiday tradition in Curry Ford West which features Santa stopping at businesses along Curry Ford to take photos and engage local businesses.
L a k e U n d e r h i l l
G r e e n w o o d P a r k
BuckminsterCir
H u n t n g t o n S t L ake Como
Wessex St
C l e m w o o d S t
L a k e A r n o ld P l
Wa n u t S t
Wa l n u t S t
H a r g i l l D r
H a n d B l v d
Vi n e S t
R a eh n St
C u r r y F o r d R d
J e s s a m i n e A v e
S C r y s t a l L a k e D r
P e e l A v e
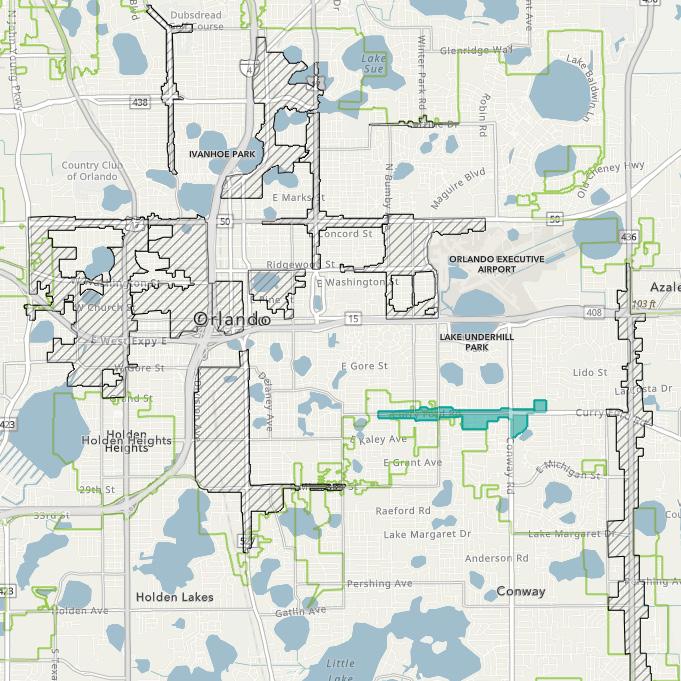
C o n w a y G a r d e n s R d B a l d w i n D r
C u r r y F o r d R d
R o s c o m a r e A v
H argill Dr
C o n w ay Rd

Co nway Rd
As of year-end 2023, Curry Ford West’s total employees compose approximately 0.2% of the total employment within the City. Curry Ford West’s employment sector is primarily dominated by the retail trade, accommodation and food services, and other services (excluding public administration) industries, as illustrated in the table below.
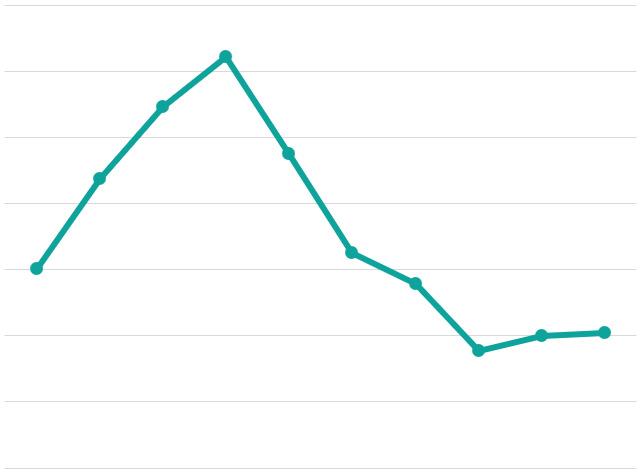
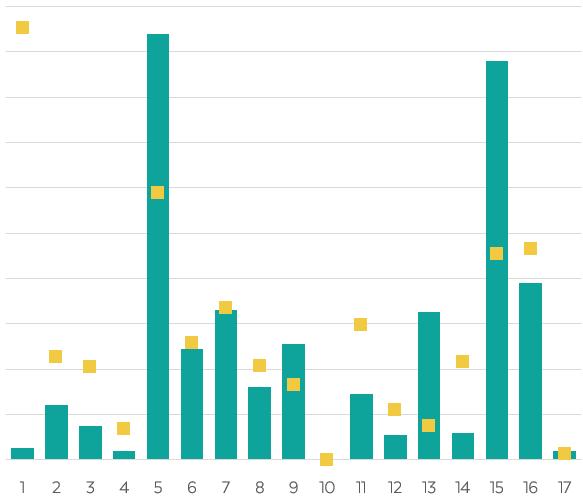
Over the 10-year period, from 2014 to 2023, Curry Ford West’s total employment has experienced a negative compound annual growth rate (“CAGR”) of 2.1%. This growth rate is significantly less than the City’s positive 2.3% CAGR during the same period. The figure above illustrates Curry Ford West’s total annual employment trends from 2014 through 2023.
In addition, Curry Ford West’s total employment decreased from 1,003 employees in 2014 to 809 employees in 2023—resulting in a net decrease of 194 total employees.
A location quotient (“LQ”) is an analytical statistic that measures how concentrated a particular industry is within an area. The above figure illustrates the concentration of employment by industry sector within Curry Ford West, as compared to the concentration within the City for year-end 2023. Curry Ford West has a higher concentration of industry professionals (LQ greater than 1.0) in the agriculture and mining, retail trade, other services (excluding public administration), accommodation and food services, information and finance, and administration services industries. Curry Ford West and the City are equally specialized (LQ equals 1.0) within the transportation and utilities industries.
As of year-end 2023, residents of Curry Ford West spent an estimated $21.2 million, with 34% allocated to housing, 32% to retail goods, 12% to food (both away from home and at home), 7.3% to health care, and 3.9% to entertainment and recreation. This spending pattern highlights the dominance of housing and retail, which together account for 66% of total expenditures. Additionally, food and health care make up 19.3% of the consumer spending budget, while entertainment and recreation represents the smallest portion of consumer spending. Within the broader context, total expenditures within Curry Ford West make up approximately 0.2% of the consumer spending within the City, with over $11.421 billion in total expenditures as of year-end 2023.
As of year-end 2023, Curry Ford’s for-sale residential market included 49 residential units. Residential condominium (“condo”) units made up the majority, at 65%, while single-family homes accounted for 35% of the total. Curry Ford’s residential units represent 0.03% of the total single-family residential units and 0.1% of the total residential condos within the City.
Curry Ford encompasses portions of one condo property, Orange Tree Village Condo. Total inventory of single-family and residential condo units within Curry Ford have remained unchanged over the past five years, 2019 through 2023.
As of year-end 2023, the average single-family residential assessed value per unit at $251,510 and the taxable value per unit at $225,830 were both significantly greater than those of residential condo units—with an assessed value per unit of $106,900 and a taxable value per unit of $94,870.
In addition, Curry Ford experienced a total of 5 residential condo unit sales in 2023, all located within the Orange Tree Village Condo property. Curry Ford’s residential unit sales represent 0.3% of the total residential condo unit sales within the City, as illustrated in the following table.
RESIDENTIAL SALES ACTIVITY
By the end of 2023, total sales price for residential condo units were $811,700 and the average sales price per sq. ft. was $158.78—significantly lower compared to that of the City with a residential condo unit sales per sq. ft. of $222.78.
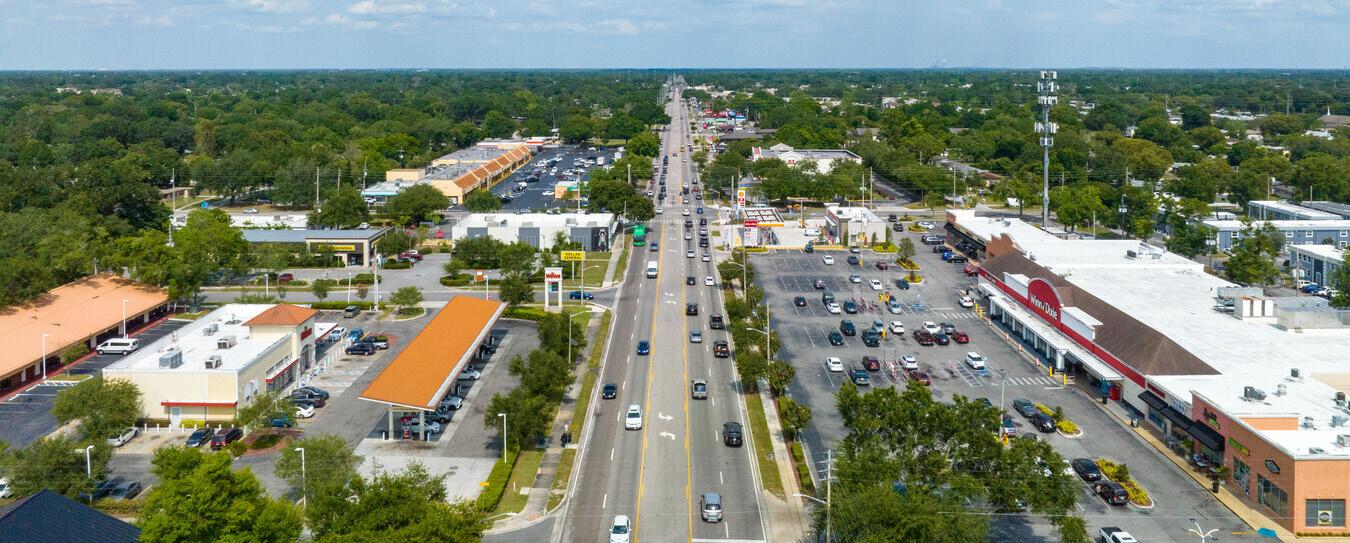
As of year-end 2023, Curry Ford West’s commercial real estate market composed just over 581,220 square feet (“sq. ft.”) of office and retail space, in addition to 339 for-rent marketrate multi-family residential units, as illustrated in the market characteristics table below. To note, there is zero industrial/flex space and zero hotel rooms within Curry Ford West as of year-end 2023.
Retail space composed the majority of Curry Ford West’s office and retail inventory as of year-end 2023, at 90%, with office space composing 10% of the total commercial inventory. Specifically, the office space within Curry Ford West consisted of zero Class A space, 45% Class B space, and 55% Class C space.
Curry Ford West’s retail properties had a slightly lower occupancy rate compared to office properties, which were fully occupied as of yearend 2023. Moreover, occupancy rates for Curry Ford West’s for-rent multi-family market was approximately 93.3% during this same period.
In addition, average rental rates for Curry Ford West’s office properties were slightly higher than those for retail properties as of year-end 2023. Additionally, Curry Ford West’s average rental
rates for its office market were greater than those for the City as of year-end 2023. However, average rental rates were smaller within Curry Ford West’s retail markets compared to that of the City during this same time frame.
There were 7 lease transactions that occurred in Curry Ford West’s office and retail markets— resulting in a total of 13,421 sq. ft. leased during 2023. Leasing activity refers to the volume of square footage that is committed to and actually signed in a given period of time, including direct leases, subleases and renewals of existing leases.
Gross absorption measures the total sq. ft. occupied within existing buildings over a given period, without accounting for vacated space. As of year-end 2023, Curry Ford West’s retail space experienced gross absorption of over 14,700 sq. ft. In addition, Curry Ford West’s for-rent multifamily residential market experienced negative absorption of 9 units during this same time frame
The following pages illustrate major development activities, year-over-year snapshots, and five-year annual trends for Curry Ford West’s commercial real estate market.
Office space remained unchanged from the prior year at 56,615 sq. ft. Vacancy rates for office properties remained unchanged from the prior year at 0.0%.
Average rental rates per sq. ft. increased 6.0%, from $28.01 to $29.68.
Leasing activity of office space decreased 100%
Over the past five years, 2019 to 2023, Curry Ford West saw the addition of approximately 9,240 sq. ft. of retail/restaurant space within 2 properties, both built within 2023. Within Curry Ford West, there is zero underconstruction activity as of year-to-date 2024, through August 2024. During this same time frame, there are three proposed properties within Curry Ford West, including the Flats at Hourglass, the Hourglass Townhomes, and an outparcel at Conway Commons. Notable development activity throughout the past fiveyear period and proposed development activity is illustrated in the graphic below.
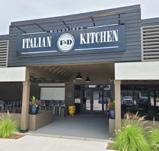
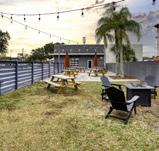
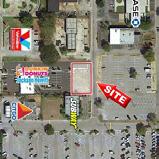
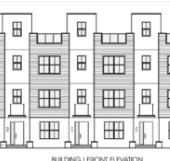
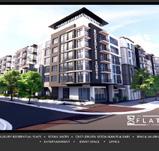
Retail space increased 1.8% from the prior year to 524,607 sq. ft.
Vacancy rates for retail properties increased 3.3 percentage points, from 0.8% to 4.1%.
Average rental rates per sq. ft. increased 20.8%, from $21.94 to $26.50.
Leasing activity of retail space increased 100%
Over the past five years, 2019 to 2023, Curry Ford West’s commercial space (i.e., office and retail space) increased by 9,242 sq. ft. of retail space and remained unchanged for its office space. During this same time frame, total multi-family inventory also remained unchanged within Curry Ford West.
Comparatively, the new inventory within Curry Ford West over the past five years accounted for 5.2% of the new retail inventory within the City.
There are zero sq. ft. of industrial/flex space located within Curry Ford West as of yearend 2023, therefore performance data is not available for this property use.
There are zero hotel rooms located within Curry Ford West as of year-end 2023, therefore performance data is not available for this property use.
For-rent multi-family units remained unchanged from the prior year at 339 units.
Vacancy rates increased 2.7 percentage points for multi-family properties, from 4.0% to 6.7%.
Average rental rates per unit decreased 5.3%, from $1,657 to $1,570.
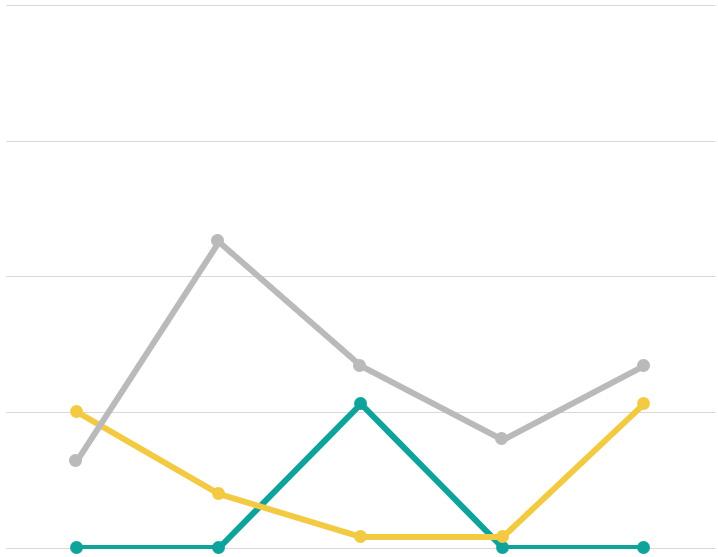
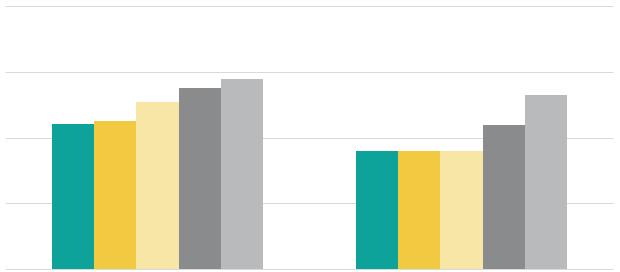
Vacancy rates in Curry Ford West saw increases over the past five years of 0.3 percentage points in the retail market and 3.5 percentage points in the rental multi-family market. Rising vacancy rates are likely due to a shortage of desirable rental spaces and high rental costs exceeding what the local market can afford. However, notable increases from 2020-2022 may also be a result of the COVID-19 pandemic. During this same time frame, vacancy rates in Curry Ford West’s office market remained unchanged.
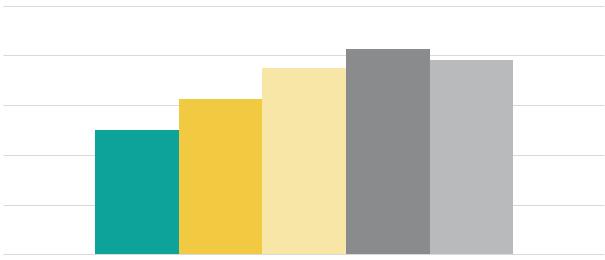
Over the past five years, 2019 to 2023, the average rental rates per sq. ft. for commercial space within Curry Ford West experienced increases of 32% for office and 47% for retail. During this same time frame, average rental rates per unit for multi-family increased 57%. Increases in average rental rates may be attributed to rising operating and fixed costs, as well as properties in desirable locations or with premium amenities that can command higher rents.
The Gateway District Main Street (“Gateway District”), part of the Main Street America program, is a vibrant shopping and cultural hub in Orlando, known for its eclectic mix of international flavors, unique shops, and lively community events. Spanning approximately 973 acres along State Road 436 (South Semoran Boulevard), as shown on the map on the following page, the Gateway District is the largest Orlando Main Street. Bordered by State Road 408 to the north and State Road 538 to the south, the Gateway District offers convenient northsouth routes for commuters.
Located in southeast Orlando, the Gateway District serves as the backbone of east Orlando, connecting the City’s two major airports: Orlando International Airport and Orlando Executive Airport. It is the main route for visitors traveling between either airport and key destinations like downtown Orlando and the University of Central Florida.
In the past 10 to 15 years, the neighborhoods surrounding the Gateway District have developed a vibrant Hispanic and Latino character, while maintaining the strong values and homeownership that have long defined this area of Orlando. This cultural shift has infused the Gateway District with renewed energy, transforming it into a melting pot experiencing an urban revival. With a history of just under 50 years, the Gateway District became the City’s first Market Street District as part of the Orlando Main Street program, led by a nonprofit board of directors and aligned with a national initiative to strengthen business districts.
As an official Main Street Organization in partnership with the City of Orlando, the Gateway District focuses on fostering economic growth and
prosperity. Its mission is to create a thriving business corridor along Semoran Boulevard, emphasizing connections between businesses, residents, and the surrounding community.
To support this mission, the Gateway District’s goals include promoting the Semoran Corridor as a vibrant business district, assisting member businesses with navigating regulations and permitting processes, and implementing beautification projects to enhance the area’s appeal. The nonprofit organization also aims to raise awareness of the Gateway District throughout Central Florida, improve safety for businesses and visitors, and provide valuable resources and assistance to member businesses for their growth and development.
Notable developments along Semoran Boulevard in the Gateway District include High Tide Harry’s, a family-owned seafood restaurant with over 20 years of history, located two miles north of
Orlando International Airport. Renowned for its award-winning seafood, High Tide Harry’s has been recognized by the Orlando Sentinel, Orlando Weekly, and Zagat. Additionally, the Lee Vista Promenade is a premier shopping center within the Gateway District, featuring extensive retail, dining, and entertainment options. This 450,000-square-foot center, located less than a mile from the Orlando International Airport, includes Epic Theaters, ULTA, HomeGoods, PetCo, Five Below, Michaels, Red Robin, Outback Steakhouse, and Rock & Brews.
The Gateway District’s 2023 Annual Report highlights that the Gateway District Main Street invested nearly $5.0 million into the district, with 1.7% coming from private investments. The district also welcomed 28 new businesses, created 179 jobs, and benefited from 338 volunteer hours contributed by residents and businesses.
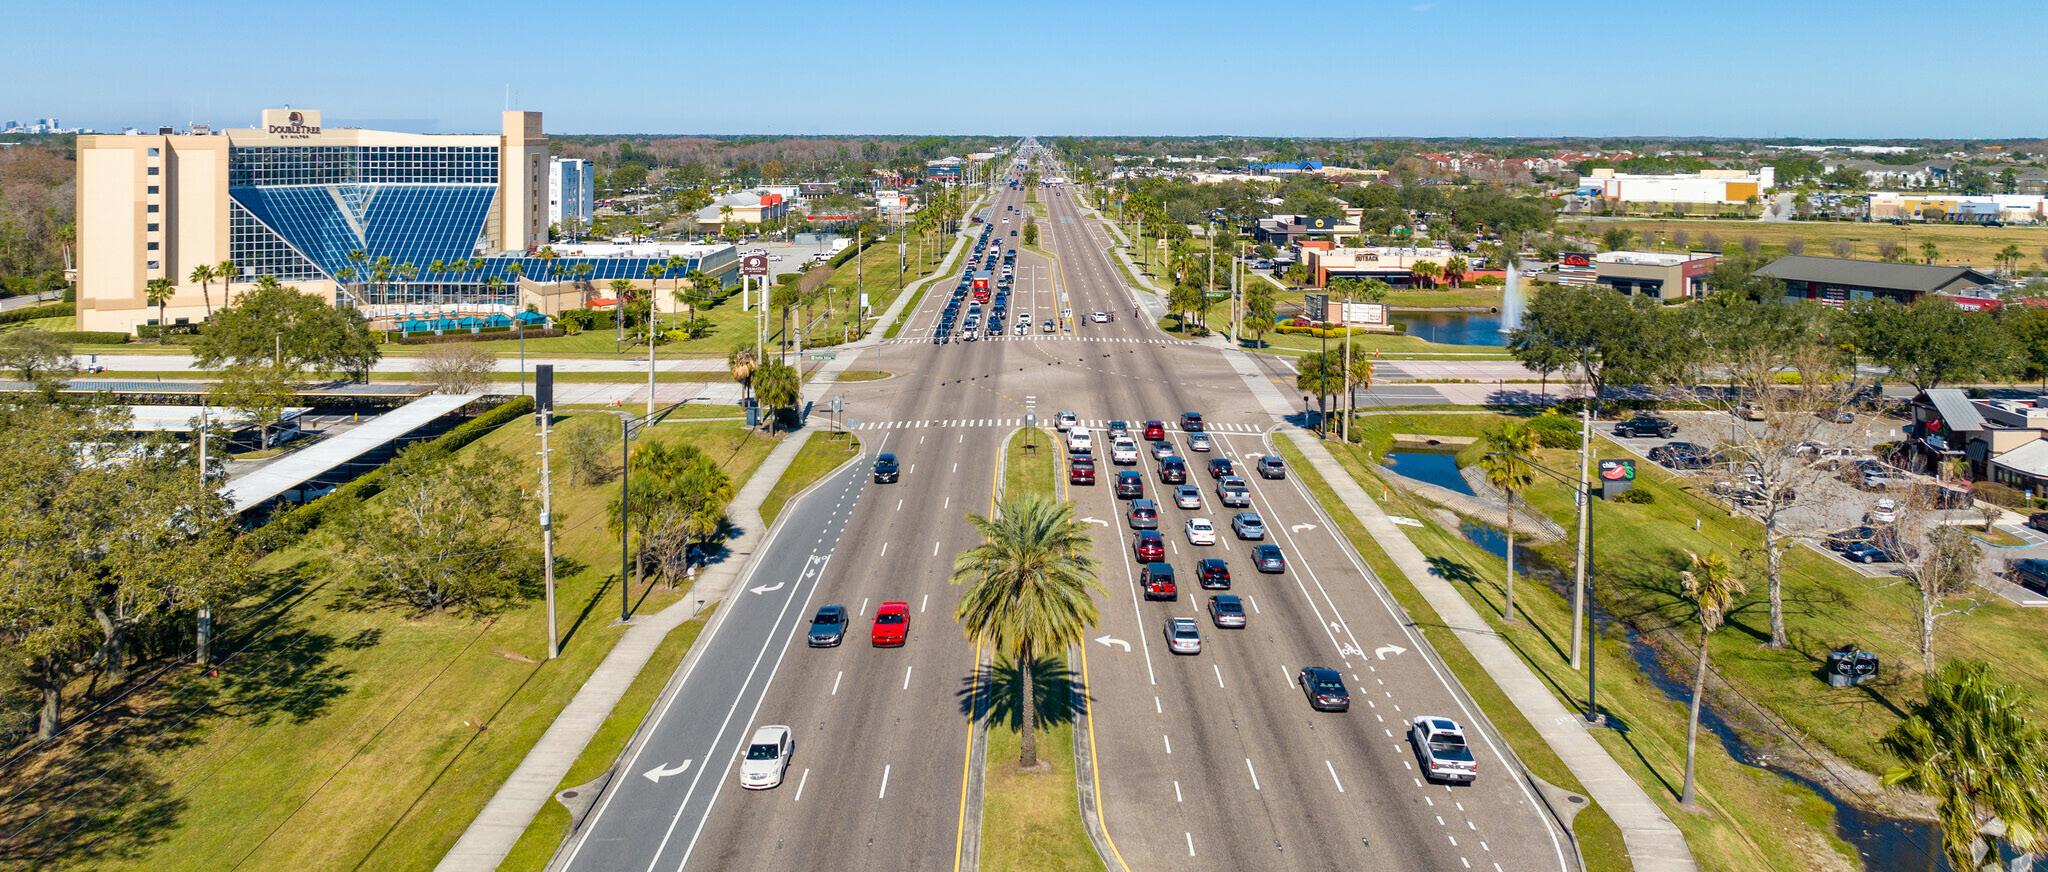
The Gateway District envisions creating an environment where local business can flourish through community engagement and support initiatives. Key priority projects and programs within the Gateway District include:

Arts After Dark — Beginning in January 2024, Arts After Dark is a monthly event located at the Hyatt House Hotel. Local painters, arts and crafts vendor, and other small businesses are welcome to showcase and sell artwork to attendees. The event is also accompanied by other vendors, and is mixed with a variety of performances to create a fun and friendly environment.

Business Development and Community Enhancement — The Gateway District is dedicated to providing valuable support and resources to local businesses and the community. Some of these business development programs include: (1) permitting assistance, providing assistance to local businesses to help understand and manage permitting processes; (2) safety initiatives, collaborating with local authorities to implement safety measures and awareness programs; (3) business development, offering a variety of resources to support business development, including workshops, training sessions, and networking opportunities; and (4) beautification projects, enhancing the aesthetic and appeal of the Gateway District through beautification projects, including the installation of banners, landscaping, and public art, creating a welcoming and attractive environment for residents and visitors.
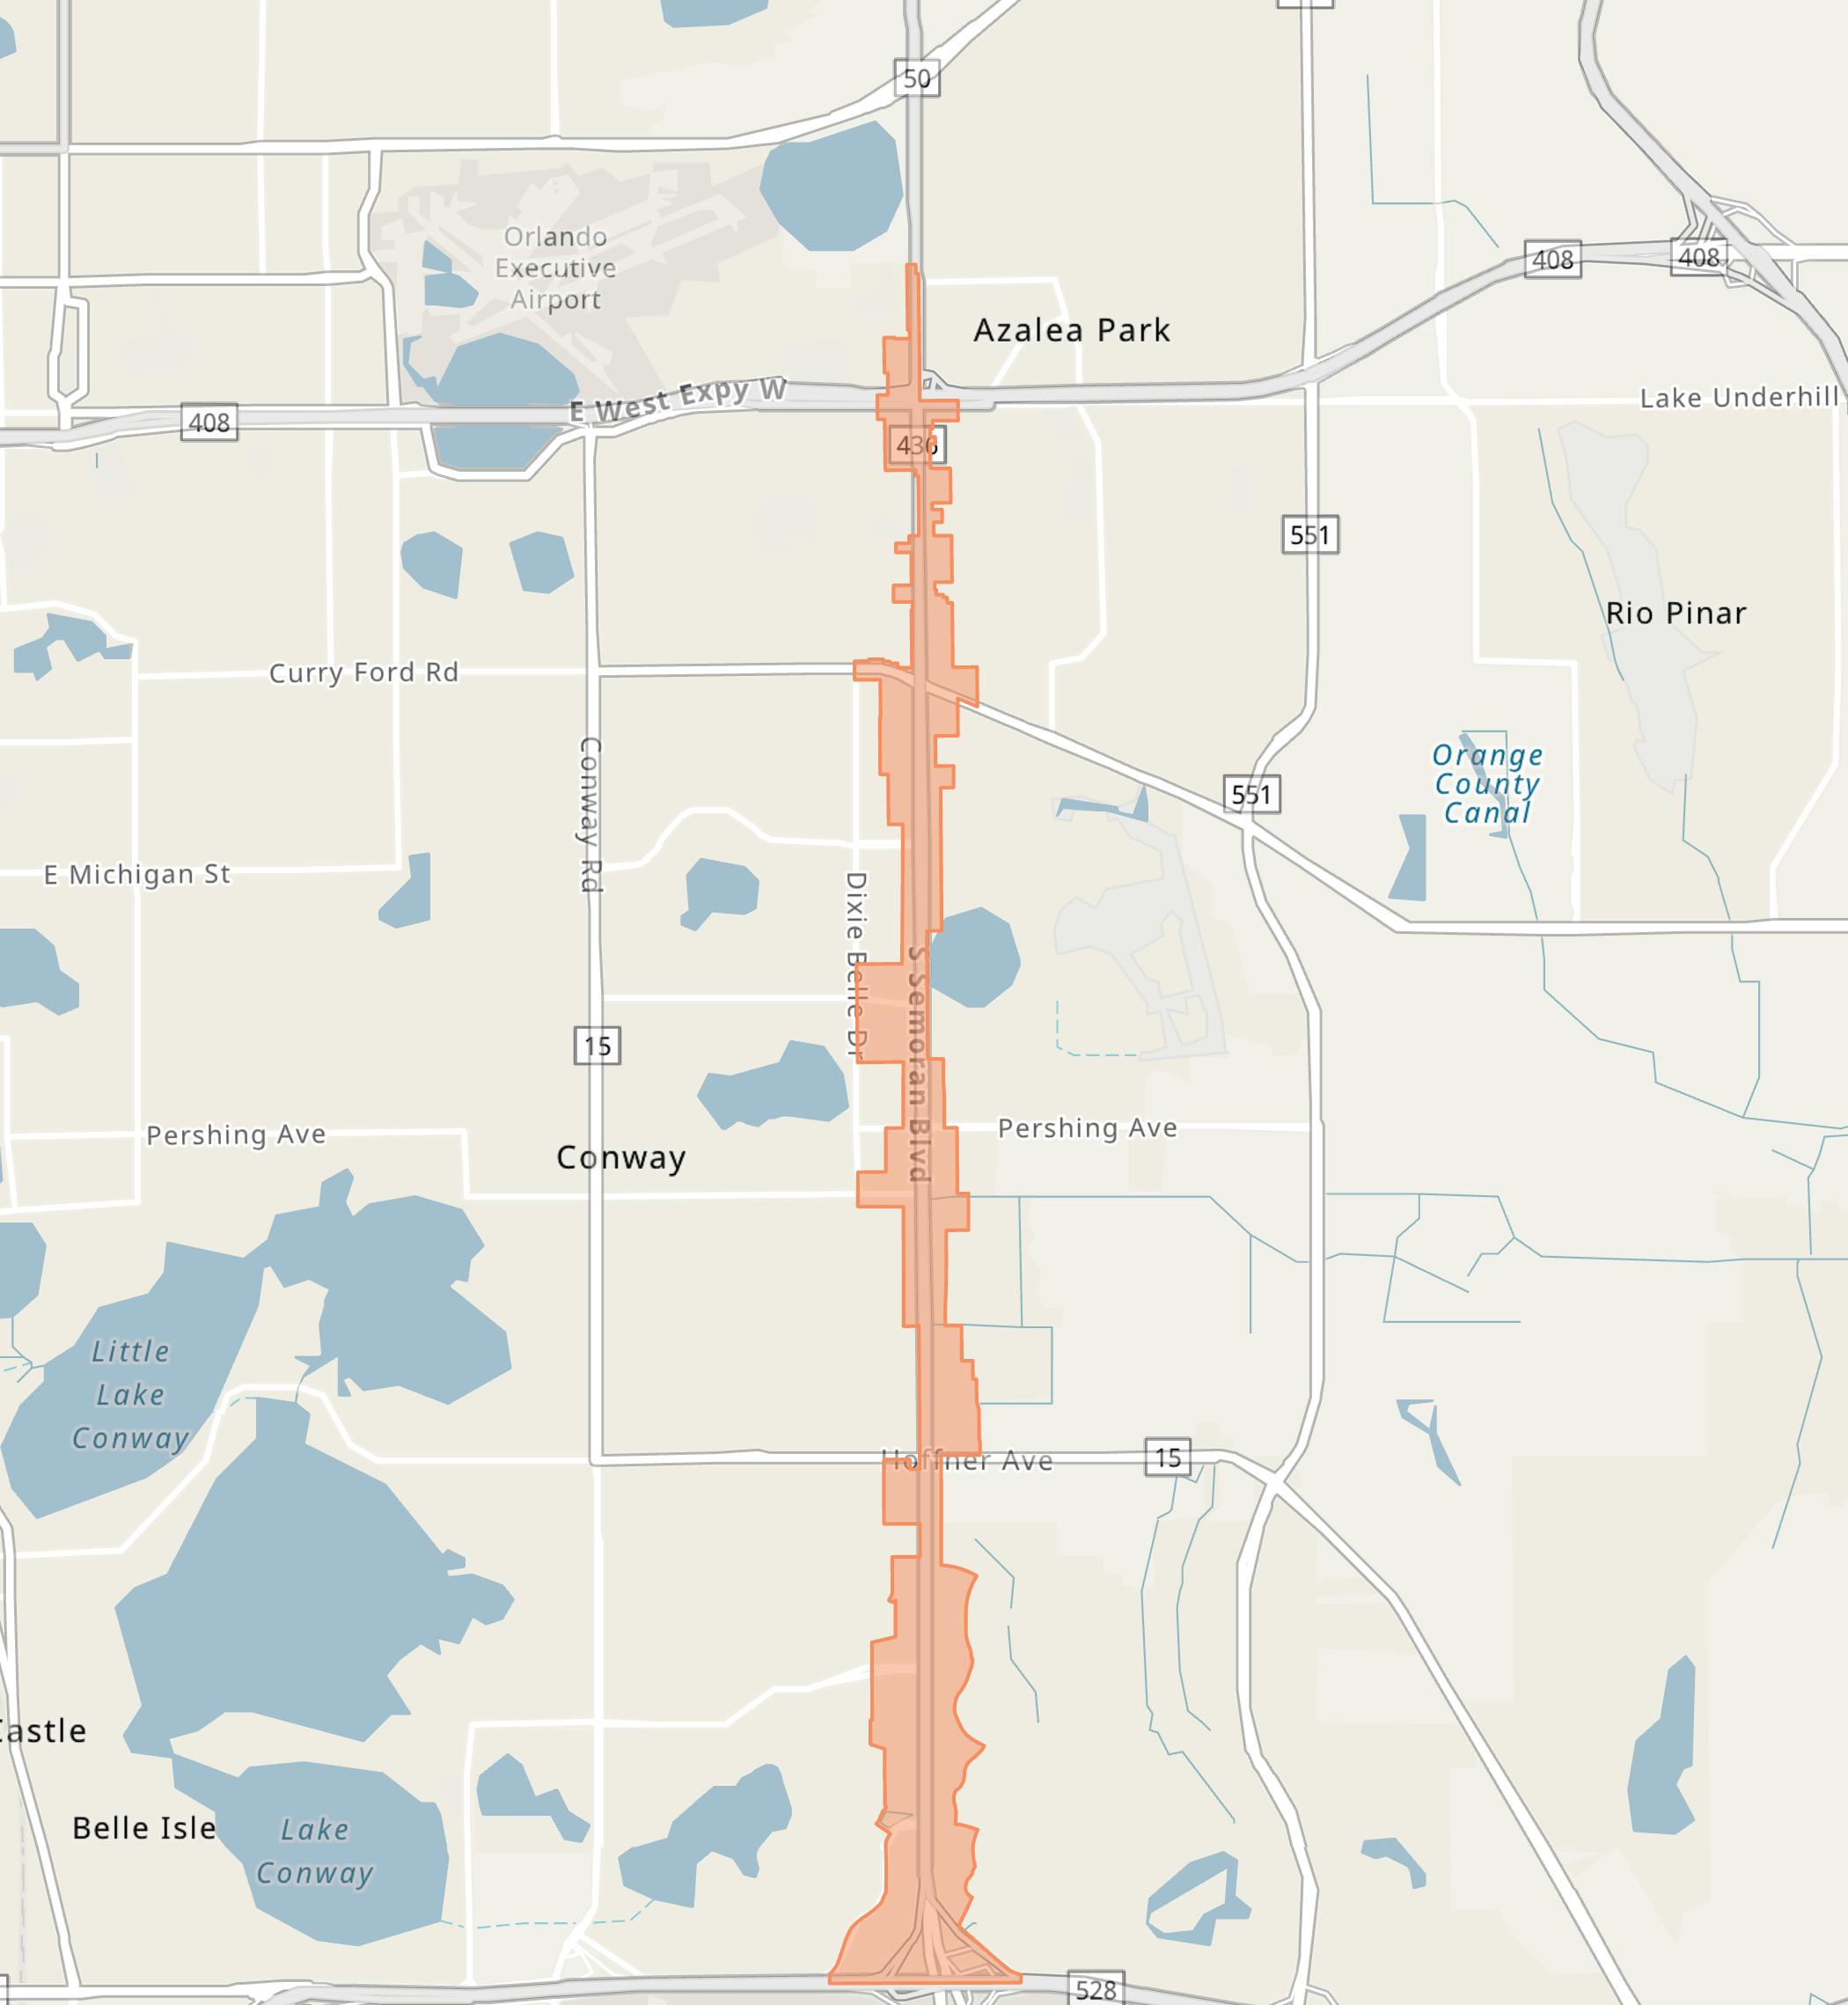
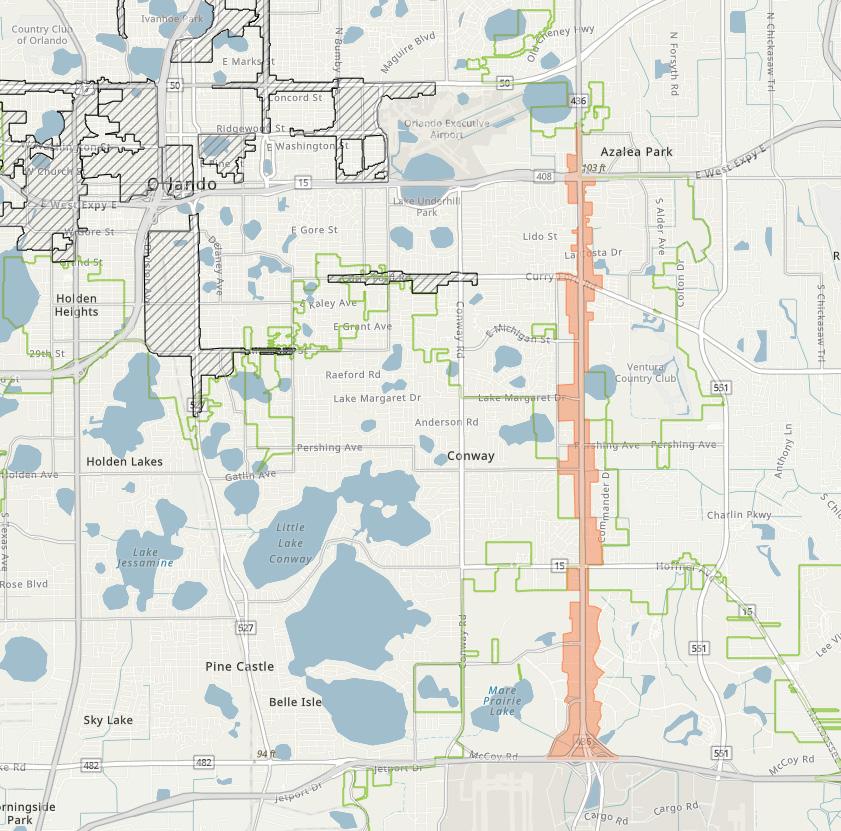
As of year-end 2023, the Gateway District’s total employees compose approximately 1.6% of the total employment within the City. The Gateway District’s employment sector is primarily dominated by the accommodation and food services, retail trade, and educational services industries, as illustrated in the table below.
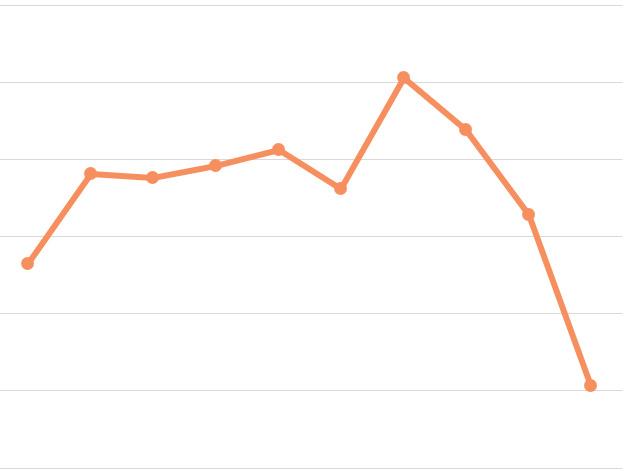
Over the 10-year period, from 2014 to 2023, the Gateway District’s total employment has experienced a negative compound annual growth rate (“CAGR”) of 2.3%. This growth rate is significantly lower higher than the City’s positive 2.3% CAGR during the same period. The figure above illustrates the Gateway District’s total annual employment trends from 2014 through 2023.
In addition, the Gateway District’s total employment decreased from 7,651 employees in 2014 to 6,066 employees in 2023—resulting in a net decrease of 1,585 total employees.
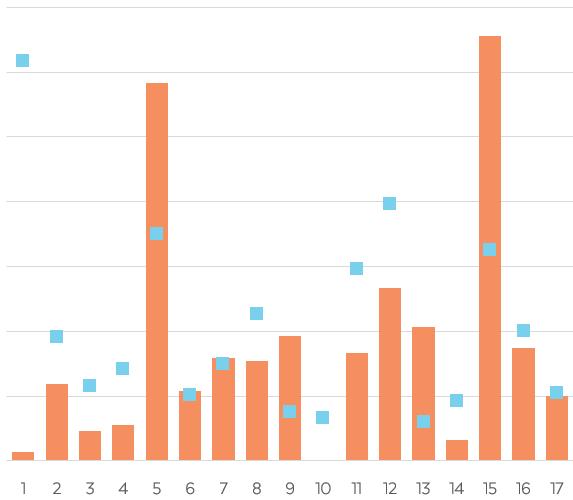
A location quotient (“LQ”) is an analytical statistic that measures how concentrated a particular industry is within an area. The above figure illustrates the concentration of employment by industry sector within the Gateway District, as compared to the concentration within the City for year-end 2023. The Gateway District has a higher concentration of industry professionals (LQ greater than 1.0) in the agriculture and mining, educational services, retail trade, accommodation and food services, administration and support, real estate and leasing, construction, and other services (excluding public administration) industries.
As of year-end 2023, residents of the Gateway District spent an estimated $79.6 million, with 34% allocated to housing, 31% to retail goods, 12% to food (both away from home and at home), 7.6% to health care, and 3.9% to entertainment and recreation. This spending pattern highlights the dominance of housing and retail, which together account for 64% of total expenditures. Additionally, food and health care make up 19.4% of the consumer spending budget, while entertainment and recreation represents the smallest portion of consumer spending. Within the broader context, total expenditures within the Gateway District make up approximately 0.7% of the consumer spending within the City, with over $11.421 billion in total expenditures as of year-end 2023.
As of year-end 2023, the Gateway District’s for-sale residential market included about 315 residential units. Residential condominiums (“condo”) made up the majority, at 95%, while single-family homes accounted for only 5.1% of the total. The Gateway District’s residential units represent 0.03% of the total single-family residential units and 1.0% of the total residential condos within the City.
The Gateway District encompasses two residential condo properties, including Semoran Pines and Venetian Place Condominium. Total inventory of single-family and residential condo residential units within the Gateway District have remained unchanged over the past five years, 2019 through 2023.
As of year-end 2023, the average single-family residential assessed value per unit at $213,600 and the taxable value per unit at $197,970 were both significantly greater than those of residential condo units—with an assessed value per unit of $93,110 and a taxable value per unit of $86,730.
In addition, the Gateway District experienced a total of one single-family unit sales and 13 residential condo unit sales in 2023. The Gateway District’s residential unit sales represent 0.01% of the total single-family residential unit sales and 0.9% of the total residential condo unit sales within the City, as illustrated in the following table.
By the end of 2023, total sales price for singlefamily homes and residential condo units was $115,000 and $1,593,000, respectively. In addition, the average sales price per sq. ft. for both singlefamily and residential condo units in the Gateway
District, at $84.56 per sq. ft. and $121.63 per sq. ft., respectively, were lower compared to the City’s average, at $346.26 per sq. ft. for single-family homes and $222.78 per sq. ft. for residential condo units.
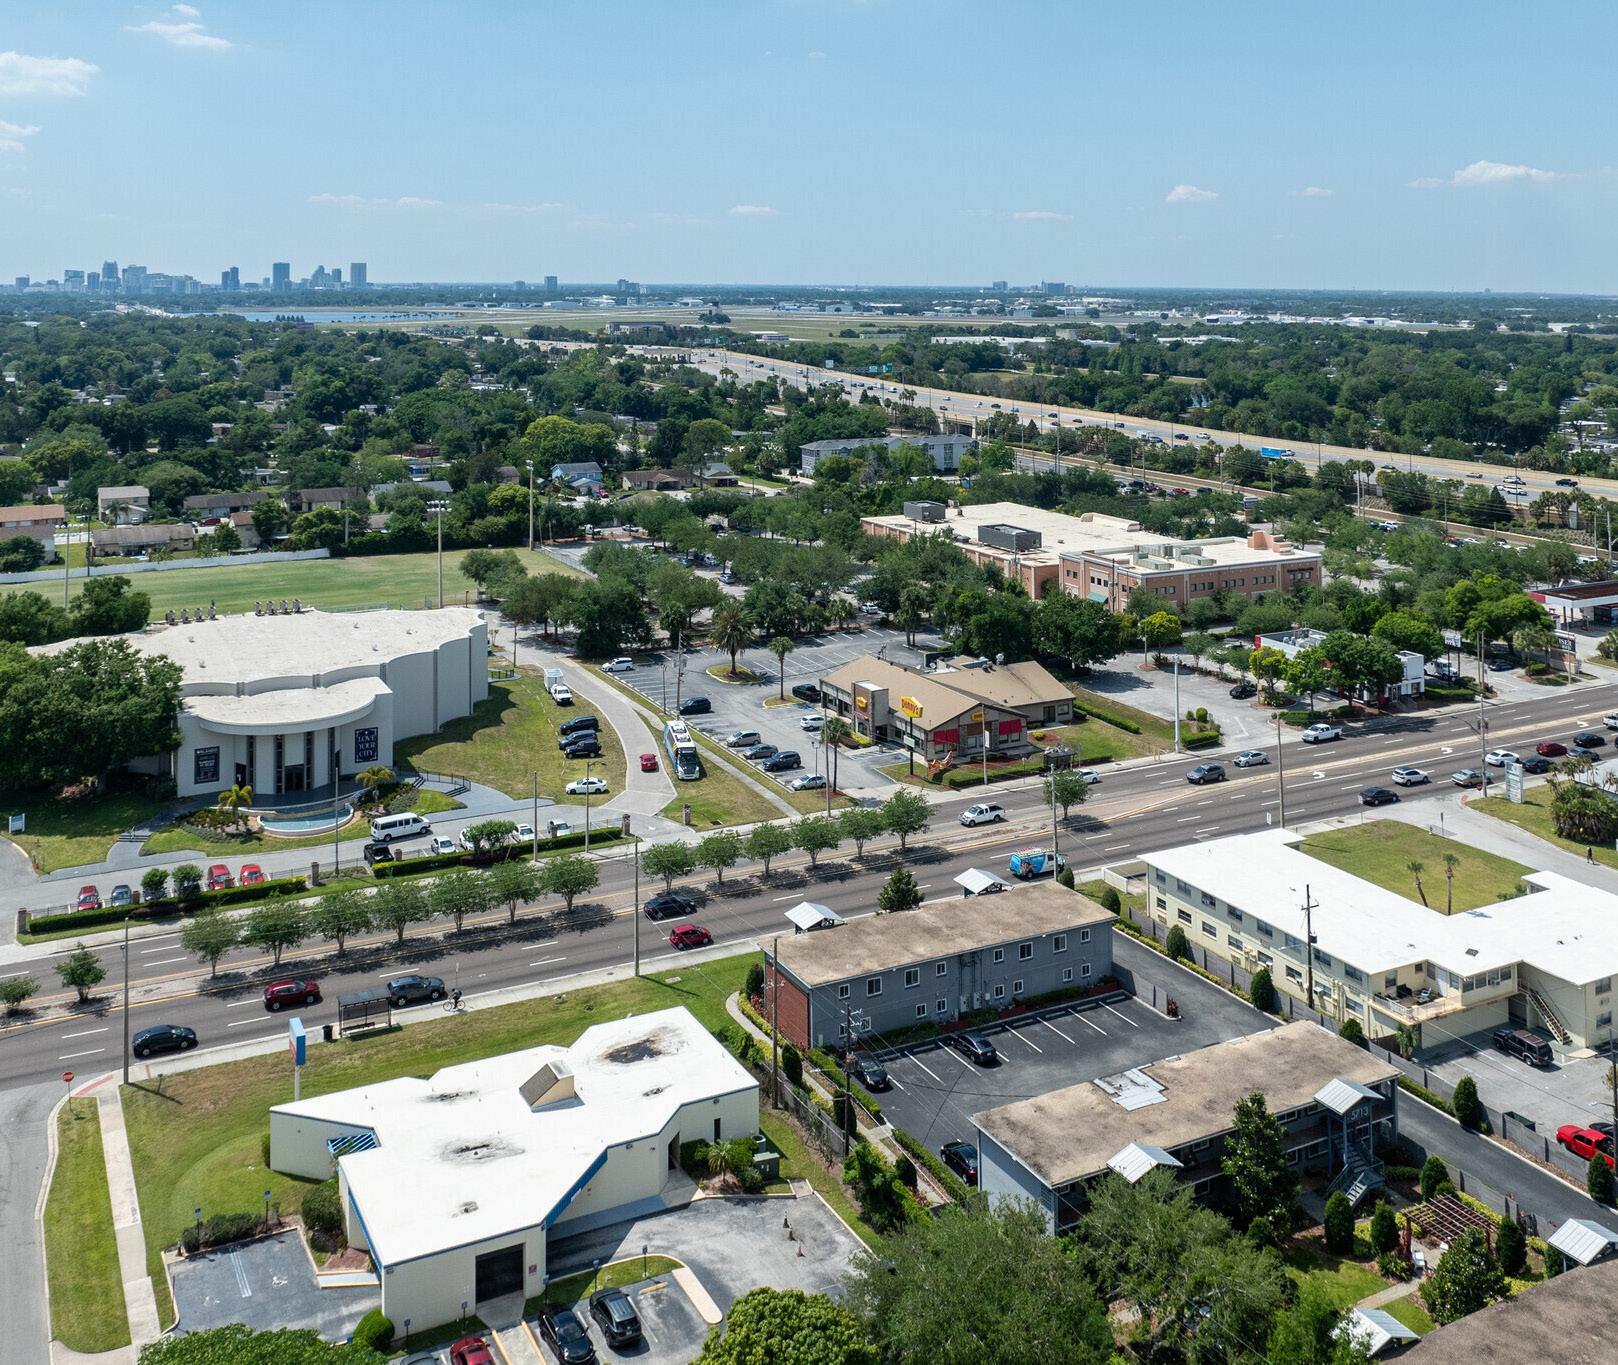
As of year-end 2023, the Gateway District’s commercial real estate market composed nearly 2.73 million square feet (“sq. ft.”) of office, retail, and industrial/flex space, in addition to 2,365 hotel rooms, and 814 for-rent market-rate multifamily residential units, as illustrated in the market characteristics table below.
Retail space composed the majority of the Gateway District’s commercial inventory at 75% of the total share, followed by office and industrial/ flex space with 18% and 6.5%, respectively, of the total, as of year-end 2023. Specifically, the office space within the Gateway District consisted of 4.0% Class A space, 43% Class B space, and the remaining portion as Class C space.
Within the Gateway District, office properties had a slightly greater occupancy rate compared to retail and industrial/flex properties, as of year-end 2023. Moreover, occupancy rates for both the Gateway District’s hotel and rental multi-family markets were approximately 82% and 95%, respectively.
In addition, the Gateway District’s average rental rates for its office and retail properties, as well as its hotel and for-rent multi-family markets, were lower than those for the City as of year-end
2023; whereas, the district’s industrial/flex market average rental rates were greater than those of the City during this same time period.
There were 30 lease transactions that occurred in the Gateway District’s office, retail, and industrial/ flex markets—resulting in a total of 81,107 sq. ft. leased during 2023. Leasing activity refers to the volume of square footage that is committed to and actually signed in a given period of time, including direct leases, subleases, and renewals of existing leases.
Gross absorption measures the total sq. ft. occupied within existing buildings over a given period, without accounting for vacated space. As of year-end 2023, the Gateway District’s total gross absorption equated to 112,541 sq. ft. of office, retail, and industrial/flex space. In addition, the Gateway District’s for-rent multi-family residential market experienced a negative absorption of 6 units during this same time frame.
The following pages illustrate major development activities, year-over-year snapshots, and fiveyear annual trends for the Gateway District’s commercial real estate market.
Building Area
Office space remained unchanged from the prior year at 496,288 sq. ft.
Vacancy rates for office properties decreased 5 percentage points, from 6.5% to 1%.
Average rental rates per sq. ft. decreased 4.0%, from $25.51 to $24.50.
Leasing activity of office space increased 115%
Over the past five years, 2019 to 2023, the Gateway District saw the addition of approximately 32,000 sq. ft. of office space, 9,900 sq. ft. of retail space, and 320 hotel rooms within 4 properties, as illustrated in the graphics below.
Within the Gateway District, there is zero under-construction activity as of year-to-date 2024, through August 2024. However, during this same time frame, there are six proposed development projects within the Gateway District, including approximately 806,870 sq. ft. of retail space within a neighborhood center located at Orlando Gateway Village, in addition to 220 hotel rooms proposed within 2 mid-scale development projects.
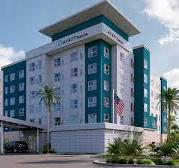
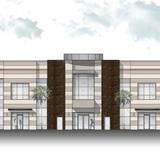
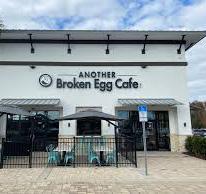
Retail space remained unchanged from the prior year at 2.1 million sq. ft.
Vacancy rates for retail properties decreased 0.1 percentage points, from 6.3% to 6.2%.
Average rental rates per sq. ft. increased 5.3%, from $21.53 to $22.67.
Leasing activity of retail space increased 35%
Industrial/flex space remained unchanged from the prior year at 178,721 sq. ft.
Vacancy rates increased 4.6 percentage points, from 3.3% to 7.9%.
Average rental rates per sq. ft. decreased 15%, from $18.88 to $16.04.
Leasing activity increased 18%
Hotel inventory increased 7.1% from 2,209 rooms to 2,365 rooms.
Vacancy rates for hotel properties increased 0.4 percentage points, from 17.6% to 18.0%.
Average daily rate (“ADR”) for hotel rooms increased 3.3%, from $137.75 to $142.32.
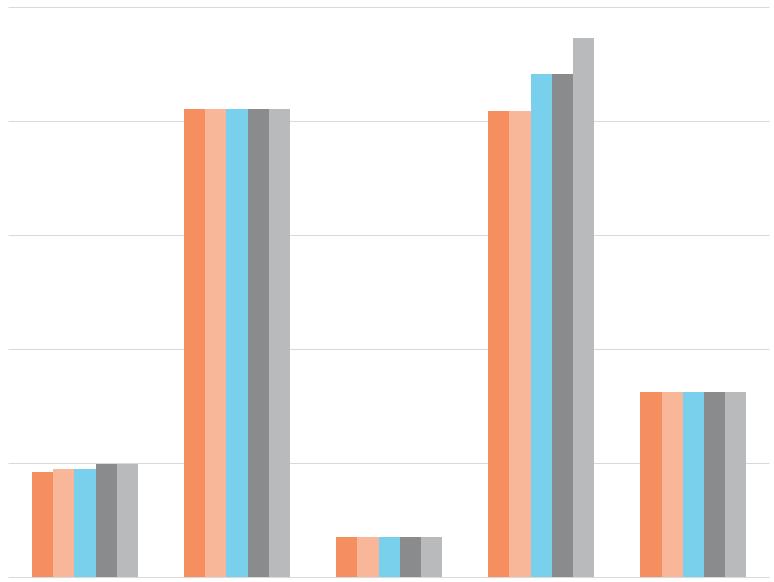
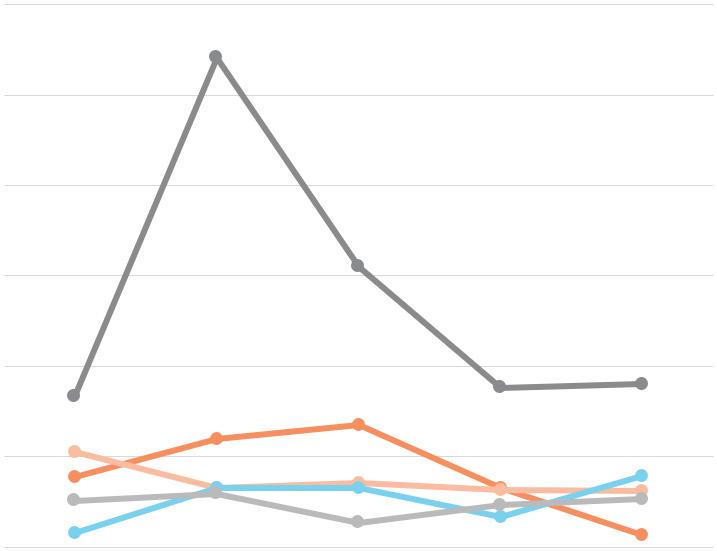
Over the past five years, 2019 to 2023, total inventory of commercial space within the Gateway District experienced an increase of 32,000 sq. ft. of office space, and remained unchanged in both retail and industrial/flex space. During this same time frame, total hotel rooms also increased by 320 rooms; whereas, multi-family inventory remained unchanged within the Gateway District.
Comparatively, the new inventory within the Gateway District over the past five years accounted for 1.2% of the City’s new office space and 7.1% of the City’s new hotel rooms.
Over the past five years, the Gateway District saw vacancy rate increases of 6, 1.3, and 0.2 percentage points in the industrial/flex, hotel, and for-rent multifamily market, respectively. Rising vacancy rates are likely due to a shortage of desirable rental spaces and high rental costs exceeding what the local market can afford. However, notable increases from 2020-2022 may also be a result of the COVID-19 pandemic. In contrast, the Gateway District’s office and retail markets experienced a 7 and 4 percentage point decline in vacancy rates, respectively, over the past five years—which may be attributed to an increase in spending and demand for rentable spaces.
For-rent multi-family units remained unchanged from the prior year at 814 units.
Vacancy rates increased 0.7 percentage points for multi-family properties, from 4.6% to 5.3%.
Average rental rates per unit decreased 1.0%, from $1,528 to $1,512.
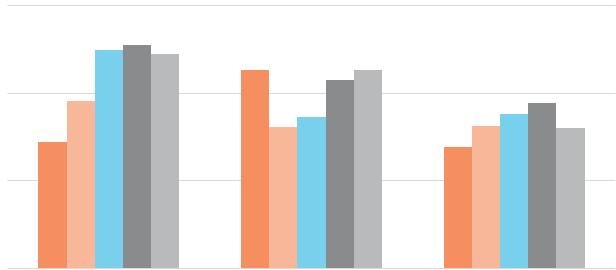
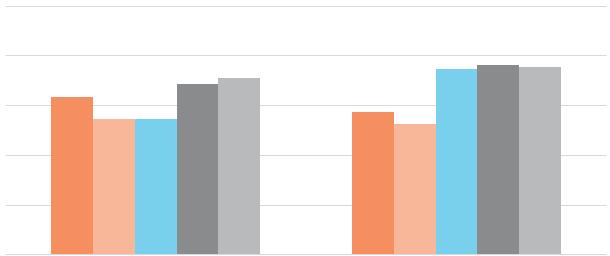
Over the past five years, 2019 to 2023, the average rental rates per sq. ft. within the Gateway District experienced increases of 69% for office, 0.1% for retail, and 16% for industrial/flex. During this same time frame, average daily rates for hotel rooms increased 12%, and average rental rates per unit for multi-family increased 32%. Increases in average rental rates may be attributed to rising operating and fixed costs, as well as properties in desirable locations or with premium amenities that can command higher rents.
The Ivanhoe Village Main Street (“Ivanhoe Village”), part of the Main Street America program, is nestled in one of Orlando’s most cherished historic neighborhoods, anchored by the scenic Lake Ivanhoe. Spanning approximately 384 acres along State Road 527, Ivanhoe Village is conveniently situated near major north-south thoroughfares, including Interstate-4 and U.S. Highway 17 (Mills Avenue), as depicted in the map on the following page.
Located on the northern edge of downtown Orlando, Ivanhoe Village is renowned for its antique stores, art galleries, design centers, master craftsmen, restaurants, and retail shops. The area offers a variety of attractions, from outdoor dining and a vintage record shop to a bike shop and jewelry stores.
Ivanhoe Village features a classic architectural layout, with small-scale one- and two-story storefronts facing pedestrian-friendly sidewalks. Many buildings showcase Art Deco elements, with sleek curves and forms enhancing their façades. A replica Statue of Liberty marks the entrance to Ivanhoe Village, surrounded by tropical plants and flowers.
Ivanhoe Village envisions embracing and celebrating Orlando’s indie, offbeat, and authentic side. It aims to foster a culturally vibrant district that seamlessly blends art, unique businesses, and a causal, laid-back atmosphere. To support this vision, Ivanhoe Village’s goals are to promote longterm revitalization of the district, preserving its rich history and community aesthetic It also strives to support the prosperity of local businesses through collaborative efforts and partnerships.
A key highlight of Ivanhoe Village is the Loch Haven Cultural Park, a 45-acre cultural hub located at the intersection of North Mills Avenue and Princeton Street. Nestled between three lakes—Lake Estelle to the north, Lake Rowena to the east, and Lake Formosa to the south—this park is home to several prestigious institutions, including the Orlando Shakespeare Theatre, the Orlando Science Center, the Orlando Museum of Art, the Orlando Fire Museum, the Mennello Museum of American Art, the Orlando Ballet, Orlando Family Stage, and the Orlando Garden Club. Loch Haven Cultural Park offers a rich array of artistic and educational experiences, making it a cornerstone of the community.

Ivanhoe Village is also home to AdventHealth Health Village, a comprehensive medical campus providing specialized medical centers, outpatient clinics, and wellness programs. This enhances the district’s access to top-tier healthcare and contributes to its vitality and growth.
Ivanhoe Village’s 2023 Annual Report highlights that the Ivanhoe Village Main Street invested over $1.9 million into the district, with 7.8% coming from private investments. The district also welcomed 8 new businesses, created 61 jobs, and benefited from 977 volunteer hours contributed by residents and businesses.
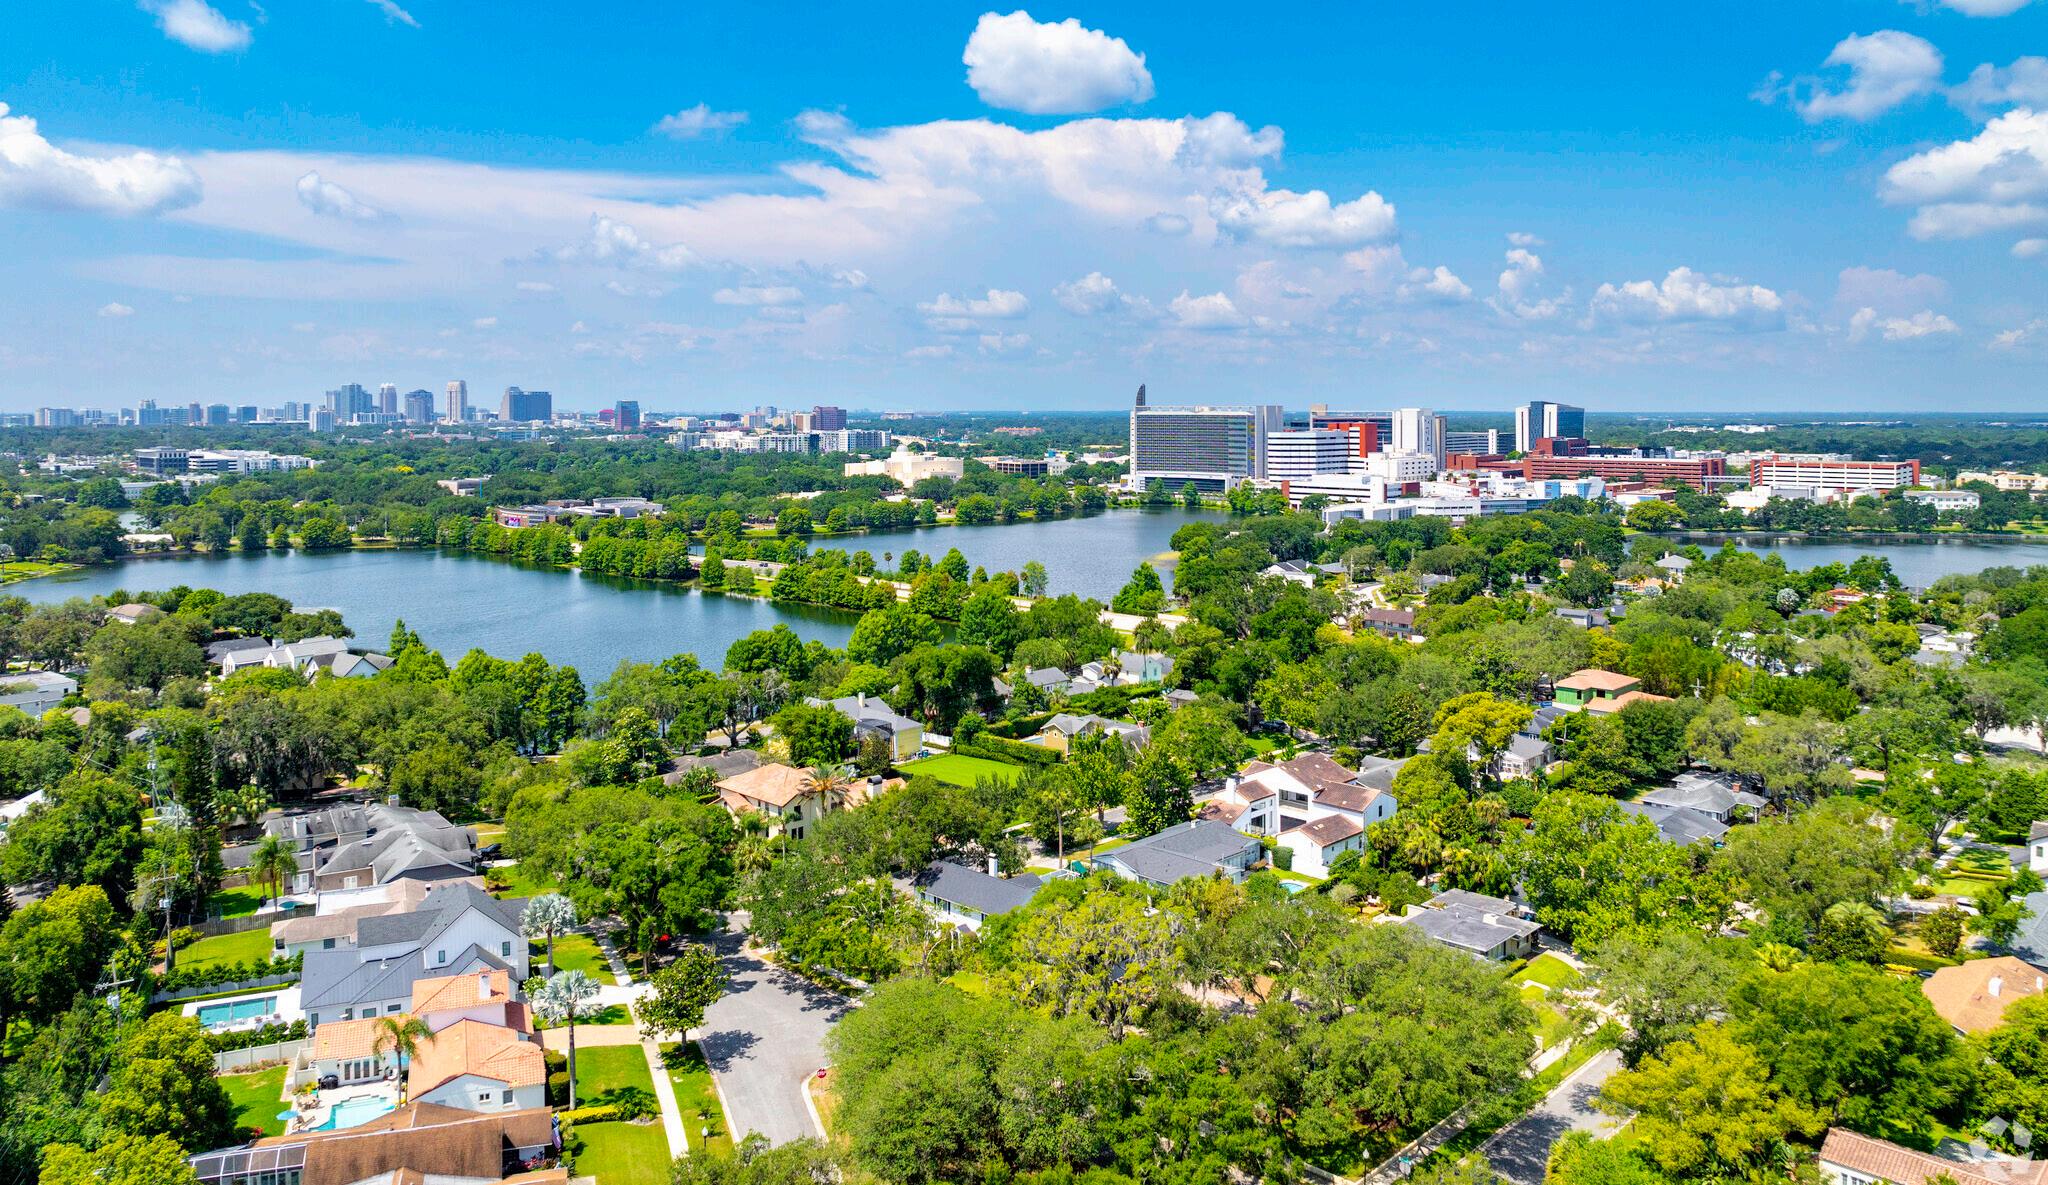
Ivanhoe Village is committed to the meaningful, long-term revitalization of Orlando’s cultural district. This includes preserving its rich history, enhancing its community aesthetic, and fostering local business prosperity through collaborative efforts and synergy with businesses, residents, and partners. Key priority projects and programs within Ivanhoe Village include:

Community Events — Ivanhoe Village organizes a variety of community events year-round. Key events in the district include: Jingle Eve, an annual celebration featuring a wine walk, live music, food trucks, and local vendors; and Ivanhoe Village Vibes, a weekly event sponsored by United Arts of Central Florida, showcasing live performances by local artists. Additionally, Ivanhoe Village hosts numerous pop-up events and fundraisers.
The Gateway Building — The ONIX Group is overseeing the development of a new 14-story hotel next to AdventHealth in Ivanhoe Village. This project will include a 150-room hotel, medical offices leased by AdventHealth, a restaurant, retail spaces, and other amenities, with an expected opening in fall 2026.

North Orange Avenue Sanitary Sewer
Improvements — In September 2023, the City of Orlando’s Public Works Department began Phase 1 of a 15-month project to replace the outdated sanitary sewer lines on North Orange Avenue, between Ivanhoe Boulevard and Alden Road. The project, divided into five phases, will install a new, larger-diameter pipeline to better support the area’s growth.
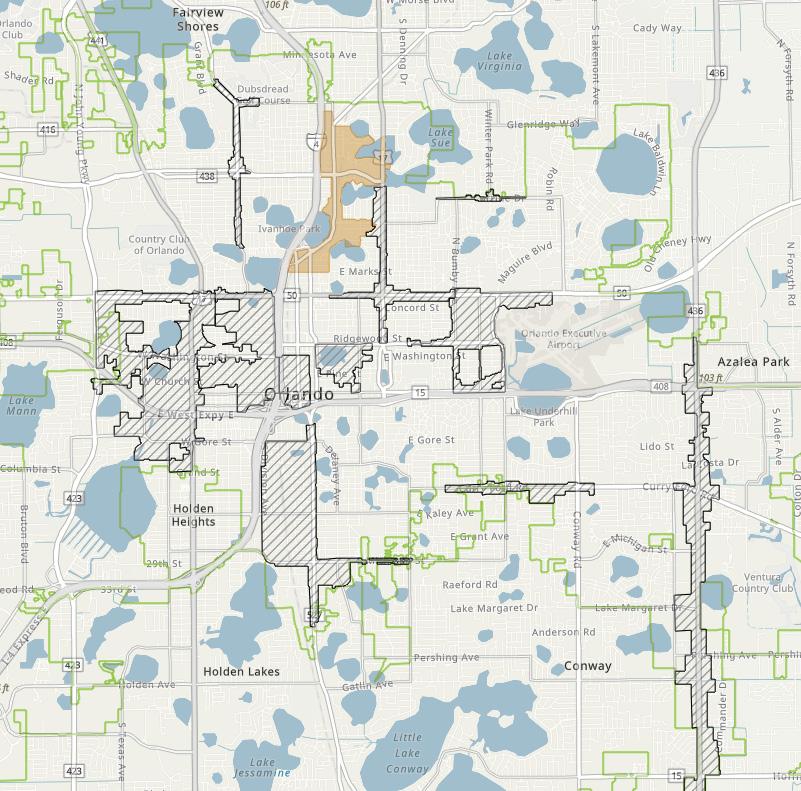
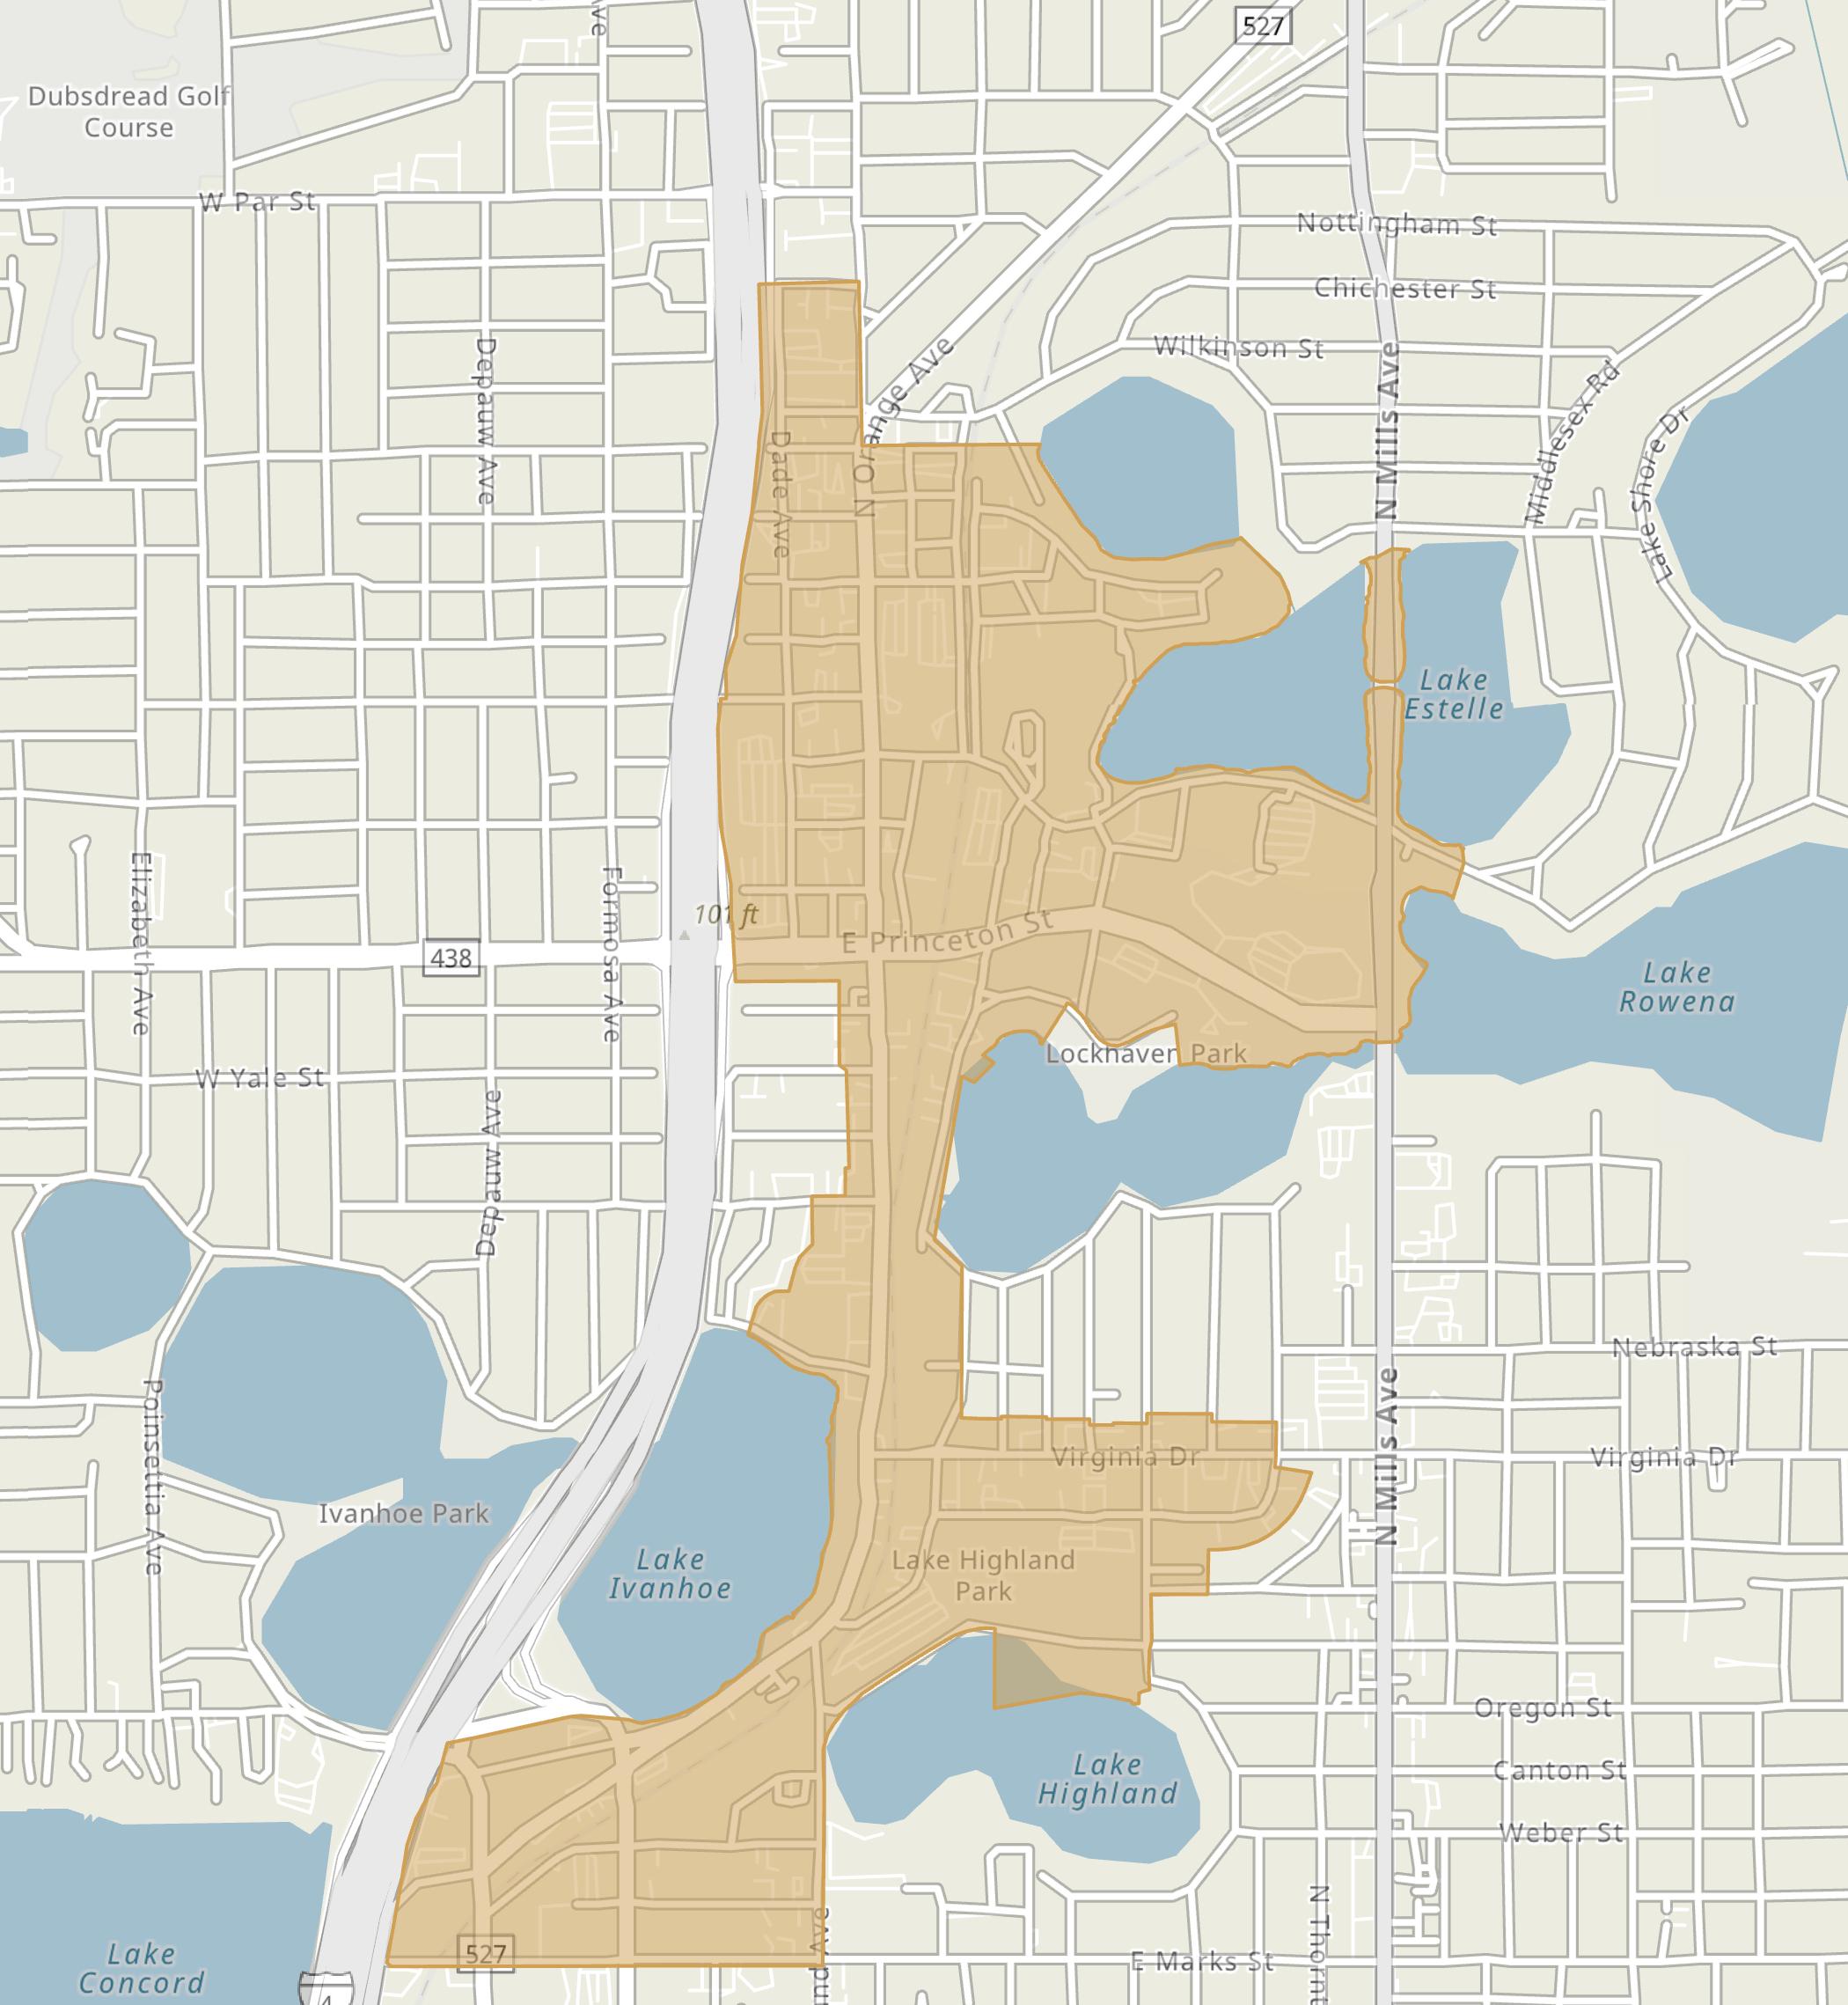

As of year-end 2023, Ivanhoe Village’s total employees compose approximately 5.4% of the total employment within the City. Ivanhoe Village’s employment sector is primarily dominated by health care and social assistance, and administration and support services industries, as illustrated in the table below.

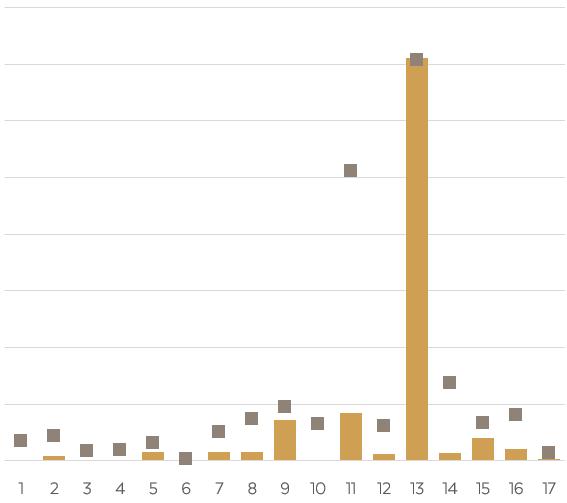
Over the 10-year period, from 2014 to 2023, Ivanhoe Village’s total employment has experienced a compound annual growth rate (“CAGR”) of 1.9%. This growth rate is slightly higher than the City’s 2.3% CAGR during the same period. The figure above illustrates Ivanhoe Village’s total annual employment trends from 2014 through 2023.
In addition, Ivanhoe Village’s total employment increased from 16,821 employees in 2014 to 20,362 employees in 2023—resulting in a net increase of 3,541 total employees. During this same time frame, Ivanhoe Village has captured approximately 4.6% of the City’s total growth in employment.
A location quotient (“LQ”) is an analytical statistic that measures how concentrated a particular industry is within an area. The above figure illustrates the concentration of employment by industry sector within Ivanhoe Village, as compared to the concentration within the City for year-end 2023. Ivanhoe Village has a higher concentration of industry professionals (LQ greater than 1.0) in the health care and social services and the administration and support services industries.
As of year-end 2023, residents of Ivanhoe Village spent an estimated $131.7 million, with 34% allocated to housing, 30% to retail goods, 12% to food (both away from home and at home), 7.2% to health care, and 4.0% to entertainment and recreation. This spending pattern highlights the dominance of housing and retail, which together account for 64% of total expenditures. Additionally, food and health care make up 18.9% of the consumer spending budget, while entertainment and recreation represents the smallest portion of consumer spending. Within the broader context, total expenditures within Ivanhoe Village make up approximately 1.2% of the consumer spending within the City, with over $11.421 billion in total expenditures as of year-end 2023.
As of year-end 2023, Ivanhoe Village’s for-sale residential market included 281 residential units. Residential condominiums (“condo”) made up the majority, at 99%, while single-family homes accounted for only 0.7% of the total. Ivanhoe Village’s residential condo units represent 1.0% of the total residential condos within the City.
Ivanhoe Village encompasses one residential condo property, Uptown Place Condominium. Total inventory of condo residential units within Ivanhoe Village has remained unchanged over the past five years, 2019 through 2023. As of year-end 2023, the average assessed value per unit was $159,420 and the taxable value per unit was $152,810 for all residential condo units within Ivanhoe Village.
In addition, Ivanhoe Village experienced a total of 22 residential condo unit sales in 2023; representing 1.5% of the total residential condo unit sales within the City, as illustrated in the following table.
By the end of 2023, the total sales price for residential condo units exceeded $4.4 million. Additionally, the average sales price per sq. ft. for residential condo units in Ivanhoe Village, at $223.46 per sq. ft., was comparable to the City’s average of $222.78 per sq. ft. during the same period. RESIDENTIAL SALES ACTIVITY
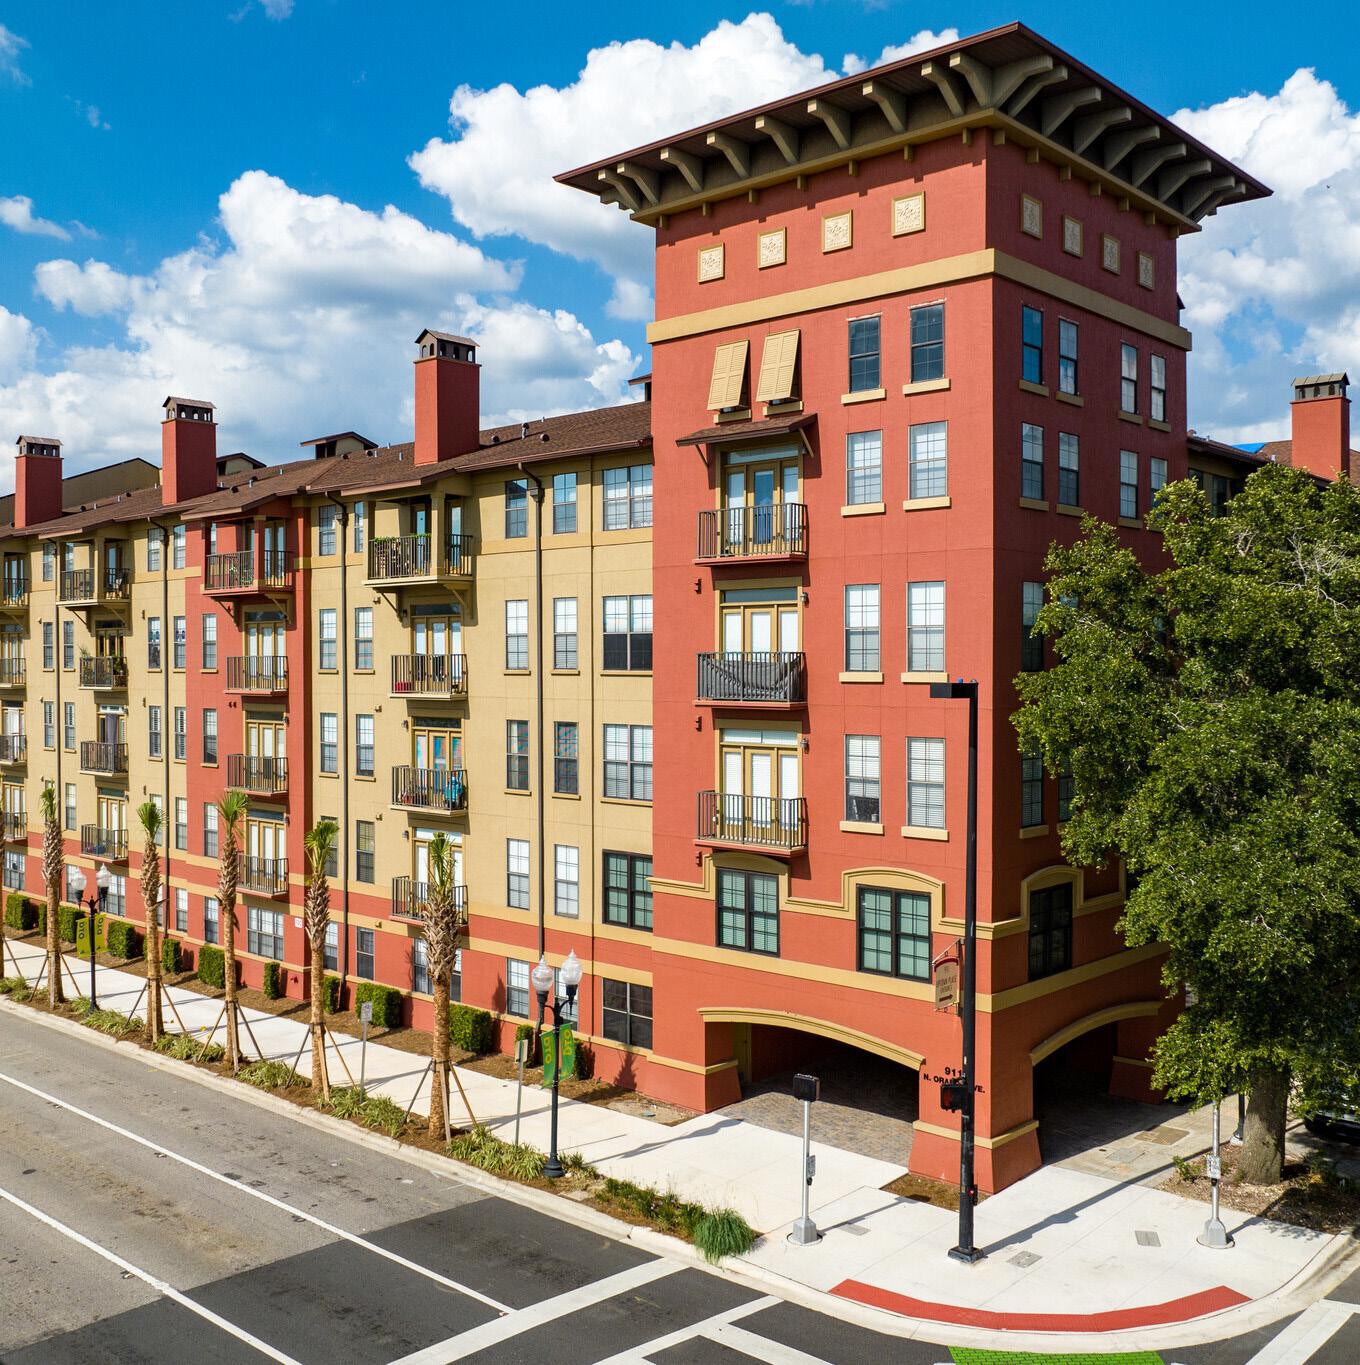
As of year-end 2023, Ivanhoe Village’s commercial real estate market composed nearly 2.92 million square feet (“sq. ft.”) of office, retail, and industrial/ flex space, in addition to 463 hotel rooms, and 1,438 for-rent market-rate multi-family residential units, as illustrated in the market characteristics table below.
Office space composed the majority of Ivanhoe Village’s office, retail, and industrial/flex inventory at 77% of the total share, followed by industrial/ flex and retail space with 12% and 11%, respectively, of the total, as of year-end 2023. Specifically, the office space within Ivanhoe Village consisted of 42% Class A space, 41% Class B space, and the remaining portion as Class C space.
Although office properties encompassed the greatest amount of commercial space within Ivanhoe Village, these properties had a significantly lower occupancy rate compared to the retail and industrial/flex properties, both of which were fully occupied as of year-end 2023. Moreover, occupancy rates for Ivanhoe Village’s hotel and for-rent multifamily market were 71.3% and 93.1%, respectively, during this same period. In addition, average rental rates for retail properties were significantly higher
than those for office and industrial/flex properties within Ivanhoe Village as of year-end 2023. Comparatively, Ivanhoe Village’s average rental rates for all its commercial real estate markets were greater than those of the City as of year-end 2023.
There were 33 lease transactions that occurred in Ivanhoe Village’s office and retail markets—resulting in a total of approximately 55,550 sq. ft. leased during 2023. Leasing activity refers to the volume of square footage that is committed to and actually signed in a given period of time, including direct leases, subleases, and renewals of existing leases.
Gross absorption measures the total sq. ft. occupied within existing buildings over a given period, without accounting for vacated space. As of year-end 2023, Ivanhoe Village’s total gross absorption equated to 36,102 sq. ft. of commercial space. In addition, Ivanhoe Village’s for-rent multi-family residential market experienced negative absorption of 10 units during this same time frame.
The following pages illustrate major development activities, year-over-year snapshots, and five-year annual trends for Ivanhoe Village’s commercial real estate market.
Office space remained unchanged from the prior year, at 2.2 million sq. ft.
Vacancy rates for office properties increased 4.5 percentage points, from 3.4% to 7.9%.
Average rental rates per sq. ft. increased 3.2%, from $27.55 to $28.43.
Leasing activity of office space decreased 32%
Over the past five years, 2019 to 2023, Ivanhoe Village saw the addition of approximately 320,000 sq. ft. of office space, 19,400 sq. ft. of retail space, and 1,128 for-rent multi-family units within five properties, as illustrated in the graphics below.
Within Ivanhoe Village, there is zero underconstruction activity as of year-to-date 2024, through August 2024. However, during this same time frame, there are 698 for-rent multifamily units proposed within 2 development projects located in Ivanhoe Village.
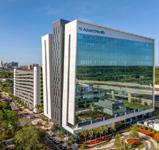
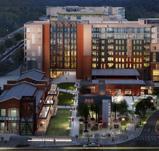
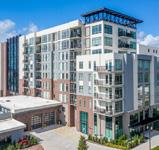
Retail space remained unchanged from the prior year at 330,246 sq. ft.
Vacancy rates for retail properties decreased 1.2 percentage points, from 1.2% to 0.0%.
Average rental rates per sq. ft. increased 1.7%, from $46.25 to $47.03.
Leasing activity of retail space increased 34%
Industrial/flex space remained unchanged from the prior year at 373,003 sq. ft.
Vacancy rates remained unchanged from the prior year at 0.0%.
Average rental rates per sq. ft. remained unchanged at $12.50.
No leasing activity occurred year-over-year.
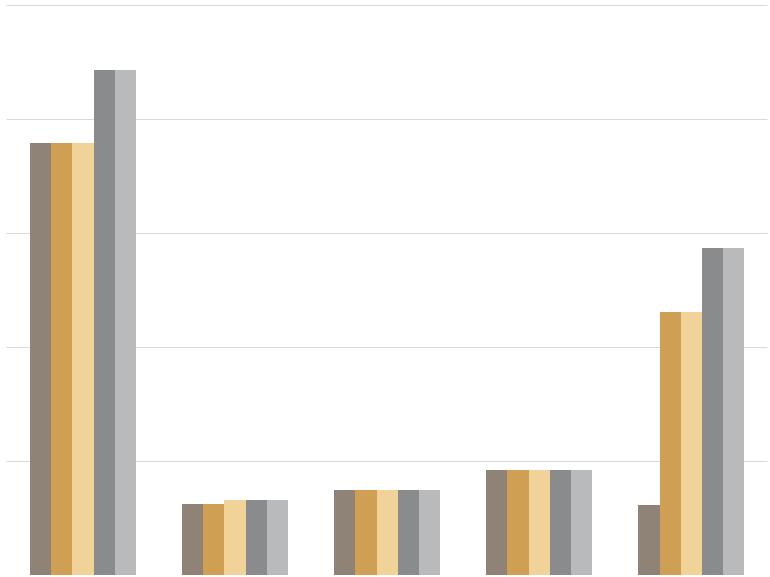
Over the past five years, 2019 to 2023, total inventory of commercial space within Ivanhoe Village experienced increases of 320,000 sq. ft. of office space and 19,392 sq. ft. of retail space, and remained unchanged in industrial/flex space.
During this same time frame, total hotel rooms also remained unchanged; whereas, multi-family inventory increased by 1,128 units within Ivanhoe Village.
Comparatively, the new inventory within Ivanhoe Village over the past five years accounted for 12% of the City’s new office space and 11% of the City’s new retail space.
Hotel inventory remained unchanged from the prior year at 463 rooms.
Vacancy rates for hotel properties decreased 0.9 percentage points, from 29.6% to 28.7%.
Average daily rate (“ADR”) for hotel rooms increased 2.6%, from $143.96 to $147.75.
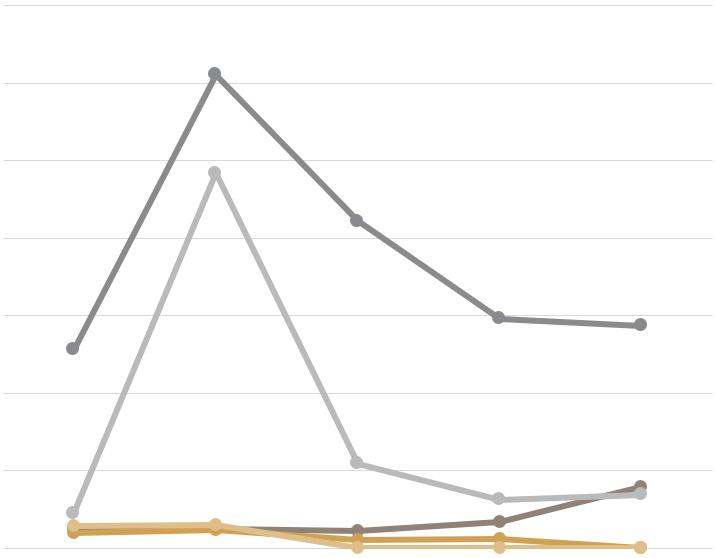
Over the past five years, Ivanhoe Village saw slight vacancy rate increases of 5.4, 3.1, and 2.4 percentage points in the office, hotel, and for-rent multi-family markets, respectively. Rising vacancy rates are likely due to a shortage of desirable rental spaces and high rental costs exceeding what the local market can afford. However, notable increases from 2020-2022 may also be a result of the COVID-19 pandemic. In contrast, Ivanhoe Village’s retail and industrial/flex markets experienced a 1.9 and 2.8 percentage point decline in vacancy rates, respectively, over the past five years—which may be attributed to an increase in spending and demand for rentable spaces.
For-rent multi-family units remained unchanged from the prior year at 1,438 units.
Vacancy rates increased 0.7 percentage points for multi-family properties, from 6.2% to 6.9%.
Average rental rates per unit decreased 5.0%, from $2,342 to $2,226.
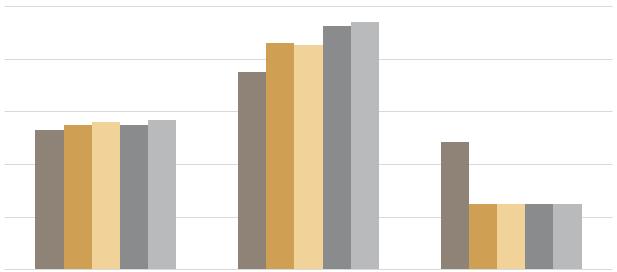
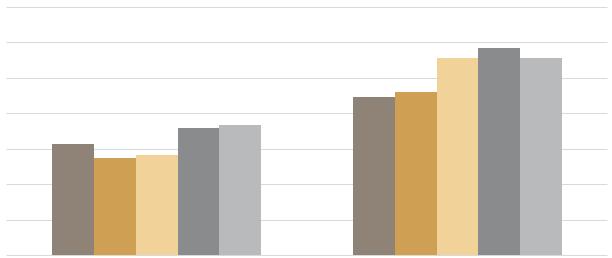
Over the past five years, 2019 to 2023, the average rental rates per sq. ft. for commercial space within Ivanhoe Village experienced increases of 7.3% for office and 25% for retail. During this same time frame, average daily rates for hotel rooms increased 17% and average rental rates per unit for multi-family increased 25%. Increases in average rental rates may be attributed to rising operating and fixed costs, as well as properties in desirable locations or with premium amenities that can command higher rents.
The Milk District Main Street (“Milk District”), part of the Main Street America program, still centered around its origins in dairy, has transformed into a vibrant community filled with small businesses, residents, and visitors. Covering about 320 acres, the Milk District is bordered by State Road 50 (East Colonial Drive) to the north, the Orlando Executive Airport to the east, State Road 408 to the south, and North Bumby Avenue to the west, and is conveniently located near downtown Orlando, as illustrated in the map on the following page.
The Milk District is a vibrant cultural hub known for its progressive lifestyle and thriving music and arts scene. It offers a variety of culinary experiences, colorful murals, recreational sports and music venues, unique shopping spots, community gardens, award-winning bars, and coffee shops.
The Milk District’s mission is to be a vibrant and dynamic neighborhood for locals, attracting regional visitors and becoming a must-see destination for those exploring the City. As a hub of creativity and culture in the heart of Orlando, the district aims to lead the region with authentic cultural experiences, destination dining, live entertainment, outdoor activities, and an innovative workforce. By embracing its grassroots spirit and gritty character, the Milk District collaborates with independent businesses to foster community and human connections that enhance daily life.
To support this mission, the Milk District is dedicated to promoting policies and practices of cultural equity that foster a just, inclusive, and equitable community. It embraces a transformative strategy guided by three main principles: (1) Dining, Arts, and Entertainment, (2) Health, Wellness, and the Environment, and (3) Tourists and Tourism.
At the heart of the Milk District’s historic landmarks is the T.G. Lee Dairy, founded in 1925 by Thomas Gilbert Lee to produce dairy products for Central Florida, and the Beefy King Restaurant, a familyowned restaurant that has been a staple for the City since 1968.
In addition, the Milk District is well-known for its live music venue, the historic Plaza LIVE. Constructed in 1963 as the City’s first two-screen movie theater, it is now Orlando’s premier live concert venue, hosting a wide range of concerts, comedians, and cultural events. Converted into a live-performance venue in the early 1990s, it has since opened its doors to many new artists and talent, becoming the third largest seated venue in Central Florida. For additional entertainment, the Milk District also contains the Orlando Skate Park, Primrose Lanes Restaurant and Bowling Club, and the Festival Park Community Garden, which has urban plots where visitors can grow and take home their own vegetables and herbs.
Bordering the Milk District to the west is the Orlando Executive Airport. Officially opened in 1928 as Orlando Municipal Airport, it initially offered Pan Am service to Cuba and Puerto Rico. In 1940, the US Army Corps took control for military training, renaming it Orlando Air Base. The City resumed control in 1946, with commercial service from Delta, Eastern, and National airlines. After the opening of Orlando International Airport, it became primarily a general and corporate aviation airport, and was renamed Orlando Executive Airport in 1982. Today, it has two fixed base operators, Atlantic and Sheltair, providing various services to private and corporate aircraft for both based and itinerant customers.
The Milk District’s 2023 Annual Report highlights that the Milk District Main Street invested over $2.5 million into the district, with 5.7% coming from private investments. The district also welcomed 13 new businesses, created 120 jobs, and benefited from 1,589 volunteer hours contributed by residents and businesses.
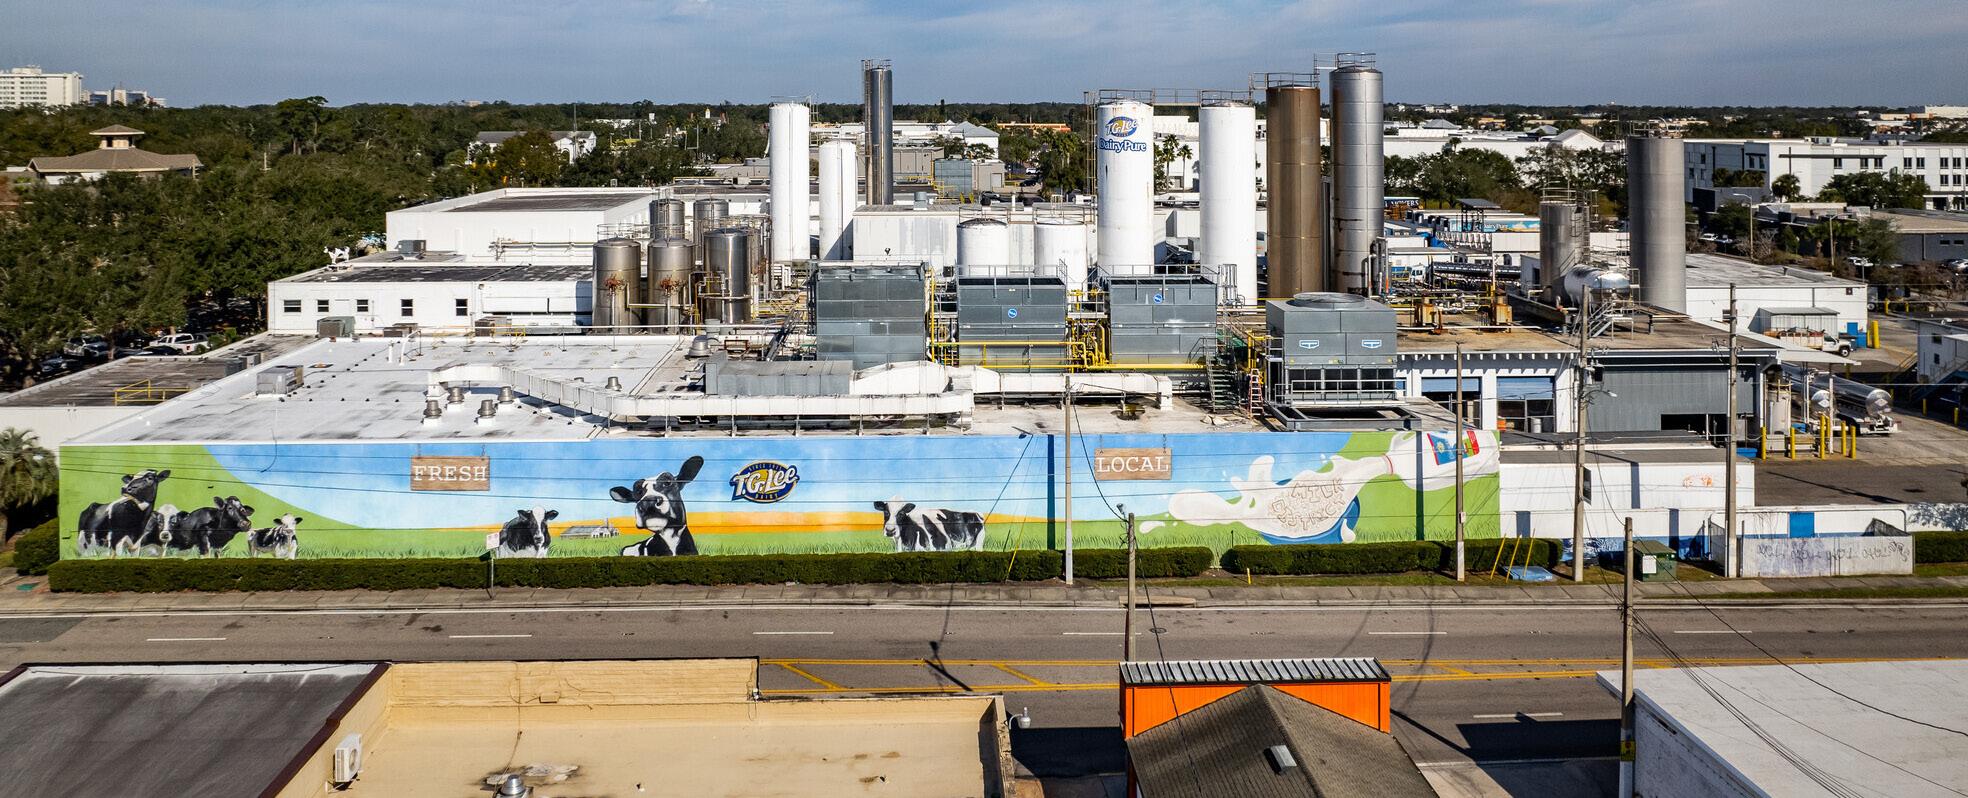
Legend
City of Orlando
Milk District
Main Street
Orlando Main Streets
The Milk District strives to lead the Central Florida Region as home to authentic cultural experiences, destination dining, live entertainment, outdoor activities, and an innovative workforce. Key priority projects and programs within the Milk District include:
Orlando Parks Master Plan — The City of Orlando Families, Parks, and Recreation (“FPR”) Department is developing a Parks Master Plan to create a citywide network of high-performing, connected green spaces. This includes the 2.5-mile Underhill Path, linking Park of the Americas, Lake Underhill Park, Colonel Joe Kittinger Park, and Festival Park, located in the Milk District.
Plaza LIVE — The venue is currently undergoing a series of renovations aimed at conserving the building’s history and restoring its rooftop spire. Renovations began in 2023 and are anticipated to be completed by the end of 2024.
Bike Milk District — In partnership with the League of American Bicyclists, the Milk District offers Bicycle Friendly Business Certifications and helps cover the costs of branded bike racks for local businesses. This initiative promotes a welcoming atmosphere for bicycling employees, customers, and the community, enhancing access to businesses, health, and wellness, and providing safe transportation options.
Art Box Program — This program promotes local art and enhances the urban environment by inviting artists to transform traffic signal boxes. This initiative beautifies public spaces and fosters community pride and support for local culture.
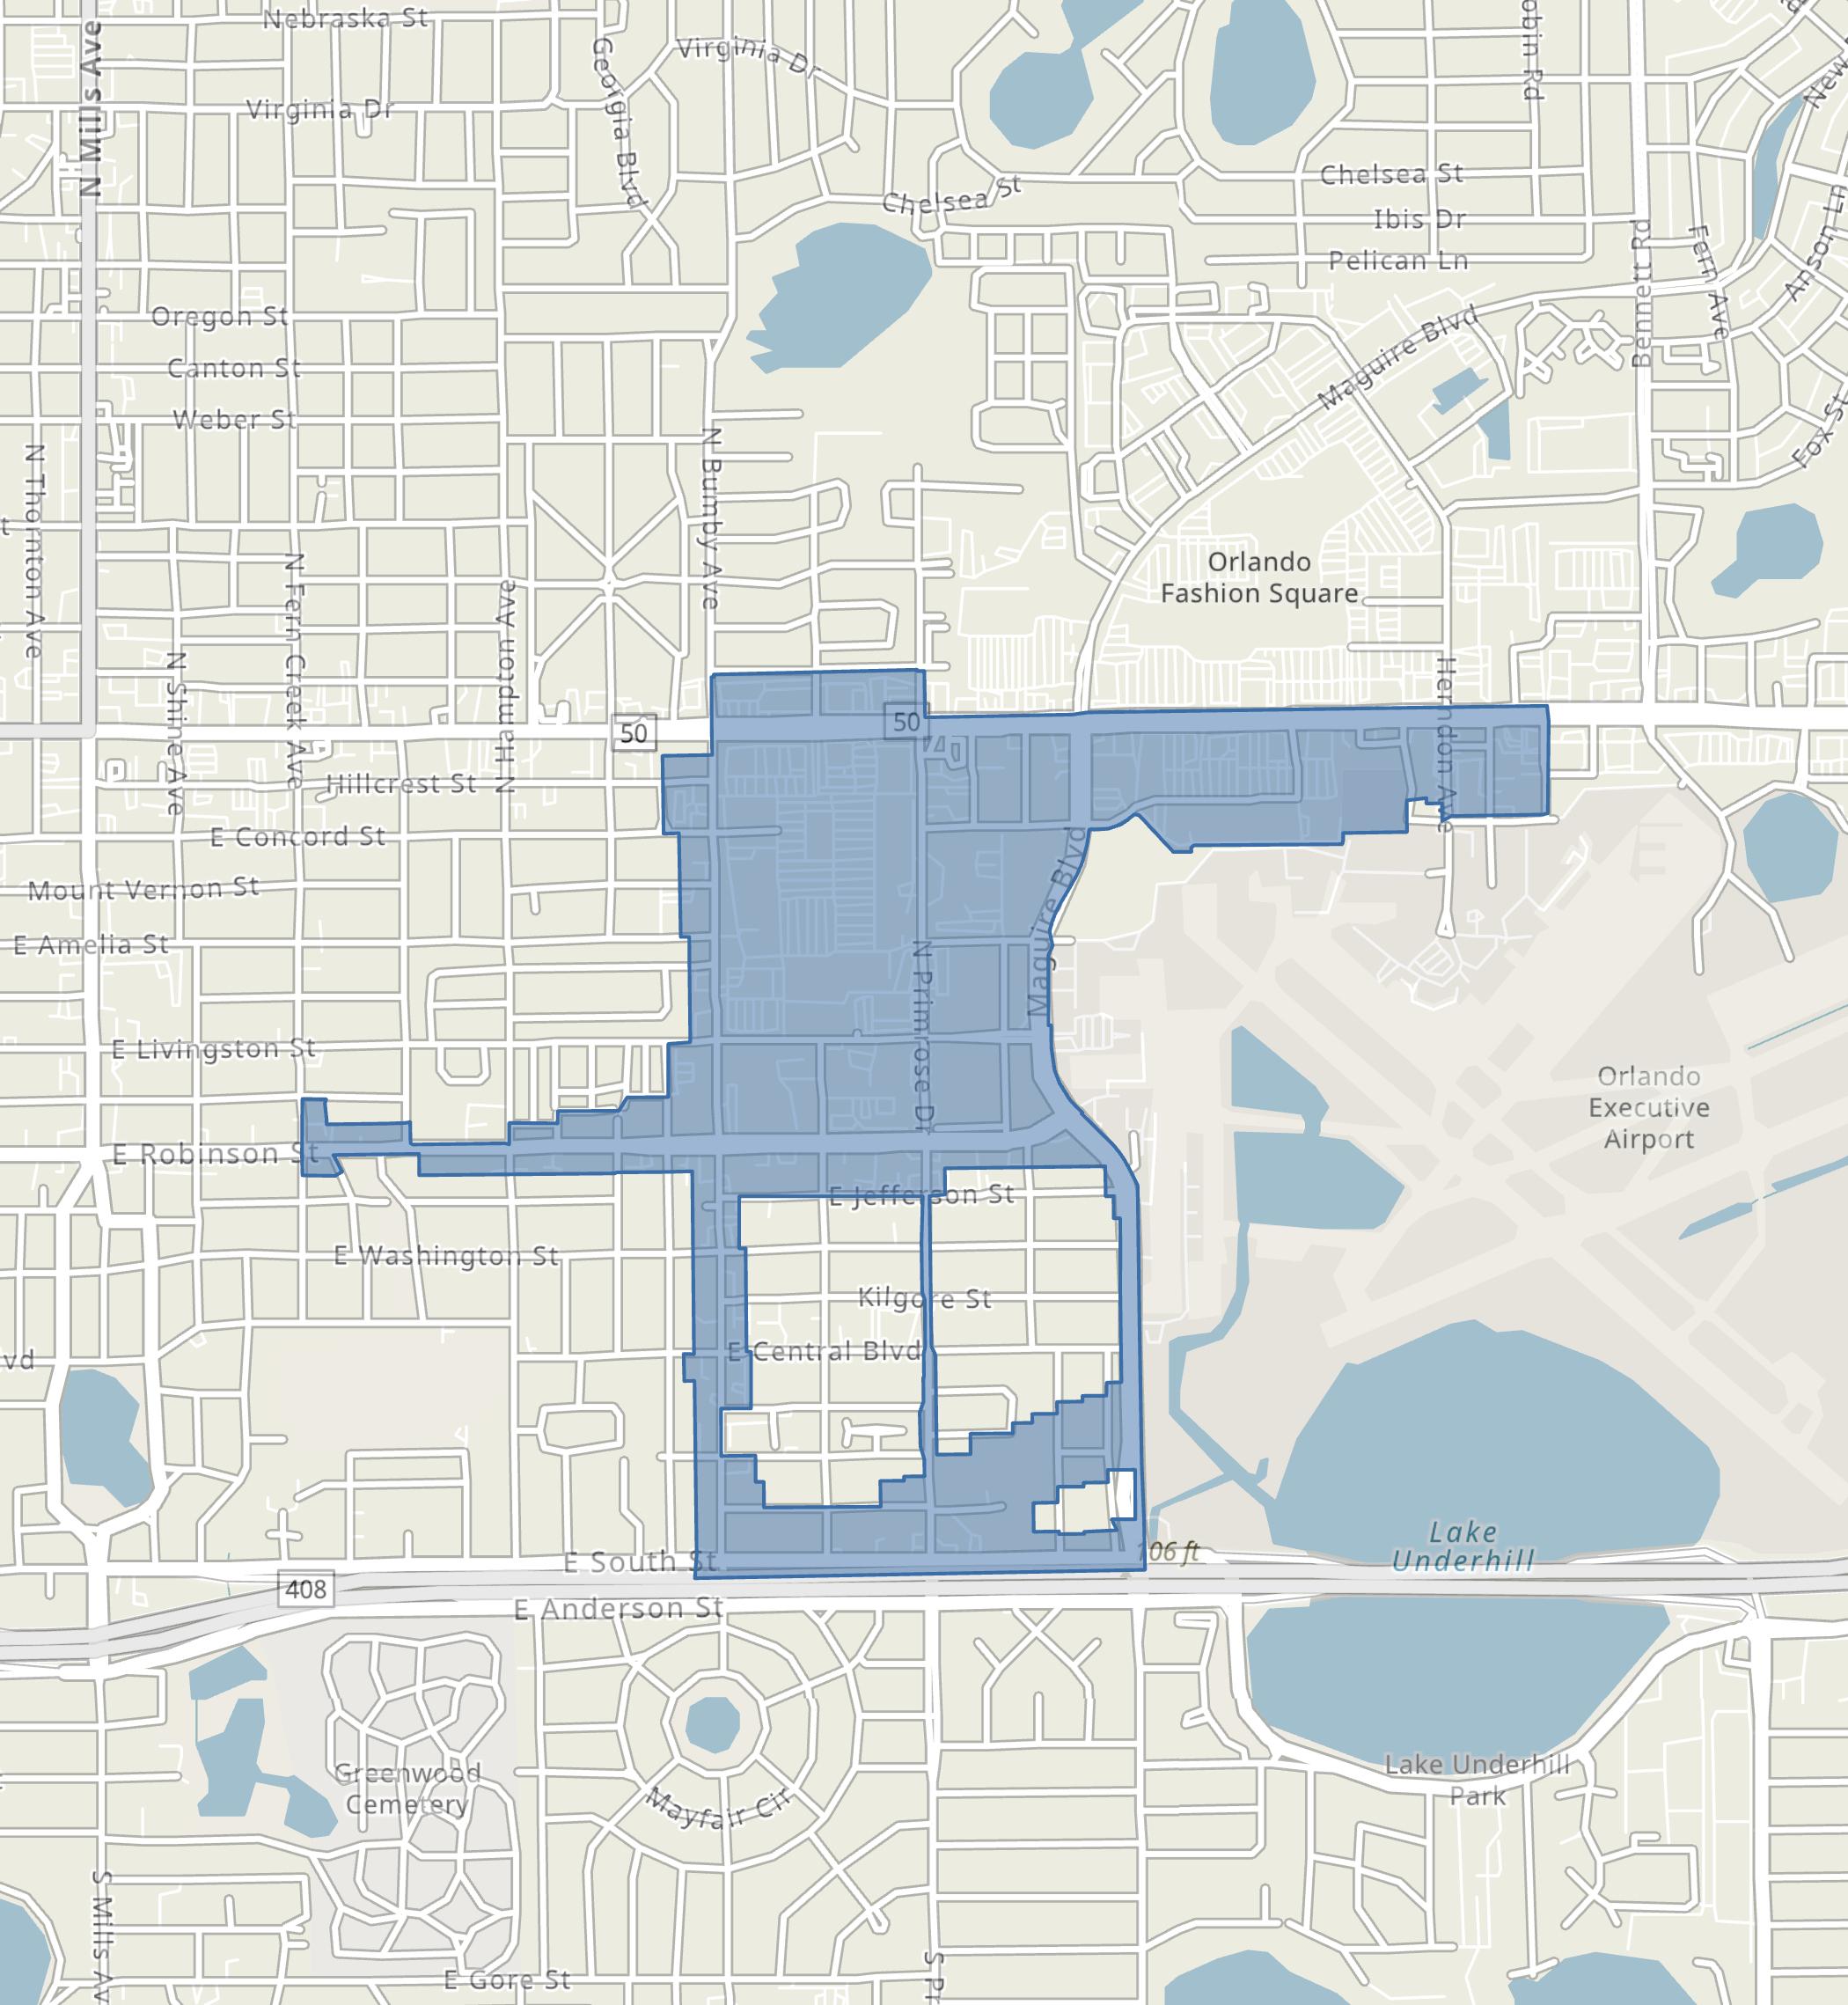
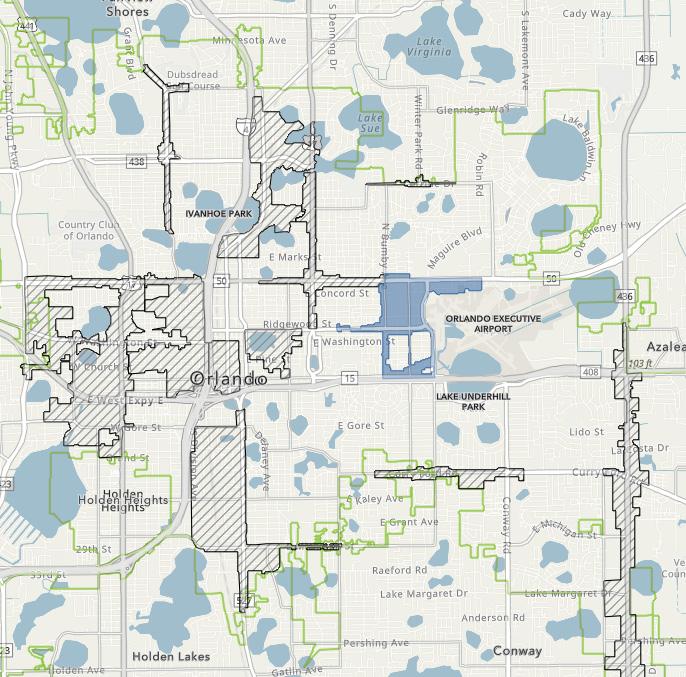
As of year-end 2023, the Milk District’s total employees compose approximately 1.0% of the total employment within the City. The Milk District’s employment sector is primarily dominated by the retail trade, accommodation and food services, and real estate and leasing industries, as illustrated in the table below.
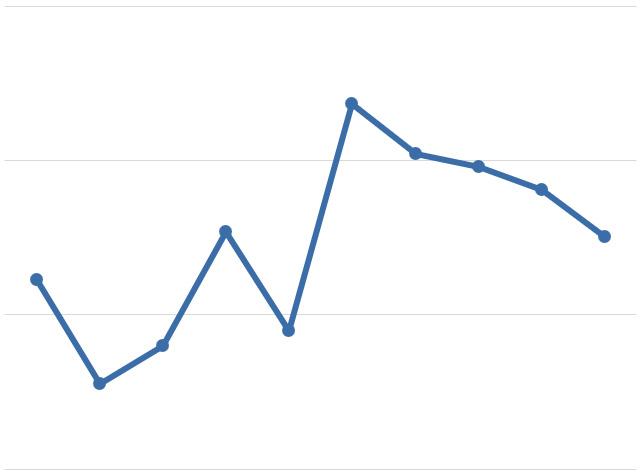
Over the 10-year period, from 2014 to 2023, the Milk District’s total employment has experienced a compound annual growth rate (“CAGR”) of 0.4%. This growth rate is slightly lower than the City’s 2.3% CAGR during the same period. The figure above illustrates the Milk District’s total annual employment trends from 2014 through 2023.
In addition, the Milk District’s total employment increased from 3,613 employees in 2014 to 3,754 employees in 2023—resulting in a net increase of 141 total employees. During this same time frame, the Milk District has captured approximately 0.2% of the City’s total growth in employment.
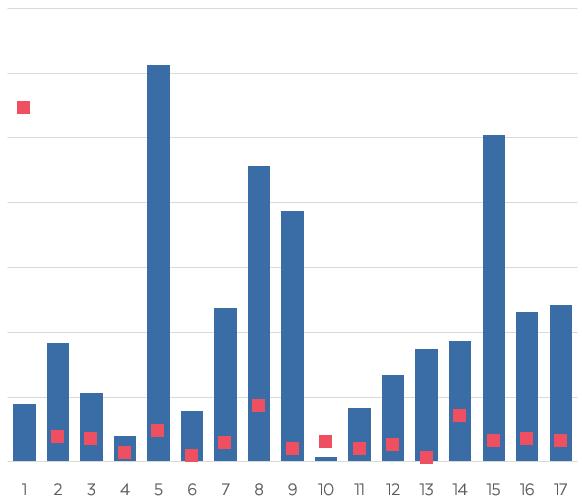
A location quotient (“LQ”) is an analytical statistic that measures how concentrated a particular industry is within an area. The above figure illustrates the concentration of employment by industry sector in the Milk District, as compared to the concentration within the City for year-end 2023. The Milk District has a higher concentration of industry professionals (LQ greater than 1.0) in the agricultural, real estate and leasing, arts and recreation, retail trade, construction, manufacturing, accommodation and food services, other services, public administration, and management of companies industries. The Milk District and the City are equally specialized (LQ equals 1.0) in the information and finance industry.
As of year-end 2023, residents of the Milk District spent an estimated $18.8 million, with 34% allocated to housing, 30% to retail goods, 12% to food (both away from home and at home), 7.8% to health care, and 4.0% to entertainment and recreation. This spending pattern highlights the dominance of housing and retail, which together account for 64% of total expenditures. Additionally, food and health care make up 19.5% of the consumer spending budget, while entertainment and recreation represents the smallest portion of consumer spending. Within the broader context, total expenditures within the Milk District make up approximately 0.2% of the consumer spending within the City, with over $11.421 billion in total expenditures as of year-end 2023.
As of year-end 2023, the Milk District’s for-sale residential market included 42 residential units. Single-family homes made up the majority, at 62%, while residential condominium (“condo”) accounted for 38% of the total. The Milk District’s residential units represent 0.05% of the total single-family residential units and 0.06% of the total residential condos within the City.
The Milk District encompasses portions of two residential condo properties: Church Street Terrace and Glenwood Commons. Total inventory of singlefamily and residential condo residential units within the Milk District remained unchanged over the past five years, 2019 through 2023. As of year-end 2023, the average single-family residential assessed value per unit, at $293,710, and the average taxable value
per unit, at $264,870 were slightly greater than those for residential condo units—with an assessed value per unit of $245,620 and a taxable value per unit of $226,870.
The Milk District experienced zero single-family unit sales and residential condo unit sales in 2023.

As of year-end 2023, the Milk District’s commercial real estate market composed nearly 2.0 million square feet (“sq. ft.”) of office, retail, and industrial/flex space, in addition to 72 forrent market-rate multi-family residential units, as illustrated in the market characteristics table below. The Milk District does not have any hotel rooms as of year-end 2023.
Retail space composed the majority of the Milk District’s office, retail, and industrial/flex inventory at 64% of the total share, followed by office space with 19% of the total as of year-end 2023. Specifically, the office space within the Milk District consisted of zero Class A space, 40% Class B space, and 60% Class C space.
Although retail properties encompassed the greatest amount of space within the Milk District, these properties had significantly lower occupancy rates compared to the office and industrial/flex properties, with occupancy rates of 99.3% and 100%, respectively, as of year-end 2023. Moreover, occupancy rates for the Milk District’s for-rent multi-family market was 96.5% during this same period. In addition, the Milk District’s average rental rates for its office, retail, and industrial/flex properties were greater than
those for the City as of year-end 2023; whereas, the district’s for-rent multi-family markets had average rental rates lower than those of the City during this same time period.
There were 10 lease transactions that occurred within the Milk District’s office, retail, and industrial/flex markets—resulting in a total of approximately 28,000 sq. ft. leased during 2023. Leasing activity refers to the volume of square footage that is committed to and actually signed in a given period of time, including direct leases, subleases, and renewals of existing leases.
Gross absorption measures the total sq. ft. occupied within existing buildings over a given period, without accounting for vacated space. As of year-end 2023, the Milk District’s total gross absorption equated to 44,587 sq. ft. of commercial space. In addition, the Milk District’s for-rent multi-family residential market experienced zero absorption during this same time frame.
The following pages illustrate major development activities, year-over-year snapshots, and five-year annual trends for the Milk District’s commercial real estate market.
Office space remained unchanged from the prior year at 373,509 sq. ft.
Vacancy rates for office properties decreased 2.3 percentage points, from 3.0% to 0.7%.
Average rental rates per sq. ft. increased 19%, from $23.99 to $28.51.
Leasing activity for office space decreased 75%
Over the past five years, 2019 to 2023, the Milk District saw the addition of approximately 2,550 sq. ft. of new office space, 2,380 sq. ft. of retail space, and 3,840 sq. ft. of industrial/flex space within three properties.
In addition, there is one market-rate multifamily apartment property currently underconstruction within the Milk District as of year-to-date 2024, through August 2024. The following graphics illustrate the new construction activity within the Milk District over the past five years.
Retail space remained unchanged from the prior year at 1.27 million sq. ft.
Vacancy rates for retail properties increased 2.3 percentage points, from 4.0% to 6.3%.
Average rental rates per sq. ft. increased 50%, from $29.23 to $45.95.
Leasing activity of retail space decreased 54%
Industrial/flex space increased 1.1% from the prior year, from 343,802 sq. ft. to 347,642 sq. ft.
Vacancy rates remained unchanged from the prior year at 0.0%.
Average rental rates per sq. ft. increased 48%, from $16.95 to $25.00.
Leasing Activity increased 105% from the prior year.
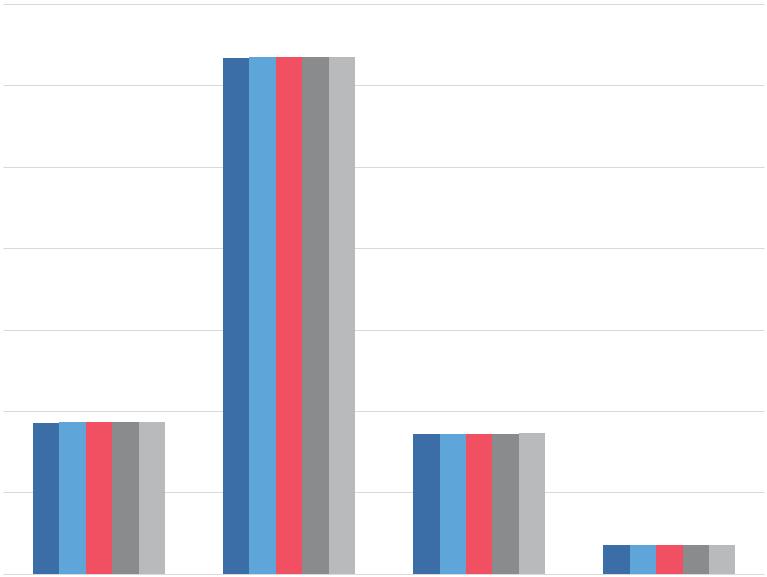
Over the past five years, 2019 to 2023, total inventory of commercial space within the Milk District experienced increases of 2,552 sq. ft. of office space, 2,377 sq. ft. of retail space, and 3,840 sq. ft. in industrial/flex space. During this same time frame, total rental multi-family residential units inventory remained unchanged and no hotel rooms were constructed within the Milk District.
Comparatively, the new inventory within the Milk District over the past five years accounted for 0.1%, 1.3%, and 0.01% of the City’s new office, retail, and industrial/flex space, respectively.
There are zero hotel rooms located within the Milk District as of year-end 2023, therefore performance data is not available for this property use.
For-rent multi-family units remained unchanged from the prior year at 72 units.
Vacancy rates increased 0.4 percentage points for multi-family properties, from 3.1% to 3.5%.
Average rental rates per unit increased 1.6%, from $1,589 to $1,615.
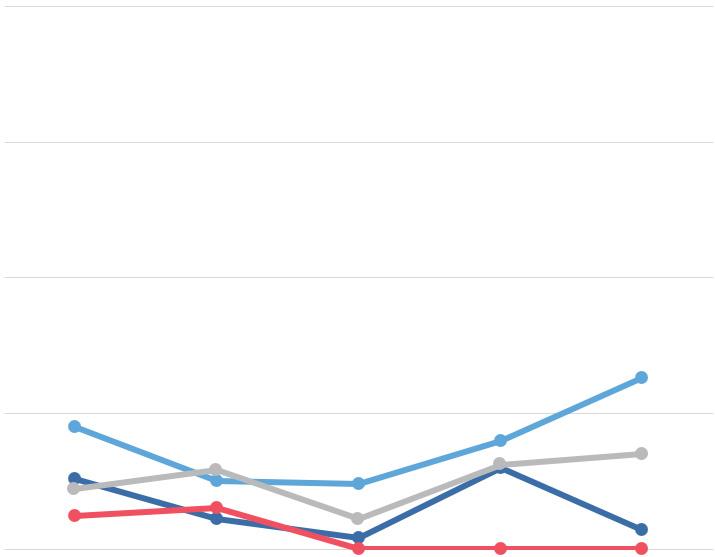
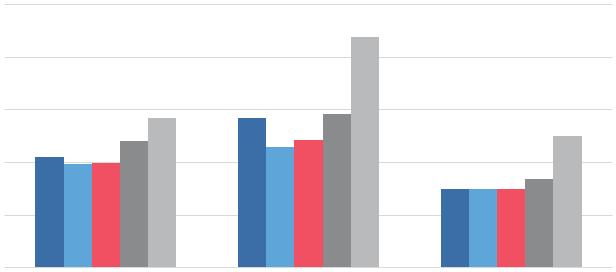
Vacancy rates within the Milk District saw slight increases over the past five years of 1.8 and 1.3 percentage points in the retail and for-rent multifamily markets, respectively. Rising vacancy rates are likely due to a shortage of desirable rental spaces and high rental costs exceeding what the local market can afford. However, notable increases from 2020-2022 may also be a result of the COVID-19 pandemic. In contrast, the Milk District’s office and industrial/flex markets experienced a 1.9 and 1.2 percentage point decline in vacancy rates, respectively, over the past five years—which may be attributed to an increase in demand for rentable office and industrial/flex space.
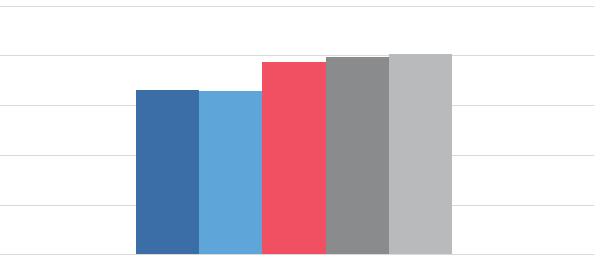
Over the past five years, 2019 to 2023, the average rental rates per sq. ft. for commercial space within the Milk District experienced increases of 36% for office, 54% for retail, and 67% for industrial/flex.
During this same time frame, average rental rates per unit for rental multi-family units increased 22%. Increases in average rental rates may be attributed to rising operating and fixed costs, as well as properties in desirable locations or with premium amenities that can command higher rents.
The Mills 50 District Main Street (“Mills 50 District”), part of the Main Street America program, is recognized as a vibrant intersection of creativity and culture. Covering approximately 173 acres at the crossroads of State Road 50 (Colonial Drive) and U.S. Highway 17 (Mills Avenue), the Mills 50 District offers convenient access for both north-south and east-west commuters, as shown in the map on the following page.
The Mills 50 District is an historic yet forwardthinking neighborhood in Orlando, celebrated for its diverse range of small businesses and its creative, cultural, and inclusive atmosphere. The Mills 50 District features live music venues, distinctive murals, pop-up markets, holistic living services, fitness studios, art spaces, dining options, and craft beverage producers. With its walkable streets, the Mills 50 District seamlessly blends commerce with artistic expression, offering a unique and immersive experience for visitors.
Envisioning a vibrant, walkable neighborhood where commerce thrives in harmony with artistic and cultural expression, the Mills 50 District aims to be Orlando’s most diverse area, blending historic charm with progressive creativity to offer a uniquely sensory experience. To realize this vision, the Mills 50 District focuses on attracting people to the neighborhood by highlighting amenities like live music, distinctive murals, and public art, and a wide range of dining and drinking establishments that celebrate the area’s creative and inclusive culture.
The Mills 50 District’s transformational efforts are driven by five key pillars, including creativity, health, unity, balance, and diversity. These pillars emphasize a blend of creative professionals,
promote healthy lifestyle choices, ensure a strong commitment to property ownership and district improvements, strike a balance between active homeowners and entrepreneurial business owners, and encourage cultural, lifestyle, and architectural diversity throughout the district.
Notable historic developments in the Mills 50 District include the Cameo Theater, built in 1939 as Orlando’s first neighborhood theater. After only a year of operation, the theater closed, and various businesses, including IBM, occupied the building over the years. To restore the building’s original appearance, the City awarded a 50/50 matching grant to aid in the restoration of its historic façade, with renovations completed in 2015. Additionally, the historic Colonial Photo and Hobby, a familyowned business, celebrated 70 years in Central Florida in July 2024. The shop, which moved to 634 N. Mills Avenue in 1973, has expanded to 15,000 square feet and now offers drones and modern cameras alongside its traditional products.
Another significant establishment within the Mills 50 District is Track Shack, which opened in September 1977 at 1313 N. Mills Avenue. Having later moved to its current location at 1104 N. Mills Avenue in July 1996, Track Shack has been recognized as one of the top five specialty running stores in the U.S. This locally-owned store focuses on running and walking, and has become a community hub for fitness, renowned for expert footwear fitting and support for local races. The Track Shack Youth Foundation has contributed over $2 million to Central Florida organizations through grants funded by race proceeds.
The Mills 50 District’s 2023 Annual Report highlights that the Mills 50 Main Street invested nearly $3.0 million into the district, with 8.1% coming from private investments. The district also welcomed 18 new businesses, created 148 jobs, and benefited from 1,901 volunteer hours contributed by residents and businesses.
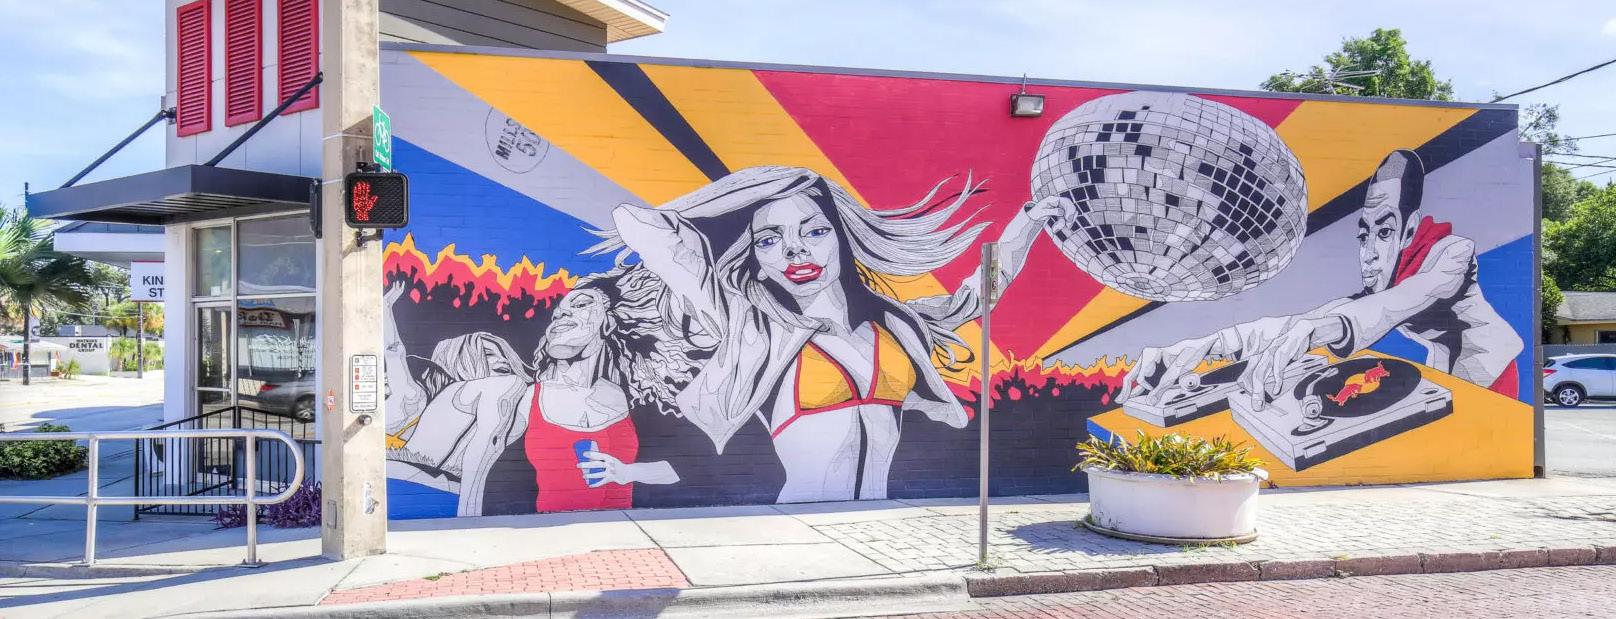
Legend
City of Orlando
Mills 50 District
Main Street
Orlando Main Streets
The Mills 50 District’s mission is to foster Orlando’s most diverse neighborhood by stimulating business, creating a walkable community, and promoting our creative culture. Key priority projects and programs within the Mills 50 District include:

Community Events — The Mills 50 District organizes a variety of community events year-round. Key annual events in the district include Virginia Drive Live, Almost Fall Fest, St. Paddy’s Day Pub Crawl, and Business After Hours, all showcasing local vendors, live music, and food. Additionally, the Mills 50 District hosts numerous popup community events and fundraisers.

Mills 50 Art Projects — The Mills 50 District is celebrated for its numerous Art Projects, which aim to enhance the community’s appeal. These initiatives strive to create an environment that reflects the community’s diversity, creativity, commerce, and neighborhoods. The Art Projects include the Art Box Project, Art Drain Project, and Dumpster Art Project. In collaboration with local artists, electric boxes, storm drains, and dumpsters throughout the district have been creatively repainted. These unique and educational initiatives use art to highlight the function and importance of these structures.
In addition, the Mills 50 District encourages the creation of murals by local artists on blank buildings and infrastructure throughout the district. These Art Projects enhance the aesthetic of the community for all residents and visitors to enjoy.
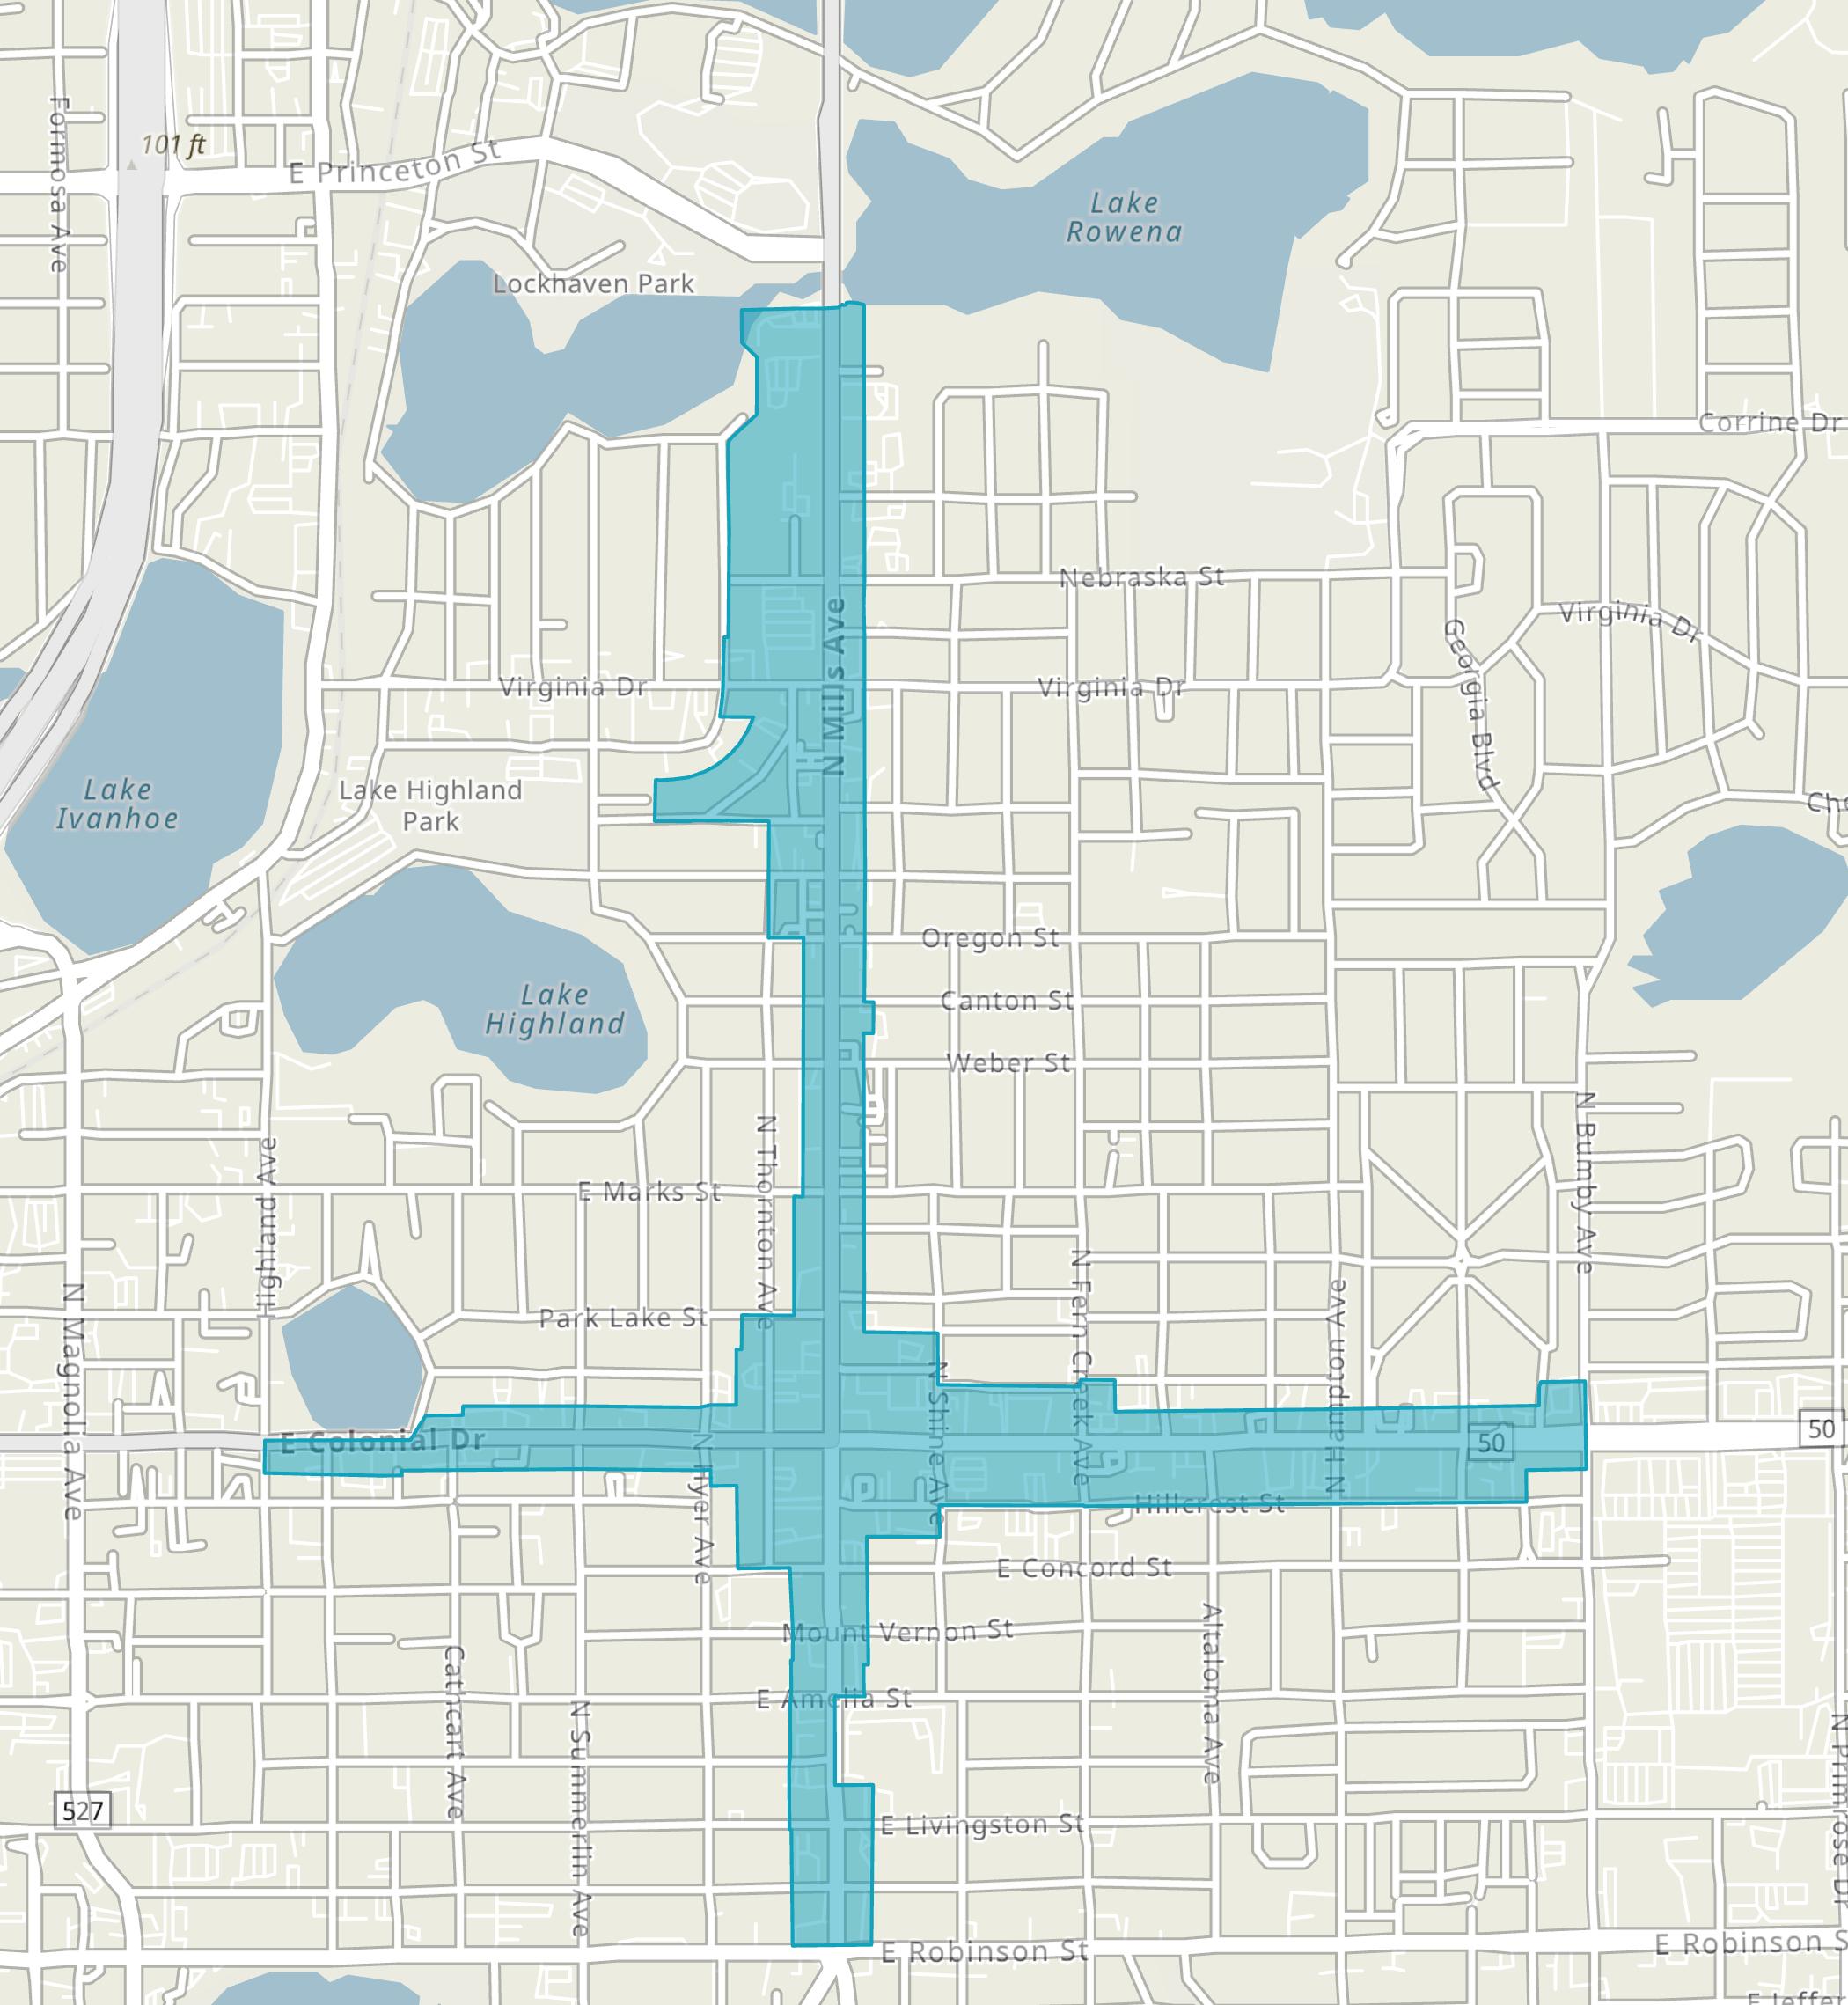
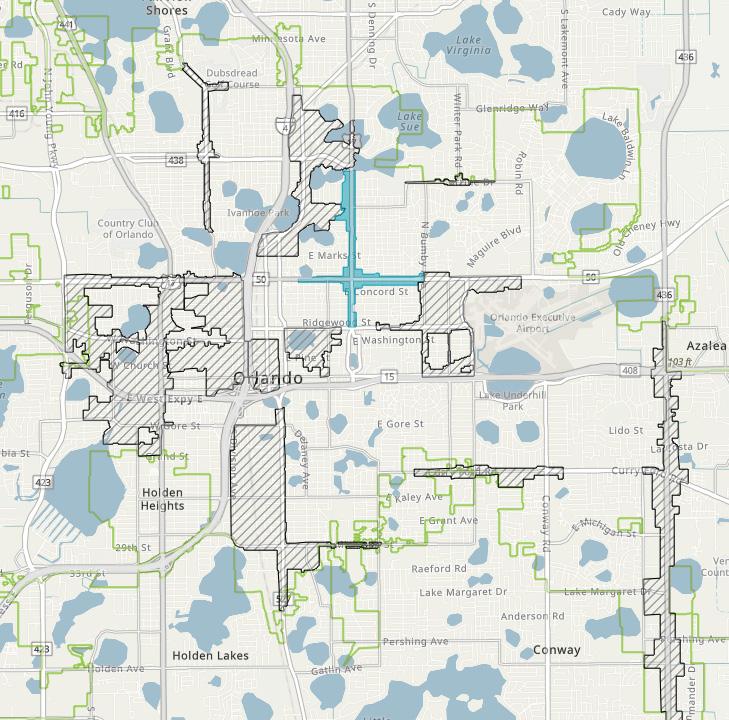
As of year-end 2023, the Mills 50 District’s total employees compose approximately 1.1% of the total employment within the City. The Mills 50 District’s employment sector is primarily dominated by the professional services, other service (excluding public administration), and accommodation and food services industries, as illustrated in the table below.
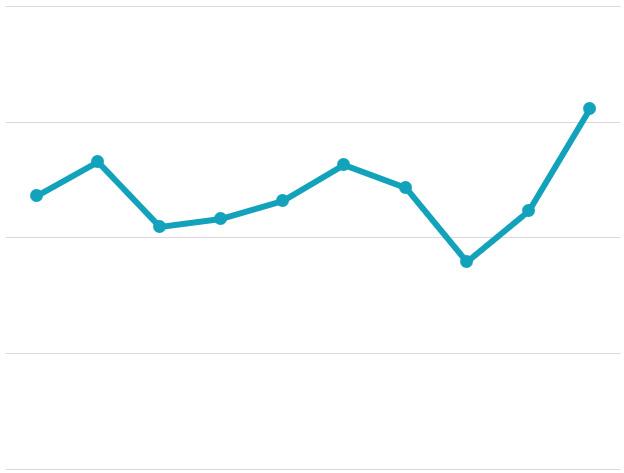
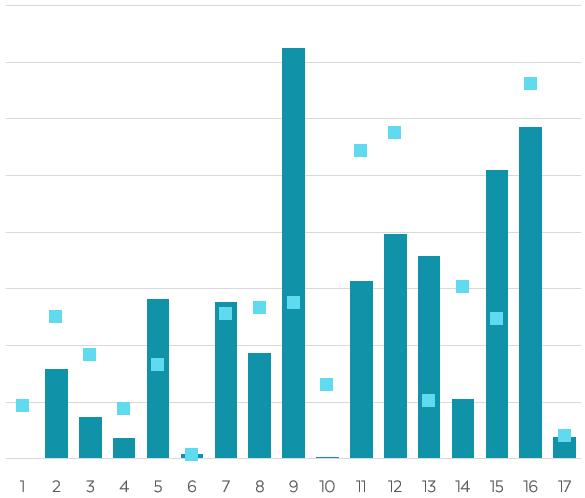
Over the 10-year period, from 2014 to 2023, the Mills 50 District’s total employment has experienced a compound annual growth rate (“CAGR”) of 1.0%. This growth rate is similar to the City’s 2.3% CAGR during the same period. The figure above illustrates the Mills 50 District’s total annual employment trends from 2014 through 2023.
In addition, the Mills 50 District’s total employment increased from 3,681 employees in 2014 to 4,058 employees in 2023—resulting in a net increase of 377 total employees. During this same time frame, the Mills 50 District has captured approximately 0.5% of the City’s total growth in employment.
A location quotient (“LQ”) is an analytical statistic that measures how concentrated a particular industry is within an area. The above figure illustrates the concentration of employment by industry sector within the Mills 50 District, as compared to the concentration within the City for year-end 2023. The Mills 50 District has a higher concentration of industry professionals (LQ greater than 1.0) in the other services, educational services, administration, arts and entertainment, real estate and leasing, professional services, information and finance, construction, and accommodation and food services industries.
As of year-end 2023, residents of the Mills 50 District spent an estimated $35.7 million, with 34% allocated to housing, 31% to retail goods, 12% to food (both away from home and at home), 6.7% to health care, and 4.1% to entertainment and recreation. This spending pattern highlights the dominance of housing and retail, which together account for 65% of total expenditures. Additionally, food and health care make up 18.4% of the consumer spending budget, while entertainment and recreation represents the smallest portion of consumer spending. Within the broader context, total expenditures within the Mills 50 District make up approximately 0.3% of the consumer spending within the City, with over $11.421 million in total expenditures as of year-end 2023.
As of year-end 2023, the Mills 50 District’s for-sale residential market included 176 residential units. Residential condominium (“condo”) units made up the majority, at 96%, while single-family homes accounted for only 4.0% of the total. The Mills 50 District’s residential units represent 0.01% of the total single-family residential units and 0.6% of the total residential condos within the City.
The Mills 50 District encompasses one residential condo property, Park Lake Towers. Total inventory of single-family and residential condo residential units within the Mills 50 District have remained unchanged over the past five years, 2019 through 2023.
As of year-end 2023, the average single-family residential assessed value per unit at $304,430 and the taxable value per unit at $297,280 were both significantly greater than those of residential condo units—with an assessed value per unit of $165,030 and a taxable value per unit of $141,670.
In addition, the Mills 50 District experienced a total of 8 residential condo unit sales in 2023. The Mills 50 District’s residential unit sales represent 0.5% of the total residential condo unit sales within the City, as illustrated in the following table.
By the end of 2023, total sales price for residential condo units were just under $1.5 million. Additionally, as of year-end 2023, the average sales price per sq. ft. for residential condo unit sales within the Mills
50 District, at $187.32 per sq. ft., was slightly smaller compared to the residential condo unit sales within the City, at $222.78 per sq. ft.
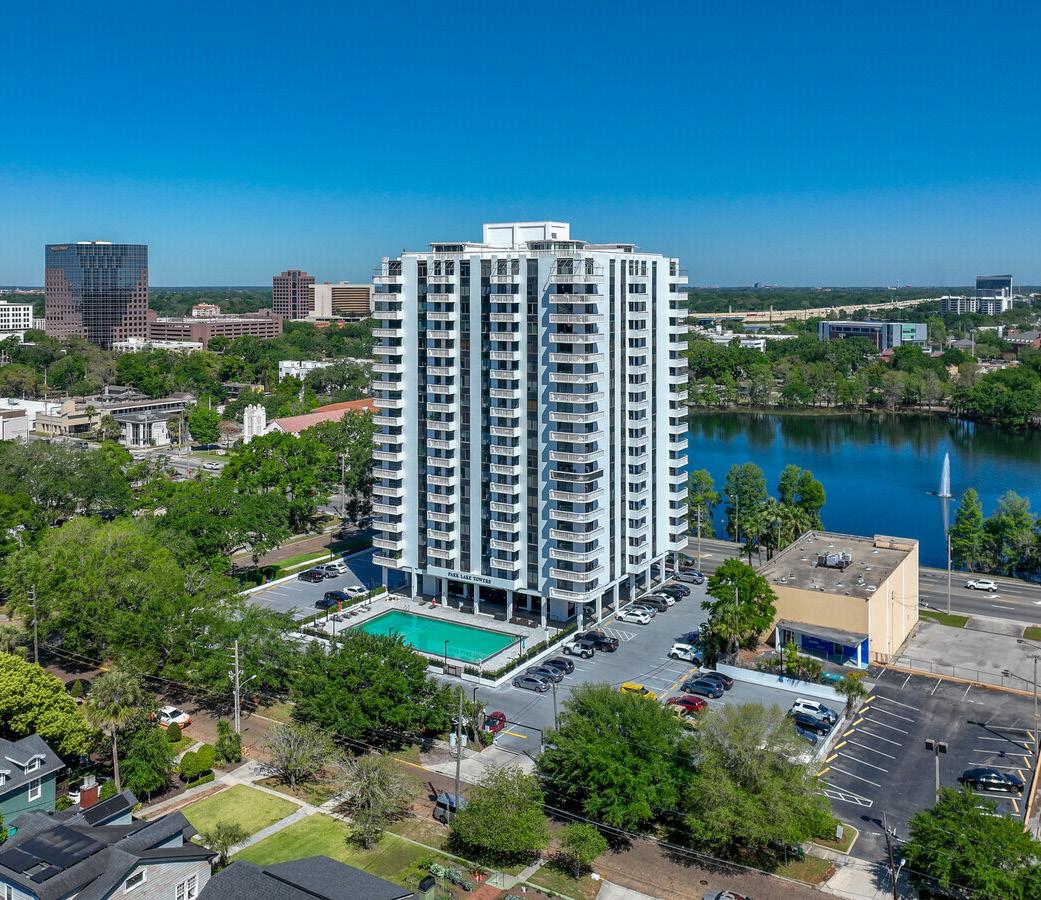
As of year-end 2023, the Mills 50 District’s commercial real estate market composed nearly 1.75 million square feet (“sq. ft.”) of office, retail, and industrial/flex space, and 567 for-rent marketrate multi-family residential units, as illustrated in the market characteristics table below. The Mills 50 District does not have any hotel rooms.
Office space composed the majority of Mills 50’s office, retail, and industrial/flex inventory at 57% of the total share, as of year-end 2023. Specifically, the office space within the Mills 50 District consisted of 9.2% Class A space, 41% Class B space, and 50% Class C space.
Office properties within the Mills 50 District had a slightly lower occupancy rate compared to the retail and industrial/flex properties, with occupancy rates of 98.9% and 100%, respectively, as of yearend 2023. Moreover, occupancy rates for the Mills 50 District’s for-rent multi-family market was 55% during this same period; this can be attributed to the Alexan Mills 50 Apartment, which opened in 2023 and is still in lease-up.
In addition, the Mills 50 District’s average rental rates for its office properties were lower than those for the City as of year-end 2023; whereas, the
Mills 50 District’s retail and for-rent multi-family markets had average rental rates greater than those of the City during this same time period.
There were 25 lease transactions that occurred in the Mills 50 District’s commercial real estate market—resulting in a total of approximately 43,000 sq. ft. leased during 2023. Leasing activity refers to the volume of square footage that is committed to and actually signed in a given period of time, including direct leases, subleases, and renewals of existing leases.
Gross absorption measures the total sq. ft. occupied within existing buildings over a given period, without accounting for vacated space.
As of year-end 2023, the Mills 50 District’s total gross absorption equated to 141,400 sq. ft. of commercial space. In addition, the Mills 50 District’s for-rent multi-family residential market experienced positive absorption of 7 units during this same time frame.
The following pages illustrate major development activities, year-over-year snapshots, and five-year annual trends for the Mills 50 District’s commercial real estate market.
Leasing activity of office space decreased 68%
Over the past five years, 2019 to 2023, the Mills 50 District saw the addition of approximately 71,000 sq. ft. of office space, 12,750 sq. ft. of retail space, and 245 for-rent multi-family units within five properties. In addition, there is approximately 85,600 sq. ft. of office space currently under-construction within the Mills 50 District as of year-to-date 2024, through August 2024. The following graphics illustrate the new construction activity within the Mills 50 District over the past five years.
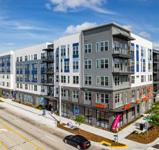
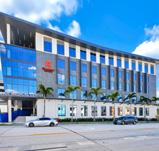
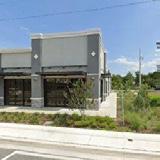
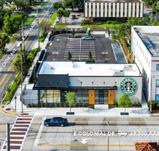
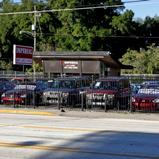
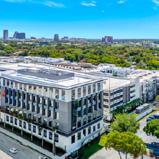
Retail space increased 1.0% from the prior year, from 710,037 sq. ft. to 717,237 sq. ft.
Vacancy rates increased 1.0 percentage points, from 0.1% to 1.1%.
Average rental rates per sq. ft. decreased 9.1%, from $39.63 to $ 36.02.
Leasing activity of retail space decreased 87%
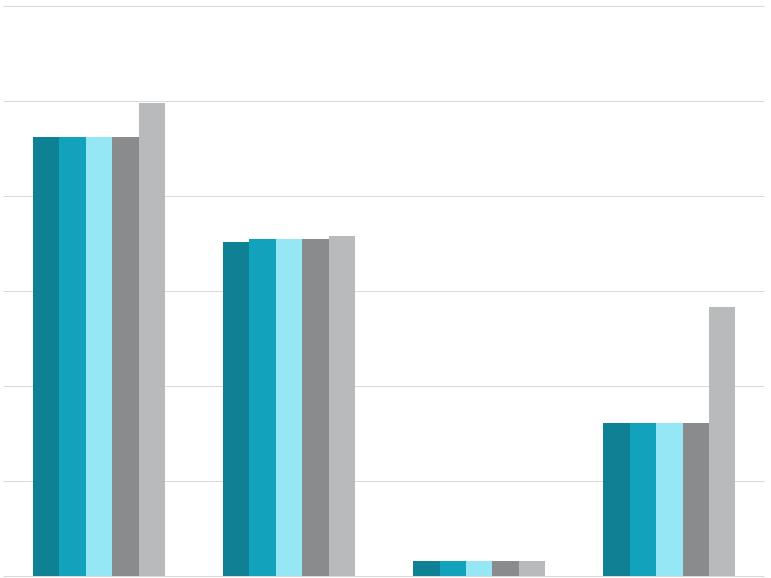
Over the past five years, 2019 to 2023, total inventory of commercial space within Mills 50 experienced increases of 71,000 sq. ft. of office space and 12,750 sq. ft. of retail space; whereas, industrial/flex space remained unchanged. During this same time frame, total rental multi-family residential units inventory increased by 245 units within the Mills 50 District with the addition of the Alexan Mills 50 built in 2023.
Comparatively, the new inventory within Mills 50 over the past five years accounted for 2.9% of the City’s new office space, 1.9% of the City’s new retail space, and 2.0% of the City’s new rental units.
Industrial/flex space remained unchanged from the prior year, at 31,400 sq. ft.
Vacancy rates for industrial/flex properties remained unchanged at 0.0%.
There is no data available on rental rates or leasing activity for industrial/flex properties.
There are zero hotel rooms located within the Mills 50 District as of year-end 2023, therefore performance data is not available for this property use.
For-rent multi-family units increased 76.1% from the prior year, from 322 units to 567 units.
Vacancy rates increased 39.6 percentage points for multi-family properties, from 5.2% to 44.8%.
Average rental rates per unit decreased 3.5%, from $2,146 to $2,071.
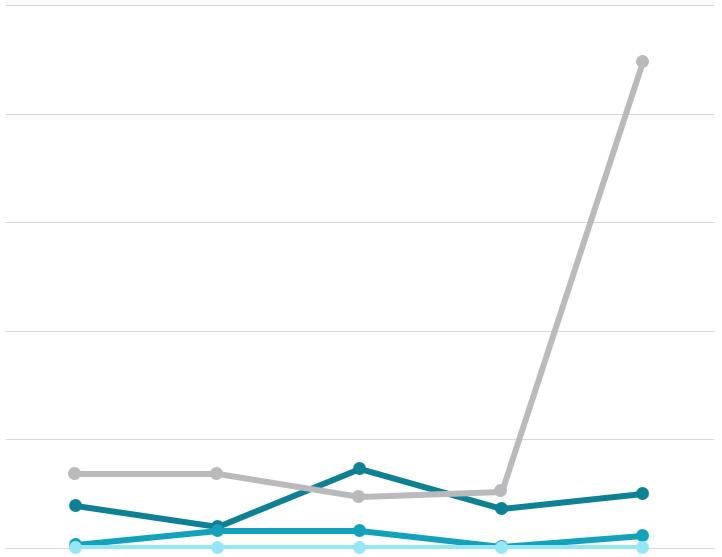
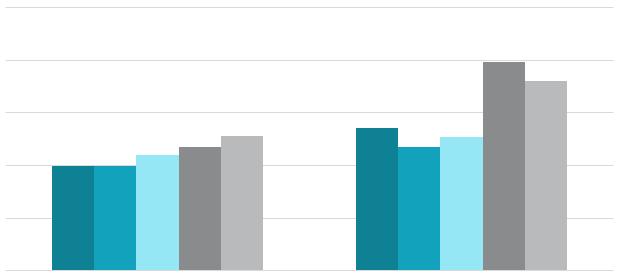
Over the past five years, the Mills 50 District saw slight vacancy rate increases of 1.1 and 0.8 percentage points in the office and retail market, respectively. Rising vacancy rates are likely due to a shortage of desirable rental spaces and high rental costs exceeding what the local market can afford. However, notable increases from 2020-2022 may also be a result of the COVID-19 pandemic. Comparatively, the Mills 50 District’s for-rent multi-family market experienced a significant increase in vacancy rates over the past five years of 38 percentage points, which may be attributed to the recently completed Alexan Mills 50 still being in lease-up as of 2023.
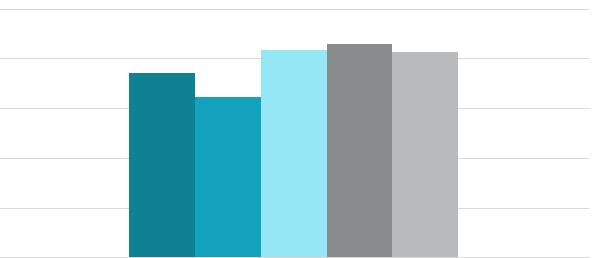
Over the past five years, 2019 to 2023, the average rental rates per sq. ft. for commercial space within the Mills 50 District have experienced increases of 29% and 33% for office and retail properties, respectively. During this same time frame, average rental rates per unit for multi-family increased by 12%. Increases in average rental rates may be attributed to rising operating and fixed costs, as well as properties in desirable locations or with premium amenities that can command higher rents.
The SoDo District Main Street (“SoDo District”), part of the Main Street America program, is a business district nestled among many of Orlando’s historic neighborhoods, renowned for their lakes, walkable parks, and charming streets. Spanning approximately 582 acres and bisected by State Road 527 (South Orange Avenue) and Michigan Street, the SoDo District enjoys a convenient location near other major thoroughfares like Interstate 4 and State Road 408, as illustrated in the map on the following page.
Neighbors, property owners, and merchants have come together to revitalize the Orange Avenue and Michigan Street corridors, celebrating a vibrant community where residents live, shop, work, and play. With numerous renovations and additions to the commercial district, the SoDo District is emerging as a thriving market. Small retail and mixed-use projects are giving the area a fresh, positive look and feel. While many large retail chains have recently invested in the SoDo District, a generous number of boutiquestyle shops and mom-and-pop restaurants continue to offer diverse options.
The mission of the SoDo District is to enhance the community through thoughtful design, empowering local businesses and residents to collaborate and create a vibrant environment to live, work, and play. The SoDo District’s mission emphasizes honoring the district’s history while fostering diversity and growth as a regional economic engine. The goal of the SoDo District is to continue revitalizing the commercial corridors along Orange Avenue and Michigan Street, celebrating a lively, walkable community.
At the core of the SoDo District is Orlando Health, one of Orlando’s most established hospital networks, which has been a cornerstone of the community since 1918. For over a century, Orlando Health’s Orlando
Regional Medical Center (“ORMC”) has offered the most advanced surgical, medical, rehabilitative, and emergency care options, including Central Florida’s only Level 1 Trauma Center.
ORMC, the flagship hospital of Orlando Health (“OH”), meets the region’s growing healthcare needs. Its Burn Center, one of the few in Florida, is designated as a Verified Burn Center by the American Burn Association. ORMC is also certified by the Joint Commission as an Advanced Comprehensive Stroke Center and in Hip, Knee, and Spine Surgery programs. Additionally, ORMC collaborates with system-wide institutes for cancer, heart and vascular, digestive health, neuroscience, and orthopedics, all based in the downtown Orlando campus. It also partners with the OH Arnold Palmer Hospital for Children, the OH Heart & Vascular Institute, the OH Winnie Palmer Hospital for Women & Babies, and the recently complete OH Jewett Orthopedic Institute. Various outpatient diagnostic and treatment procedures are available at on-campus facilities, including the Orlando Health Ambulatory Care Center.
Located on the southern edge of ORMC’s campus, Lake Beauty Park, inspired by the ORMC campus vision, creates a clean, healthy, and engaging environment, blending the architecture with natural elements. It features street-side stormwater bioretention planters, littoral planting, paved walking paths, and scenic views.
Lastly, the SoDo Shopping Center is another key development within the district. Situated on a former industrial site, this 22-acre mixed-use development features 300 multi-family units, 75,000 sq. ft. of office space, and a 255,000 sq. ft. shopping center. The SoDo Shopping Center also hosts various annual community events, such as Light Up SODO, Haunting on Main, and the CardBoard Art Festival.
SoDo’s 2023 Annual Report highlights that the SoDo Main Street invested over $48.2 million into the district, with 0.2% coming from private investments. The district also welcomed 16 new businesses, created 495 jobs, and benefited from 1,567 volunteer hours contributed by residents and businesses.
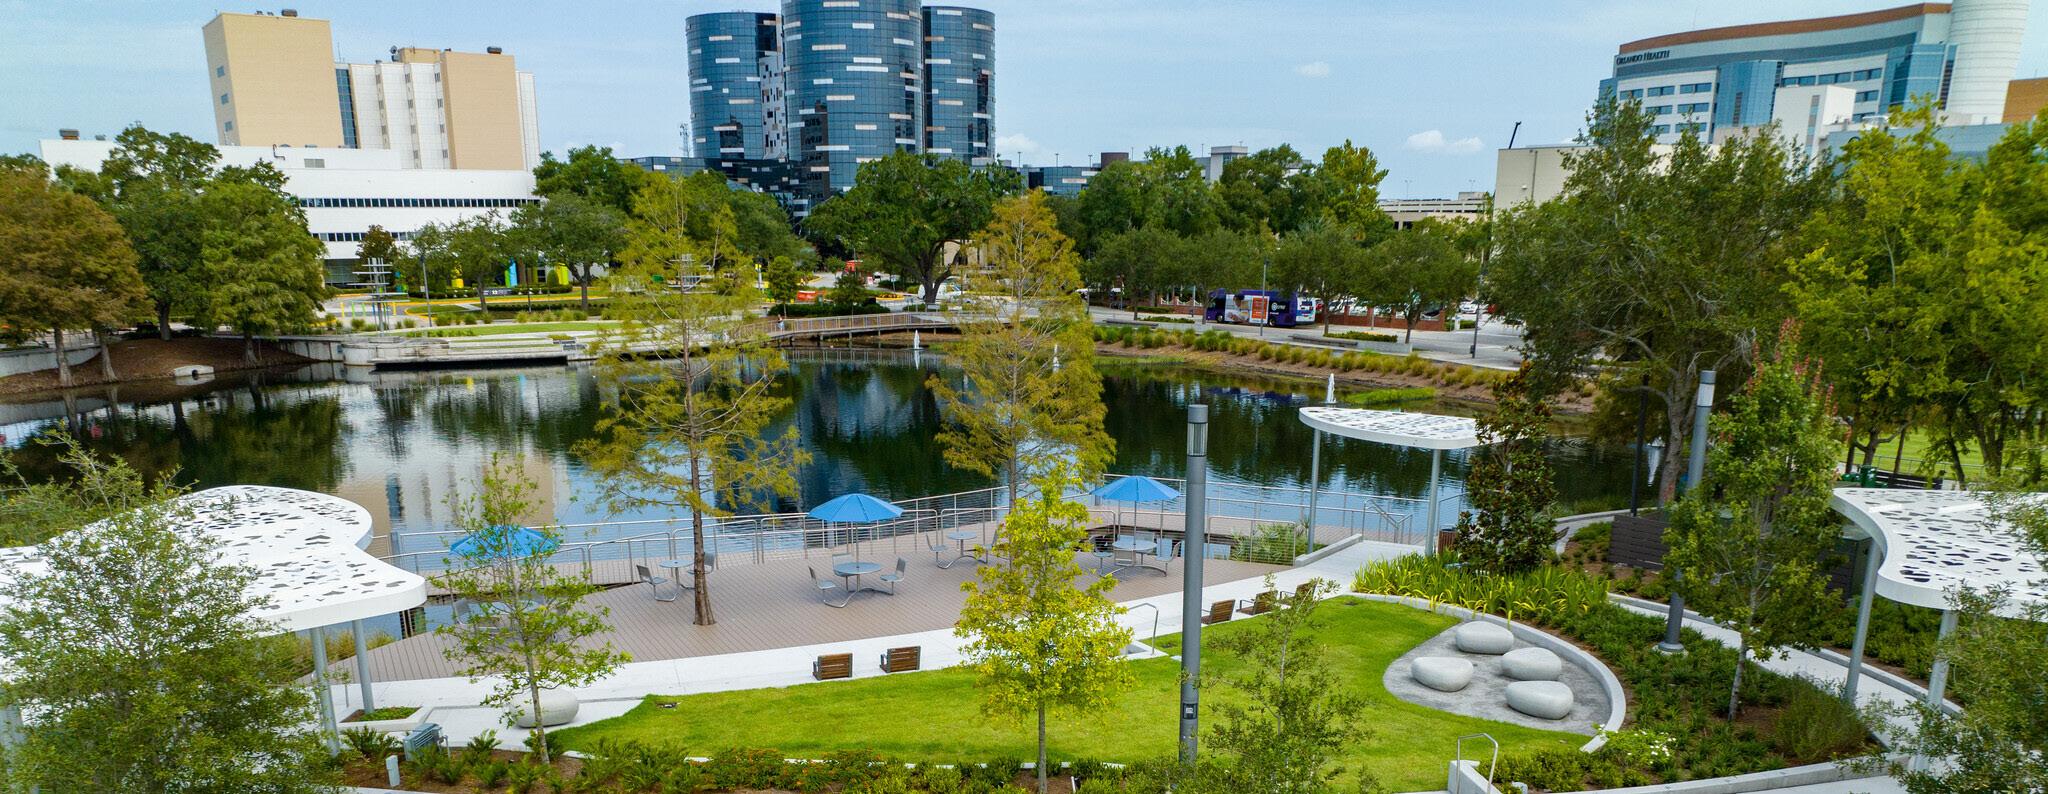
Legend City of Orlando
SoDo District
Main Street
Orlando Main Streets
The SoDo District envisions creating a vibrant residential and local business community embracing innovation and the district’s vintage roots. Key priority projects and programs within the SoDo District include:

Community Events — The SoDo District organizes a variety of community events year-round. Key annual events in the district include Light Up SoDo and SoDo After Dark, all showcasing local vendors, live music, and food. Additionally, the SoDo District hosts numerous pop-up events and fundraisers.

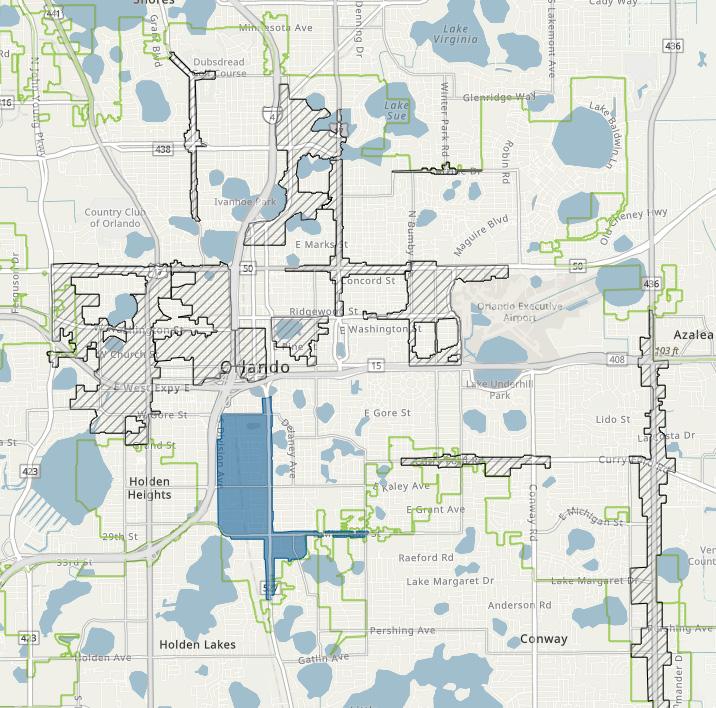
Wellness Initiatives — In March 2024, the SoDo District, sponsored by Orlando Health, launched the “SO DO IT” Wellness Initiative to enhance access to and awareness of community resources. Additionally, the district has been enhancing the bike path along Division Avenue, aiming to make the area more walkable and bike-friendly.

The DSNID is a special local government focused on redeveloping and improving the 720-acre Downtown South neighborhood. The DSNID Advisory Council is preparing a Master Plan to identify services and capital improvements in the SoDo District. Additionally, the district is improving the Lucerne/Southern Gateway, which could inspire similar upgrades in the northern part of the district. These enhancements aim to create a seamless connection between downtown Orlando and SoDo. The NID is already working on various projects to boost the area’s appeal and functionality, striving for a unified urban landscape.
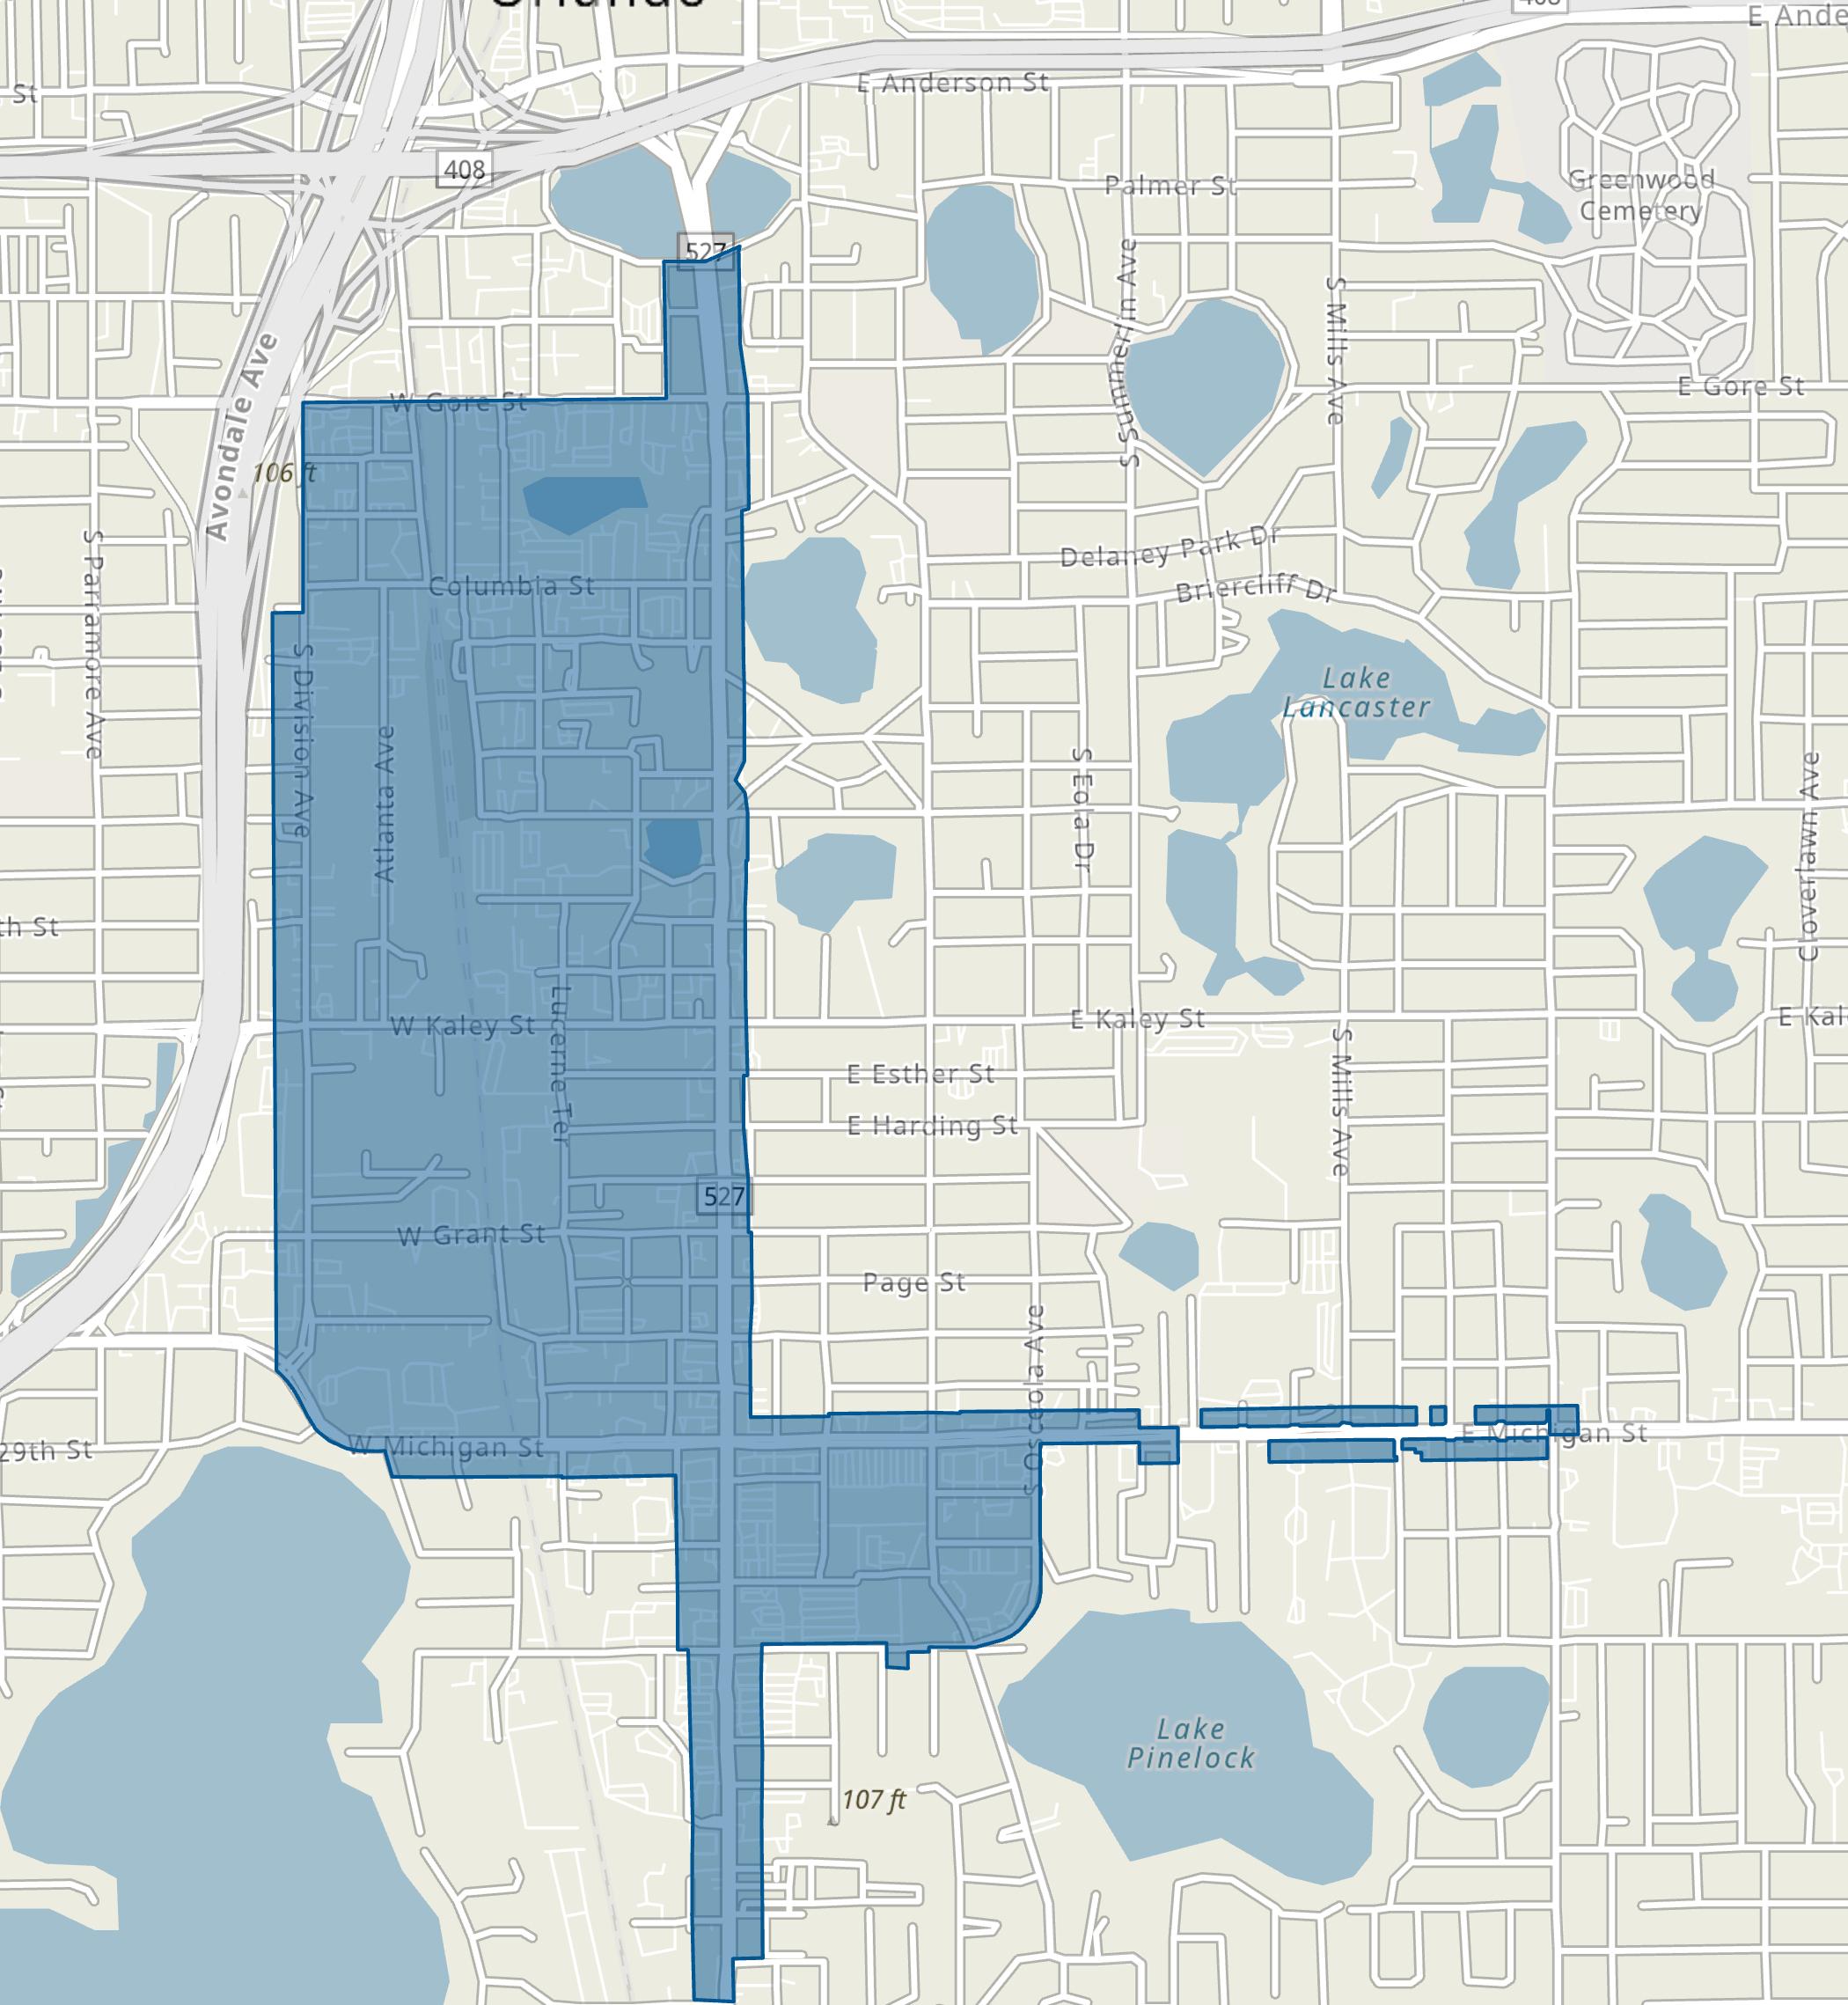
As of year-end 2023, the SoDo District’s total employees compose approximately 13.9% of the total employment within the City. The SoDo District’s employment sector is primarily dominated by the health and social assistance, professional services, and transportation and utilities services industries, as illustrated in the table below.
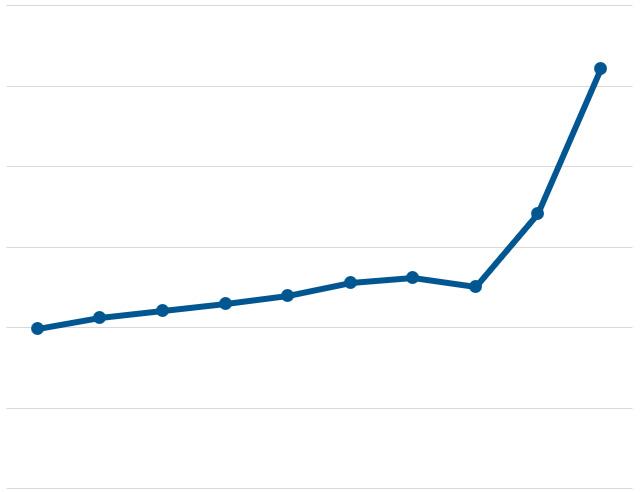
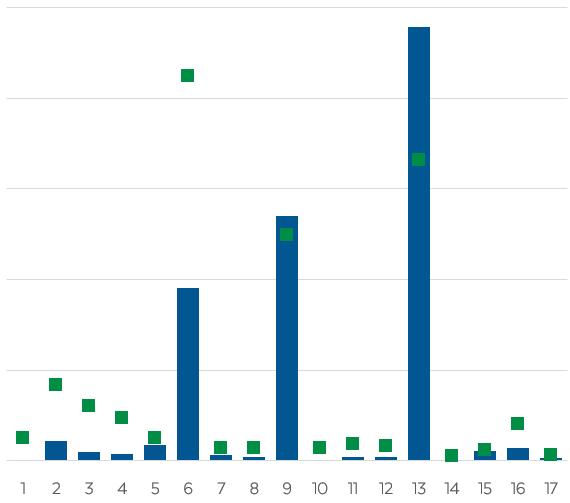
Over the 10-year period, from 2014 to 2023, the SoDo District’s total employment has experienced a compound annual growth rate (“CAGR”) of 10.1%. This growth rate is significantly greater than the City’s 2.3% CAGR during the same period. The figure above illustrates the SoDo District’s total annual employment trends from 2014 through 2023.
In addition, the SoDo District’s total employment increased from 19,864 employees in 2014 to 52,221 employees in 2023—resulting in a net increase of 32,357 total employees. During this same time frame, the SoDo District has captured over 10% of the City’s total growth in employment.
A location quotient (“LQ”) is an analytical statistic that measures how concentrated a particular industry is within an area. The above figure illustrates the concentration of employment by industry sector within the SoDo District, as compared to the concentration within the City for year-end 2023. The SoDo District has a higher concentration of industry professionals (LQ greater than 1.0) in the transportation and utilities, health care and social assistance, and professional services industries.
As of year-end 2023, residents of the SoDo District spent an estimated $43.2 million, with 34% allocated to housing, 30% to retail goods, 12% to food (both away from home and at home), 7.0% to health care, and 3.9% to entertainment and recreation. This spending pattern highlights the dominance of housing and retail, which together account for 64% of total expenditures. Additionally, food and health care make up 18.8% of the consumer spending budget, while entertainment and recreation represents the smallest portion of consumer spending. Within the broader context, total expenditures within the SoDo District make up approximately 0.4% of the consumer spending within the City, with over $11.421 billion in total expenditures as of year-end 2023.
As of year-end 2023, the SoDo District’s for-sale residential market included 134 residential units. Single-family homes made up the majority, at 64%, while residential condominium (“condo”) units accounted for 36% of the total. The SoDo District’s residential units represent 0.2% of both the total single-family residential units and total residential condos within the City.
The SoDo District encompasses portions of three residential condo properties: La Costa Brava Lakeside, One Thousand Oaks, and Delaney Court. Total inventory of residential units within the SoDo District have remained relatively unchanged for residential condo units over the past five years, 2019 through 2023, while single-family homes increased by 14 units, as illustrated in the following figure.
As of year-end 2023, the average single-family residential assessed value per unit at $286,180 and the taxable value per unit at $264,850 were both
significantly greater than those for residential condo units—with an assessed value per unit of $186,170 and a taxable value per unit of $181,740.
In addition, the SoDo District experienced a total of 5 single-family home sales and 5 residential condo unit sales in 2023. The SoDo District’s residential unit sales represent 0.1% and 0.3% of the total single-family home and residential condo unit sales, respectively, within the City, as illustrated in the following table.
By the end of 2023, the total sales price for singlefamily residential units reached approximately $2.3 million, while residential condo unit sales amounted to around $1.3 million. The average sales price per sq. ft. for single-family homes in the SoDo District at $255.97 per sq. ft. was significantly lower than the City’s average, at $346.26 per sq. ft. In contrast, the average sales price per sq. ft. for the SoDo District’s residential condo units, at $209.13 per sq. ft., was only slightly lower than the City’s average, at $222.78 per sq. ft. during the same period.
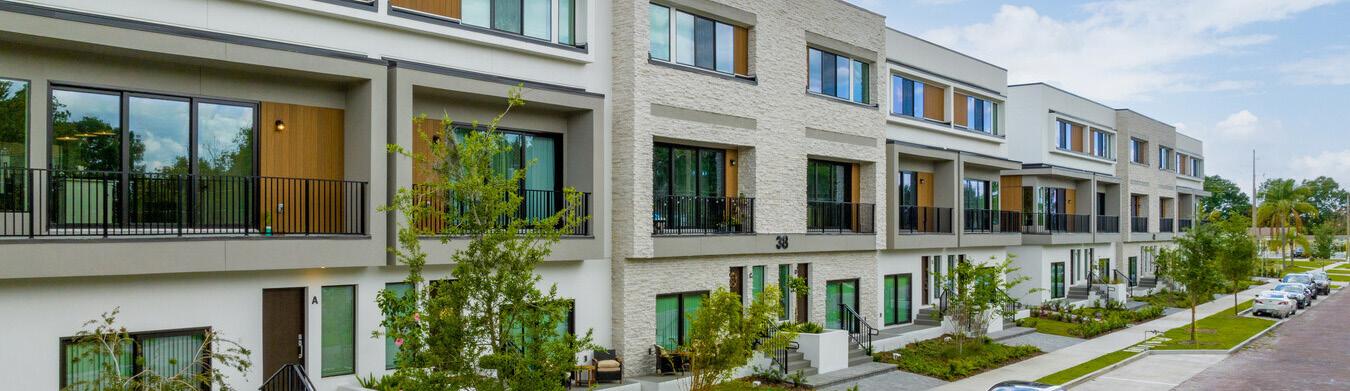
As of year-end 2023, the SoDo District’s commercial real estate market composed approximately 4.0 million square feet (“sq. ft.”) of office, retail, and industrial/flex space, in addition to 236 hotel rooms and 1,137 for-rent market-rate multi-family residential units, as illustrated in the market characteristics table below.
Industrial/flex space composed the majority of the SoDo District’s office, retail, and industrial/ flex inventory at 55% of the total share, followed by office space with 33% of the total as of yearend 2023. Specifically, the office space within the SoDo District consisted of 5.2% Class A space, 55% Class B space, and 39% Class C space.
Although industrial/flex and office properties encompassed the greatest amount of commercial space within the SoDo District, retail properties had the highest occupancy at 100% as of yearend 2023. Moreover, occupancy rates for the SoDo District’s hotel and for-rent multi-family market were 74.3% and 93.9%, respectively, during this same period. In addition, the SoDo District’s average rental rates for its office and industrial/ flex properties were greater than those for the City as of year-end 2023; whereas, the district’s retail,
hotel, and for-rent multi-family markets had average rental rate lower than those of the City during this same time period.
There were 25 lease transactions that occurred in the SoDo District’s office, retail, and industrial/ flex markets—resulting in a total of approximately 146,000 sq. ft. leased during 2023. Leasing activity refers to the volume of square footage that is committed to and actually signed in a given period of time, including direct leases, subleases, and renewals of existing leases.
Gross absorption measures the total sq. ft. occupied within existing buildings over a given period, without accounting for vacated space. As of year-end 2023, the SoDo District’s total gross absorption equated to 55,705 sq. ft. of commercial space. In addition, the SoDo District’s for-rent multi-family residential market experienced negative absorption of 4 units during this same time frame.
The following pages illustrate major development activities, year-over-year snapshots, and five-year annual trends for the SoDo District’s commercial real estate market.
Office space remained unchanged from the prior year at 1.32 million sq. ft.
Vacancy rates for office properties increased 0.5 percentage points, from 2.0% to 2.5%.
Average
Leasing activity of office space increased 54%
Over the past five years, 2019 to 2023, the SoDo District saw the addition of approximately 18,754 sq. ft. of industrial/ flex space, 15,000 sq. ft. of office space, and 110 new hotel rooms within three properties. Within the SoDo District, there is 112,140 sq. ft. of under-construction activity as of year-todate 2024, through August 2024, as illustrated in the graphics below. During this same time frame, there are 856 rental multi-family units proposed, as well as 11,500 sq. ft. of retail space proposed within 2 development projects located within the SoDo District.
Retail space remained unchanged from the prior year at 512,206 sq. ft.
Vacancy rates for retail properties decreased 1.0 percentage points, from 1.0% to 0.0%.
Average rental rates per sq. ft. increased 7.2%, from $24.38 to $26.13.
Leasing activity of retail space increased 338%
Industrial/flex space
increased 0.9% from the prior year from 2.17 million sq. ft. to 2.19 million sq. ft.
Vacancy rates increased 1.4 percentage points, from 0.1% to 1.5%.
Average rental rates per sq. ft. increased 27% from $11.13 to $14.11.
Leasing activity of industrial/flex space increased 3.7%.
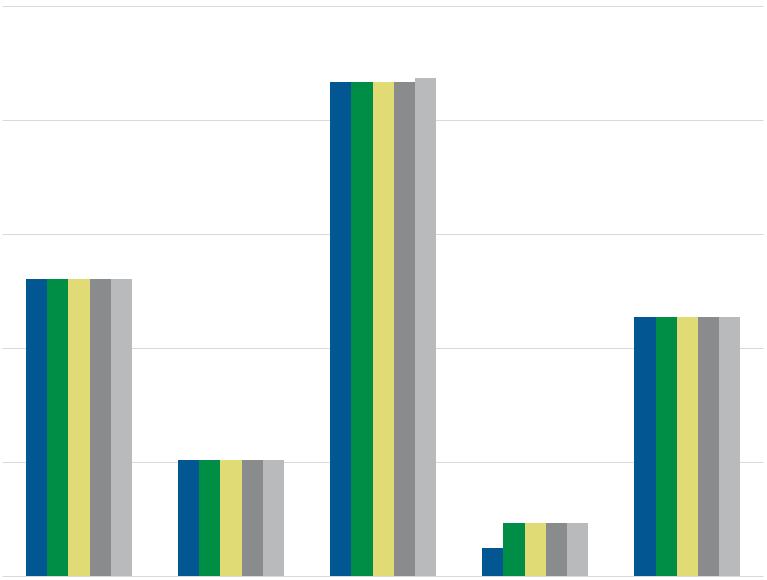
Over the past five years, 2019 to 2023, total inventory of commercial space within SoDo experienced an increase of nearly 18,800 sq. ft. of industrial/flex space and 110 hotel rooms with the addition of TownePlace Suites Orlando Downtown. During this same time frame, total office and retail space, as well as rental multi-family inventory remained unchanged within SoDo.
Comparatively, the new inventory within SoDo over the past five years accounted for 0.05% of the City’s new industrial/flex space and 3.4% of the City’s new hotel room inventory.
Hotel inventory remained unchanged from the prior year at 236 rooms.
Vacancy rates for hotel properties decreased 1.4 percentage points, from 27.1% to 25.7%.
Average daily rate (“ADR”) for hotel rooms increased 0.6%, from $132.00 to $132.73.
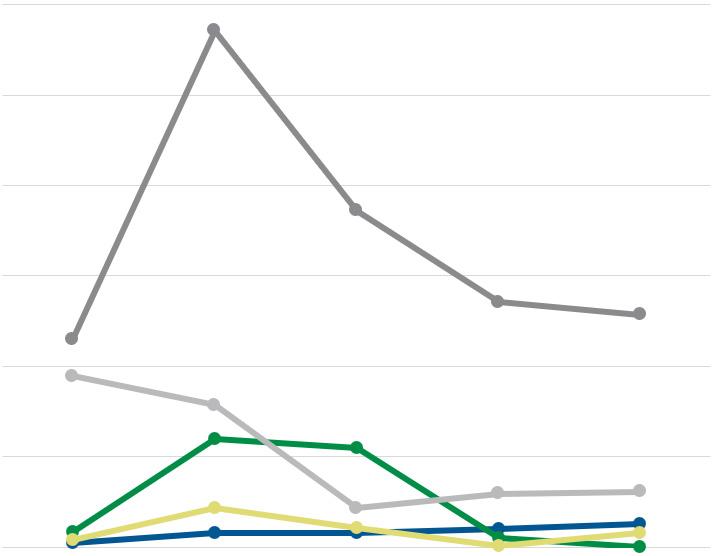
Over the past five years, SoDo saw slight increases of 2.1, 0.7, and 2.8 percentage points in the office, industrial/flex, and hotel market, respectively. Rising vacancy rates are likely due to a shortage of desirable rental spaces and high rental costs exceeding what the local market can afford. However, notable increases from 2020-2022 may also be a result of the COVID-19 pandemic. In contrast, SoDo’s retail and for-rent multi-family markets experienced a 1.7 and 12.8 percentage point decline in vacancy rates over the past five years— which may be attributed to an increase in spending and demand for rentable spaces.
For-rent multi-family units remained unchanged from the prior year at 1,137 units.
Vacancy rates increased 0.2 percentage points for rental multi-family units, from 5.9% to 6.1%.
Average rental rates per unit decreased 9.8%, from $1,786 per unit to $1,611 per unit.
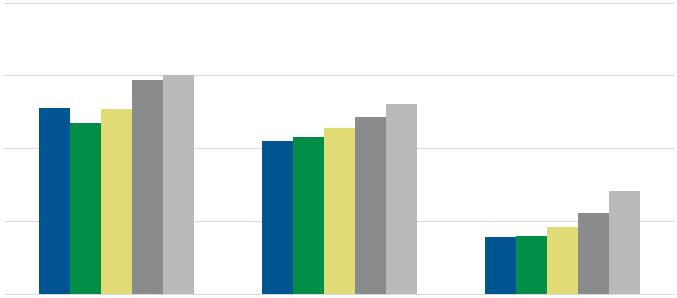
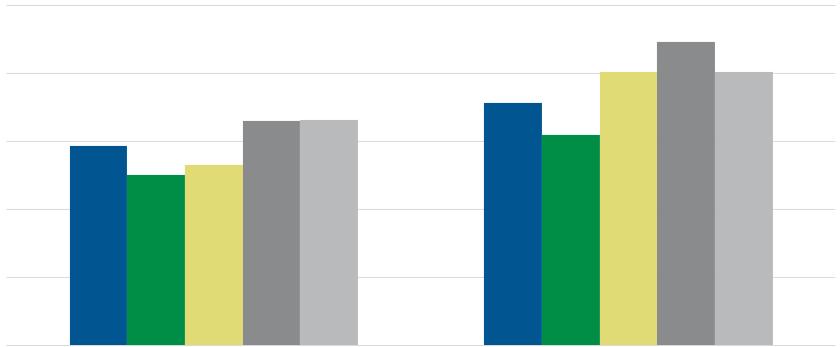
Over the past five years, the average rental rates per sq. ft. within SoDo experienced increases of 18%, 24%, and 80% for office, retail, and industrial/ flex properties, respectively. During this same time frame, average daily rates for hotel rooms increased 13% and average rental rates per unit for multi-family increased 13%. Increases in average rental rates may be attributed to rising operating and fixed costs, as well as properties in desirable locations or with premium amenities that can command higher rents.
The Thornton Park District Main Street (“TPD”), part of the Main Street America program, is a vibrant and walkable commercial district, boasting over 60 locally-owned specialty shops, services, and dining destinations. Covering approximately 122 acres, TPD is conveniently located near Orlando’s downtown core, bordered by State Road 526 to the north and South Street to the south, as shown in the map on the following page.
As one of the most desirable places to live in downtown Orlando, TPD is successful in attracting young professionals and urban dwellers. This has transformed the district into a lively 24/7 neighborhood with a diverse mix of residents. The neighborhood’s aesthetic and creative reuse of existing structures highlight its status as a vibrant enclave within walking distance of downtown Orlando. Home styles range from 1920s bungalows to Craftsman-style structures to Tudor Revivals, all lining renovated brick streets with pristine landscaping.
TPD is dedicated to making adaptive reuse a defining feature of the community. The district’s mission is to foster a supportive environment for local businesses and neighbors, while nurturing an inclusive atmosphere. This commitment is reflected in TPD’s focus on enhancing walkability, ensuring safety, preserving the district’s unique charm, and offering distinctive amenities. One of TPD’s primary objectives is to elevate its reputation as a highly sought-after Main Street District. This involves continuous efforts to improve the overall experience for residents and visitors alike, making it a vibrant and desirable place to live, work, and explore.
Nestled in the heart of TPD, Lake Eola Park serves as a central hub for the community. This iconic park draws both residents and visitors with its scenic views, vibrant atmosphere, and a variety of recreational activities. The park features a 23-acre lake which is the centerpiece of the area. Visitors can enjoy a leisurely stroll around the 0.9-mile sidewalk that encircles the lake, rent swan-shaped paddle boats, and photograph the live swans and other birds inhabiting the park. The park also includes a playground, picnic areas, and expansive green space.
Lake Eola Park is not only a popular spot for relaxation and recreation but also a venue for various community events. Central to these events is the Walt Disney Amphitheater, donated by to the City by the Walt Disney Company in 1989. Located amid beautiful flower beds with a stunning view of Orlando’s skyline, this outdoor venue hosts public events, plays, dance performances, outdoor movies, and free concerts. The amphitheater, featuring a retro scallop-shaped facade, has seating for 1,157 and is a key location for holiday events, including Christmas shows and Fourth of July fireworks.

Another popular urban park within TPD is Constitution Green. Spanning nearly 2 acres, this park is known for its historic Southern Live Oak tree, which is estimated to be between 125 and 175 years old and is listed on Orlando’s Official Significant Trees Map. The park offers a tranquil retreat with open fields, shaded areas, and ample seating. It also features the Dog Run, downtown Orlando’s first offleash dog park, which opened in 2016. This facility includes water bowls, shaded areas, and plenty of seating, making it a popular spot for dog owners and their pets. The park’s strategic location and lush landscapes make it a cherished green space for both residents and visitors.
TPD’s 2023 Annual Report highlights that the Thornton Park District Main Street invested nearly $3.0 million into the district, with 7.1% coming from private investments. The district also welcomed 16 new businesses, created 79 jobs, and benefited from 1,015 volunteer hours contributed by residents and businesses.
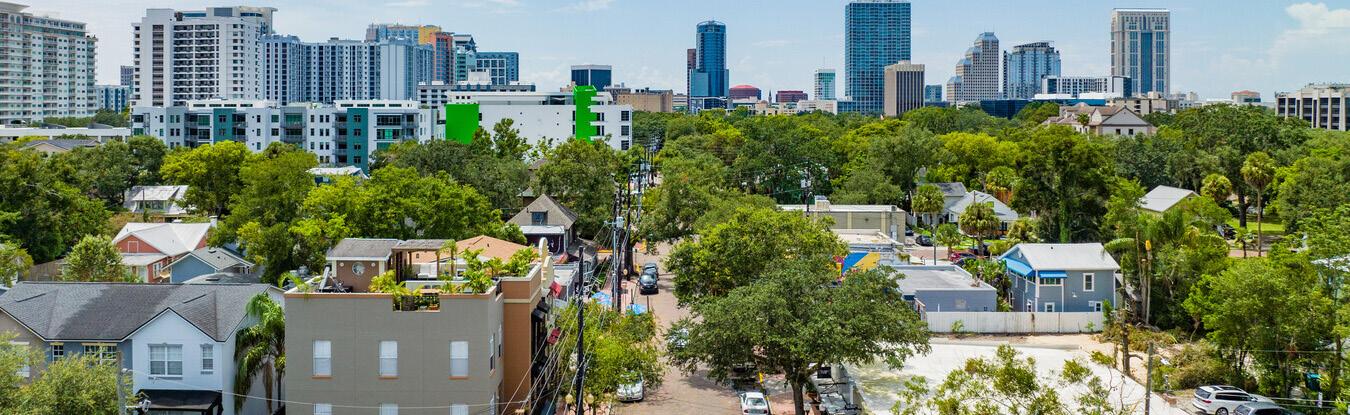
TPD aims to provide a memorable experience through its locally-owned shops, dining destinations, community events, and distinctive offerings. Key priority projects and programs within TPD include:
Vive at Eola — The 13-story Vive at Eola, approved in February 2022, located at 205 and 225 S. Eola Drive. The project will feature 12,536 square feet of retail/restaurant space, 244 residential micro-units, and a 133-space parking garage. Additional amenities include water elements, a roof deck lounge, fitness area, and private patios.

Community Events — TPD organizes a variety of key weekly and monthly community events, including: TPD Markets, held every Thursday and Friday, this market brings the community together, promoting local crafters and artists while creating a walkable space; Orlando Farmers Market at Lake Eola, hosted by the Downtown Development Board (DDB) and managed by Red Top Projections, has offered fresh produce, baked goods, crafts, and more every Sunday since 1987; Art and Wine Walk, on the second Thursday of each month, this event features wine tastings at over 20 locations, along with art vendors, live music, DJs, and a night market. Additionally, TPD hosts numerous pop-up events and fundraisers year-round.

Thornton Park Mural Projects — TPD features numerous murals on its infrastructure, highlighting the community’s unique culture. Notable examples include the City Centre Mural Project and the Thornton Park Central Garage Mural.
Legend
City of Orlando
Thornton Park District
Main Street
Thornton Park Proper
Orlando Main Streets
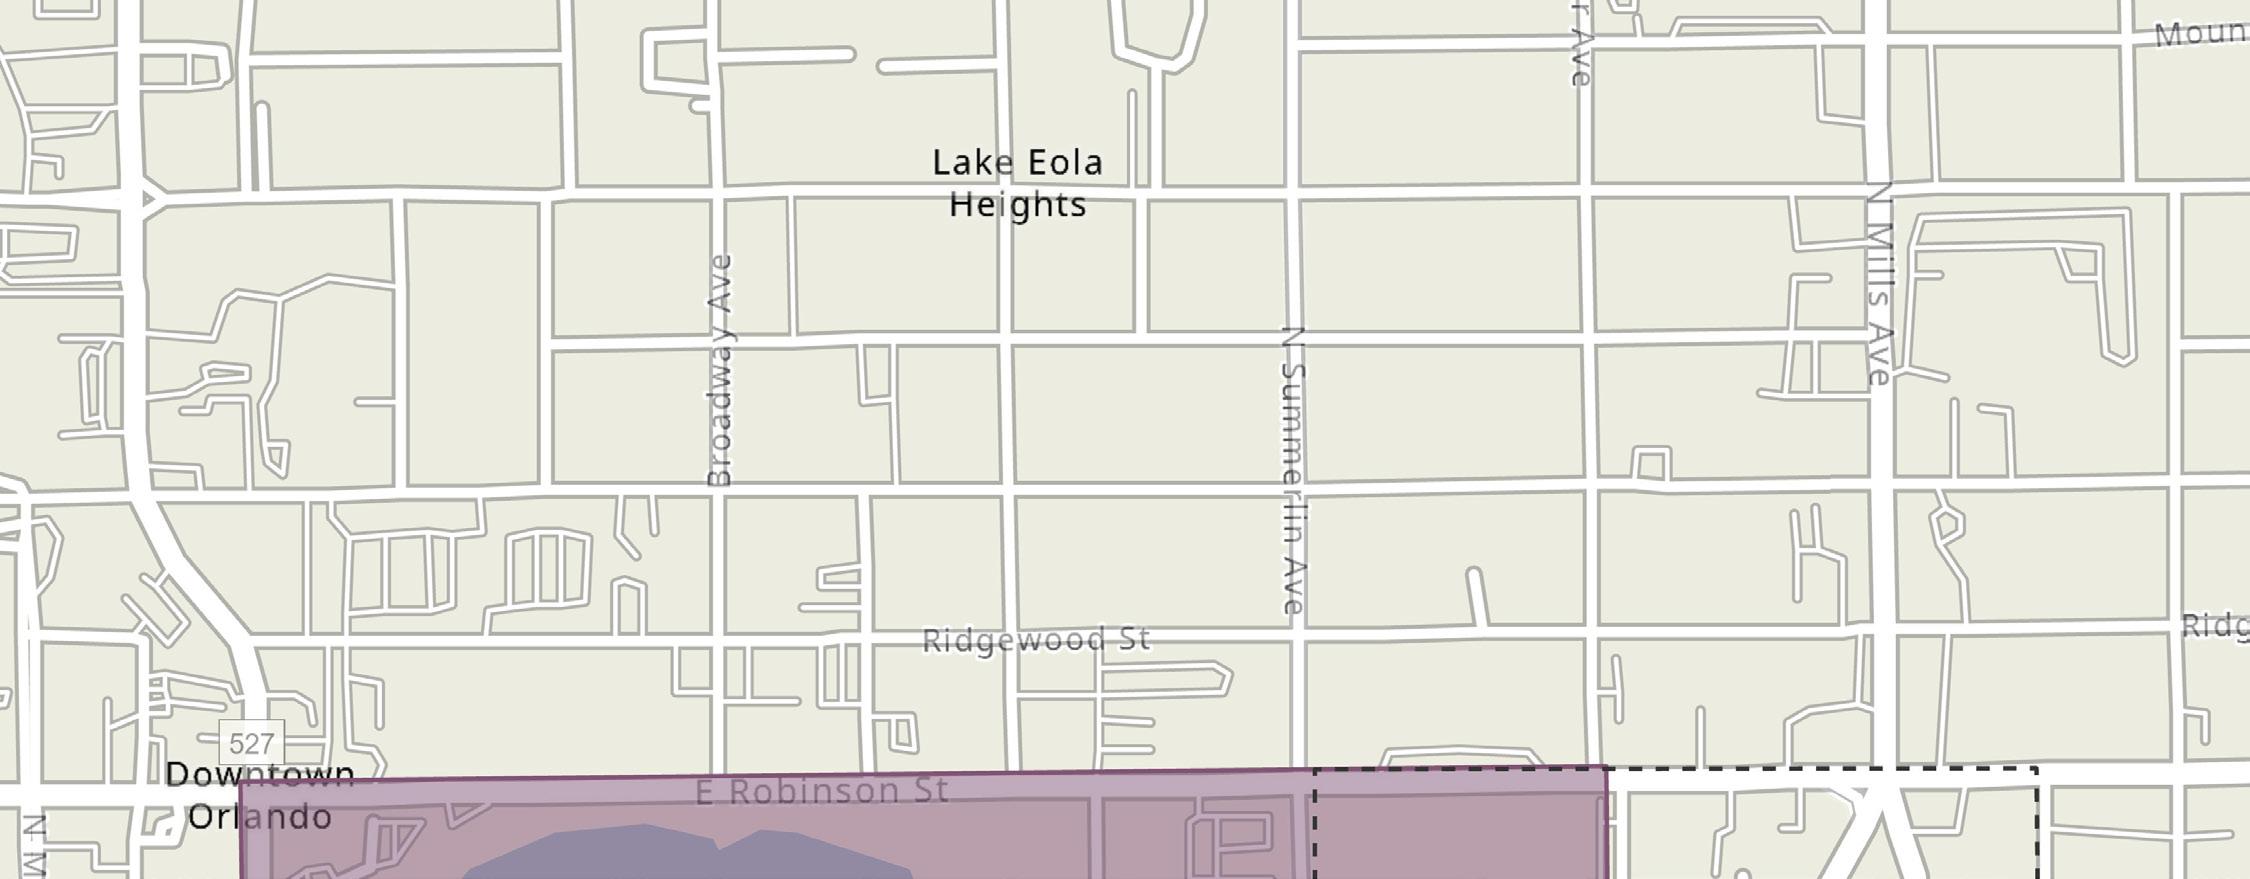
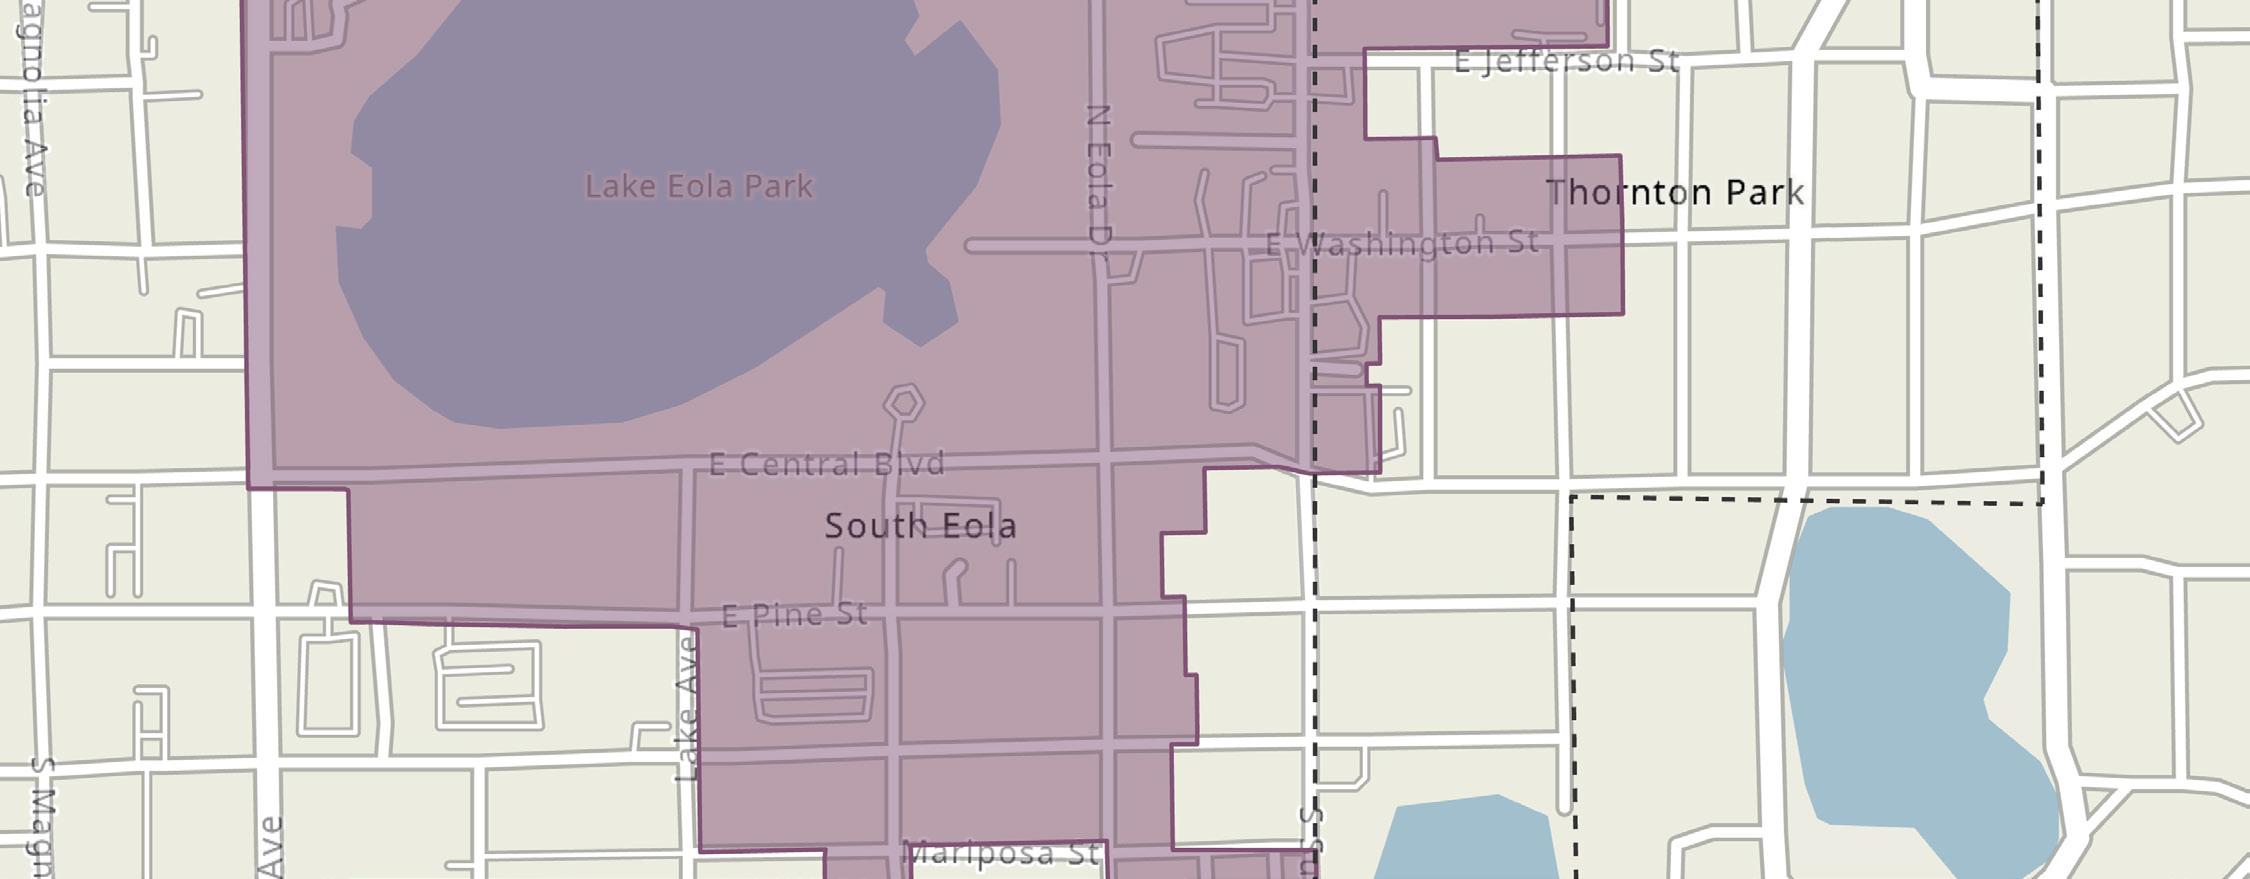
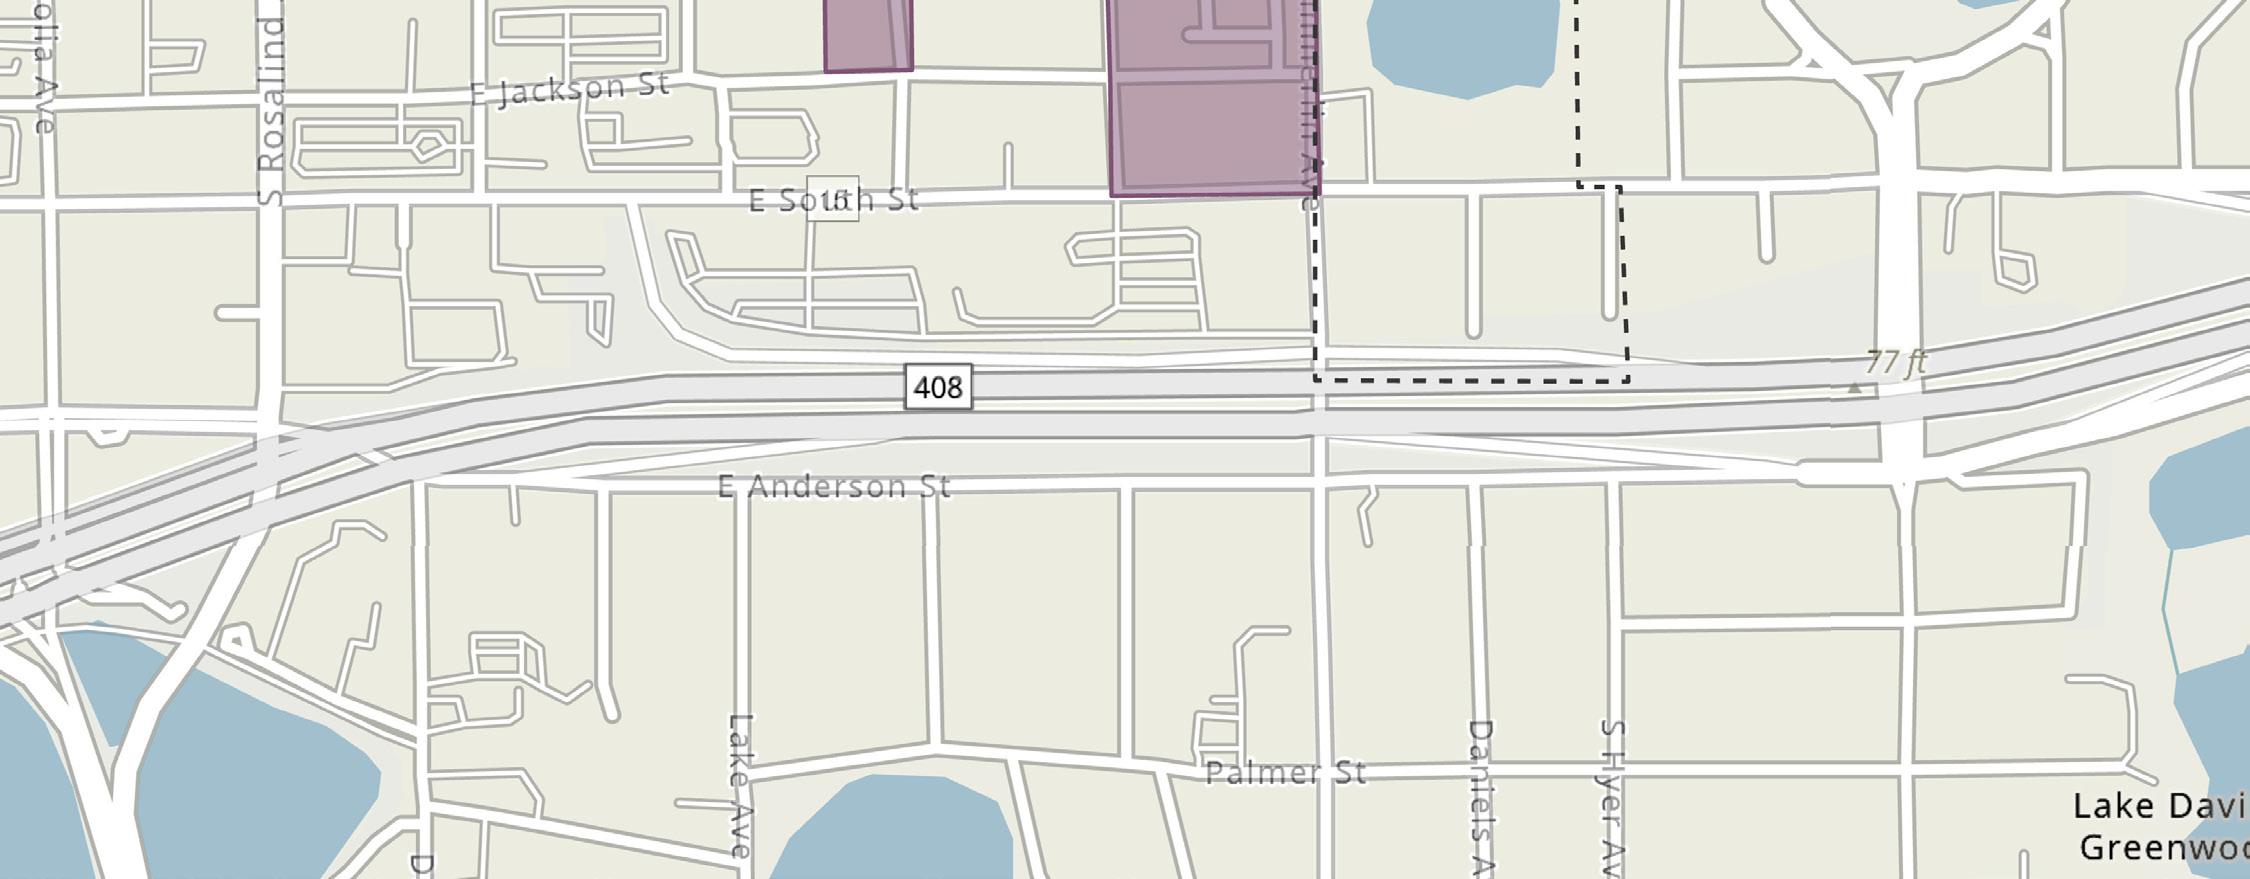
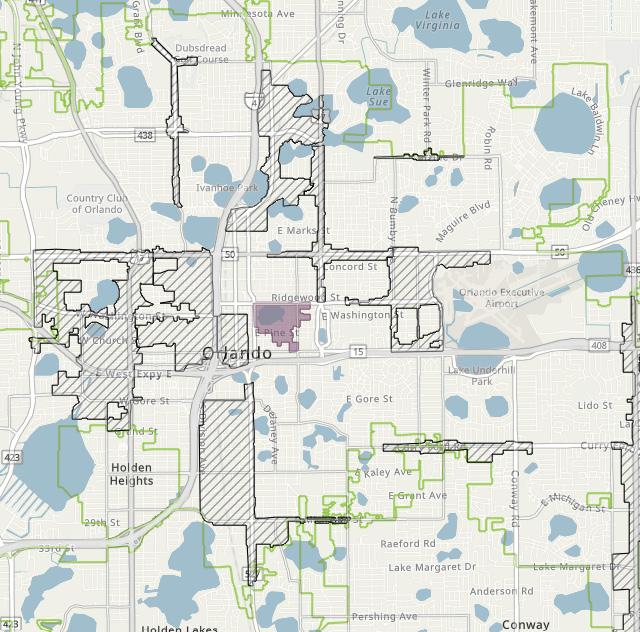
As of year-end 2023, TPD’s total employees compose approximately 1.9% of the total employment within the City. TPD’s employment sector is primarily dominated by the professional services, health care and social assistance, and information and finance industries, as illustrated in the table below.
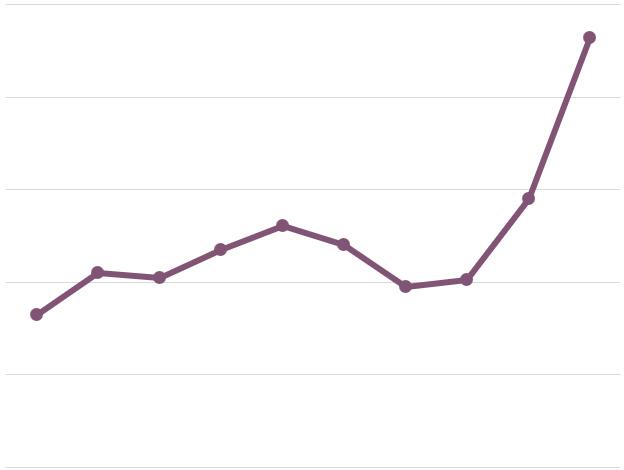
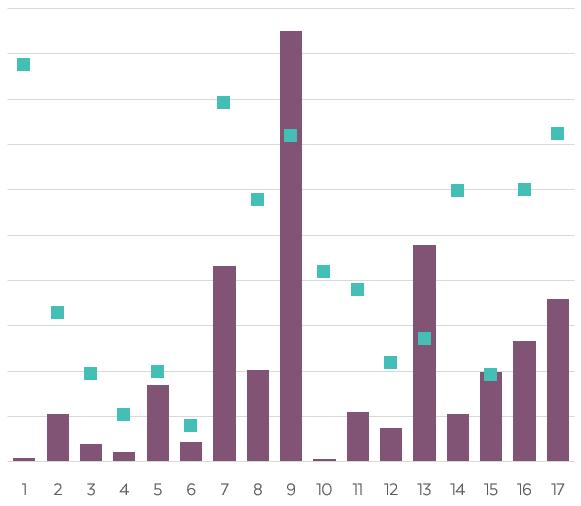
Over the 10-year period, from 2014 to 2023, TPD’s total employment has experienced a compound annual growth rate (“CAGR”) of 5.6%. This growth rate is significantly greater than the City’s 2.3% CAGR during the same period. The figure above illustrates the TPD’s total annual employment trends from 2014 through 2023.
In addition, TPD’s total employment increased from 4,149 employees in 2014 to 7,143 employees in 2023—resulting in a net increase of 2,994 total employees. During this same time frame, TPD has captured approximately 3.9% of the City’s total growth in employment.
A location quotient (“LQ”) is an analytical statistic that measures how concentrated a particular industry is within an area. The above figure illustrates the concentration of employment by industry sector within TPD, as compared to the concentration within the City for year-end 2023. TPD has a higher concentration of industry professionals (LQ greater than 1.0) in the agriculture and mining, information and finance, public administration, professional services, other services (excluding public administration), and real estate and leasing industries. TPD and the City are equally specialized (LQ equals 1.0) in the management of companies industry.
As of year-end 2023, residents of TPD spent an estimated $236.1, million, with 34% allocated to housing, 29% to retail goods, 12% to food (both away from home and at home), 6.9% to health care, and 3.9% to entertainment and recreation. This spending pattern highlights the dominance of housing and retail, which together account for 64% of total expenditures. Additionally, food and health care make up 18.8% of the consumer spending budget, while entertainment and recreation represents the smallest portion of consumer spending. Within the broader context, total expenditures within TPD make up approximately 2.1% of the consumer spending within the City, with over $11.421 billion in total expenditures as of year-end 2023.
As of year-end 2023, TPD’s for-sale residential market included 867 residential units. Residential condominium (“condo”) units made up the majority, at 95%, while single-family homes accounted for 5% of the total. TPD’s residential units represent 0.1% of the total single-family residential units and 2.9% of the total residential condos within the City.
TPD encompasses numerous residential condo properties, including East Central Condo, the Sanctuary, Star Tower, Thornton Park Central, and Waverly on Lake Eola. Total inventory of residential units within TPD have remained relatively unchanged for single-family homes and residential condo units over the past five years, 2019 through 2023, with the addition of one single-family home, as illustrated in the following figure.
0.05% and 3.2% of the total single-family home and residential condo unit sales, respectively, within the City, as illustrated in the following table. SINGLE-FAMILY ANNUAL TRENDS
As of year-end 2023, the average single-family residential assessed value per unit at $580,200 and the taxable value per unit at $555,750 were both significantly greater than those for residential condo units—with an assessed value per unit of $355,160 and a taxable value per unit of $321,750.
In addition, TPD experienced a total of 4 singlefamily home sales and 47 residential condo unit sales in 2023. TPD’s residential unit sales represent
By the end of 2023, the total sales price for singlefamily residential units reached approximately $2.7 million, while residential condo unit sales amounted to around $22.2 million. The average sales price per sq. ft. for single-family homes in TPD at $306.85 per sq. ft. was slightly lower than the City’s average, at $346.26 per sq. ft. In contrast, the average sales price per sq. ft. for residential condo units in TPD, at $332.21 per sq. ft., was significantly greater than that of the City, at $222.78 per sq. ft., during the same period.
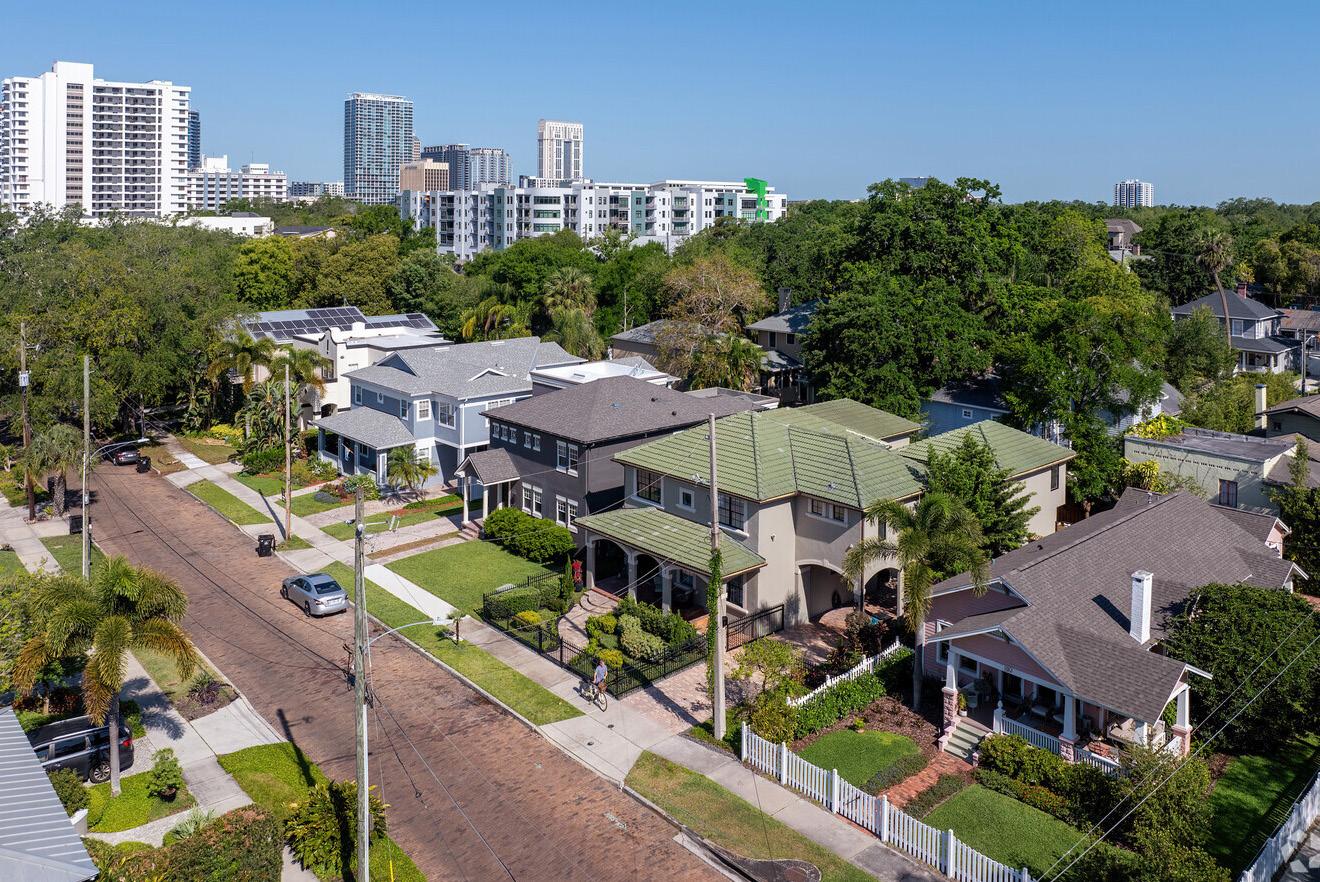
As of year-end 2023, TPD’s commercial real estate market composed nearly 1.3 million square feet (“sq. ft.”) of office, retail, and industrial/flex space, in addition to 20 hotel rooms, and 1,660 for-rent market-rate multi-family residential units, as illustrated in the market characteristics table below.
Office space composed the majority of TPD’s office, retail, and industrial/flex inventory at 91% of the total share, as of year-end 2023. Specifically, the office space within TPD consisted of 78% Class A space, 4.4% Class B space, and 18% Class C space.
Although office properties encompassed the greatest amount of commercial space within TPD, retail and industrial/flex properties had higher occupancy rates at 97.9% and 100%, respectively, as of year-end 2023. Moreover, occupancy rates for TPD’s hotel and for-rent multi-family market were 74.2% and 95.3%, respectively, during this same period.
In addition, TPD’s average rental rates for its retail properties and for-rent multi-family units were greater than those of the City as of year-end 2023; whereas, the district’s office and hotel markets had
an average rental rate lower than that of the City during this same time period. Average rental rates for industrial/flex space was unavailable due to sample size limitations.
There were 17 lease transactions that occurred in TPD’s office, retail, and industrial/flex markets— resulting in a total of approximately 39,700 sq. ft. leased during 2023. Leasing activity refers to the volume of square footage that is committed to and actually signed in a given period of time, including direct leases, subleases, and renewals of existing leases.
Gross absorption measures the total sq. ft. occupied within existing buildings over a given period, without accounting for vacated space. As of year-end 2023, TPD’s total gross absorption equated to 52,394 sq. ft. of commercial space. In addition, TPD’s for-rent multi-family residential market experienced positive absorption of 2 units during this same time frame.
The following pages illustrate major development activities, year-over-year snapshots, and five-year annual trends for TPD’s commercial real estate market.
Office space remained unchanged from the prior year at 1.18 million sq. ft.
Vacancy rates for office properties decreased 0.8 percentage points, from 3.8% to 3.0%.
Average rental rates per sq. ft. increased 7.5%, from $24.35 to $26.17.
Leasing activity of office space decreased 15%
Over the past five years, 2019 to 2023, TPD saw the addition of 360 rental multi-family units within one property, as illustrated in the graphics below.
Within TPD, there is zero under-construction activity as of year-to-date 2024 through August 2024. However, during this same time frame, there are 144 rental multi-family units proposed within 1 property located in TPD, as illustrated in the graphic below.
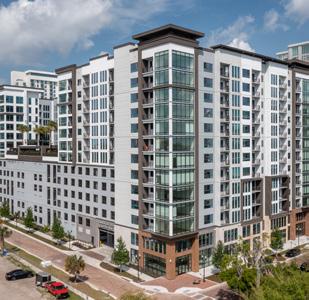
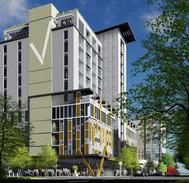
Retail space remained unchanged from the prior year at 106,305 sq. ft.
Vacancy rates for retail properties decreased 2.0 percentage points, from 4.1% to 2.1%.
Average rental rates per sq. ft. increased 6.6%, from $37.60 to $40.10.
Leasing activity of retail space increased 328%
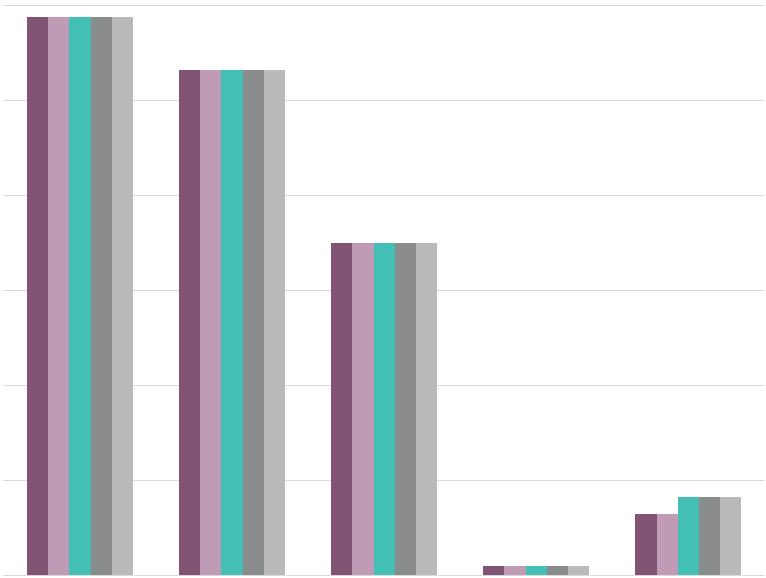
Over the past five years, 2019 to 2023, total inventory of commercial space within TPD remained unchanged across the office, retail, and industrial/flex space markets, as well as within the hotel room inventory. During this same time frame, total rental multi-family units increased by 360 units with the addition of Camden Lake Eola within TPD.
Comparatively, the new inventory within TPD over the past five years accounted for 3.0% of the City’s new multi-family inventory.
Industrial/flex space remained unchanged from the prior year at 7,000 sq. ft.
Vacancy rates remained unchanged from the prior year at 0.0%.
Average rental rate and leasing activity was not available for industrial/ flex space within TPD in 2023.
Hotel inventory remained unchanged from the prior year at 20 rooms.
Vacancy rates for hotel properties decreased 30 percentage points, from 56.2% to 25.8%.
Average daily rate (“ADR”) for hotel rooms increased 0.6%, from $131.97 to $132.74.
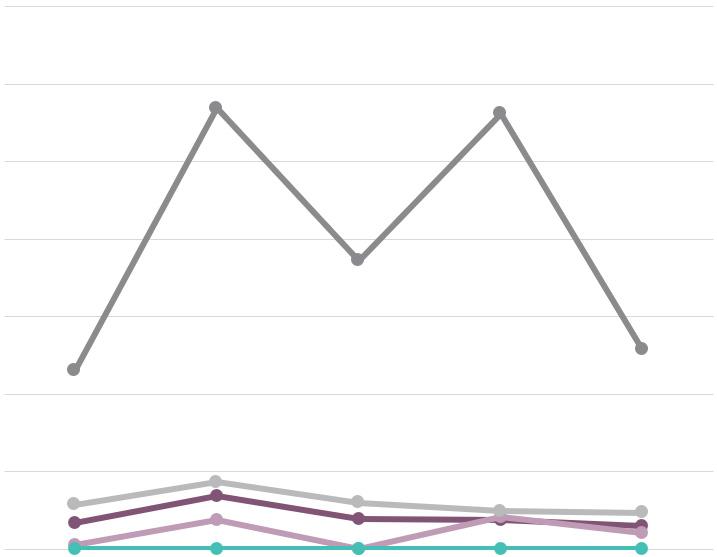
Over the past five years, TPD saw vacancy rate increases of 1.6 and 2.8 percentage points in the retail and hotel market, respectively. Rising vacancy rates are likely due to a shortage of desirable rental spaces and high rental costs exceeding what the local market can afford. However, notable increases from 2020-2022 may also be a result of the COVID-19 pandemic. In contrast, TPD’s office and for-rent multi-family markets experienced a 0.4 and 1.0 percentage point decline in vacancy rates over the past five years—which may be attributed to an increase in demand for rentable office and multifamily units within TPD.
For-rent multi-family units remained unchanged from the prior year at 1,660 units.
Vacancy rates decreased 0.2 percentage points for multi-family properties, from 4.9% to 4.7%.
Average rental rates per unit decreased 6.5%, from $2,128 to $1,989.
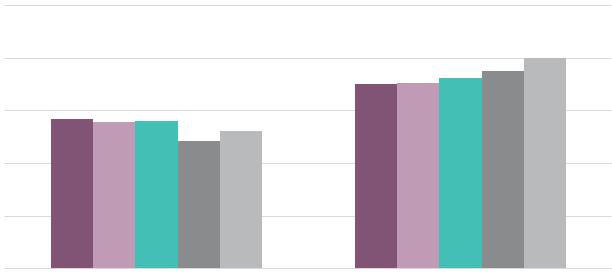
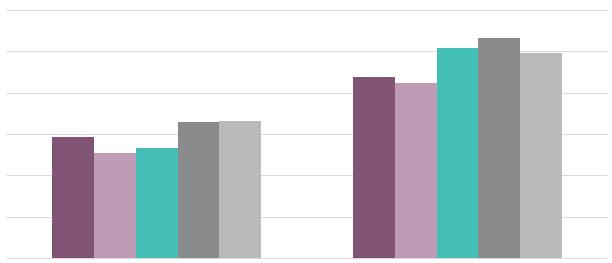
Over the past five years, 2019 to 2023, the average rental rates per sq. ft. for commercial space within TPD experienced an increase of 14% for retail properties. During this same time frame, average daily rates for hotel rooms increased 13% and average rental rates per unit for multi-family increased 14%. Increases in average rental rates may be attributed to rising operating and fixed costs, as well as properties in desirable locations or with premium amenities that can command higher rents.
The West Lakes Main Street (“West Lakes”), part of the Main Street America program, is recognized as one of Orlando’s newest and promising hubs for business and community growth. Spanning approximately 832 acres, as shown in the map on the following page, West Lakes is the second largest Orlando Main Street. Bordered by State Road 50 (West Colonial Drive) to the north, U.S. Highway 441 (Orange Blossom Trail) to the east, State Road 423 (John Young Parkway) to the west, and bisected by State Road 408 to the south, West Lakes provides convenient access to major thoroughfares for both commuters and visitors.
West Lakes is a historic yet progressive neighborhood in Orlando, where residents cherish the community’s legacy of diversity, leadership, and local businesses across various industries. From automotive and manufacturing to health and financial services, as well as retail and dining, West Lakes will honor the community’s historic value while fostering new opportunities for consumers and collaborators.
Embracing revitalization and growth, West Lakes aims to elevate its corporations, small businesses, startups, and entrepreneurs while preserving the community’s rich history. To support this mission, West Lake strives to ensure effective management and stakeholder partnerships; enhance the district’s appearance by improving infrastructure, preserving historic buildings, and creating inviting public spaces; attract visitors and investors through marketing and events, showcasing the district’s unique offerings and vibrant culture; and strengthen the economic base by supporting existing businesses, attracting new enterprises, and encouraging entrepreneurship. Together, these strategies drive the revitalization and growth of West Lakes, ensuring it remains a dynamic and thriving community.
At the heart of West Lakes, Camping World Stadium and the historic Lake Lorna Doone Park make the district a popular destination for sports enthusiasts, festival goers, and concert fans.
Camping World Stadium, an outdoor venue in West Lakes, is located near sports and entertainment facilities like the KIA Center, Dr. Phillips Center for the Performing Arts, and Inter&Co Stadium. Originally opened in 1936 as Orlando Stadium, it has also been known as the Tangerine Bowl and Florida Citrus Bowl. Owned and operated by the City of Orlando, the stadium has expanded from its original 8,900 seats to 60,219 seats. Camping World Stadium has hosted numerous college football games, including many bowl games, the National Football League’s (“NFL”) Pro Bowl, the 1994 FIFA World Cup, the 1996 Summer Olympic Soccer Preliminaries, and various concerts, sports, and entertainment events.
Lake Lorna Doone Park, one of Orlando’s oldest parks, has been a community fixture since 1925 and was the site of the South’s first integrated Little League Baseball game in 1955. Located
next to Camping World Stadium, the park recently underwent an $8 million renovation through a public-private partnership involving the City of Orlando, Florida Citrus Sports, and the NFL which was completed in 2021. Known as the “Jewel of the West Side,” the 12-acre park features a walking loop, fitness stations, a barrier-free playground, basketball courts, a splash pad, a putting green, a 100-yard football field, a covered performance pavilion, an interactive arts garden, and a fountain centerpiece. More recently, the City approved the Community Building Project at the park in 2023. This building will feature new meeting space, offices, restrooms, and a concession area for the park.
West Lake’s 2023 Annual Report highlights that the West Lakes Main Street invested nearly $10.7 million into the district, with 1.2% coming from private investments. The district also welcomed 36 new businesses, created 147 jobs, and benefited from 2,289 volunteer hours contributed by residents and businesses.
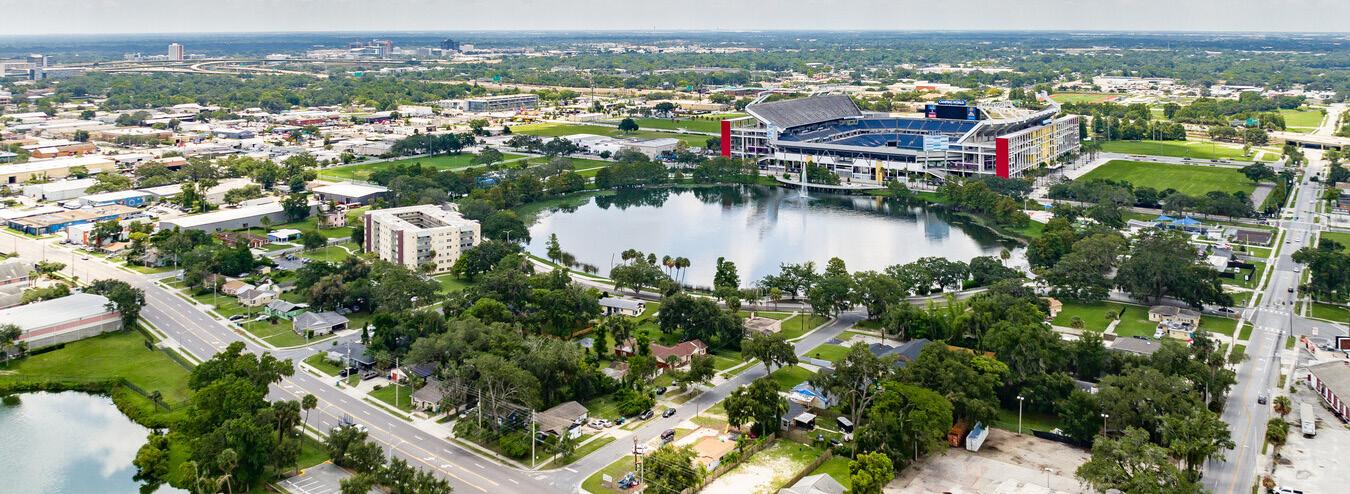
City of Orlando
West Lakes
Main Street
Orlando Main Streets
West Lakes strives to become a promising hub for business growth and community revitalization. Key priority projects and programs within West Lakes include:

Camping World Stadium — In January 2024, the Orange County Board of County Commissioners approved $400 million for stadium renovations, including 18,000 new upper deck seats, connecting the east and west sides, and building a 100,000-square-foot multi-purpose venue. The renovations are expected to be completed by 2027.

Community Events — West Lakes organizes a variety of community events yearround. Key events in the district include The Conversation, an in-person event to connect with like-minded individuals and engage in thought-provoking discussions on topics like financial literacy, entrepreneurship, mental health, affordable housing, and health and wellness.
Another community event in West Lakes is Play Date, held at Lake Lorna Doone Park. This event offers games, activities, food trucks, local vendors, live entertainment, and an esports area with tournaments and giveaways, making it enjoyable for all ages. Play Date aims to provide attendees with opportunities to learn about local organizations and businesses, as well as resources available in their area. In addition, West Lakes hosts other various pop-up events and fundraisers year-round.
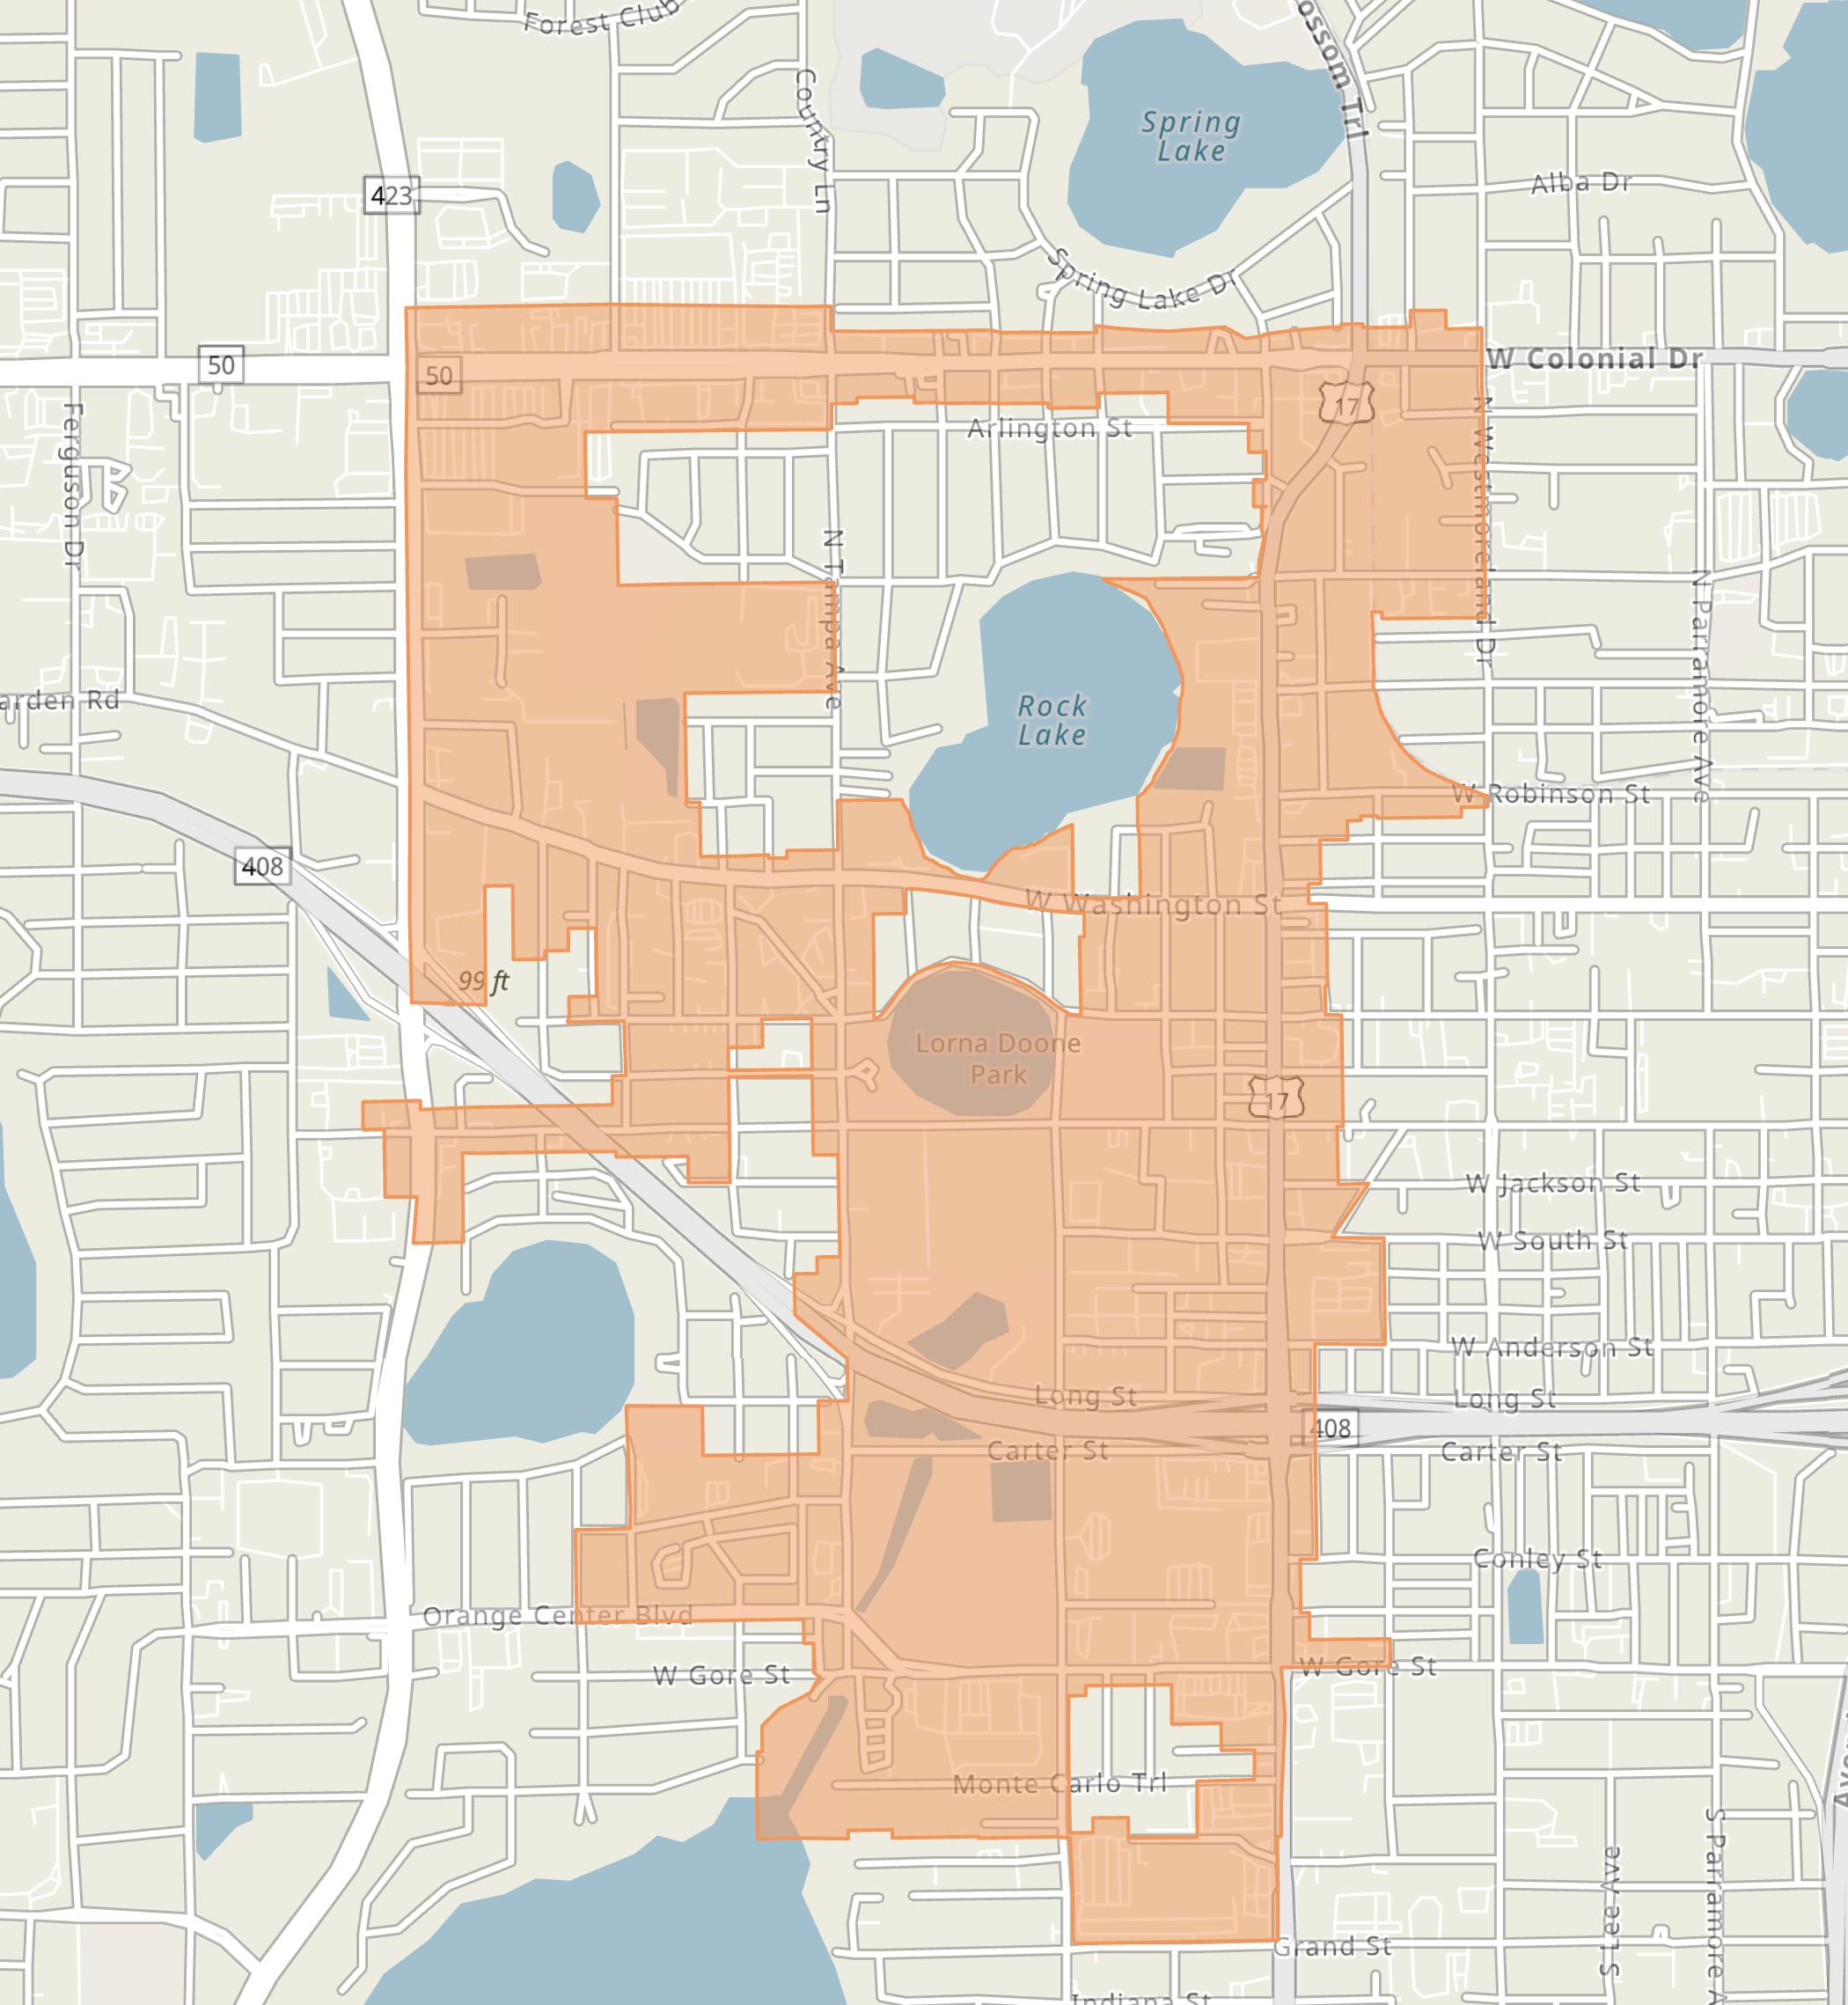
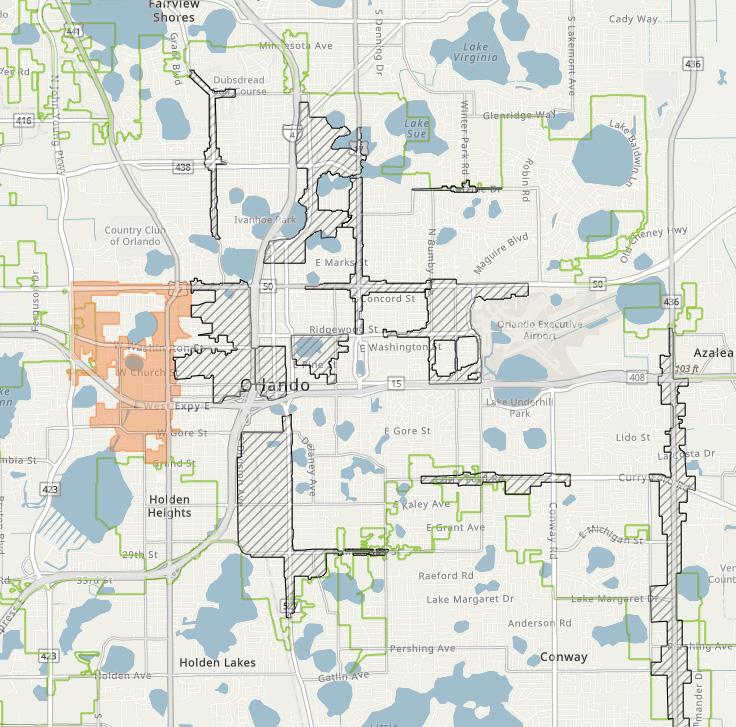
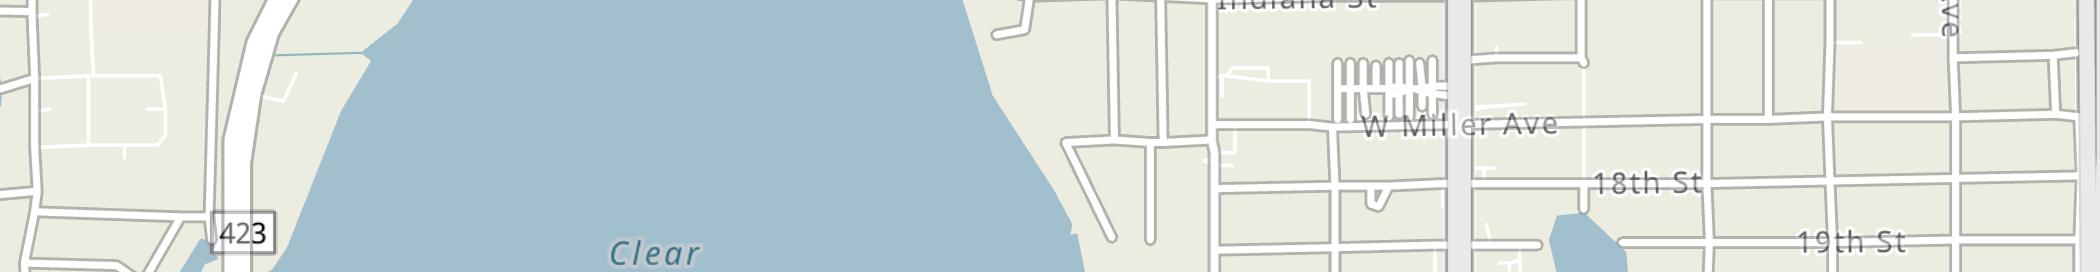
As of year-end 2023, the West Lakes District’s total employees compose approximately 2.0% of the total employment within the City. The West Lakes District’s employment sector is primarily dominated by the public administration, other services, and accommodation and food services industries, as illustrated in the table below.
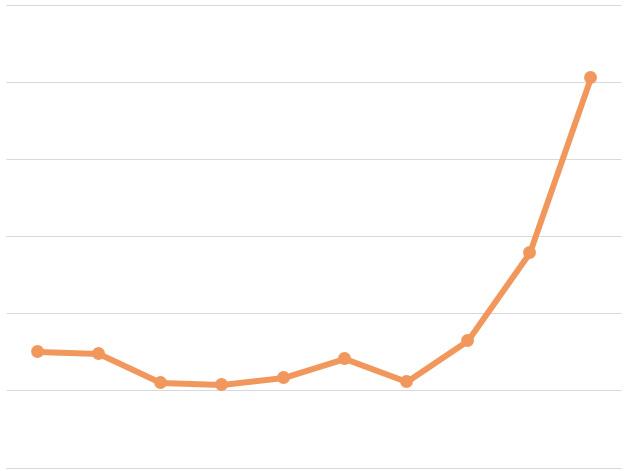
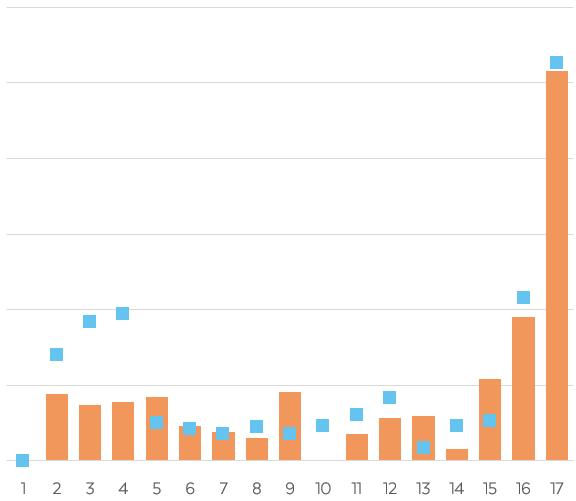
Over the 10-year period, from 2014 to 2023, the West Lakes District’s total employment has experienced a compound annual growth rate (“CAGR”) of 6.5%. This growth rate is significantly greater than the City’s 2.3% CAGR during the same period. The figure above illustrates the West Lakes District total annual employment trends from 2014 through 2023.
In addition, the West Lakes District’s total employment increased from 4,012 employees in 2014 to 7,561 employees in 2023—resulting in a net increase of 3,549 total employees. During this same time frame, the West Lakes District has captured over 4.6% of the City’s total growth in employment.
A location quotient (“LQ”) is an analytical statistic that measures how concentrated a particular industry is within an area. The above figure illustrates the concentration of employment by industry sector within the West Lakes District, as compared to the concentration within the City for year-end 2023. The West Lakes District has a higher concentration of industry professionals (LQ greater than 1.0) in the public administration, other services (excluding public administration), wholesale trade, manufacturing, and construction services industries. The West Lakes District and the City are equally specialized (LQ equals 1.0) in the educational services industry.
As of year-end 2023, residents of the West Lakes District spent an estimated $29.1 million, with 34% allocated to housing, 31% to retail goods, 12% to food (both away from home and at home), 8.0% to health care, and 3.9% to entertainment and recreation. This spending pattern highlights the dominance of housing and retail, which together account for 65% of total expenditures. Additionally, food and health care make up 20.1% of the consumer spending budget, while entertainment and recreation represents the smallest portion of consumer spending. Within the broader context, total expenditures within the West Lakes District make up approximately 0.3% of the consumer spending within the City, with over $11.421 billion in total expenditures as of year-end 2023.
As of year-end 2023, the West Lakes District’s for-sale residential market included only 16 singlefamily homes, representing 0.03% of the total single-family residential units within the City. West Lakes does not contain any residential condo units as of year-end 2023.
The West Lakes District includes small portions of several neighborhoods, such as Lorna Doone, Lake Sunset, Haralson Estates, and Rock Lake. Total inventory of residential units within the West Lakes District has remained unchanged for single-family homes over the past five years, 2019 through 2023.
As of year-end 2023, West Lakes District’s average single-family residential assessed and taxable value per unit was $112,130 and $96,280, respectively
The West Lakes District experienced zero singlefamily unit sales in 2023.
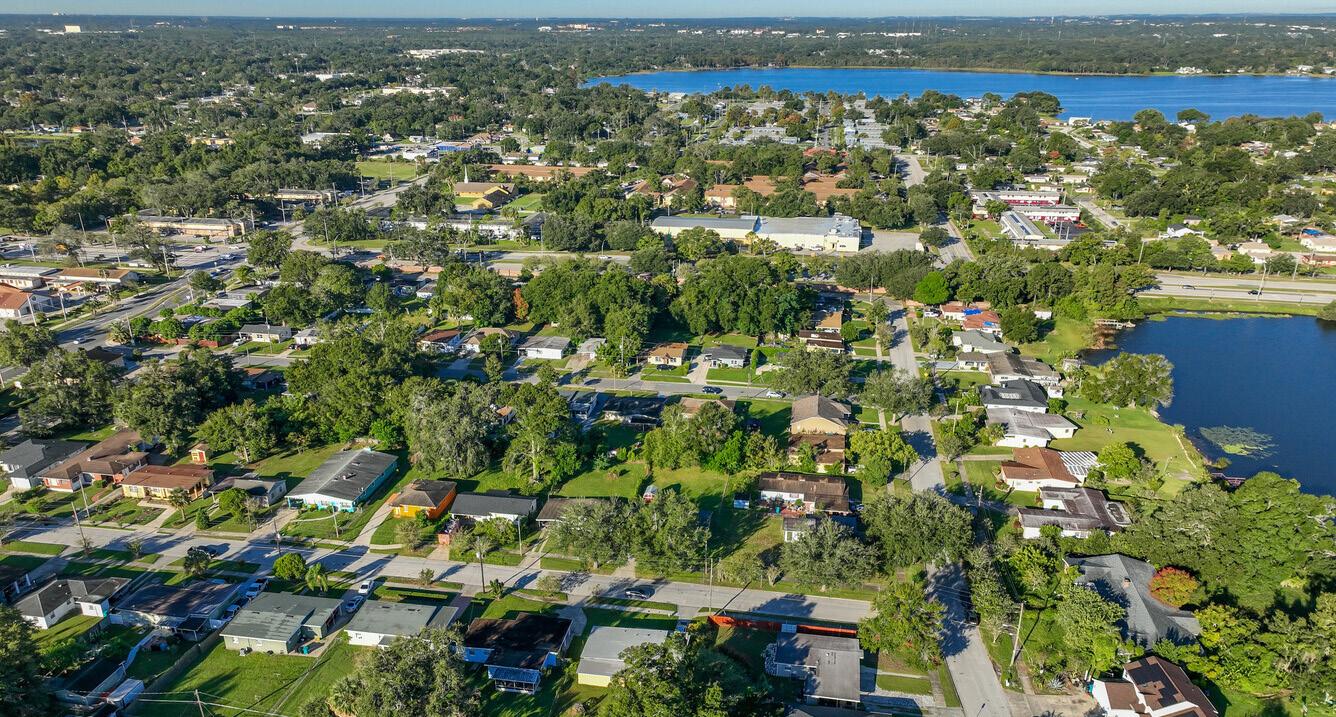
As of year-end 2023, West Lakes’ commercial real estate market composed nearly 4.1 million square feet (“sq. ft.”) of office, retail, and industrial/flex space, in addition to 459 hotel rooms, and 1,365 for-rent market-rate multi-family residential units, as illustrated in the market characteristics table below.
Industrial/flex space composed the majority of West Lakes’ office, retail, and industrial/flex inventory at 64% of the total, followed by office and retail space with nearly 18% of the total share, as of year-end 2023. Specifically, the office space within West Lakes consists of zero Class A space, 46% Class B space, and 54% Class C space.
Although industrial/flex properties encompassed the greatest amount of commercial space within West Lakes, retail and office properties had higher occupancy rates 99.7% and 97.2%, respectively, as of year-end 2023. Moreover, occupancy rates for West Lakes’ hotel and for-rent multi-family market were 59.5% and 93.6%, respectively, during this same period. In addition, West Lake’s average rental rates for its industrial/flex properties were greater than those of the City as of year-end 2023; whereas, the district’s office, retail, hotel, and for-
rent multi-family markets had an average rental rate lower than that of the City during this same time period.
There were 26 lease transactions that occurred in West Lakes’ office, retail, and industrial/flex markets—resulting in a total of approximately 82,400 sq. ft. leased during 2023. Leasing activity refers to the volume of square footage that is committed to and actually signed in a given period of time, including direct leases, subleases, and renewals of existing leases.
Gross absorption measures the total sq. ft. occupied within existing buildings over a given period, without accounting for vacated space. As of year-end 2023, West Lakes’ total gross absorption equated to 167,323 sq. ft. of commercial space. In addition, West Lakes’ forrent multi-family residential market experienced negative absorption of 18 units during this same time frame.
The following pages illustrate major development activities, year-over-year snapshots, and five-year annual trends for West Lakes’ commercial real estate market.
Office space remained unchanged from the prior year at 742,708 sq. ft.
Vacancy rates for office properties increased 0.1 percentage points, from 2.7% to 2.8%.
Average rental rates per sq. ft. decreased 1.1%, from $21.08 to $20.84.
Leasing activity of office space decreased 42%
Over the past five years, 2019 to 2023, West Lakes saw the addition of 26,400 sq. ft. of retail space, 14,500 sq. ft. of industrial/flex space, as well as 120 for-rent multi-family units. In addition to 115,280 sq. ft. of industrial/ flex space and 6,345 sq. ft. of retail space built in 2019, as illustrated in the graphics below. Within West Lakes, there is zero underconstruction activity as of year-to-date 2024, through August 2024. However, during this same time frame, there are 529 for-rent multifamily units proposed within 3 development projects located in West Lakes.
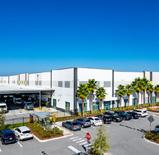
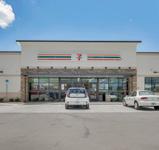
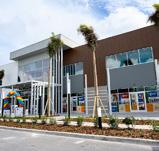
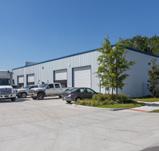
Retail space increased 3.8% from the prior year from 693,143 sq. ft. to 719,543 sq. ft.
Vacancy rates increased 0.2 percentage points, from 0.1% to 0.3%.
Average rental rates per sq. ft. increased 116%, from $12.15 to $26.22.
Leasing activity of retail space decreased 100%
Industrial/flex space remained unchanged from the prior year at 2.6 million sq. ft.
Vacancy rates increased 1.0 percentage points, from 2.4% to 3.4%.
Average rental rates per sq. ft. increased 32%, from $9.59 to $12.61.
Leasing activity increased 9.0% from the prior year.
Hotel inventory remained unchanged from the prior year at 459 rooms.
Vacancy rates for hotel properties increased 5.7 percentage points, from 34.8% to 40.5%.
Average daily rate (“ADR”) for hotel rooms increased 1.0%, from $73.83 to $74.56.
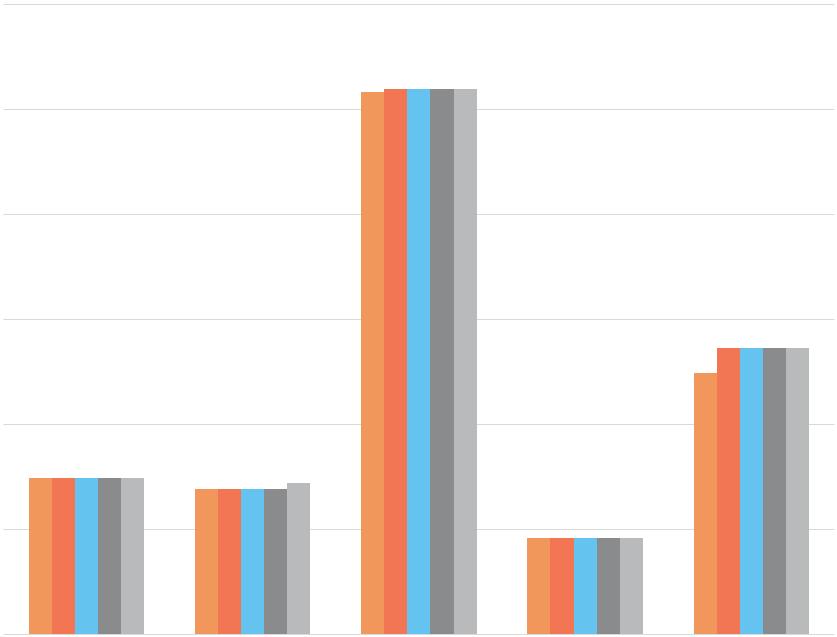
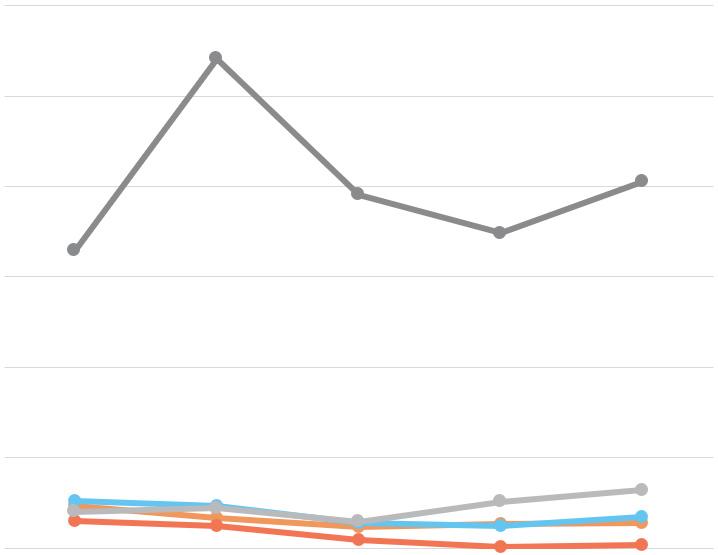
Over the past five years, 2019 to 2023, total inventory of commercial space within West Lakes experienced increases of 26,400 sq. ft. of retail space, 14,500 sq. ft. of industrial/flex, and 120 rental multi-family units with the addition of Pendana at West Lakes. During this same time frame, total office space and hotel rooms remained unchanged within West Lakes.
Comparatively, the new inventory within West Lakes over the past five years accounted for 15% of the City’s new retail space, 0.04% of the City’s new industrial/flex space, and 1.0% of the City’s new forrent multi-family inventory.
Over the past five years, West Lakes saw increases in vacancy rates of 7.6 and 2.4 percentage points in the hotel and for-rent multi-family market, respectively. Rising vacancy rates are likely due to a shortage of desirable rental spaces and high rental costs exceeding what the local market can afford. However, notable increases from 2020-2022 may also be a result of the COVID-19 pandemic. In contrast, West Lakes’ retail, office, and industrial/flex markets experienced a 2.7, 1.9, and 1.8 percentage point decline in vacancy rates, respectively, over the past five years—which may be attributed to an increase in spending and demand for rentable spaces.
For-rent multi-family units remained unchanged from the prior year at 1,365 units.
Vacancy rates increased 1.3 percentage points for multi-family properties, from 5.1% to 6.4%.
Average rental rates per unit decreased 5.0%, from $1,042 to $990.
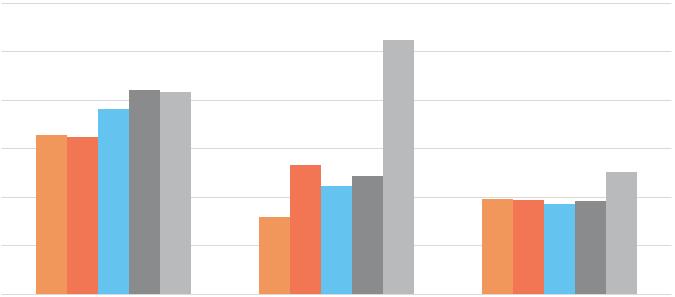
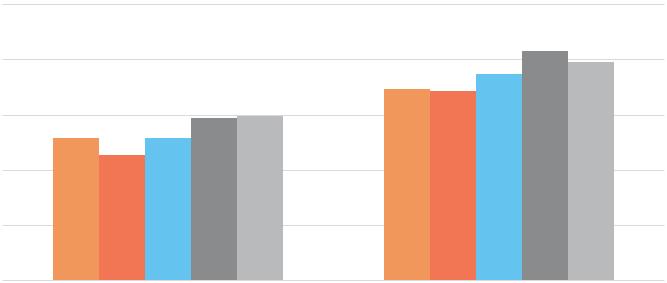
Over the past five years, 2019 to 2023, the average rental rates per sq. ft. within West Lakes experienced an increase of 27%, 231%, and 28% for office, retail and industrial/flex spaces, respectively. Average daily rates for hotel rooms also increased 16% and average rental rates per unit for multi-family increased 14% during this same time frame. Increases in average rental rates may be attributed to rising operating and fixed costs, as well as properties in desirable locations or with premium amenities that can command higher rents.
The Parramore Main Street (“Parramore”), part of the Main Street America program, is renowned for its rich history, vibrant culture, and diverse community offerings. Spanning approximately 397 acres bordered by State Road 50 (Colonial Drive) to the north, Interstate 4 to the east, State Road 408 to the south, and North Westermoreland Drive to the west, Parramore offers convenient access for both northsouth and east-west commuters, as shown in the map on the following page.
Founded in the late 1800s, Parramore is Orlando’s oldest and largest African-American neighborhood. It became the heart of the City’s Black community during segregation, with residents of diverse ethnic backgrounds, including African, African-American, Caribbean, and Seminole Indian. Parramore developed a distinct identity with its social, religious, and commercial establishments and played a significant role in Central Florida’s civil rights history.
Parramore was a pivotal hub of the Chitlin’ Circuit, a network of venues that hosted prominent African-American entertainers during segregation. Additionally, religious institutions in Parramore were central to its social and political fabric. The historic Shiloh Baptist Church played a monumental role in the civil rights movement in the Central Florida Region. It was a gathering place for activism and progress, highlighted by a visit from Dr. Martin Luther King Jr., who spoke in Orlando as part of his national campaign for justice and equality.
Parramore’s legacy businesses have also left an indelible mark on the region. Establishments like Carter’s Barbershop and Black Bottom House of Prayer stand as testaments to the entrepreneurial spirit and communal bonds that have sustained Parramore for generations. These businesses, along
with iconic venues like the historic Wells’ Built Hotel, which once served as a vital lodging for Black travelers and performers, are living reminders of the neighborhood’s vibrant history.
Today, Parramore is Orlando’s only Commercial National Registered Historic District, recognized for its rich African-American heritage. In 2022, Parramore became the City’s twelfth Main Street District, offering a platform for all stakeholders to support business owners, property owners, and residents in creating a vibrant and collaborative community.
Parramore’s mission as a non-profit is to bridge the gap between its rich history and progressive future, fostering meaningful community engagement between residents and business owners. A key goal is to honor and preserve the community’s rich African American heritage while promoting economic revitalization and advocating for the vibrant future envisioned by its stakeholders.
In addition, Parramore has emerged as the premier entertainment and sports district of the City, encompassing prominent venues such as the KIA Center, Inter&Co Stadium, and Creative Village.
The KIA Center, formerly known as the Amway Center, is an indoor arena on South Division Avenue, built in 2010. It hosts concerts, sports, and entertainment events, and is home to the Orlando Magic, Orlando Solar Bears, and Orlando Predators.
Inter&Co Stadium, formerly known as Orlando City Stadium, is a 25,000-seat soccer-specific stadium. Opened in 2017, the stadium is home to a Major League Soccer (“MLS”) team, Orlando City, and a National Women’s Soccer League (“NWSL”) team, Orlando Pride.
Lastly, Creative Village, built on the former Amway Arena site, is a mixed-use, transit-oriented neighborhood featuring the UCF/Valencia Downtown Campus, which serves over 8,000 students and integrates education, residential, and commercial spaces in the heart of downtown.
Parramore’s 2023 Annual Report highlights that the Parramore Main Street invested $3.3 million into the district, with 2.3% coming from private investments. The district also welcomed 11 new businesses, created 24 jobs, and benefited from 345 volunteer hours contributed by residents and businesses.
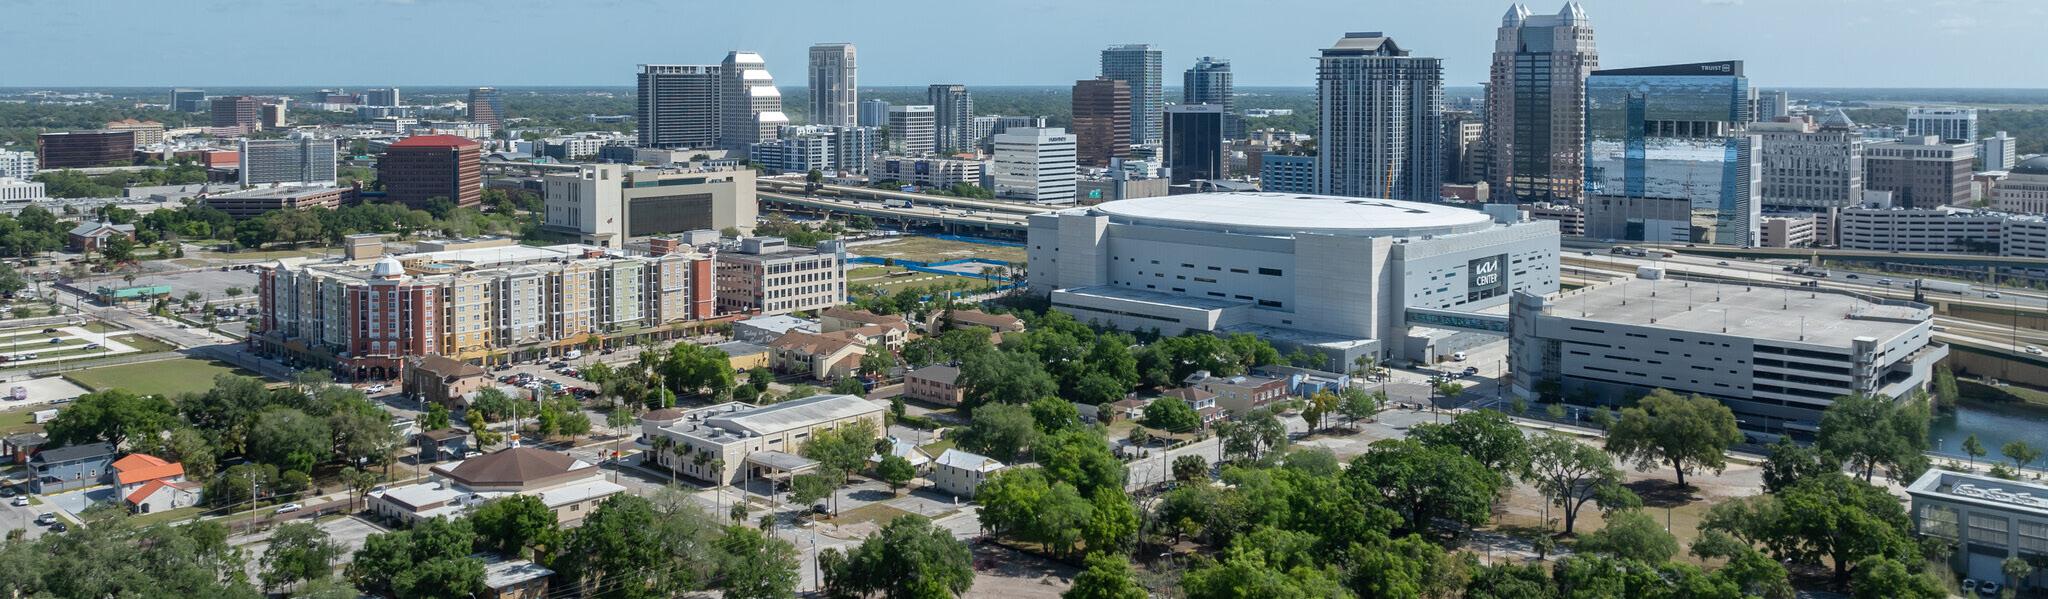
Parramore is committed to bridging the gap between its rich history and progressive future, while encouraging the vitality of meaningful community engagement between residents and business owners. Key priority projects and programs within Parramore include:

Parramore Mural Projects — In 2022, the district awarded grants for three new mural installations and revitalization efforts. Artists, recruited through a partnership with Art of Collab, focused on Parramore’s history, heritage, and heart, drawing inspiration from its African American history and cultural significance in Florida. Parramore continues to promote murals that highlight its rich history and heritage.

Parramore Hive Event — In partnership with Ideas for Us, this event gathers stakeholder feedback on sustainability and environmental needs in the Parramore community. Based on this feedback, nine action projects focusing on design and beautification have been created.
Westcourt Orlando — The Orlando Magic is developing a $500 million mixed-use complex across from KIA Center on Church Street. Approved in 2020 and amended in 2024, the 8.4-acre site will feature a 261-room luxury hotel, 80,000 sq. ft. of entertainment space, 305,000 sq. ft. of office space, 166,000 sq. ft. of retail, 781 residential units, an open-air plaza, a 3,500-seat event venue, and a 1,800-space parking garage. Formerly known as the Sports & Entertainment District, the project is expected to be fully completed in 2 years.
Legend
City of Orlando
Parramore District
Main Street
Orlando Main Street
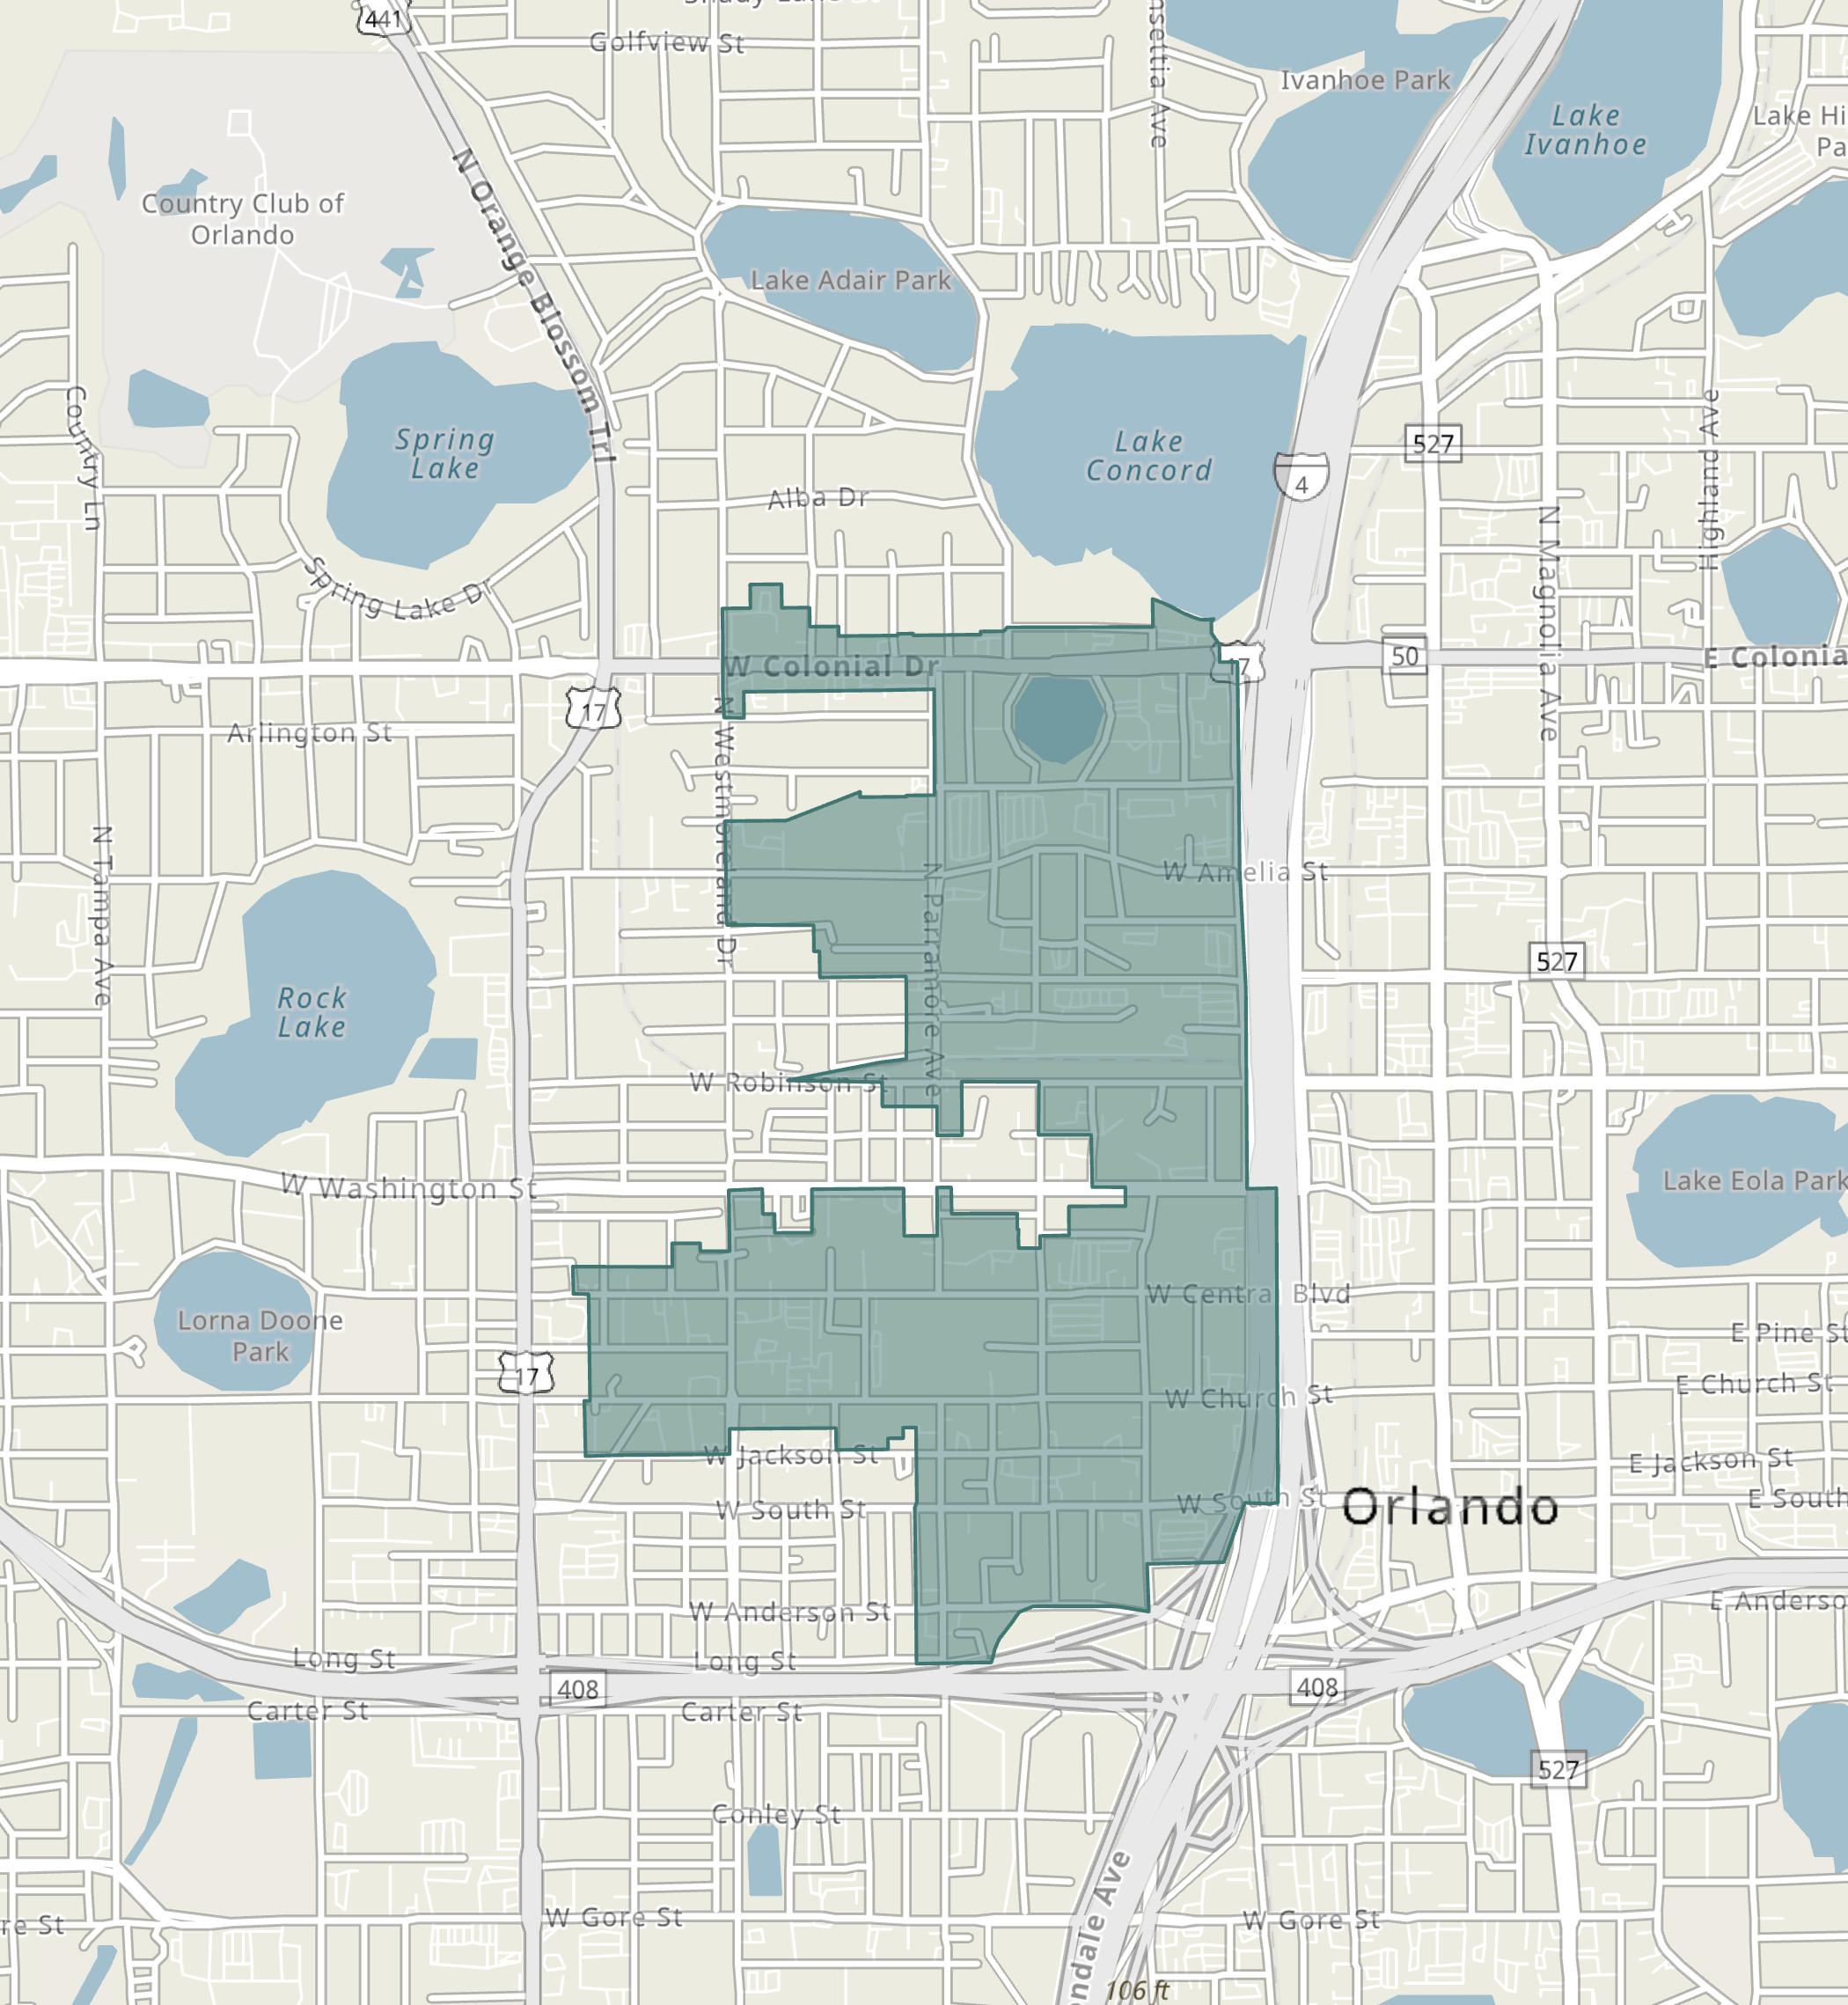
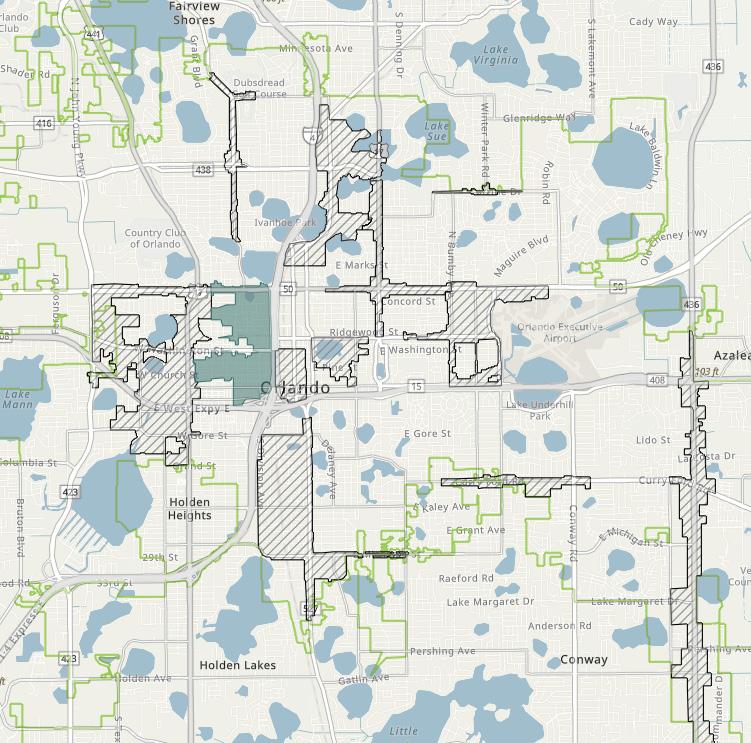

As of year-end 2023, Parramore’s total employees compose approximately 2.2% of the total employment within the City. Parramore’s employment sector is primarily dominated by the public administration, educational services, and accommodation and food services industries, as illustrated in the table below.
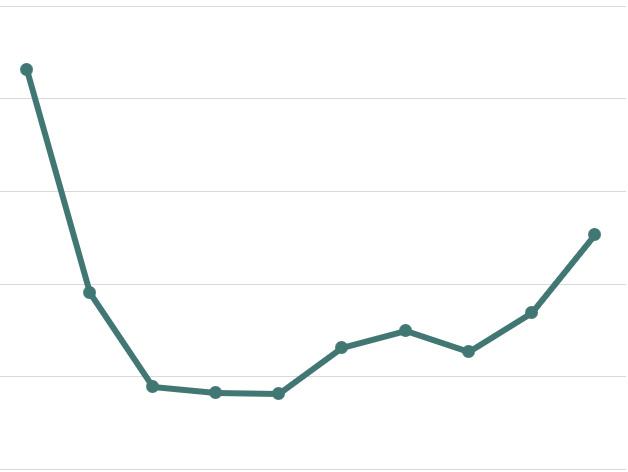
Over the 10-year period, from 2014 to 2023, Parramore’s total employment has experienced a negative compound annual growth rate (“CAGR”) of 1.0%. This growth rate differs substantially from the City’s positive 2.3% CAGR during the same period. The figure above illustrates Parramore’s total annual employment trends from 2014 through 2023.
In addition, Parramore’s total employment decreased from 9,156 employees in 2014 to 8,266 employees in 2023—resulting in a net decrease of 890 total employees.
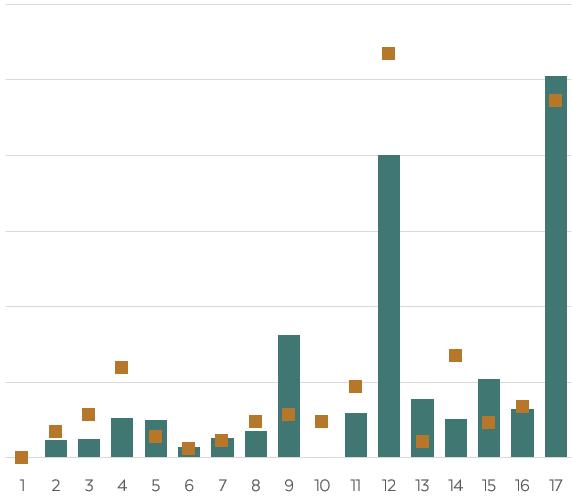
A location quotient (“LQ”) is an analytical statistic that measures how concentrated a particular industry is within an area. The above figure illustrates the concentration of employment by industry sector within Parramore, as compared to the concentration within the City for year-end 2023. Parramore has a higher concentration of industry professionals (LQ greater than 1.0) in the educational services, public administration, arts and recreation services, wholesale trade, and administration and support services industries.
As of year-end 2023, residents of Parramore spent an estimated $53.2 million, with 35% allocated to housing, 30% to retail goods, 12% to food (both away from home and at home), 7.6% to health care, and 3.8% to entertainment and recreation. This spending pattern highlights the dominance of housing and retail, which together account for 65% of total expenditures. Additionally, food and health care make up 19.9% of the consumer spending budget, while entertainment and recreation represents the smallest portion of consumer spending. Within the broader context, total expenditures within Parramore make up approximately 0.5% of the consumer spending within the City, with over $11.421 billion in total expenditures as of year-end 2023.
As of year-end 2023, Parramore’s for-sale residential market included only 37 single-family homes, representing 0.07% of the total singlefamily residential units within the City. Parramore does not contain any residential condo units as of year-end 2023.
Parramore includes parts of three distinct neighborhoods, including the Parramore, Lake Dot, and Callahan neighborhoods. Total inventory of residential units within Parramore has remained unchanged for single-family homes over the past five years, 2019 through 2023.
As of year-end 2023, Parramore’s average singlefamily residential assessed and taxable value per unit was $109,640 and $94,000, respectively.
Parramore experienced zero single-family unit sales in 2023.
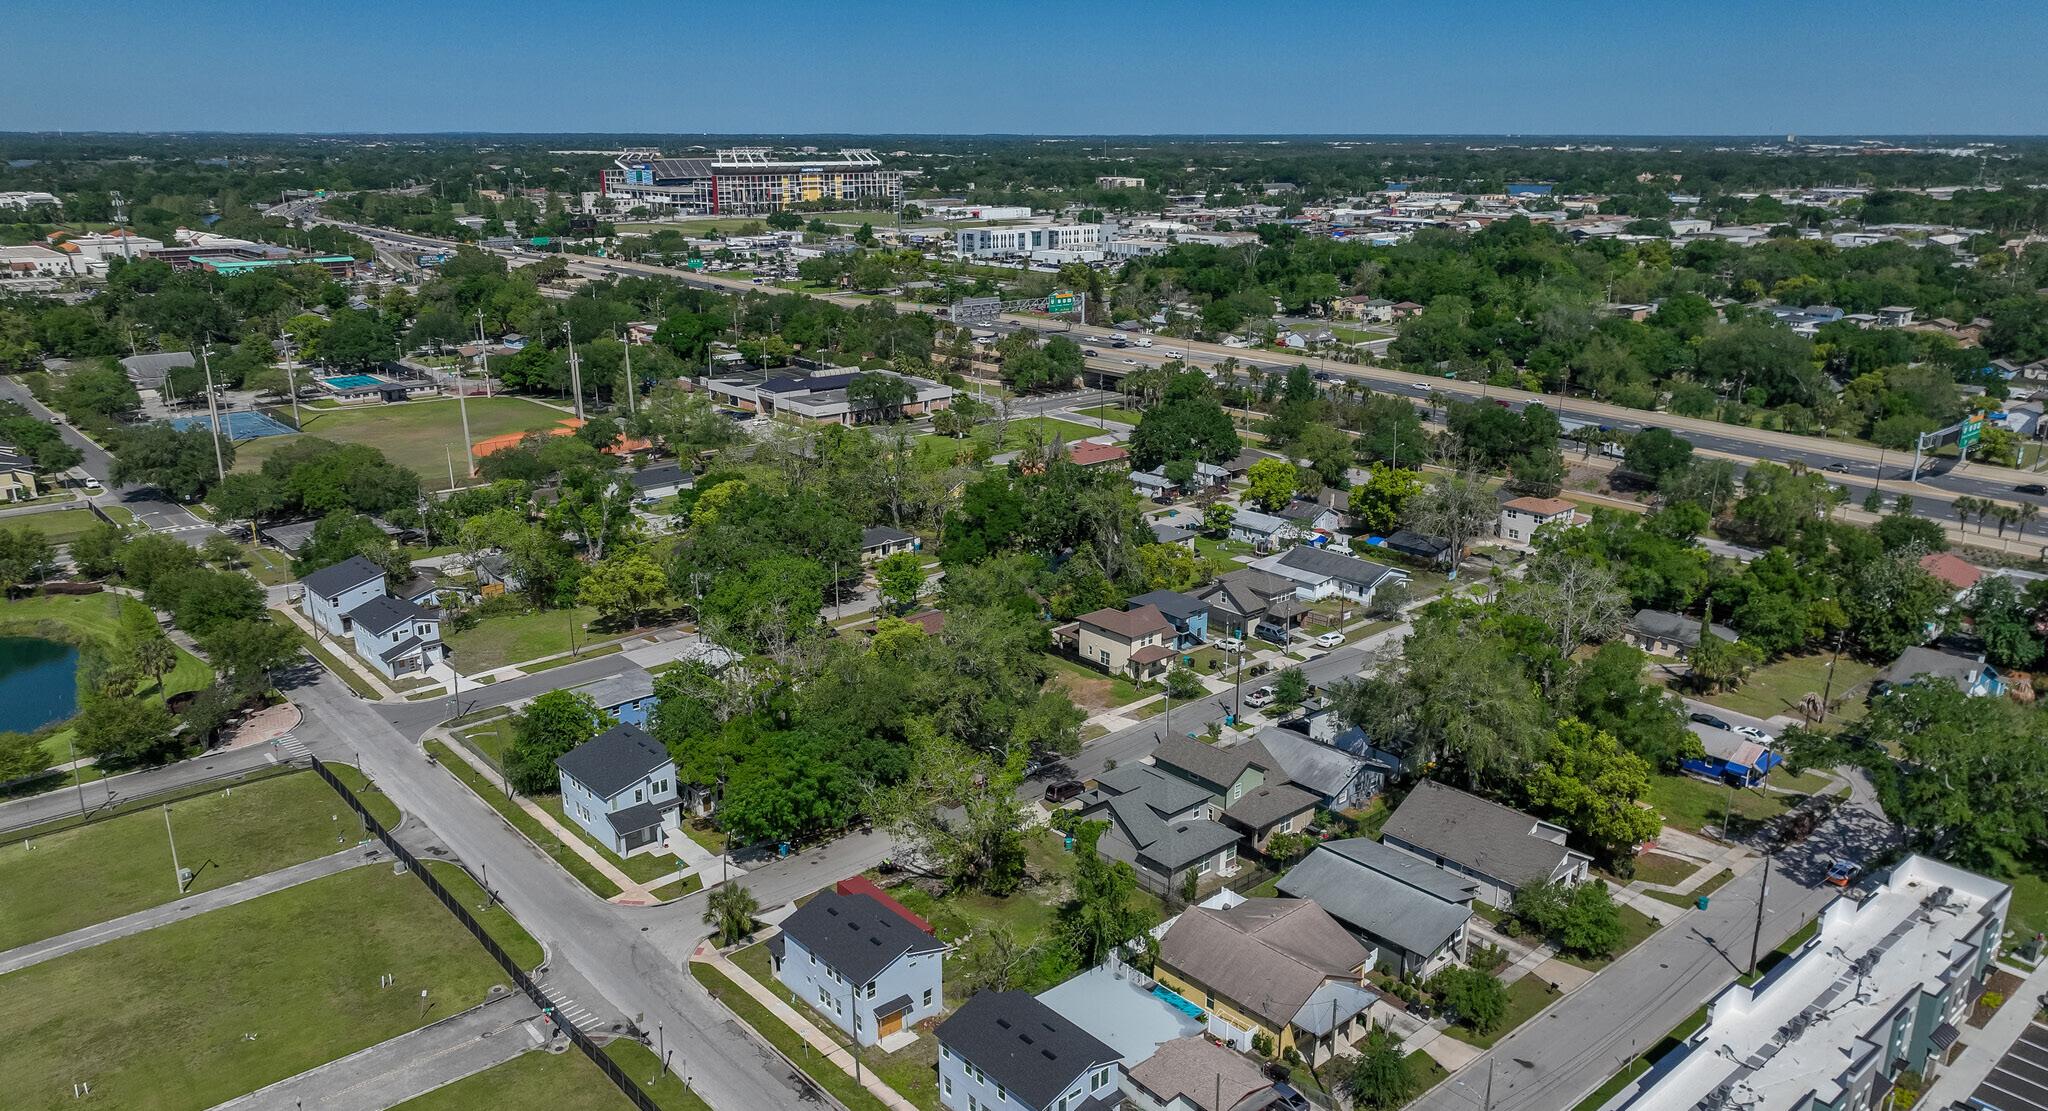
As of year-end 2023, Parramore’s commercial real estate market composed nearly 3.4 million square feet (“sq. ft.”) of office, retail, and industrial/ flex space, 540 hotel rooms, and 1,800 for-rent market-rate multi-family residential units, as illustrated in the market characteristics table below.
Office space composed the majority of Parramore’s office, retail, and industrial/ flex inventory at 55% of the total, followed by industrial/flex space with 33% of the total share, as of year-end 2023. Specifically, the office space within Parramore consisted of 31% Class A space, 14% Class B space, and 55% Class C space.
Office properties within Parramore encompassed the greatest amount of commercial space and had the greatest occupancy at 99.8% compared to that of the industrial/flex and retail properties with 96.1% and 91.9% occupancy rates, respectively. Moreover, occupancy rates for Parramore’s hotel and for-rent multi-family market were 68.1% and 93.7%, respectively, during this same period.
In addition, Parramore’s average rental rates for its retail, industrial/flex, and hotel markets were greater than those for the City as of year-end 2023;
whereas, the district’s office and for-rent multifamily markets had an average rental rate lower than that of the City during this same time period.
There were 12 lease transactions that occurred in Parramore’s office, retail, and industrial/flex markets—resulting in a total of approximately 106,650 sq. ft. leased during 2023. Leasing activity refers to the volume of square footage that is committed to and actually signed in a given period of time, including direct leases, subleases, and renewals of existing leases.
Gross absorption measures the total sq. ft. occupied within existing buildings over a given period, without accounting for vacated space. As of year-end 2023, Parramore’s total gross absorption equated to 115,530 sq. ft. of commercial space. In addition, Parramore’s for-rent multifamily residential market experienced a positive absorption of 76 units during this same time frame.
The following pages illustrate major development activities, year-over-year snapshots, and five-year annual trends for Parramore’s commercial real estate market.
Office space remained unchanged from the prior year at 1.86 million sq. ft.
Vacancy rates for office properties decreased 2.1 percentage points, from 2.3% to 0.2%.
Average rental rates per sq. ft. decreased 1.1%, from $23.07 to $22.82.
Leasing activity of office space decreased 100%
Over the past five years, 2019 to 2023, Parramore saw the addition of approximately 394,100 sq. ft. of office space and 701 forrent multi-family units within 3 properties. In addition to 181,152 sq. ft. of retail space, 1,572 sq. ft. of office space, and 256 multifamily units in 2019, as illustrated in the graphics below. To note, Parramore also added 150 affordable multi-family units, with the construction of Palm Garden Orlando Apartments in 2020. Within Parramore, there is zero under-construction activity as of yearto-date 2024, through August 2024.
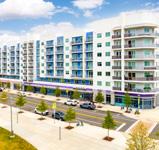
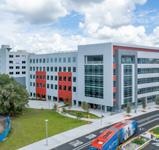
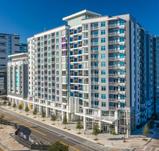
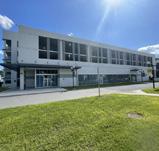
Retail space remained unchanged from the prior year at 460,793 sq. ft.
Vacancy rates for retail properties increased 2.1 percentage points, from 6.0% to 8.1%.
Average rental rates per sq. ft. increased 97.5%, from $16.89 to $33.35.
Leasing activity of retail space increased 91%
Industrial/flex space remained unchanged from the prior year at 1.04 million sq. ft.
Vacancy rates decreased 2.3 percentage points, from 6.2% to 3.9%.
Average rental rates per sq. ft. decreased 7.1%, from $13.59 to $12.63.
Leasing activity of industrial/flex space increased 15%.
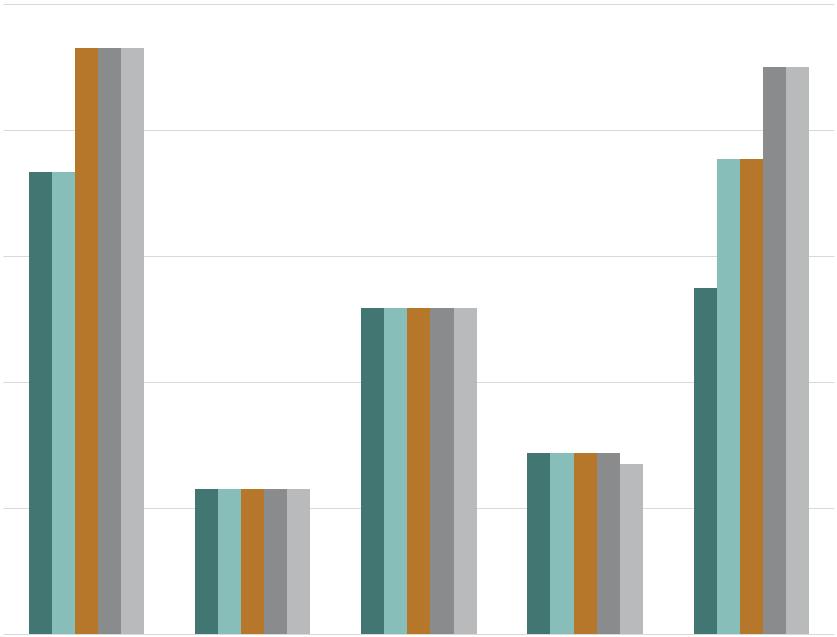
Over the past five years, 2019 to 2023, total inventory of commercial space within Parramore experienced increases of 394,110 sq. ft. of office space and 701 rental multi-family units with the addition of Modera at Creative Village and the Julian Apartments. During this same time frame, total retail and industrial/flex space remained unchanged, while hotel room inventory experienced a decline of 36 rooms.
Comparatively, the new inventory within Parramore over the past five years accounted for 15% of the City’s new office space and 5.9% of the City’s new rental multi-family inventory.
Hotel inventory decreased 6.3% from the prior year, from 576 rooms to 540 rooms.
Vacancy rates for hotel properties increased 0.5 percentage points, from 31.4% to 31.9%.
Average daily rate (“ADR”) for hotel rooms increased 3.6%, from $164.02 to $170.30.
For-rent multi-family units remained unchanged from the prior year at 1,800 units.
Vacancy rates decreased 4.2 percentage points for multi-family properties, from 10.5% to 6.3%.
Average rental rates per unit decreased 4.5%, from $1,566 to $1,496.
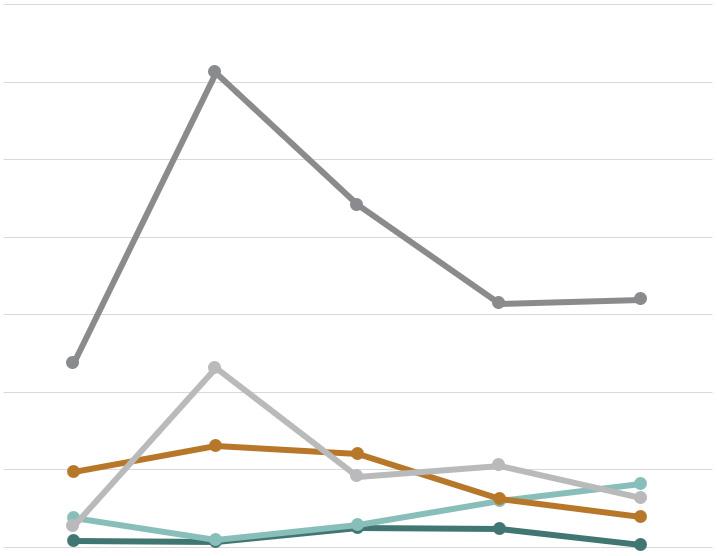
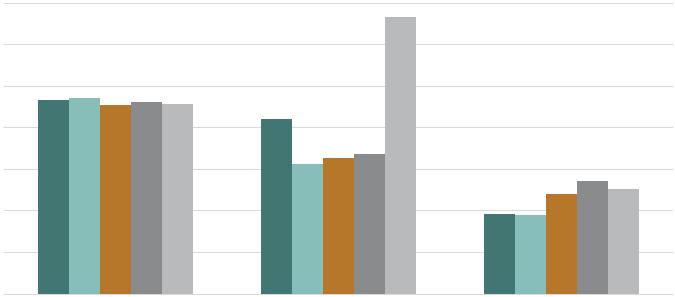
Over the past five years, Parramore saw increases in vacancy rates of 4.3, 8.2, and 3.6 percentage points in the retail, hotel, and for-rent multi-family market, respectively. Rising vacancy rates are likely due to a shortage of desirable rental spaces and high rental costs exceeding what the local market can afford. However, notable increases from 2020-2022 may also be a result of the COVID-19 pandemic. In contrast, Parramore’s office and industrial/flex markets experienced a 0.6 and 5.8 percentage point decline in vacancy rates, respectively, over the past five years—which may be attributed to an increase in demand for rentable office and industrial/flex space.
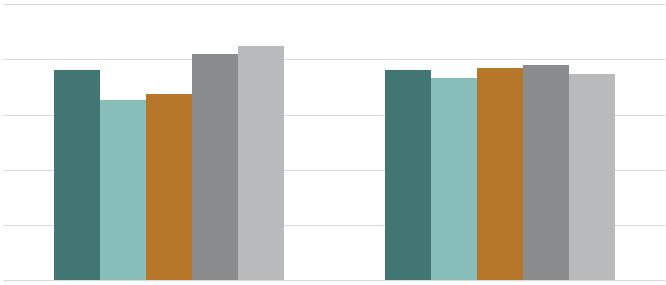
Over the past five years, 2019 to 2023, the average rental rates per sq. ft. for commercial space within Parramore experienced significant increases of 60% and 31% for retail and industrial/flex space, respectively, as well as an increase of 11% in average daily rates for the hotel market. Increases in average rental rates may be attributed to rising operating and fixed costs, as well as properties in desirable locations or with premium amenities that can command higher rents.
▪ The City of Orlando Market Report (“Publication”) is intended for the City of Orlando’s (“City” or “Client”) use for purposes of information, marketing, and other activities. The Publication may be used in its entirety for those purposes. Partial excerpts of, or partial references to the Publication, in any form must acknowledge that these passages are out of context and the entire Publication must be considered or viewed.
▪ GAI Consultants has no present or prospective interest in any property located within the City. The content of the Publication should not be construed as legal, financial, regulatory, or investment advice.
▪ Possession of the Publication or copy thereof by anyone other than the Client, does not carry with it the right of publication or reproduction. Neither the Publication nor its contents, nor any reference to our firm may be included or quoted in any real estate offering or registration statement, or other agreement or document, without our prior permission. Permission will be granted upon meeting certain conditions.
▪ Certain data used in compiling the Publication was furnished from sources which we consider reliable; however, we do not guarantee the correctness of such data, although so far as possible, we have made reasonable, diligent efforts to check and/ or verify the same and believe it to be accurate.
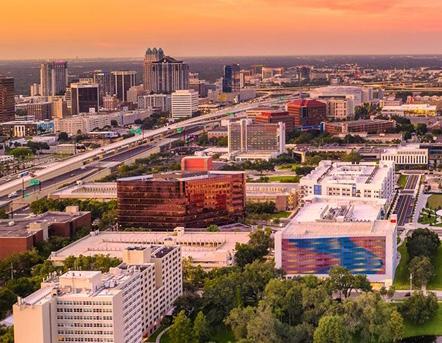
There could be small errors of fact based on data and methods of reporting or accounting for that data. No liability is assumed for omissions or inaccuracies that subsequently may be disclosed for any data used in the Publication.
▪ GAI Consultants has no obligation to update the Publication for information or knowledge of events or conditions that become available after the date of publication.
▪ In no event shall either party be liable for any loss of profits, loss of business, or for any indirect, special, incidental or consequential damages of any kind.
▪ Authorization and acceptance of, and/or use of, the Publication constitutes acceptance of the above terms and limiting conditions.
▪ The precise nature of the smaller planning areas, as well as the release schedule of data from certain sources both public and proprietary, presents certain challenges to capturing each indicator uniformly and consistently, necessitating estimation or interpolation in some cases. In other cases, data sets are reported only for specific ZIP Code or Census Tract boundaries which have been aggregated. While the data set can be used to infer conclusions about large geographic areas with great statistical certainty—the smaller the area of interest, the greater the margin of error.