Continued from page 29 the use of that equipment as the chlorine source in the monochloramine formation. The Flatford facility had no source disinfection and required pH adjustment of the source water (raw water in the range of 6.5 pH, where greater than 8 is conducive to chloramine formation), as well as the chlorine and ammonia source chemical. St. Cloud Pilot Study Jones Edmunds coordinated with FDEP for the approval of a two-month pilot test between Feb. 13 and April 13, 2020, to demonstrate the effectiveness of monochloramine as an alternative disinfection method and to maintain reduced TTHM and HAA5 levels in the St. Cloud Southside effluent as part of demonstrating the constructability and testing of the installed wells. Figure 5 shows the final well construction diagram for the injection well and associated monitoring wells. The city has an analyzer building where continuous samples of its permitted effluent, before disinfection (EFB,) its flash mixer (where chemical dosing occurs), and its permitted effluent after disinfection (EFA), are hydraulically fed. All samples and measurements were obtained from this source. The existing hypochlorite tanks and pump skids were used for the chlorine source, and the city had a 300-gal ammonium sulfate tote and a spare peristaltic pump for the ammonia source. As part of the FDEP-approved pilot study, the WWTF connected the ammonium sulfate
tote and spare in-house peristaltic pump to the disinfection system. Piping was already installed to convey ammonium sulfate to a dosing location adjacent to the hypochlorite dosing point and immediately upstream of the flash mixer to allow almost instantaneous mixing of chlorine and ammonia sources after dosing. The flash mixer promotes uniform mixing of the chemicals for the formation of monochloramine. When the pilot was initiated, the pump was set at the same flow-paced signal as the hypochlorite feed pumps and at a lower dosing ration, but did not have an automatic residual trim. Monochloramine, free ammonia, and total chlorine measurements were recorded from the sample lines, and sodium hypochlorite and/ or ammonium sulfate doses were adjusted to achieve desired monochloramine levels. The existing hypochlorite and ammonia pumps were manually set to pump at chemical feed rates generally in accordance with the dosing rates required at the variable flow rates of the diurnal pattern of the facility, but were adjusted based on the different live flow rates at the time of testing. The dosing rates were calculated using the chemical equations and molar ratios of the process. The total volume of the one chlorine contact tank online during the pilot was calculated to be approximately 190,300 gal using the dimensions of the tank (106 ft x 8 ft x approximately 10 ft) with three trains. The contact time was calculated based on the live flow rate at the time when the
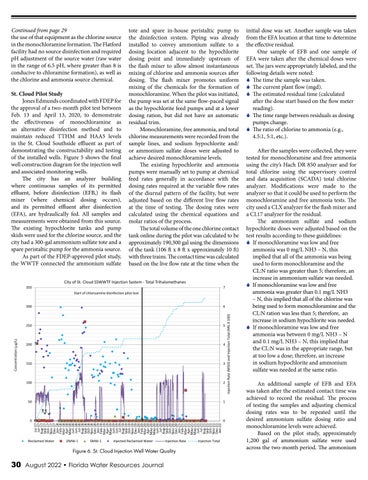
Figure 6. St. Cloud Injection Well Water Quality
30 August 2022 • Florida Water Resources Journal
initial dose was set. Another sample was taken from the EFA location at that time to determine the effective residual. One sample of EFB and one sample of EFA were taken after the chemical doses were set. The jars were appropriately labeled, and the following details were noted: S The time the sample was taken. S The current plant flow (mgd). S The estimated residual time (calculated after the dose start based on the flow meter reading). S The time range between residuals as dosing pumps change. S The ratio of chlorine to ammonia (e.g., 4.5:1, 5:1, etc.). After the samples were collected, they were tested for monochloramine and free ammonia using the city’s Hach DR 850 analyzer and for total chlorine using the supervisory control and data acquisition (SCADA) total chlorine analyzer. Modifications were made to the analyzer so that it could be used to perform the monochloramine and free ammonia tests. The city used a CLX analyzer for the flash mixer and a CL17 analyzer for the residual. The ammonium sulfate and sodium hypochlorite doses were adjusted based on the test results according to these guidelines: S If monochloramine was low and free ammonia was 0 mg/L NH3 – N, this implied that all of the ammonia was being used to form monochloramine and the CL:N ratio was greater than 5; therefore, an increase in ammonium sulfate was needed. S I f monochloramine was low and free ammonia was greater than 0.1 mg/L NH3 – N, this implied that all of the chlorine was being used to form monochloramine and the CL:N ration was less than 5; therefore, an increase in sodium hypochlorite was needed. S If monochloramine was low and free ammonia was between 0 mg/L NH3 – N and 0.1 mg/L NH3 – N, this implied that the CL:N was in the appropriate range, but at too low a dose; therefore, an increase in sodium hypochlorite and ammonium sulfate was needed at the same ratio. An additional sample of EFB and EFA was taken after the estimated contact time was achieved to record the residual. The process of testing the samples and adjusting chemical dosing rates was to be repeated until the desired ammonium sulfate dosing ratio and monochloramine levels were achieved. Based on the pilot study, approximately 1,200 gal of ammonium sulfate were used across the two-month period. The ammonium


