Tree Physiology 25, 929–938
© 2005 Heron Publishing—Victoria, Canada
Tree Physiology 25, 929–938
© 2005 Heron Publishing—Victoria, Canada
1 InstitutfürWaldinventurundWaldwachstum,Georg-August-Universität, Göttingen, Germany
2 Corresponding author(jseo@uni-forst.gwdg.de)
3 Korea Forest Research Institute, 207,Cheongyangni-2dongdongdaemun-gu, Seoul, 130-712, Korea
Received June 9, 2004; accepted February 6, 2005; published online May 2, 2005
Summary
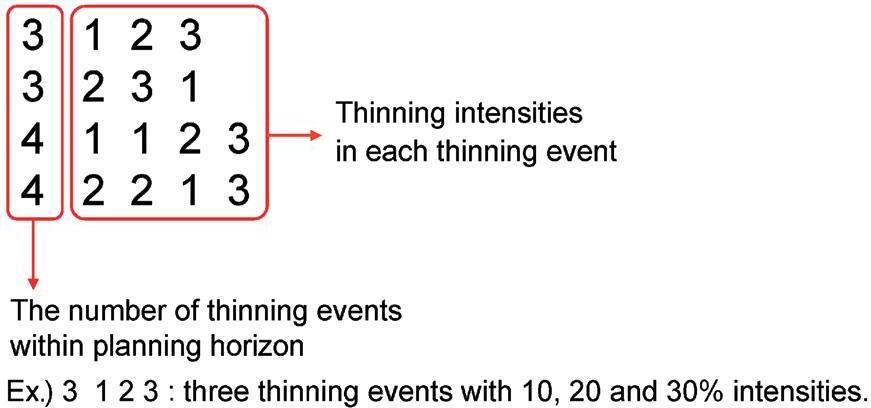
Wepresentanapproachtogenerateandevaluate differentsilviculturaldevelopmentpathsandtooptimizethe developmentofaNorwaysprucestand,usingalong-termplanninghorizon.Togenerateasilviculturalpath,themaximum standdensitywasapplied.Ateachthinningevent,threepossiblethinningintensities(10,20,30%ofthestemnumberperha) wererandomlychosen.Asearchalgorithmknownasmodified AcceleratedSimulatedAnnealing(mASA)wasusedtoestimatetheoptimumcombinationofstandpathsforagivenforest asawhole.Productionandeconomicmanagementobjectives wereconsideredandthencompared.Theeconomiccriterion wastheExpectedStandValue(ESV)witha4%discountrate.
Thegenerateddatasetof38Norwaysprucestands(comprisingatotalof123.8ha)wasusedinthecasestudy.Theresult withthebestcombinationofpathswaspresentedinadigitized forestmap.Forestmanagementsimulationwasperformedusingaspeciallydevelopedcomputerprogram,foraplanning horizonof20years.ThemASAprovedtobeaneffective search method for identifying optimum paths.
Keywords:expectedstandvalue,Norwayspruce,searchalgorithm,silviculturalpath.
Introduction
Amajorchallengeinforestmanagementisintegratingstandlevelandforest-levelobjectives.Astandisageographicalunit withinaforestedlandscapewithdefinedboundariesandattributes.Neighboringstandsmaydifferinspeciescomposition,stageofdevelopment,densityandstructure.Stand-level planningisconcernedwiththespecificationofdevelopment paths,i.e.,atimeseriesofsilviculturalactivitiesforagiven stand.Forest-levelplanningdeterminesthebestcombination ofdevelopmentpathsinallstands,consideringconstraintsand objectivesfortheenterpriseortheforestedlandscapeasa whole(Clutteretal.1983,vonGadow1991,Wikström2000).
Theobjectiveofforestmanagementistoensuresustainability ofthedifferentforestfunctionsandtoimplementthesilviculturalandeconomicgoalsoftheenterprise.Animportant
prerequisiteforachievingthisobjectiveistheabilityto generateoptimumpaths,usingsuitablegrowthmodelsandalgorithmsthatmimicspecificharvestoperationsdescribedin termsofstandardforestryterminology.Optimumforestmanagementcanbeachievedonlywhensufficientandrealistic stand-levelpathsarespecified.Therefore,theprocessofgenerating paths is a crucial element in forest planning.
Inforestmanagementplanning,spatialgoals,suchasadjacencyrestrictions,arecombinatorialproblemsbynature.Thus astheproblemsizeincreases,thesolutionspacealsoincreases,butatadisproportionatelygreaterrate(Lockwood andMoore1993).Mixedintegerprogrammingandinteger programmingtechniqueshavebeenusedtoproducemanagementplanswithadjacencyconstraints,butthesetechniques havelimitations,directlyrelatedtoproblemsize,whenappliedtolargecombinatorialproblems(LockwoodandMoore 1993).Theuseofheuristictechniquesforforestmanagement planningisbecomingmorecommon.Manytypesofcomplex, nonlineargoals(e.g.,spatialandtemporaldistributionofelk habitat,asdescribedbyBettingeretal.1997),whichhavetraditionallybeenconsideredtoocomplextosolvewithtraditionaloptimizationtechniques,arenowbeingconsidered.In recentyears,heuristicprogrammingtechniqueshavebeen appliedtotraditionalforestharvestschedulingproblems(HogansonandRose1984)aswellastoforesttransportationproblems(Pulkki1984,NelsonandBrodie1990,Weintraubetal. 1994,1995,MurrayandChurch1995),wildlifeconservation andmanagement(ArthaudandRose1996,Bettingeretal. 1997,HaightandTravis1997),aquaticsystemmanagement (Bettingeretal.1998),andtheachievementofbiologicaldiversity goals (KangasandPukkala1996).
ThemethodknownasSimulatedAnnealingisoneofthe heuristictechniquescommonlyusedinforestmanagement planning.NelsonandLiu(1994)developedaSimulatedAnnealingalgorithmfora431-unitwithadjacencyconstraints. TheyshowedthattheirSimulatedAnnealingtechniquecould generatesuperiorsolutionstoarandomstarthill-climbingalgorithm.LockwoodandMoore(1993)developedaSimulated Annealingalgorithmtosolveatacticalschedulingproblemfor
a6148-unitinnortheasternOntario(Canada).Dahlinand Sallnäs(1993)alsousedSimulatedAnnealingtosolveplanningproblemswithadjacencyconstraintsinthesub-alpine region in Sweden.
TheobjectiveofthisstudyistopresentamethodofgeneratingsilviculturalpathsforaNorwayspruceforest,andtoapply aheuristicsearchmethodbasedonSimulatedAnnealingto identify an optimum path combination for the entire forest.
Datafrom38NorwaysprucestandsatWinnefeldSüdinthe SollingforestofnorthwesternGermanywereusedinthiscase
study.Table1showstheinitialdataforeachstand.Thetotal forestareawas123.8ha.Topresenttheoptimizedforestmanagementplan,adigitalizedforesttypemapcontainingstand growthinformationwaspreparedwithreferencetoageographical information system (GIS).
AbasalareamodeldevelopedbyVilèkoandvonGadow (unpublishedresults)onthebasisofstudiesbySchübeler (1997),Gurjanovetal.(2000)andSánchezOroisetal.(2001) wasusedtoestimatemeanstemdiametergrowth.Toestimate thedominantheightgrowth,asimplepolymorphicheight model(Sloboda1971)wasused.Themeanheightwasesti-
A HEURISTIC ALGORITHM FOR LONG-TERM FOREST MANAGEMENT 931
Table2.Basicfunctionsofthegrowthmodelusedtoestimatedthechangeinstandparameters.Abbreviations: G1 =basalareaatpresent; G2 = basalareaatthenextperiod; A1 =standageatpresent; A2 =standageatthenextperiod;SI=siteindex; N1 =stemnumberperhectareatpresent; N2 =stemnumberperhectareatthenextperiod; A100 =referenceyear(Year100); A =standageatpresent; G =basalarea;FZ=formfactor;dg = quadratic mean diameter at breast height; N
= maximum stand density index.
matedfromtheestimateddominantheight,withasimplenonlinearregressionfunction.Aformfunctiondevelopedby Bergel(1973)wasusedtoestimatestandvolume.Amaximum densityfunctionbasedonthestanddensityindex(SDI)conceptwasusedtoestimatemaximumstemnumberperhaasa thinningcontrolfunction.Theparametersofeachmodelwere fittedtotheNorwaysprucestanddataset.Thesemodelswere appliedtoestimatestandgrowthtothenextthinningevent(Table 2).
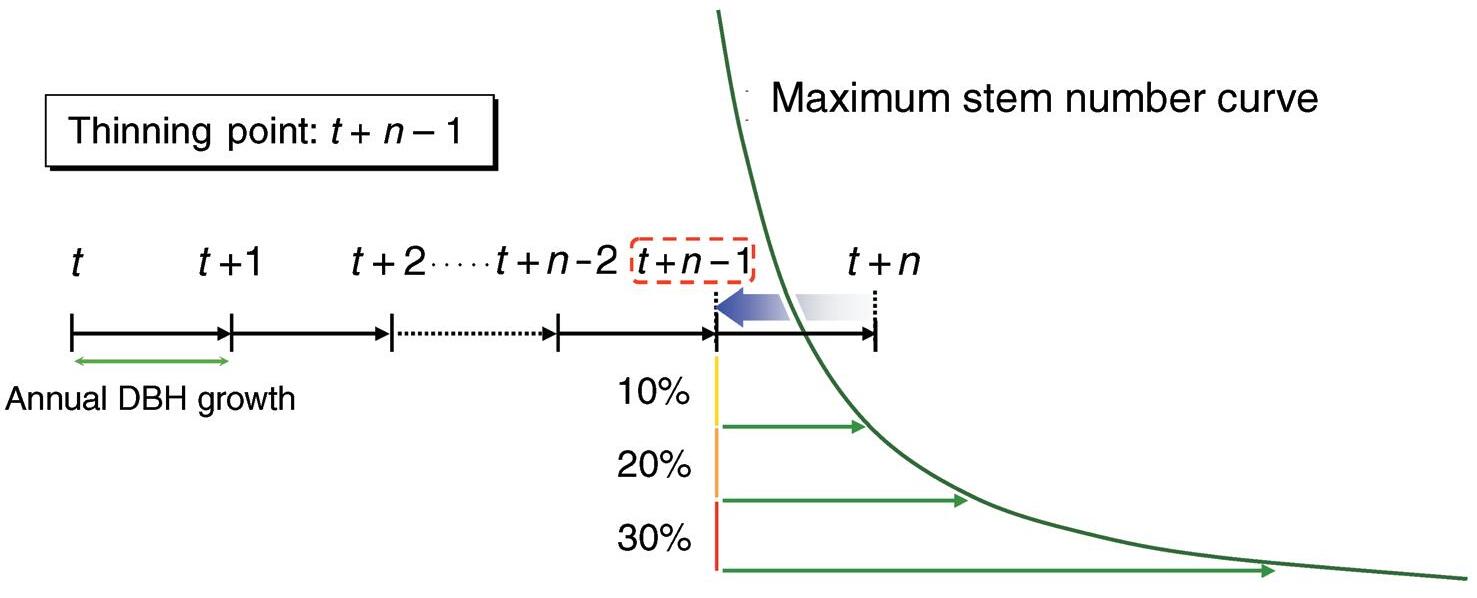
Table3.Equationsforestimatingthechangeofstandafterthinning.
Abbreviation:DBH=diameteratbreastheight;dga =quadraticmean DBHafterthinning;dgb =quadraticmeanDBHbeforethinning; NG=NGindex;hga =meanheightafterthinning;andhgb =mean height before thinning.
TheequationsshowninTable3wereusedtoestimatethe changeinstandparameters(thequadraticmeandiameterat breastheight(DBH)andmeanheight)afterthinning.ParametersinbothequationswereestimatedfromtheNorwayspruce data set.
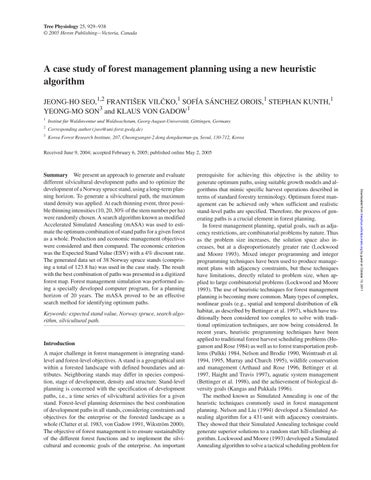
Thebasicruleofmanagementinthisstudywastothinahead ofmortality.Thethinningmodelisbasedonstanddensity (Seoetal.,unpublishedresults).Threethinningintensities wererandomlyselectedateachthinningevent(10,20,30%of stemnumberperha).Thetimingofathinningeventwasdefinedbythemaximumdensity.Ifthesimulatedstemnumber ofastandisclosetoorequaltothemaximumstemnumber, thethinningwillbecarriedout1yearbefore,otherwisethe stemnumberwillremainconstantuntilthenextthinningevent (Figure 1).
Inthisthinningmodel,themaximumstemnumbercurveis animportantfactorfordeterminingthetimeofathinning event.Therefore,itwasnamedthe“ThinningControlFactor” (TCF).Toapplyadditionalthinningsequences,notonlythe
maximumstemnumber(100%),butalso90,80,70and60% ofthemaximumwereusedasTCF(Figure2).ThusalltheapplicablepathsforastandcanbecalculatedwithEquation1. Threekindsofthinningtype(thinningfrombelow,thinning fromaboveandindifferentthinning)wereapplied,according tostandage.ThethinningtypewasspecifiedbasedontheNG index(Equation2)(Staupendahl1999,vonGadowandHui 1999):
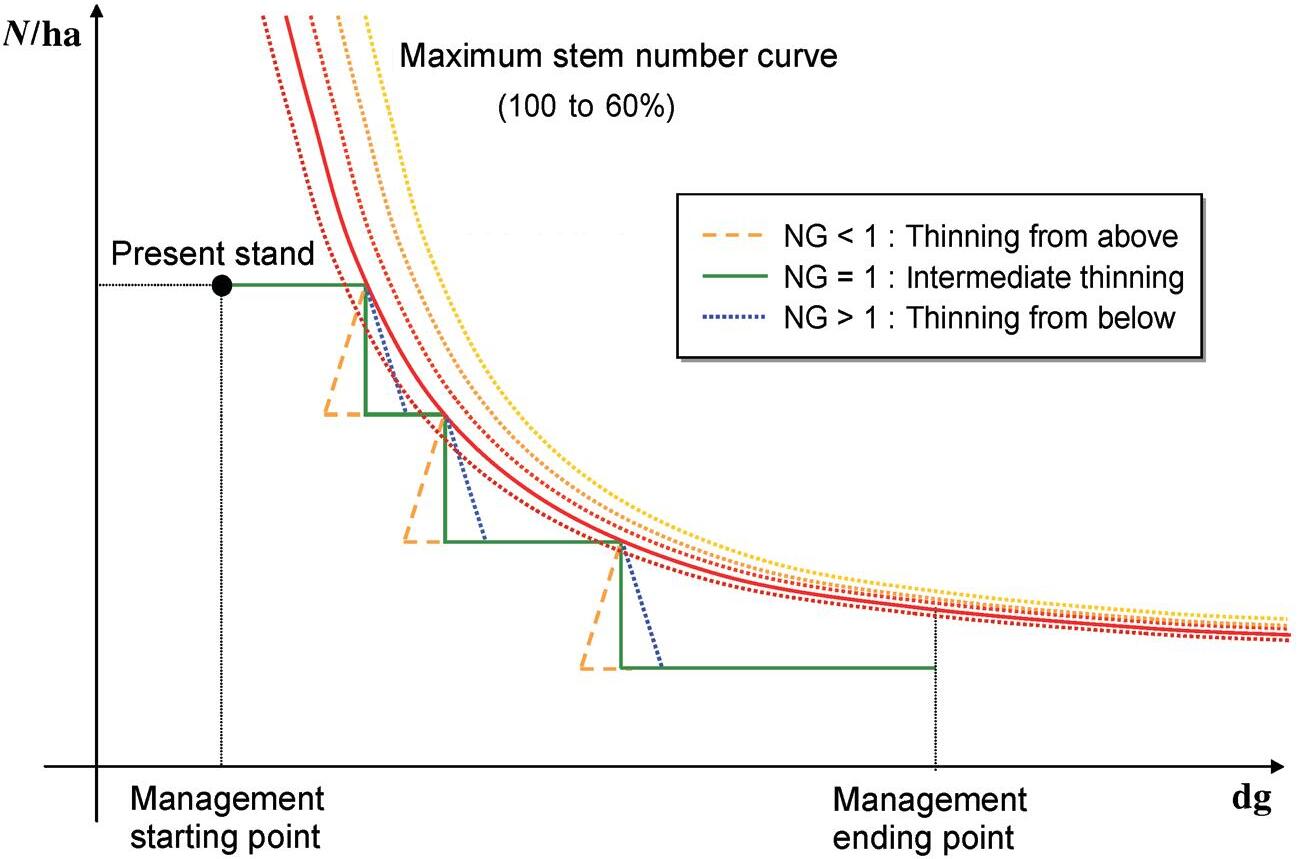
Animportantpartofpathgenerationisaplausibilitytest. Thetestisperformedusingtworulesforallinitializedpaths. Thefirstruleisa mortalitypreemption rulethatstatesthata thinningeventisinvalidifthestemnumberhasexceededthe maximumstemnumbercurve.Thesecondrule,knownasthe thinningevent rule,eliminatesallpathswherethenumberof specifiedthinningeventscannottakeplacewithinthespecifiedtimewindow.Onlyvalidpathsareselectedandtheirobjectivefunctionvaluescalculated(Figure4).Thelaststepof thegenerationinvolvestheselectionofthe10bestpathsin eachstand,accordingtotheobjectivefunctionvalues.This data set is used in the forest-wide optimization.
whereTIisthenumberofthinningintensities,nTCFisthe numberofthinningcontrolfactors,maxisthemaximumnumberofthinningfrequencies,andministheminimumnumber of thinning frequencies:
(2)
where Nr and Nt areremovedandtotalstemnumber,respectively,and Gr and Gt areremovedandtotalbasalarea, respectively.
Forexample,aminimumofoneandamaximumof10thinningeventswithfiveTCFcurveswilltheoreticallygive 442,860 paths for one stand:
(3)
Objective function
Twoobjectiveswereappliedinthisstudy.Thefirstwasmaximumvolumeproduction(Equation4);thesecondwasmaximumExpectedStandValue(ESV)(Equation5),representing thesumofnetpresentvalue,stumpagevalueandlandexpectationvalueofeachstand(Equation6).ToestimatethenetpresentvalueinESV,theso-calledtime-windowmethodwasused (Hilleetal.1999,SánchezOroisandVilèko2002):
Generatingsiviculturalpaths
Togeneratesilviculturalpathsforeachofthe38stands,acomputerprogramwasdevelopedinVisualBasic6.0.Beforethe startofthegenerationprocess,allpossiblepathsareinitialized (Figure3).
where z1 istheobjectivefunctionvalueofthefirstobjective, n isthenumberofstands, hi , j istheremovedvolumeha –1 atthe i ththinninginstand j, F isthenumberofthinnings, TE , j isthe volumeha –1 attheendoftheplanningperiodinstand j,and Aj is the areaofstand j (ha):
where z2 istheobjectivefunctionvalueofthesecondobjective, ESVttj 0 , istheexpectedstandvalueofstand j, t isstandageat theendoftheplanningperiod, t0 isstandageatthebeginning oftheplanningperiod, ti isstandageatthinning i, r israteof interest,CFi iscashflowatthinningevent i,SVt isstumpage valueattheendoftheplanningperiod,LEVt islandexpectation value at the end of the planning period.
Thelandexpectationvalueofeachpathwasassumedtobea constant,becausetheplanninghorizonisthesame.Therefore, theexpectedstandvaluewascalculatedwithoutthelandexpectationvalue.Tocalculateestimatedcashflow,product pricesandharvestingcostsarebasedonmeanstemdiameter.
Therearemanywaystospecifyharvestconstraints.Onepossibilityistodefineaso-calledeven-flowconstraintthatisoften usedtoensuremoreorlessequalharvestvolumesovertime. Sometimesitisdesirablethatthetotalharvestshouldincrease fromyeartoyear,forexamplebyatleast p percent,which could be implemented using the following constraint:
where hijt isthesumofthefellingvolumes(thinningsplus clearfelling)perhaatyear t ifalternative j ( jthtreatmentoptiononstand i )isusedand Xij isthecorrespondingarea(ha)of
stand i (i =1... I ).Ourcurrentmodelformulationspecifiesthat at least 100m3 must be harvested each year, thus
Thetaskistofindthecombinationoffinalfelling,thinning agesandthinningintensitiesinthedifferentstandsthatmaximizestheobjectivefunctionvalueandsatisfiestheconstraints.
Optimization method
SimulatedAnnealing(SA;Kirkpatricketal.1983,Lockwood
andMoore1993,ChenandvonGadow2002,2003)isaheuristicsearchtechniquethatiscommonlyusedtosolvespatial harvestschedulingproblems.BostonandBettinger(1999)reportedthatSAisabletolocatethebestsolutionvaluestoproblemswhencomparedwithotherheuristictechniques(Monte CarloIntegerProgrammingandTabusearch).Bettingeretal. (2002)comparedeightheuristictechniques.Theyclassified thetechniquesintothreeclasses(verygood,adequateandless thanadequate).TheSAmethodwasfoundtobe“verygood.” Therefore, we used SA as a search method.
AcceleratedSimulatedAnnealing(ASA)hasbeenproposedandtestedempiricallybyYoonandCho(1996).Itis fasterthanstandardSAandyetmaintainstheconvergence propertybecauseitdoesnotalterthebasicSAstructure.The mainfeatureofASAisthatitincreasesthespeedofconvergencebymakingthesizeoftheinnerloopsmallerthanSA. ThisismadepossiblebycheckingiftheMarkovchaindescribingtheevolutionmadeintheinnerloopofSAreachesthe steadystatebydecreasingthetemperature T onlywhenthe
Markovchainisjudgedtoreachthesteadystate.Ofcourse, thereareotherconsiderationsadaptedtomakeASAmoreefficient:theautomaticinitialtemperaturesettingmechanismand carefulstoppingcriteriatoavoidanunnecessarilylongwanderingperiodatthefinalstageoftheconvergence.TheASA algorithm is given inFigure5.
ThemodifiedASA(mASA,developedbythefirstauthor)is animprovementfeaturinganadditionalfunction.Thisfunctioncontrolsandteststhenextsolution(combinationof paths),whichisrandomlyselectedtocomparetheobjective values,sothatwhenaparticularcombinationhasbeenrandomlyselected,itwillnotbeselectedagain.Asaresultofthis function,thewholeprocessingtimecanbereducedby50% (cf.Hajek1988).
ToevaluatethemASA,asimpleoptimizationwasperformedusing100objectivevaluesand100iterations.Theoptimalsolutionwasknown.Apracticalwaytoevaluatethe performanceofaheuristicistocomparetheresultsofaheuristicprocedurewithaknownoptimalsolution.Heuristictech-
936 SEO,VIL
niqueshavethedisadvantagethatonecannotguaranteetheir performance;thus,thereisnoguaranteethatanoptimalsolutionwillbefound(BostonandBettinger1999).Figure6 showstheconvergencebetweenstandardSA(a)andmASA (b)forthesameproblem.UsingmASA,theoptimalsolution canbesuccessfullyandrapidlyestimatedwithonly14itera-
tions,whereasusingstandardSA,theoptimalsolutionwas foundafter78iterations.BecausetheresultsofSAarenotalwaysclosetothetrueoptimum,moreiterationsarerequiredto obtaintheoptimalsolutionneartheglobalextreme.Numerous runsusingmASAproducedasimilarresult,indicatingthatthe mASAalgorithm is more efficient than standard SA.
Table4.Estimatedoptimumtreatmentalternativeforwholestandsandestimatedobjectivefunctionvalues.Abbreviations:St.No.=standnumber;TCF= thinning control factor; Vol. = volume (m 3 ); Th.-Freq. = thinning frequency; andESV= expected stand value (Euro).
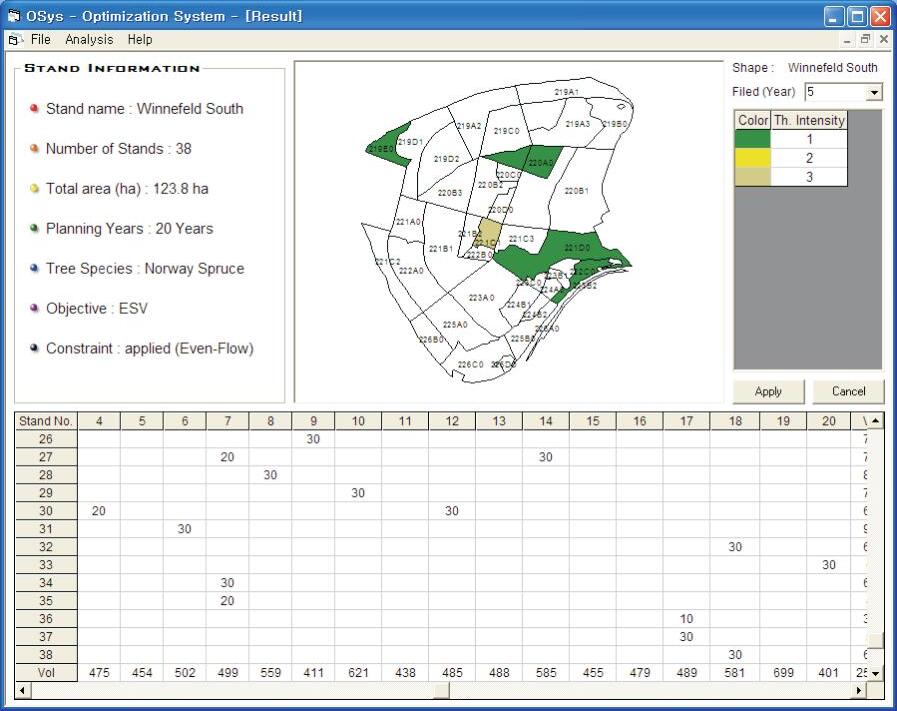
AnoptimizationsystembasedonmASAwasdeveloped.The estimatedresultoftheoptimizationissavedintheMicrosoft Excelformatandalsoinadatabaseformattolinktheprocess withaGISdatabase.TheMapObjectcomponentwasincluded inthissystem.Thiscomponentoffersthepossibilitythata shapefile(digitizedmap)includingattributedataofeach polygoncanbeusedbythesystem.Thisoffersthepossibility ofpresentingoptimizationresultsasamapthatshowsthespatialarrangementofthemanagementactivitiesinthedifferent time periods (Figure7).
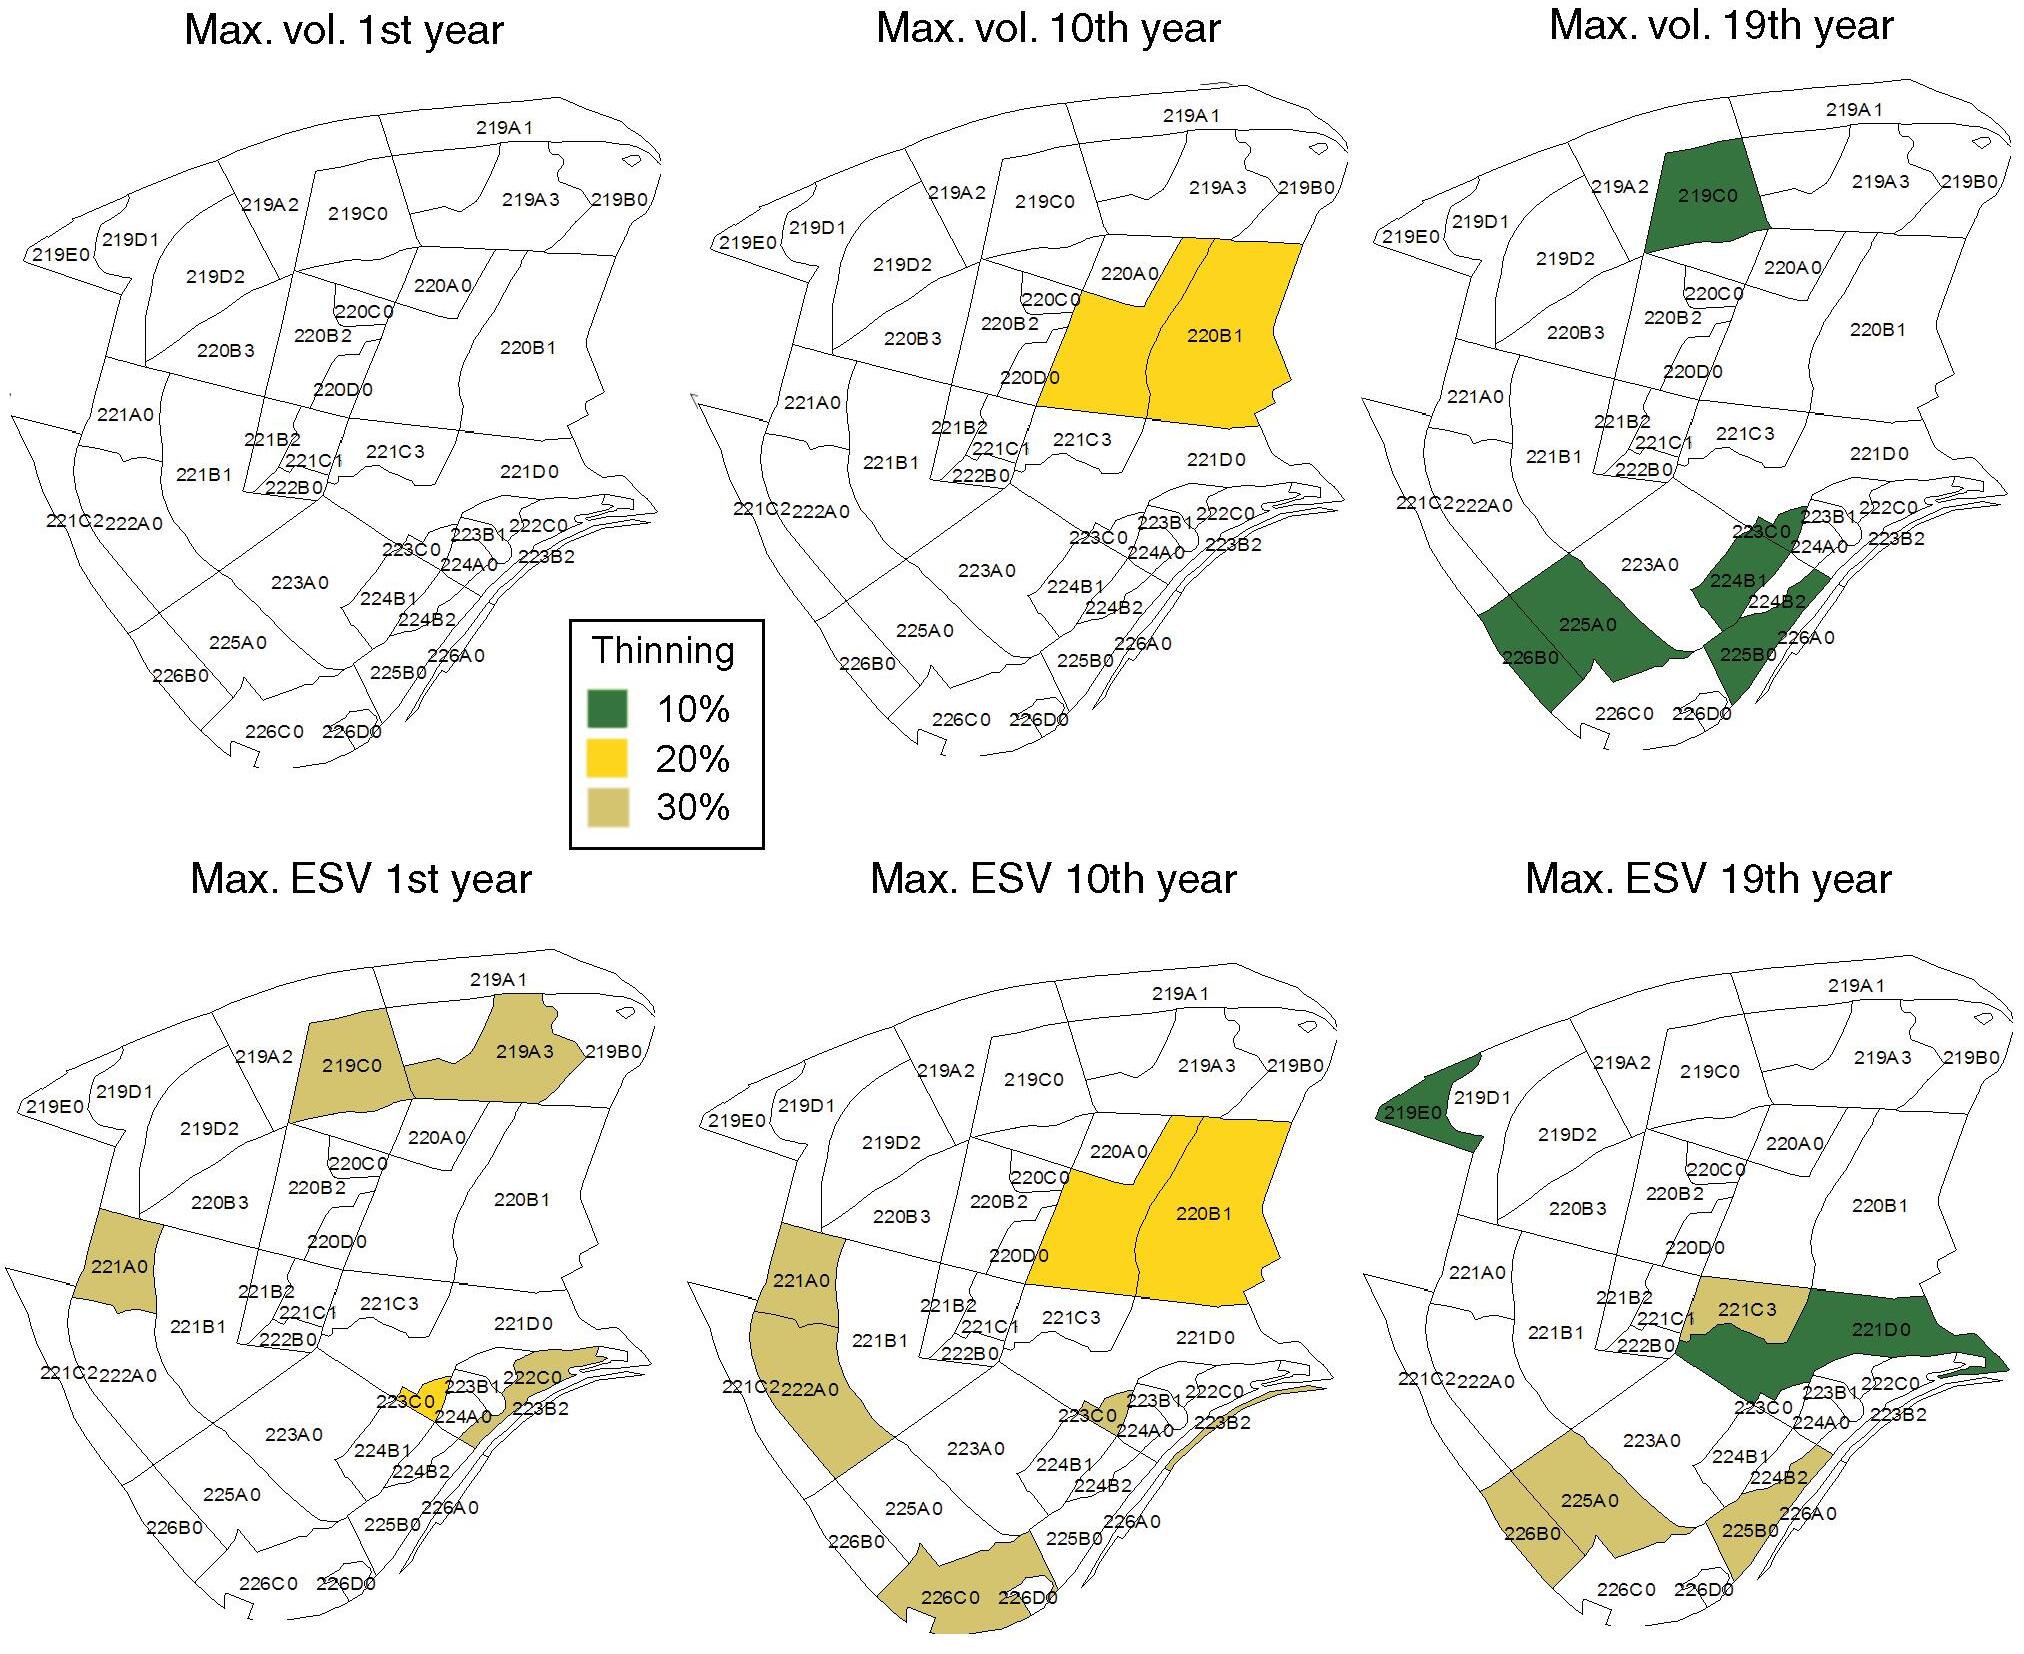
Atotalof609,948pathsweregeneratedforthe38Norway sprucestands,butonly380paths(the10bestpathsineach stand×38stands)wereusedintheoptimizingprocess.Table4 showstheoptimalcombinationofpathsforthe38Norway sprucestandsandtheobjectivefunctionvalue,consideringan even-flowconstraint.Theplanninghorizonwas20yearsand therateofinterestwas4%.Thetotalharvestvolumewas 27,017m3 andthetotalESVwas450,429€.TheselectedTCF inthevolumemaximizationwasalmostalways100%,which istobeexpectedbecausevolumegrowthishigherathigher densities.IntheESVmaximization,100%ofTCFwasselectedformostoftheyoungstands,becausethehigherTCF suggestsalaterthinningtime,producingmorevaluableharvestedtimber.Inmostofthematureandolderstands,alower TCF(60%)wasgenerallyselectedbecausetheyielddifferencesbetweenharvesteventsinolderstandsaresmallandearlierpositivecashflowsarepreferablewhenthevaluesofthe cash flows are similar.
Figure8presentsaseriesofmapsshowingtheresultofthe optimization;thatis,thespatialarrangementofthemanagementschedulefor20yearsinaccordancewiththespecified objectives.
Wedevelopedamethodforgeneratingallpossiblepathsfor onestand.Outofagreatnumberofpaths,onlythebest10 wereselectedtoparticipateintheoptimizationprocess,toreducetheotherwiseprohibitiveprocessingtime.Thedifference intheobjectivefunctionvaluesbetweenpathswasrather small.Thenewsearchalgorithm,knownasmASA,provedto besuperiortothestandardSA.WeconcludethatmASAis usefulwhenoneneedstosolvelargeforestmanagement problems.
Theapplicationsystemcanbeusedtogenerateamanagementplanforanentireforestenterprise,basedoncurrentstand attributesandspecifiedobjectives.Amajoradvantageofthe multiplepathsapproachisthatanychangeinthecurrentstand attributesorintheobjectivescanbeeasilyimplemented.Althoughalltheotherdataandspecificationsremainasthey havebeendefined,anewoptimalplancanbeproducedalmost instantaneously.Thisflexibilityisanimportantadvantage.
Theoptimalplancanbeusedtoformulatepracticaloperationalschedulesthatcanbechangedeasilyasconditions change.Therefore,theconceptofmultiplepathsisasuitable theoreticalbasisfordesigningthedevelopmentofaforested landscape.
References
Arthaud,G.J.andD.Rose.1996.Amethodologyforestimatingproductionpossibilityfrontiersforwildlifehabitatandtimbervalueat the landscape level. Can. J. For. Res. 26: 2191–2200.
Bergel,D.1973.FormzahluntersuchunganBuche,Fichte,EuropächerLärcheundJapanischerLärchezurAufstellungneuer Massentafel.Allg.ForstJagdztg. 117–124.
Bettinger,P.,J.Sessions,andK.Boston.1997.UsingTabusearchto scheduletimberharvestssubjecttospatialwildlifegoalsforbig game. Ecol. Model. 94:111–123.
Bettinger,P.,J.SessionsandK.N.Johnson.1998.Ensuringthecompatibilityofaquatichabitatandcommodityproductiongoalsin easternOregonwithaTabusearchprocedure.For.Sci.44:96–112.
Bettinger,P.,D.Graetz,K.Boston,J.SessionsandW.Chung.2002. Eightheuristicplanningtechniquesappliedtothreeincreasingly difficult wildlife planning problems. SilvaFenn. 36:561–584.
Boston,K.andP.Bettinger.1999.AnanalysisofMonteCarlointeger programming,simulatedannealing,andTabusearchheuristics. For. Sci. 45:292–301.
Chen,B.W.andK.vonGadow.2002.Timberharvestplanningwith spatialobjectives,usingthemethodofsimulatedannealing. Forstwiss.Centralbl. 121:25–34.
Chen,B.W.andK.vonGadow.2003.Acasestudyofsimulatedannealing,geneticalgorithm,Tabusearchandlinearprogramming for solving forest planning problems.Forstachiv74:26–31.
Clutter,J.L.,J.C.Fortson,L.V.Pienaar,G.H.BristerandR.L.Bailey. 1983.Timbermanagement—aquantitativeapproach.Wileyand Sons, New York, pp 238–252.
Dahlin,B.andO.Sallnas.1993.Harvestschedulingunderadjacency constraints—acasestudyfromtheSwedishsub-alpineregion. Scand. J. For. Res. 8:281–290.
Gurjanov,M.,S.SanchezOroisandJ.Schröder.2000.GrundflächenmodellefürgleichaltrigeFichtenreinbestände.EinevergleichendeAnalyse.Centralbl.gesamteForstwes. 117:187–198.
Haight,R.G.andL.E.Travis.1997.Wildlifeconservationplanning usingstochasticoptimizationandimportancesampling.For.Sci. 43:129–139.
Hajek,B.1988.Coolingschedulesforoptimalannealing.Math.Oper. Res. 13:311–329.
Hille,M.,D.Hessenmöller,B.MöhringandK.vonGadow.1999. BewertungwaldbaulicherMassnahmenmitHilfederZeitfenstermethodeamBeispieleines110-järigenBuchenbestandes. In IUFROProc., Prague, Czech Republic, pp 94–100.
Hoganson,H.M.andD.Rose.1984.Asimulationapproachforoptimal timber management scheduling. For. Sci. 30:220–238.
Kangas,J.andT.Pukkala.1996.Operationalizationofbiologicaldiversityasadecisionobjectiveintacticalforestplanning.Can.J. For. Res. 26:103–111.
Kirkpatrick,S.,C.D.GellatandM.P.Vecchi.1983.Optimizationby simulated annealing. Science 220:671–680.
Lockwood,C.andT.Moore.1993.Harvestschedulingwithspatial constraints:asimulatedannealingapproach.Can.J.For.Res.23: 468–478.
Murray,A.T.andR.L.Church.1995.Heuristicsolutionapproachesto operationalforestplanningproblems.Oper.Res.Spektrum17: 193– 203.
Nelson,J.andJ.D.Brodie1990.Comparisonofarandomsearchalgorithmandmixedintegerprogrammingforsolvingarea-based forest plans. Can. J. For. Res. 20:934–942.
Nelson,J.andG.Liu.1994.Schedulingcutblockswithsimulated annealing. In ProceedingsoftheInternationalSeminaronForest OperationsUnderMountainousConditions.Ed.J.Sessions.
Harbin, P.R. of China, pp 29–36.
Pulkki,R.1984.Aspatialdatabase—heuristicprogrammingsystem foraidingdecision-makinginlong-distancetransportofwood.
Acta For.Fenn. 188, 89 p.
SánchezOrois,S.andF.Vilèko.2002.BewertungundOptimierung vonVornutzungeninFichtenbeständen.Forstwiss.Centralbl.121: 250–264.
SánchezOrois,S.,M.GurjanovandJ.Schröder.2001.Analysedes GrundflächenzuwachsesgleichaltrigerFichtenbestände.Allg. ForstJagdztd. 172:51–60.
Schübeler,D.1997:UntersuchungenzurstandortabhängigenWachstumsmodellierungbeiderFichte.Diss.zurErlangungdes DoktorgradesderForstlichenFakultätderGeorg-AugustUniversitätGöttingen, 155 p.
Sloboda,B.1971.ZurDarstellungvonWachstumsprozessenmit HilfevonDifferentialgleichungenersterOrdnung.Mitt.Bad.Württemb.Forstl. Vers. u.Forsch.Anst. 32.
Staupendahl,K.1999.BestandesbezogeneModelierungvonDurchforstungeninBuchenreinbeständenaufderBasisdesStammzahl-Grundflächen-Verhältnisses.VortraganlässlichderJahrestagungderSektionErtragskundedesDeutschenVerbandes ForstlicherForschungsanhalteninVolprehausen/Sollingam 17.-19.Mai1999.
vonGadow,K.1991.IntegrationvonEinzel-undGesamtnutzungsplannunginderForsteinrichtung.Allg.ForstJagdztg.162:72–75. vonGadow,K.andG.Y.Hui.1999.Modelingforestdevelopment. KluwerAcademic Publisher, Dordrecht, 213 p.
Weintraub,A.,G.Jones,A.Magendzo,M.MeachamandM.Kirby, M.1994.Aheuristicsystemtosolvemixedintegerforestplanning models.Oper. Res. 42:1010–1024.
Weintraub,A.,G.Jones,M.Meacham,A.MagendzoandD.Malchuk.1995.Heuristicproceduresforsolvingmixed-integerharvest scheduling—transportationplanningmodels.Can.J.For.Res.25: 1618–1626.
Wilkström,P.2000.Solvingstand-levelplanningproblemsthatinvolvemultiplecriteriaandasingle-treegrowthmodel.Doctoral Thesis, Swedish Univ. Agric. Sci., Umeå, 167 p.
Yoon,B.S.andG.Y.Cho.1996.Accelerationofsimulatedannealing antitsapplicationforvirtualpathmanagementinATMnetworks.
J. Korean Operation Res. Manage. Sci. Soc. 20:125–140.