Design-unbiasedestimationforpoint-to-tree distancesampling
ChristophKleinnandFrantišekVil ko
Abstract: Point-to-treedistancesamplingdesigns,sometimesalsoreferredtoas k-treesamplingorfixed-countsampling,arepracticalresponsedesignoptionsforfieldsamplinginforestinventoriesandecologicalsurveys.Whilepractitionersacceptanduseseveralapproachestoestimatestemdensityandotherstandattributes,amajorconcernfroma statisticalpointofviewisthelackofageneralunbiasedestimatorforthisclassofsamplingstrategies.Inthispaper weanalysepoint-to-treedistancesamplingintheframeworkofdesign-basedprobabilisticsamplingandpresentanunbiasedestimatorvalidforestimationofanystandattribute.Thisestimatordrawsupontheideaofdefininganinclusion zonearoundeachtree.Atreeistakenasasampletreeifaselectedsamplepointfallsintoitsinclusionzone.Thesize oftheinclusionzoneisthereforeameasureoftheindividualtree’sinclusionprobabilitywhensamplingisdonewith randomsamplepoints.Oncetheinclusionprobabilitiesareknownforallsampledtrees,theHorwitz–Thompsonestimatorcanbeusedasanunbiasedestimatorforanystandvariable.Inpoint-to-treedistancesampling,theinclusion zoneofaparticulartreedependsexclusivelyonthespatialarrangementoftheneighbouringtrees.Suchinclusion zonesaredeterminedby k-orderVoronoipolygons,where k isthenumberoftreesbeingsampledpersamplepoint. Theapproach,however,requiresthepositionsofthe k sampletreesandanumberofsurroundingtreestobemapped. Fieldapplicationisthereforedifficult,butacomparisonofplotdesignsbysimulationstudiesinfullymappedstands cannowalsobedonewithanunbiasedestimatorfor k-treesampling.
Résumé: Lesplansd’échantillonnageconstituésdeplacettesà k arbresselonleurdistance,parfoisappeléséchantillonnagede k arbresouéchantillonnaged’unnombrefixed’arbres,fontpartiedesstratégiesd’échantillonnagepourréaliserlesinventairesforestiersetécologiquesdefaçonpratiquesurleterrain.Alorsquelespraticiensacceptentet utilisentplusieursapprochespourestimerladensitédesarbresetlesautresattributsdupeuplement,unepréoccupation majeuredupointdevuestatistiquevientdel’absenced’estimateurgénéralnonbiaisépourcesstratégiesd’échantillonnage. Danscetarticle,l’échantillonnagede k arbresselonleurdistanceestanalysédanslecontextedel’échantillonnageprobabilisteetunestimateurvalideetnonbiaiséestprésentépourestimern’importequelattributdupeuplement.Cetestimateurs’appuiesurladéfinitiond’unezoned’inclusionautourdechaquearbre.Unarbreestconsidérécommeun arbre-échantillonsiunpointd’échantillonnagesélectionnétombedanssazoned’inclusion.Latailledecettezone d’inclusiondevientainsiunemesuredelaprobabilitéd’inclusiond’unarbrelorsquel’échantillonnageprocèdepar pointsd’échantillonnagealéatoires.Lorsquelesprobabilitésd’inclusionsontconnuespourtouslesarbreséchantillonnés,l’estimateurHorwitz-Thompsonestunestimateurnonbiaisépourn’importequelattributdupeuplement.Dans l’échantillonnagede k arbresselonleurdistance,lazoned’inclusiond’unarbredonnédépendexclusivementde l’arrangementspatialdesarbresvoisins.Ceszonesd’inclusionsontdéterminéesparlespolygonesVoronoid’ordre k où k estlenombred’arbreséchantillonnésparplacette.Cependant,cetteapprocheexigequelapositiondes k arbreséchantillonsetd’uncertainnombred’arbresvoisinssoitcartographiée.Decefait,sonapplicationsurleterrainestdifficile,maisunecomparaisondesplansd’échantillonnageparsimulation,danslespeuplementsentièrementcartographiés,peutdorénavantêtreréaliséeavecunestimateurnonbiaisépourl’échantillonnagede k arbresaussi.
[TraduitparlaRédaction]
Introduction
KleinnandVilèko1414
Variousresponsedesignoptionsareavailableforconductingforestinventories,suchasfixed-areaplots,nestedplots, andrelascopesamples.Point-to-treedistancetechniquesare frequentlyappliedinecologicalstudies(Pielou1977; Sutherland1998),butalsoinforestinventories(e.g.,Picard etal.2005).Inthisclassoftechniquesasamplepointisse-
lectedandthe k nearestobjects(trees,plants)tothepoint areincludedinthesampleunit.Becauseofthefixednumber of k trees(objects),thisclassofresponsedesignsisalsoreferredtoasfixed-countdistancemethods(e.g.,Sheiletal. 2003),or k-treesampling.Anumberofothertermsarein use,suchasdensity-adaptedsampling(e.g.,Jonssonetal. 1992)andplotlesssampling(e.g.,Patiletal.1979;Krebs 1999).
Received10June2005.Accepted31January2006.PublishedontheNRCResearchPressWebsiteathttp://cjfr.nrc.caon12May 2006.
1Correspondingauthor(e-mail:ckleinn@gwdg.de).
Point-to-treedistancesamplingcangreatlyfacilitatefieldworkundermanyconditions(if k isnottoobig),becauseat allsamplepointsthesamenumberof k treesisobserved. Thismakesiteasiertoplanandcostaninventorybecause theeffortperplotwillbemoreuniformthanwouldotherwisebethecase.
Whiletherearevariationsofpoint-to-treedistancesampling,suchasthepoint-centeredquartermethod(Cottamet al.1953;Mawson1968),theT-squaremethod(Besagand Gleaves1973;Engemanetal.1994),andline-baseddistance techniques(e.g.,Parker1979;Sheiletal.2003),wefocus hereonthebasicdesign,inwhich,fromaselectedsample point,the k nearesttreesaretakenassampletrees.Ifwe takethedistancefromthesamplepointtothe k treeasradiusofanimaginarycircularplotandusethistogeneratean expansionfactorinthenormalmanner,wegenerateasystematicoverestimationofstandparameters:byusingthedistancetothe k treeastheradiusoftheplotcircle,weare definingthesmallestpossiblecircularplotthatcontains k trees.Largerplotswitharadiusofthedistanceupto(but smallerthan)the(k +1)treewouldalsocontain k trees (Essed1957),buthavealargerexpansionfactor.
Therearenumeroussuggestionsofhowtoadjustplotsize toachievebetterestimates,formingawidegroupoflargely empiricalapproaches(e.g.,Essed1957;Morisita1957; Prodan1968;Cox1971;Smaltschinski1981;Hall1991). KleinnandVil ko(inpress)suggestusingthemean distancesbetweenthe k and(k +1)treesasanimproved approachtoplotsizeadjustments.Anothergroupofapproachesismodelbasedandconsidersthespatialpointpatternofthetrees;theseapproachesattempttoidentifythe stochasticprocessunderlyingtheobservedpointpatterns.
Forarandom(Poisson)forestandforsomeclassesofclusteredpointpatterns,unbiasedandapproximatelyunbiased estimatorsareknown(seePicardetal.(2005)foracomprehensivecomparison).Manyofthesemodel-basedapproachesfocusondensity-estimation,thatis,estimationof thenumberofobjectsperhectare,whileinforestinventories amuchwiderrangeoftreeandstandattributesisofinterest.
PayandehandEk(1986)statethat“distancemeasuresare rarelyusedinforestsurveysbecauseofconcernforbias,but theyarecommonlyusedinecologicalassessments…”. Whilethisiscertainlytrue,researchisongoingandvarious publicationsdealwithvariationsofthetechniqueandsuggestionsforapproximateestimationprocedures,especially forapplicationsdevelopedunderdifficultfieldconditionsin tropicalregions(e.g.,Hall1991;Sheiletal.2003;Picardet al.2005).Thepracticaladvantageofthetechnique,suchas its“simplicityandcompactness”andits“easyapplication” (Sheiletal.2003),hasconvincedmanyresearcherstoaccommodatetheinherentbiasesofthetechnique,whicha numberofstudieshavedemonstratedarewithinacceptable ordersofmagnitude(PayandehandEk1986;Lessardetal. 1994).Empiricalapproximationtechniquesarelikelytocontinuebeingrelevantforpracticalapplicationsandfurtherapproachesarebeingproposed(e.g.,KleinnandVil ko,in press).
However,particularlywithintheforestinventoryresearch community,someauthorsclearlyadviseagainst k-treesamplingwhenunbiasedestimationisanissue(Mandallaz1995; Schreuder2004),andresearchtowardsthedevelopmentofa
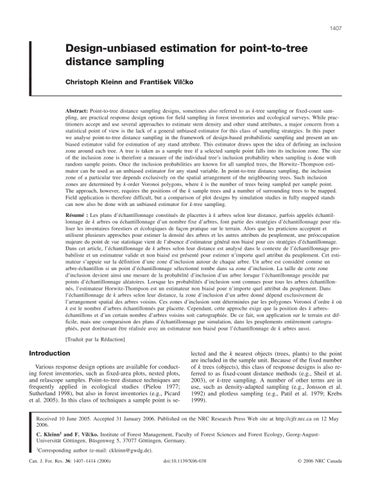
Fig.1. Subdivisionofaforestareaintoinclusionzonesfor ktreesamplingwith k =1.Thedotsaretreepositions.Theresultingtessellationintosetsofpoints(areas)closesttothecontained treeisknownasaplanarordinaryVoronoidiagram.
generalandunbiasedestimatorcontinuestobeaconcern. Picardetal.(2005),citingGoreaudandPélessier(2003),see thepathtounbiasedestimationinamodel-basedapproach “characterizingthedeparturefromrandomlabelling”.However,inthispaperwesuggestanunbiasedestimatorfor point-to-treedistancesamplingthatisdesignbasedanddoes notrequireanyassumptionsaboutthenatureofthetreepattern.Wedrawupontheconceptofindividual-treeinclusion zones,whichhasbeendiscussedbroadlyintheforestinventoryliterature(seefollowingsection).
Theconceptofinclusionzonesinforest inventorysampling
Estimationindesign-basedsamplingrequirestheinclusionprobabilitiesofallselectedpopulationelementstobe known.ThenthegeneralizedapproachbytheHorwitz–Thompsonestimatorisapplicable(HorwitzandThompson 1952;OvertonandStehman1996).Forforestinventorysamplingitisconvenienttodeterminetheinclusionprobability foreachindividualtreeingeometricaltermsbyfindingthe sizeofitsinclusionzone.Ifasamplepointfallsintotheinclusionzone,thenthecorrespondingtreeisincludedinthe sample.Byselectingonesamplepoint,allthosetreesareincludedinthesampleforwhichthisparticularsamplepoint iswithintheirinclusionzone.
Theresponsedesigns(plotdesigns)commonlyusedin forestinventoriescanallbecharacterizedanddefinedinthis manner.Forfixed-areacircularplots,forexample,theinclusionzonesforalltreesaredefinedascirclesofplotradius centeredatthetreeposition,andforrelascopesampling,the areasofthecircularinclusionzonesareproportionaltothe tree’sbasalarea.FollowingSchreuderetal.(1992), Grosenbaugh(1952)wasthefirsttodescriberelascopesamplingasanexampleofunequalprobabilitysamplingwithinclusionprobabilityproportionaltobasalarea.Grosenbaugh (1955)usedtheconceptofinclusionzones(whichhecalled K-circles)forrelascopesampling.Huschetal.(1993)used theterm“tree-centredconcept”,referringtotheconceptof
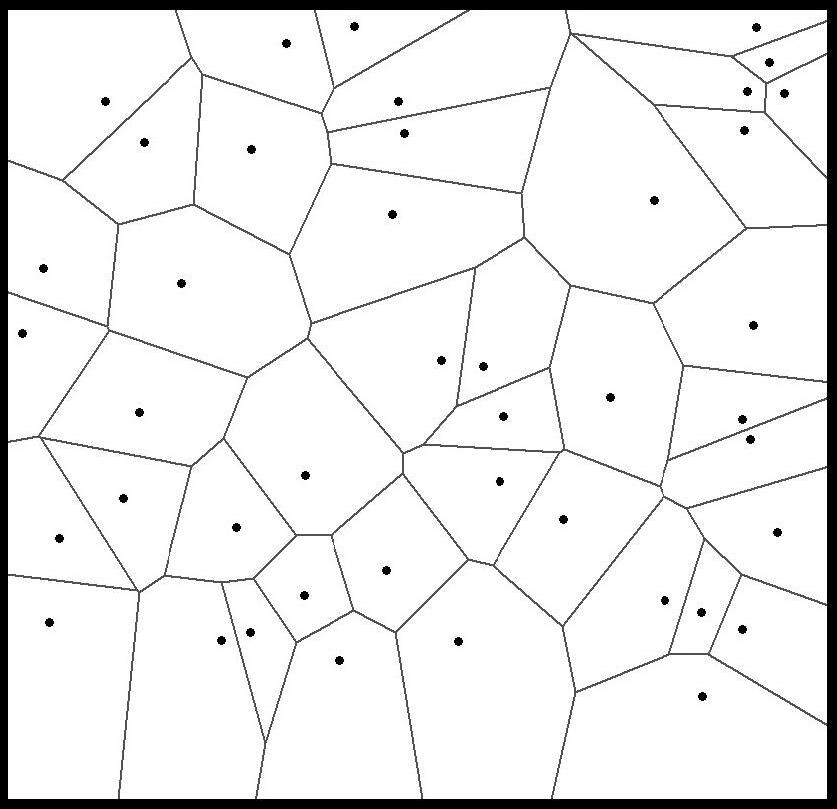
Fig.2. GeometricconstructionofordinaryplanarVoronoipolygonsbyperpendicularbisectors.Eachbisectorconstructedbetweenthetarget tree T andtree i (shownherewith i =1,2,…,7) subdividestheplaneintotwohalves,whereonesidecontainsall pointsclosertotree T andtheotherthosepointsthatarecloser totree i.Foreachbisectorinthegraph,thisismarkedbythe twolettersalongit(forfurtherexplanationseetext).
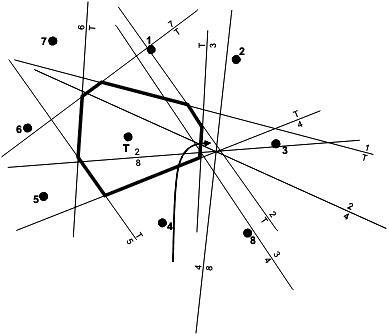
Fig.3. Principleofgeometricconstructionofhigherorder Voronoipolygons.BisectorsaremarkedasinFig.2.Onthe right-handsideofthefigure,theperpendicularbisectorsarealso drawnbetweenneighbouringtrees.Theordereddistancesare givenforoneofthesmallpolygons(wherethearrowpoints), whichresultedfromthetessellationbythebisectors.Forthe markedsmallpolygon,thebisectorsthatformthepolygonsides definethefollowingrelations(where A < B meanscloserto A thanto B):3< T, T <2,4<8,2<4. Fromthis,thedistances canbeorderedas3< T <2<4.Toputtree8—whichisalso intheabovelistofrelations—intherightplace,onewould needtoanalysefurtherbisectors,leadingpossiblytofurthertessellation(e.g.,betweentrees1and8).Targettree T isthesecondnearesttreetoallpointsinthissmallpolygon,sothatthis particularsmallpolygonispartofthesecond-orderVoronoi polygonfortree T.Tofindthe k-orderVoronoipolygon,this analysisneedstobedoneforallsmallpolygonsaroundthe (k –1)-orderpolygon.
circularinclusionzonescentredoneachtreewhenusingcircularplotsorrelascopesampling.
Theinclusionzoneapproachisimmediatelylinkedtothe ideathatitisthedimensionlesspointsandnotthetrees themselvesthatarethesamplingelementswithintheforest areaofinterest.Thisconceptisreferredtoasthe“infinite populationapproach”(Mandallaz1991;Eriksson1995)and “continuouspopulationapproach(Williams2001).
Theinclusionzoneapproachisactuallyaveryinstructive geometricapproachbecause,bybasicapplicationofgeometricprobabilities,itillustratestheconceptofselectionandinclusionprobabilities.
Inclusionzonesforpoint-to-treedistance sampling
Todefinetheinclusionzoneofatreefor k-treesampling, weneedtofindallpointsforwhichthisparticulartreeisthe first,second,…, kthnearestneighbour.Thegeometricshape thatcontainsallsuchpointsistherequiredinclusionzone forthatparticulartree.
Figure1showsinclusionzonesforalltreeswith k =1: theforestareaissubdividedsuchthateachpointinsidethe rectangularframeisassignedtoexactlyone(thenearest) tree;allpointsinsideaparticularpolygonarenearesttothe sametree.Thistessellationisknownundervariousnames andisdescribedinvariousdifferentthematiccontexts: Okabeetal.(1999)giveanexcellentoverviewandcallit “planarordinaryVoronoidiagram”,whiletheyalsostatethat the“firstundisputedcomprehensivepresentationsofthe concepts”thattheyareawareofappearintheworkof Dirichletasearlyas1850—andVoronoi’searliestpublicationwasin1907(Okabeetal.1999).WhileitwouldprobablybemoreappropriatetotalkaboutDirichletdiagrams, throughoutthispaperweusetheconventionalsousedby
Okabeetal.(1999)andrefertothemasVoronoidiagrams orpolygons.
PlanarordinaryVoronoipolygonshavealsobeenusedin variousforestrycontexts,includingmodellingofintertree competition,wherethesepolygonsaretakenasdescribing theareaofinfluenceforeachindividualtree(e.g.,Mooreet al.1973),studiesthatanalysetessellationsasabasisforspatiallybasedforestinventorysamples(e.g.,Lowell1997), andalsoasanexampleforunequalprobabilitysamplingin theabsenceofasamplingframeiftheobjectnearesttoa randompointisselected(e.g.,OvertonandStehman1996; BarabesiandFattorini1998).Thislatterapplicationcorrespondsto k-treesamplingwith k =1.
ConstructionofplanarordinaryVoronoipolygonsisgeometricallystraightforwardandisillustratedinFig.2.From thetargettree T,perpendicularbisectorsareconstructedto allimmediateneighbours,numberedherefrom i =1,2,…,7. Eachbisectorsubdividesthedistancebetweentreessuch thatononesideofthelineallpointsarecloserto T andon theothersideclosertotree i.Eventually,segmentsofthese bisectorsbuildthepolygonthatcontainsallpointsforwhich T istheclosesttree.
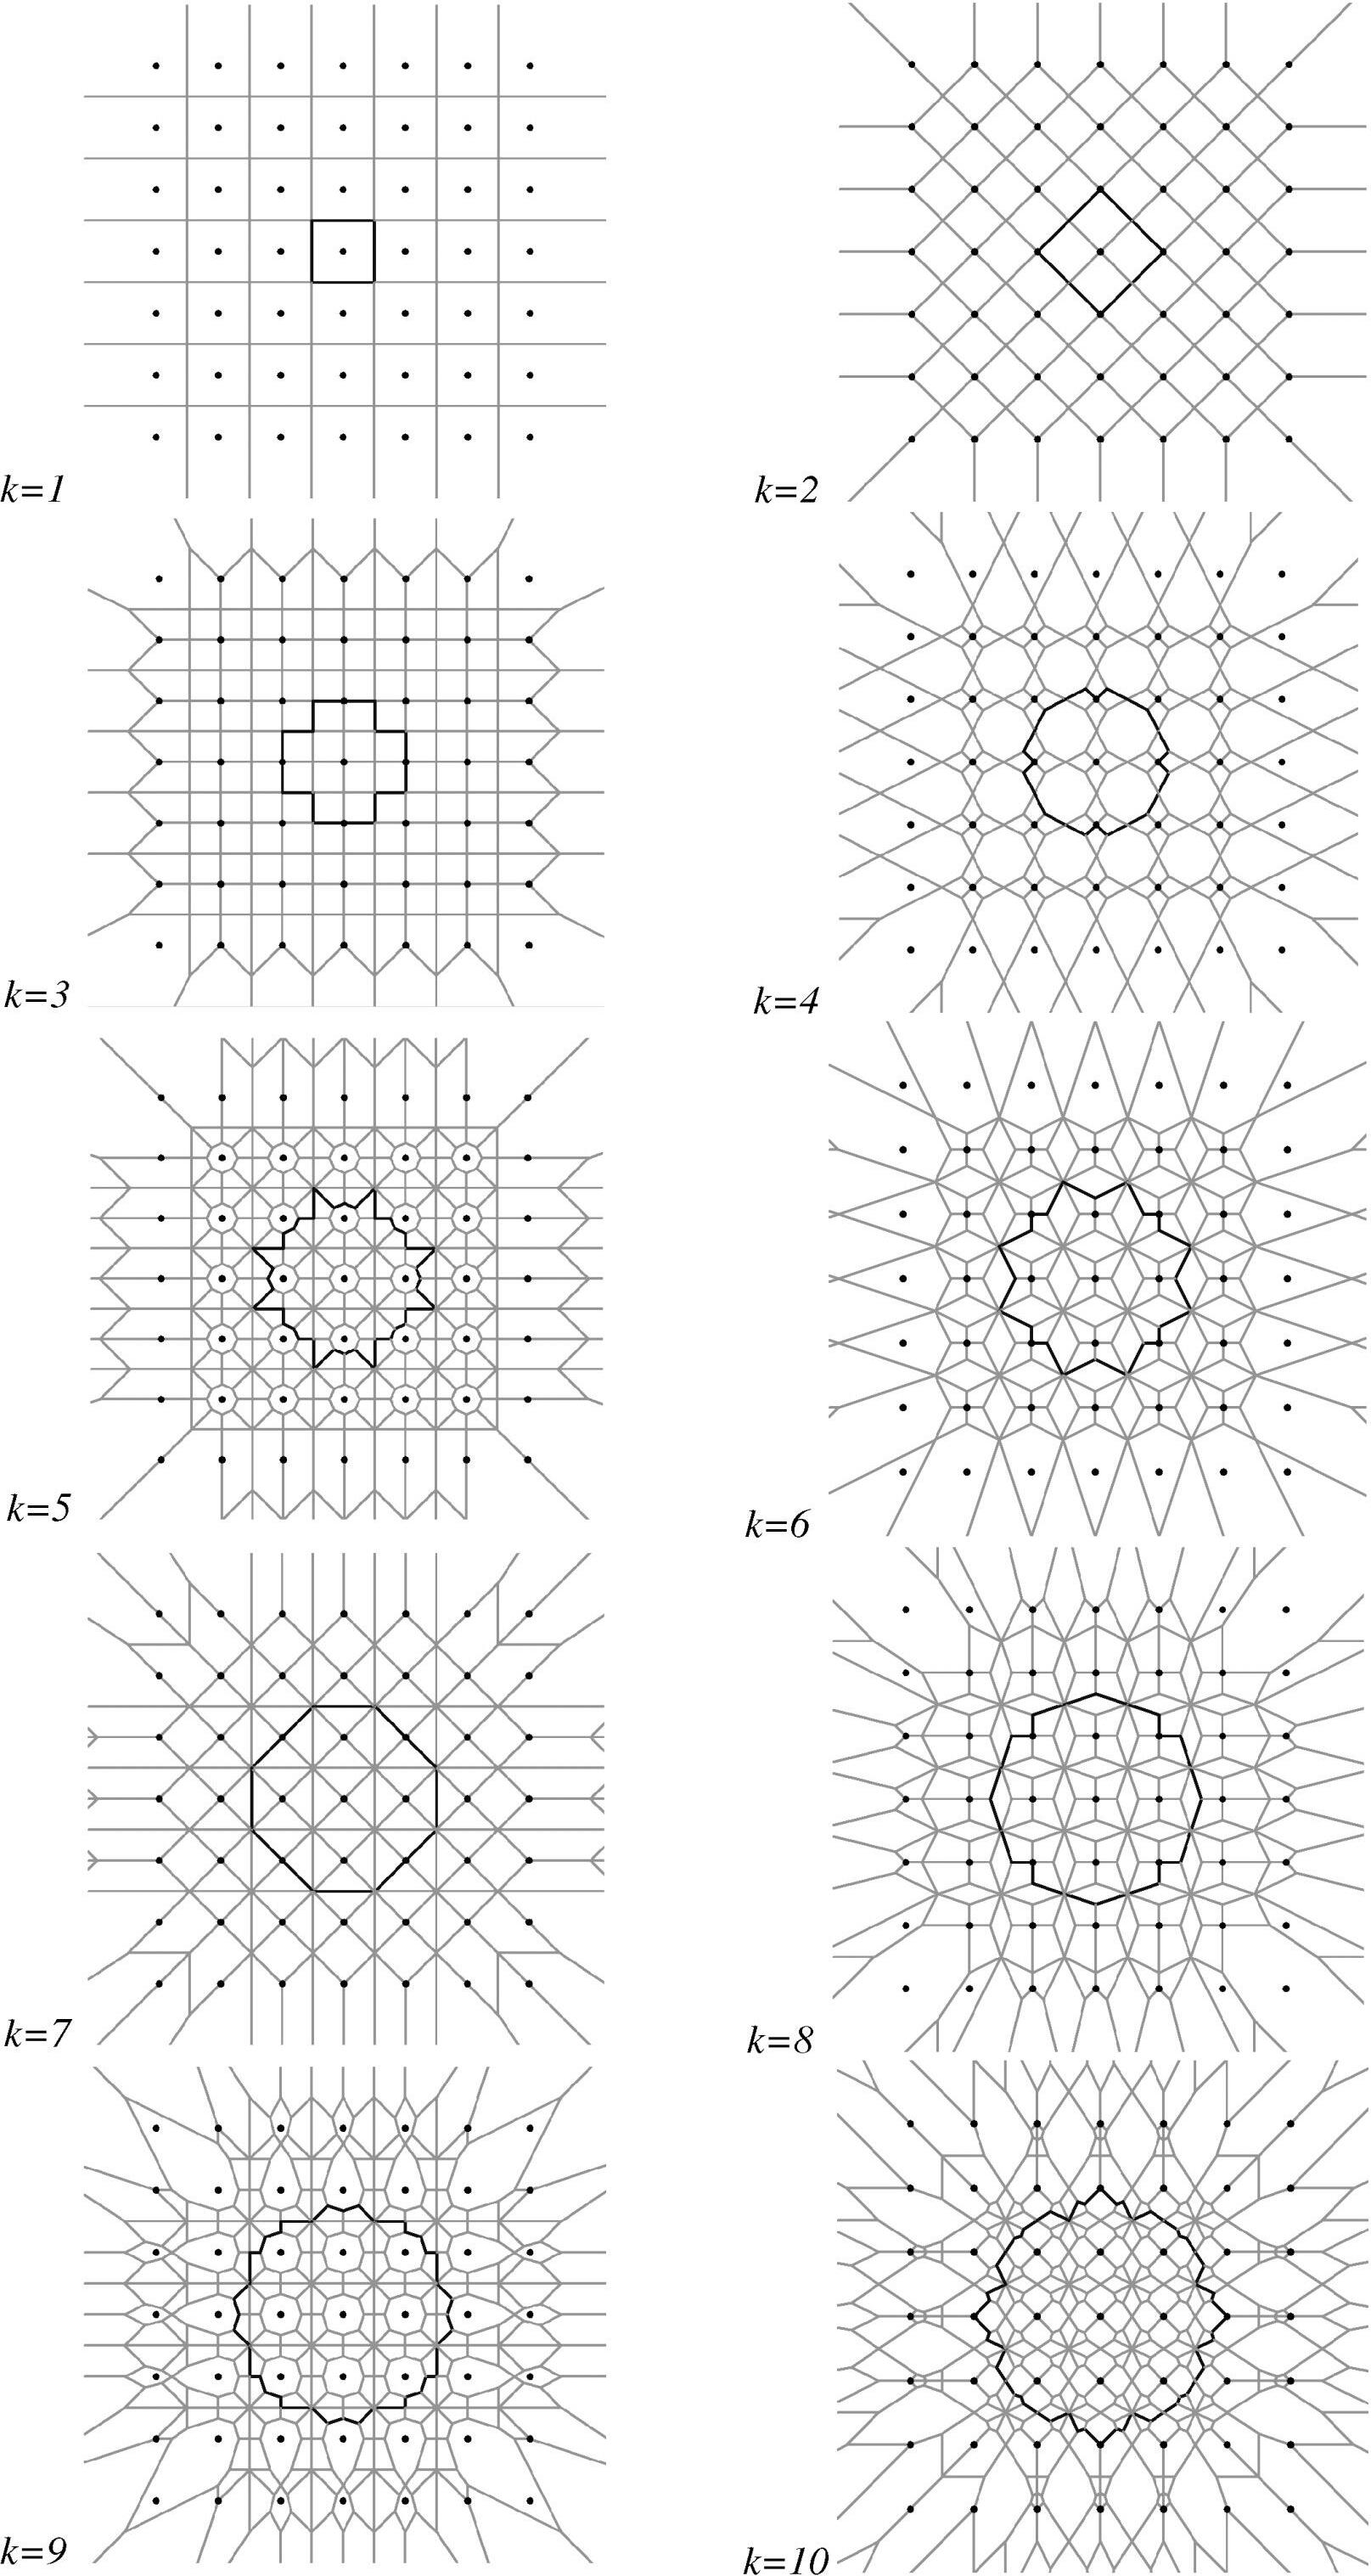
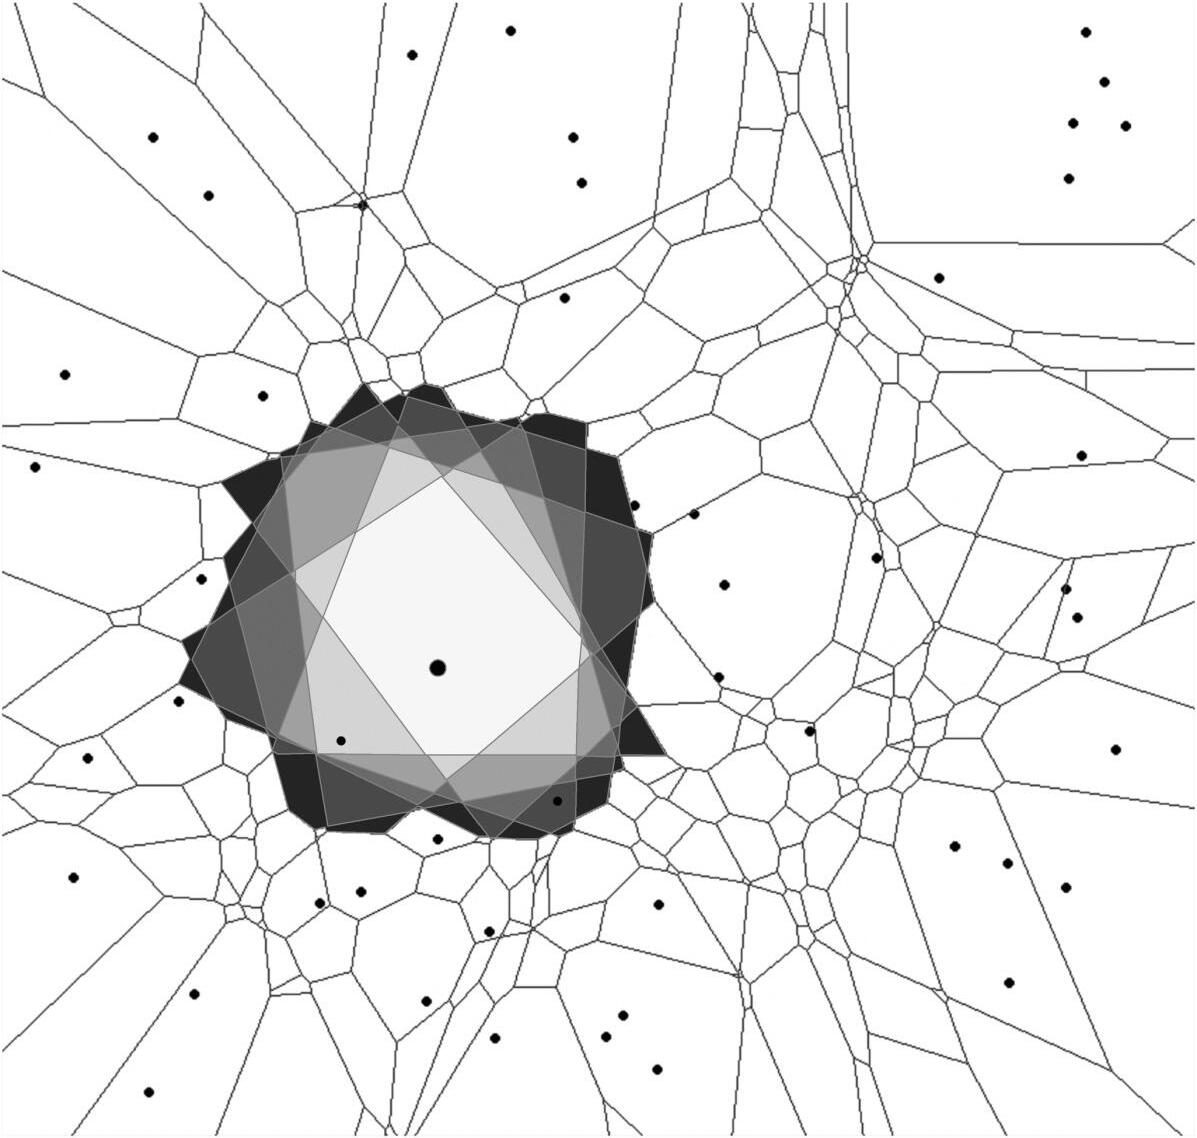
Fig.5. Illustrationofaninclusionzoneforonetree(thebolder centraldot)for k =1to6foranirregulartreemap.Thedots marktreepositions.Forclarity,theinclusionzonesaregivenfor onetreeonly.Theinner(white)polygonisfor k =1,thenext bigger(anddarker)for k =2,andsoon.
GeneratinghigherorderVoronoipolygons,usingtheapproachpresentedhere,isastraightforwardextensionofplanarordinaryVoronoipolygons.However,wehavenotseen higherorderVoronoipolygonsappliedintheforestinventorycontextnorinthecontextof k-treesamplingingeneral.
Obviously,onlyfor k =1willtheinclusionzonesofthe treesinastandbemutuallyexclusive,whereasinclusion zonesfor k >1dooverlap.Infact,thenatureof k-treesamplingensuresthateachsamplepointintheareaofinterest willbecoveredbyinclusionzonesofexactly k trees.
ThesecharacteristicsareillustratedinFig.4forasquare gridoftreepositionsandfor k =1,2,…,10.Inthisspecial casewithtreepositionsonasquaregrid,theinclusionzones foralltreesareidentical.ForclarityinFig.4,onlytheinclusionzoneforthecentraltreeishighlighted.Itcaneasily beseenthat,foradistance s betweentreesonthelattice,the inclusionzoneshaveanareaof I = ks²forall k.Asthis holdsfortheinclusionzonesofalltrees,itisobviousthat eachpointoftheforestiscoveredbytheinclusionzonesof exactly k trees.
Forirregularpoint(tree)patterns,theinclusionzonestake onirregularshapes.Figure5givesanexamplefor k = 1,2,...,6,alldepictedinasinglegraph.
Issuesofapplicationto k-treesampling
For k >1,inclusionzonesbecomemorecomplex.Here, theinclusionzonemustcontainallpointsfromwhichthis particulartreeisthefirst,second,…, kthneighbour.Theinclusionzonefor k alwayscompletelycontainstheinclusion zonefor k= 1,aroundwhichnewareasareadded,forwhich thetreeisthe kthneighbour.Theresultingpolygonsare calledhigherorderVoronoipolygons(Okabeetal.1999). GeometricconstructionofhigherorderVoronoipolygons may,inprinciple,followthesameapproachasdescribed previouslyfor k =1.However,perpendicularbisectorsare notonlybuiltbetweenatargettreeanditsimmediateneighbours,butalsobetweentreesaroundthetargettree.Figure3 illustratesthisgeometricconstruction:theperpendicularbisectorsbetweenalltreesintheareaaroundthetargettree generateatessellationintomanypolygons;here,wereferto thoseassmallpolygons.Allpointsinthesmallpolygons havethesameordereddistancestothesurroundingtrees, thatis,theyhavethesamenearest,secondnearest,third nearest,…, k-nearesttree,asillustratedfortheexamplein Fig.3.Thisordercanbedeterminedbycomparingthepositionofthissmallpolygonwithallhalfplanesresultingfrom thebisectorsthatbuildthesidesofthesmallpolygons.The searched k-orderVoronoipolygonsaroundthetargettreeis thentheunificationofallsmallpolygonsforwhichthetargettreehasbeenidentifiedasthenearest,secondnearest, …, k-nearesttree.Thehigherthevalueof k,themoretrees needtobeincludedinthetessellationprocess.Thisapproachofbuilding k-orderVoronoipolygonsiswhatOkabe etal.(1999,p.230)call“thenaïvemethod”.Whileitissufficientforourpurpose—beinginterestedinthesizeofthe targettree’sinclusionzone—Okabeetal.(1999)treatthe issueinamathematicallymoreformalandgeneralmanner.
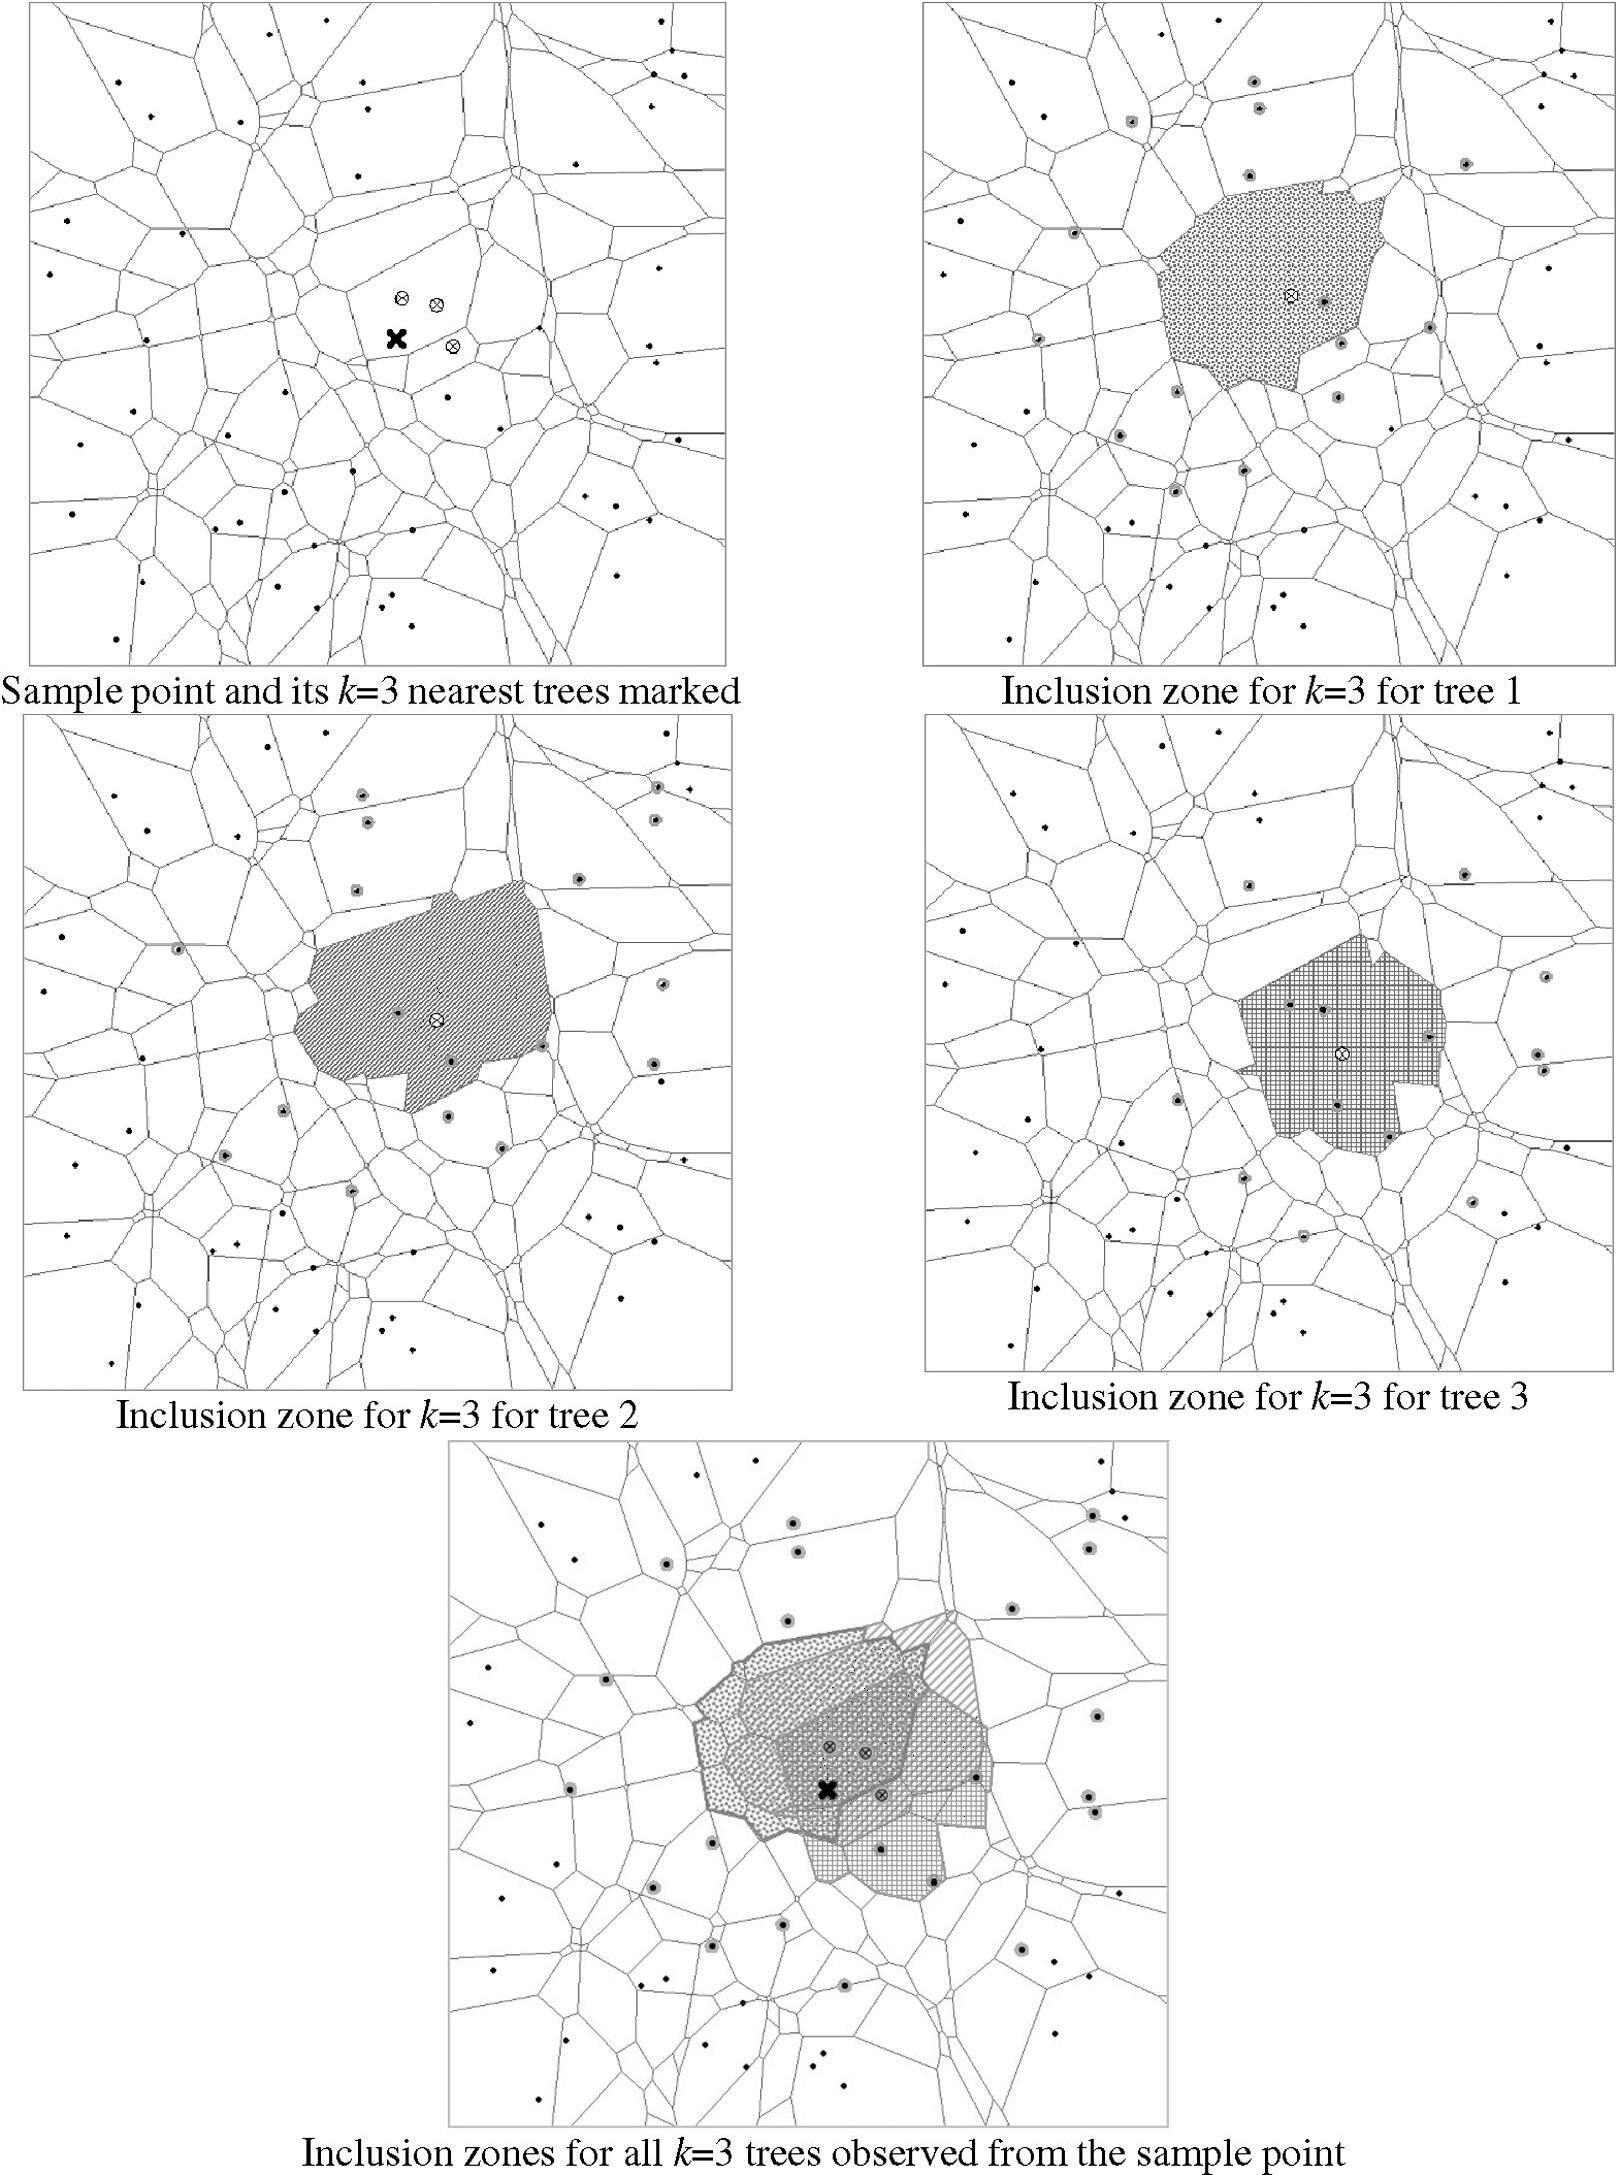
Forestimationin k-treesampling,theinclusionzonesfor all k selectedtreesatasamplepointneedtobedetermined sothat,assumingsimplerandomsampling,theinclusion probabilitycanbecalculatedforeachtreeandtheHorwitz–Thompsonestimatorcanbeemployed.However,contraryto otherresponsedesignssuchasfixed-areaplotsorrelascope sampling,theseinclusionzonescannotimmediatelybedeterminedfromthedefaultinventorymeasurements,buta treemapneedstobegeneratedaroundthesamplepoint,cf. aroundthesampledtrees.Figure6illustratesthisfor k =3.
Thedistanceandnumberoftreestobeincludedinthis mapping,neededtocorrectlyandcompletelydrawtheinclusionzonesforall k includedtrees,dependsonthespatialarrangementofthetreesandintertreedistancesandisnot immediatelyobvious.However,theoverallefforttodothis mappingislikelytobeprohibitiveforfieldapplicationof thistechniqueinforestinventoryuntileasytechnicalmethodsfortreemappingarefound.Devisingsuchatechniqueis anongoingissue;forexample,fromthesamplepoint,the azimuthanddistancetotheneighbouringtreescouldbe measuredwithanelectronicsurveydevicelinkedtoafield computer.Thesefieldmeasurementscouldalsobedoneusingterrestrialhorizontallaserscanning.Thepositionsofthe surroundingtreesarethenmappedbypolarcoordinates,and theresultingVoronoidiagramsarecalculatedaftereachnew positionmeasurement.Assoonassufficienttreesare mappedsothattheinclusionzonesofall k treescanunambiguouslybecalculated,themeasurementprocesscanbe terminated.Futurepracticalapplicationofthistechnique willgiveindicationsofthepracticalfeasibilityofthedescribedapproach.
Discussionandconclusion
Theinclusionzoneapproachhaseventuallyshownthe
Fig.6. Illustrationofinclusionzonesforonesamplepointwitha k-treesample(k =3):fromthesamplepoint(×)the k =3nearest treesareidentifiedassampletrees.Forallthese k treesthethird-orderVoronoipolygons(i.e.,individualinclusionzonesfor k =3) needtobedetermined.Todoso,thepositionsofneighbouringtreesneedtobemapped,heremarkedwithbolddots.Altogether,the positionsof24treesarerequiredhere,asillustratedinthelowermap.
waytowardunbiasedestimationinpoint-to-treedistance sampling.Thepresentedtechniqueisdesignbasedanddoes notrequireanyassumptionsabouttheunderlyingpointpattern.Itisagenerallyvalidapproach.Toourbestknowledge, thisisthefirstgeneralizeddesign-unbiasedapproachdevelopedfor k-treesampling.Estimationfollowstheprinciples ofunequalprobabilitysampling,inprinciplejustlike
relascopesampling,butdeterminingtheinclusionprobabilitiesismorecomplex.
Thecoreelementoftheestimatoristheconceptofinclusionzones,which,undersimplerandomsampling,define theprobabilitiesofindividualtreesbeingincludedinthe sample.Forpoint-to-treedistancesampling,theseinclusion zonesaresignificantlydifferentfromthoseknownfrom
otherresponsedesignsinforestinventorying,suchasfixedareaplots,nestedplots,orrelascopeplots:
(1)Inclusionzonesforpoint-to-treedistancesamplingare variableinareaandirregularinshape.
(2)Sizeandshapeoftheinclusionzonesdependexclusivelyonthespatialarrangementoftheneighbouring trees.Theyarenotproportionalordirectlyrelatedto anytreeattribute,andcannot,therefore,becalculated fromthevariablescommonlyobservedinforestinventory.
(3)Therefore,additionalmeasurements(namelyposition measurementsfortheneighbouringtrees)mustbetaken todeterminetheinclusionzones.
(4)Becausetheinclusionprobabilitiesarenotdirectlydeterminedasafunctionofanytreecharacteristic,they arenotproportionaltoanytreeattribute.Itistherefore hypothesizedthatthestatisticalperformancemaynotbe superiortothatofotherplotdesigns.
(5)Inclusionzonesendbydefinitionatthestandboundary; boundaryoverlapofinclusionzonesisnotanissue.
(6)Therearenoemptysampleplotsintheareaofinterest. Eachpointoftheareaiscoveredbyexactly k inclusion zones.
Theapproachtoestimationpresentedhereisoftheoreticalinterestinthefirstplace.Itallowsforthecomparisonof k-treesamplingtootherplotdesignswithouttherestriction thatfor k-treesamplingonecanonlyresorttoasetofbiased estimators.Suchcomparisonsarethesubjectofcurrentresearch.
Itisobvious,however,thatthemapping,requiredtomake thecalculationsforthepresentedestimator,isaseveredrawbackforpracticalimplementation.The“easyapplication” (Sheiletal.2003)of k-treesamplingwouldthenbelost.
Still,thereisnodoubtthatthecommonlyusedempirical designandmodel-basedapproximationtechniqueswillcontinuetohavepracticalrelevance.Possibly,methodscanbe identifiedtocalculateorapproximatetheareaoftheinclusionzonesinalesscomplexmannerthandescribedinthis paper.Anempiricalregressionapproach,inwhichthepertreeinclusionzoneisregressedagainstthedistances,azimuths,andpositionsofthe k trees,iscurrentlybeingtested.
Acknowledgements
Wegratefullyacknowledgesupportofthisresearchfrom theGermanScienceFoundationundergrantKL894/7-1.The authorsthankDr.WalterZucchini,InstituteofStatisticsand EconometricsatGeorg-August-UniversitätGöttingen,for technicaldiscussionsandDr.JennyWong,DirectorWild ResourcesLtd.,Bangor,Wales,forsuggestionsandlanguagerevisionofthemanuscript.Theobservationsandrecommendationsoftwoanonymousreviewershelpedto improvethemanuscript.
References
Barabesi,L.,andFattorini.L.1998.Theuseofreplicatedplot,line andpointsamplingforestimatingspeciesabundanceandecologicaldiversity.Environ.Ecol.Stat. 5:252–370. Besag,J.E.,andGleaves,J.T.1973.Onthedetectionofspatialpatterninplantcommunities.Bull.Int.Stat.Inst. 45:153–158.
Cottam,G.,Curtis,J.T.,andHale,W.1953.Somesamplingcharacteristicsofpopulationsofrandomlydispersedindividuals. Ecology, 34:741–757.
Cox,F.1971.DichtebestimmungundStrukturanalysevon PflanzenpopulationenmitHilfevonAbstandsmessungen. MitteilungenderBundesforschungsanstaltfürForst-und Holzwirtschaft,Reinbek/Hamburg,No.87.[InGerman.]
Engeman,R.M.,Sugihara,R.T.,Pank,L.F.,andDusenberry,W.E. 1994.AcomparisonofplotlessdensityestimatorsusingMonte Carlosimulation.Ecology, 75(6):1769–1779.
Eriksson,M.1995.Design-basedapproachestohorizontal-pointsampling.For.Sci. 41(4):890–907.
Essed,D.1957.Estimationofstandingtimber.Doctoralthesis, WageningenAgriculturalUniversity,H.Veenman&Zonen, Wageningen,Netherlands.
Goreaud,F.,andPélissier,P.2003.Avoidingmisinterpretationof bioticinteractionswiththeintertypeK12-function:population independencevs.randomlabellinghypotheses.J.Veg.Sci. 14: 681–692.
Grosenbaugh,L.R.1952.Plotlesstimberestimates—new,fast, easy.J.For. 50:32–37.
Grosenbaugh,L.R.1955.Betterdiagnosisandprescriptioninsouthernforestmanagement.South.For.Exp.Stat.Occas.Pap.145.
Hall,J.B.1991.Multiple-nearest-treesamplinginanecological surveyofAfromontanecatchmentforest.For.Ecol.Manage. 42: 245–266.
Horwitz,D.G.,andThompson,D.J.1952.Ageneralizationofsamplingwithoutreplacementfromafiniteuniverse.J.Am.Stat. Assoc. 47:663–668.
Husch,B.,Miller,C.I.,andBeers,T.W.1993.Forestmensuration. 3rded.KriegerPublishingCompany,Melbourne.
Jonsson,B.,Holm,S.,andKallur,H.1992.Aforestinventory methodbasedondensity-adaptedcircularplotsize.Scand.J. For.Res. 7:405–421.
Kleinn,C.,andVil ko,F.Anewempiricalapproachforestimation in k-treesampling.For.Ecol.Manage.Inpress.
Krebs,C.J.1999.Ecologicalmethodology.2nded.AddisonWesleyLongman,MenloPark,Calif.
Lessard,V.,Reed,D.D.,andMonkevich,N.1994.Comparing ntreedistancesamplingwithpointandplotsamplinginnorthern Michiganforesttypes.North.J.Appl.For. 11(1):12–16.
Lowell,K.E.1997.Anempiricalevaluationofspatiallybasedforestinventorysamples.Can.J.For.Res. 27:352–360.
Mandallaz,D.1991.Aunifiedapproachtosamplingtheoryfor forestinventorybasedoninfinitepopulationandsuperpopulationmodels[online].Diss.Techn.Wiss.ETHZürich9378. Availablefromhttp://e-collection.ethbib.ethz.ch/show?type= diss&nr=9378[accessed27April2006].
Mandallaz,D.1995.“Leshasardfaitbienleschoses”:statistische MethodenfürdieWaldinventur.Schweiz.Z.Forstwes. 146(12): 1015–1032.[InGerman.]
Mawson,J.C.1968.AMonteCarlostudyofdistancemeasuresin damplingfordpatialdistributioninforeststands.For.Sci. 14(2): 127–139.
Moore,J.,Budelsky,C.,andSchlesinger,R.1973.Anewindex representingindividualtreecompetitivestatus.Can.J.For.Res. 3:495–500.
Morisita,M.1957.Anewmethodfortheestimationofdensityby thespacingmethodapplicabletonon-randomlydistributedpopulations.Physiol.Ecol.Kyoto, 7(2):134–144.
Okabe,A.,Boots,B.,Sugihara,K.,andChiu,S.N.1999.Spatial tessellations:conceptsandapplicationsofvoronoidiagrams. 2nded.JohnWiley&Sons,NewYork.
Overton,W.S.,andStehman,S.V.1996.TheHorwitz–Thompson theoremasaunifyingperspectiveforprobabilitysampling:with examplesfromnaturalresourcesampling.Am.Stat. 49(3):261–269.
Parker,K.R.1979.Densityestimationbyvariableareatransect.J. Wildl.Manage. 43(2):484–492.
Patil,S.A.,Burnham,K.P.,andKovner,J.L.1979.Nonparametric estimationofplantdensitybythedistancemethod.Biometrics, 35:597–604.
Payandeh,B.,andEk,A.R.1986.Distancemethodsanddensity estimators.Can.J.For.Res. 16:918–924.
Picard,N.,Kouyaté,A.M.,andDessard,H.2005.TreedensityestimationsusingadistancemethodinMaliSavanna.For.Sci. 51(1):7–18.
Pielou,E.C.1977.Mathematicalecology.JohnWiley&Sons, NewYork.
Prodan,M.1968.PunktstichprobefürdieForsteinrichtung.Forst Holzwirt, 23(11):225–226.[InGerman.]
Schreuder,H.T.2004.Samplingusingafixednumberoftreesper plot.USDAFor.Serv.Res.NoteRMRS-RN-17.pp.1–3.
Schreuder,H.T.,Gregoire,T.G.,andWood,G.B.1992.Sampling methodsformultiresourceforestinventory.JohnWiley&Sons, NewYork.
Sheil,D.,Ducey,M.J.,andSamsoedin,I.2003.Anewtypeof sampleunitfortheefficientassessmentofdiversetreecommunitiesincomplexforestlandscapes.J.Trop.For.Sci. 15(1): 117–135.
Smaltschinski,T.1981.DichteundBestandesstruktur.Dissertationsschrift.Ph.D.thesis,Albert-Ludwigs-UniversitätFreiburg, Freiburg,Germany.
Sutherland,W.J.(Editor).1998.Ecologicalcensustechniques.A handbook.CambridgeUniversityPress,Cambridge.
Williams,S.W.2001.Comparisonofestimationtechniquesfora forestinventoryinwhichdoublesamplingforstratificationis used.For.Sci. 47(4):563–576.