


MAINTENANCE & RECONSTRUCTION JUNE/JULY 2024 ✪ TOP 50 PAVING ✪ TOP 50 STRIPING ✪ TOP 50 SEALCOATING ✪ TOP 50 PAVEMENT REPAIR THE OFFICIAL MAGAZINE OF PAVE/X CATEGORIES SURVEY RESULTS TOP CONTRACTOR › › › www.ForConstructionPros.com/Pavement


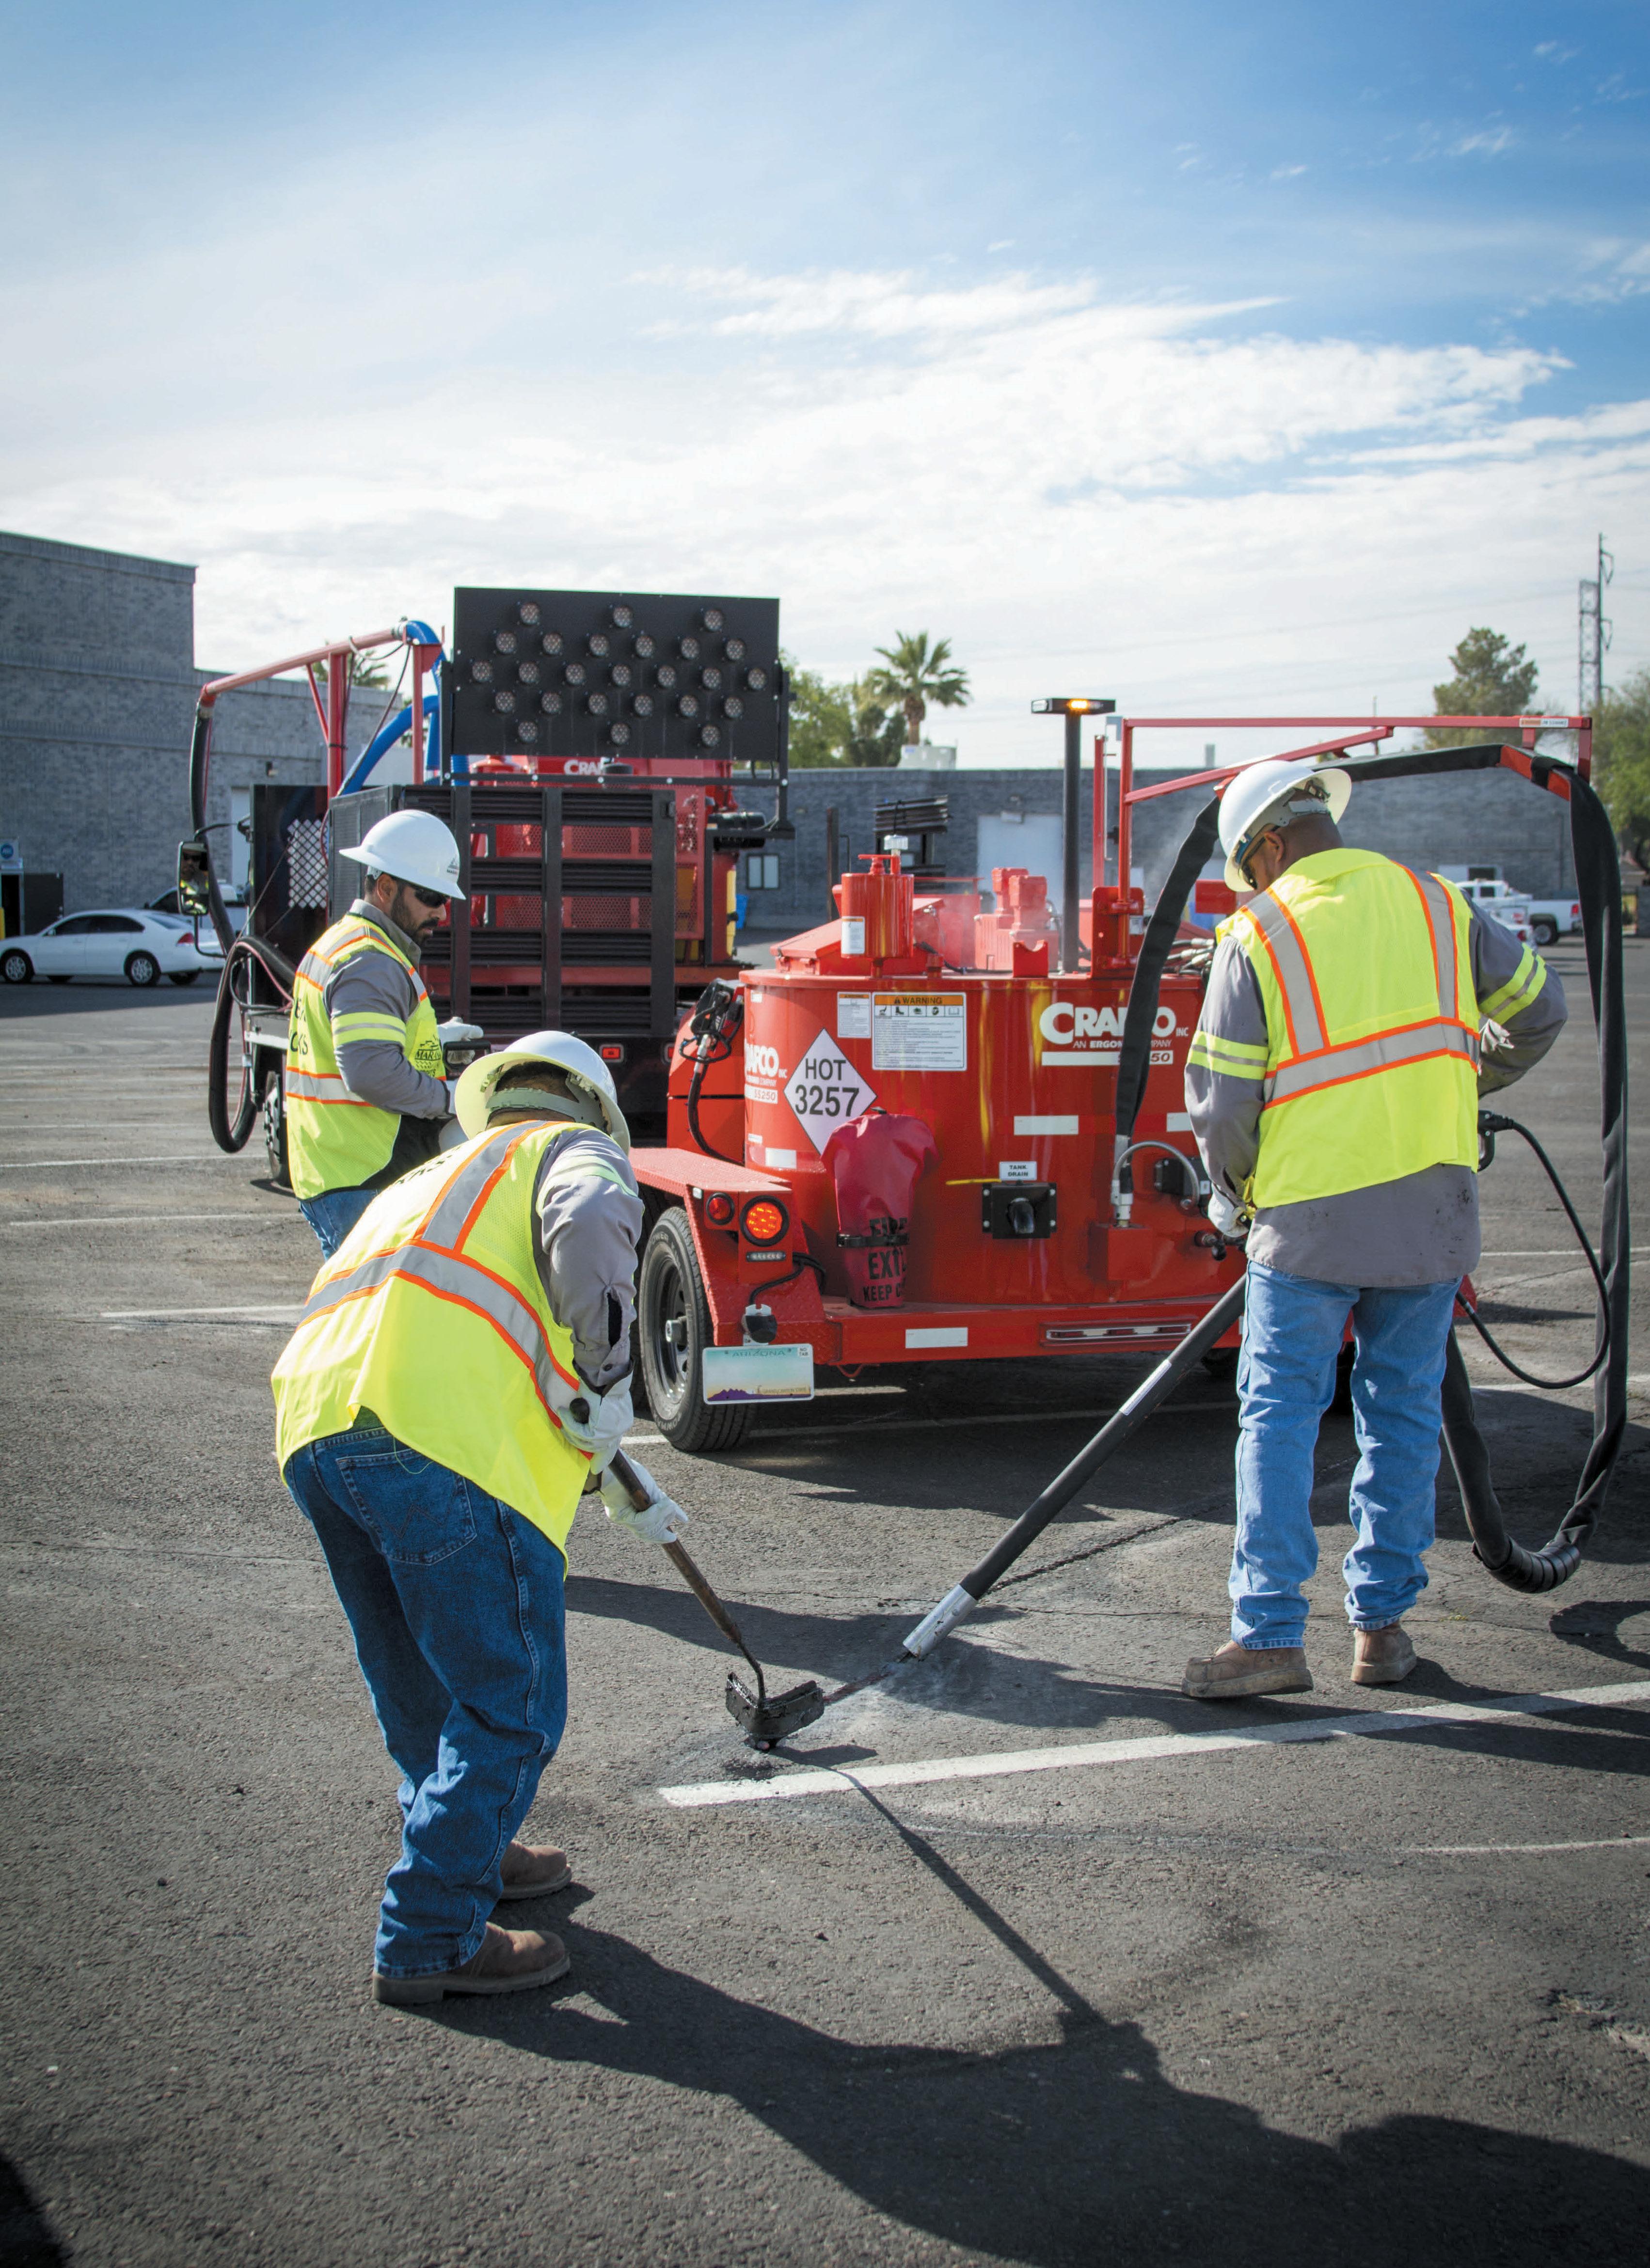
Connect with us The new Crafco EZ Patcher is your solution for safer, faster mastic application. With a floating drag box, camera system and in-cab controls, the EZ Patcher keeps your crew away from traffic while boosting productivity See how the EZ Patcher can help you get more done safely at crafco.com/ez-patcher

FEATURES


SURVEY RESULTS TOP CONTRACTOR
Free Newsletter
The 2024 Top Contractor Overview: No Easy Answers, No Normal
The dust may have settled, but what has come into focus now is an industry in a state of rapid change in terms of work and competition.
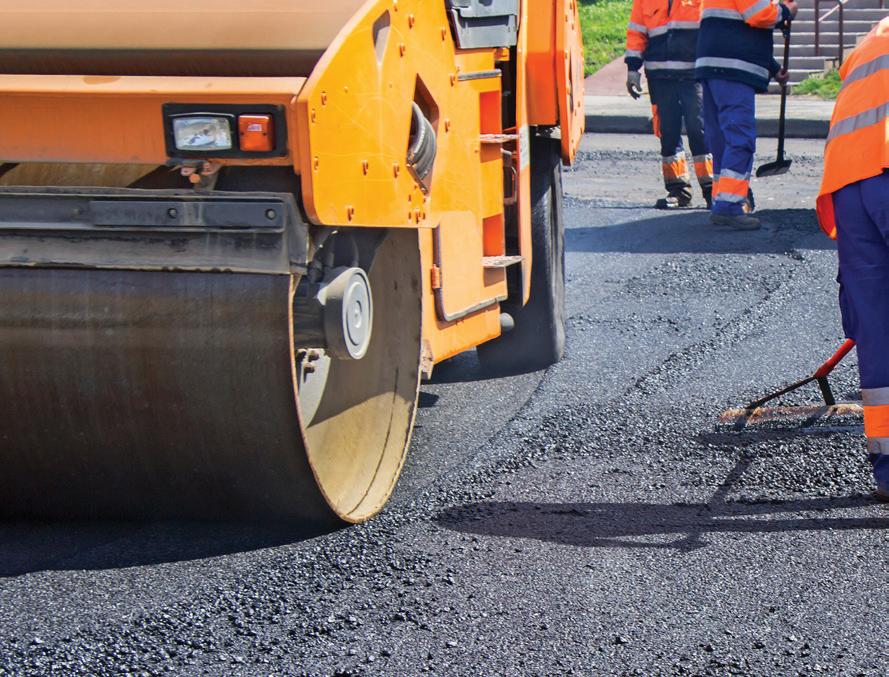
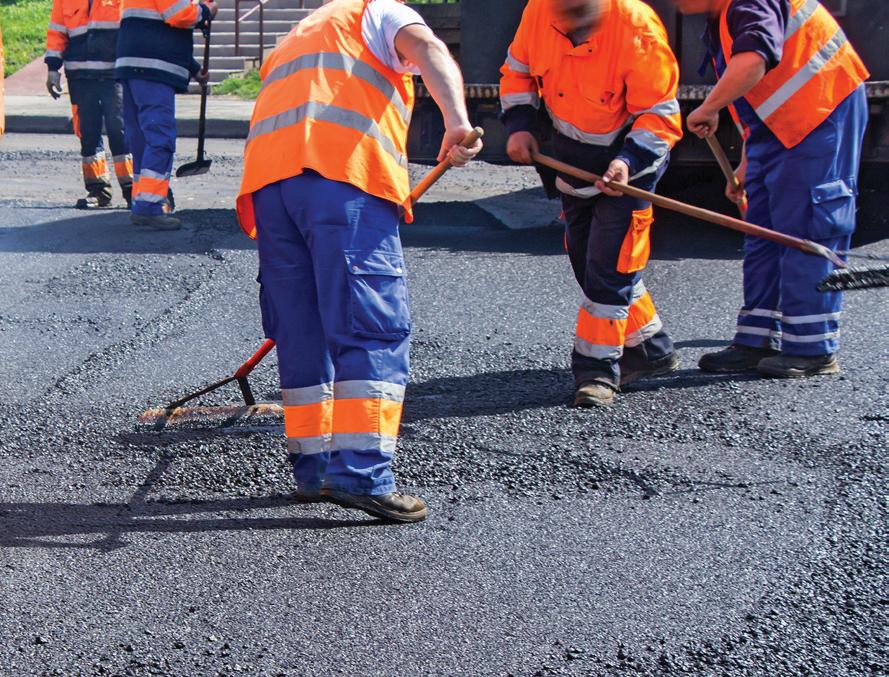
Top 50 Paving 2024: Cracking The Code
Despite a small contraction in the market’s overall grosses, as well as in the area of paving specifically, there might be a trend revealed within the data to explain why profit margins stay strong even in years when less asphalt goes down. 18
Top 50 Sealcoating 2024: A Bit Of An Enigma
Sealcoating over the last 10 years has seen a steady decline in gross sales and that trend continued this year. There may be outside factors influencing this trend, but the profit margins of those contractors still doing it are strong.
Top 50 Striping 2024: Line Goes Down
On the whole, an outsider might assess the striping sector as one that has also trended down over the last couple years, but that isn’t the case when you analyze things in closer detail. Striping is strong and profitable.
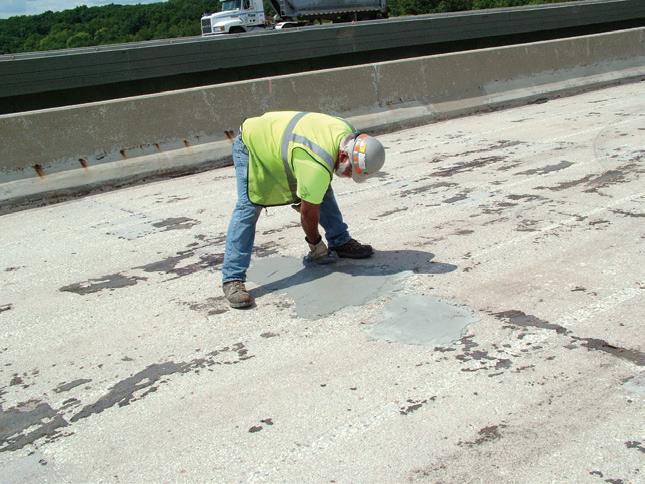
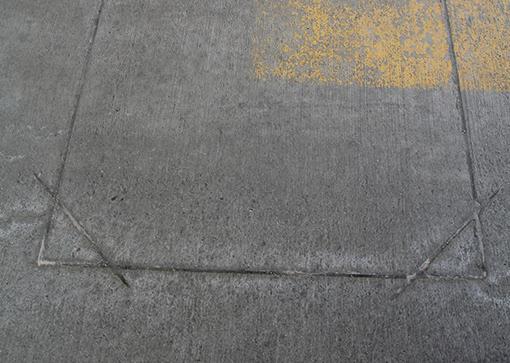
Top 50 Pavement Repair 2024: A Sure Thing
Of all the categories that we took survey data on, the Pavement Repair sector seems to be holding the most consistent and predictable growth over the last 10 years.
Subcribe to the twice monthly Blacktop Update newsletter, and stay on top of all the latest howto articles, new products, industry events, the upcoming Pavement Awards 2025, videos like the No Edge Lines series, and SO MUCH MORE! Scan the QR code below and sign-up TODAY!

TABLE OF CONTENTS June/July 2024 | Issue 5, Volume 36 www.ForConstructionPros.com/Pavemen t | June/July 2024 | PAVEMENT MAINTENANCE & RECONSTRUCTION 3
8
10
26
34
IN EVERY ISSUE 6 Editorial 42 Classifieds
WHAT’S ONLINE
A Better Hiring Mindest: What We Can Offer You
Jose Hernandez and his brother Pete started their asphalt business with nothing, but discovered an out-of-the-box recruitment method to find quality employees.
Read more at: https://pavemg.com/ahnindsm
Love & Asphalt | No Edge Lines Season 2 Episode 1
Our editor Brandon heads to his first-ever World of Asphalt in Nashville, TN, where he walks the showroom floor, talks to attendees, and ultimately ends up on a river boat party. Checkout the first episode of an all-new season of No Edge Lines.
Read more at: https://pavemg.com/NELS2E1
IGNITE Construction Summit 2024: Registration Open!
Register now, space is limited for the #1 management focused conference in the industry! This year’s destination: sunny Palm Springs, CA.
Read more at: https://pavemg.com/IGNITE


ADVISORY BOARD
Agua Trucks Inc
Wickenburg, AZ, Scott Duscher
Asphalt Contractors Inc., Union Grove, WI Robert Kordus


Published and copyrighted 2024 by IRONMARKETS. All rights reserved. No part of this publication may be reproduced or transmitted in any form or by any means, electronic or mechanical, including photocopy, recording or any information storage or retrieval system, without written permission from the publisher.

Subscription policy: Individual subscriptions are available without charge in the U.S. only to pavement maintenance contractors, producers and government employees involved in paving or pavement maintenance; dealers, and distributors of pavement maintenance equipment or materials; and others with similar business activities. Complete the subscription form at www.forconstructionpros.com or use your company letterhead giving all the information requested. Publisher reserves the right to reject nonqualified subscribers. One year subscriptions for nonqualified individuals: $35.00 U.S.A., $60.00 Canada and Mexico, and $85.00 all other countries (payable in U.S. funds, drawn on U.S. bank). Single copies available (prepaid only) $10.00 each (U.S., Canada & Mexico), $15.00 each (International). Pavement Maintenance & Reconstruction (ISSN 1098-5875), is published eight times per year: January, February, March, April/May, June/July, August/September, October/ November, December by IRONMARKETS, 201 N. Main St. Ste 350, Fort Atkinson, WI 53538. Periodicals postage paid at Fort Atkinson, WI and additional entry offices.


POSTMASTER: Please send change of address to Pavement, PO Box 3605, Northbrook, IL 60065-3605. Printed in the USA.
PAVEMENT MAINTENANCE & RECONSTRUCTION is proudly supported by these associations:


Asphalt Restoration Technology Systems, Orlando, FL Connie Lorenz
Brahney Paving, Hillsborough, NJ Steven Brahney
Eosso Brothers Paving; Hazlet, NJ ...................................................................... Tom Eosso
Maul Paving/Concrete/Sealcoating, PLainfield, IL ........................................ Chris Maul
Parking Lot Maintenance, Lake St. Louis, MO .......................................... Todd Bruening
Petra Paving, Hampstead, NH Chris Tammany
Pioneer Paving, Albuquerque, NM Don Rooney
Roberts Traffic, Hollywood, FL Lisa Birchfield
Show Striping Inc. (SSI), Wisconsin Dells, WI Amber Showalter
T&N Asphalt Services, Salt Lake City, UT Nick Howell
Young Sealcoating Inc, Lynchburg, VA Steve Young
The Paving Lady Mauro Comuzzi
JMP Excelsior Services
Jim Panzenhagen
Sweeping Industry Veteran Gabe Vitale
Flat Nickel Management
Michael Nawa
Wis-Coat Asphalt Maintenance ....................................................................... Marvin Joles
Clear Choice Sealing ......................................................................................Warren Johnson
Jacketta Sweeping Services
Debbie Jacketta
Royal Pavement Solutions Kenneth Roy III
ASSOCIATION REPRESENTATIVES:
Pavement Coatings Technology Council Brian Riggs, Executive Director
4 PAVEMENT MAINTENANCE & RECONSTRUCTION | June/July 2024 | www.ForConstructionPros.com/Pavemen t
68 Vol. 36, No. 5 June/July 2024
PAVEMENT


BUILDING AMERICA... SINCE 1926.


W. R. MEADOWS got its start helping to "Build America" in the 1920s. And now – just as then –
W. R. MEADOWS is a source you can trust for quality building materials for all your airport, bridge, highway and water treatment plant projects.
Our product line includes:
• Concrete curing and sealing compounds for highways
• Epoxies and repair mortars for restoring and strengthening existing concrete
• Expansion joint materials for easing the expansion and contraction of concrete slabs
• Waterproofing for bridge decks and foundations
• Joint sealants for asphalt and concrete surfaces
W. R. MEADOWS: Founded and Flourishing in America for 97 years. Visit www.wrmeadows.com or call 1-800-342-5976 for more information.
© W. R. MEADOWS, INC. 2023
PAVEMENT


How Asphalt Employers Can Find Their Next Superstar
There are always people under you with something great to offer, they’re just waiting for someone to invest in them.
My whole life I’ve been an ideas-man, but in every place I was before here, I never seemed to have the support to help me succeed in the way that I’ve experienced in my current role. And I’ve been through some interesting phases in the road that led me editor. Anytime I sit down with a new contractor, asphalt worker, or industry executive, and we talk for any amount of time, it never fails that I get asked, “What did you do before?”
 Brandon Noel, Editor bNoel@iron.markets 234-600-8983
It’s only appropriate, on the two-year anniversary issue of when I became editor of Pavement Maintenance, that I get a little bit into it while also sharing what I’ve learned about leadership.
SPOTTING THE ONES
It dawned on me while driving one day recently, all the stepping stones and experiences at different jobs and opportunities that didn’t pan out. I bet if you stopped and thought about it, you could conjure up your own list of dead-ends and cul-de-sacs where things did not go the way you hoped or imagined. It can make you feel like a failure, and I felt that way for a long time, but I no longer do. I have come to see that those weren’t necessarily failures of my ideas or, especially, my efforts; but failures of support and leadership.
Without knowing it, I was always looking for a leader who would say, “All right, let’s go. What do you need from me?” Even when I was working in a steel factory, as the operator of a repetitive stamping machine, I would stand there and have ideas. Anytime I tried to realize them, or share them, there was a little-to-no interest. I experienced that in lots of parts of my life in various ways, either by choice or by lack of time and energy, things never came together.
At your company, right now, there is somebody, and maybe more than one, who is an ideaperson. They can’t help but want to put themselves fully into the work they do, no matter how small. You might have recognized their hard work, or, at the very least, their weird enthusiastic ways of approaching the job. They stick out a bit, right? They can’t help but want to rethink how to get things done, even if the way it’s been done has worked for many years. Any time you put them on something new, they’re quickly wanting to discuss changes or new methods.
IT CHANGES EVERYTHING
At past jobs, whenever I tried to invest myself into my work in a greater way, it was met with either indifference or outright resistance, rather than with leadership.
The thought I want to leave you with is to, perhaps, look around at your group of employees, the people you’re charged to lead, and find the ones who are wanting more. I charge you to tell them, “All right, let’s go. What do you need from me?” and see what might blossom from that seed. ■

EDITORIAL
Editor Brandon Noel bnoel@iron.markets
Content Director, Marketing Services ...........Jessica Lombardo jlombardo@iron.markets
Managing Editor Gigi Wood gwood@iron.markets
Senior Editor, Equipment & Workwear, IRONPROS Michael Cheng mcheng@iron.markets
Junior Editor Merina Shriver mshriver@iron.markets
AUDIENCE
Audience Development Manager Angela Franks
PRODUCTION
Senior Production Manager Cindy Rusch crusch@iron.markets
Art Director April Van Etten
ADVERTISING/SALES
Brand Director Amy Schwandt aschwandt@iron.markets
Brand Manager Megan Perleberg mperleberg@iron.markets
Sales Representative .................................................... Sean Dunphy sdunphy@iron.markets
Sales Representative Kris Flitcroft kflitcroft@iron.markets
IRONMARKETS
Chief Executive Officer.................................................. Ron Spink
Chief Revenue Officer Amy Schwandt VP, Finance Greta Teter VP, Audience Development Ronda Hughes VP, Operations & IT Nick Raether VP, Demand Generation & Education ....................... Jim Bagan Corporate Director of Sales Jason DeSarle
Brand Director, Construction, OEM & IRONPROS Sean Dunphy
Content Director ...................................................... Marina Mayer
Director, Online & Marketing Services Bethany Chambers Director, Event Content & Programming Jess Lombardo
CIRCULATION & SUBSCRIPTIONS
P.O. Box 3605, Northbrook, IL 60065-3605 (877) 201-3915 | Fax: (847)-291-4816 circ.pavement@omeda.com
LIST RENTAL
Sr. Account Manager Bart Piccirillo | Data Axle (518) 339 4511 | bart.piccirillo@infogroup.com
REPRINT SERVICES
Brand Manager ..................................................... Megan Perleberg mperleberg@iron.markets | (800) 538-5544
Published and copyrighted 2024 by IRONMARKETS. All rights reserved. No part of this publication may be reproduced or transmitted in any form or by any means, electronic or mechanical, including photocopy, recording, or any information storage or retrieval system, without written permission from the publisher.


6 PAVEMENT MAINTENANCE & RECONSTRUCTION | June/July 2024 | www.ForConstructionPros.com/Pavemen t EDITORIAL
@PAVEMENTMAGAZINE WWW.FORCONSTRUCTIONPROS.COM/PAVEMENT Published by IRONMARKETS 201 N. Main St. Ste 350, Fort Atkinson, WI 53538 (800) 538-5544 • IRON.MARKETS.COM
@PAVEMENTMAGAZINE @PAVEMENTMAINTENANCE
@PAVEMENTMAGAZINE


 By Brandon Noel, Editor
The Top Pavement Maintenance Contractors of 2024: No Easy Answers, No Normal
The complex economic factors at work in our industry are impacted by many outside forces. If you only look at the yearover-year figures, you might be discouraged, but we’ve been tracking things for more than a decade, and upward is still the trend.
Things in the world, the economy, and, subsequently, in our industry aren’t as clear cut as you might like or hope them to be. The water is a bit muddied concerning who’s growing and what exactly is helping them grow. One thing that seems clear is that the market is becoming an increasingly competitive environment. Contractors have to take advantage of every tool, trick, and tactic to gain an advantage over their competitors. And while there are plenty of parking lots, streets, and other asphalt surfaces out there for companies to bid against one another for, there does seem to be a little bit of caution in the air.
It’s not all doom-and-gloom, however, the self-reported results from those who participated in the Top Contractor survey for 2024 show a healthy amount of individual growth, year-over-year. Also, while this was just the second time that the surveys were
collected exclusively online through a digital form submission we saw an increase in overall participation from members of the industry over last year’s launch.
In 2023, when we switched away from paper submissions, there was a slight dip in the number of participants, likely due to the transition, but it looks to be on track to recover from that as people adjust to the new status quo.
The economic status of the pavement maintenance industry isn’t easy to decipher, even with the amount of information we collect for the lists, it only provides a peak behind the asphaltcurtain. This year, that brief look behind the scenes was a little confusing.
While every individual Top 50
category provided seemed to dip a little bit, in terms of their individual sales, the overall gross sales for the Top 50 contractors exceeded that of last year. One explanation for this would be that there was an increase in certain sales outside of our queried categories (paving, pavement repair, sealcoating, and striping) that we haven’t accounted for yet by name.
That’s something that we would like to hone in on and correct in future years. Rather than just leave it marked to “other” we would prefer find out if there are emerging services that are growing in the industry to the point that makes them relevant to document, and bring to the attention of everyone else.
8 PAVEMENT MAINTENANCE & RECONSTRUCTION | June/July 2024 | www.ForConstructionPros.com/Pavemen t

OVERALL SALES TOTALS
For the Top 50 Contractors, based solely on gross total sales, we have our one, singular, and indisputable point of growth from last year at a staggering $1.588 billion. In 2023, the Top 50 contractors totaled more than $1.544 billion, which was a point of shrinkage from 2022’s total of $1.674 billion. Taken into context, these three figures are all hovering around each other pretty closely, and it’s important to remember that the really high total from 2022 was based on the 2021 sales figures. That was the first full year after the major shutdowns of the Covid-19 pandemic. It may have spiked that year a little bit, as people didn’t spend as much according to the 2021 Top Contractor survey, which showed a total sales number of only $1.096 billion.
There’s one thing we must do, however, because in previous years we excluded the “other” segment in this figure and simply added up the four categorical segment totals. We want to show apples-to-apples, not apples-to-oranges.
Calculated under the previous method, the gross sales total of all categories is $1.374 and that represents a contraction of almost 11% or a difference of $214 million. That might seem somewhat alarming, but I believe that the “other” category is something we need to take a more detailed look at in years to come, in order to better understand the numbers.
Let’s briefly examione each category, including the mysterious “other” lurking in there, and their TOTAL gross sales:
• Paving Top 50: $1.614 billion in 2024 total sales compared to $1.723 billion in 2023
• Striping Top 50: $1.435 billion in total sales compared to $1.583 billion in 2023
• Sealcoating Top 50: $1.448 in total sales compared to $1.590 billion in 2023
• Pavement Repair Top 50: $1.544 in total sales compared to $1.672 billion in 2023
• The “Other” category from the Top 50: $221 million in total sales for 2024 compared to $213 million in 2023
You can see that thia is really making a big difference. We must, also, note that the “other” category grew by $8 million. The differences between 2024 and 2023’s gross total sales is made up by the “other” sales, erasing what looks to be a year-overyear loss.
I think that, at least in part, the contractors responding to our survey are doing more diverse work than ever before. What we must do in the years going forward is figure out a way to quantify and capture the data in a way that reflects the diverse work strategies the industry is taking on.
Looking at the four primary Top 50 categories, things don’t look as blatantly positive as they did a year before. All four categories saw at least some contraction, bringing in less from their respective segmented-only sales. However, as you will see, we do try to decipher why this is the case, as well as, why it might not be a sign for panic:
• Paving-Only sales dropped to $844,813,039 compared to $913,190,892 in 2023
• Striping-Only sales dropped to $89,944,736 compared to the $130 million generated in 2023
• Sealcoat-Only sales dropped to $152,812,614 compared to $186,110,524 the previous year
• Pavement Repair-Only sales dropped to $285,633,743 from the all-time high of $315 million in 2023
THE AVERAGE TOP 50 CONTRACTOR
The average contractor in our Top 50 generated an average $32 million in gross total sales, which is a drop from last year’s average of $35 million. However, it remains far above the two years before that, which came in at $23 million in 2022 and $14 million in 2021. That’s still an upward trending figure. Their average segmented revenue streams breakdown as follows:
• Paving: 49%
• Striping: 10%
• Sealcoat: 12%
• Pavement Repair 18%
• Other: 8.85%
• Hot Mix Asphalt Sales: 1.4%
• Surface Treatments: 0.75%
The average contractor’s time was split up as follows:
• Driveways: 4%
• Highways: 3%
• Parking Lots: 72%
• Residential/City Roads: 17%
• Other: 4%
The average contractor’s customer mix broke down as follows:
• Commercial/Industrial: 60%
• Municipal: 13%
• Multi-family/HOA/etc: 19%
• Single Family: 6%
• Other: 2%
In one of the few growth areas for all of 2024, the Top 50 Contractors earned an average of 27% of their gross sales working as a subcontractor for someone else. That is an increase over last year’s previous high of 24% and continues the upward trend from 2022’s 17%. ■
For more information visit https://pavemg.com/ topcontractor24
www.ForConstructionPros.com/Pavemen t | June/July 2024 | PAVEMENT MAINTENANCE & RECONSTRUCTION 9
By Brandon Noel, Editor
PAVING 50
Top 50 Paving Contractors 2024: CRACKING THE CODE
Is there a trend to explain why profit margins stay strong even when demand goes down?
The 2024 Paving Top 50 moved in an unexpected direction this year. In our analysis of the data from 2022 and 2023, which saw a huge amount of growth — to the tune of approximately $170 million in pavingonly sales — from $742.2 million to $913.1 million. We predicted that, while the market would not likely see an increase of that magnitude, it would still see some increase due to broader market factors, such as overall customer demand, inflation, and materials. However, that does not appear to be the case.
For 2024, the Top 50 Paving Contractors generated $844.8 million in paving-only sales. This is a small contraction of $68.3 million, or, to put it another way, it shrank about 7.5% from the 2023 figure. While it isn’t a big enough decrease to signal some sort of alarm, it is interesting, and worth dissecting. Obviously, our data is dependent, year-to-year, on contractors who submit their financials. We aren’t necessarily seeing the same exact sample of information from one year to the next. However, if we take that into account, and presume generally similar conditions, the shrinkage still tells us a few things.
POSSIBLE EXPLANATIONS
Firstly, it reveals that last year’s number was possibly an even bigger aberration than we previously thought. A market
increase of nearly 23%, nearly a quarter of the market size in 2022 to 2023, does seem preposterously large now, in retrospect. The 2024 figure, in some ways, is less of a market contraction, and more of a market normalization or correction. If we compare 2022 to 2024, what we get is slightly more realistic increase of $102.6 million; still a whopping 14% market boom.
Secondly, and this might be our strongest possible theory about the market’s contraction, it might mean that 2024 was a year that saw far less NEW pavements laid, versus resurfacing. Something explored further below.
The third thing we might deduce from this data has to factor in the ongoing, and widely reported on, shortage of labor. How does that factor into sales? Hypothetically, it could mean that as
contractors continue to struggle fillingout their paving crews with skilled and reliable workers, it has slightly impacted the amount of work that can be sold and completed in a given season. While there are, perhaps, some contractors not struggling with labor needs, that is not the industry trend as a whole. Most employers are in need of more workers, and more workers means more paving jobs, and, thus, higher sales figures.
Compared to the other industry segments in the Top Contractor survey, paving-only sales was still by far the highest earning, followed by pavement repair services at $285,633,742 ($315,056,146 in 2023) and sealcoating work at $152,812,613 ($186,110,524 in 2023) and then by striping sales at $89,944,735 ($129,954,003 in 2023).
As you can see, at a glance, every
10 PAVEMENT MAINTENANCE & RECONSTRUCTION | June/July 2024 | www.ForConstructionPros.com/Pavemen t
area of sales has seen a similar deflation, with the most significant being striping segment. This might lend credence to the labor shortage theory, but we will discuss those segment in greater detail.
TOTAL SALES FOR THE PAVING TOP 50
The survey itself takes into account a much broader range of financial data than what we publicly report. We focus on the four main categories: paving, striping, pavement repair, and sealcoating. Some of that unpublished data does have an overall effect on this analysis as a whole, and in this case, the same trend from the paving-only figures runs parallel to the total sales, while still not being as steep a contraction. The Top 50 Paving contractors reported $1.614 billion in total sales, a small decline from 2023’s massive $1.723 billion. A loss of approximately $109 million, or almost EXACTLY the same percentage fall of paving-only sales, 7.3%.
Those contractors who’s primary business is in the realm of paving, while their revenue isn’t exclusively paving, seem to have shouldered the losses directly in those operations, except for about .2% coming from other areas of their business, perhaps. A much more detailed analysis would be required to find these exact areas of loss, but it’s clear that there may be a correlation.
The $1.614 billion from 2024 is still an overall increase from the 2022 total of $1.331 billion, but, interestingly, it’s still a significant leap from both the 2021 total of $1.336 billion (based on a Top 75), and is still an edge above, what was a previous high before 2023, the 2020 total of $1.611 billion (Top 75). This lends more support for our earlier theories about why the market shrank this year, that it was a correction. If we look at these totals, year-by-year, for the past six, this is what we see:
• 2019: $1.046 billion
• 2020: $1.611 billion
• 2021: $1.336 billion
• 2022: $1.331 billion
• 2023: $1.723 billion
• 2024: $1.614 billion
NEW VS OLD
While this is not determinant, our survey results do indicate a certain wavelike pattern of growth. Large increases followed by one or two years of lower but steady markets, followed by another large boost. Why might that be? In the absence of deeper economic statistics, it may signal that customer paving needs work along a cycle that mirrors that of typical asphalt-pavement lifespans, in conjunction with general new construction and community development. There are years, sometimes consecutive, that clients are seeking resurfacing work predominantly, and then there are years where the need for new pavements jumps. This would help explain why paving sales decreased, but profit margins and overall sales totals remained historically strong.
In order to better test this hypothesis, next year, we plan to expand our survey to include a few new stats. If we determine how many paving jobs were new construction versus resurfacing, we might start to understand the market trends better. Additionally, there are many paving contractors who also do their own site-prep, earthworks, and milling. We may, also, add survey questions in those areas to deepen our understanding of the market.
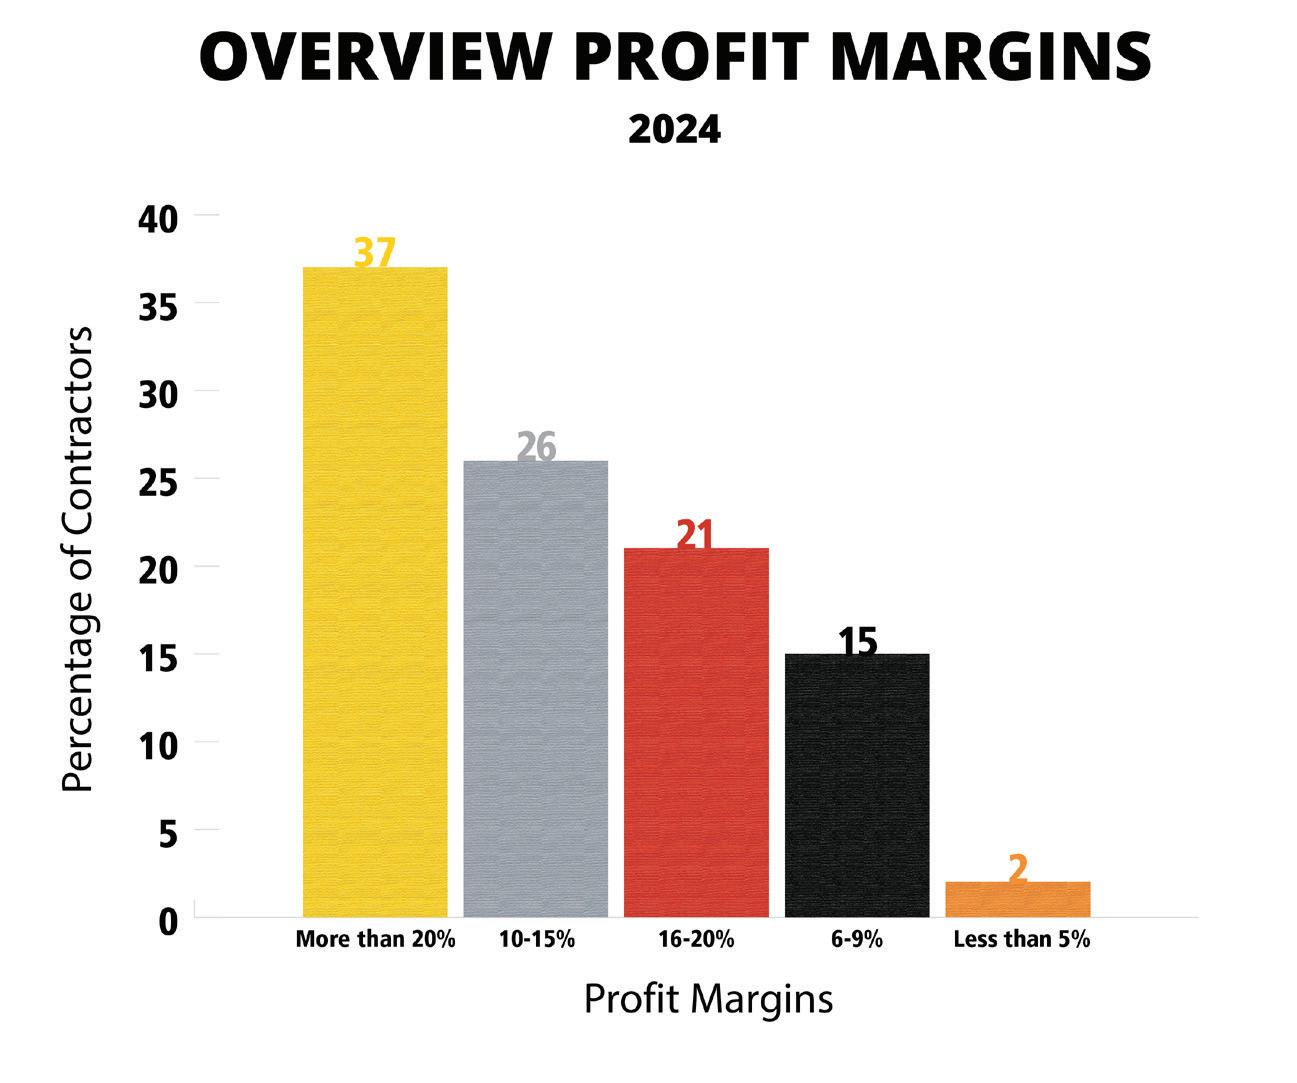
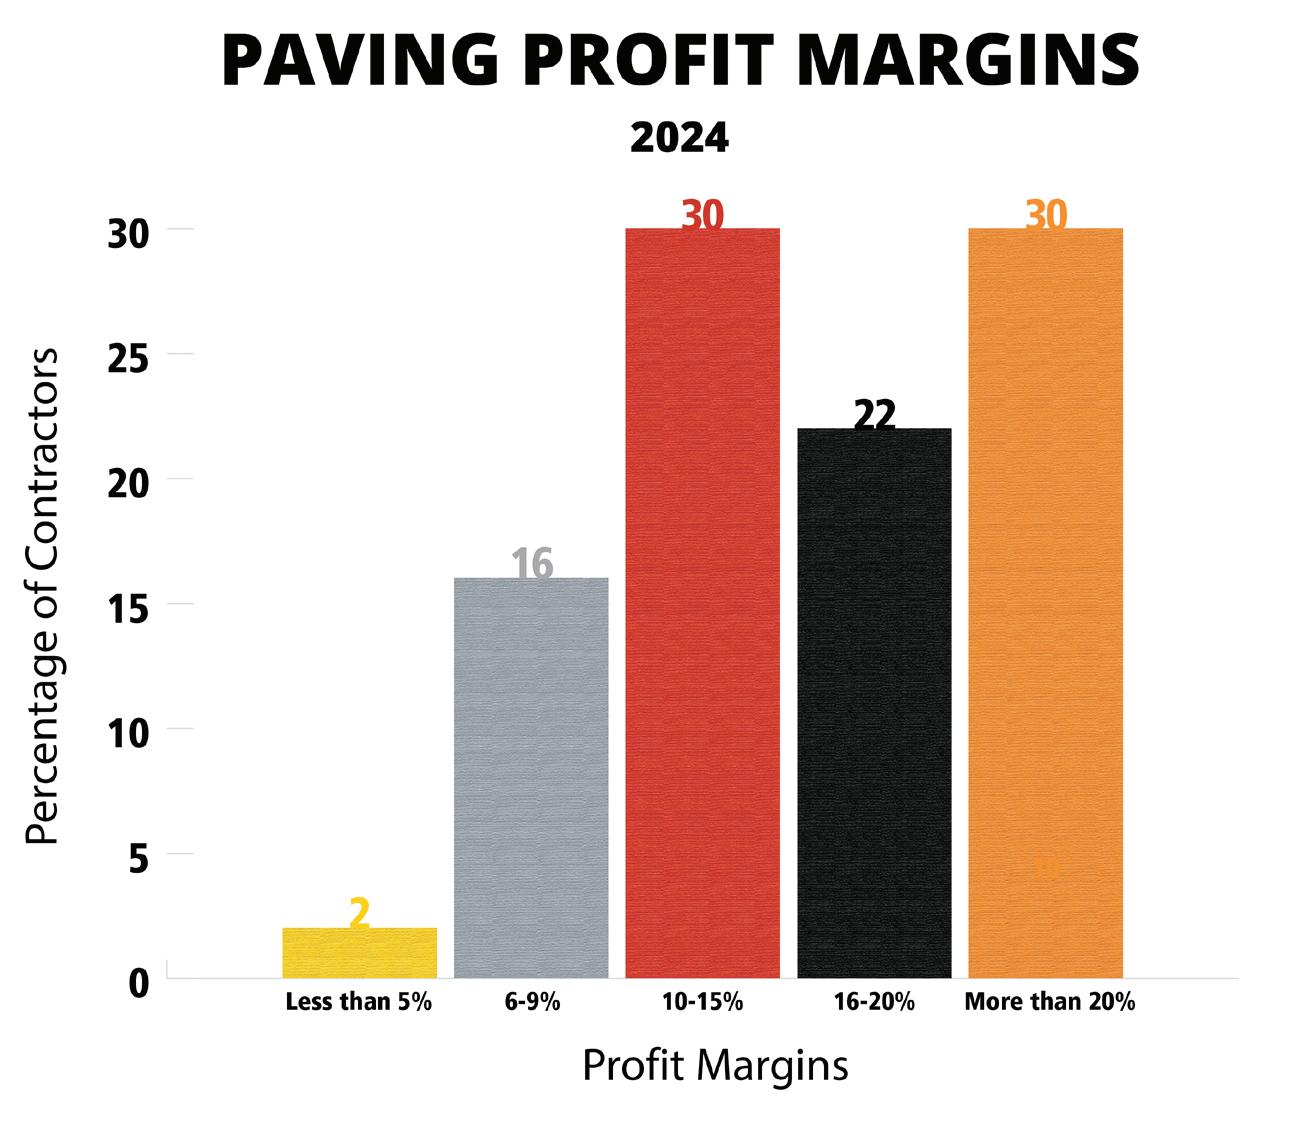
PROFIT MARGINS
As noted in the overview, we have shifted our profit margin ranges in an effort to normalize the distributions. Reviewing last year’s results, 52% (26 contractors) of the Paving Top 50 reported profit margins greater than 15%. That means more than half were in the highest distributed range, making for an extremely top heavy graph, whereas the bottom range was less than
3% margins, and represented only 4% (two companies) of top contractors. While this is informative on its own, telling us that those who rank in the Paving Top 50 are also those hitting the highest margins, it doesn’t really tell us much more than that. While it may take a few years with the new model to start interpreting the data in a really thoughtful way, the new distribution is interesting right off-the-bat.
Unsurprisingly, the top margin earners are still over-represented, but the distribution is a little more even. For 2024:
• Only 30% (15) of contractors ranked in the highest profit margin range of more than 20%
• 22% (11) ranked in the 16-20% range, which when added to those contractors ranking at +20%, is the same as last year, at 26
• Another 30% (15) contractors in the 10-15% range, which is the only range that remains from 2023, relatively stable compared to the 14 reported last year
• 16% (8) contractors in the 6-9% range
• Only 2% (1) contractor at 5% or less These results indicate the new ranges haven’t negatively impacted the results, only displayed them in better detail. If your paving profit margins are less than 10%, then you have less than a 18% chance of ranking in the Paving Top 50. That’s something worth considering when job costing and bidding on new work. Where are you currently sitting, and where are your goals?
TYPE OF JOBS
• While every contractor in the Paving 50 did at least some parking lot work, at an average of 72%, there was one outlier that only derived 4% of its work from parking lots
• That same outlier did the remainder of their work (96%) in paving driveways, throwing off that curve as well, where 31 of the Paving 50 averaged 13% from driveways
www.ForConstructionPros.com/Pavemen t | June/July 2024 | PAVEMENT MAINTENANCE & RECONSTRUCTION 11
PAVING 50
• Only eight contractors completed work on highways at an average of 15% of their total work composition
• 35 contractors did residential streets or roadwork at an average of 22% of their total work composition
CUSTOMER MIX
• While every contractor did work in the commercial/industrial space, our favorite outlier only clocked 1% of their work there, where the average was 54%
• 40 contractors completed work for cities or municipalities at an average of 16% of their work composition
• 45 did work for multi-family residences at an average of 29% of their work composition
• 29 contractors completed work for single-family residence at an average of 14% of work composition
• 44 of the Paving Top 50 did at least some work as a subcontractor, deriving an average of 26% of their work from it
FLEET REPLACEMENT
There were 36 contractors reporting it requires more than $2 million to replace their current fleet of machines; it appears that it is another metric that should be changed for next year’s survey. Eight companies reported it would require between $1 - $2 million, four between $500,000 - $1 million, and one apiece for the ranges between $250K$500K and less than $250K. ■
12 PAVEMENT MAINTENANCE & RECONSTRUCTION | June/July 2024 | www.ForConstructionPros.com/Pavemen t
Year in Business Sales Composition (%) Where We Work (%) Customer Mix (%) Paving Pavement Repair Sealcoating Striping Other Driveways Highways Parking Lots Streets/Roads Other Commercial Municipal Multi-family Single-family Other
For more information visit https://pavemg.com/ujjxh6 A&A Paving - Roselle, Illinois 64 60 25 10 5 0 5 0 85 10 0 60 5 35 0 0 Advanced Surface Engineering LLCYoungstown, Ohio 2 60 15 15 10 0 0 0 85 15 0 75 10 15 0 0 Aegis Asphalt Construction - Eugene, Oregon 15 56 3 23 12 6 30 10 40 10 10 70 15 10 5 0 All Out Services LLC dba All Out Parking LotsBroomall, Pennsylvania 13 64 23 3 1 9 1 0 81 10 8 69 20 10 1 0 Alpha Paving Industries - Round Rock, Texas 12 70 1 3 4 22 1 20 39 40 0 30 50 10 10 0 Anderson Striping & Construction, Inc.Kingsburg, California 37 25 5 29 39 1 1 0 89 2 8 68 21 10 0 1 ASAP Asphalt Sealing And Paving Co.Meadow Lands, Pennsylvania 19 41 34 13 6 6 6 0 84 10 0 74 8 12 5 1 Asphalt Solutions Inc. - Youngstown, Ohio 24 60 5 20 15 0 0 0 100 0 0 90 0 10 0 0 Associated Paving Contractors, Inc. - Warminster, Pennsylvania 52 30 10 5 5 0 5 0 95 0 0 50 40 5 5 0 Atlantic Southern Paving & SealcoatingSunrise, Florida 31 45 15 15 5 18 3 2 60 35 0 40 15 15 3 27 Bear Owen Paving Company, Inc. - Peckville, Pennsylvania 55 100 0 0 0 0 96 0 4 0 0 1 0 0 99 0 BelRock Asphalt Paving Inc - Belvidere, Illinois 21 70 10 10 0 10 20 0 80 0 0 70 5 15 5 5 Blackjack Paving - Fairburn, Georgia 16 70 20 7.5 2.5 0 2.5 0 95 2.5 0 62 2.5 33 2.5 0 Brahney Paving / FixAsphalt.com - Wall Twp, N.J. 23 35 42 15 4 4 1 0 99 0 0 89 0 10 1 0 BSI Paving - Oxford, Michigan 20 58 1 3 2 36 5 0 34 19 42 36 9 16 3 36 C & R Asphalt LLC. - Lexington, Kentucky 30 78 1 12 3 6 4 0 91 5 0 82 0 11 3 4


14 PAVEMENT MAINTENANCE & RECONSTRUCTION | June/July 2024 | www.ForConstructionPros.com/Pavemen t PAVING
Year in Business Sales Composition (%) Where We Work (%) Customer Mix (%) Paving Pavement Repair Sealcoating Striping Other Driveways Highways Parking Lots Streets/Roads Other Commercial Municipal Multi-family Single-family Other CALVAC INCORPORATED - San Jose, California 50 23.7 23.7 16.7 10 0 15 5 50 30 0 40 5 40 15 0 Central Paving, LLC - Ellensburg, Washington 10 50 20 20 10 0 20 0 30 50 0 20 50 10 20 0 Crown Paving, LLC - Greenbrier, Tennessee 8 19.5 60.5 3.5 2.7 2.3 0 11 74 15 0 41 47 12 0 0 DACS Asphalt & Concrete - Denver, Colorado 10 45 16 5 4 30 0 0 90 10 0 40 0 60 0 0 Daniel B. Krieg, Inc. - Harrisburg, Pennsylvania 91 33 0 9 1 43 0 56 27 8 9 80 20 0 0 0 Dominion Paving & Sealing - Purcellville, Virginia 42 60 11 9 5 15 0 0 50 50 0 29 1 67 3 0 Eosso Brothers Paving - Farmingdale, N.J. 31 75 5 15 5 0 5 0 20 75 0 25 5 70 0 0 Erickson Asphalt Services Inc - Princeton, Minnesota 34 70 15 12 0.2 0 20 0 60 20 0 50 1 20 29 0 Finley Asphalt & Concrete - Bristow, Virginia 59 41 44 3 2 10 0 0 75 20 5 15 45 40 0 0 G & M New England, LLC - Sherborn, Massachusetts 23 15 50 30 5 0 25 0 75 0 0 50 0 25 25 0 Gann Asphalt & Concrete Inc. - Riverside, Missouri 30 45 15 30 10 0 0 0 95 0 5 50 10 40 0 0 Johnson and Sons Paving - Menomonee Falls, Wisconsin 10 75 10 10 5 0 6 0 70 24 0 60 5 25 10 0 KNL INDUSTRIES - Canby, Oregon 40 78 13 8 1 0 15 10 50 25 0 20 38 30 12 0 Laurel Asphalt LLC - Windber, Pennsylvania 29 75 2 10 11 2 45 0 47 8 0 47 8 0 45 0 M&D Blacktop Co. - Grove City, Ohio 60 75 10 10 5 0 5 0 85 0 10 75 15 5 5 0 M&M Asphalt Maintenance Inc. dba All County Paving - Delray Beach, Florida 36 60 10 20 10 0 0 5 34 61 0 34 36 30 0 0 Maul Paving - Plainfield, Illinois 23 50 30 15 5 0 0 0 100 0 0 80 5 15 0 0 O’Leary Asphalt Inc. - Ijamsville, Maryland 39 48 14 4 1 33 1 0 80 16 3 19 20 60 1 0 Paramount Asphalt & Sealcoating CorporationNaples, Florida 9 55 5 20 20 0 0 0 50 50 0 60 10 30 0 0 Pavement Solutions, LLC - Richmond, Illinois 22 46 29 9 15 1 16 0 84 0 0 84 0 0 16 0 PLM Paving and Concrete - Pewaukee, Wisconsin 9 64 3.7 8.2 2.3 21.8 4 0 92 4 0 85 5 6 4 0 Prestige Paving Company - La Mirada, California 10 50 25 20 5 0 0 0 75 15 10 60 30 2 5 3 Pro-Pave Incorporated - Sterling, Virginia 24 70 25 4 1 0 0 0 75 23 2 40 15 40 0 5 Rabine - Schaumburg, Illinois 43 60 15 2 3 20 0 0 90 10 0 99 0 1 0 0 Ruston Paving Co., Inc. - Durham, N.C. 81 68 30 0 0 2 0 0 100 0 0 75 10 15 0 0
50
PAVING 50
E-CLUTCH™ REDUCES PUMP MAINTENANCE


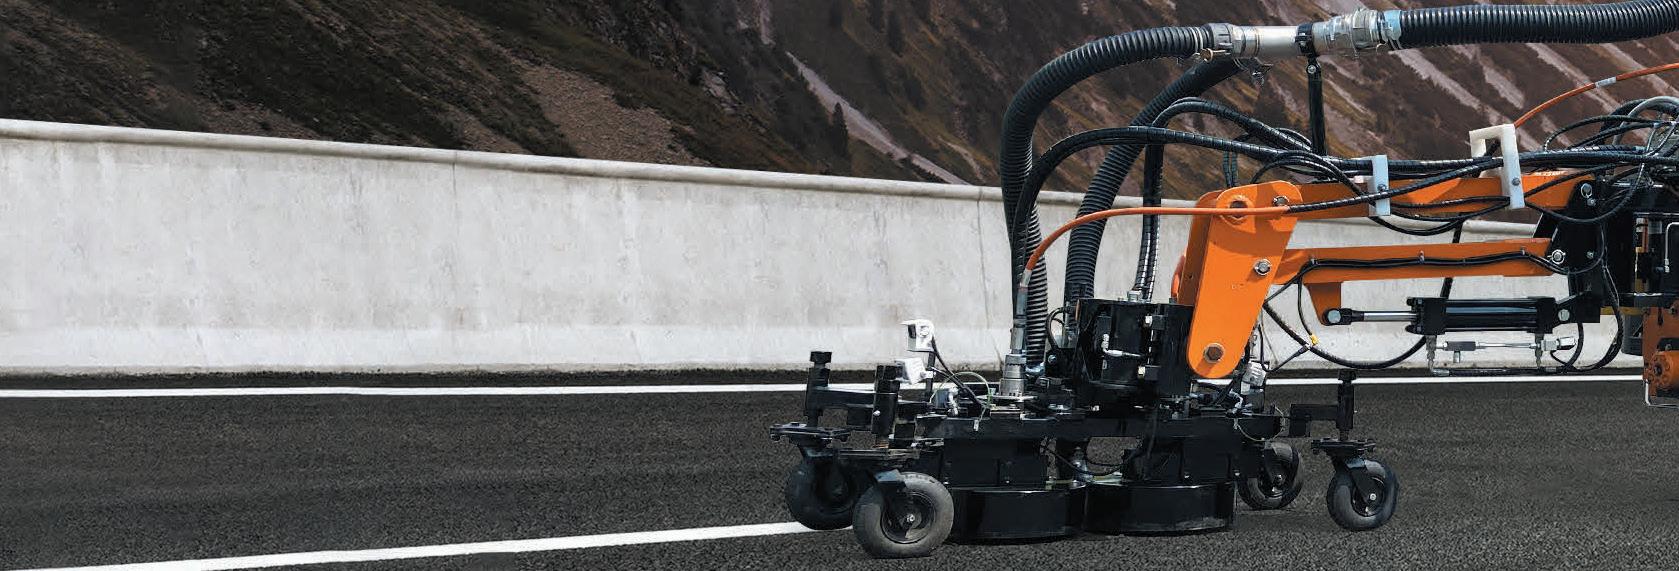
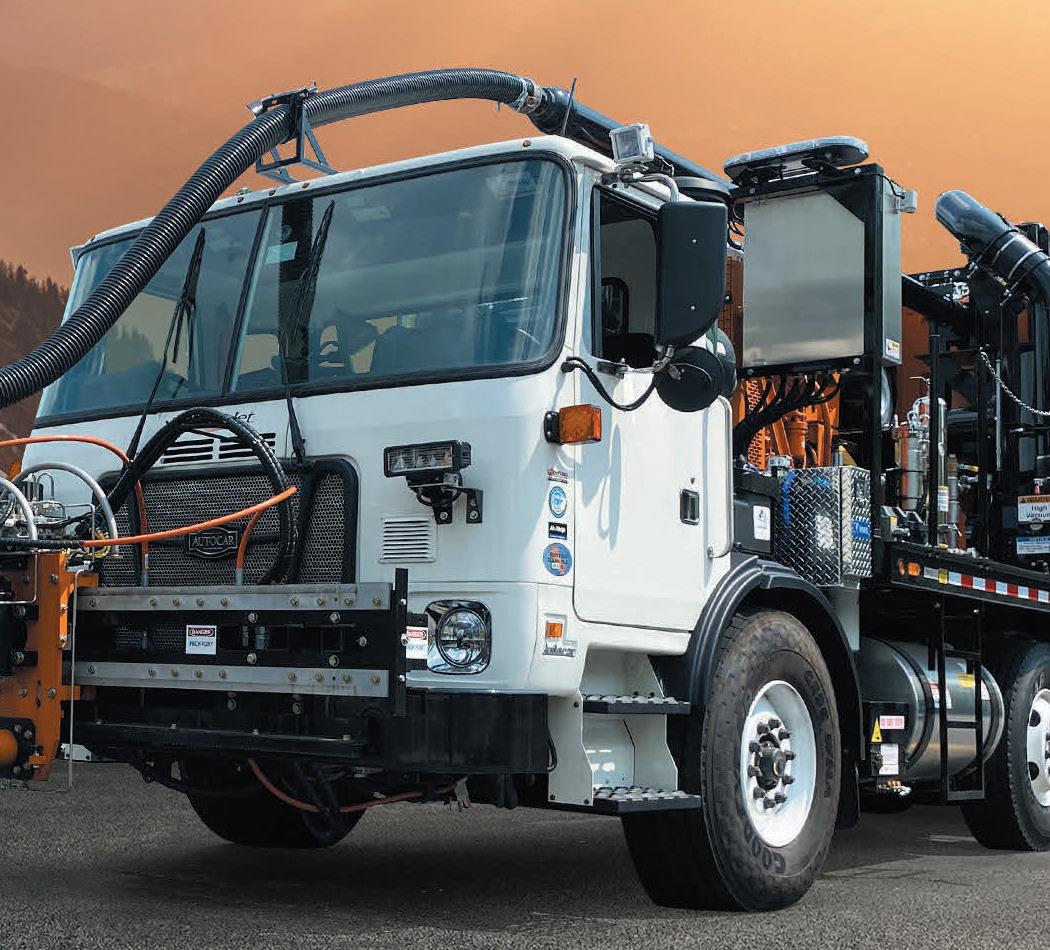

New pump technology makes marking removal with the StarJet® SRV-7 more efficient than ever — on detail work as well as centerlines.
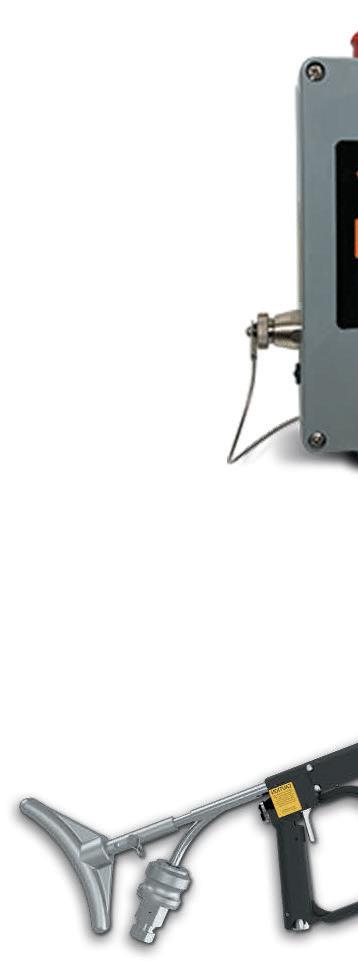
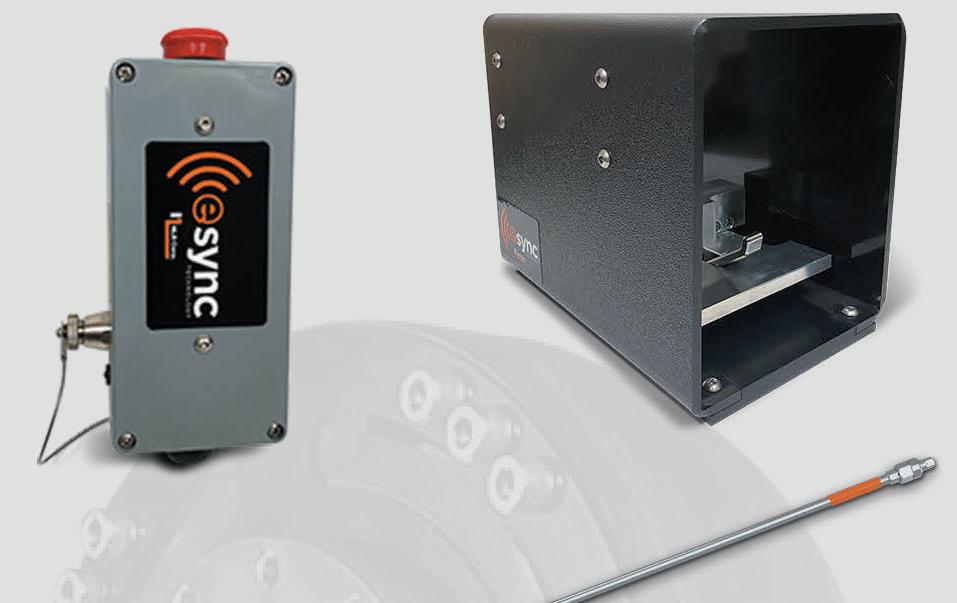
NLB’s patented E-Clutch™ eliminates the maintenance-heavy PTO and a lot of valves, hoses, and wiring. That means more time on the road and lower operating costs. And the E-Clutch is wirelessly integrated with Esync™ tools, improving safety by enabling a lance operator to shut off the pump remotely. There’s no dump valve, and no excess water to clean up.
These latest innovations demonstrate again why NLB is the leader in water jet marking removal. See them, and the SRV-7 demo, at www.nlbcorp.com/starjet


16 PAVEMENT MAINTENANCE & RECONSTRUCTION | June/July 2024 | www.ForConstructionPros.com/Pavemen t Year in Business Sales Composition (%) Where We Work (%) Customer Mix (%) Paving Pavement Repair Sealcoating Striping Other Driveways Highways Parking Lots Streets/Roads Other Commercial Municipal Multi-family Single-family Other
SEAL-O-MATIC PAVEMENT SOLUTIONS INC. dba PAVEMENT SOLUTIONS - Olathe, Kansas 12 15 68 17 0 0 1 0 49 50 0 95 1 4 0 0 Sipes Asphalt & Concrete - Indianapolis, Indiana 11 20.3 14.2 6 1.2 58.3 0 0 100 0 0 70 0 30 0 0 Stasi Brothers Asphalt Corp. - Westbury, N.Y. 63 25 5 2 1 67 1 0 20 5 74 50 5 15 10 20 Synergy Pavement Group - South Beloit, Illinois 25 55 10 8 5 22 40 0 60 0 0 60 0 0 40 0 The Pavement Group - Wexford, Pennsylvania 6 54 7 8 6 25 0 0 100 0 0 98 0 2 0 0 The Surface Masters, Inc. - Marietta, Georgia 14 79 4 8 3 6 0 0 93 6 1 71 17 11 0 1 U.S. Pavement Services LLC - Woburn, Massachusetts 39 65 6 8 4 17 5 0 85 10 0 78 10 10 2 0 United Paving Co. - Corona, California 24 25 45 20 5 4 5 0 75 20 0 70 5 15 5 5 US PAVER - Arnold, Maryland 21 52.5 14 20 13.5 0 0 0 100 0 0 85 5 10 0 0
Pendant
Lance Hand Foot Box
NLBCORP.COM | (800) 441-5059 © Copyright 2024 NLB Corp. | PSaleSTR_24_008_v1
AND SAVES WATER.

Small Size, BIG Impact
Dynapac’s CC900G/CC950, are modern small tandem rollers designed for small-scale compaction work such as patching, bicycle paths, parking lots, driveways, etc. These machines are equipped with reliable Honda gas or Kubota diesel engines and the largest drum diameter in the class (23 inches). The drive motors connected in series, together with the large drum diameter provide excellent gradeability and productivity.
Go the extra mile with a pressurized water system and spring loaded scrapers


Simple and easy operating controls
Service components are easily accessible
Reliable Honda gas (900G) or Kubota diesel (950) engine
Maintenance free heavy duty articulation hitch
Long lasting drum with the thickest drum shell in its class. (0.4 in)


Highest rated operator comfort with insulated front and rear drums


Foldable ROPS for easy transport and working under low height jobs
Longer paving time between refills with large capacity water tank (50 gal)
Pave against walls with high curb clearance (18 in)
Better quality mat with the largest drum diameter in its class (23 in).


Your Partner on the Road Ahead dynapac.us | 800-651-0033 Follow Dynapac North America Now available
industry-leading finance options $
with
SEALCOATING 50
By Brandon Noel, Editor
Top 50 Sealcoat Contractors 2024: A Bit Of An Enigma
Over the past 10 years, sealcoating has seen a steady decline in gross total sales, and that trend continued this year. There may be outside factors influencing this trend, but the profit margins of those contractors still doing the work are strong.
When looking at the numbers by themselves, the sealcoating-only segment is a bit harder to parse out than the paving-only market. For 2024, the sealcoat-only sales total topped off at $152.8 million. That’s a dip in sales from last year by $33.3 million (or about 18%) from 2023’s total of $186.1 million. However, the apparent contraction takes the figure almost exactly back down to the 2022 total of $150 million, especially when you account for inflation. It erases the growth documented between last year and the year before, but there’s a larger trend in the sealcoating-only sales that is somewhat troubling. Take a look at the previous decade of recorded data:
• 2015: $249 million (Top 75)
• 2016: $201 million (Top 75)
• 2017: $112 million
• 2018: $171 million (Top 75)
• 2019: $137 million
• 2020: $161 million
• 2021: $108 million (Top 75) [pandemic]
• 2022: $150 million
Sponsored by
• 2023: $186 million
• 2024: $152 million
Looking back at the figures for the past 10 years, ever since the 2015 ($249 million) and 2016 ($201 million) sealcoat-only sales totals hit these historic highs, they have been steadily decreasing. And it’s been doing so at an overall average rate of decline of roughly 22% per year. Unfortunately, the 10-year trend is contraction. Last year, we wondered if we’d hit a ceiling of growth, on our way back up to the pre-pandemic numbers, but what might have looked like a ceiling of growth might actually be the floor.
While there are dozens of possible reasons and contributing factors as
to why this is the case, one external factor could point to a lion’s share of the cause. The U.S. House of Representatives introduced H.R. 2576, the TSCA Modernization Act on June 23, 2015. The Energy and Commerce Committee swiftly acted on the bill, and the legislation was passed by a near unanimous vote that very day. A final version of the legislation wouldn’t be signed into law for another year, but the writing was likely on the wall. This legislation impacted the rules restricting the EPA’s power to regulate the chemical industry, and for sealcoating, it directly impacted the rules and regulations surrounding the use and production of coal tar sealer, and other
18 PAVEMENT MAINTENANCE & RECONSTRUCTION | June/July 2024 | www.ForConstructionPros.com/Pavemen t


The climb toward greatness never ends, but the view gets better. Your dedication inspires us to always keep improving, because our job isn’t over until yours is. Here’s to another great year from Crafco - your partner in sealcoating excellence. CONSTANT IMPROVEMENT HARD WORK EXCELLENCE + = Congratulations to the 2024 Sealcoating Top Contractors. crafco.com/sealcoating Connect with us
SEALCOATING 50
sealants that possess PAHs in excess of .1%. The new law didn’t constitute a nationwide ban, but has made it easier for states and local governments to pass restrictive measures.
It’s important to note that this isn’t causality, but a strong indication of a correlated effect. There certainly appears to be a connection to the time in which these legal changes went into place, and the slow decline of the sealcoat-only sales figures. However, there are many viable alternatives to coal tar sealers used in parts of the country that have outright bans in place, so it may be the case that their services are less in demand or that fewer contractors are offering it. Without much more detailed and larger data it’s difficult to answer these questions for certain.
TOTAL SALES FOR THE SEALCOATING TOP 50
Total sales for all the work completed by the 2023 Top 50 Sealcoating contractors was $1.44 billion compared to the $1.59 billion in total sales in 2023, a much steeper drop of $141.8 million (or a 9% drop) compared to the relatively small drop the year before of $11 million (or 0.7%). But of our Top 50 Sealcoating contractors, what is the mix of work they are doing? Is it predominantly sealcoating or other work?
The sealcoat sales made up only 11% of the total sales, which is half of what it was last year (22%) and continues its similar downward trend, as well. Even the companies completing the most sealcoating work are not getting anything near the majority of their sales from it, making it a smaller piece of their business puzzle.
While no company in the Top 50 completed sealcoat work exclusively, there were two outliers who did more than 90% of their sales in sealcoating, indicating it’s the primary or sole area of services they likely provide.
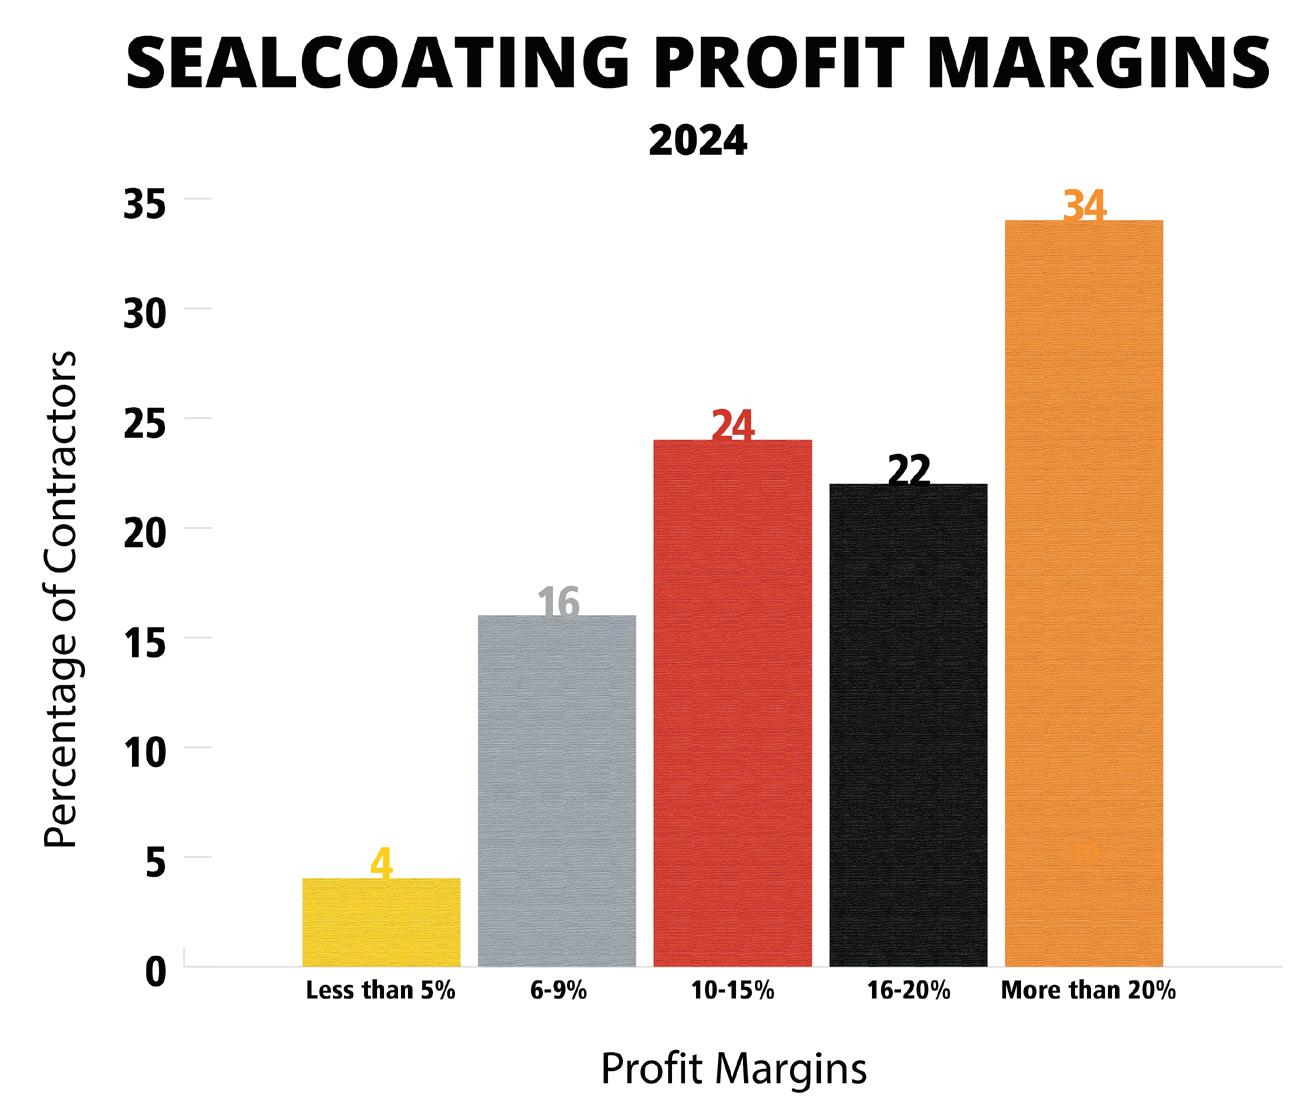
PROFIT MARGINS
An interesting parallel between the Sealcoating and Paving Top 50 is how the profit margin distribution mirrored the previous year, despite changing the reported ranges. While the highest grouping of contractors did fall into the greater than 20% profit margin range at 17 companies, added together with those in the 16-20% profit margin range, it is the same figure from 2023’s top profit group, “greater than 15%,” standing at 28 total companies.
Twelve contractors reported 10-15% margins, up from 11 the year prior. The same amount reported in the lowest range of profits, at two contractors, and this year eight companies reported falling into the newly establish range of 6-9% profit margins. Trying to gleam some understanding from these margins in conjunction with the trends in total and sealcoat-only sales, it appears that while the gross sales amounts appear to be in decline, those completing the work are still making a fair bit of profit from the sector. In fact, the margins could be seen as slightly increasing. One potential explanation for this might be less competition, with steady or minimally growing demand.
WHERE THEY WORK
While it isn’t any surprise that the vast majority of the work mix was in parking lots, there were a total of six contractors in the Top 50 Sealcoating that exclusively performed all their jobs in parking lots.
• 58% of contractors completed work on residential driveways at an average amount of 9% of total work composition
• 14% of the companies did sealcoating on highways at an average rate of 17% of total work composition
• 100% completed parking lot sealcoating at an average rate of 74% of total work composition
• 72% of contractors performed work on residential streets and roads at an average rate of 22% of total work composition
WHO DID THEY WORK FOR
This year municipal work did see a small rise in the clientele mix, but, without a doubt, the commercial and industrial customers dominate the demand for this service.
• 100% of contractors worked for industrial/commercial clients at an average 62% of sales composition
• 80% of the Top 50 worked for municipal customers at an average 14% of sales composition
• 94% worked for multi-family homes/apartment/housing associations at an average rate of 22% of sales
• 52% worked for single-family residential clients at an average rate of 10% of sales
• 92% of the Sealcoating Top 50 completed some work as a subcontractor for someone else at an average rate of 27% of their gross total sales
FLEET REPLACEMENT
The number of contractors reporting it would require more than $2 million to replace their total fleet increased by one from last year to 30 companies.
• 12 companies reported it would require between $1 - $2 million for replacement, the same as 2023
• Two reported between $500,00$1 million would be needed, more than the zero last year
• Five reported needing less than $500,000 in all, a drop from last year’s 9 ■
For more information visit https://pavemg.com/gdxf5q
20 PAVEMENT MAINTENANCE & RECONSTRUCTION | June/July 2024 | www.ForConstructionPros.com/Pavemen t
www.ForConstructionPros.com/Pavemen t | June/July 2024 | PAVEMENT MAINTENANCE & RECONSTRUCTION 21 Sponsored by Year in Business Sales Composition (%) Where We Work (%) Customer Mix (%) Paving Pavement Repair Sealcoating Striping Other Driveways Highways Parking Lots Streets/Roads Other Commercial Municipal Multi-family Single-family Other A&A Paving - Roselle, Illinois 64 60 25 10 5 0 5 0 85 10 0 60 5 35 0 0 Advanced Surface Engineering LLC - Youngstown, Ohio 2 60 15 15 10 0 0 0 85 15 0 75 10 15 0 0 Aegis Asphalt Construction - Eugene, Oregon 15 56 3 23 12 6 30 10 40 10 10 70 15 10 5 0 Affordable Striping & Sealing, LLC - Las Vegas, Nevada 17 0 0 45 55 0 5 0 65 30 0 45 5 25 25 0 Alpha Paving Industries - Round Rock, Texas 12 70 1 3 4 22 1 20 39 40 0 30 50 10 10 0 Anderson Striping & Construction, Inc.Kingsburg, California 37 25 5 29 39 1 1 0 89 2 8 68 21 10 0 1 Asphalt Authority - Fort Wayne, Indiana 3 0 0 90 10 0 15 0 85 0 0 75 0 15 10 0 Asphalt Sealers, Inc. - Venice, Florida 10 0 5 95 0 0 0 0 70 30 0 70 0 30 0 0 Asphalt Solutions Inc. - Youngstown, Ohio 24 60 5 20 15 0 0 0 100 0 0 90 0 10 0 0 Atlantic Southern Paving & SealcoatingSunrise, Florida 31 45 15 15 5 18 3 2 60 35 0 40 15 15 3 27 B&G Sealcoating LLC - Endicott, N.Y. 14 0 5 70 25 0 20 0 80 0 0 50 30 0 20 0 BelRock Asphalt Paving Inc - Belvidere, Illinois 21 70 10 10 0 10 20 0 80 0 0 70 5 15 5 5 Blackjack Paving - Fairburn, Georgia 16 70 20 7.5 2.5 0 2.5 0 95 2.5 0 62 2.5 33 2.5 0 Brahney Paving / FixAsphalt.com - Wall Twp, N.J. 23 35 42 15 4 4 1 0 99 0 0 89 0 10 1 0 C & R Asphalt LLC. - Lexington, Kentucky 30 78 1 12 3 6 4 0 91 5 0 82 0 11 3 4 CALVAC INCORPORATED - San Jose, California 50 23.7 23.7 16.7 10 0 15 5 50 30 0 40 5 40 15 0 Central Paving, LLC - Ellensburg, Washington 10 50 20 20 10 0 20 0 30 50 0 20 50 10 20 0 Crown Paving, LLC - Greenbrier, Tennessee 8 19.5 60.5 3.5 2.7 2.3 0 11 74 15 0 41 47 12 0 0 DACS Asphalt & Concrete - Denver, Colorado 10 45 16 5 4 30 0 0 90 10 0 40 0 60 0 0 Daniel B. Krieg, Inc. - Harrisburg, Pennsylvania 91 33 0 9 1 43 0 56 27 8 9 80 20 0 0 0 Dominion Paving & Sealing - Purcellville, Virginia 42 60 11 9 5 15 0 0 50 50 0 29 1 67 3 0 Eosso Brothers Paving - Farmingdale, N.J. 31 75 5 15 5 0 5 0 20 75 0 25 5 70 0 0 Erickson Asphalt Services Inc - Princeton, Minnesota 34 70 15 12 0.2 0 20 0 60 20 0 50 1 20 29 0
SEALCOATING 50

Sponsored by
22 PAVEMENT MAINTENANCE & RECONSTRUCTION | June/July 2024 | www.ForConstructionPros.com/Pavemen t
Year in Business Sales Composition (%) Where We Work (%) Customer Mix (%) Paving Pavement Repair Sealcoating Striping Other Driveways Highways Parking Lots Streets/Roads Other Commercial Municipal Multi-family Single-family Other
Finley Asphalt & Concrete - Bristow, Virginia 59 41 44 3 2 10 0 0 75 20 5 15 45 40 0 0 G & M New England, LLC - Sherborn, Massachusetts 23 15 50 30 5 0 25 0 75 0 0 50 0 25 25 0 Gann Asphalt & Concrete Inc. - Riverside, Missouri 30 45 15 30 10 0 0 0 95 0 5 50 10 40 0 0 G-FORCE Parking Lot Striping - Amherst, N.H. 6 0 0 15 85 0 0 0 97 3 0 90 5 5 0 0 Johnson and Sons Paving - Menomonee Falls, Wisconsin 10 75 10 10 5 0 6 0 70 24 0 60 5 25 10 0 KNL INDUSTRIES - Canby, Oregon 40 78 13 8 1 0 15 10 50 25 0 20 38 30 12 0 M&D Blacktop Co. - Grove City, Ohio 60 75 10 10 5 0 5 0 85 0 10 75 15 5 5 0 M&M Asphalt Maintenance Inc. dba All County Paving - Delray Beach, Florida 36 60 10 20 10 0 0 5 34 61 0 34 36 30 0 0 Maul Paving - Plainfield, Illinois 23 50 30 15 5 0 0 0 100 0 0 80 5 15 0 0 O’Leary Asphalt Inc. - Ijamsville, Maryland 39 48 14 4 1 33 1 0 80 16 3 19 20 60 1 0 Paramount Asphalt & Sealcoating CorporationNaples, Florida 9 55 5 20 20 0 0 0 50 50 0 60 10 30 0 0 Pavement Solutions, LLC - Richmond, Illinois 22 46 29 9 15 1 16 0 84 0 0 84 0 0 16 0 PLM Paving and Concrete - Pewaukee, Wisconsin 9 64 3.7 8.2 2.3 21.8 4 0 92 4 0 85 5 6 4 0 Prestige Paving Company - La Mirada, California 10 50 25 20 5 0 0 0 75 15 10 60 30 2 5 3 Pro-Pave Incorporated - Sterling, Virginia 24 70 25 4 1 0 0 0 75 23 2 40 15 40 0 5 Rabine - Schaumburg, Illinois 43 60 15 2 3 20 0 0 90 10 0 99 0 1 0 0 Richland Sealcoating Co, Inc - Mansfield, Ohio 51 0 2 90 8 0 4 0 95 1 0 75 5 15 5 0 SEAL-O-MATIC PAVEMENT SOLUTIONS INC. dba PAVEMENT SOLUTIONS - Olathe, Kansas 12 15 68 17 0 0 1 0 49 50 0 95 1 4 0 0 Sipes Asphalt & Concrete - Indianapolis, Indiana 11 20.3 14.2 6 1.2 58.3 0 0 100 0 0 70 0 30 0 0 Stasi Brothers Asphalt Corp. - Westbury, N.Y. 63 25 5 2 1 67 1 0 20 5 74 50 5 15 10 20 T&N Asphalt Services, Inc. - Salt Lake City, Utah 27 2 22 30 46 0 1 0 90 5 4 94 1 5 0 0 The Pavement Group - Wexford, Pennsylvania 6 54 7 8 6 25 0 0 100 0 0 98 0 2 0 0
PAVEMENT PROFIT CENTER
www.ForConstructionPros.com/Pavemen t | June/July 2024 | PAVEMENT MAINTENANCE & RECONSTRUCTION 23 Year in Business Sales Composition (%) Where We Work (%) Customer Mix (%) Paving Pavement Repair Sealcoating Striping Other Driveways Highways Parking Lots Streets/Roads Other Commercial Municipal Multi-family Single-family Other
The Surface Masters, Inc. - Marietta, Georgia 14 79 4 8 3 6 0 0 93 6 1 71 17 11 0 1 U.S. Asphalt Maintenance, LLC - Midlothian, Virginia 40 0 0 90 10 0 0 0 100 0 0 80 0 20 0 0 U.S. Pavement Services LLC - Woburn, Massachusetts 39 65 6 8 4 17 5 0 85 10 0 78 10 10 2 0 United Paving Co. - Corona, California 24 25 45 20 5 4 5 0 75 20 0 70 5 15 5 5 US PAVER - Arnold, Maryland 21 52.5 14 20 13.5 0 0 0 100 0 0 85 5 10 0 0

24 PAVEMENT MAINTENANCE & RECONSTRUCTION | June/July 2024 | www.ForConstructionPros.com/Pavemen t PAVEMENT PROFIT CENTER


www.ForConstructionPros.com/Pavemen t | June/July 2024 | PAVEMENT MAINTENANCE & RECONSTRUCTION 25 800.543.7077 | neyra.com customerservice@neyra.com PAVEMENT SEALERS | ADDITIVES & PRIMERS | CRACK SEALANTS & PATCHING SPORTS SURFACING | MARKING PAINT | TOOLS, SUPPLIES & EQUIPMENT Family-owned and operated since 1975. Trust our industry experts to help you grow your business and optimize your time and efforts. “CUSTOMER FIRST” FOCUS INDUSTRY LEADING INNOVATION EXCEPTIONAL CUSTOMER SERVICE PREMIUM PRODUCT QUALITY Quality you need. Service you deserve. Contact Tadashi Soma Print and Digital Advertising | 920-542-1267 | tsoma@ACBusinessMedia.com
By Brandon Noel, Editor
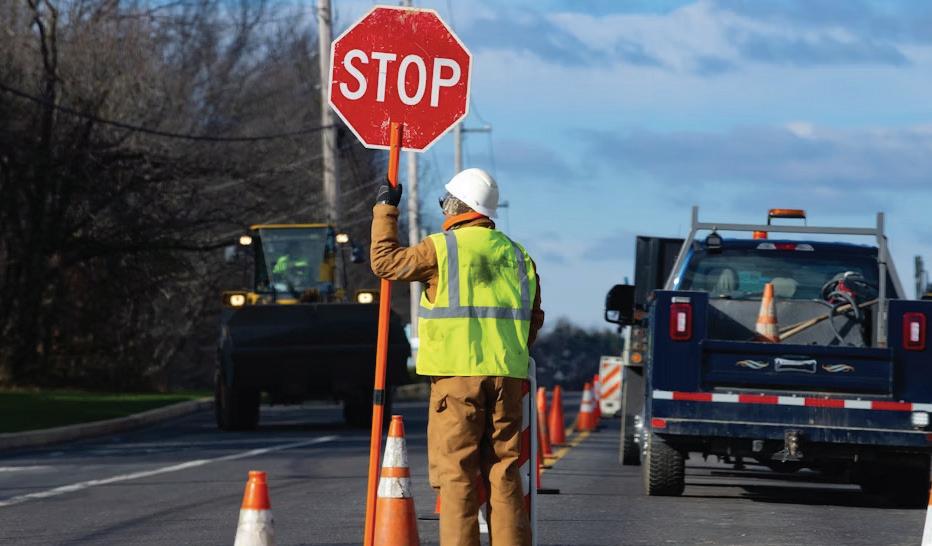
Top 50 Striping Contractors 2024: Line Goes Down? STRIPING 50
On the whole, an outsider might assess the striping sector as one that has also trended down over the last couple years, but that isn’t the case when you analyze things in closer detail. Striping is strong and profitable.
The striping-only sales segment totaled a fairly surprising $89.9 million. We wish that it was a more positive surprise, but this year marks the lowest reported amount for this sector going back the past 10 years, and a drop of $40 million from just last year. At a glance, it might appear that the sector is in an overall downward trend, but that’s not really the whole story. Between the years 2015-2018, things remained relatively stable, and, in fact, seemed to be growing at a solid 8.95% rate, but that was the last span of what might be deemed stable numbers.
From 2018 to 2019 things spiked in a tremendous way, and stayed pretty close to that in the following year, 2020. However, the pandemic lockdowns definitely had some level of impact, cutting the striping-only sales in half. Not taking into account 2022, where we received some data that was later unable to be fully verified, 2023 appeared to show the striping segment rebounding. While this year’s contraction is disappointing, there’s a faint positive hiding in the numbers. The overall, average rate of change by year, over 10
years, is still +$2.9 million. That’s not a growth rate that blows anyone away, but it’s still a positive level of growth. We’d definitely like to see that continue to improve in the coming seasons.
A REVIEW OF THE PAST DECADE:
• 2015: $112 million
• 2016: $133 million
• 2017: $139 million
• 2018: $144 million
• 2019: $215 million
• 2020: $204 million
• 2021: $100 million*
• 2022: $534 million**
• 2023: $130 million
• 2024: $90 million
*Pandemic shutdowns
**Invalidated/unverifiable data
TOTAL SALES FOR THE STRIPING TOP 50
The total gross sales for all work done by the 2024 Top 50 Striping contractors came at $1.435 billion, which is also a slight contraction when compared to last year’s reported total of $1.583 billion. That’s a negative change of about $148 million missing from the Top 50 Striping contractors. Once again, there’s some silver lining to these numbers, due to the now invalidated data messing with the 2022 figures. Because of that we will ignore 2022, and thus what we see is actually pretty promising for those contractors who’s main source of revenue is striping.
In 2021, the total gross sales for the Striping Top 50 was $890 million, which means that the average rate of
26 PAVEMENT MAINTENANCE & RECONSTRUCTION | June/July 2024 | www.ForConstructionPros.com/Pavemen t
change in total sales for the Striping Top 50 since 2021 is about 23% and that’s really excellent. For the contractors who do a heavy amount of striping, the business model seems to be doing really well.
Only five contractors in the Top 50 did received more than 75% of their gross sales from striping, but one of those five exclusively did nothing but striping. Everyone, besides that one outlier, did a mix of everything, with one other contractor hitting 90% and the remaining 10% completed in sealcoating.
PROFIT MARGINS
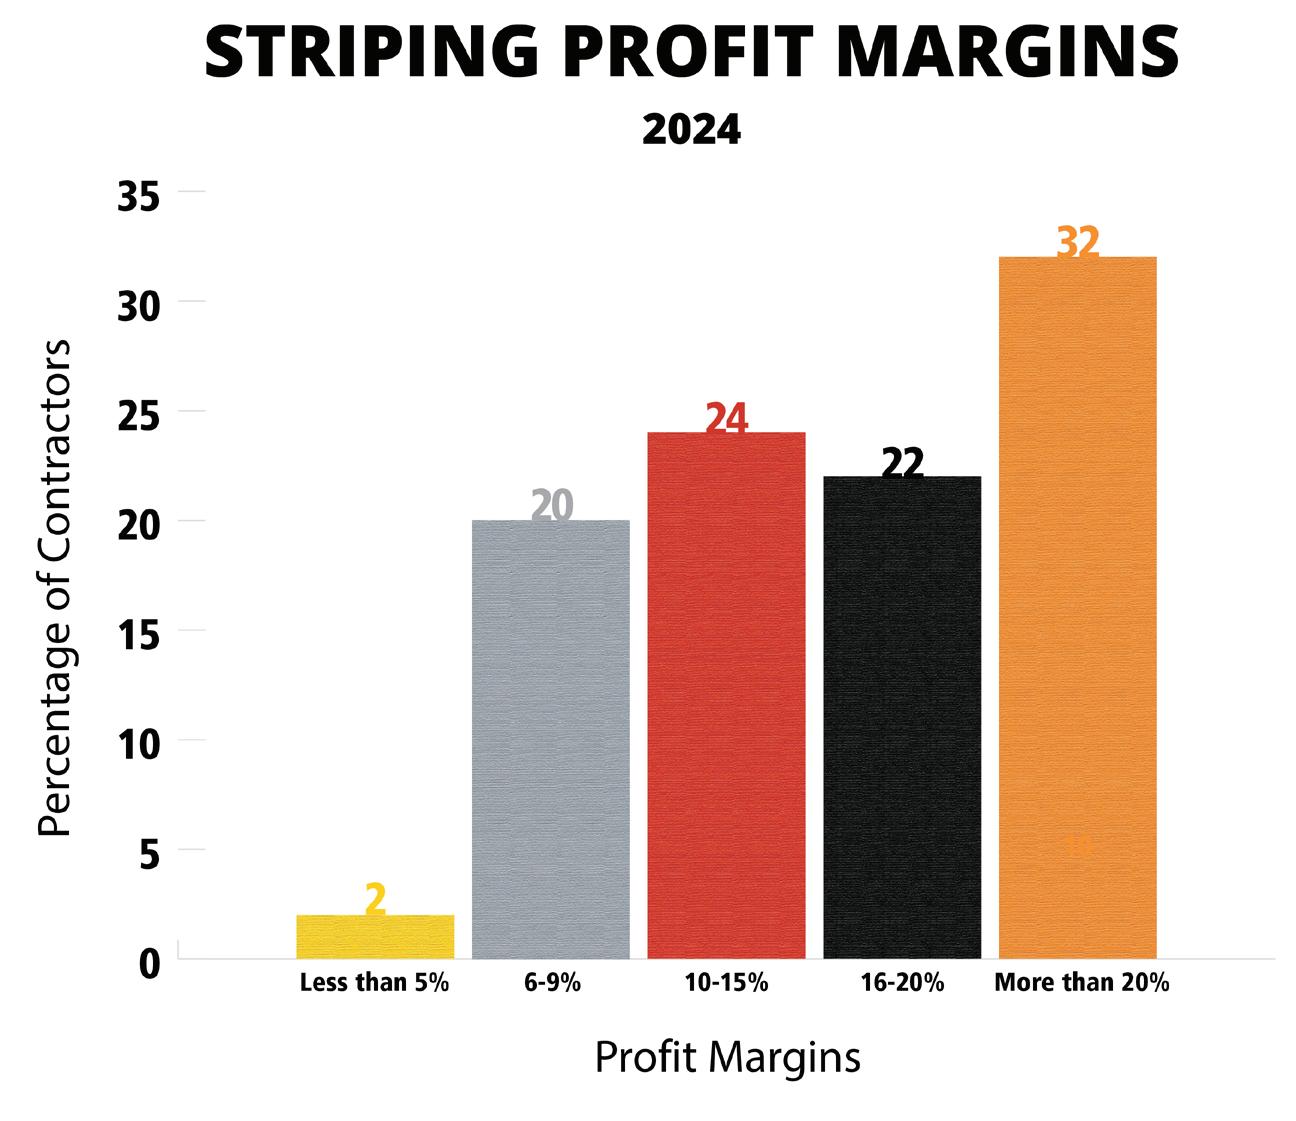
The profit margin distribution for the Striping Top 50 is, perhaps, the most intriguing since the alteration of the range percentages. This is because the top four (of the five total) ranges are all very close. There’s almost an even number of contractors in each range, meaning that of our Top 50, everyone was kind of doing there own thing. There’s not a strong sense of the profit margin levels across the industry like there is in paving, for example: where a strong majority all exist in the higher end of the spectrum. Striping is not as top heavy.
• Those who reported the highest profit margins, more than 20%, represented 32% (16 contractors) of the field
• 22% (11) of contractors ranked in the 16-20% profit margin range
• Under the previous distribution model, that 54% of contractors would be in the highest range
• That’s a 6% increase over last year’s 48%, and seems to give some evidence to broad profitability
• 24% (12) of the Top 50 ranked in the 10-15% profit margin range, another drop down from 28% in 2023 and 37% in 2022, suggesting the trend is upwardly mobile
• 20% (10) contractors landed in the 6-9% range, and just 2% (1) in the lowest range of less than 5%
TYPE OF WORK
The mix of work is slightly misleading in this case, because it isn’t really a reflection of where the Top 50 Striping contractors did striping per se, but a breakdown of the places they completed any type of work. It’s still interesting, and worth taking a look at.
• 52% of contractors performed work on driveways, at an average rate of 9% of their work mix
• 18% of contractors completed some highway work and at an average rate of 10%
• Unsurprisingly, 100% of contractors completed parking lot work at an average rate of 37% of their work mix composition
• 76% completed residential street projects at an average rate of 21%
• 22% completed work in undefined “other” areas, and, interestingly, one outlier did a whopping 74%
CUSTOMER MIX
Same as last year, 100% of contractors did work for commercial and/or industrial clients
• 82% of contractors did work for municipalities at an average customer mix of 17%
• 94% of the Top 50 completed work for multi-family, residential properties at an average mix of 24%
• 50% of the list did some work for single-family residential properties at an average mix of 10%
FLEET REPLACEMENT
• 2% of contractors reported it would only take between $250,000-$500,000
• 10% reported it would require between $500K - $1 million
• 24% would need between $1 million - $2 million
• A staggering 64% would need more than $2 million to fully replace their current fleets ■
For more information visit https://pavemg.com/4yn466
www.ForConstructionPros.com/Pavemen t | June/July 2024 | PAVEMENT MAINTENANCE & RECONSTRUCTION 27 Adobe Stock/satyrenko
STRIPING 50


28 PAVEMENT MAINTENANCE & RECONSTRUCTION | June/July 2024 | www.ForConstructionPros.com/Pavemen t Year in Business Sales Composition (%) Where We Work (%) Customer Mix (%) Paving Pavement Repair Sealcoating Striping Other Driveways Highways Parking Lots Streets/Roads Other Commercial Municipal Multi-family Single-family Other
A&A Paving - Roselle,Illinois 64 60 25 10 5 0 5 0 85 10 0 60 5 35 0 0 Advanced Surface Engineering LLCYoungstown, Ohio 2 60 15 15 10 0 0 0 85 15 0 75 10 15 0 0 Aegis Asphalt Construction - Eugene, Oregon 15 56 3 23 12 6 30 10 40 10 10 70 15 10 5 0 Affordable Striping & Sealing, LLC - Las Vegas, Nevada 17 0 0 45 55 0 5 0 65 30 0 45 5 25 25 0 Alpha Paving Industries - Round Rock, Texas 12 70 1 3 4 22 1 20 39 40 0 30 50 10 10 0 Anderson Striping & Construction, Inc.Kingsburg, California 37 25 5 29 39 1 1 0 89 2 8 68 21 10 0 1 ASAP Asphalt Sealing And Paving Co.Meadow Lands, Pennsylvania 19 41 34 13 6 6 6 0 84 10 0 74 8 12 5 1 Asphalt Restoration Technology Systems, Inc.Orlando, Florida 17 8 33 42 17 0 0 0 60 40 0 20 0 80 0 0 Asphalt Solutions Inc. - Youngstown, Ohio 24 60 5 20 15 0 0 0 100 0 0 90 0 10 0 0 Associated Paving Contractors, Inc. - Warminster, Pennsylvania 52 30 10 5 5 0 5 0 95 0 0 50 40 5 5 0 Atlantic Southern Paving & SealcoatingSunrise, Florida 31 45 15 15 5 18 3 2 60 35 0 40 15 15 3 27 B&G Sealcoating LLC - Endicott, N.Y. 14 0 5 70 25 0 20 0 80 0 0 50 30 0 20 0 Blackjack Paving - Fairburn, Georgia 16 70 20 7.5 2.5 0 2.5 0 95 2.5 0 62 2.5 33 2.5 0 Brahney Paving / FixAsphalt.com - Wall Twp, N.J. 23 35 42 15 4 4 1 0 99 0 0 89 0 10 1 0 BSI Paving - Oxford, Michigan 20 58 1 3 2 36 5 0 34 19 42 36 9 16 3 36 C & R Asphalt LLC. - Lexington, Kentucky 30 78 1 12 3 6 4 0 91 5 0 82 0 11 3 4 CALVAC INCORPORATED - San Jose, California 50 23.7 23.7 16.7 10 0 15 5 50 30 0 40 5 40 15 0 Central Paving, LLC - Ellensburg, Washington 10 50 20 20 10 0 20 0 30 50 0 20 50 10 20 0 Citymark Striping LLC - Troy, N.Y. 14 0 0 13 77 10 0 5 90 5 0 50 25 25 0 0 Crown Paving, LLC - Greenbrier, Tennessee 8 19.5 60.5 3.5 2.7 2.3 0 11 74 15 0 41 47 12 0 0 DACS Asphalt & Concrete - Denver, Colorado 10 45 16 5 4 30 0 0 90 10 0 40 0 60 0 0 Dominion Paving & Sealing - Purcellville, Virginia 42 60 11 9 5 15 0 0 50 50 0 29 1 67 3 0


600+
STRIPING 50
30 PAVEMENT MAINTENANCE & RECONSTRUCTION | June/July 2024 | www.ForConstructionPros.com/Pavemen t Year in Business Sales Composition (%) Where We Work (%) Customer Mix (%) Paving Pavement Repair Sealcoating Striping Other Driveways Highways Parking Lots Streets/Roads Other Commercial Municipal Multi-family Single-family Other
Eosso Brothers Paving - Farmingdale, N.J. 31 75 5 15 5 0 5 0 20 75 0 25 5 70 0 0 Finley Asphalt & Concrete - Bristow, Virginia 59 41 44 3 2 10 0 0 75 20 5 15 45 40 0 0 Gann Asphalt & Concrete Inc. - Riverside, Missouri 30 45 15 30 10 0 0 0 95 0 5 50 10 40 0 0 G-FORCE Parking Lot Striping - Amherst, N.H. 6 0 0 15 85 0 0 0 97 3 0 90 5 5 0 0 G-FORCE Parking Lot Striping of BaltimoreEdgewood, Maryland 3 0 0 10 90 0 0 0 100 0 0 70 10 20 0 0 Johnson and Sons Paving - Menomonee Falls, Wisconsin 10 75 10 10 5 0 6 0 70 24 0 60 5 25 10 0 KNL INDUSTRIES - Canby, Oregon 40 78 13 8 1 0 15 10 50 25 0 20 38 30 12 0 Laurel Asphalt LLC - Windber, Pennsylvania 29 75 2 10 11 2 45 0 47 8 0 47 8 0 45 0 Line Design Solutions, LLC - Pompano Beach, Florida 10 0 5 5 80 10 0 15 50 35 0 35 30 35 0 0 M&D Blacktop Co. - Grove City, Ohio 60 75 10 10 5 0 5 0 85 0 10 75 15 5 5 0 M&M Asphalt Maintenance Inc. dba All County Paving - Delray Beach, Florida 36 60 10 20 10 0 0 5 34 61 0 34 36 30 0 0 Maul Paving - Plainfield, Illinois 23 50 30 15 5 0 0 0 100 0 0 80 5 15 0 0 O’Leary Asphalt Inc. - Ijamsville, Maryland 39 48 14 4 1 33 1 0 80 16 3 19 20 60 1 0 Paramount Asphalt & Sealcoating CorporationNaples, Florida 9 55 5 20 20 0 0 0 50 50 0 60 10 30 0 0 Pavement Solutions, LLC - Richmond, Illinois 22 46 29 9 15 1 16 0 84 0 0 84 0 0 16 0 PLM Paving and Concrete - Pewaukee, Wisconsin 9 64 3.7 8.2 2.3 21.8 4 0 92 4 0 85 5 6 4 0 Prestige Paving Company - La Mirada, California 10 50 25 20 5 0 0 0 75 15 10 60 30 2 5 3 Pro-Pave Incorporated - Sterling, Virginia 24 70 25 4 1 0 0 0 75 23 2 40 15 40 0 5 Rabine - Schaumburg, Illinois 43 60 15 2 3 20 0 0 90 10 0 99 0 1 0 0 Sipes Asphalt & Concrete - Indianapolis, Indiana 11 20.3 14.2 6 1.2 58.3 0 0 100 0 0 70 0 30 0 0 Stasi Brothers Asphalt Corp. - Westbury, N.Y. 63 25 5 2 1 67 1 0 20 5 74 50 5 15 10 20 STRAIGHT LINE PAVEMENT SERVICES, INC. - Venice, Florida 3 0 0 0 100 0 0 5 90 5 0 90 5 5 0 0


TOP CONTRACTORS USE TOP TECHNOLOGY © 2020 Graco Inc. 3J0047B 4/20 Printed in the U.S.A. Product covered by issued and pending patents, see graco.com/patents Get more done with less labor and greater accuracy with features only found on a Graco LineLazer.® Less Set-Up Time • Auto-Layout ™ II Greater Accuracy • LazerGuide™ 2000 Exact Line Lengths Without A Tape Measure • Automatic Guns Striping Information At-A-Glance • LiveLook ™ Display Track All Jobs • J-Log™ with USB Download Simplify Parking Lot Striping to Increase Your Profits Learn more at graco.com/autolayout MADE IN THE USA WITH GLOBAL COMPONENTS


CRACKSEALER CRACKSEALER


32 PAVEMENT MAINTENANCE & RECONSTRUCTION | June/July 2024 | www.ForConstructionPros.com/Pavemen t STRIPING 50 Year in Business Sales Composition (%) Where We Work (%) Customer Mix (%) Paving Pavement Repair Sealcoating Striping Other Driveways Highways Parking Lots Streets/Roads Other Commercial Municipal Multi-family Single-family Other 1333 South Daysville Road Oregon, Illinois 61061 Illinois 61061 Sales: Sales: 815-732-2116 Sales: Sales: sales@etnyre.com Parts/Service: Parts/Service: 888-586-1899 888-586-1899 Versatile controls allowing automatic or Versatile controls allowing automatic or manual operation manual operation Two sealant loading doors for easy access Two sealant loading doors for easy access Enclosed high-pressure diesel-oil burner Enclosed high-pressure diesel-oil burner with automatic ignition with automatic ignition faster heating with direct hot oil coils faster direct hot oil coils Environmentally friendly flush-free system Environmentally friendly flush-free system Sealant tank capacity of either 250 or 400 Sealant tank capacity of either 250 or 400 gallons gallons
T&N Asphalt Services, Inc. - Salt Lake City, Utah 27 2 22 30 46 0 1 0 90 5 4 94 1 5 0 0 The Pavement Group - Wexford, Pennsylvania 6 54 7 8 6 25 0 0 100 0 0 98 0 2 0 0 The Surface Masters, Inc. - Marietta, Georgia 14 79 4 8 3 6 0 0 93 6 1 71 17 11 0 1 U.S. Pavement Services LLC - Woburn, Massachusetts 39 65 6 8 4 17 5 0 85 10 0 78 10 10 2 0 United Paving Co. - Corona, California 24 25 45 20 5 4 5 0 75 20 0 70 5 15 5 5 US PAVER - Arnold, Maryland 21 52.5 14 20 13.5 0 0 0 100 0 0 85 5 10 0 0

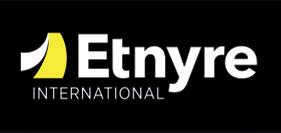
RAISING THE STANDARD
Since its introduction, the Weiler P385 has set the standard for commercial pavers. The P385C raises that standard.
Variable speed and reversible conveyors and augers and a 25% increase in tunnel height provide optimal material output.
Increase to 120 hp with the Cat® C3.6 Tier 4F/Stage V engine.
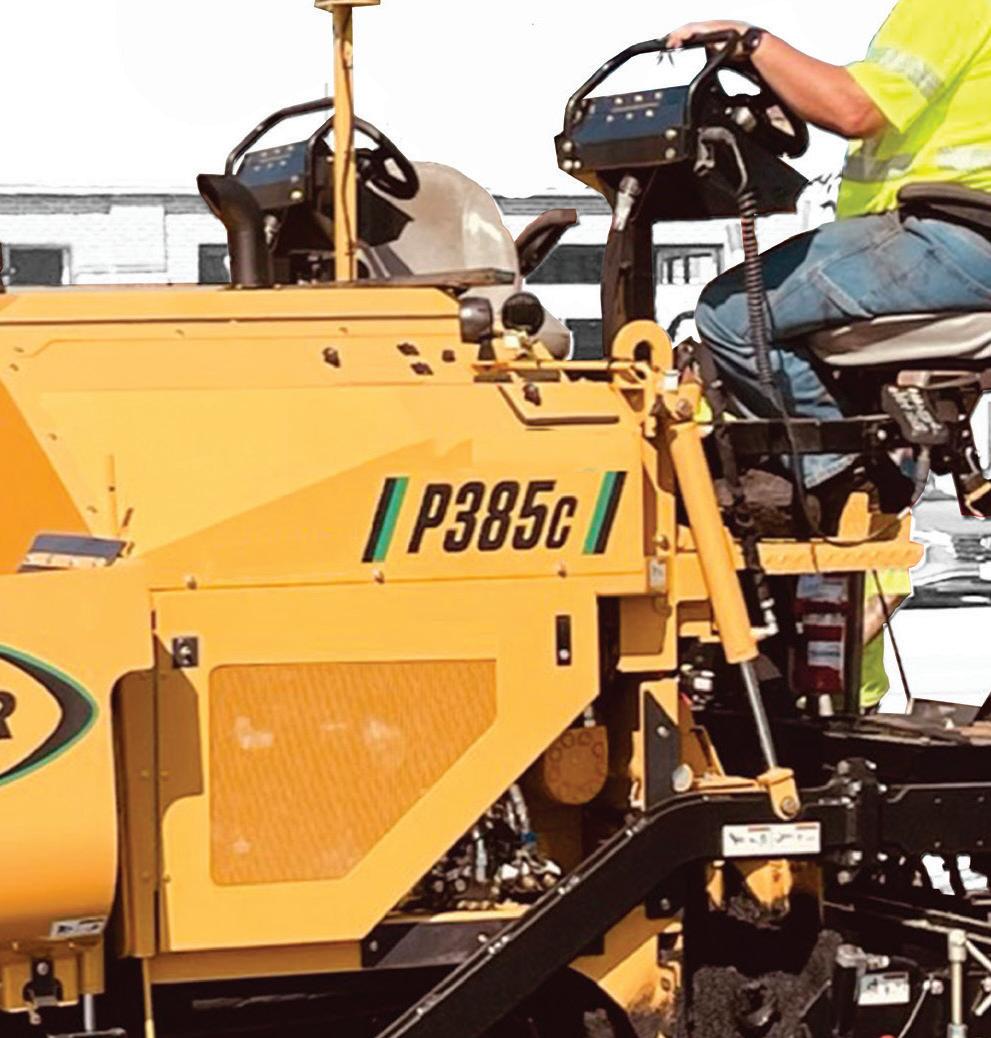
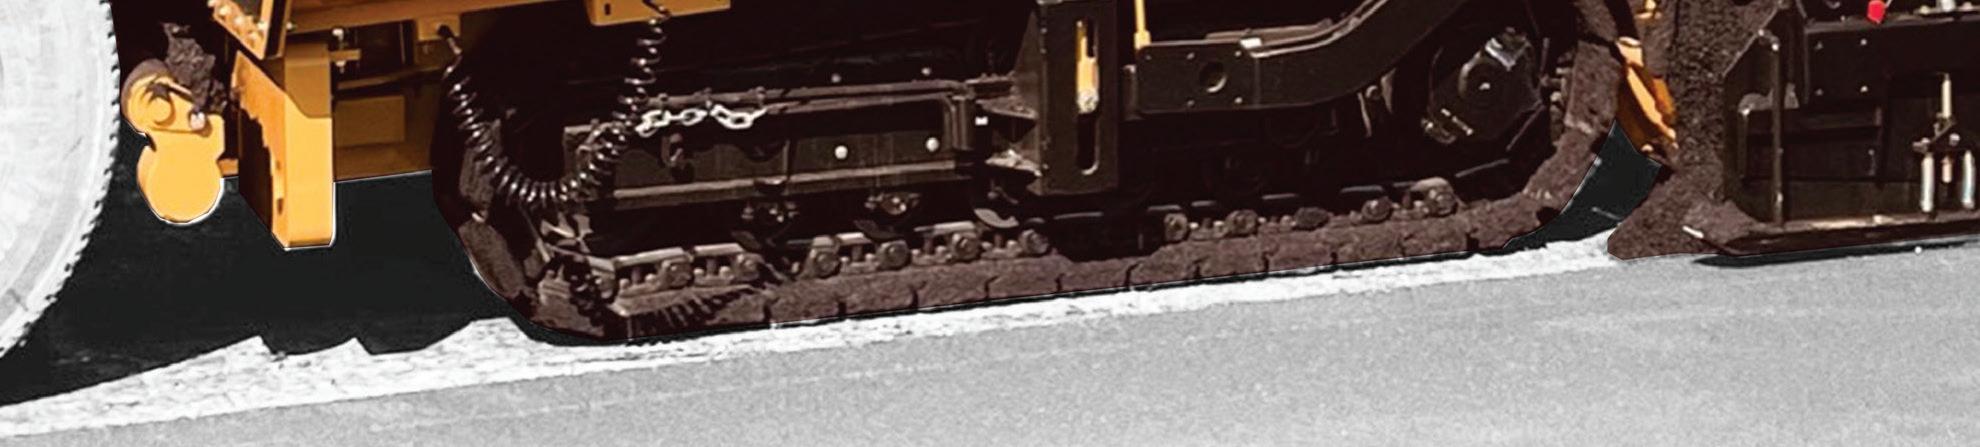

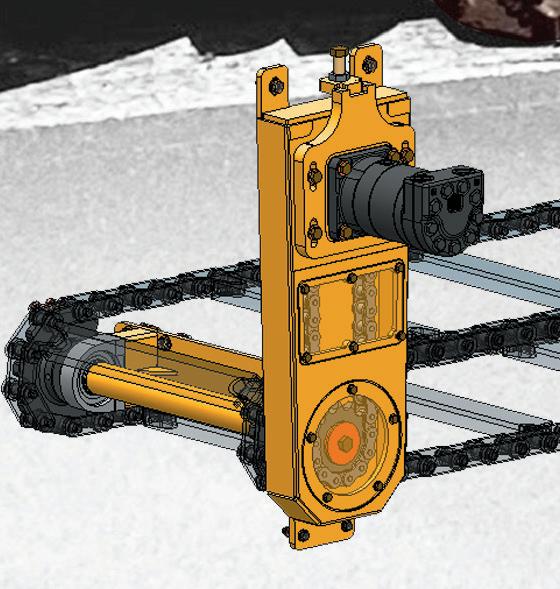


Modular conveyor drive and sealed chain case increase feeder system reliability and life.

Enhanced heat system performance with direct-drive hydraulic generator and elimination of GFCI breakers.

weilerproducts.com


PAVEMENT REPAIR


 By Brandon Noel, Editor
Sponsored by

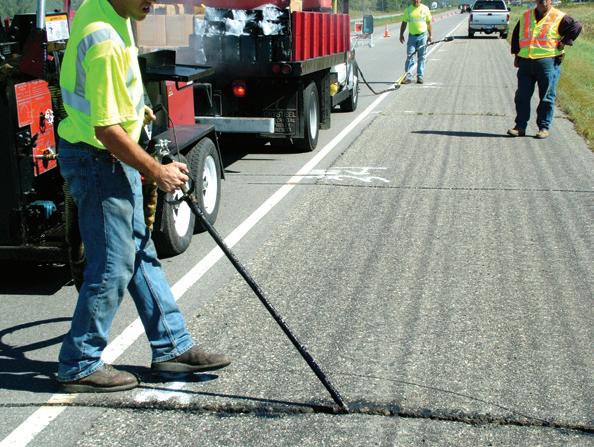
Top 50 Pavement Repair Contractors: Close To A Sure Thing
The Pavement Repair sector seems to be holding the most consistent and predictable growth over the last ten years.
We saved the Top 50 Pavement Repair contractors for last for a reason. Without a doubt, this sector of the business is the single most consistent financially, even if it isn’t on the same scale as the Paving Top 50 in terms of overall sales grosses. The pavement repair-only sales topped out at $285,633,743 for 2024, and that’s pretty amazing. When I tell you that it’s a down-step from last year’s $315 million, you might find “amazing” to be a strange categorization, but when put into the same greater context that we’ve been putting the other Top 50 lists into this year, it becomes much clearer.
I’ve been trying to play a bit of detective with the data we received this year from the surveys, really hoping to find some sort of understanding to the patterns. That might be a fools errand, but, if nothing else, it is going to help me make the survey better as the years go by. While, in some ways, I’ve been left scratching my head more than seeing things clearly, but with this category I think it’s safe to say this: Pavement repair work is a sure-bet.
As other parts of the industry have seen weird fluctuations, downward trends, or completely unpredictable shifts, the Pavement Repair Top 50
exhibits the most consistent numbers. There might be years that people put off sealcoating their properties, which usually means striping dips too, and there are going to be stretches where commercial property managers keep postponing resurfacing work. However, what they can’t really afford to wait on, is getting their liabilities taken care of.
Let’s take a look at the last ten years:
• 2024 - $286 million
• 2023 - $315
• 2022 - $248
• 2021 - $205*
• 2020 - $217
• 2019 - $209
• 2018 - $265
• 2017 - $165
• 2016 - $255
• 2015 - $269
*Pandemic
This is pretty significant. Over the course of the past decade, this sector has remained steady, and growing at an average rate of 6.41% annually. That’s nothing to ignore, and it should inform your business, as well, and even more so if you live in cold weather climates where hot mix isn’t available for several months out of the year.
During those winter months, you should absolutely be offering repair services that utilize things like asphalt reclaimers and recyclers, hot boxes, and infrared heaters. Those can work all year round, and they are obviously services that continue to be in demand and growing.
TOTAL SALES PAVEMENT
REPAIR TOP 50
The total gross sales for the Top 50 Pavement Repair contractors came in at
34 PAVEMENT MAINTENANCE & RECONSTRUCTION | June/July 2024 | www.ForConstructionPros.com/Pavemen t
50
THE BEST NEVER REST


Connect with us
Congratulations to the 2024 Pavement Repair Top Contractors. You showed up, worked hard, and didn’t settle for good enough. Your dedication inspires us to always keep improving, because our job isn’t over until yours is. Here’s to another great year from Crafco - your partner in pavement preservation. Visit us at crafco.com
PAVEMENT REPAIR


$1,543,627,669. Compare that number to the total sales for all the sales by the Pavement Repair 50 for 2023 $1.672 billion and $1.22 billion in 2022, and all of these are significantly higher than 2021’s reported figure of $1.045 billion. While, yes, it is another small contraction, the trajectory and the trend is still upward.
The average rate of change from four years ago to now is an eye-popping 67.72% and year-over-year growth stands at a healthy and respectable
15.22%. Again, it bears repeating that this sector is a good investment if you are looking for dependable ways to grow your business further.
PROFIT MARGINS
The restructuring of the profit margin percentages seems to have effected this category more than the others. Last year, it was very top heavy, like the other groups were, as well. And then the middle three rangers were all within two percentage points of one another, or just
36 PAVEMENT MAINTENANCE & RECONSTRUCTION | June/July 2024 | www.ForConstructionPros.com/Pavemen t
Year in Business Sales Composition (%) Where We Work (%) Customer Mix (%) Paving Pavement Repair Sealcoating Striping Other Driveways Highways Parking Lots Streets/Roads Other Commercial Municipal Multi-family Single-family Other
50
Sponsored by A&A Paving - Roselle, Illinois 64 60 25 10 5 0 5 0 85 10 0 60 5 35 0 0 Advanced Surface Engineering LLC - Youngstown, Ohio 2 60 15 15 10 0 0 0 85 15 0 75 10 15 0 0 AFS Contracting llc - Bloomfield, Ct 10 10 85 3 2 0 5 0 75 20 0 65 25 8 2 0 All Out Services LLC dba All Out Parking LotsBroomall, PA 13 64 23 3 1 9 1 0 81 10 8 69 20 10 1 0 Alpha Paving Industries - Round Rock, TX 12 70 1 3 4 22 1 20 39 40 0 30 50 10 10 0 Anderson Striping & Construction, Inc. - Kingsburg, California 37 25 5 29 39 1 1 0 89 2 8 68 21 10 0 1 ASAP Asphalt Sealing And Paving Co. - Meadow Lands, PA 19 41 34 13 6 6 6 0 84 10 0 74 8 12 5 1 Asphalt Restoration Technology Systems, Inc.Orlando, FL 17 8 33 42 17 0 0 0 60 40 0 20 0 80 0 0 Associated Paving Contractors, Inc. - Warminster, PA 52 30 10 5 5 0 5 0 95 0 0 50 40 5 5 0 Atlantic Southern Paving & Sealcoating - Sunrise, Florida 31 45 15 15 5 18 3 2 60 35 0 40 15 15 3 27 BelRock Asphalt Paving Inc - Belvidere, IL 21 70 10 10 0 10 20 0 80 0 0 70 5 15 5 5 Blackjack Paving - Fairburn, GA 16 70 20 7.5 2.5 0 2.5 0 95 2.5 0 62 2.5 33 2.5 0 Brahney Paving / FixAsphalt.com - Wall Twp, NJ 23 35 42 15 4 4 1 0 99 0 0 89 0 10 1 0 C & R Asphalt LLC. - Lexington, Kentucky 30 78 1 12 3 6 4 0 91 5 0 82 0 11 3 4 CALVAC INCORPORATED - san jose, CA 50 23.7 23.7 16.7 10 0 15 5 50 30 0 40 5 40 15 0 Central Paving, LLC - Ellensburg, WA 10 50 20 20 10 0 20 0 30 50 0 20 50 10 20 0


a single contractor. Those middle profits were the most common. This year, they are a little less top heavy, and then bulge back out towards the bottom third.
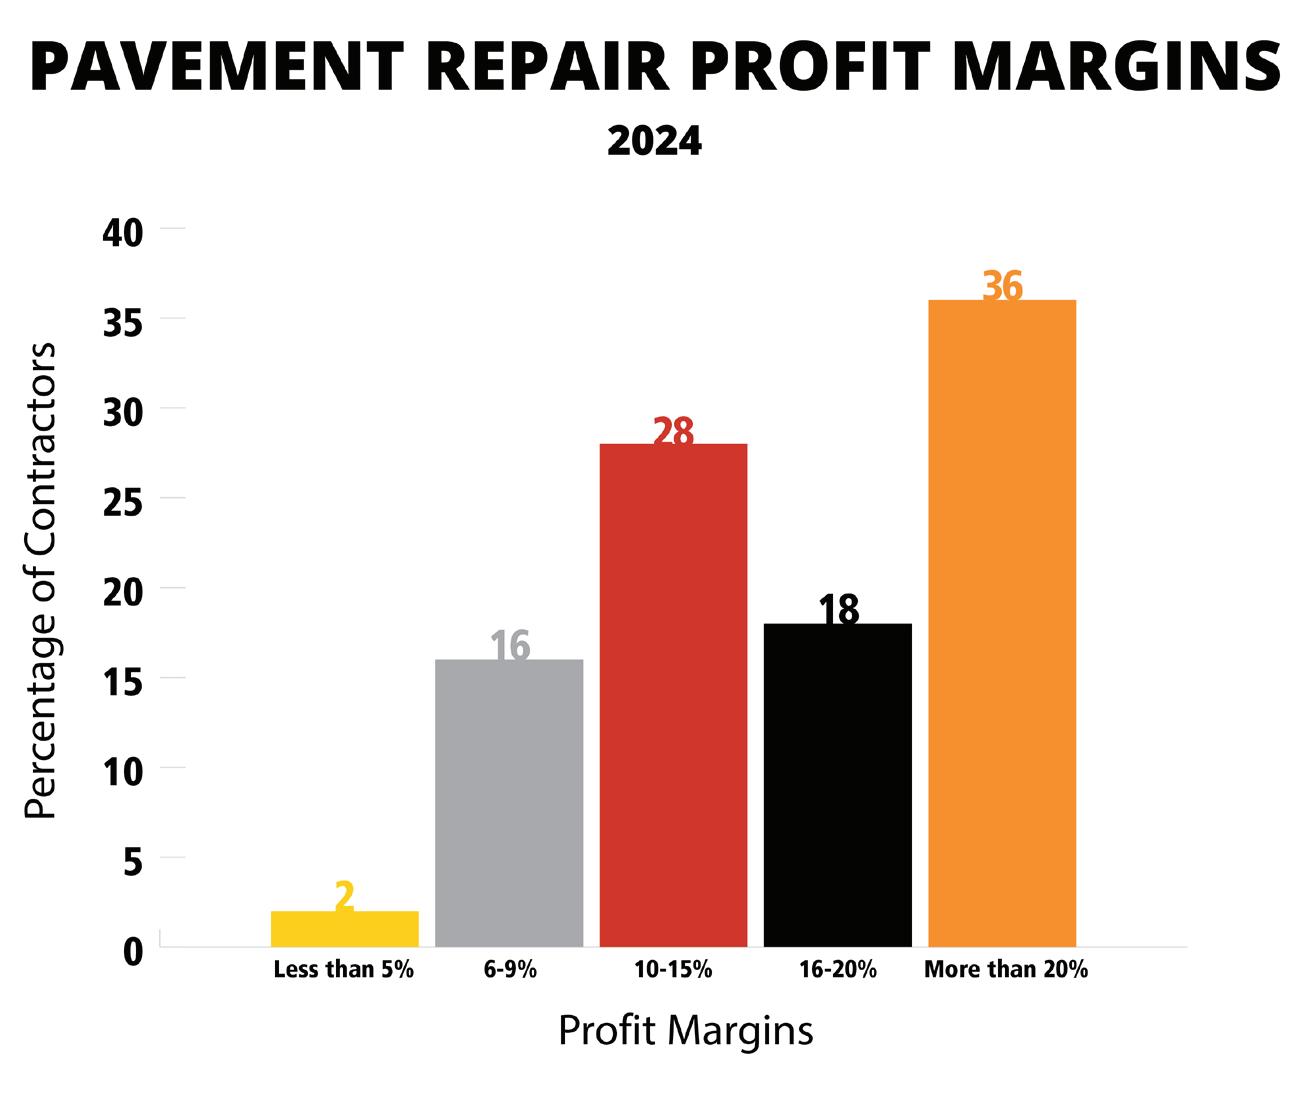
• 36% of contractors (18 companies) reported profit margins greater than 20%, and 18% (9) ranked in the 16-20% range
• That means 54% were in the highest range of profits, compared to 2023 which saw 56% in the above 15% range
• 14% of contractors (7) reported profits in the 10-15% range, compared to 16% in 2023
• 16% of contractors (8) fell into the 6-9% profit range, and 2% in the lowest bracket at less than 5% profit margins
These fluctuations might be explained by increased material costs, and pricing not keeping pace. I expect that next year, these profit margins will slide back upwards.
TYPES OF WORK
• 72% of the Pavement Repair Top 50 completed work on driveways at an average rate of 8% of their job mix composition
• Only 8% of this Top Contractor category completed highway work, the lowest of all list groups, at an
average rate of 13%
• 100% of the contractors completed some parking lot work at an average rate of 74%
• 72% of contractors also did residential street or roadwork at an average rate 23% of the job mix
TYPES OF CLIENTS
• All 50 of the Pavement Repair Top 50 completed work for commercial and/or industrial customers at an average rate of 60% of client mix composition
• 78% of contractors on the list completed some municipal work at an average rate of 8% of client mix
• 94% of the Top 50 did work for multi-family residence or HAOs at
an average rate of 22%
• 62% of companies worked for single-family residence at an average rate of 10% of client mix
FLEET REPLACEMENT
• 6% of the Pavement Repair Top 50 said it requires between $250K$500K to fully replace their fleets
• 6% said that it would require twice that, between $500K - $1 million
• 18% stated that it would take between $1 million - $2 million
• The remaining 20% said it would need more than $2 million to fully replace their fleets ■
For more information visit https://pavemg.com/mz1q1r

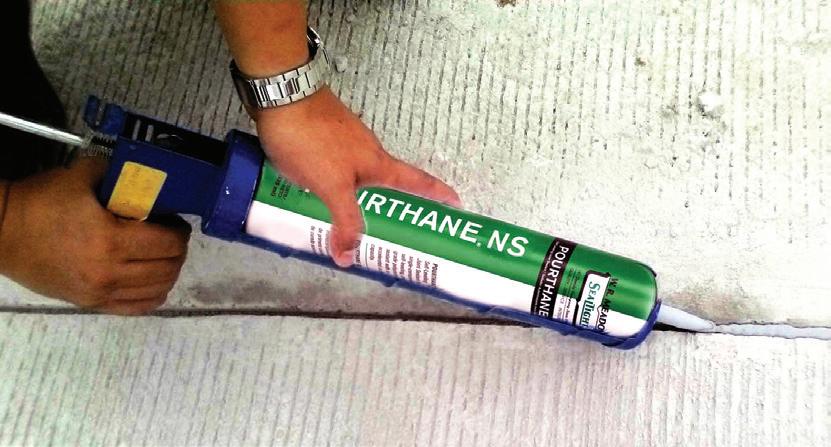
NR-201 is a one-part, selfleveling, moisture-curing, isocyanate free sealant based on a unique hybrid STPU (Silyl Terminated Polyurethane) designed for use as a traffic loop sealant and applications requiring jet fuel resistance. 300SL
300SL is a self-leveling onepart, ultra low modulus elastomer designed for sealing joints in roadways.
301NS
301NS is a non-sag, one-part, ultra low modulus product designed for sealing joints in concrete or asphalt.
Pecora 322FC is a two-part, coldapplied, self-leveling, fast-curing, ultra-low modulus 100% silicone material designed for the sealing of concrete pavement joints that experience thermal movement.
www.ForConstructionPros.com/Pavemen t | June/July 2024 | PAVEMENT MAINTENANCE & RECONSTRUCTION 37 REDUCE PAVEMENT DETERIORATION THREE
AND ASPHALT SEALING CHALLENGES PHONE 215-723-6051 | TOLL FREE 215-723-6051 | pecora.com
PRODUCTS FOR ALL YOUR CONCRETE
NR201
300SL & 301NS
322 FC
NR201
322FC
Adobe Stock/smuki
PAVEMENT REPAIR
38 PAVEMENT MAINTENANCE & RECONSTRUCTION | June/July 2024 | www.ForConstructionPros.com/Pavemen t
50 Year in Business Sales Composition (%) Where We Work (%) Customer Mix (%) Paving Pavement Repair Sealcoating Striping Other Driveways Highways Parking Lots Streets/Roads Other Commercial Municipal Multi-family Single-family Other
Crown Paving, LLC - Greenbrier, Tennessee 8 19.5 60.5 3.5 2.7 2.3 0 11 74 15 0 41 47 12 0 0 DACS Asphalt & Concrete - Denver, Colorado 10 45 16 5 4 30 0 0 90 10 0 40 0 60 0 0 Dominion Paving & Sealing - Purcellville, Virginia 42 60 11 9 5 15 0 0 50 50 0 29 1 67 3 0 Eosso Brothers Paving - Farmingdale, NJ 31 75 5 15 5 0 5 0 20 75 0 25 5 70 0 0 Erickson Asphalt Services Inc - Princeton, Minnesota 34 70 15 12 0.2 0 20 0 60 20 0 50 1 20 29 0 Finley Asphalt & Concrete - Bristow, VA 59 41 44 3 2 10 0 0 75 20 5 15 45 40 0 0 G & M New England, LLC - Sherborn, Ma 23 15 50 30 5 0 25 0 75 0 0 50 0 25 25 0 Gann Asphalt & Concrete Inc. - Riverside, Mo 30 45 15 30 10 0 0 0 95 0 5 50 10 40 0 0 Johnson and Sons Paving - Menomonee Falls, Wisconsin 10 75 10 10 5 0 6 0 70 24 0 60 5 25 10 0 KNL INDUSTRIES - Canby, OR 40 78 13 8 1 0 15 10 50 25 0 20 38 30 12 0 Love’s Asphalt Solutions LLC - Lafayette, Louisiana 9 0 66 25.7 8.3 0 5 0 95 0 0 85 0 10 5 0 M&D Blacktop Co. - Grove City, Ohio 60 75 10 10 5 0 5 0 85 0 10 75 15 5 5 0 M&M Asphalt Maintenance Inc. dba All County Paving - Delray Beach, FL 36 60 10 20 10 0 0 5 34 61 0 34 36 30 0 0 Maul Paving - Plainfield, IL 23 50 30 15 5 0 0 0 100 0 0 80 5 15 0 0 Mr. Pave - Lynchburg, Virginia 5 0 99 1 0 0 10 0 60 25 5 100 0 0 0 0 O’Leary Asphalt Inc. - Ijamsville, MD 39 48 14 4 1 33 1 0 80 16 3 19 20 60 1 0 Paramount Asphalt & Sealcoating CorporationNaples, FL 9 55 5 20 20 0 0 0 50 50 0 60 10 30 0 0 Pavement Solutions, LLC - Richmond, Illinois 22 46 29 9 15 1 16 0 84 0 0 84 0 0 16 0 PLM Paving and Concrete - Pewaukee, WI 9 64 3.7 8.2 2.3 21.8 4 0 92 4 0 85 5 6 4 0 Prestige Paving Company - La Mirada, CA 10 50 25 20 5 0 0 0 75 15 10 60 30 2 5 3 Pro-Pave Incorporated - Sterling, VA 24 70 25 4 1 0 0 0 75 23 2 40 15 40 0 5 Rabine - Schaumburg, IL 43 60 15 2 3 20 0 0 90 10 0 99 0 1 0 0 Ruston Paving Co., Inc. - Durham, NC 81 68 30 0 0 2 0 0 100 0 0 75 10 15 0 0 SEAL-O-MATIC PAVEMENT SOLUTIONS INC. DBA PAVEMENT SOLUTIONS - OLATHE, KANSAS 12 15 68 17 0 0 1 0 49 50 0 95 1 4 0 0 Sipes Asphalt & Concrete - Indianapolis, Indiana 11 20.3 14.2 6 1.2 58.3 0 0 100 0 0 70 0 30 0 0
Sponsored by

DRAG AND DROP CREW AND EQUIPMENT SCHEDULING
Powerfully simple whiteboard-like scheduling made for people like us.
✔ Easy scheduling with a drag and drop whiteboard like interface
✔ Instantly send crew members a text message with daily event info, saving you hours on the phone
✔ Consolidate all photos, notes, plans, and videos in one place for easy access
✔ Available in both Spanish and English


www.ForConstructionPros.com/Pavemen t | June/July 2024 | PAVEMENT MAINTENANCE & RECONSTRUCTION 39 Year in Business Sales Composition (%) Where We Work (%) Customer Mix (%) Paving Pavement Repair Sealcoating Striping Other Driveways Highways Parking Lots Streets/Roads Other Commercial Municipal Multi-family Single-family Other Stasi Brothers Asphalt Corp. - Westbury, NY 63 25 5 2 1 67 1 0 20 5 74 50 5 15 10 20 Synergy Pavement Group - South Beloit, IL 25 55 10 8 5 22 40 0 60 0 0 60 0 0 40 0 T&N Asphalt Services, Inc. - Salt Lake City, Utah 27 2 22 30 46 0 1 0 90 5 4 94 1 5 0 0 The Pavement Group - Wexford, PA 6 54 7 8 6 25 0 0 100 0 0 98 0 2 0 0 The Surface Masters, Inc. - Marietta, Georgia 14 79 4 8 3 6 0 0 93 6 1 71 17 11 0 1 U.S. Pavement Services LLC - Woburn, MA 39 65 6 8 4 17 5 0 85 10 0 78 10 10 2 0 United Paving Co. - Corona, CA 24 25 45 20 5 4 5 0 75 20 0 70 5 15 5 5 US PAVER - Arnold, MD 21 52.5 14 20 13.5 0 0 0 100 0 0 85 5 10 0 0 Weaver Construction Services - Conway, South Carolina 12 10 35 40 5 0 0 0 65 35 0 15 10 20 55 0
BOOK A DEMO


THE PREMIER EDUCATIONAL CONFERENCE & NETWORKING PROGRAM FOR PAVEMENT BUSINESS OWNERS & HIGH-LEVEL MANAGERS SPARK Business Growth Through Networking & Education ILLUMINATE Critical Issues in Your Business FIRE UP Your Business By Identifying the Best Ways to Adapt & Advance From the producers of: WWW.IGNITECONSTRUCTIONSUMMIT.COM REGISTER NOW DECEMBER 4 - 6, 2024 THE RENAISSANCE ESMERALDA RESORT & SPA INDIAN WELLS, CA

www.ForConstructionPros.com/Pavemen t | June/July 2024 | PAVEMENT MAINTENANCE & RECONSTRUCTION 41 CONGRATS TO THE 2024 TOP CONTRACTORS BEST WISHES FOR EVERYONE’S SEASON


42 PAVEMENT MAINTENANCE & RECONSTRUCTION | June/July 2024 | www.ForConstructionPros.com/Pavemen t CLASSIFIEDS Call 800-776-7690 or visit billygoat com Take the chore out of the chore with Billy Goat! Call 800-776-7690 or visit billygoat.com Take the chore out of the chore with Billy Goat! Billy Goat® Blower Line-Up from 6 to 35 gross HP†! F1002SPV Self-propelled, F1002V †Power rated by engine manufacturer Vanguard: All power levels are stated gross horsepower at 3,600 RPM per SAE J1940 as rated by Briggs & Stratton® F902H Vanguard-powered with Grazor® GZ551V 8" Steel Wire Brush F602X Compact Stand-On Blower Ideal for small and mid-size lot cleaning. 3500 CFM Also available: X3001: 4500 CFM 23 gross HP† 627cc Vanguard® V-Twin Z3001: 7500 CFM 35 gross HP† 993cc Vanguard® V-Twin F1802V, Selfpropelled available, F1802SPV F1302H, Self-propelled available, F1302SPH F1402SPV, Self-Propelled www.libertysupply.biz Spray Tips Liberty Supply 1/4”, 3/8” & 1/2” NPT 80/10, 80/20, 80/30, 80/40, 80/50, 80/70, 80/100 (800) 397-9907


To be considered, eligible contractors are required to have a minimum of 15 full-time or part-time employees in the U.S. and a primary business of: General Building Construction, Earthmoving, Paving, Concrete or Specialty and trades (Underground, Utility, Electrical, HVAC, Demolition, etc.) Apply today at BestContractorsToWorkFor.com APPLICATION DEADLINE JULY 19, 2024 SCAN HERE
the opportunity to be recognized as an outstanding employer, highlighting the paramount importance of your people. The online application process is FREE, and earning the distinction of being a premier contractor offers the advantage of attracting the diligent and skilled workforce that your company truly merits. Time is running out - hurry and apply today! Prove your excellence by clinching the title of “BEST CONTRACTOR” to Work for in Construction!
Take