


MAINTENANCE & RECONSTRUCTION JUNE/JULY 2023 › › › www.ForConstructionPros.com/Pavement ››TOP 50 PAVING ››TOP 50 STRIPING ››TOP 50 SEALCOATING ››TOP 50 PAVEMENT REPAIR CATEGORIES THE OFFICIAL MAGAZINE OF PAVE/X [ [ 2023 SURVEY RESULTS TOP CONTRACTOR
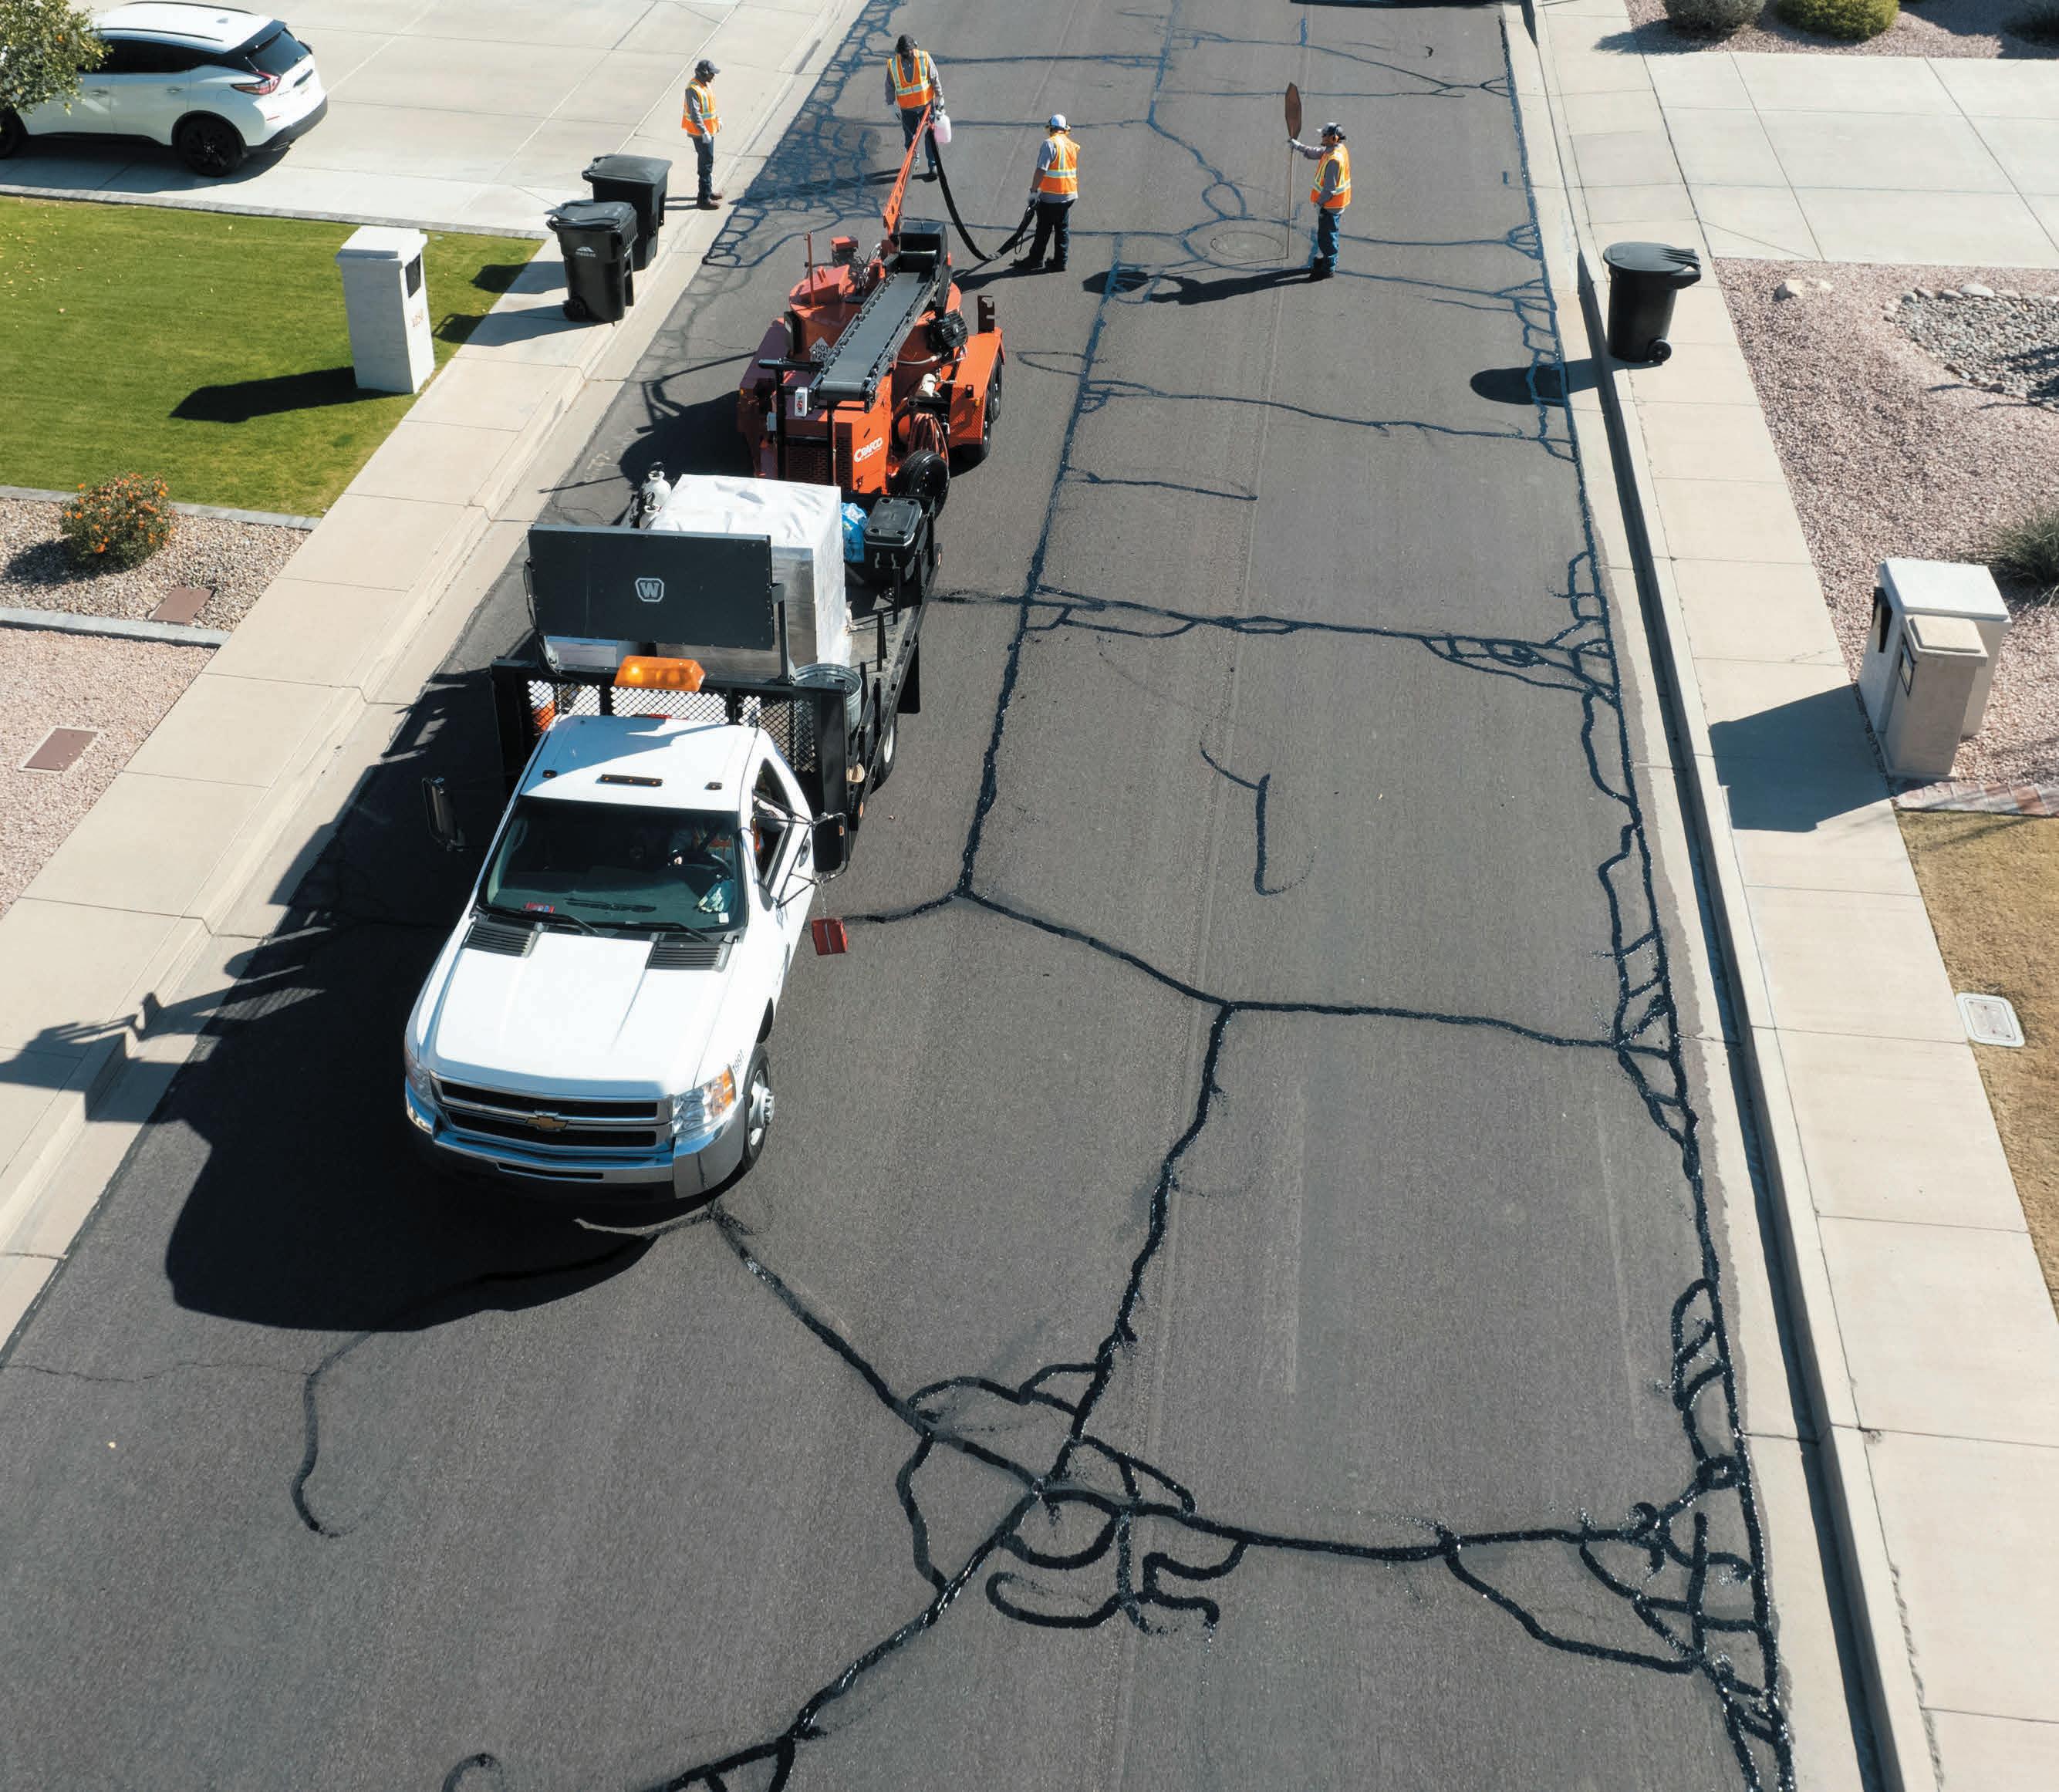
Scan to learn what a successful crack sealing program looks like

The Best Performing Sealants in the Industry.

From rural roads and parking lots to highways and city streets, Crafco hot-applied asphalt crack sealants are the trusted choice of agencies and contractors for sealing cracks in the US and abroad.


Crafco’s high-quality sealants work in all climates and provide long-lasting protection, durability, and reliability. When tested, Crafco’s sealants demonstrated the longest service life in the industry.
Crafco continues to develop new and innovative crack sealants through ongoing research to provide customers with the most reliable and highest-quality products on the market today.
Get started today! Visit crafco.com/sales
Follow us:
SURVEY RESULTS TOP CONTRACTOR

FEATURES
8 Announcing the 2023 Pavement Top Contractors: A Return To Status Quo?
The industry continues to grow and see financial success despite inflation, supply chain, and labor woes.


10 2023

Paving Top 50 Contractors
Paving-only sales for the Top 50 Contractors saw an explosion of growth, increasing by more than $170 million from 2022, nearly three times the increase between previous years.


18 2023

Sealcoating Top 50 Contractors


This year, the Sealcoating Top 50 grew by $36 million in sales, possibly revealing the growth plateau has been reached.
26


2023 Striping Top 50 Contractors
After dealing with some anomalous data in 2022, this year’s profit margins and sales return to previous normal ranges, though sales still grew by $30 million from 2021’s numbers.

34 2023 Pavement Repair Top 50 Contractors


Segment only sales for every list was up, but profit margins also indicate the this particular work is highly lucrative for contractors.
DEPARTMENTS
6 Editorial
The 2022 Pavement Top Contractor lists show a strong rebound from 2021.
46 Your Business Matters
How to Develop an Organizational Structure That Scales with Your Growth
TABLE OF CONTENTS ON THE COVER Design by April Van Etten, Art Director, AC Business Media, 201 N. Main Street, Fort Atkinson, WI 53538 June/July 2023 | Issue 5, Volume 35 2023
www.ForConstructionPros.com/Pavemen t | June/July 2023 | PAVEMENT MAINTENANCE & RECONSTRUCTION 3
IN EVERY ISSUE
Classifieds
42
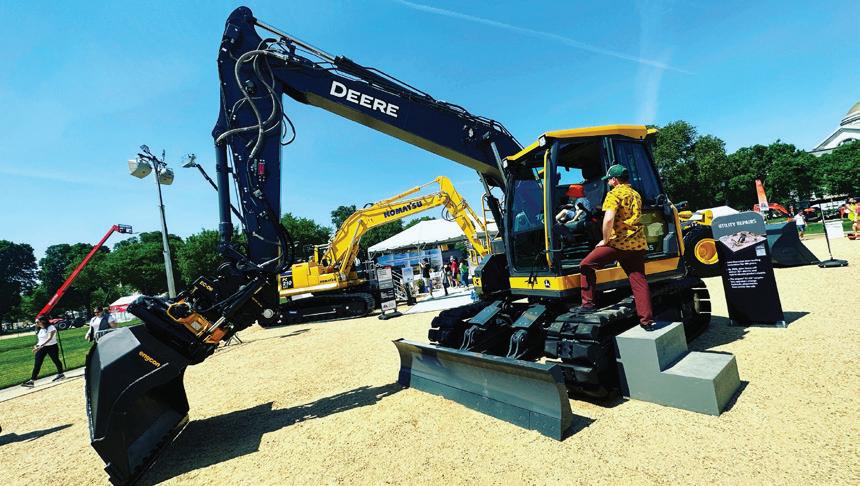
Celebration of Construction Brings Policy and the Public Together

The Association of Equipment Manufacturers went to great lengths for the event held on the National Mall, where the general masses could experience first-hand the industry, while also strengthening relations with decision makers.

Read more at:
https://pavemg.com/og9n3n


Florida Legislators Pass Law to Allow Radioactive Waste in Asphalt Mixes
The Republican controlled legislature in the state of Florida challenged a 30-year rule kept by the EPA that disallows phosphogypsum, a radioactive byproduct of the fertilizer industry, as a material for road pavement mixes.
Read more at:
https://pavemg.com/m87vji
[VIDEO] Trimble Talks Efficiency, Productivity of Roadworks Platform
Kevin Garcia talks about the Roadworks platform, its automated/assist solutions for asphalt paving in both 3D and 2D.


Read more at:
https://pavemg.com/0u9639

68 WHAT’S ONLINE Stay Up-to-Date with us on Social Media 4 PAVEMENT MAINTENANCE & RECONSTRUCTION | June/July 2023 | www.ForConstructionPros.com/Pavemen t
Vol. 35, No. 5 June/July 2023 Published and copyrighted 2023 by AC Business Media. All rights reserved. No part of this publication may be reproduced or transmitted in any form or by any means, electronic or mechanical, including photocopy, recording or any information storage or retrieval system, without written permission from the publisher. Subscription policy: Individual subscriptions are available without charge in the U.S. only to pavement maintenance contractors, producers and government employees involved in paving or pavement maintenance; dealers, and distributors of pavement maintenance equipment or materials; and others with similar business activities. Complete the subscription form at www. forconstructionpros.com or use your company letterhead giving all the information requested. Publisher reserves the right to reject nonqualified subscribers. One year subscriptions for nonqualified individuals: $35 U.S.A., $60 Canada and Mexico, and $85 all other countries (payable in U.S. funds, drawn on U.S. bank). Single copies available (prepaid only) $10.00 each (U.S., Canada & Mexico), $15 each (International). Pavement Maintenance & Reconstruction (ISSN 1098-5875), is published eight times per year: January, February, March/April, May, June/July, August/September, October/November, December by AC Business Media, 201 N. Main St., Fort Atkinson, WI 53538. Periodicals postage paid at Fort Atkinson, WI and additional entry offices. POSTMASTER: Please send change of address to Pavement, PO Box 3605, Northbrook, IL 60065-3605. Printed in the USA. PAVEMENT MAINTENANCE & RECONSTRUCTION is proudly supported by these associations: PAVEMENT
BUILDING AMERICA... SINCE 1926.
W. R. MEADOWS got its start helping to "Build America" in the 1920s. And now – just as then –
W. R. MEADOWS is a source you can trust for quality building materials for all your airport, bridge, highway and water treatment plant projects.


Our product line includes:
• Concrete curing and sealing compounds for highways

• Epoxies and repair mortars for restoring and strengthening existing concrete
• Expansion joint materials for easing the expansion and contraction of concrete slabs
• Waterproofing for bridge decks and foundations

• Joint sealants for asphalt and concrete surfaces
W. R. MEADOWS: Founded and Flourishing in America for 97 years. Visit www.wrmeadows.com or call 1-800-342-5976 for more

information. © W. R. MEADOWS, INC. 2023
Hitting The Halfway Mark for 2023
Last month, I had the opportunity to travel to Washington, D.C., and spend some time in the nation's Capital for the first ever Celebration of Construction, held by AEM on the National Mall for three days. It was a great opportunity for the general public to engage with parts of the construction industry that they might not have ever had the opportunity to engage with directly.
What was really interesting, from my perspective, was that despite the event being labeled general "construction,” by AEM, the paving and asphalt industry had more representation than I expected and that’s NOT A BAD THING! It was a good sign to see the tools of our trade out on the Mall. I was curious about the origins of the event, and what goes into putting together an event with rollers, pavers, and huge excavators so close to the most important buildings in the country.
Brandon Noel, Editor bNoel@ACBusinessMedia.com 234-600-8983
I had the chance to talk to AEM's senior director of regulatory affairs Nick Tindall. In regard to how they manage to put something like the event together in such a high profile location, he said, "First of all, you have to follow a lot of rules with the National Park Service." That’s because the National Mall is essentially, the People's Park.
"You definitely need the right event consultant that knows how to do things on the National Mall because it's not a trade show," Tindall continued. "It's no picnic. There's a lot of boxes that have to be checked because you are in a public space and they have very strict rules."
Overall, it did seem to pay off, and there were hundreds of families with their kids climbing up and over all the heavy machines. In a conversation with the new president of BOMAG Americas, Brian Bieller, he seemed to summarize the value of the close interaction.
"Just seeing the kids all day, crawling up the machines, having fun, it’s been the best,” Bieller said. “The goal is to foster a lifelong interest from an early age, but the initial interest from kids is already there. Events like this are great.”
As the saying goes, “train up a child in the way he (they) should go,” right? Maybe some kids who spent a nice spring day sitting in the operators’ chairs will someday sit in it again.
TOP CONTRACTOR LISTS
Speaking of chairs, this is my first year in the editorial seat, tasked with going through submitted applications for the Top Contractor lists. Almost the entirety of this issue is dedicated to them, as well as the analysis of the data provided through the application process. I want to note how we changed the process this year, and that it definitely impacted things in one way or another. For the first time ever, the application process was moved completely online, through the ForConstructionPros.com website, and it will be the same for the 2024 lists.
Whenever you change things, there will inevitably be growing pains, but we believe that this move was for the best. We also believe that going forward, the online submission process is a more accessible way for businesses to participate and gain recognition for their business and their crews’ hard work. If you happened to miss this years application window, along with the many emails we will send out, make a note to visit our website starting this December 2023, as the window will open then and close sometime in March of 2024.
See you on the road! ■
EDITORIAL
Editor Brandon Noel bnoel@acbusinessmedia.com
Contributing Editor Jessica Lombardo jlombardo@acbusinessmedia.com

Managing Editor Gigi Wood gwood@acbusinessmedia.com
Senior Editor, Construction Technology, IRONPROS Charles Rathmann crathmann@acbusinessmedia.com

Senior Editor, Equipment & Workwear, IRONPROS Michael Cheng mcheng@acbusinessmedia.com


AUDIENCE
Audience Development Manager Angela Franks
PRODUCTION
Senior Production Manger Cindy Rusch crusch@acbusinessmedia.com
Art Director April Van Etten
ADVERTISING/SALES
Brand Director Amy Schwandt aschwandt@acbusinessmedia.com
Sales Representative Sean Dunphy sdunphy@acbusinessmedia.com

Sales Representative Kris Flitcroft kflitcroft@acbusinessmedia.com
Sales Representative Tadashi Soma tsoma@acbusinessmedia.com
AC BUSINESS MEDIA
Chief Executive Officer....................................................Ron Spink
Chief Financial Officer JoAnn Breuchel
Chief Revenue Officer Amy Schwandt
Brand Director, Supply Chain & Green Industry Jason DeSarle

Brand Director, Construction Sean Dunphy
VP, Audience Development Ronda Hughes
VP, Operations & IT Nick Raether
Content Director Marina Mayer
Director, Online & Marketing Services Bethany Chambers
Content Director, Marketing Services ...............Jess Lombardo
Director, Demand Generation & Education ............. Jim Bagan
CIRCULATION & SUBSCRIPTIONS
P.O. Box 3605, Northbrook, IL 60065-3605 (877) 201-3915 | Fax: (847)-291-4816 circ.pavement@omeda.com
LIST RENTAL
Sr. Account Manager Bart Piccirillo | Data Axle (518) 339 4511 | bart.piccirillo@infogroup.com
REPRINT SERVICES
Tadashi Soma (800) 538-5544 ext. 1267 | tsoma@ACBusinessMedia.com
Published and copyrighted 2023 by AC Business Media. All rights reserved. No part of this publication may be reproduced or transmitted in any form or by any means, electronic or mechanical, including photocopy, recording, or any information storage or retrieval system, without written permission from the publisher.
@PAVEMENTMAINTENANCE
6 PAVEMENT MAINTENANCE & RECONSTRUCTION | June/July 2023 | www.ForConstructionPros.com/Pavemen t EDITORIAL PAVEMENT @PAVEMENTMAGAZINE @PAVEMENTMAGAZINE @PAVEMENTMAGAZINE
WWW.FORCONSTRUCTIONPROS.COM/PAVEMENT Published by AC BUSINESS MEDIA 201 N. Main St. Ste 350, Fort Atkinson, WI 53538 (800) 538-5544 • www.ACBusinessMedia.com
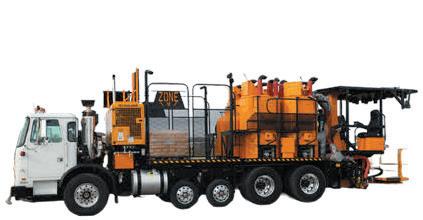
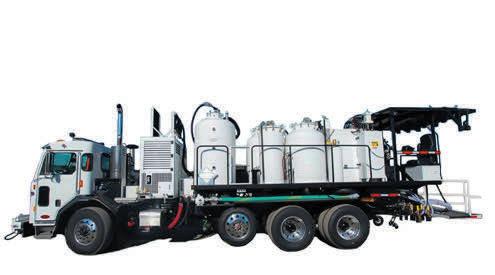
EASY AS Blow Cut-in Apply NEAL’s innovative Pavement Preservation Package provides game-changing efficiency on both detail and high-volume sealcoating. Our versatile DA 350’s blower and cut-in attachments complete detail work up to 7 times faster. While our High-Volume Road Maintenance Vehicle’s high material output makes short work of large surface areas. High-Volume Productivity You Can Count On TALK TO OUR EXPERTS: 770-637-6499 // WWW.NEALEQUIP.COM
Announcing the 2023 Pavement Top Contractors
The industry continues to grow and see financial success despite inflation, supply chain, and labor woes.


The 2023 Top Contractor results are in, and for the second straight year the data shows an increase in overall sales, while the number of participating contractors remained about the same as last year, resulting in lists of top 50 (as in 2022) instead of the usual 75 included in years past. The number of entries is still encouraging, however, considering that the application process underwent its biggest transformation ever.
For the first time, entries were taken only through an online submission process on our website, ForConstructionPros.com, and it will be the method going forward from this point on. Hopefully, this means that next year we will have enough participants to bring the lists back up to their original qualifying size.
The next submission window will open in the month of December 2023 and then remain open through sometime in March 2024. The deadline date will be more definitive once we get closer. You should make a note on your calendars if you missed the opportunity this year, but another thing you can do, is go and sign up for our newsletters on the website. If you're already receiving them, make sure to open them up every month when they pop into your inbox, because we make sure to send out many notices, as well as links directly to the online application.
For the 2023 Pavement Top 50 Contractors, total sales dollars dipped slightly from last year, however, based on the complete data, the industry appears to still be in a growth period
despite the effects of inflation depressing the economy in many ways, continued supply chain issues driving up material costs, and labor shortages causing headaches for everyone. For context, the growth illustrated in this data is partly due to reviewing one segment in particular, which you will see may have skewed the results somewhat.
OVERALL SALES DOLLARS

We open up our analysis with overall sales dollars of the qualifying contractors, which reached more than $1.544 billion. When compared to last year's total of $1.674 billion, and $1.096 billion in 2021, it represents an approximate contraction of 8.5% versus the abnormally large 62% growth the year before. While some might see this year's figure in a negative light, it still
represents a step in the right direction when you take into consideration the proper economic context.
That overall sales number represents the combined total of the segmented sales data for paving-only, sealcoatingonly, striping-only, and repair-only work. In other words, it is comprised of the sales figures used to compile our four qualifying lists. No sales dollars are duplicated, and sales in the "other" category are also excluded from this sum.
When you consider the effects of severe inflation experienced by the country in 2022, it's actually surprising that the apparent market contraction wasn't steeper. The previous year’s 62% growth was an outlying figure, partially due to pandemic "rebound" and wasn't expected to repeat. It may be the market selfcorrecting. However, there are economic
8 PAVEMENT MAINTENANCE & RECONSTRUCTION | June/July 2023 | www.ForConstructionPros.com/Pavemen t
signifiers to be very optimistic about. For instance, when it comes to total sales 2023 (which does take into account income from outside the four main categories) companies did quite well compared to 2022:
• Paving 50: $1.723 billion in total sales compared to $1.337 billion
• Striping 50: $1.583 billion in total sales compared to $1.132 billion


• Sealcoating 50: $1.59 billion in total sales compared to $1.61 billion


• Pavement Repair 50: $1.672 billion in total sales compared to $1.22 billion
Three out of four Top 50 lists saw significant total sales growth over last year, and the dip in sealcoating numbers is small enough that it could simply be that a handful of big sealcoating contractors didn't know to submit through the new application process. Compare this to the segmented-only sales data for 2023 versus last year:
• Paving-only sales increased to $913,190,892 from $742,226,477


• Striping-only sales dropped drastically to $129,954,003 from $534,425,922
• Sealcoating-only sales jumped to $186,110,524 from $150,346,312

• Pavement Repair-only sales increased to $315,056,146 from $247,572,610


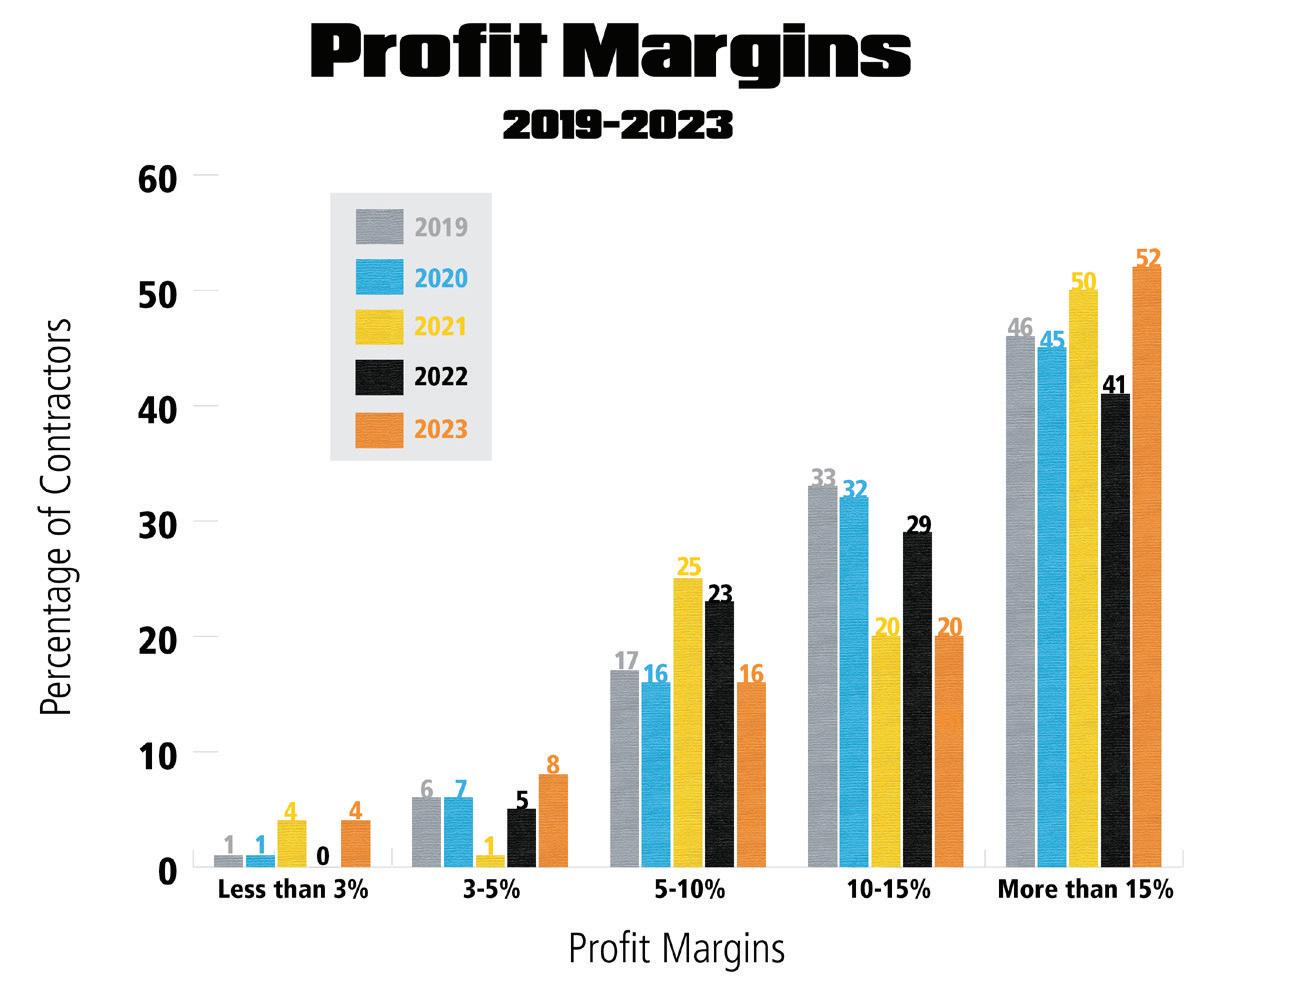
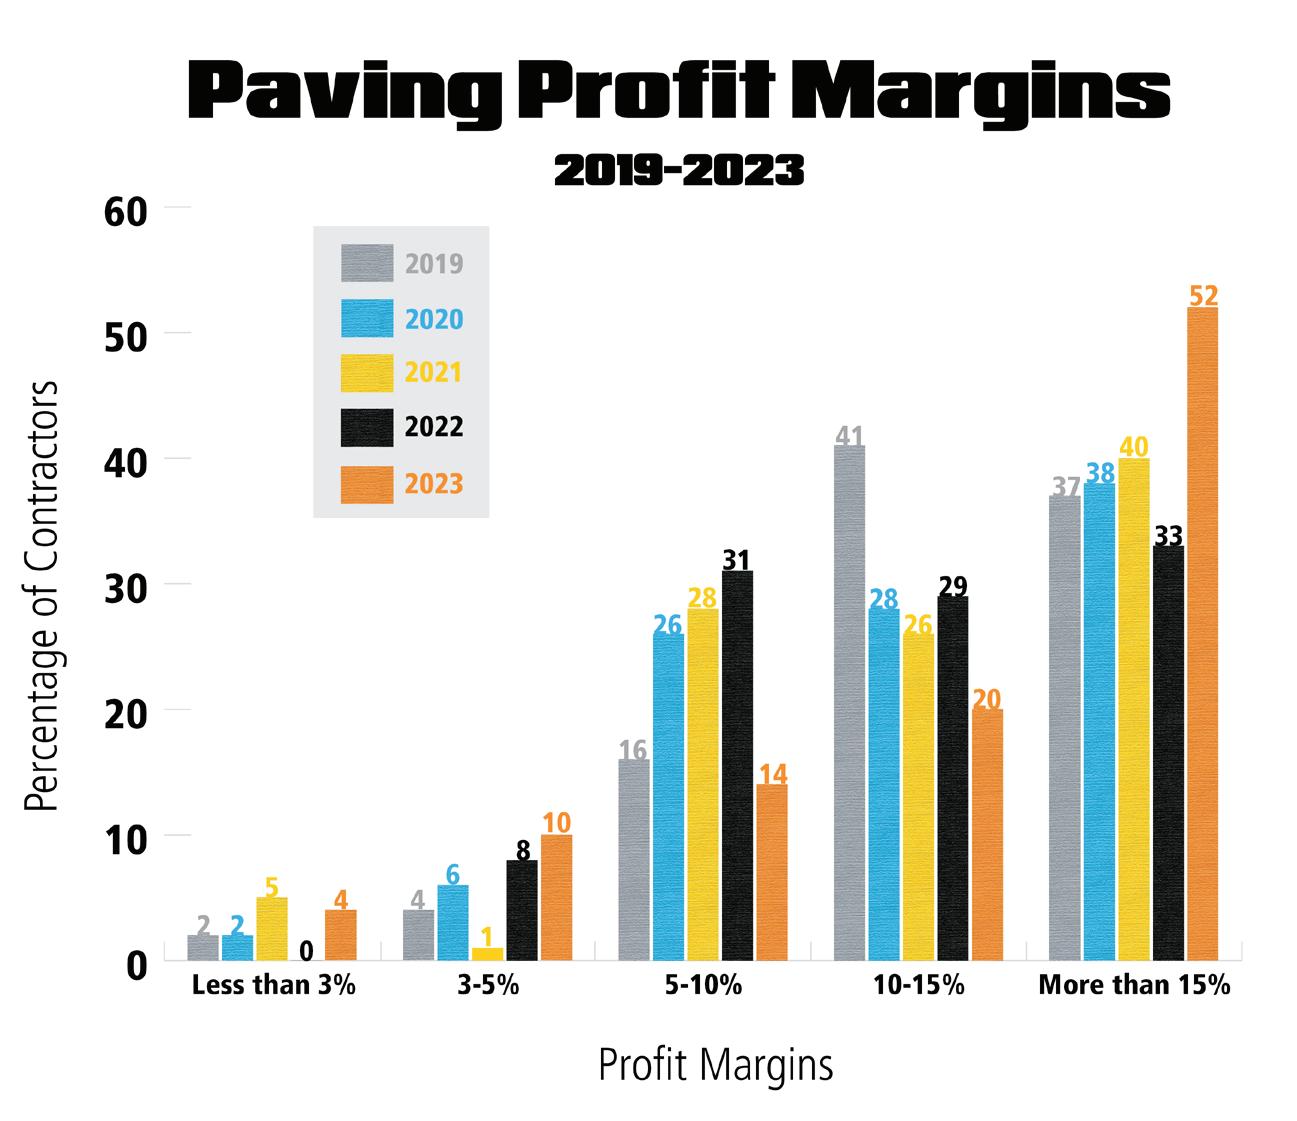
Reported profit margins [see graph] were higher than they've been in the last five years for those earning at the top or bottom of the margin curve. Those reporting greater than 15% margins increased to 52% over just 41% a year ago. For middle margin earners, there was nearly a 10% drop off in the 10-15% margin group, and 7% decrease in those reporting 5-10% margins. However, the amount of contractors who's margins were less than 5% were the highest they've been.
THE "AVERAGE" TOP 50 CONTRACTOR
The overall total sales, including the "other" category outside the main four, came to $1.757 billion, and the average contractor generated just over $35 million in annual sales ($23 million last year and $14 million in 2021) from a diversified mix of paving and pavement
maintenance work. This figure is a 34% increase in per-contractor sales, on average, over last year. The average revenue by segment breaks down like this:
Paving: 58% (62% last year)
Striping: 20% (18%)


Sealcoating: 22% (25%)

Pavement Repair: 20% (19%)
Surface Treatments: 2% (3%)


Other: 12% (11%)

By a fairly wide margin, concrete work is the most commonly cited service that contractor's provide in the answer box for "other.” This article has been edited for length.


Full details for the 2023 Top Contractors online. https://pavemg. com/2022TopContractor

www.ForConstructionPros.com/Pavemen t | June/July 2023 | PAVEMENT MAINTENANCE & RECONSTRUCTION 9
www.starseal.com 800-759-1912 Experts in Sealcoatings Simply the BEST Simply the BEST Ready To Use Asphalt Crack Filler. • Pour • Squeegee • Trowel THE WORKING T OGETHER The ULTIMATE PROTECTION
2023 Paving Top 50 Contractors: Boomtown Business
Paving-only sales for the Top 50 Contractors saw an explosion of growth, increasing by more than $170 million from 2022, nearly three times the increases between previous years.
The 2023 Paving Top 50 contractors generated $913,190,892 in paving-only sales, which is an astronomical level of increase over the 2022 total, which topped out at $742,226,477. Just to give you an idea of where things are, the last year that the qualifying list was made up of 75 companies, the paving-only sales figure reached $832 million, more than $100 million shy of this year’s numbers with 25 fewer companies.
Without more detailed market information, it is difficult to put a real button on what the exact driving factor behind this growth really is. The temptation is to assign a lot of the ballooning figures to the rising overall price of having paving work done. The price of asphalt, diesel, labor, and just about everything else, is much higher than in years past. However, more than half of the Paving Top 50 contractors reported greater than 15% profit margins, which makes it slightly difficult to pin it all on costs.
In last year's summary of the Top Contractor results, previous editor Jessica Lombardo theorized that the large $60 million jump in that survey
could have been due to larger paving projects that were put on hold through the post pandemic season, and which were all finally coming through. If we accept that premise, and expand upon it, perhaps, that was just the tip of the iceberg. Delayed projects couldn't be delayed any further. One outlying thought was a boost in government funds, but, as you'll see, the percentage of municipal paving work wasn't particularly high.

Paving-only sales remain undefeated when compared to the other industry segments, the closest being pavement repair-only sales at $315,056,146 ($247 million in the previous year), followed by sealcoating-only sales at $186,110,524 ($150 million last year), and striping-only sales coming in at $129,954,003.

TOTAL SALES FOR THE PAVING 50
The total sales for all the work our 2023 Paving 50 contractors completed was $1.723 billion, a nearly $400 million jump from last year's $1.331 billion (Top 50), but even more significant may be that it is a jump from both the 2021 total of $1.336 billion (Top 75), as well as 2020's previous high of $1.611 billion (Top 75). Devoid of economic context, the numbers themselves appear to show a steady and healthy marketplace, but we know that the economy remains highly volatile and unpredictable.
This year's paving-only sales represent just 58% of the total list sales, which is a small step down from the 62% reported last year. The remaining 42% of sales comes from a diverse amount of other work the Paving 50 conduct:
10 PAVEMENT MAINTENANCE & RECONSTRUCTION | June/July 2023 | www.ForConstructionPros.com/Pavemen t PAVING
50
Learn more at www.LeeBoy.com
• 45 companies perform sealcoating services
• 44 companies do striping work, up from 39 in 2022
• All but one of the Paving Top 50 companies do repair work
Contractors who derive a majority of their sales from paving certainly are doing more diverse work than ever before, in fact, only a single company on the list of qualifiers derived all of their sales revenue from paving alone. Keep in mind that a majority of companies on this list still generated the vast majority of their sales from paving specifically.
PROFIT MARGINS

As the chart details out, contractors profit margins within the 2023 Paving 50 are stronger than ever before, while the mid-tier profit ranges saw a slight dip across the board. Drops of 9% (1015% profit range) and a whopping 17% (5-10% profit range) were redistributed at both end of the spectrum, suggesting that jobs were much more profitable in general, as well as, a rise in higher volume of lower margin work.
• The percentage of Paving 50 companies reporting margins greater than 15% exploded to 52%, a radical
rate of growth at 19% more than last year's 33%, and higher even than the previous peak year of 2021 at 40% of companies
• Contractors reporting margins of 10-15% tanked down to 20%, down from 29% last year
• Contractors within the 5-10% profit margin range dropped from 31% to just 14%, the biggest categorial drop at 17%
• On the bottom end of the ranges, 10% of contractors reported 3-5% margins, which continues a trending upwards from 1% in 2021 and 8% in 2022.
• 4% of contractors reported less than 3% profit margins, which is more than last year's 0%, but less than 2021's 5%
An interesting correlate is that of the 26 companies that reported greater than 15% profit margins, 16 also reported having completed more than 400 jobs in the year. With more than half of qualifiers being top earners, one might draw the conclusion that those who are making the highest gains are also completing the most number of jobs.
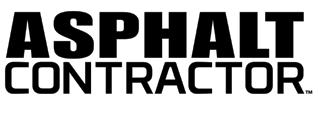
TYPES OF JOBS THE PAVING 50 COMPLETED
• All 50 companies report sales from parking lot work (the lowest being just 8% of their sales) which, once again, makes this the largest type of work that the Top 50 do.
• All Paving 50 report more than 5% of this type of work, equalling 67% of their work
• 35 companies reported at least some streets and roads work, one greater than last year, but the percentage of work dropped from 64% down to just 23%
• 34 companies reported working on driveways, up from 21 last year, but only at 17% versus 48% in 2022
• Nine companies reported doing some

form of highway work, same number as last year, but the percentage of total work rose to 8% from 5%
• Eight companies listed "other" work, averaging 22% of their makeup, the largest single type being that of excavation/site work

WHO THE PAVING 50 WORKED FOR?
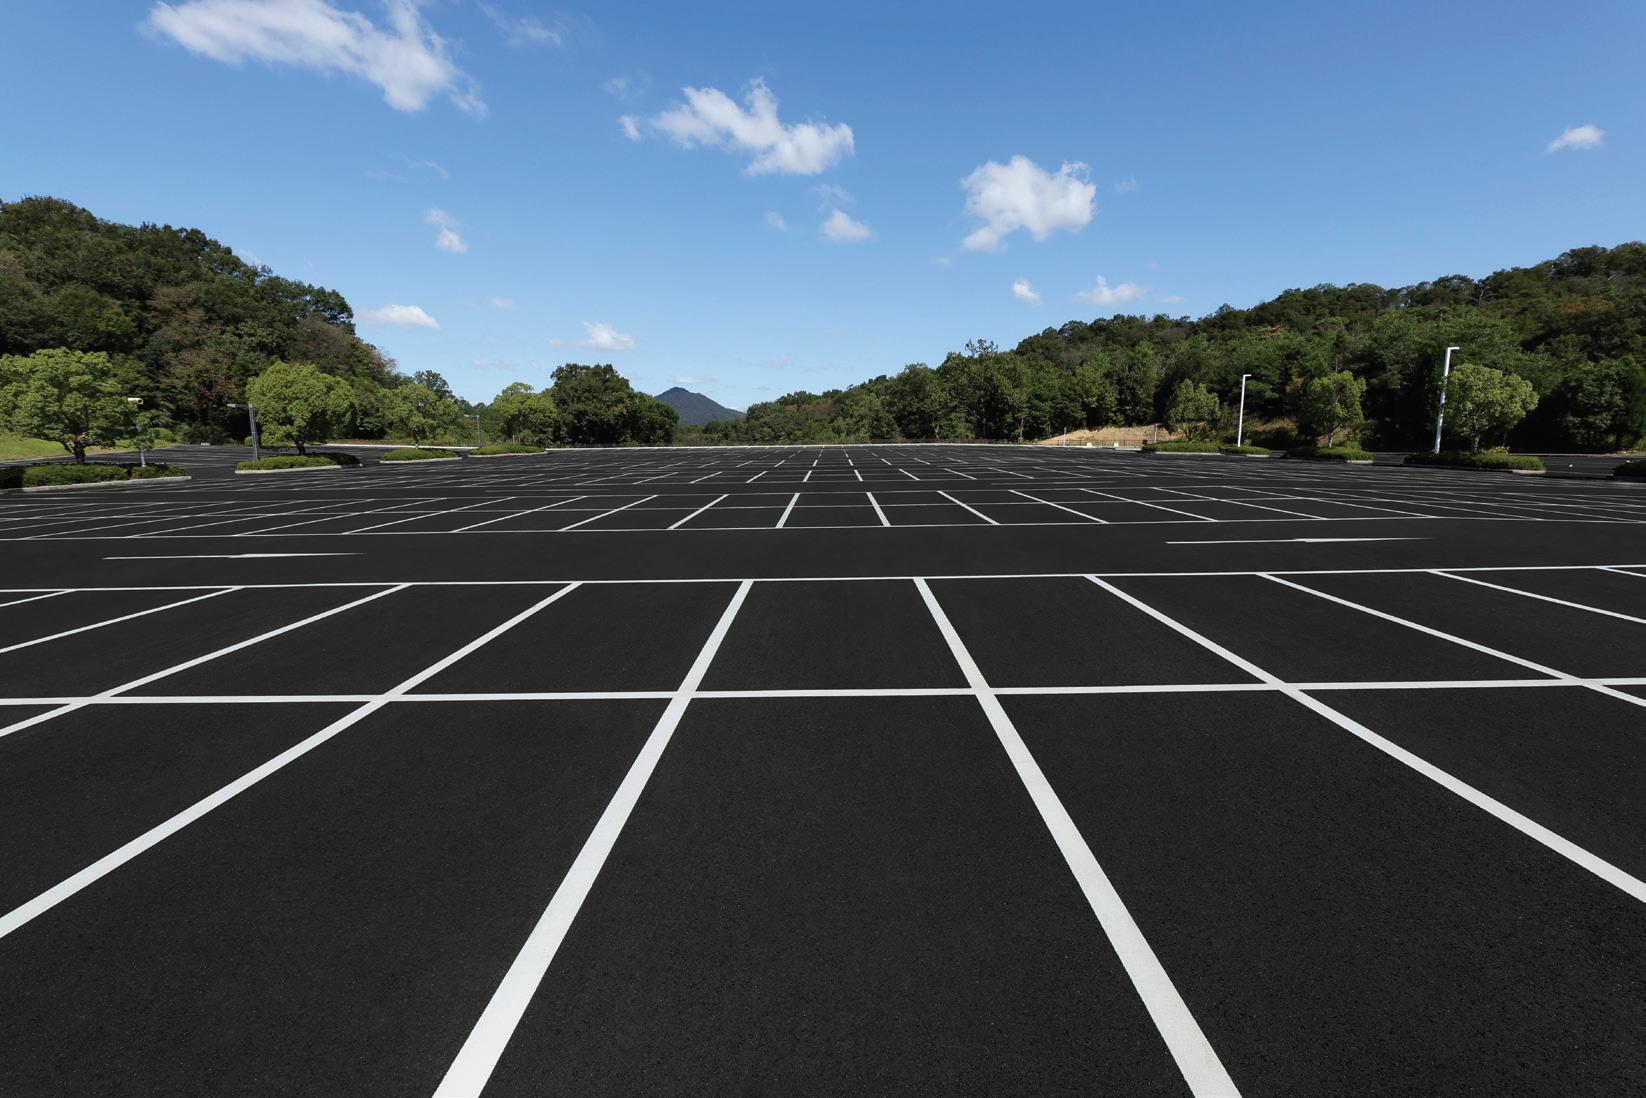
All 50 contractors completed at least 5% or more of their work for commercial/ industrial customers
• 44 contractors reported working for multi-family/HAO residential customers
• 36 contractors worked for municipal clients
• 22 contractors worked for singlefamily residential customers
• Despite an unpredictable economy and significant changes to costs and completion times, the figures are pretty consistent with trends from previous years.
REPLACING THE EQUIPMENT IN THE TOP 50'S FLEET
Perhaps, most unsurprisingly, the number of contractors whose fleet now surpasses our benchmark of $2 million to replace has grown from 33 last year, to 36 this year. This trend will likely only continue apace, due to the increasing expensive nature of the paving industry equipment, its maintenance, as well as new capital investment. Ten companies reported it would require between $1 and $2 million, only two companies said it would require between $500,000 and $1 million, while zero contractors claimed between $250,000 and $500,000; however, two final entries reported it would take less than $250,000 to replace their fleets. ■
For more information visit https://pavemg.com/ ujjxh6
12 PAVEMENT MAINTENANCE & RECONSTRUCTION | June/July 2023 | www.ForConstructionPros.com/Pavemen t PAVING 50
Adobe Stock/Stockr
YOUR PARTNER ON THE ROAD AHEAD


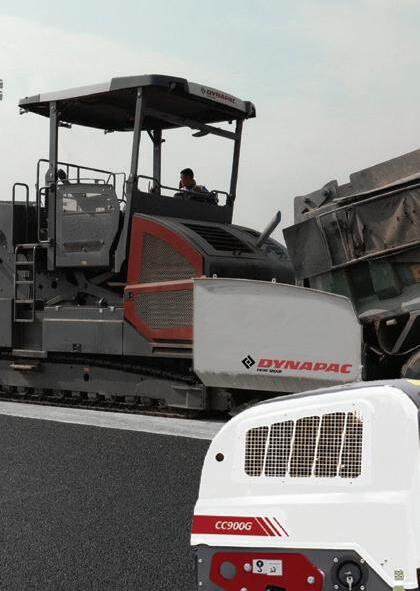


What does that mean? It means that we are determined to support you in your journey towards greater profitability, safety and environmental stewardship. It means that we will help you forge new paths, shape key trends and offer new solutions to support you on that journey. And it means we will be with you for every step of that journey through application consultancy, personalized trainings; across numerous geographic territories and around the clock.


Tell us where you’re going and we will help you get there.


800-651-0033 Follow Dynapac North America
14 PAVEMENT MAINTENANCE & RECONSTRUCTION | June/July 2023 | www.ForConstructionPros.com/Pavemen t PAVING 50 Year in Business Sales Composition (%) Where We Work (%) Customer Mix (%) Paving Sealcoating Striping Sweeping Pavement Repair Other Highways Streets/Roads Parking Lots Driveways Other Commercial Municipal Multi-family Single-family Other A&A Paving - Roselle, IL 63 60 5 1 13 21 0 20 80 0 0 70 0 30 0 0 0 ACI ASPHALT & CONCRETE, LLC - Maple Grove, MN 32 62 8 2 11 17 0 0 90 10 0 80 5 15 0 0 0 All Out Services llc DBA All Out Parking LotsBroomall, PA 11 29 1 3 12.2 55 0 0 99 1 0 100 0 0 0 0 0 American Asphalt Repair & Resurfacing Co., Inc.Hayward, CA 40 40 8 4 21 17 0 45 53 2 0 48 10 40 2 1 0 Area Asphalt Inc - Eden, WI 38 85 10 1 4 0 0 5 50 45 0 40 10 10 40 0 0 Associated Paving Contractors Inc.Warminster, PA 51 90 5 3 3 0 0 15 75 10 0 50 45 0 5 10 0 Atlantic Southern Paving & SealcoatingSunrise, FL 35 45 15 5 15 18 2 35 60 3 0 40 15 15 3 0 0 Birmingham Sealcoat, Inc. - Oxford, MI 19 58 8 1 1 32 0 10 85 5 0 83 5 10 2 60 0 Blackjack Paving - Fairburn, GA 15 45 13 6 25 11 0 10 85 5 0 50 10 35 5 10 10 Brahney Paving / www.FIXASPHALT.com - Wall, NJ 22 48 40 2 10 0 0 0 98 2 0 88 0 10 2 1 0 Brothers Paving and Concrete - Manassas, VA 34 72 2 5 2 18 0 12 83 5 0 41 1 55 3 2 0 C & R Asphalt, LLC - Lexington, KY 29 77 13 3 1 6 0 4 86 4 6 81 0 11 3 3 4 DACS Asphalt & Concrete - Denver, CO 9 40 12 5 15 28 0 10 85 5 0 85 0 15 0 5 0 Daniel B. Krieg, Inc. - Harrisburg, PA 90 47 8 1 1 39 38 11 20 4 27 12 79 4 1 5 0 DC Construction Services, Inc. - Pendleton, IN 10 64 5 1 1 29 0 38 61 1 0 46 44 10 0 0 0 Deziel Paving - Thomaston, CT 30 100 0 0 0 0 0 0 10 90 0 10 0 0 90 0 5 Dominion Paving & Sealing - Purcellville, VA 41 59 8 3 27 3 0 30 70 0 0 30 0 70 0 4 0 Eosso Brothers - Farmingdale, NJ 30 66 8 3 5 18 1 74 20 5 0 5 3 90 2 0 0 Erickson Asphalt - Princeton, MN 33 74 15 1 5 5 0 0 10 90 0 10 0 5 85 0 0 Erickson Asphalt - Princeton, MN 33 70 15 5 10 0 0 5 25 70 0 50 0 30 20 0 0 Finley Asphalt & Concrete - Bristow, VA 58 40 3 2 45 10 1 18 78 0 3 17 40 40 0 5 0 Hartford Paving Corporation - Johnston, RI 49 47 0 0 15 38 0 38 8 0 54 10 20 2 0 65 0 Intercounty Paving Co Inc - carmel, NY 68 65 0 2 8 25 0 50 20 1 29 25 50 25 0 0 2 Kansas Asphalt, Inc. - Bucyrus, KS 20 50 7 4 39 0 0 2 93 5 0 83 2 10 5 0 0 Laurel Asphalt - Windber, PA 27 78 6 5 7 4 5 10 39 46 0 37 16 2 45 0 0
RAISING THE STANDARD

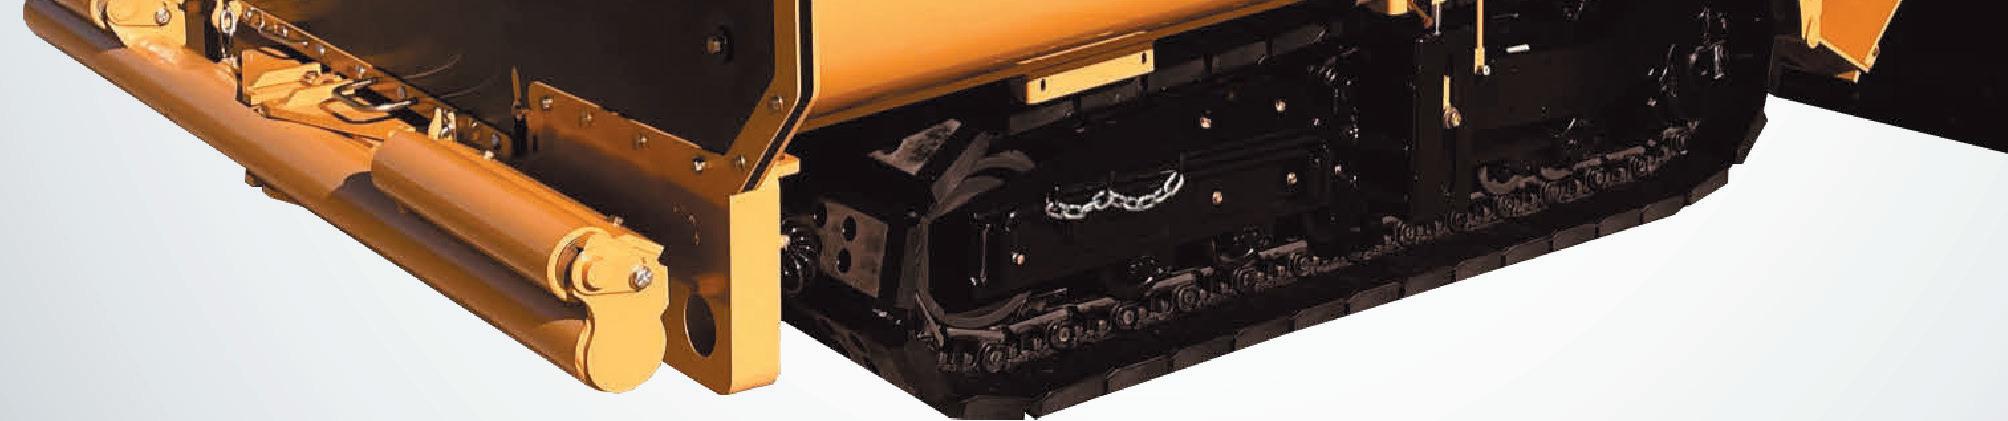

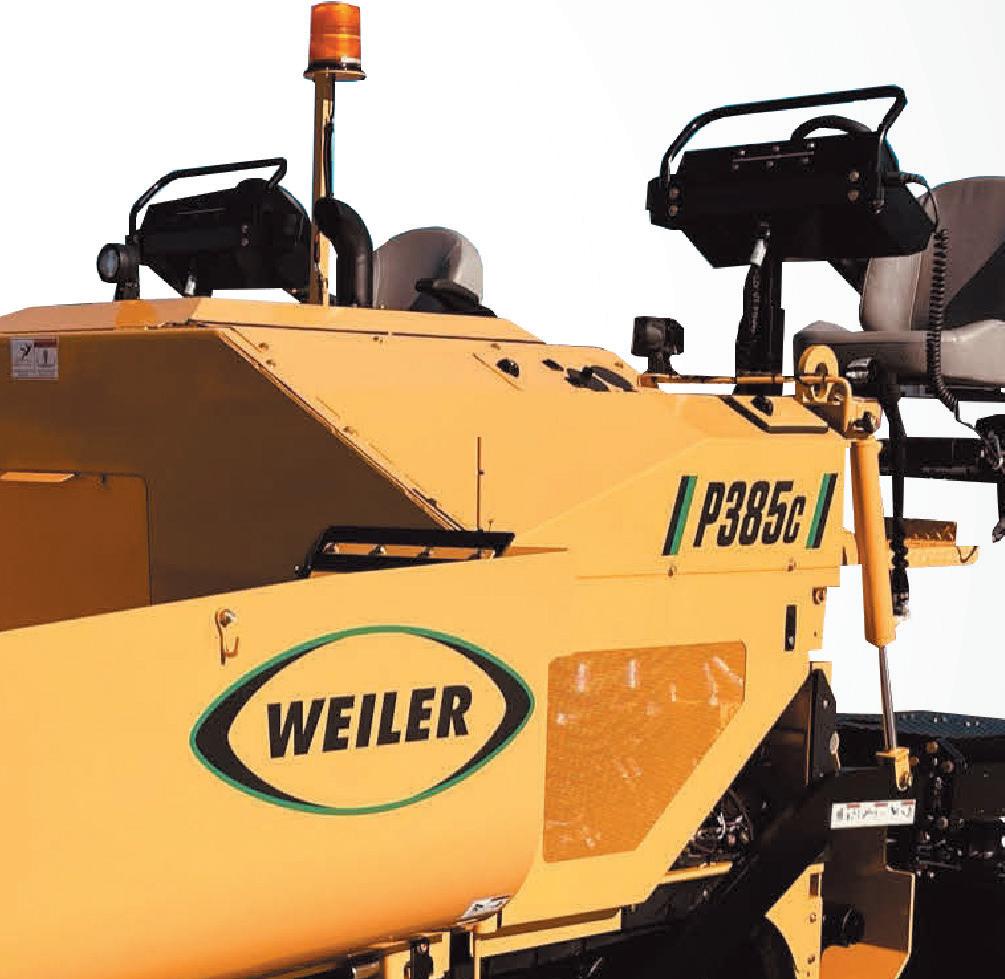
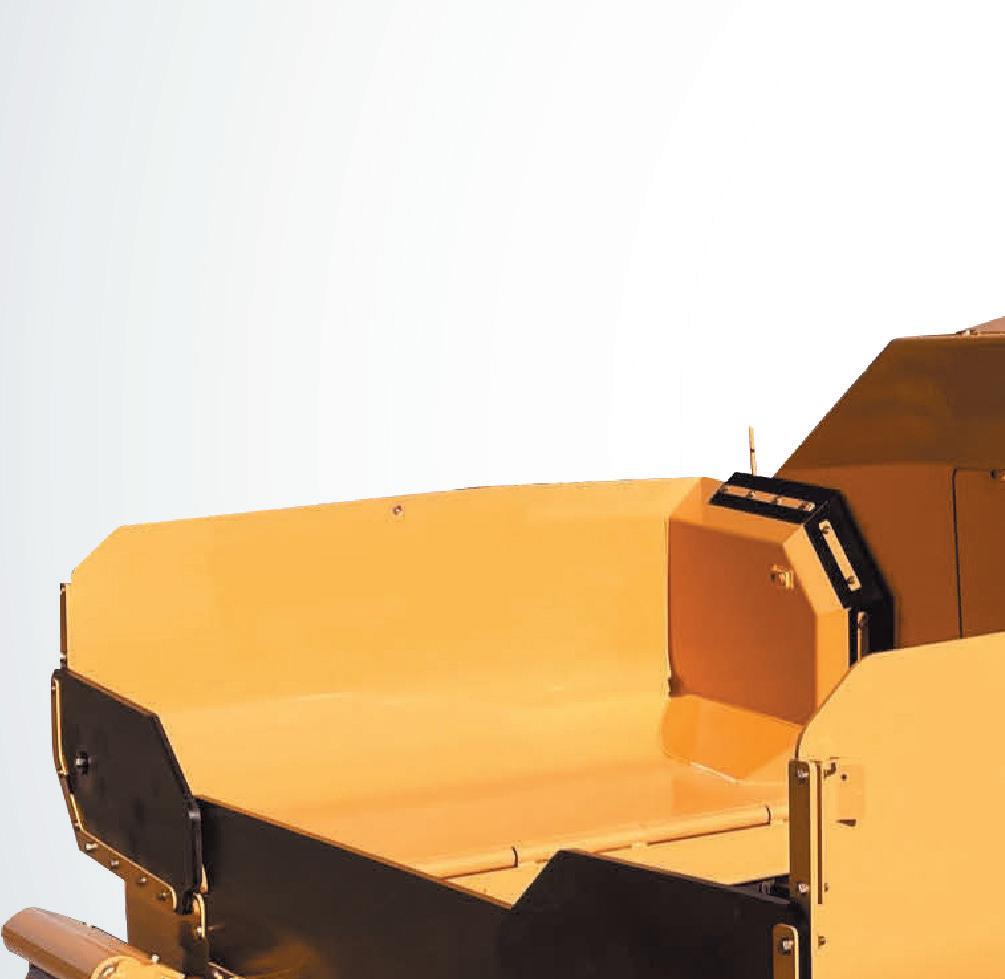
weilerproducts.com Since its introduction, the Weiler P385 has set the standard for commercial pavers. The P385C raises that standard.
Increase to 120 hp with the Cat® C3.6 Tier 4F/Stage V engine. Variable speed and reversible conveyors and augers and a 25% increase in tunnel height provide optimal material output. Modular conveyor drive and sealed chain case increase feeder system reliability and life. Enhanced heat system performance with direct-drive hydraulic generator and elimination of GFCI breakers.
16 PAVEMENT MAINTENANCE & RECONSTRUCTION | June/July 2023 | www.ForConstructionPros.com/Pavemen t Year in Business Sales Composition (%) Where We Work (%) Customer Mix (%) Paving Sealcoating Striping Sweeping Pavement Repair Other Highways Streets/Roads Parking Lots Driveways Other Commercial Municipal Multi-family Single-family Other PAVING 50 Luizzi Asphalt Services - Albany, NY 15 75 10 5 5 5 0 0 90 10 0 85 10 0 5 40 5 M&D Blacktop Co. - Grove City, OH 59 70 15 5 10 0 0 0 90 5 5 80 10 10 0 2 0 M&M Asphalt Maintenance, Inc. DBA All County Paving - Delray Beach, FL 35 60 20 10 10 0 5 60 35 0 0 35 35 25 0 44 0 Maul Paving, Inc - Plainfield, IL 23 64 15 5 16 0 0 10 89 1 0 69 10 20 1 5 0 O’Leary Asphalt Inc. - Ijamsville, MD 38 70 10 10 5 0 0 25 50 25 0 40 10 40 10 0 0 Paramount Asphalt & Sealcoating CorporationNaples, FL 7 35 15 40 10 0 0 50 50 0 0 50 20 30 0 0 17 Pavement Solutions, LLC - Richmond, IL 21 44 12 28 10 6 0 15 45 40 0 60 5 10 25 0 0 Rabine - Schaumburg, IL 42 60 2 3 15 20 0 10 90 0 0 99 0 1 0 0 0 Rose Paving - Bridgeview, IL 49 52 10 6 23 0 0 0 100 0 0 75 0 25 0 35 0 Ruston Paving Co., Inc. - Durham, NC 80 68 0 0 30 2 0 0 100 0 0 75 10 15 0 50 0 SEAL-O-MATIC PAVEMENT SOLUTIONS INC. - Olathe, KS 10 26 15 0 49 0 0 45 50 5 0 80 10 8 2 0 0 Sipes Asphalt & Concrete - Indianapolis, IN 10 30 15 5 25 25 0 0 100 0 0 90 0 10 0 0 0 Smooth Paving - Mundelein, IL 16 81 12 0 7 0 0 10 90 0 0 82 10 8 0 0 0 Stasi Brothers Asphalt & Masonry - Westbury, NY 61 40 5 5 10 40 0 20 60 20 0 50 20 20 10 0 0 Steed Paving - Jackson, SC 9 60 20 10 10 0 10 20 50 20 0 40 40 10 10 2 0 Suburban Asphalt Co., Inc. - Franklin, WI 58 70 13 2 15 0 0 0 95 5 0 70 0 25 5 0 0 Superior Blacktop Services - Summerville, SC 10 40 25 5 25 5 0 10 90 0 0 40 20 40 0 0 0 T&K Asphalt Services, Inc. - Whitman, MA 35 50 8 2 13 26 0 5 94 1 0 65 4 30 1 10 0 The Pavement Group, Inc - Wexford, PA 5 53 8 5 12 22 0 0 100 0 0 100 0 0 0 0 0 THE PAVING LADY - Boynton Beach, FL 37 55 25 5 10 5 0 60 40 0 0 55 10 35 0 0 0 The Surface Masters, Inc. - Marietta, GA 12 77 10 4 4 5 0 0 100 0 0 63 22 15 0 0 0 U.S. Pavement Services - Woburn, MA 39 35 25 15 10 5 0 0 95 5 0 70 10 15 5 2 0 United Paving Co. - Corona, CA 23 40 20 10 30 0 1 24 70 1 4 60 5 20 5 5 0 Valley Blacktopping, Inc. - Eagan, MN 47 96 0 0 2 2 0 0 60 40 0 40 5 15 40 2 0 Van Etten Contracting LLC - New Windsor, NY 19 40 0 0 10 50 10 10 30 0 50 90 10 0 0 25 0


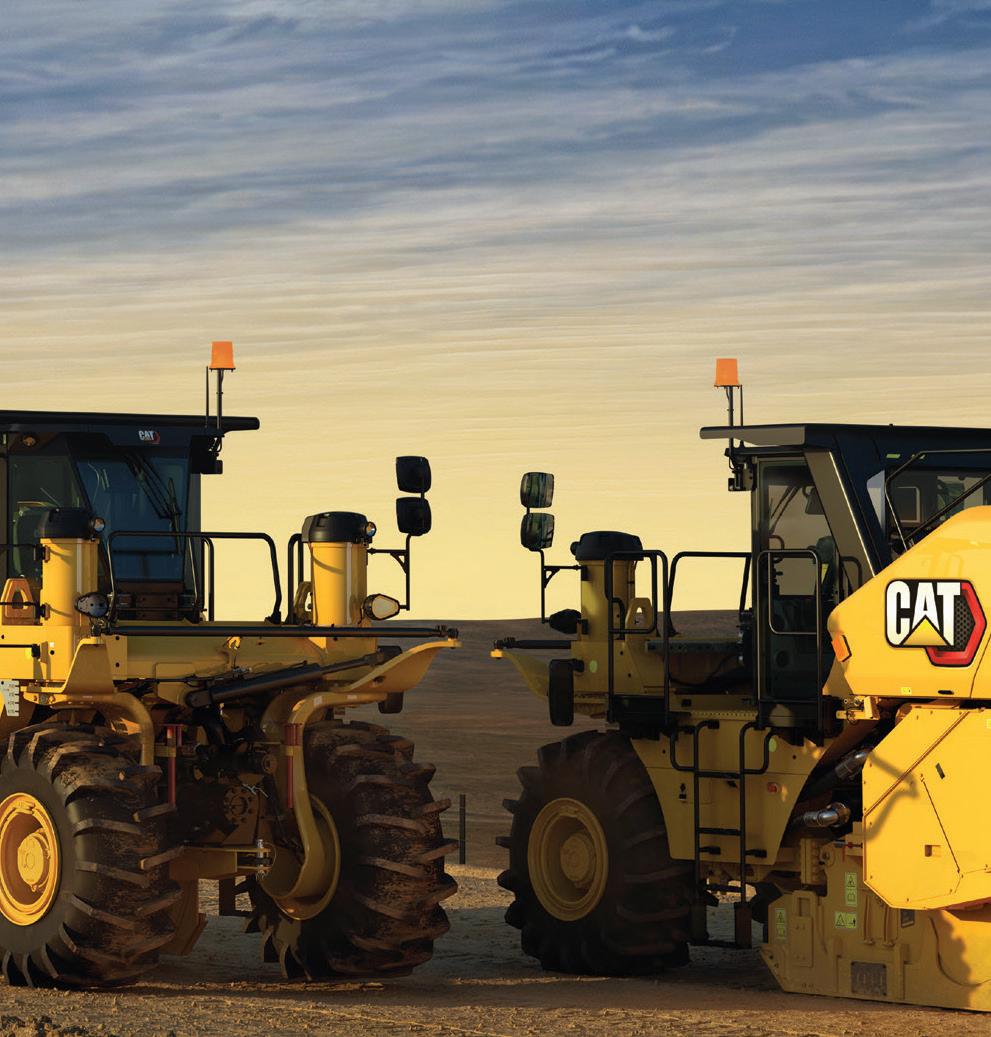


EVEN MORE POWER TO PULVERIZE © 2023 Caterpillar. All Rights Reserved. CAT, CATERPILLAR, LET’S DO THE WORK, their respective logos, “Caterpillar Corporate Yellow,” the “Power Edge” and Cat “Modern Hex” trade dress as well as corporate and product identity used herein, are trademarks of Caterpillar and may not be used without permission. Introducing Cat® RM600 and RM800 road reclaimers/stabilizers: Featuring an all-new Caterpillar design loaded with power, technology and operator features to keep you productive all shift long. Visit cat.com/morepower for more information.
2023 Sealcoating Top 50 Contractors: Hitting the Ceiling?
The Sealcoating Top 50 grew by $36 million in sales, possibly indicating that a growth plateau has been reached.
Sealcoating-only sales for the 2023 Sealcoating 50 totaled $186,110,524 compared to last year's $150 million, and $108 million in 2021. This signifies the completion of sealcoating segmented sales recovery to pre-pandemic levels, even with a smaller qualifier list of 50 instead of the 75 in 2020 that generated $161 million. This year's growth of $36 million (approximately 19% in gains) isn't as high as last year's jump of $42 million in sales, but isn't so far off to be considered anomalous.


From a historical perspective, sealcoating-only sales have experienced very high peaks in the past several years. While this year's $186 million is the highest total in the last five years, it is dwarfed by the 2016 ($201 million) and 2015 ($249) sales totals. Those figures were seen as a bit unusual, even at the time, and possibly due to adjacent market factors, but the current status seems to indicate a "normal" representation or ceiling of regular growth.
While the Sealcoating-only segmented sales previously sat in last place compared to the other three stand-alone categories, this year the Sealcoating 50 trail only paving and pavement repair. Listed from highest revenue per segment to lowest, paving-only sales are at $913 million ($742 million last year), pavement repair-only sales is at $315 million
($247 million last year), sealcoating, and then, lastly, striping-only is at $129 million ($534 million* last year).
*Last year's reported striping totals were skewed by data later deemed inaccurate.
TOTAL SALES FOR THE SEALCOATING 50
Total sales for all the work completed by the 2023 Sealcoating 50 was $1,590,214,734 in total sales compared to $1,601,293,233 in 2022. A small drop of approximately $11 million dollars, and a market contraction of approximately 0.7%, while still significantly topping the 2021 total of $930 million, may signal the sector remains in a good economic state.
Interestingly, however, sealcoatingonly sales represented just 22% of the overall sales of the Sealcoating 50, down
from the previous two year's of 25% and 24% respectively, though fairly close in range. The remaining sales represent a diverse mix of pavement maintenancerelated work including:
• 48 companies perform striping work
• 45 companies perform pavement repair work
• 44 companies perform paving work
None of the 50 qualifying companies on the list perform exclusively sealcoating work, however, three did generate 90% of sales from sealcoating-only work.
BIG BOOST TO PROFIT MARGINS
Last year's report was that profit margins were relatively steady. The previous four stats on contractors reporting more than 15% margins
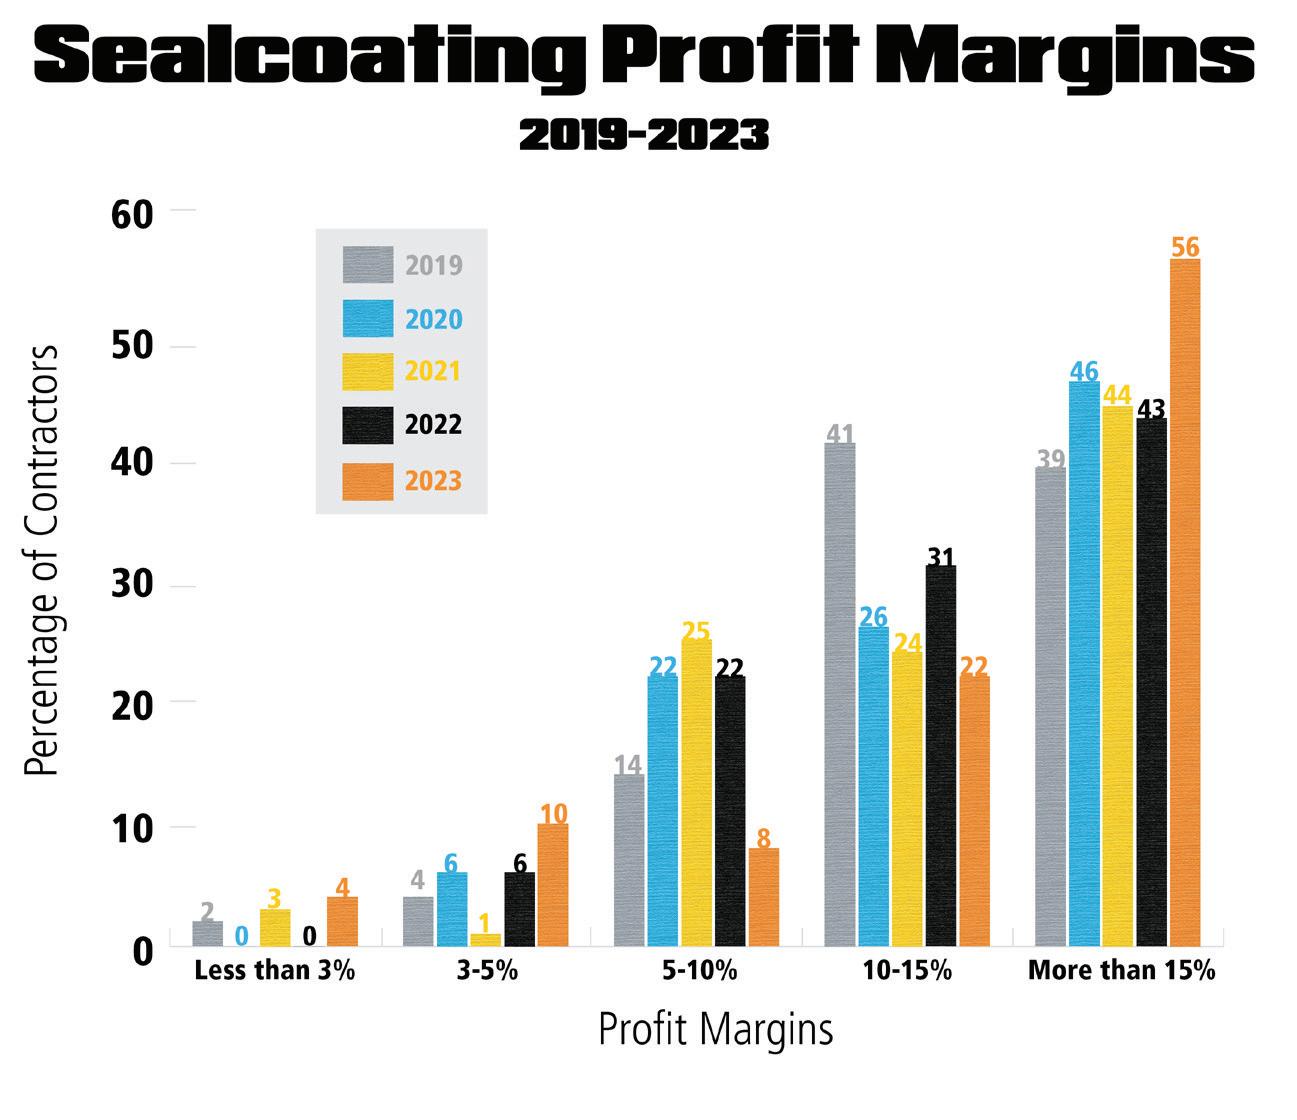
18 PAVEMENT MAINTENANCE & RECONSTRUCTION | June/July 2023 | www.ForConstructionPros.com/Pavemen t
SEALCOATING 50 Sponsored by

to all of the finalists and top awarded contractors in the sealcoating category. Congratulations Make the most of your sealcoating projects. Visit Crafco.com
were 39% (2019), 46% (2020), 44% (2021), and 43% (2022). This year, the percentage of contractors reporting the highest margins rose by 13 points to 56%. This is a huge leap.
• 4% reported margins less than 3% (0% last year)
• 10% reported margins between 3-5% (6% last year)
• 8% reported margins between 5-10% (22% last year)
• 22% reported margins between 10-15% (30% last year)
• 56% reported margins of greater than 15% (43% last year)
Clearly, the two biggest shifts this year were at the top end, and right smack in the middle, 13 and 14 point shifts respectively. The other three ranges saw more modest changes. It's difficult to ascertain why these types of shift occurred, but, one thing is for certain, the sealcoating segment has become highly profitable for many more contractors.
WHERE THE SEALCOATING 50 WORK
It's no secret, nor surprise, that the vast majority of this work is located off-road, with every company in the Sealcoating 50 reporting at least some parking lot work. For that matter, 21 out of 50 companies (42%) reported that at least 90% of their time was spent working on parking lots. That has grown from steadily from 36% in 2022 and 24% in 2021.
The rest of the time, only 64% of companies reported generating sales from driveway work (up from 48% last year), 70% said they worked on streets (over the 52% last year), and 16% said they did some work on highways (rising from just 9% last year).
THE SEALCOATING 50'S CUSTOMERS
All 50 sealcoating contractors work for commercial/industrial customers
• 45 companies do work for multifamily residential customers
• 34 contractors work for municipal clients
• 23 contractors work for singlefamily residential clients
REPLACING THE SEALCOATING 50'S EQUIPMENT
In a somewhat surprising turn, nine different companies reported they could replace their fleets for less than $500,000. That represents a fairly low level of capital investment for a segment of the industry that is producing extremely high and consistent profit margins. The other 41 companies on the Sealcoating 50 said it would require more than $1 million, and 29 of those said more than $2 million to replace all their equipment. ■
For more information visit https://pavemg.com/ r6st3h
20 PAVEMENT MAINTENANCE & RECONSTRUCTION | June/July 2023 | www.ForConstructionPros.com/Pavemen t Year in Business Sales Composition (%) Where We Work (%) Customer Mix (%) Paving Sealcoating Striping Sweeping Pavement Repair Other Highways Streets/Roads Parking Lots Driveways Other Commercial Municipal Multi-family Single-family Other ACI ASPHALT & CONCRETE, LLC - Maple Grove, MN 32 62 8 2 11 17 0 0 90 10 0 80 5 15 0 0 0 Affordable Striping & Sealing, LLC - Las Vegas, NV 16 0 42 28 0 30 0 65 35 0 0 78 7 15 0 0 0 American Asphalt Repair & Resurfacing Co., Inc.Hayward, CA 40 40 8 4 21 17 0 45 53 2 0 48 10 40 2 0 0 Asphalt Sealers, Inc. - North Port, FL 9 0 90 5 5 0 0 70 30 0 0 40 0 60 0 0 0 Atlantic Southern Paving & SealcoatingSunrise, FL 35 45 15 5 15 18 2 35 60 3 0 40 15 15 3 18 0 B&G Sealcoating LLC - Endicott , NY 12 0 90 8 1 0 0 0 90 10 0 85 5 0 10 0 0 Sponsored by SEALCOATING 50
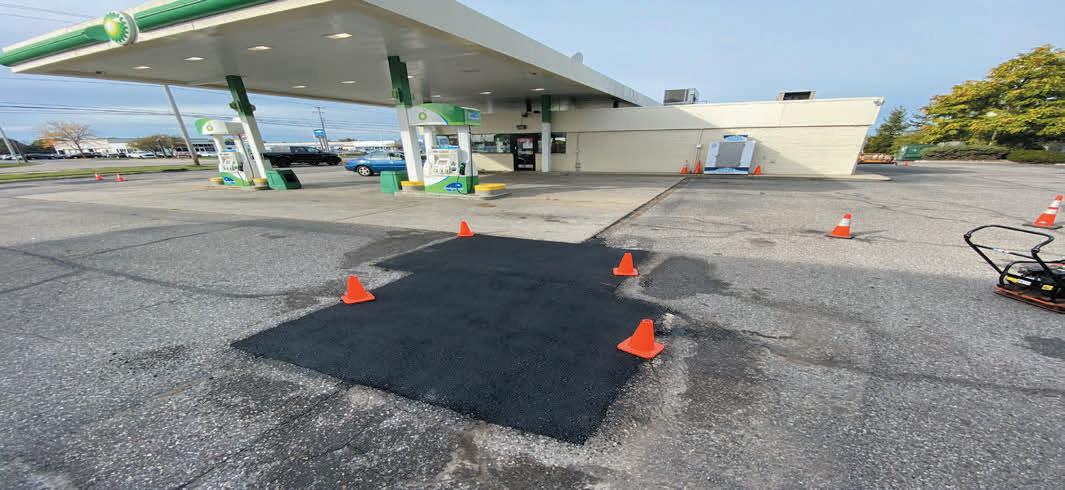

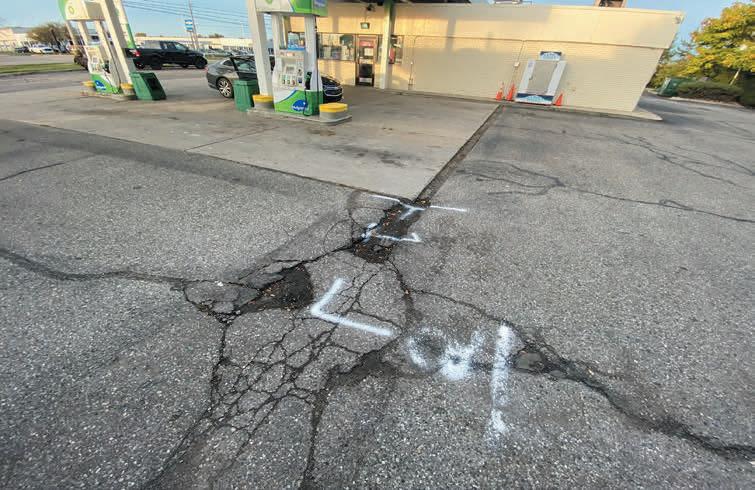
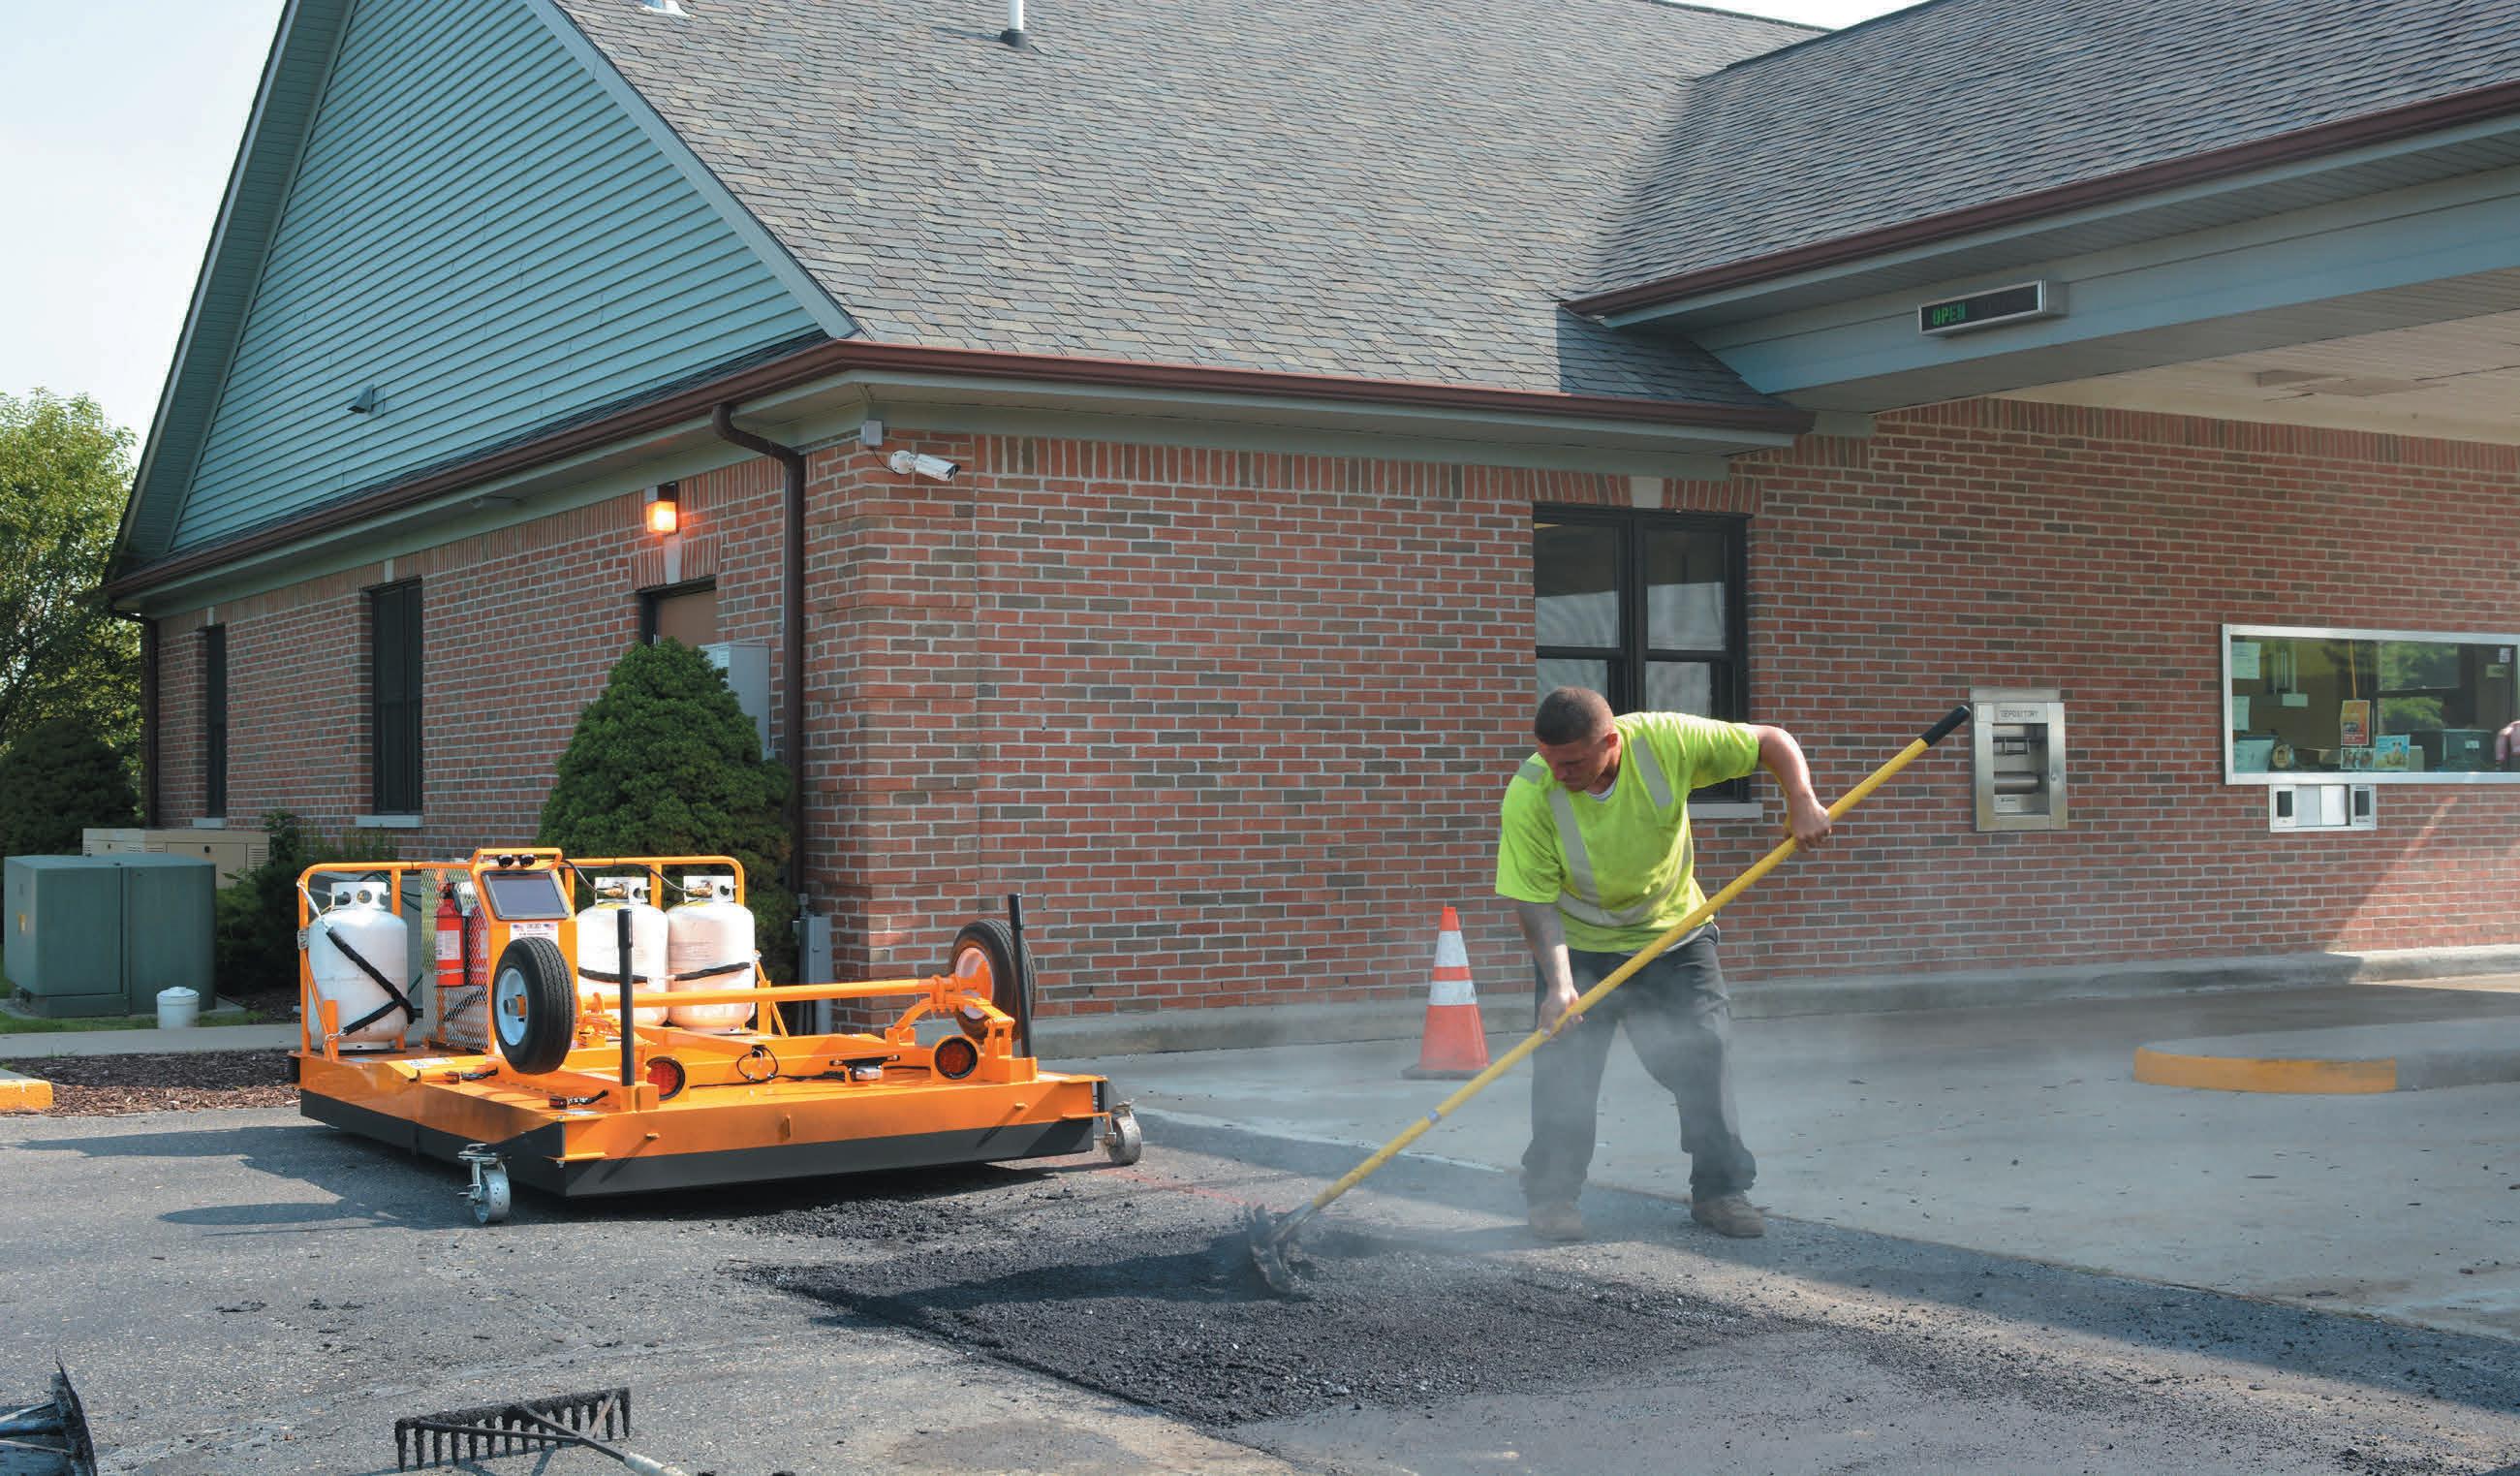
WE’RE HERE TO HELP! North Branch, MI 800-492-1757 sales@kminternational.com Common Infrared Uses Benefits of Using IR Pictured: KM 4-40 Infrared Recycler 1/3 The Time and Costs of Tradtional R&R Seamless, Thermally Bonded Repair READY TO TAKE YOUR BUSINESS TO THE NEXT LEVEL? LET KM HELP! Pothole Repair Oil Spots Paving Mistakes Storm Drain Damage Thermoplastic Installs Trip Hazards And Much More! Ability To Extend Working Season Generate $4-5K in revenue a day
22 PAVEMENT MAINTENANCE & RECONSTRUCTION | June/July 2023 | www.ForConstructionPros.com/Pavemen t Year in Business Sales Composition (%) Where We Work (%) Customer Mix (%) Paving Sealcoating Striping Sweeping Pavement Repair Other Highways Streets/Roads Parking Lots Driveways Other Commercial Municipal Multi-family Single-family Other Sponsored by Blackjack Paving - Fairburn, GA 15 45 13 6 25 11 0 10 85 5 0 50 10 35 5 0 0 Brahney Paving / www.FIXASPHALT.com - Wall, NJ 22 48 40 2 10 0 0 0 98 2 0 88 0 10 2 0 0 Brite Line Asphalt Maintenance, Inc. - Cartersville, GA 39 45 47 8 0 0 0 0 100 0 0 100 0 0 0 0 0 Brothers Paving and Concrete - MANASSAS, VA 34 72 2 5 2 18 0 12 83 5 0 41 1 55 3 0 0 C & R Asphalt, LLC - Lexington, KY 29 77 13 3 1 6 0 4 86 4 6 81 0 11 3 5 10 DACS Asphalt & Concrete - Denver, CO 9 40 12 5 15 28 0 10 85 5 0 85 0 15 0 0 0 Daniel B. Krieg, Inc. - Harrisburg, PA 90 47 8 1 1 39 38 11 20 4 27 12 79 4 1 4 0 DC Construction Services, Inc. - Pendleton, IN 10 64 5 1 1 29 0 38 61 1 0 46 44 10 0 0 0 Dominion Paving & Sealing - Purcellville, VA 41 59 8 3 27 3 0 30 70 0 0 30 0 70 0 0 4 Eosso Brothers - Farmingdale, NJ 30 66 8 3 5 18 1 74 20 5 0 5 3 90 2 0 0 Erickson Asphalt - Princeton, MN 33 74 15 1 5 5 0 0 10 90 0 10 0 5 85 0 0 Erickson Asphalt - Princeton, MN 33 70 15 5 10 0 0 5 25 70 0 50 0 30 20 0 5 Finley Asphalt & Concrete - Bristow, VA 58 40 3 2 45 10 1 18 78 0 3 17 40 40 0 3 0 G and M New England, LLC - Sherborn, MA 23 20 35 5 40 0 0 0 90 10 0 65 0 25 10 0 0 G-FORCE Parking Lot Striping - Bedford, NH 6 0 7 88 0 5 0 0 85 0 15 90 5 5 0 0 0 Kansas Asphalt, Inc. - Bucyrus, KS 20 50 7 4 39 0 0 2 93 5 0 83 2 10 5 0 0 M&D Blacktop Co. - Grove City, OH 59 70 15 5 10 0 0 0 90 5 5 80 10 10 0 0 0 M&M Asphalt Maintenance, Inc. DBA All County Paving - Delray Beach, FL 35 60 20 10 10 0 5 60 35 0 0 35 35 25 0 5 2 Maul Paving, Inc - Plainfield, IL 23 64 15 5 16 0 0 10 89 1 0 69 10 20 1 0 5 NextGen Sealcoating - Sciota, PA 17 0 90 10 0 0 0 0 35 65 0 35 0 0 65 0 0


www.ForConstructionPros.com/Pavemen t | June/July 2023 | PAVEMENT MAINTENANCE & RECONSTRUCTION 23 SEALCOATING 50 Year in Business Sales Composition (%) Where We Work (%) Customer Mix (%) Paving Sealcoating Striping Sweeping Pavement Repair Other Highways Streets/Roads Parking Lots Driveways Other Commercial Municipal Multi-family Single-family Other O’Leary Asphalt Inc. - Ijamsville, MD 38 70 10 10 5 0 0 25 50 25 0 40 10 40 10 0 0 Paramount Asphalt & Sealcoating CorporationNaples, FL 7 35 15 40 10 0 0 50 50 0 0 50 20 30 0 0 0 Pavement Solutions, LLC - Richmond, IL 21 44 12 28 10 6 0 15 45 40 0 60 5 10 25 0 17 PCI - Azusa, CA 30 0 5 95 0 0 10 60 30 0 0 20 80 0 0 0 0 Pro-Seal Asphalt Contractors - North Charleston, SC 7 10 40 10 40 0 0 0 95 5 0 40 5 40 5 0 0 Rabine - Schaumburg, IL 42 60 2 3 15 20 0 10 90 0 0 99 0 1 0 0 0 Richland Sealcoating Co, Inc - Mansfield, OH 50 0 70 25 0 5 0 1 90 4 5 6 4 25 11 0 0 Rose Paving - Bridgeview, IL 49 52 10 6 23 0 0 0 100 0 0 75 0 25 0 0 0 SEAL-O-MATIC PAVEMENT SOLUTIONS INC.Olathe, KS 10 26 15 0 49 0 0 45 50 5 0 80 10 8 2 0 0 Sipes Asphalt & Concrete - Indianapolis, IN 10 30 15 5 25 25 0 0 100 0 0 90 0 10 0 0 0 Smooth Paving - Mundelein, IL 16 81 12 0 7 0 0 10 90 0 0 82 10 8 0 0 0 Stasi Brothers Asphalt & Masonry - Westbury, NY 61 40 5 5 10 40 0 20 60 20 0 50 20 20 10 0 0 Steed Paving - Jackson, SC 9 60 20 10 10 0 10 20 50 20 0 40 40 10 10 0 0 Suburban Asphalt Co., Inc. - Franklin, WI 58 70 13 2 15 0 0 0 95 5 0 70 0 25 5 0 0 Superior Blacktop Services - Summerville, SC 10 40 25 5 25 5 0 10 90 0 0 40 20 40 0 0 0 T&K Asphalt Services, Inc. - Whitman, MA 35 50 8 2 13 26 0 5 94 1 0 65 4 30 1 0 0 T&N Asphalt Services, Inc - Salt Lake City, Utah 26 5 30 40 24 1 0 1 95 4 0 95 0 5 0 0 0 The Pavement Group, Inc - Wexford, PA 5 53 8 5 12 22 0 0 100 0 0 100 0 0 0 0 0 THE PAVING LADY - boynton beach, FL 37 55 25 5 10 5 0 60 40 0 0 55 10 35 0 0 0 The Surface Masters, Inc. - Marietta, GA 12 77 10 4 4 5 0 0 100 0 0 63 22 15 0 0 0


24 PAVEMENT MAINTENANCE & RECONSTRUCTION | June/July 2023 | www.ForConstructionPros.com/Pavemen t SEALCOATING 50 "When it comes to a product, your family can trust, it better be an etnyre." 1333 South Daysville Road Oregon, Illinois 61061 Sales: 815-732-2116 Sales: sales@etnyre.com Parts/Service: 888-586-1899 Year in Business Sales Composition (%) Where We Work (%) Customer Mix (%) Paving Sealcoating Striping Sweeping Pavement Repair Other Highways Streets/Roads Parking Lots Driveways Other Commercial Municipal Multi-family Single-family Other Sponsored by U.S. Pavement Services - Woburn, MA 39 35 25 15 10 5 0 0 95 5 0 70 10 15 5 0 0 United Paving Co. - Corona, CA 23 40 20 10 30 0 1 24 70 1 4 60 5 20 5 10 0 Weaver Construction Services - Longs, SC 10 5 50 5 15 25 0 50 30 0 20 20 20 60 0 0 0 Yeghoian Grading and Paving - Apple Valley, CA 36 50 30 15 5 0 0 5 90 5 0 85 5 5 5 0 0


Unsure of Your Next Purchase? CONSULT Comparison | Research | Insights | Product Walkarounds To get the full experience, visit: IRONPROS.COM
2023 Striping Top 50 Contractors: Statistical Fallout
Numbers for this year's Striping 50 will be much more in-line with the norms from previous years, after some outlying data from last year threw off our summary information in 2022. This year, total striping-only sales equalled $129,954,003, down from the astronomical, and skewed number, $534,425,922 last year. However, if you compare 2023's figure to the total from 2021, which was $99,558,922 (the previous fully verified year) it reveals a
growth of approximately $30 million. While that is a sign of growth for this segment, it still doesn't quite bring things back up to the pre-pandemic highs of $204 million in 2020, but is closer to the 2019 total of $139 million. Striping-only sales is a bit of a mystery to try and pin down. What is really trending? It appears that striping is still recovering, and, perhaps, it has been slower to do so than the other segment only categories.
TOTAL SALES FOR THE STRIPING 50
Total sales for all the work done by the contractors who make up the 2023 Striping 50 was $1.583 billion, compared to $1.632 billion last year. Once again, while that appears to show a decrease in total company sales for the busiest striping contractors, when viewed in light of the $890 million total from 2021, this year was nearly double that figure.
For 2023, the striping-only sales represented more than 20% of the total sales for the Striping 50 contractors, which is an increase over last year's 18%, the year prior to that is 19%, and an even larger leap up from 2019's 13% of total sales. This is a healthy sign that despite any possible bad data from 2022, contractors are seeing more and more profitable work. Our Striping 50 also generated other work in these areas:
• 47 out of 50 companies performed sealcoating jobs

• 42 companies did pavement repair


• 41 companies took on paving work Only seven companies out of the Striping 50 reported more than 50% of their sales as coming from striping,
26 PAVEMENT MAINTENANCE & RECONSTRUCTION | June/July 2023 | www.ForConstructionPros.com/Pavemen t Sponsored by STRIPING 50 Prevent surface water penetration into underlying layers of any traffic grade surface with Pecora’s silicone and urethane traffic sealants. 322FC Pecora Sealant Solutions REDUCE PAVEMENT DETERIORATION Fast Cure Traffic Silicone 300SL Self-Leveling Pavement Joint Sealant 301NS Non-Sag Highway & Pavement Joint Sealant
After dealing with some anomalous data in 2022, this year’s profit margins and sales return to previous normal ranges, though sales still grew by $30 million from 2021’s numbers.


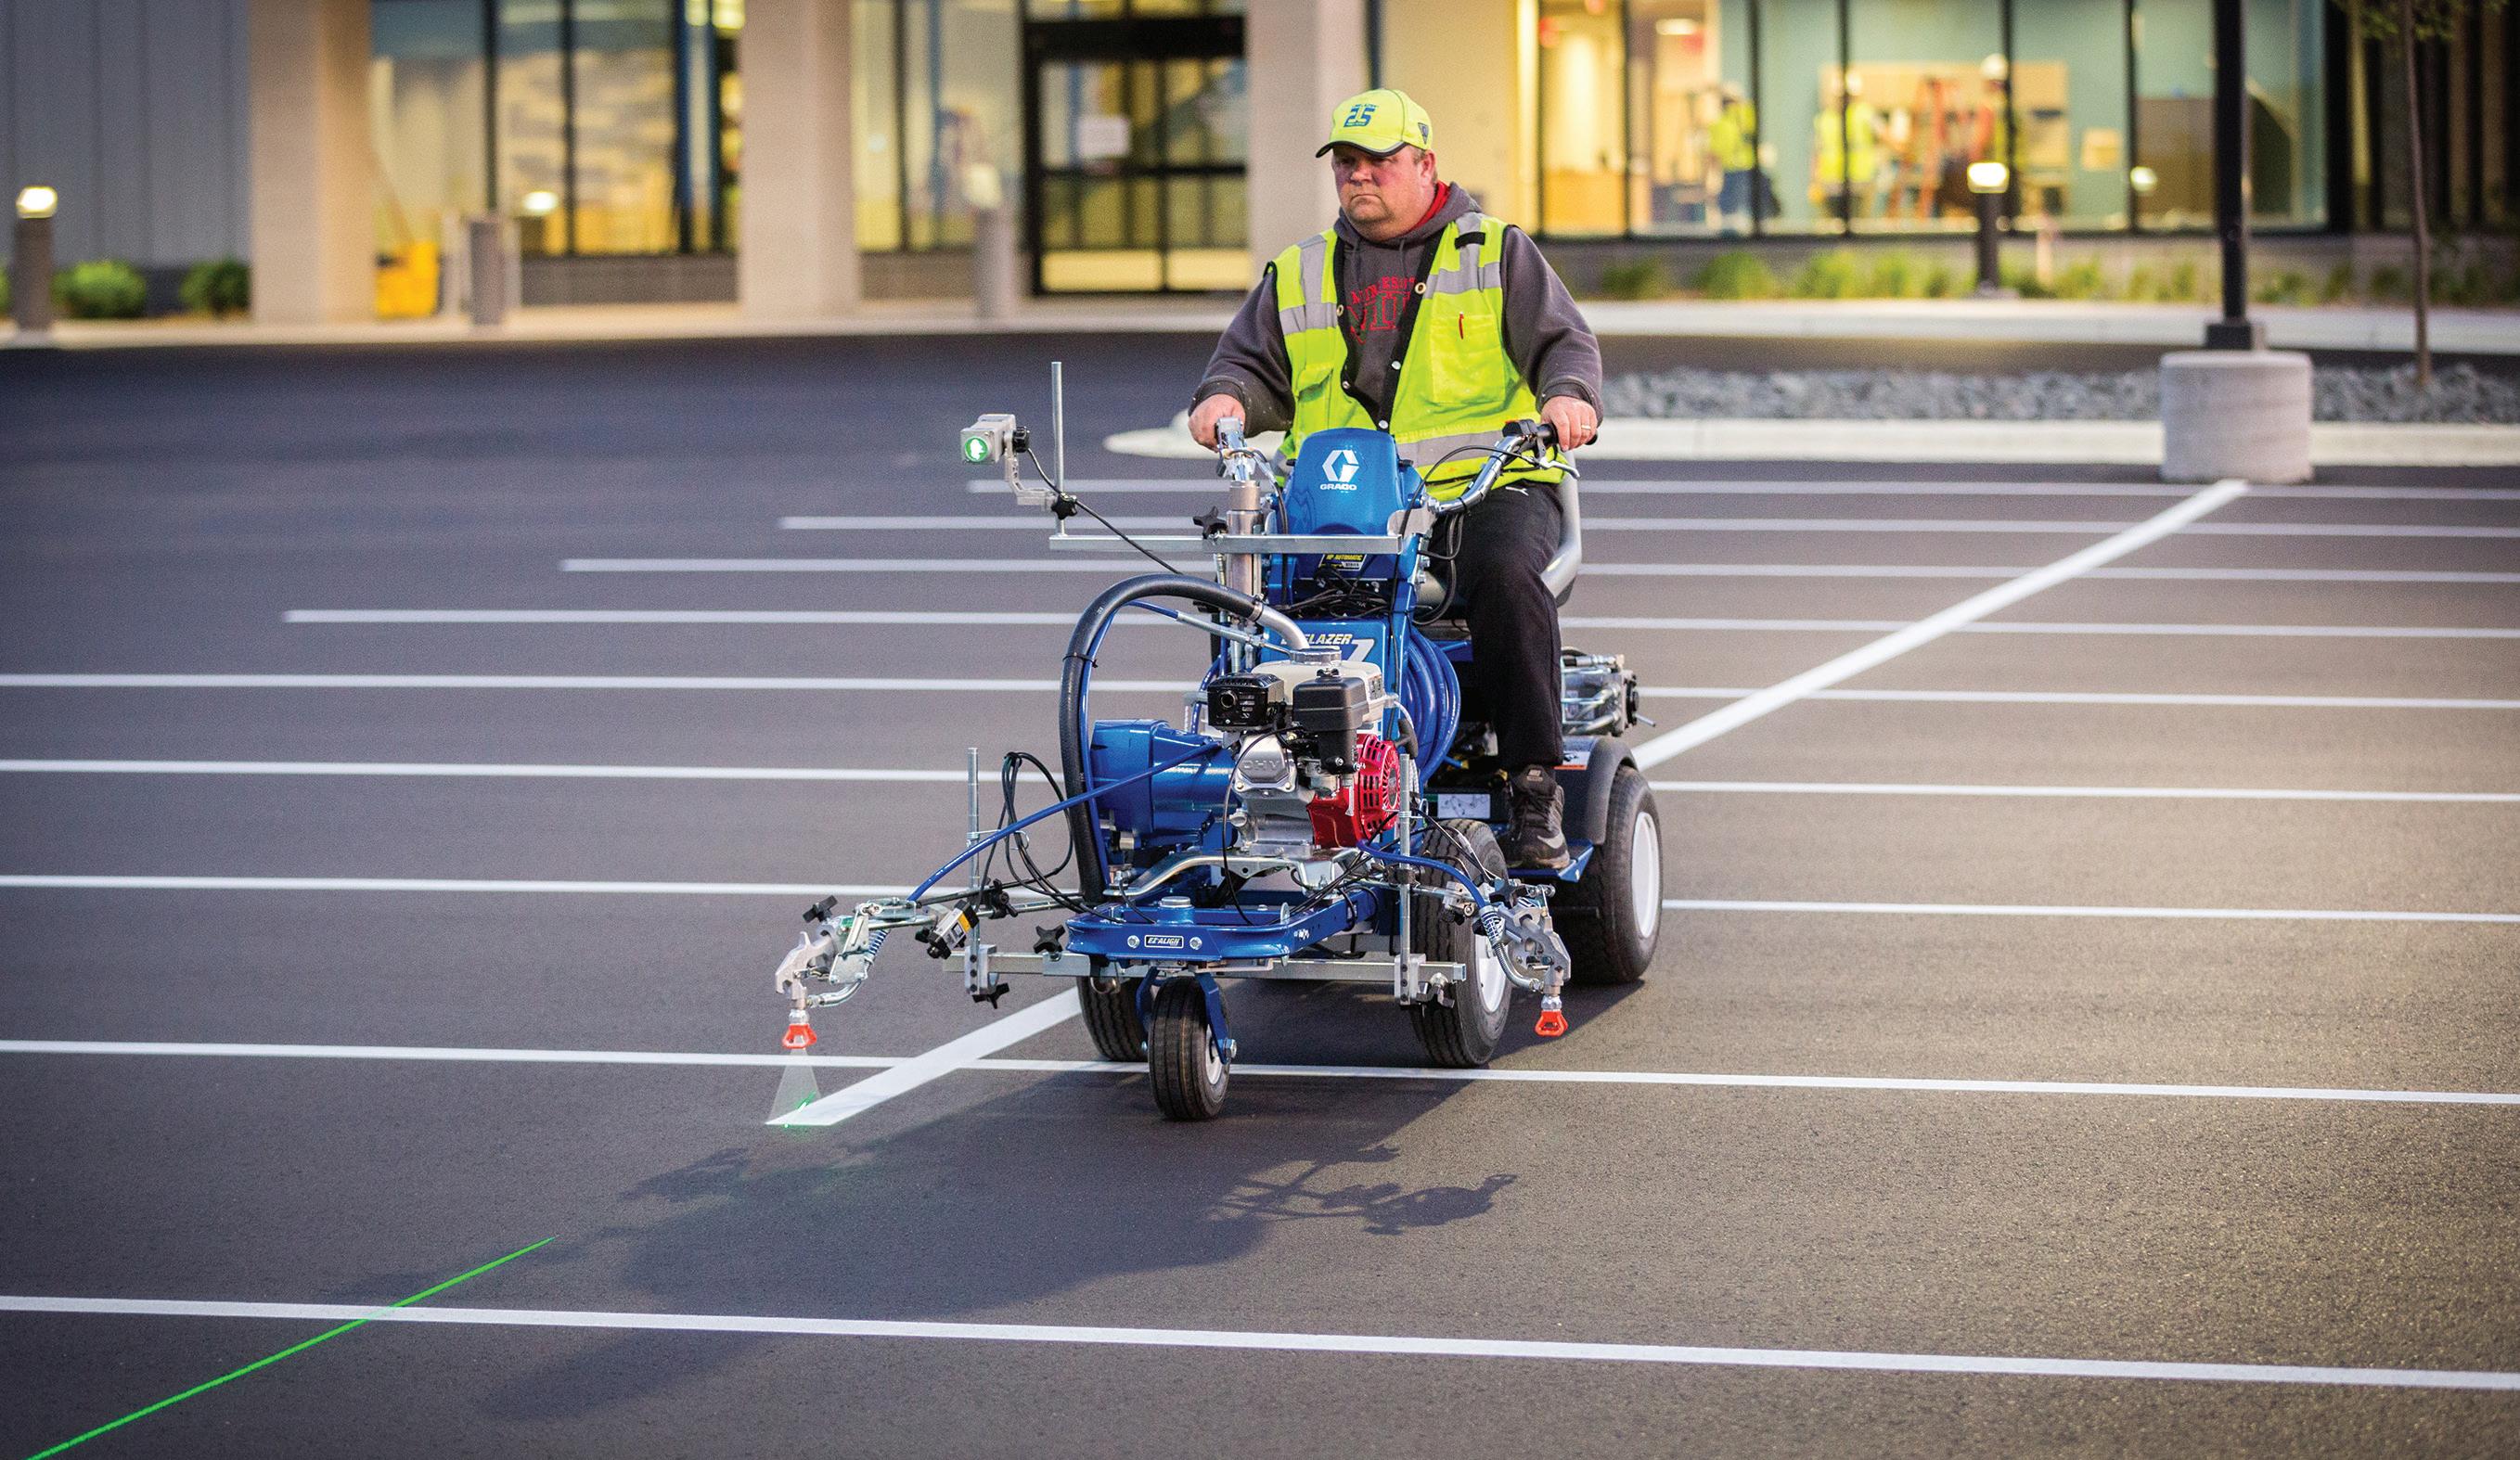
TOP CONTRACTORS USE TOP TECHNOLOGY © 2020 Graco Inc. 3J0047B 4/20 Printed in the U.S.A. Product covered by issued and pending patents, see graco.com/patents Get more done with less labor and greater accuracy with features only found on a Graco LineLazer.® Less Set-Up Time • Auto-Layout ™ II Greater Accuracy • LazerGuide™ 2000 Exact Line Lengths Without A Tape Measure • Automatic Guns Striping Information At-A-Glance • LiveLook ™ Display Track All Jobs • J-Log™ with USB Download Simplify Parking Lot Striping to Increase Your Profits Learn more at graco.com/autolayout MADE IN THE USA WITH GLOBAL COMPONENTS
which means the vast majority of our top contractors were earning a lot of their revenue from other streams. Contractors are showing up to their clientele with the ability and intention to help with a multitude of pavement and maintenance needs, with a lot of overlap.
PROFIT MARGINS
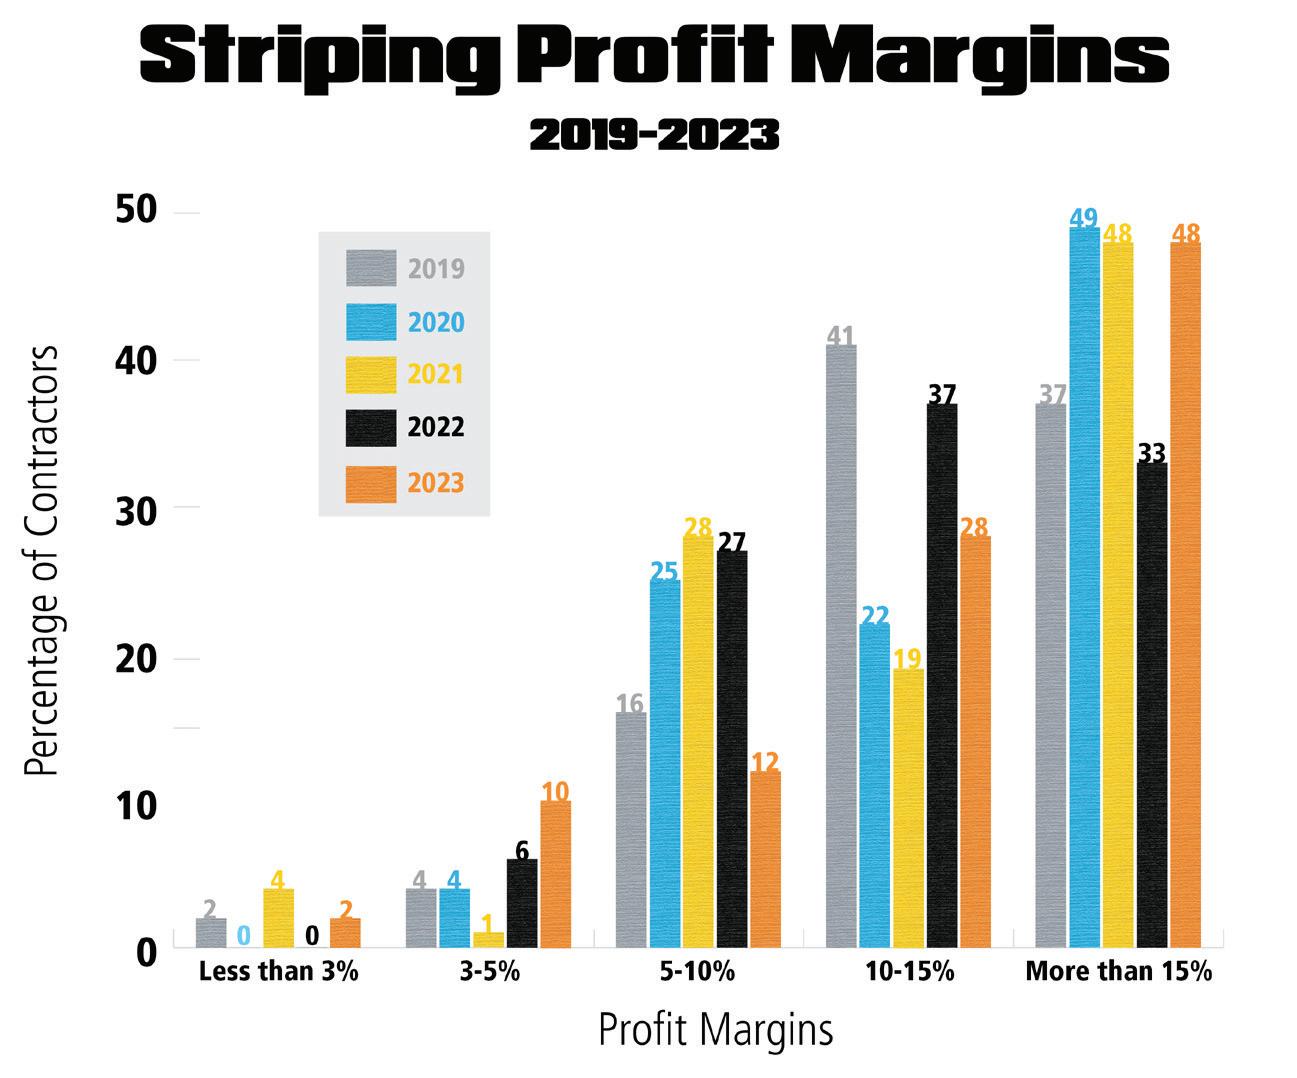
If you go back to 2019, the oldest year on our graph, 34% of companies claimed greater than 15% margins. And the majority of the top 50 seemed to hover in the mid-margin ranges between 5-10% and 10-15%.
Then things skyrocketed the year before the pandemic, when nearly half of companies reported the highest range of profits, but ever since that year, it's been trending downwards for that top tier. This year, 48% of contractors now report greater than 15% profits, on par with 2021.
Where things shifted in great contrast with that year was in the second tier, where in 2021 they reported only 19% in the 10-15% range, this year's companies shifted that number up to 28%. The true middle tier profiters have lost some
ground, as well, to the bottom end. To recap:
• Those reporting the highest margins, more than 15% rose to 48% over last year's 33%
• Contractors reporting margins of 10-15% dropped from 37% in 2022, to 28% in 2023
• Companies in the 5-10% also saw a significant downturn from 27% in
2022 to 12% in 2023
• 10% of contractors reported profit margins of between 3-5%, up from just 6% the year before
• 2% of companies showed less than 3% profits, versus 0% in 2022
*To read the full analysis scan this link below to our website.
For more information visit https://pavemg. com/4yn466
28 PAVEMENT MAINTENANCE & RECONSTRUCTION | June/July 2023 | www.ForConstructionPros.com/Pavemen t Year in Business Sales Composition (%) Where We Work (%) Customer Mix (%) Paving Sealcoating Striping Sweeping Pavement Repair Other Highways Streets/Roads Parking Lots Driveways Other Commercial Municipal Multi-family Single-family Other ACCURATE PAVEMENT STRIPING - Pflugerville, TX 12 4 5 85 1 5 5 20 60 5 10 70 15 15 0 0 0 ACI ASPHALT & CONCRETE, LLC - Maple Grove, MN 32 62 8 2 11 17 0 0 90 10 0 80 5 15 0 0 0 Affordable Striping & Sealing, LLC - Las Vegas, NV 16 0 42 28 0 30 0 65 35 0 0 78 7 15 0 0 0 All Out Services llc DBA All Out Parking LotsBroomall, PA 11 29 1 3 12 55 0 0 99 1 0 100 0 0 0 0 0 American Asphalt Repair & Resurfacing Co., Inc.Hayward, CA 40 40 8 4 21 17 0 45 53 2 0 48 10 40 2 0 0 Asphaltech Pavement Solutions - Bridgeton, NJ 6 35 25 20 20 0 0 20 70 10 0 40 0 50 10 0 0 Sponsored by

www.ForConstructionPros.com/Pavemen t | June/July 2023 | PAVEMENT MAINTENANCE & RECONSTRUCTION 29 Year in Business Sales Composition (%) Where We Work (%) Customer Mix (%) Paving Sealcoating Striping Sweeping Pavement Repair Other Highways Streets/Roads Parking Lots Driveways Other Commercial Municipal Multi-family Single-family Other STRIPING 50 Atlantic Southern Paving & Sealcoating - Sunrise, FL 35 45 15 5 15 18 2 35 60 3 0 40 15 15 3 18 0 Blackjack Paving - Fairburn, GA 15 45 13 6 25 11 0 10 85 5 0 50 10 35 5 0 0 Brite Line Asphalt Maintenance, Inc. - Cartersville, GA 39 45 47 8 0 0 0 0 100 0 0 100 0 0 0 0 0 Brothers Paving and Concrete - Manassas, VA 34 72 2 5 2 18 0 12 83 5 0 41 1 55 3 0 10 C & R Asphalt, LLC - Lexington, KY 29 77 13 3 1 6 0 4 86 4 6 81 0 11 3 5 0 Cantel Sweeping - Gresham, OR 29 0 0 14 0 86 0 0 100 0 0 83 11 6 0 0 0 Citymark Striping LLC - Albany, NY 14 0 4 79 1 17 0 5 95 0 0 50 40 10 0 0 0

30 PAVEMENT MAINTENANCE & RECONSTRUCTION | June/July 2023 | www.ForConstructionPros.com/Pavemen t STRIPING 50 Year in Business Sales Composition (%) Where We Work (%) Customer Mix (%) Paving Sealcoating Striping Sweeping Pavement Repair Other Highways Streets/Roads Parking Lots Driveways Other Commercial Municipal Multi-family Single-family Other D.E. Gemmill Inc. - Red Lion, PA 37 0 1 69 0 30 11 61 21 0 7 34 58 2 0 6 4 DACS Asphalt & Concrete - Denver, CO 9 40 12 5 15 28 0 10 85 5 0 85 0 15 0 0 0 Dominion Paving & Sealing - Purcellville, VA 41 59 8 3 27 3 0 30 70 0 0 30 0 70 0 0 0 Eosso Brothers - Farmingdale, NJ 30 66 8 3 5 18 1 74 20 5 0 5 3 90 2 0 0 Erickson Asphalt - Princeton, MN 33 70 15 5 10 0 0 5 25 70 0 50 0 30 20 0 0 Finley Asphalt & Concrete - Bristow, VA 58 40 3 2 45 10 1 18 78 0 3 17 40 40 0 3 5 G-FORCE Parking Lot Striping - Bedford, NH 6 0 7 88 0 5 0 0 85 0 15 90 5 5 0 0 0 Giordano Construction Incorporated - Houston, TX 25 0 10 10 80 0 0 10 90 0 0 90 0 10 0 0 0 Intercounty Paving Co Inc - Carmel, NY 68 65 0 2 8 25 0 50 20 1 29 25 50 25 0 0 0 JMP Excelsior Services LLC - Oakland, NJ 28 0 0 98 0 2 0 0 100 0 0 98 0 2 0 0 0 Kansas Asphalt, Inc. - Bucyrus, KS 20 50 7 4 39 0 0 2 93 5 0 83 2 10 5 0 0 Line Design Solutions - Pompano Beach, FL 8 5 5 70 5 15 0 30 70 0 0 70 10 20 0 0 2 M&D Blacktop Co. - Grove City, OH 59 70 15 5 10 0 0 0 90 5 5 80 10 10 0 0 0 M&M Asphalt Maintenance, Inc. DBA All County Paving - Delray Beach, FL 35 60 20 10 10 0 5 60 35 0 0 35 35 25 0 5 0 Maul Paving, Inc - Plainfield, IL 23 64 15 5 16 0 0 10 89 1 0 69 10 20 1 0 20 O’Leary Asphalt Inc. - Ijamsville, MD 38 70 10 10 5 0 0 25 50 25 0 40 10 40 10 0 0 Paramount Asphalt & Sealcoating CorporationNaples, FL 7 35 15 40 10 0 0 50 50 0 0 50 20 30 0 0 17 Pavement Solutions, LLC - Richmond, IL 21 44 12 28 10 6 0 15 45 40 0 60 5 10 25 0 0 PCI - Azusa, CA 30 0 5 95 0 0 10 60 30 0 0 20 80 0 0 0 0
32 PAVEMENT MAINTENANCE & RECONSTRUCTION | June/July 2023 | www.ForConstructionPros.com/Pavemen t STRIPING 50 Year in Business Sales Composition (%) Where We Work (%) Customer Mix (%) Paving Sealcoating Striping Sweeping Pavement Repair Other Highways Streets/Roads Parking Lots Driveways Other Commercial Municipal Multi-family Single-family Other Pro-Seal Asphalt Contractors - North Charleston, SC 7 10 40 10 40 0 0 0 95 5 0 40 5 40 5 0 0 Rabine - Schaumburg, IL 42 60 2 3 15 20 0 10 90 0 0 99 0 1 0 0 0 Richland Sealcoating Co, Inc - Mansfield, OH 50 0 70 25 0 5 0 1 90 4 5 6 4 25 11 0 0 Rose Paving - Bridgeview, IL 49 52 10 6 23 0 0 0 100 0 0 75 0 25 0 0 0 Sipes Asphalt & Concrete - Indianapolis, IN 10 30 15 5 25 25 0 0 100 0 0 90 0 10 0 0 0 Stasi Brothers Asphalt & Masonry - Westbury, NY 61 40 5 5 10 40 0 20 60 20 0 50 20 20 10 0 0 Steed Paving - Jackson, SC 9 60 20 10 10 0 10 20 50 20 0 40 40 10 10 0 0 Suburban Asphalt Co., Inc. - Franklin, WI 58 70 13 2 15 0 0 0 95 5 0 70 0 25 5 0 0 Superior Blacktop Services - Summerville, SC 10 40 25 5 25 5 0 10 90 0 0 40 20 40 0 0 0 T&K Asphalt Services, Inc. - Whitman, MA 35 50 8 2 13 26 0 5 94 1 0 65 4 30 1 0 0 T&N Asphalt Services, Inc - Salt Lake City, UT 26 5 30 40 24 1 0 1 95 4 0 95 0 5 0 0 0 The Pavement Group, Inc - Wexford, PA 5 53 8 5 12 22 0 0 100 0 0 100 0 0 0 0 0 THE PAVING LADY - Boynton Beach, FL 37 55 25 5 10 5 0 60 40 0 0 55 10 35 0 0 0 The Surface Masters, Inc. - Marietta, GA 12 77 10 4 4 5 0 0 100 0 0 63 22 15 0 0 0 U.S. Pavement Services - Woburn, MA 39 35 25 15 10 5 0 0 95 5 0 70 10 15 5 0 0 United Paving Co. - Corona, CA 23 40 20 10 30 0 1 24 70 1 4 60 5 20 5 10 0 Woodvalley contractors corp - Patchouge, NY 12 35 10 25 20 0 0 30 40 30 0 60 40 0 0 0 0 Yeghoian Grading and Paving - Apple Valley, CA 36 50 30 15 5 0 0 5 90 5 0 85 5 5 5 0 0

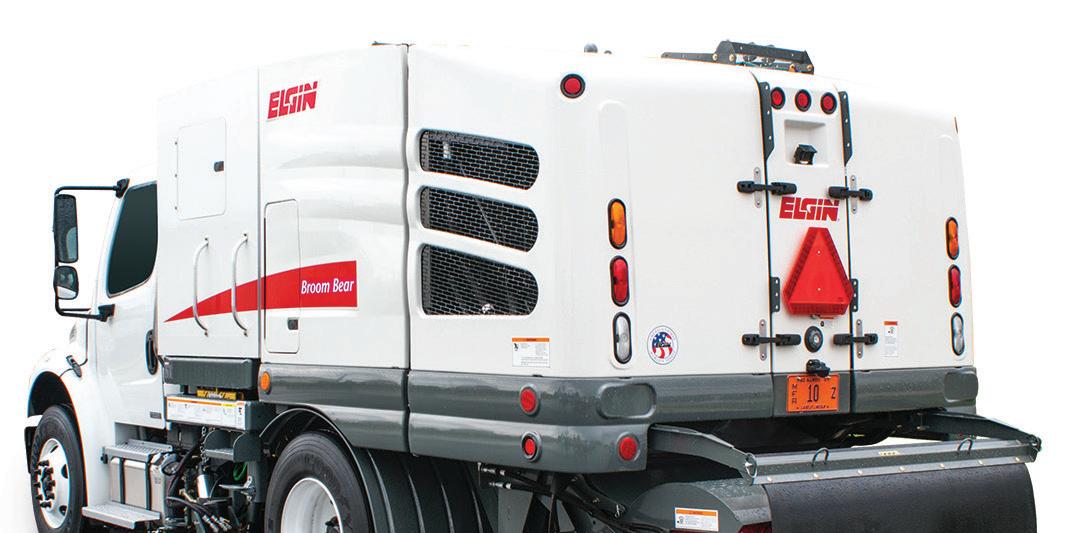

BUILT FOR CLEAN . BACKED FOR LIFE . Questions? Ask an Expert! ©2023 Elgin Sweeper Company Broom Bear ® • Non-CDL version available • Mechanical sweeping to handle heavy applications like millings • Independent broom control for in-the-cut precision • Single engine for fuel economy and less maintenance • Simple start-up procedure with easy-to-operate controls THE LEGENDARY POWER BEHIND SWEEPING Multiple Fuel Configurations Diesel, CNG, Hybrid & 100% Electric
2023 Pavement Repair Top 50: Sky is the Limit


Segment only sales for every list was up, and profit margins indicate this particular work is highly lucrative for contractors.


Here is the history of Pavement Repair-only sales going back a few years, and how many companies qualified for the lists in parenthesis. The year at the front refers to when the list was published, but is based on the financial information of the preceeding year:
• 2023: $315 million (50)


• 2022: $248 million (50)
• 2021: $205 million (75)
• 2020: $217 million (50)

• 2019: $209 million (50)

• 2018: $265 million (75)
• 2017: $165 million (50)
• 2016: $255 million (75)
If you look at this growth over the course of seven years, it reveals an annual growth of approximately 12%, on average, year-over-year. This year's growth was 22% for the past year, which matched the previous largest single year of sales growth from 2018. This year's segmented sales was 16% greater than 2018. This could potentially indicate that more and more customers are looking to repair and maintain existing pavement surfaces and trying to stretch property investment dollars as far as they will go.


TOTAL SALES FOR THE PAVEMENT REPAIR 50
Total sales for all the work performed by the Pavement Repair 50 in the past year was $1.672 billion compared to $1.22 billion the previous year, and significantly higher than 2021's reported figure of $1.045 billion.


As a percentage of total sales by the Pavement Repair 50, pavement repair-only sales accounted for more than 20% of total work completed by the contractors, which is just a shade more than the 19% reported last year. The year of 2019 was the last time we saw more than 20% for this segment.
To a certain degree, it is logical to see a third year of relatively stable percentage of work falling into this category, as the cost of virgin materials, which is so high it makes the notion of repairing what you already have a highly attractive proposition, indeed. As far as the other types of work the Pavement Repair 50 performed, they reported that:
• All but one of the 50 completed paving work
Overview continued on page 36

34 PAVEMENT MAINTENANCE & RECONSTRUCTION | June/July 2023 Sponsored by It’s All in the Box! Liquid Plastic Permanently Nonskid Lasts for decades! www.VanguardOnline.com Free Shipping Order Online VanguardOnline.com/SkidGuard Covers up to 8 Sf Surface Coating Nonskid


to all of the finalists and top awarded contractors in the pavement repair category. Congratulations Make the most of your crack sealing projects. Visit Crafco.com www.ForConstructionPros.com/XXXXXXX
• 47 performed sealcoating services
• 46 contractors reported completing striping work, but not in massive quantities
PROFIT MARGINS
The highest range of profits for the Pavement Repair 50 rose quite significantly, to their highest levels in six years. More than 56% of contractors reported earning more than 15% profit margins in the past year, while the middle margin earners seemed to completely level off.
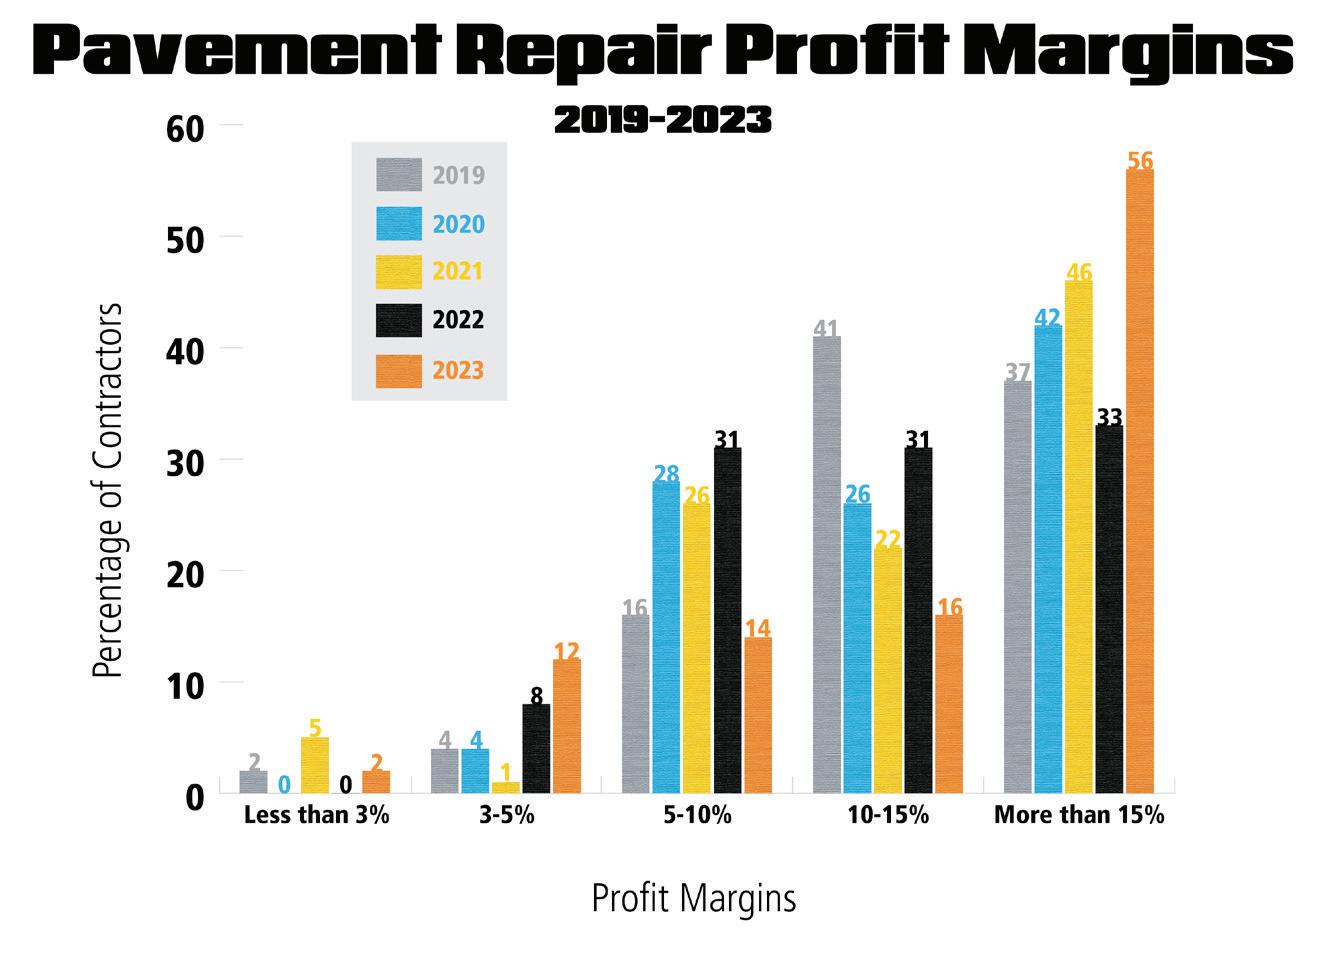
• 56% reported margins of more than 15%, up from 33% last year
• 16% reported margins of 10-15%, a big drop from 31% in 2022
• 14% of companies reported margins of 5-10%, another similar drop from 31% last year
36 PAVEMENT MAINTENANCE & RECONSTRUCTION | June/July 2023 | www.ForConstructionPros.com/Pavemen t Year in Business Sales Composition (%) Where We Work (%) Customer Mix (%) Paving Sealcoating Striping Sweeping Pavement Repair Other Highways Streets/Roads Parking Lots Driveways Other Commercial Municipal Multi-family Single-family Other Sponsored by A&A Paving - Roselle, IL 63 60 5 1 13 21 0 20 80 0 0 70 0 30 0 0 0 ACI ASPHALT & CONCRETE, LLC - Maple Grove, MN 32 62 8 2 11 17 0 0 90 10 0 80 5 15 0 0 0 All Out Services llc DBA All Out Parking LotsBroomall, Pennsylvania 11 29 1 2.8 12 55 0 0 99 1 0 100 0 0 0 0 0 American Asphalt Repair & Resurfacing Co., Inc.Hayward, CA 40 40 8 4 21 17 0 45 53 2 0 48 10 40 2 0 0 ASAP Asphalt Sealing And Paving Co.Meadow Lands, PA 18 48 14 3 28 7 0 20 70 10 0 70 5 20 5 0 0 Asphaltech Pavement Solutions - Bridgeton, NJ 6 35 25 20 20 0 0 20 70 10 0 40 0 50 10 0 0 Atlantic Southern Paving & SealcoatingSunrise, Florida 35 45 15 5 15 18 2 35 60 3 0 40 15 15 3 18 0 Blackjack Paving - Fairburn, GA 15 45 13 6 25 11 0 10 85 5 0 50 10 35 5 0 0 Brahney Paving / www.FIXASPHALT.com - Wall, NJ 22 48 40 2 10 0 0 0 98 2 0 88 0 10 2 0 0 Brothers Paving and Concrete - MANASSAS, Virginia 34 72 2 5 2 18 0 12 83 5 0 41 1 55 3 0 10
• 12% of contractors reported 3-5% profit margins, a small step up from 8% in 2022


• 2% of contractors reported margins less than 3%, which was up from 0% in 2022
WHERE THE PAVEMENT REPAIR CONTRACTORS WORK
All of the Pavement Repair 50 indicated they generate sales from parking lot work, with 22 reporting that they generate at least 90% of their work from that field. That's more than double last year's number of 10 companies. Possibly a signal that smaller repair crew contractors are seeing a lot of action on asset maintenance work, rather than larger contractors creating new spaces; roads, streets, and highways all saw a dip in work for this list. Only 35 companies did work for streets and roads, versus 35 last year, but only 6 companies reported highway work versus the 10 last year.
REPAIR 50’S CUSTOMER BASE


• All 50 contractors on the list performed some work for commercial/industrial customers, including seven that did more than 90% of their work for those clients


• 45 companies generated some work for multi-family residential clients
• 35 reported doing work for municipalities


• 23 contractors said that they did some work for single-family residential customers
REPLACING THE FLEET
Only four total companies reported that they could replace their current pavement repair fleets for less than $500,000. Three contractors said they could do it for between $500,000 and $1 million. A total of 12 reported that it would take between $1 million and $2 million. This versus the clear standalone majority, that 31 companies said it would take more than $2 million dollars to replace their fleet equipment.
To determine whether companies qualified for the list, the 2022 sales dollars were multiplied by the percentage of work done in that segment. Sales volume was verified by an outside third party. ■

For more information visit https://pavemg.com/ mz1q1r


www.ForConstructionPros.com/Pavemen t | June/July 2023 | PAVEMENT MAINTENANCE & RECONSTRUCTION 37 PAVEMENT REPAIR 50 Macro-Fast Macro-Flex • True Rubberizing additive. Improves performance. • Meets FAA-P-631. • Builds viscosity for sand suspension • Faster drying time • Improves durability • Excellent sand suspension • Blackening Additive • Speeds up drying by 75% • Builds viscosity for sand suspension • Improves durability • 100% Acrylic and speciality chemicals • Speeds up drying by 50% • Does not change viscosity Improves performance www.starseal.com 800-759-1912 THE Call or “click” today to contact a plant near you! WORKING T OGETHER The ULTIMATE PROTECTION


38 PAVEMENT MAINTENANCE & RECONSTRUCTION | June/July 2023 | www.ForConstructionPros.com/Pavemen t PAVEMENT REPAIR 50 Year in Business Sales Composition (%) Where We Work (%) Customer Mix (%) Paving Sealcoating Striping Sweeping Pavement Repair Other Highways Streets/Roads Parking Lots Driveways Other Commercial Municipal Multi-family Single-family Other Sponsored by DACS Asphalt & Concrete - Denver, CO 9 40 12 5 15 28 0 10 85 5 0 85 0 15 0 0 0 Dominion Paving & Sealing - Purcellville, Virginia 41 59 8 3 27 3 0 30 70 0 0 30 0 70 0 0 4 EMSNashville.com - Nashville, TN 20 32 13 4 35 16 0 0 100 0 0 100 0 0 0 0 0 Eosso Brothers - Farmingdale, New Jersey 30 66 8 3 5 18 1 74 20 5 0 5 3 90 2 0 0 Erickson Asphalt - Princeton, Minnesota 33 70 15 5 10 0 0 5 25 70 0 50 0 30 20 0 0 Erickson Asphalt - Princeton, Minnesota 33 74 15 1 5 5 0 0 10 90 0 10 0 5 85 0 5 Finley Asphalt & Concrete - Bristow, VA 58 40 3 2 45 10 1 18 78 0 3 17 40 40 0 3 0 G and M New England, LLC - Sherborn, MA 23 20 35 5 40 0 0 0 90 10 0 65 0 25 10 0 0 Giordano Construction IncorporatedHouston, Texas 25 0 10 10 80 0 0 10 90 0 0 90 0 10 0 0 0 Hartford Paving Corporation - Johnston, RI 49 47 0 0 15 38 0 38 8 0 54 10 20 2 0 40 0 Intercounty Paving Co Inc - carmel , N Y 68 65 0 2 8 25 0 50 20 1 29 25 50 25 0 0 2 Kansas Asphalt, Inc. - Bucyrus, KS 20 50 7 4 39 0 0 2 93 5 0 83 2 10 5 0 0 M&D Blacktop Co. - Grove City, OH 59 70 15 5 10 0 0 0 90 5 5 80 10 10 0 0 0 M&M Asphalt Maintenance, Inc. DBA All County Paving - Delray Beach, FL 35 60 20 10 10 0 5 60 35 0 0 35 35 25 0 5 0 Maul Paving, Inc - plainfield, il 23 64 15 5 16 0 0 10 89 1 0 69 10 20 1 0 5 O’Leary Asphalt Inc. - Ijamsville, MD Maryland 38 70 10 10 5 0 0 25 50 25 0 40 10 40 10 0 0 Paramount Asphalt & Sealcoating CorporationNaples, Florida 7 35 15 40 10 0 0 50 50 0 0 50 20 30 0 0 0 Pavement Solutions, LLC - Richmond, Illinois 21 44 12 28 10 6 0 15 45 40 0 60 5 10 25 0 0 Pothole Heroes - Tampa, FL 3 5 20 5 70 0 0 5 95 0 0 50 10 40 0 0 0 Pro-Seal Asphalt Contractors - North Charleston, SC 7 10 40 10 40 0 0 0 95 5 0 40 5 40 5 0 17
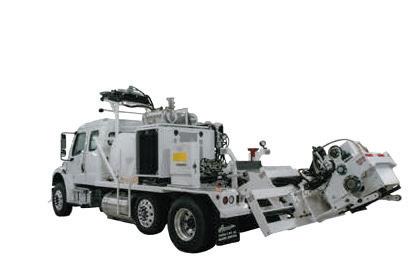
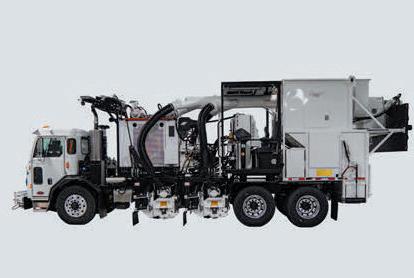
W 240 CR(i) / W 380 CR(i): Cold in-place recycling offers ideal solutions for the sustainable maintenance and repair of existing road infrastructure. The W 240 CR(i) and W 380 CR(i) machines recycle the old road surface and add new binding agents to the material on the spot This enables the creation of an enduring, hard-wearing and sustainable base layer as the basis for a good road infrastructure that can stand up to a future with ever-increasing traffic volumes Take advantage of the innovative solutions from the technology leader in the road construction segment

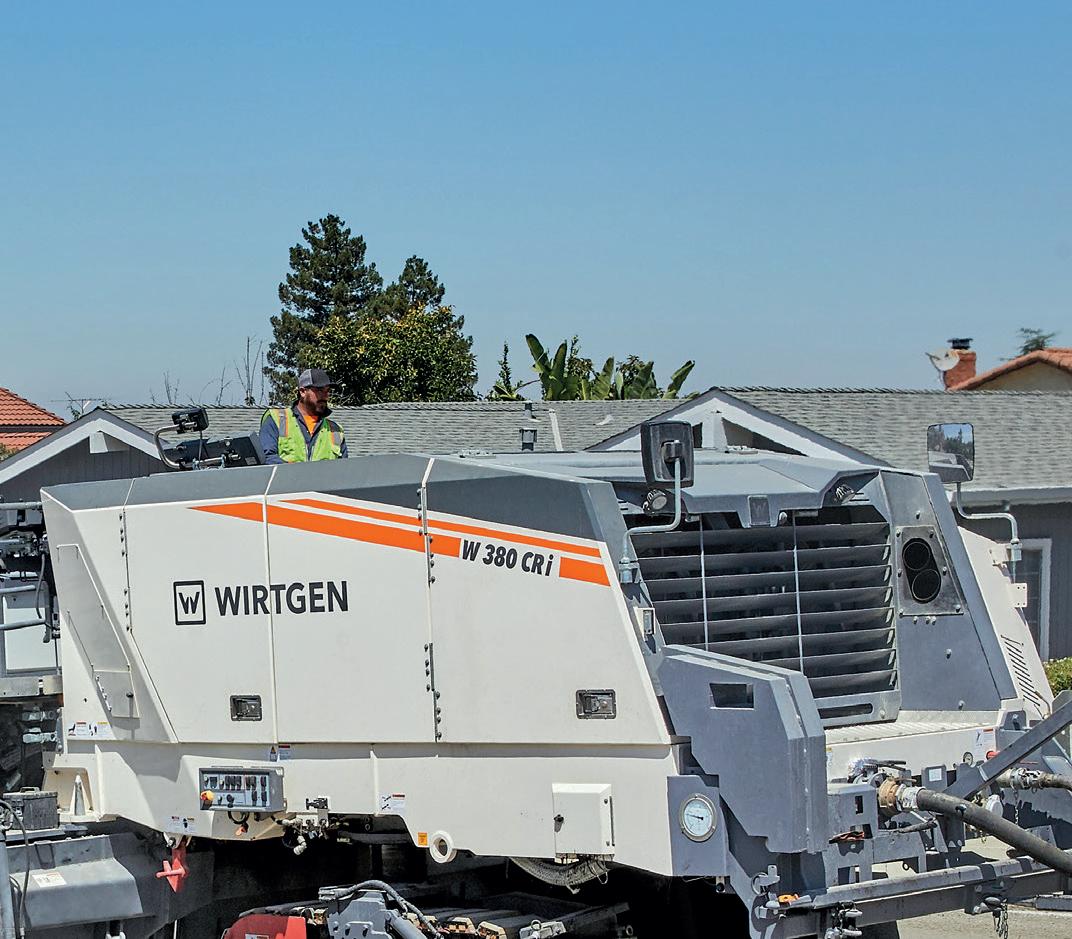
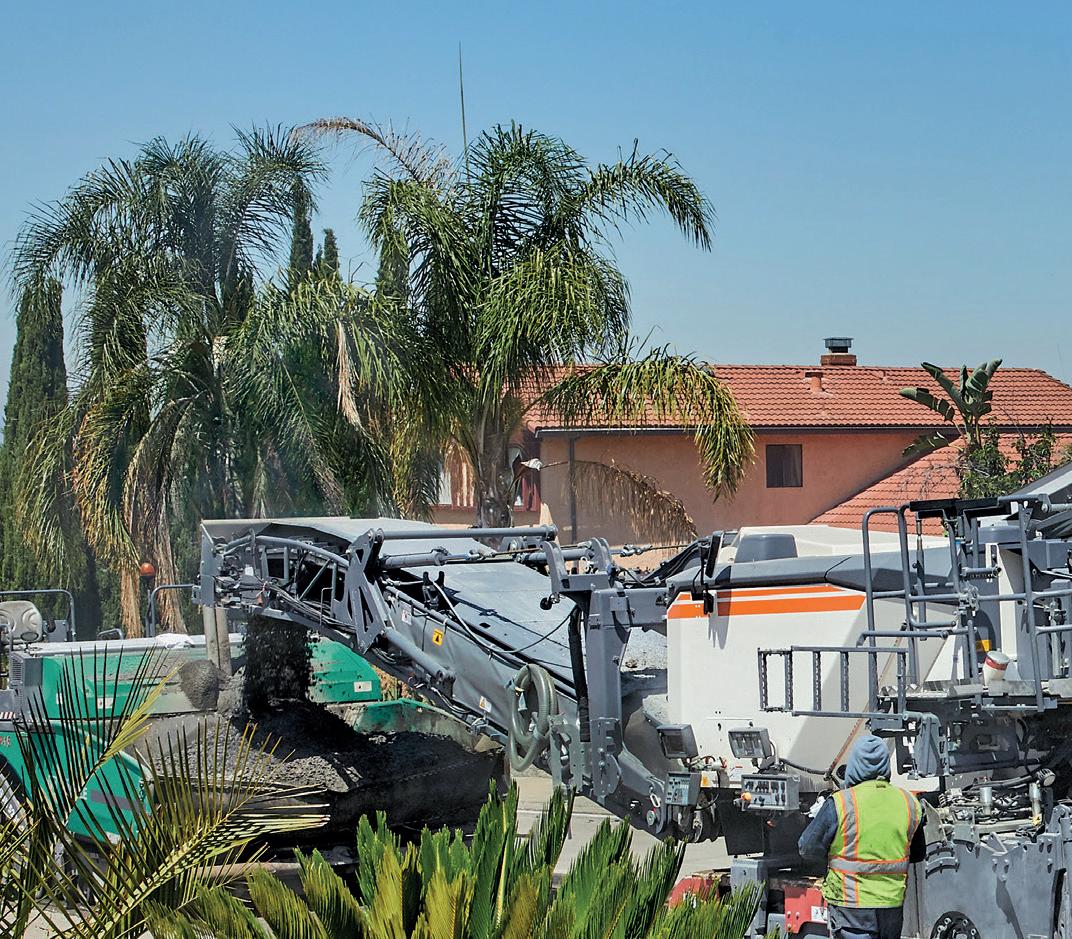


www.wirtgen.com/recycling A WIRTGEN GROUP COMPANY
a s t , good and s u st a in a bl e .
Cold i n -place re cycling : f
rtg e n.co m WIRTGEN AMERICA, INC. · 6030 Dana Way · Antioch, TN 37013 · Telephone: (615) 501-0600 CLOSE TO OUR CUSTOMERS
ww w.wi

40 PAVEMENT MAINTENANCE & RECONSTRUCTION | June/July 2023 | www.ForConstructionPros.com/Pavemen t Year in Business Sales Composition (%) Where We Work (%) Customer Mix (%) Paving Sealcoating Striping Sweeping Pavement Repair Other Highways Streets/Roads Parking Lots Driveways Other Commercial Municipal Multi-family Single-family Other Sponsored by PAVEMENT REPAIR 50 Rabine - Schaumburg, Illinois 42 60 2 3 15 20 0 10 90 0 0 99 0 1 0 0 0 Rose Paving - Bridgeview, IL 49 52 10 6 23 0 0 0 100 0 0 75 0 25 0 0 0 Ruston Paving Co., Inc. - Durham, NC 80 68 0 0 30 2 0 0 100 0 0 75 10 15 0 0 0 SEAL-O-MATIC PAVEMENT SOLUTIONS INC. , OLATHE, Kansas 10 10 26 15 0 49 0 0 45 50 5 0 80 10 8 2 0 Sipes Asphalt & Concrete - Indianapolis, IN 10 30 15 5 25 25 0 0 100 0 0 90 0 10 0 0 0 Smooth Paving - Mundelein, Illinois 16 81 12 0 7 0 0 10 90 0 0 82 10 8 0 0 0 Stasi Brothers Asphalt & Masonry - Westbury, NY 61 40 5 5 10 40 0 20 60 20 0 50 20 20 10 0 0 Suburban Asphalt Co., Inc. - Franklin, WI 58 70 13 2 15 0 0 0 95 5 0 70 0 25 5 0 0 Superior Blacktop Services - Summerville, SC 10 40 25 5 25 5 0 10 90 0 0 40 20 40 0 0 0 Synergy Asphalt Inc. - Rockton, IL 5 50 20 5 15 10 0 10 60 30 0 45 5 5 45 0 0 T&K Asphalt Services, Inc. - Whitman, MA 35 50 8 2 13 26 0 5 94 1 0 65 4 30 1 0 0 T&N Asphalt Services, Inc - Salt Lake City, Utah 26 5 30 40 24 1 0 1 95 4 0 95 0 5 0 0 0 The Pavement Group, Inc - Wexford, PA 5 53 8 5 12 22 0 0 100 0 0 100 0 0 0 0 0 THE PAVING LADY - boynton beach, Florida 37 55 25 5 10 5 0 60 40 0 0 55 10 35 0 0 0 The Surface Masters, Inc. - Marietta, Georgia 12 77 10 4 4 5 0 0 100 0 0 63 22 15 0 0 0 U.S. Pavement Services - Woburn, MA 39 35 25 15 10 5 0 0 95 5 0 70 10 15 5 0 0 United Paving Co. - Corona, CA 23 40 20 10 30 0 1 24 70 1 4 60 5 20 5 10 0 Van Etten Contracting LLC - New Windsor, NY 19 40 0 0 10 50 10 10 30 0 50 90 10 0 0 0 0 Weaver Construction Service - Longs, South Carolina 10 5 50 5 15 25 0 50 30 0 20 20 20 60 0 0 0 Woodvalley contractors corp - Patchouge , New york 12 35 10 25 20 0 0 30 40 30 0 60 40 0 0 0 0
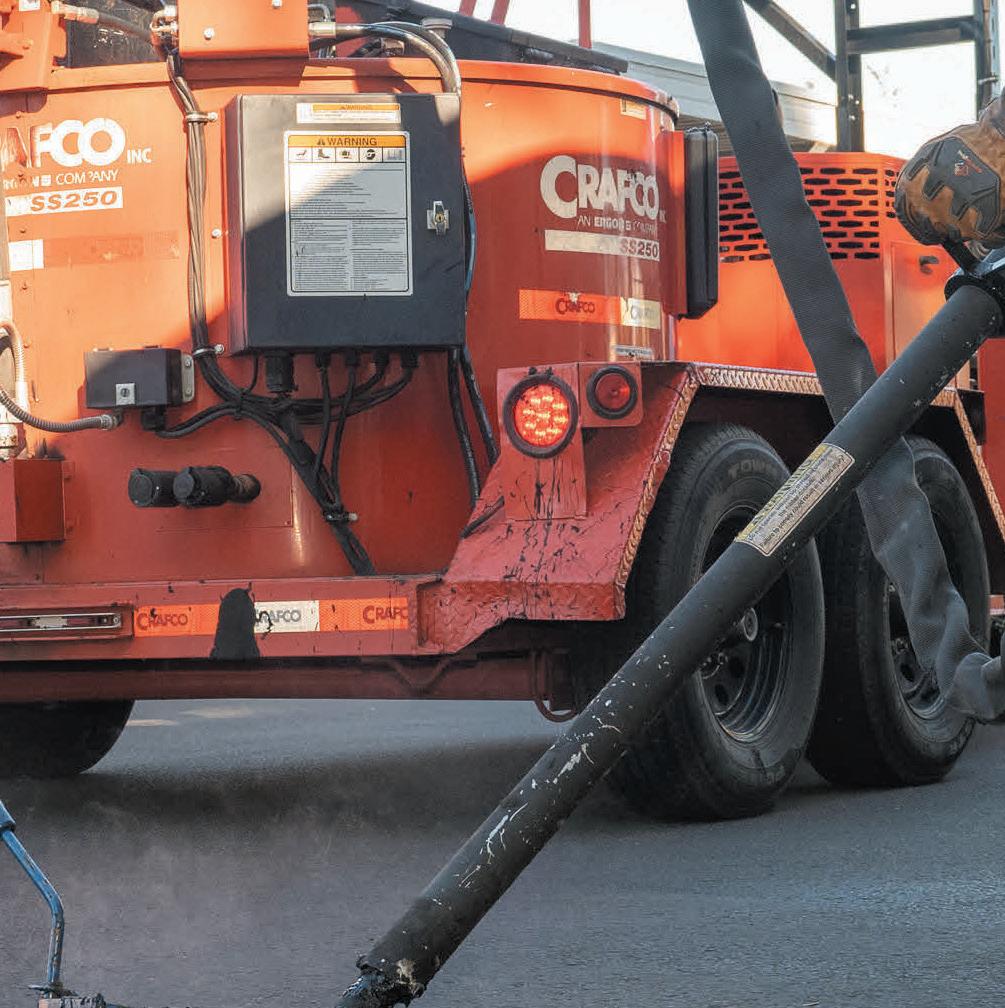
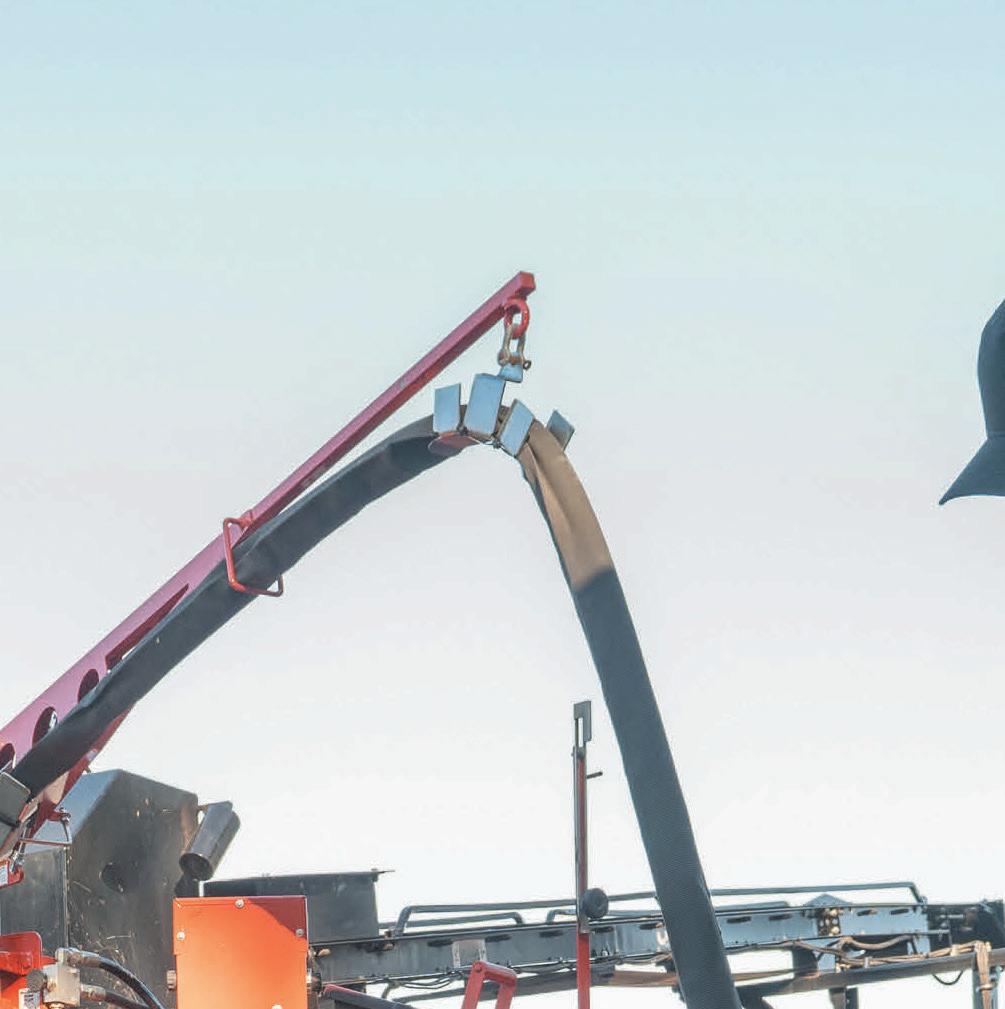
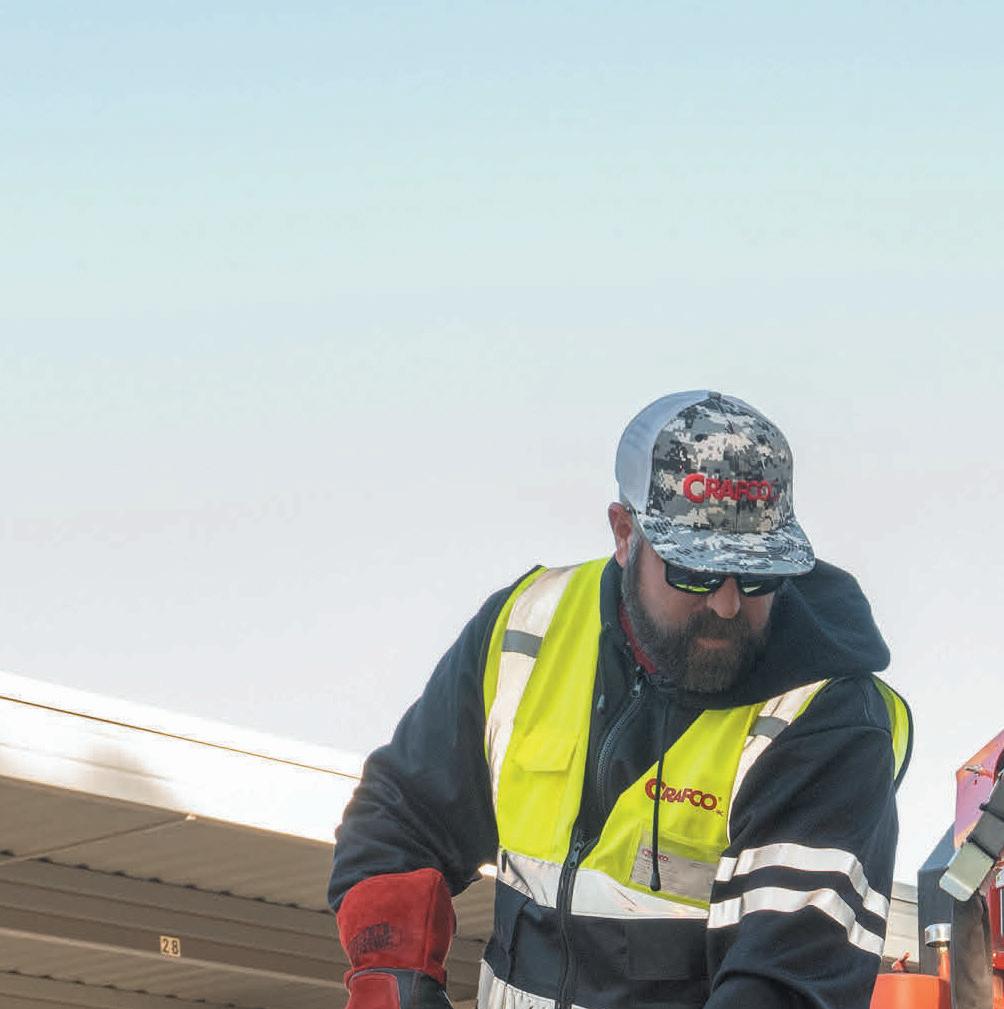
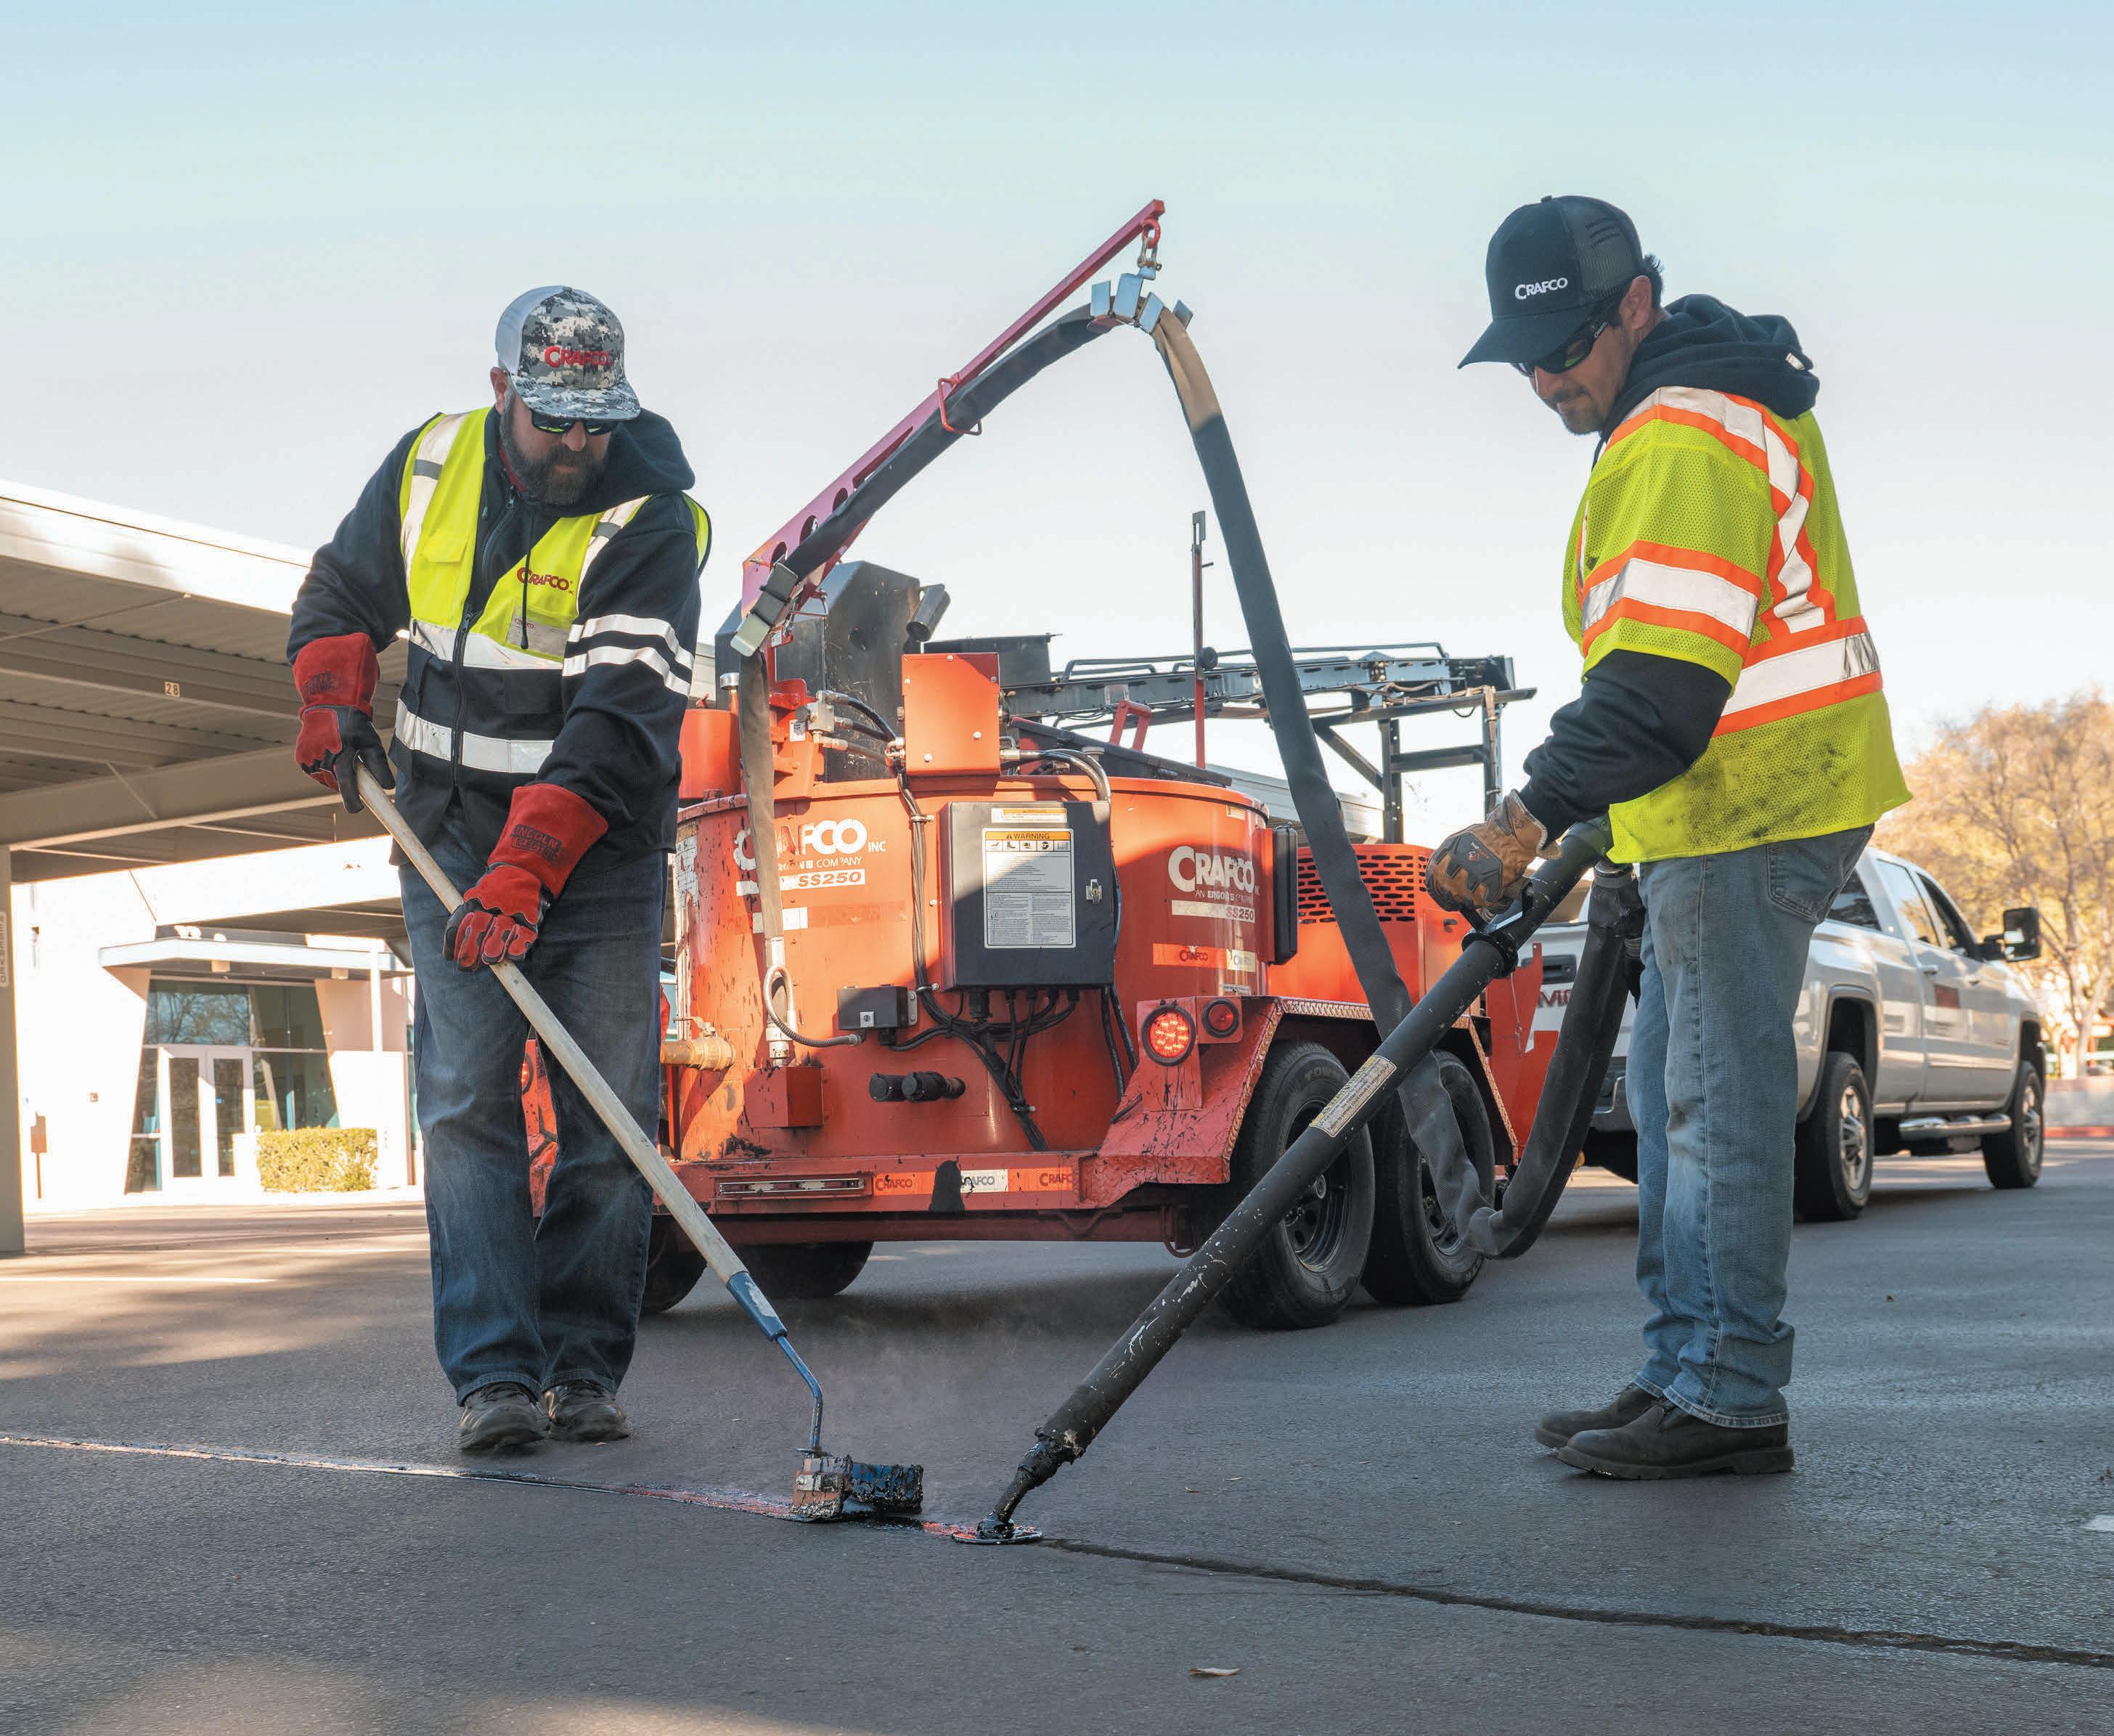
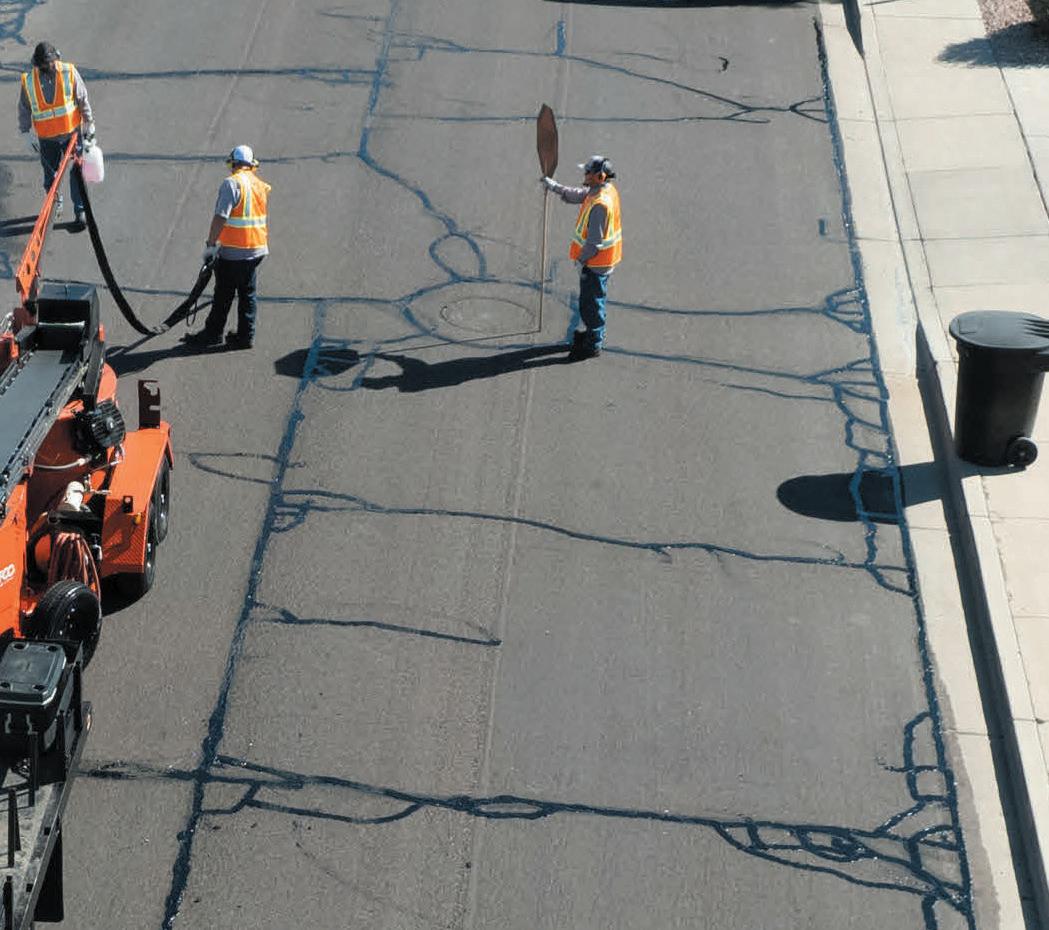
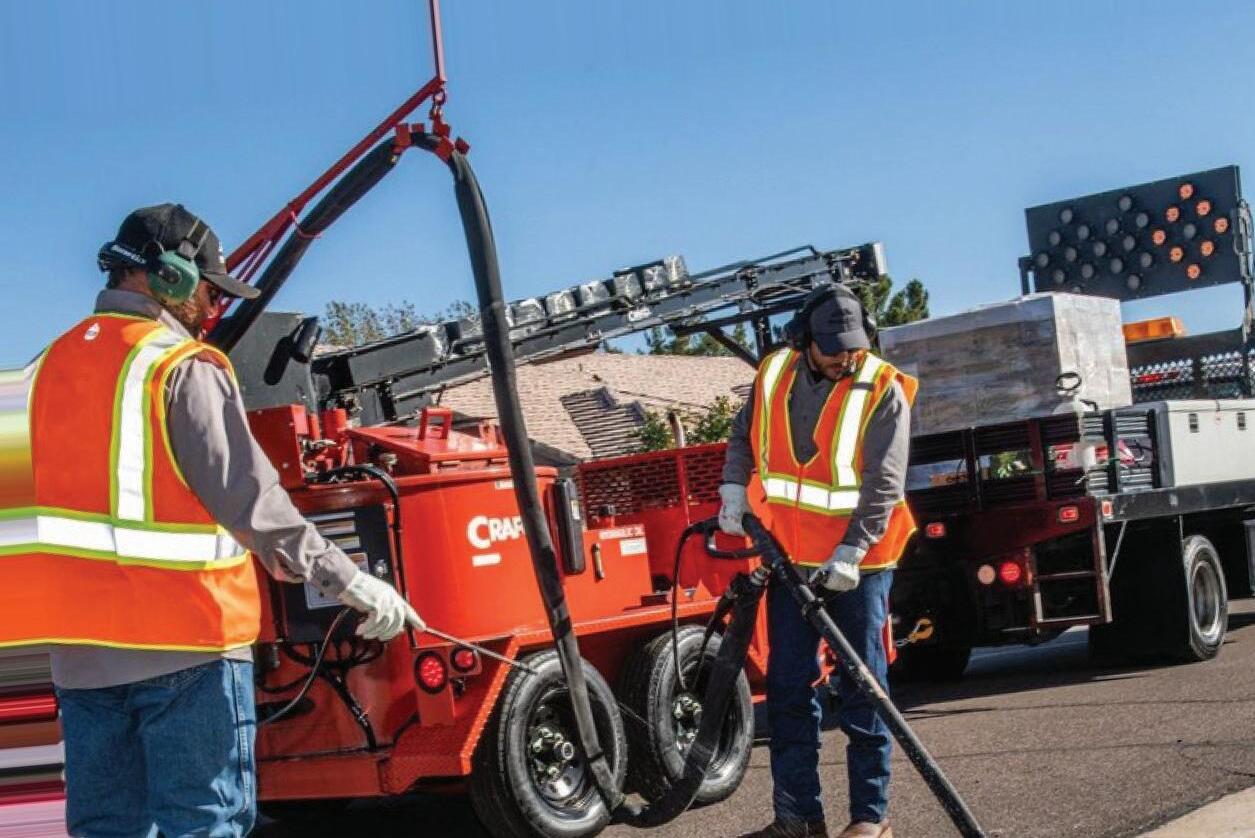
CRAFCO’S PICKING UP THE LUNCH TAB
FOR HARDWORKING CRACK SEALING CREWS!

This summer, Pavement Maintenance & Reconstruction is highlighting jobsites and the hardworking crews across the U.S. utilizing Crafco crack sealing machines. Submit your action shots for a chance to be featured by Pavement Maintenance & Reconstruction and your crew could win lunch from Crafco! Three winning crews will receive:

Restaurant gift card to location of choice*


Crafco swag


Shareworthy recognition on our social media pages


Entering is easy:

Snap a jobsite picture of your Crafco crack sealer in action Go to CrackSealSnapshot.com


Upload your photo and submit your information for a chance to win lunch!
Submit your photos TODAY!
to 20
*Up
People
SCAN TO ENTER!
BROUGHT TO YOU BY:
Snapshot
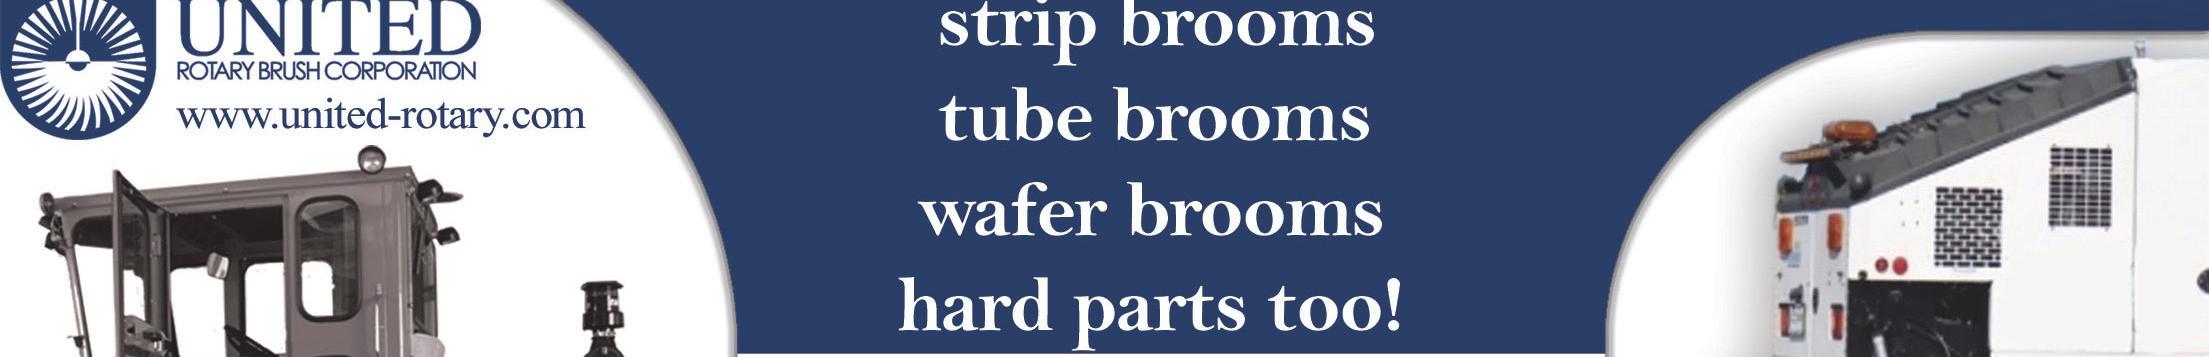
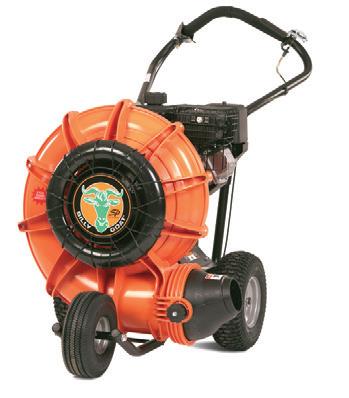
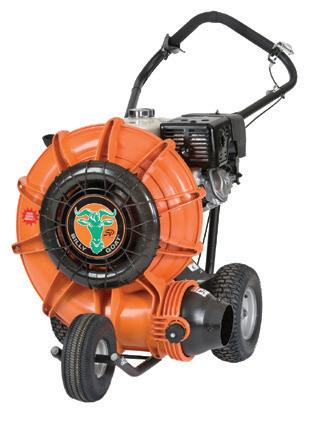
Billy Goat® Blower Line-Up from 6 to 35 gross HP
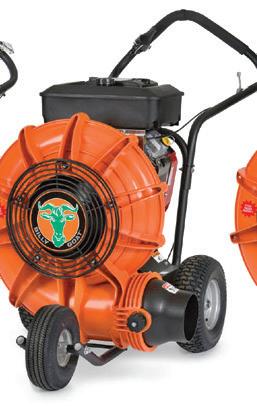


Compact Stand-On Blower
Ideal for small and mid-size lot cleaning.

3500 CFM


Also available:

X3000: 4500 CFM
23 gross HP†
627cc Vanguard®
V-Twin
Z3000: 7500 CFM
35 gross HP†
993cc Vanguard®
V-Twin
†
!
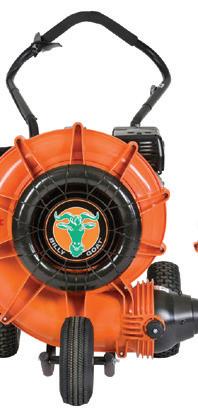
Force™ Blowersup to 18 gross HP†
Advanced composite design 16-blade fan technology


Smooth, round housing Low weight; low noise
Patented Aim N Shoot™ Push or self-propelled
F1302H, Self-propelled available, F1302SPH
†Power rated by engine manufacturer. Vanguard: All power levels are stated gross horsepower at 3,600 RPM per SAE J1940 as rated by Briggs & Stratton®


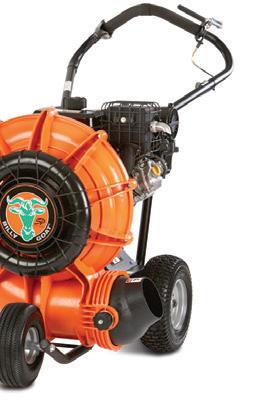

F1402SPV, Self-Propelled Vanguard 400 engine with cyclonic air filtration extends air filter replacement intervals up to 600 hours!
F902H
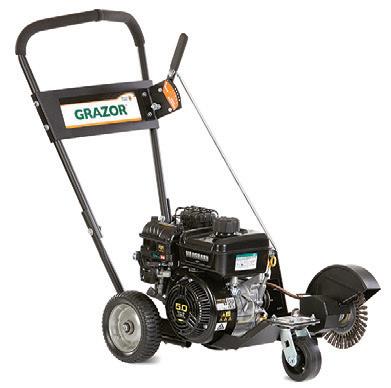
Grazor®


GZ551V
8" Steel Wire Brush
F1802V, Selfpropelled available, F1802SPV
Vanguard-powered with cyclonic air filtration!
42 PAVEMENT MAINTENANCE & RECONSTRUCTION | June/July 2023 | www.ForConstructionPros.com/Pavemen t PAVEMENT
Call 800-776-7690 or visit billygoat.com Take the chore out of the chore with Billy Goat! Call 800-776-7690 or visit billygoat.com Take the chore out of the chore with Billy Goat!
PROFIT CENTER F1002SPV Self-propelled, F1002V
F602X
EZ Liner and Arrow have joined forces to mark a new era in surface prep and pavement marking application. From in-stock Latex ValuLiners, custom-built Paint, Epoxy and Thermoplastic Stripers to Grinder and Rumble trucks, you

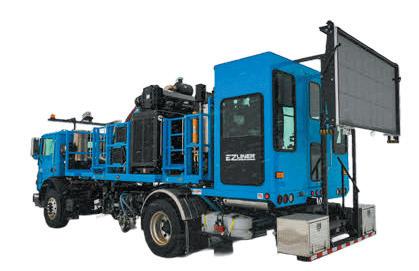

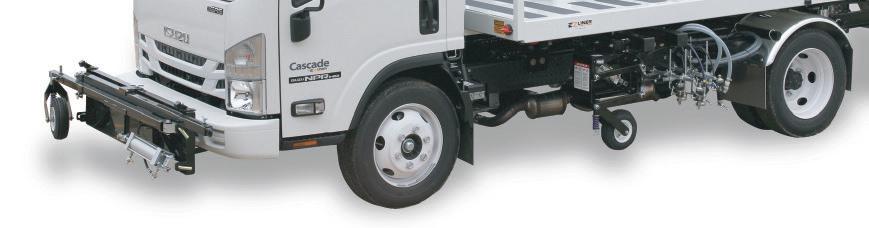
www.ForConstructionPros.com/Pavemen t | June/July 2023 | PAVEMENT MAINTENANCE & RECONSTRUCTION 43 Cascade: 110 gallon capacity Contact us today! (800) 373-4016 Latex Paint Epoxy Thermoplastic Contract #080521-EZL Rumble StripGrinder (800) 373-4016 • sales@ezliner.com • ezliner.com EZ Liner and Arrow are affiliates of VTS. We are Road-Tested. Surface Prep, Latex Striping, Thermoplastic.
get
of quality
an exceptional value. Available Now! Contact Tadashi Soma Print and Digital Advertising | 920-542-1267 | tsoma@ACBusinessMedia.com
a complete line
equipment - at


December 6-8, 2023 LOCATED AT THE SANDPEARL RESORT IN CLEARWATER BEACH, FL ATTEND THE MOST TALKED ABOUT PREMIER EDUCATIONAL CONFERENCE AND NETWORKING PROGRAM FOR PAVEMENT BUSINESS OWNERS AND HIGH-LEVEL MANAGERS FOR MORE INFORMATION, VISIT: WWW.IGNITECONSTRUCTIONSUMMIT.COM From the producers of: Register Here!
www.ForConstructionPros.com/Pavemen t | June/July 2023 Family-owned and operated since 1975. Trust our industry experts to help you grow your business and optimize your time and efforts. QUALITY YOU NEED. SERVICE YOU DESERVE. 800.543.7077 www.neyra.com PAVEMENT SEALERS | ADDITIVES & PRIMERS | CRACK SEALANTS & PATCHING SPORTS SURFACING | MARKING PAINT | TOOLS, SUPPLIES & EQUIPMENT “CUSTOMER FIRST” FOCUS INDUSTRY LEADING INNOVATION EXCEPTIONAL CUSTOMER SERVICE PREMIUM PRODUCT QUALITY Contact Tadashi Soma Print and Digital Advertising | 920-542-1267 | tsoma@ACBusinessMedia.com
Organizational Structure That Scales With Your Growth
Start by determining the functional areas (departments) you’ll have in your business. For most companies this will include: Operations, scheduling, project management, procurement, service teams, administration, accounting, administrative, facilities, HR, IT, payroll, sales & marketing, and customer service.
Every company is different, and you may choose to add additional functional areas or name your functional areas differently. You should think through the following criteria when setting your functional areas:

➊ What needs to get done for your company to succeed?
➋ Which functions within the business fit best together as one unit?
➌ How will your company work most effectively?
➍ Who is the right leader (not a specific person, but functional area leader) to oversee a particular task or responsibility?
➎ If you were to have a departmental meeting for each functional area, which people in the same room will make the most efficient use of that meeting time?
If you’re trying to determine which functional areas make the most sense in your company, you’re going to think about the different tasks/responsibilities/ outcomes that you need to see in your business to operate effectively. For example, you’ll know that you need to sign new jobs to create revenue. You determine that you don’t want the person in charge of sales to get bogged down with managing the production of the project. So, you decide Sales is a function you need separate from Operations. Where you put each function/ responsibility is up to you, just think
through the most efficient way to get from A to Z.
ORGANIZATIONAL CHART
Once you have determined your functional areas, you’ll then need to come up with your organizational chart. This will outline each position you believe you will need in your company. Again, do not think about the people you have, can afford, or how big you are right now, but think about the responsibilities that you need to be assigned for business to get done. For a while, each person will likely be filling multiple roles. Think about the ideal company structure. For example, you may decide that a Production Manager is needed to oversee the scheduling of all jobs and ordering of product, but you need a Project Manager to manage and run specific projects. Those may be two separate roles, even if you can only have one person managing both right now.
It's important to think about the best separation of work when your company is at a larger scale, so you can think through what really makes sense. Just because your office manager currently does your accounting, doesn’t mean that’s the right person to handle accounting in your ideal structure.
Every role within your company should have different responsibilities. No position should have the same responsibilities as someone else. For example, if your vice president of sales and marketing is responsible for setting marketing strategy, then your marketing director cannot also be responsible for setting marketing strategy. However, your marketing director could be responsible for carrying out the marketing plan. One sets the strategy, and another carries out the plan – these are different responsibilities.
You may wonder how this works if you have five different sales managers? You may think they are all accountable to the same outcomes or responsibilities. However, there is likely a specific distinction for each sales manager, whether it be a specific region, a certain type of account, or specifically assigned accounts.
The most important thing to remember when developing your organizational chart is that no two roles can have the same responsibilities. However, you CAN have the same person covering multiple roles. This will happen during the early stages of a business. You will create your ideal organizational chart and have 25 different positions, but you will only currently have five people on staff. This will mean that some people are wearing multiple hats. Make sure that there is a name in each box, and that someone is responsible for all tasks/outcomes in each role. When you’re first starting out, this may mean that you, the owner, are wearing 25 hats!
Getting your organizational structure set up for your business is an important first step for being ready when your business starts to scale. It is much easier to update and rework your structure as you go if you already have a good foundation in place. If you don’t, you’ll end up running your business like a mouse on a wheel and never feel like you’re getting anywhere. ■
by Shauna Huntington, founder and CEO at Fortiviti and the creator of The Small Business Bootcamp, www.smallbusinessbootcamp.com
For more information visit https://pavemg.com/it32xj
AdobeStock_157565240 YOUR BUSINESS MATTERS 46 PAVEMENT MAINTENANCE & RECONSTRUCTION | June/July 2023 | www.ForConstructionPros.com/Pavemen t
The structure and organization of your business is critical to growing profitably.
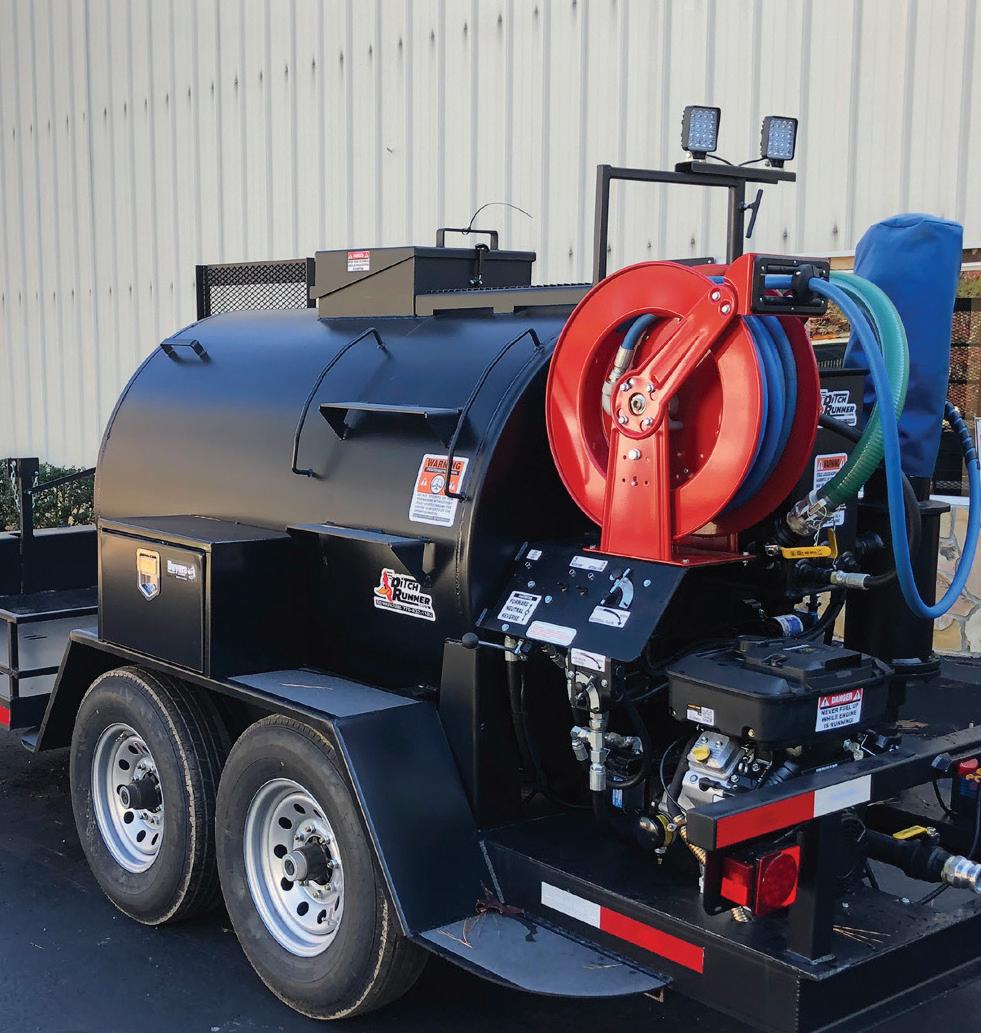


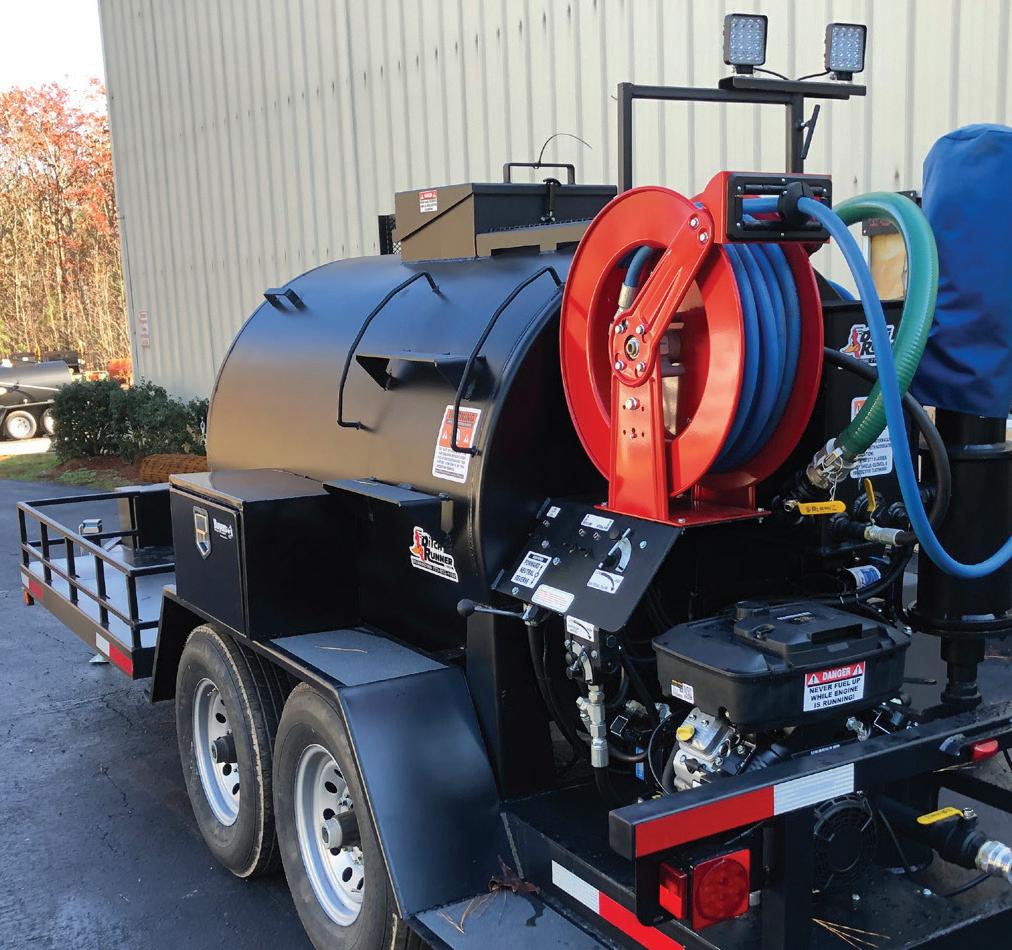


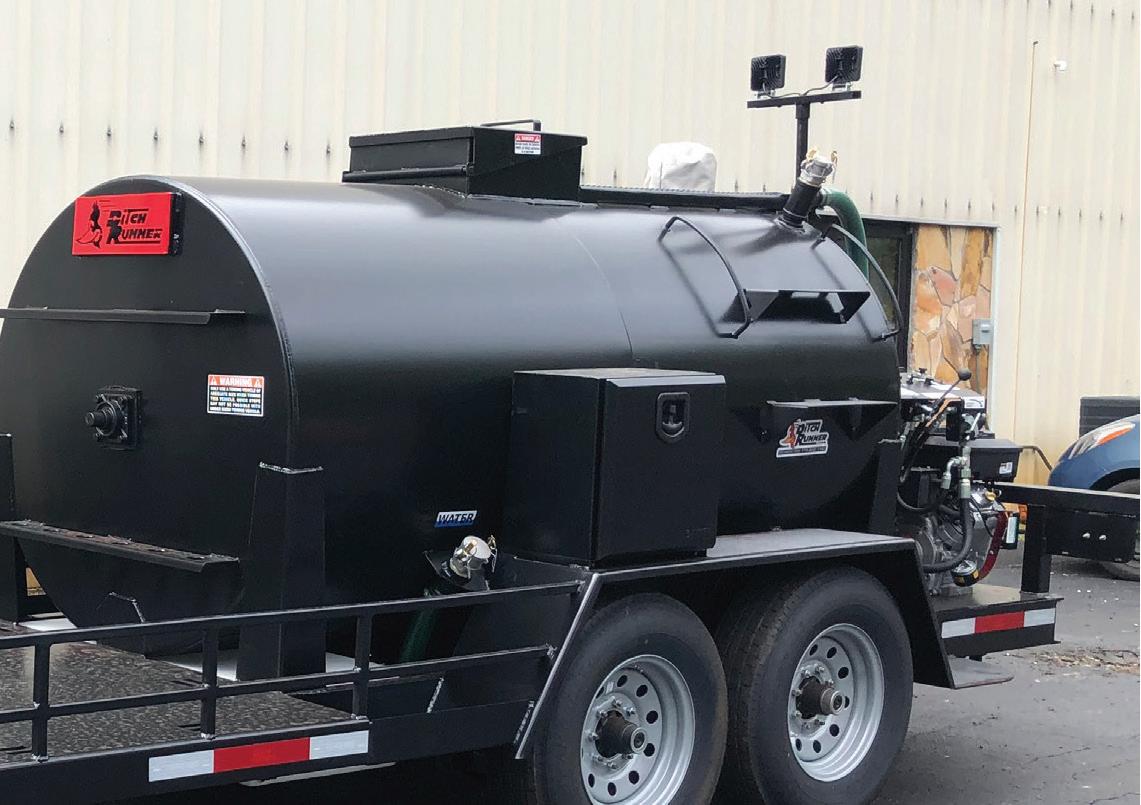


www.ForConstructionPros.com/Pavemen t | June/July 2023 | PAVEMENT MAINTENANCE & RECONSTRUCTION 47 DITCHRUNNER'S BONANZA AVAILABLE IN 600 GAL., 800 GAL. & 990 GAL. SEE OUR OTHER MACHINES AT DITCHRUNNER.COM REID MANUFACTURING, LLC 155 EVELYN S. WADE BLVD., BUCHANAN, GA 30113 770-832-1192 SALES • 770-646-6998 SERVICE/SALES CLASSIFIEDS


CONTRACTORS CONSTRUCTION TO WORK FOR IN 2023 Apply for a chance to be acknowledged as an exceptional employer that demonstrates people are their most important asset. Completing the application process online is FREE and gaining the distinction of being a best contractor provides the advantage of attracting the workforce you need during the labor shortage. Be recognized as a BEST contractor To be considered, eligible contractors are required to have a minimum of 15 full-time or part-time employees in the U.S. and a primary business of: General Building Construction, Earthmoving, Paving, Concrete or Specialty and trades (Underground, Utility, Electrical, HVAC, Demolition, etc.) Apply today at BestContractorsToWorkFor.com APPLICATION DEADLINE JULY 7, 2023 SCAN HERE


www.ForConstructionPros.com/Pavemen t | June/July 2023 | PAVEMENT MAINTENANCE & RECONSTRUCTION 49 CLASSIFIEDS Contact Tadashi Soma Print and Digital Advertising 920-542-1267 | tsoma@ACBusinessMedia.com ESTABLISHED PAVING, SEALING AND CONCRETE BUSINESS IN COASTAL SOUTH CAROLINA. 4.5 million annual sales. Serious and confidential inquiries only. pscsouth50@gmail.com www.libertysupply.biz Spray Tips Liberty Supply 1/4”, 3/8” & 1/2” NPT 80/10, 80/20, 80/30, 80/40, 80/50, 80/70, 80/100 (800) 397-9907 DRIVEWAY CARE BOOKLETS Order online at: www.asphaltpress.com Spanish version available Or call 610-489-PAVE


50 PAVEMENT MAINTENANCE & RECONSTRUCTION | June/July 2023 | www.ForConstructionPros.com/Pavemen t CLASSIFIEDS 100% Guaranteed PM 6-23 Haskell Lemon --Hi-Lite Markings --Highway Safety --Knife River --Kokosing --Mathy Const --NY Dot --Northeast Asphalt --Payne & Dolan --Plote --Suit-Kote A-1 Chipseal – Ajax Paving --Alaska DOT --Albuquerque Asphalt – Alex Paris --American Asphalt --APAC Asphalt Maint. Co –AT&T --Austin Bridge & Road --Barron County --Blacktop Services --Bonneville Power Adm --Chrisp Co –Citys all around the worldDeSilvaGates Const. --Diversified Concrete Cutting --Earle Asphalt – Glenn O. Hawbaker --Hard Drives Const. 8 Different Models E I r nfnioe@@FFaass t t MMeeaassuurree.ccoomm w w ww w ww w w...F F Fa a as s st t tM M Me e ea a as s su u ur r re e e...c c co o om m m 8 8 88 8 88 8 8--8 8 87 7 76 6 6--6 6 60 0 05 5 50 0 0 C C Co o ou u un n nt t t o o on n n U U Usss!!! CR® F F Fa a as s stttM M Me e ea a as s su u ur r re e e i iis s s a a a s s sm m ma a allllll,,, rre e el l li i ia a ab b bl l le e e, , , a a ac c cc c cu u ur r ra a at t te e e & & e e ea a as s sy y y t tto o o u u us s se e e D D Di i is s st t ta a an n nc c ce e e M M Me e ea a as s su u ur r riiin n ng g g D D De e ev v viiic c ce e e t tth h ha a attt m m mo o ou u un n nttts s s o o on n a a an n ny y yttth h hi i in n ng g g t t th h ha a at t t r r ro o olllllls s s. . Preps the area for Sealcoating or Striping Crack Cleaning Option Now Included! Cleans tight places where Sweepers can’t Helps to Prep crankcase oil spills Dealer Inquires Welcome www.bensinkrotarybroom.com www.bensinkmfg.com 503-580-0183 MAKING THE HARD PART EASIER! Check out our online video! 3 Models Available Hydraulic Model RBHGX
AN IMMERSIVE EXPERIENCE
This unique event will help contractors and business owners propel their business and expertise forward with live equipment demonstrations, an in-depth educational program and deeper connection opportunities on an expansive trade show floor.
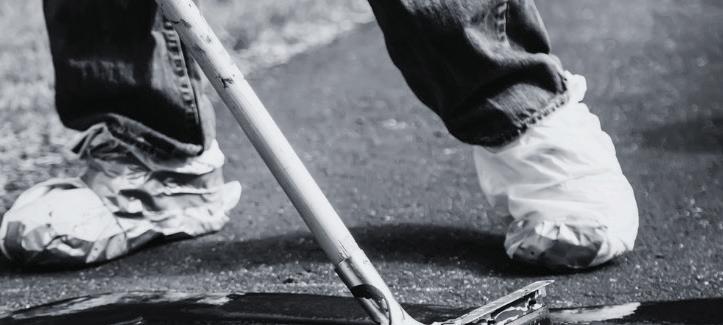
JANUARY 30 - FEBRUARY 1, 2024
Henry B. Gonzalez Convention Center - San Antonio, TX
FOR MORE INFORMATION, VISIT: PAVEXSHOW.COM

BROUGHT TO YOU
BY
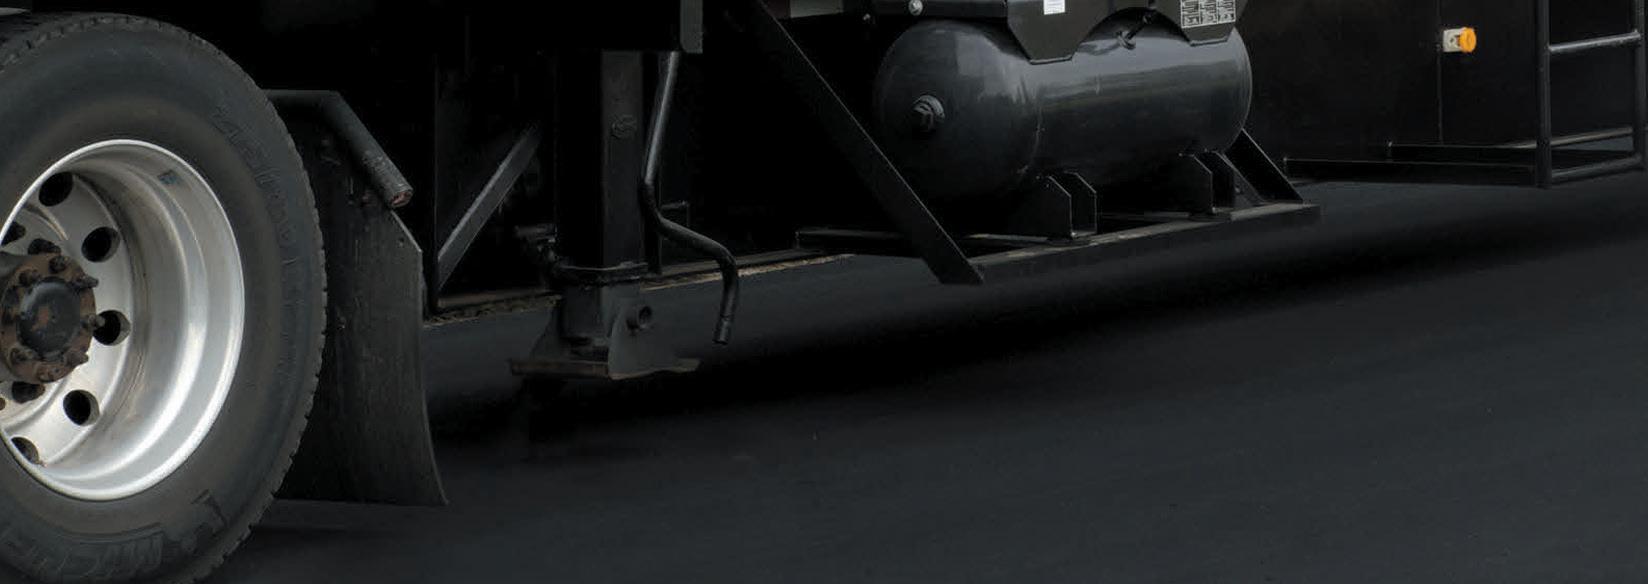
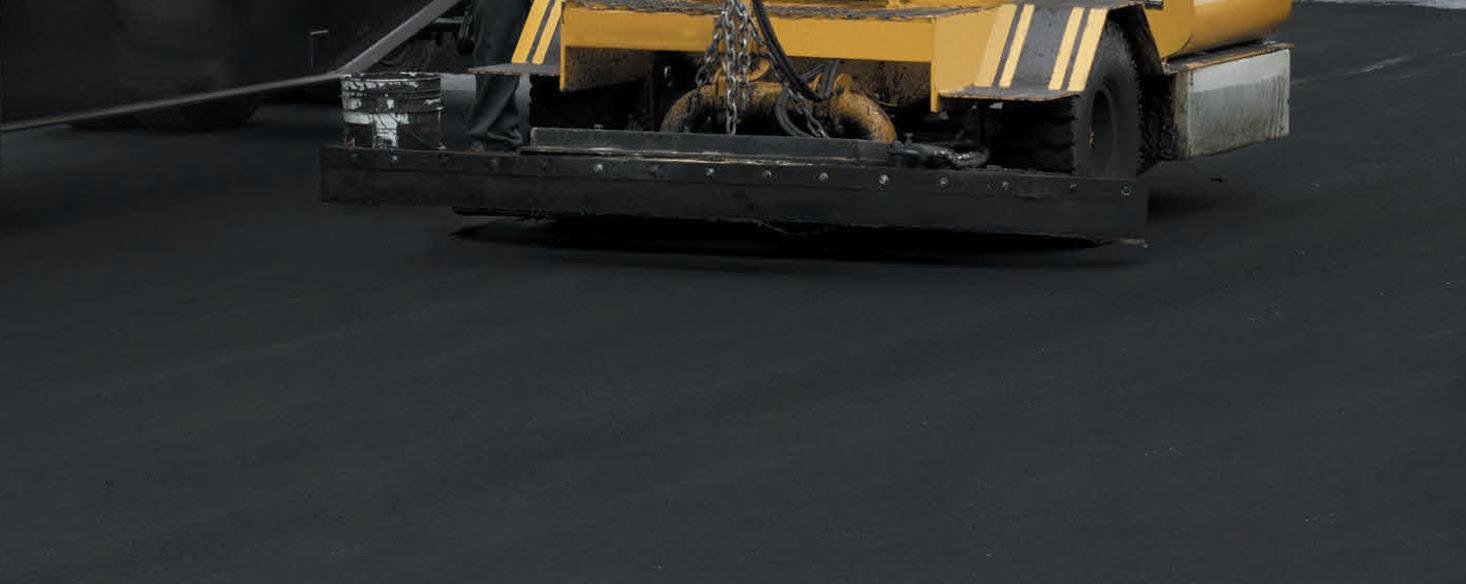

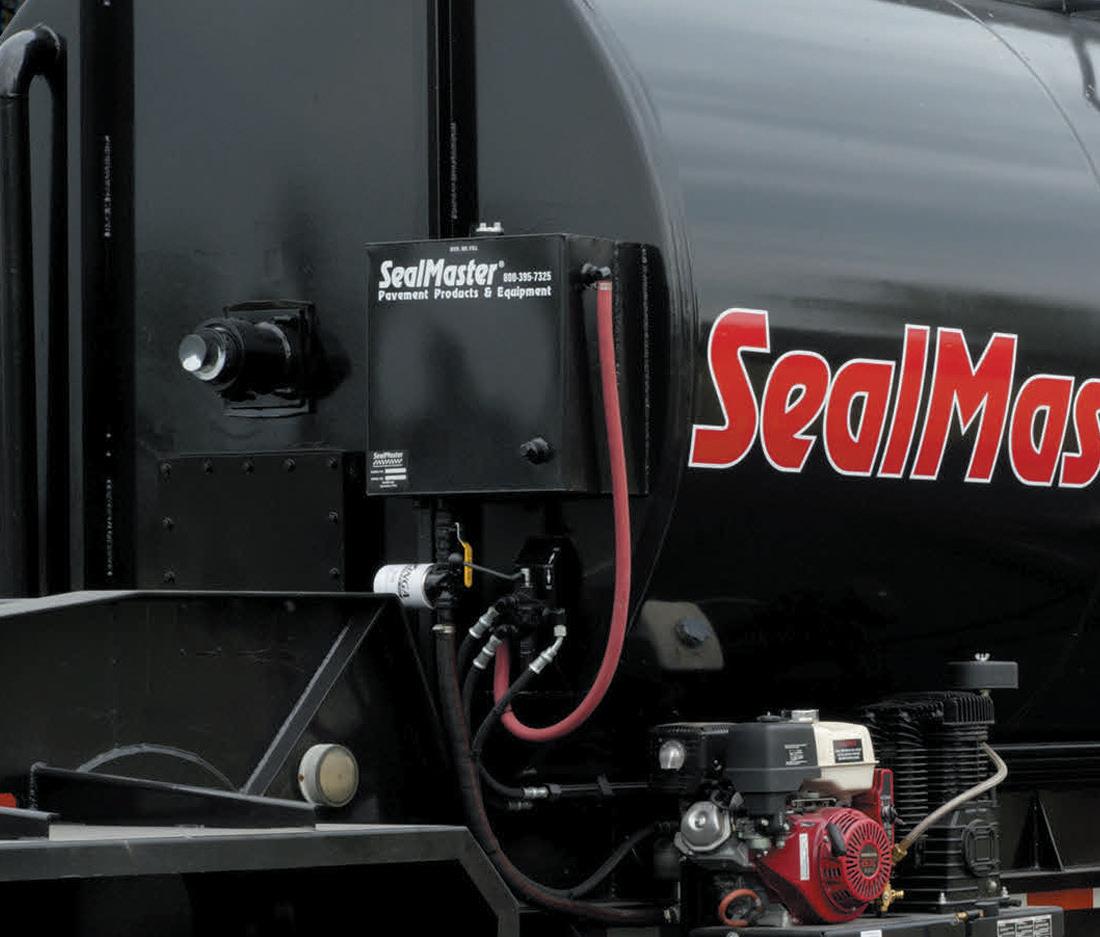

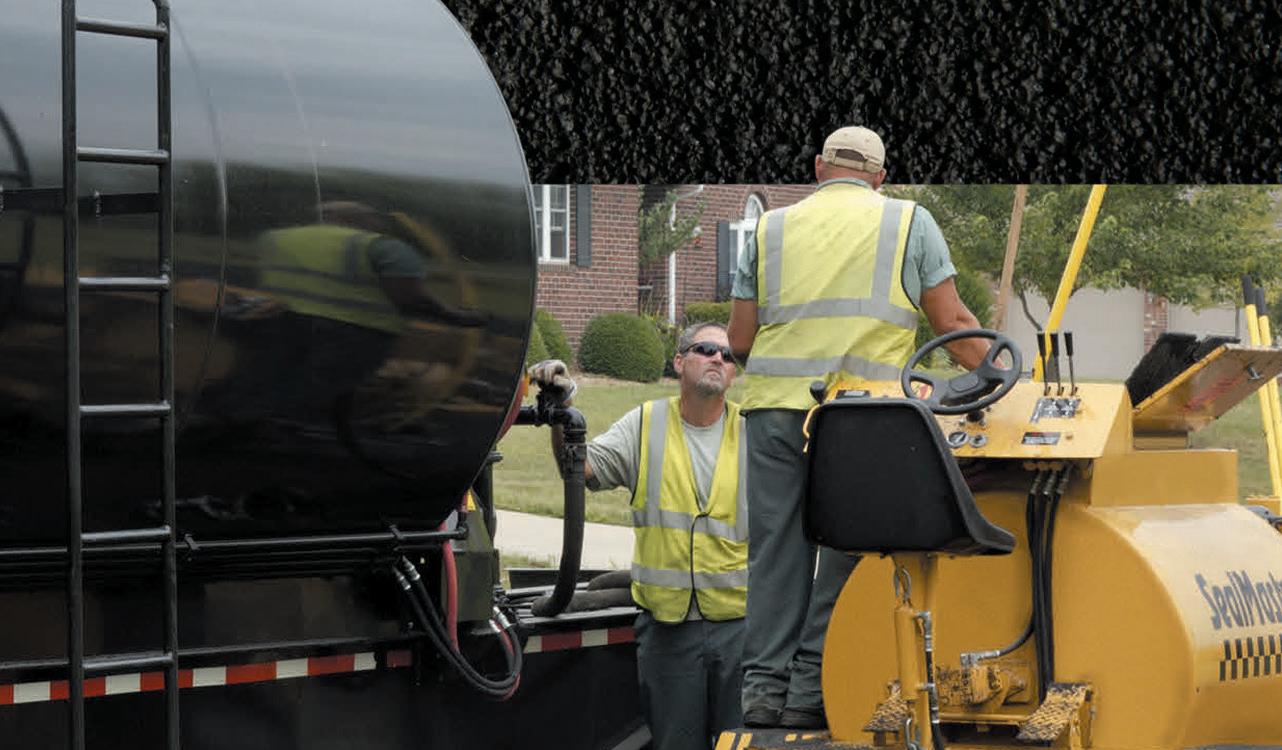


a pavement sealer that is truly “READY TO APPLY.”
need to add sand, water or additives. Everything is factory blended for consistency and optimum performance. ULTRA ADVANTAGES • Spend time on the jobsite “Applying Sealer” rather than “Mixing Sealer” • Avoid injuries from lifting heavy sand bags • Ultra is a better sealer - Higher solids and Faster drying Visit SealMasterUltra.com or contact SealMaster at 1-800-395-7325 to learn how you can double your production today. sealmaster.net | LOCATIONS NATIONWIDE DOUBLE YOUR PRODUCTION BY CUTTING YOUR SEALCOATING TIME IN HALF This Changes Everything! ULTRA PAVEMENT SEALERS ®
Finally,
No
