S D S I D
Kuldiga May 2025
Exploring LATCH , us and pants in 3 Days
May 7-9,, 2025 Kuldiga

Kuldiga May 2025
Exploring LATCH , us and pants in 3 Days
May 7-9,, 2025 Kuldiga

(the “p” is silent)
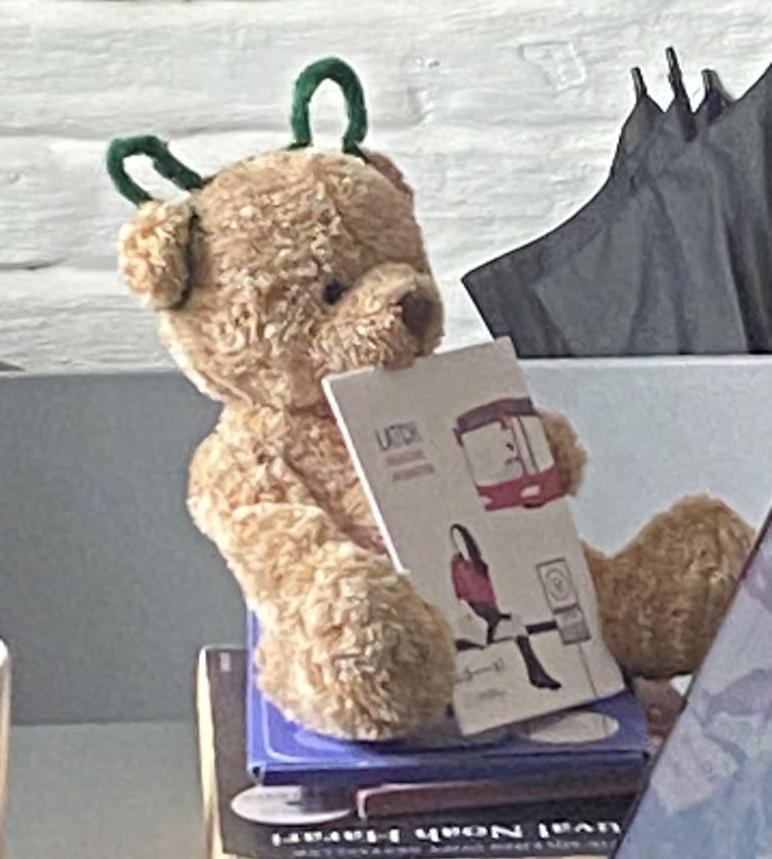
Teddy bear, Juan Pablo, takes Wall Street by STORM.

Have you seen the Data Man?
Ashwin Vasudevan is crunching all the numbers. Says “Wrong!” to fake data crunchers.

Coffee bandit strikes again!
Last night the coffee machine was ravaged yet again. Sound of ice cubes heard in kitchen. Witnesses say they saw Veronica Bautista leaving the scene in a hurry.

Ramitar Burasai says “Whaat?” Follow along as more news is to follow.
“Wouldn't
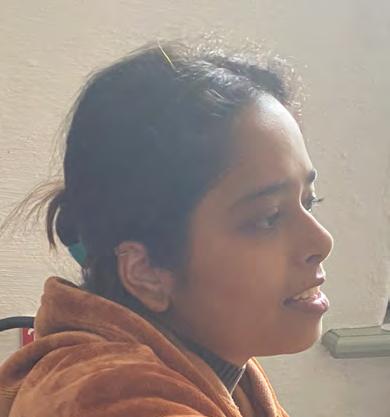
Elusive Chaynika Gujela caught on camera talking to someone.
Government surveillance
Person taking pictures of everyone finally caught. “It was for a school project” says Erik Heiki Veelmaa
says
local Brazilian.


Perpetrators caught for being late again!

Witnesses say the Watch appeared without warning , issuing scrolls of summons and confiscating coffee cups. One student attempted to argue their case , citing a long coffee line. The Watch was unmoved.

KULDĪGA — Why are some students late to class? It seemed like a basic time management issue, until our team started digging deeper.
Let us take you through it.

In a master’s program filled with students from across the globe, we quickly learned that “being on time” doesn’t mean the same thing to everyone. Some see time as flexible, others as rigid. For many, routine is shaped by cultural norms, mobility, mental load, or daily rhythms.
As part of our Information Design coursework, we turned this shared classroom puzzle into a research challenge. Using surveys and storytelling, we mapped perceptions of time within our cohort.
What we found surprised us
Distance wasn’t the issue—many who lived nearby still arrived late Cultural context shaped behavior more than clocks did Systemic structures and peer dynamics subtly influenced how people viewed time.
This newspaper documents our design exploration of a simple question and the complex human answers we uncovered for the Information Design

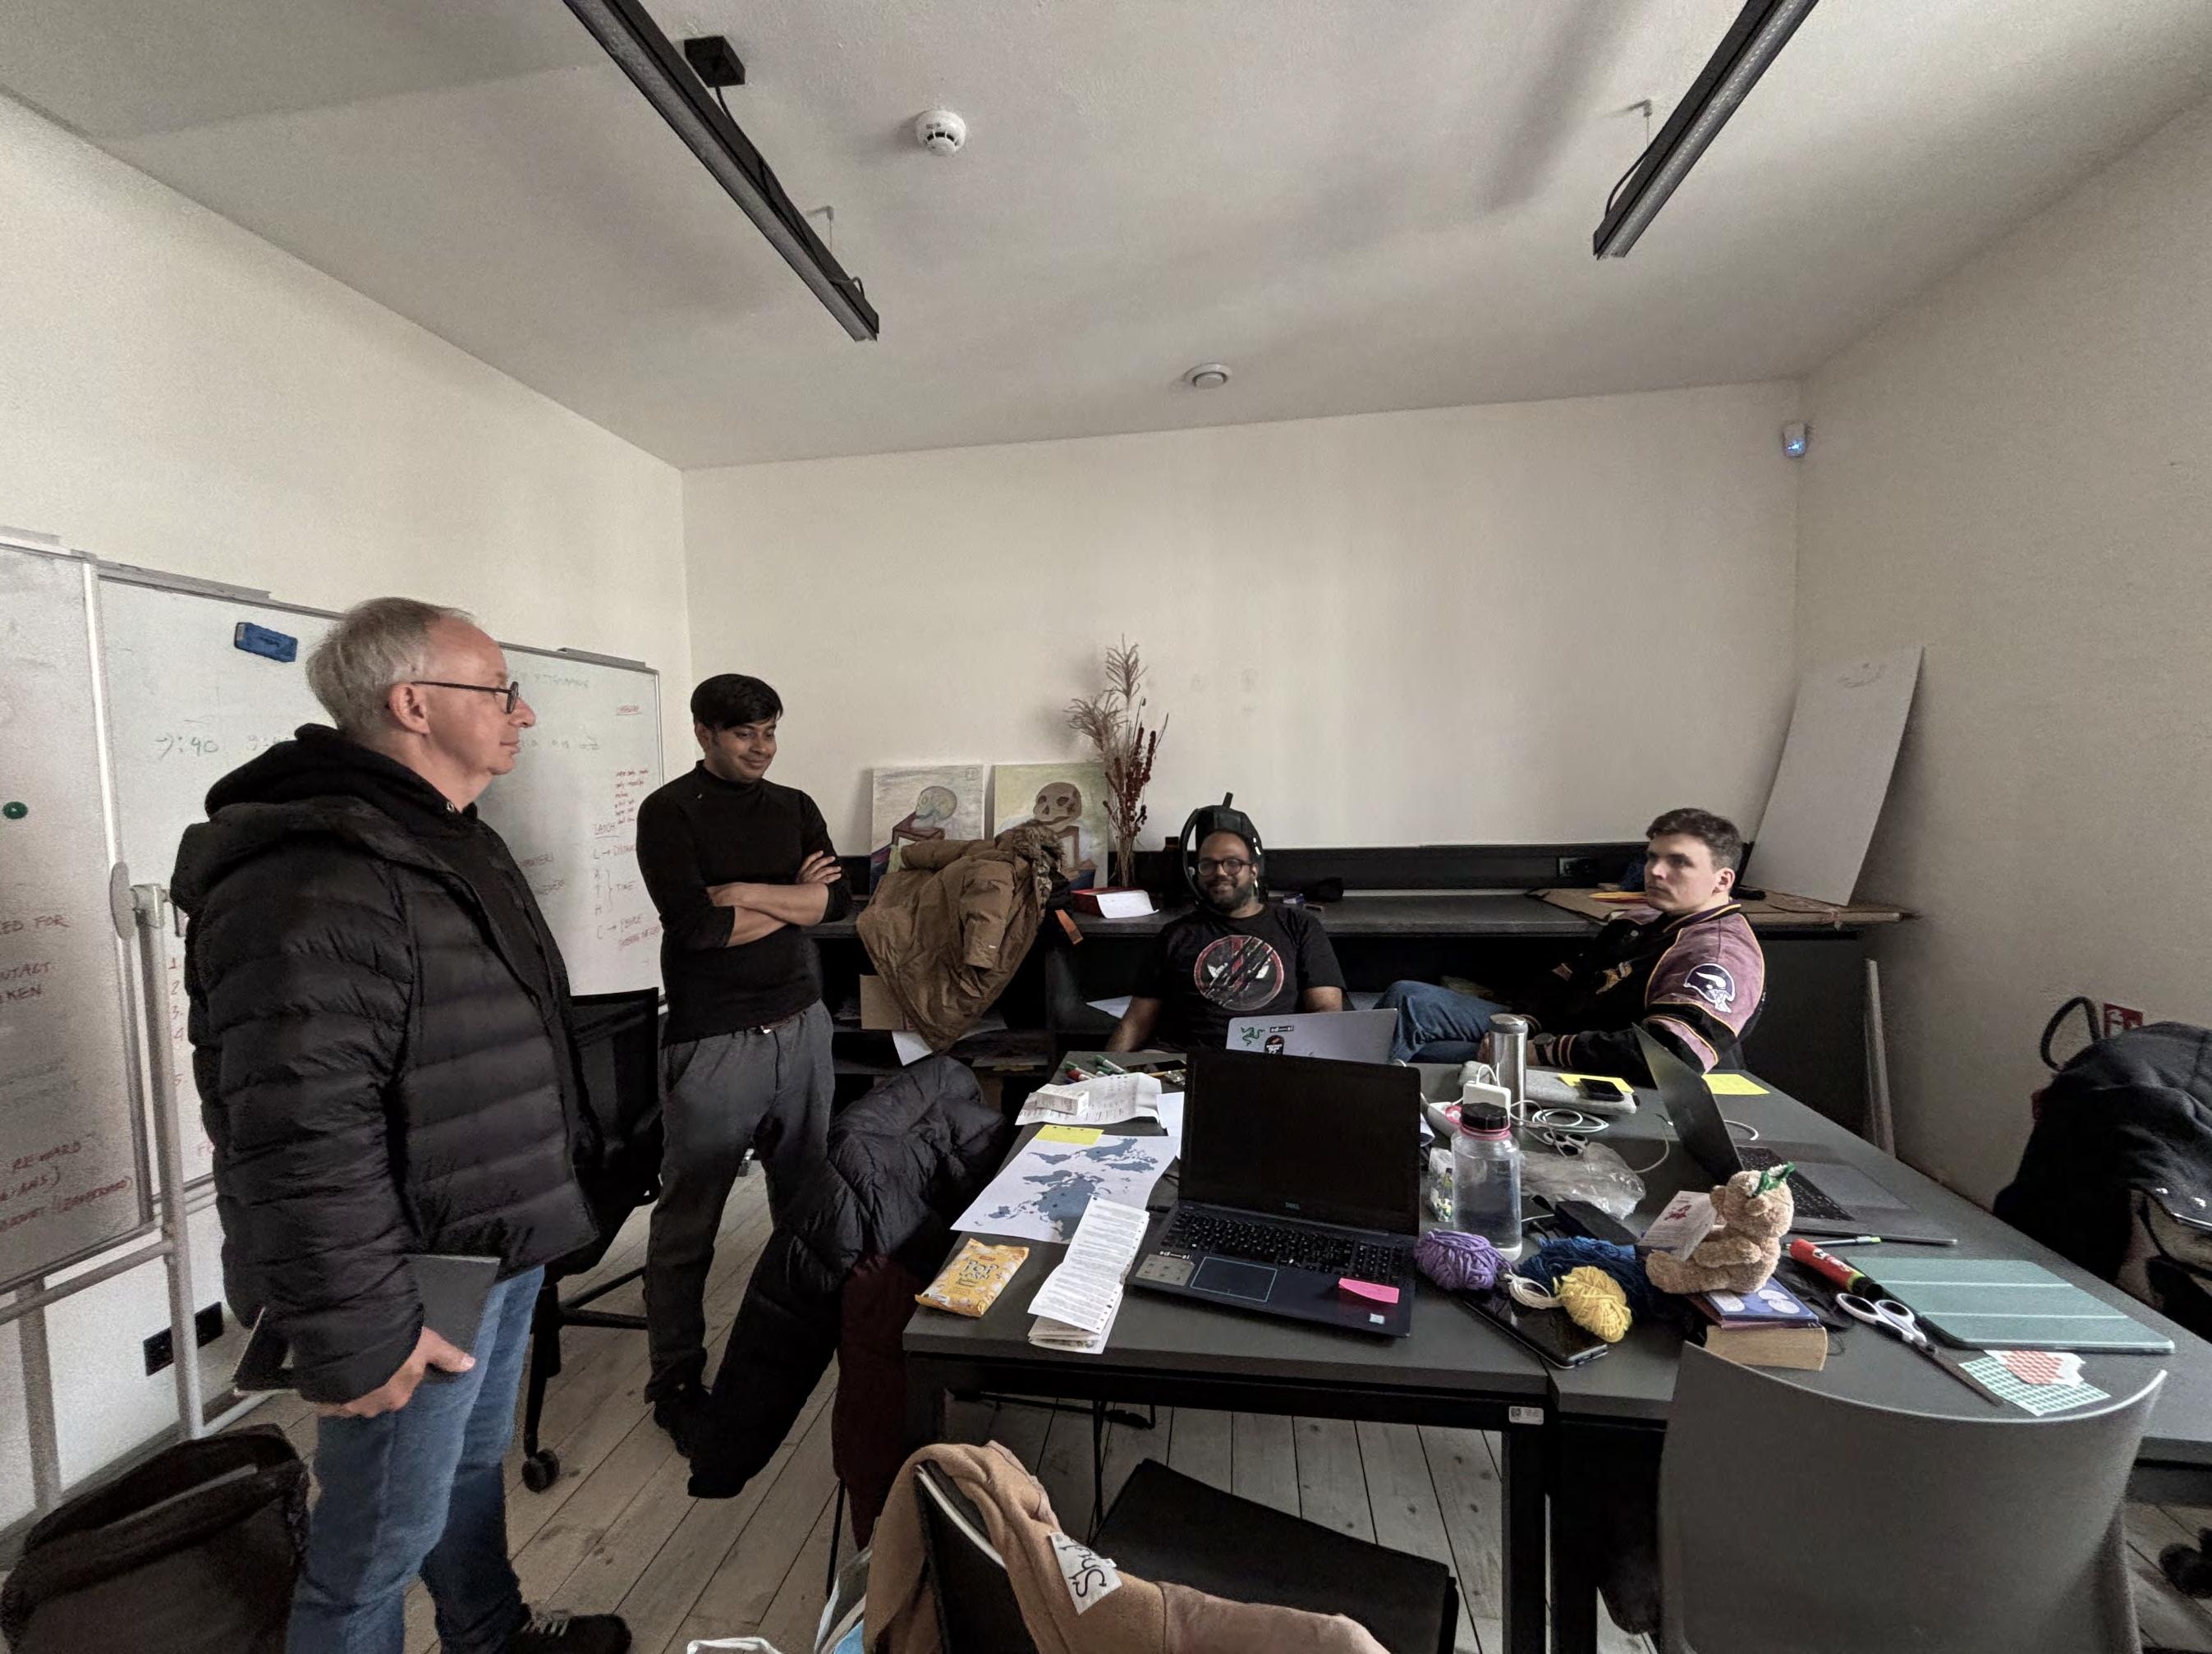
“We don’t know what we’re doing, but we’ll uncover the truth!” says team devoted to work.


Before we could design anything, we had to first understand what “being on time” actually means to the people around us?
In a classroom filled with students from more than twenty countries, this question was necessary. We realized early on that everyone brought their own internal clock, shaped by culture, daily routines, expectations, and personal circumstances.
We didn’t want to accuse, assume, or label anyone. Instead, we wanted to start an open-ended conversation. We wanted our classmates to reflect on their own relationship with time.
So we designed a short survey with a mix of quantitative and qualitative prompts.

“It’s for research,” says one researcher after backlash
Lazy teammate still on bathroom break!


We began simply by grounding identity.
We asked for each person’s name and country. Not to compare or stereotype, but to help us notice patterns shaped by cultural norms and regional routines.
Next, we got personal about punctuality.
What time do you usually arrive for class?
The choices being - early, on time, or late. We wanted to see how people defined themselves in relation to the official schedule.
At what time do you typically arrive for class?
(Write a specific time.)
This helped us move past vague self-perceptions and into real, comparable data. After all, someone’s idea of “on time” might be 9:50 AM. For someone else, it’s 10:05.
We then asked about the why.
We asked people to share the reason behind their arrival time, especially if they arrived late.
To see how environment plays a role, we measured distance.
Then, we asked about individuals cultures.
In your culture, what is considered “late” when arriving for a meeting or a class? This opened a window into diverse norms. This question helped us detach from our own assumptions and appreciate how time is socially constructed.
Finally, we explored expectations and emotions. These helped us understand how people value their time in terms of schedule, respect, energy, and attention. They also revealed how tolerance and frustration can vary depending on how people see rules and structures. The answers we got from these questions were fascinating and intriguing. This newspaper documents journey we had with the answers.
Person puzzled by latest conundrum.
A routine clean up of last week’s overturned tour bus on the outskirts of Narva took a peculiar turn when recovery teams uncovered a weathered leather satchel wedged between the driver’s seat and a coffee thermos shaped like the Eiffel Tower. Inside: a thick, crumpled notebook marked only “Dr. P in hurried block letters
What was inside the notebook? That’s where things get odd .
The notes said: “Do not administer to the left-handed. Time has elbows. Subject reports feeling ‘a bit like yoghurt’. Roaming sock confirmed. No further
And then, inexplicably written over several pages in various inks and pen pressures:
“Furtherance of third index trajectory... noted. Oyster? No. Never again. WARNING: The basil remembers.”
Authorities confirmed that no registered doctor was on the tour’s manifest. Nor has any passenger come forward to claim the notes. A page near the end is stained with what forensics described as probably jam , and includes the scribble: “Do not tell them about the jam.”
Local bus driver Rein Valtin was the first to spot the satchel.
“I thought it was a guide’s folder, he told BplrTTd Times, but then I read something about a ‘banana obligation’ and put it right back.
Tour organizer Helja Rink has declined to comment, citing abundant weirdness. However, a loose translation of one margin note read: “To cure the dream, imitate the shoe.”
Police have released photocopies to linguists, neurologists, and a man named Ants who insists this is how doctors really write. No connections to any known medical practice, human language, or reality based protocol have yet been established
Further investigations are ongoing. The notebook remains in

From the very beginning, we wanted to know what the students think about their own time management practice.
When asked if they arrive early, on-time, or late, students gave us their own perspectives on when they arrive in class.
But then we also asked the students to give us an estimated average of when they arrive in class. We simply asked them to write down the exact time when they arrive in class usually.


When we got the data, we set up a standard on what early, on-time and late really is.
So now we knew what the students perceived on their arrival time, we had the exact time when they arrived, and then we set up a standard of the structure of class timing.
When we cross matched the data, we saw how students bent time and space.
There was a significant difference between perception and reality.

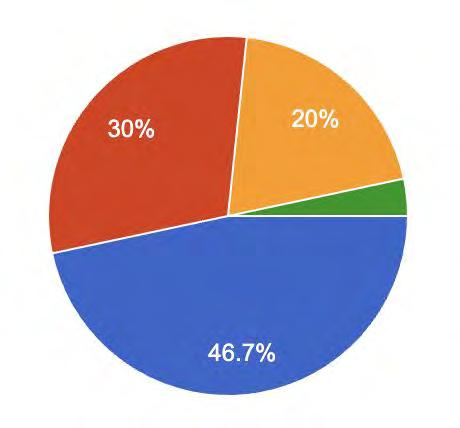
early. Almost half of the class said they arrived on time. Just around 29% said they were late.
But when we cross checked their actual entry time into the class and matched with our standard, we saw a different reality.
While 23% thought they were early, in reality more than 32% were early in class.
In their minds, almost 50% of the class thought they were on time, but when we matched with the set standards, we realized that only around 13% of the class were in class on time.
We saw a significant change in the perception and reality of being late also. In their self-reported perception, almost 29% of the students said they were late. But in reality, a significant portion of the class54.84% of the people were late.
We realized our subjects bent time and reality.
We were not surprised. After all, our classmates are pretty special.

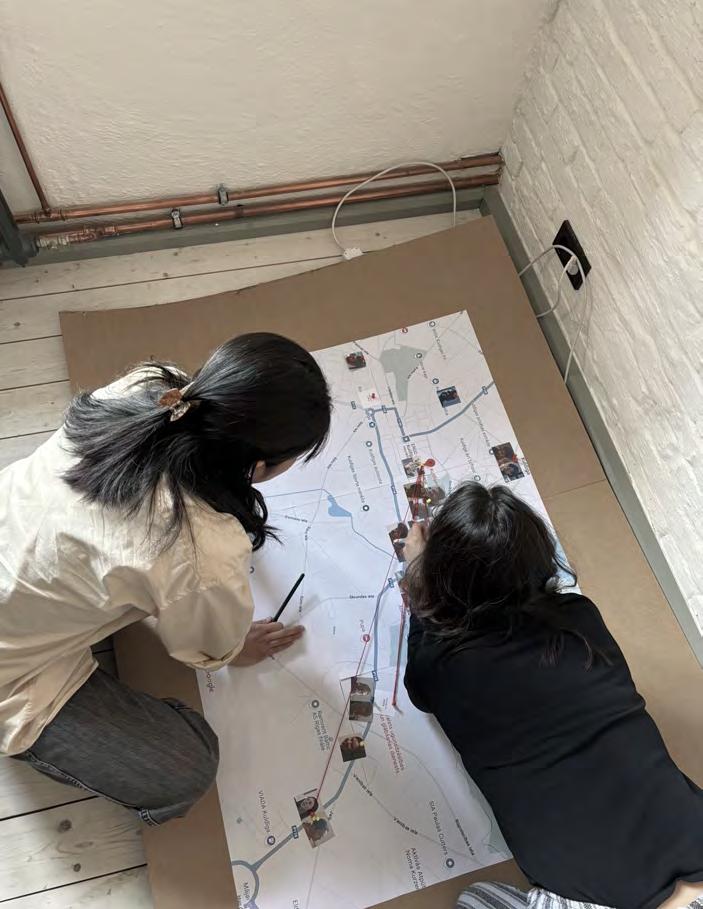
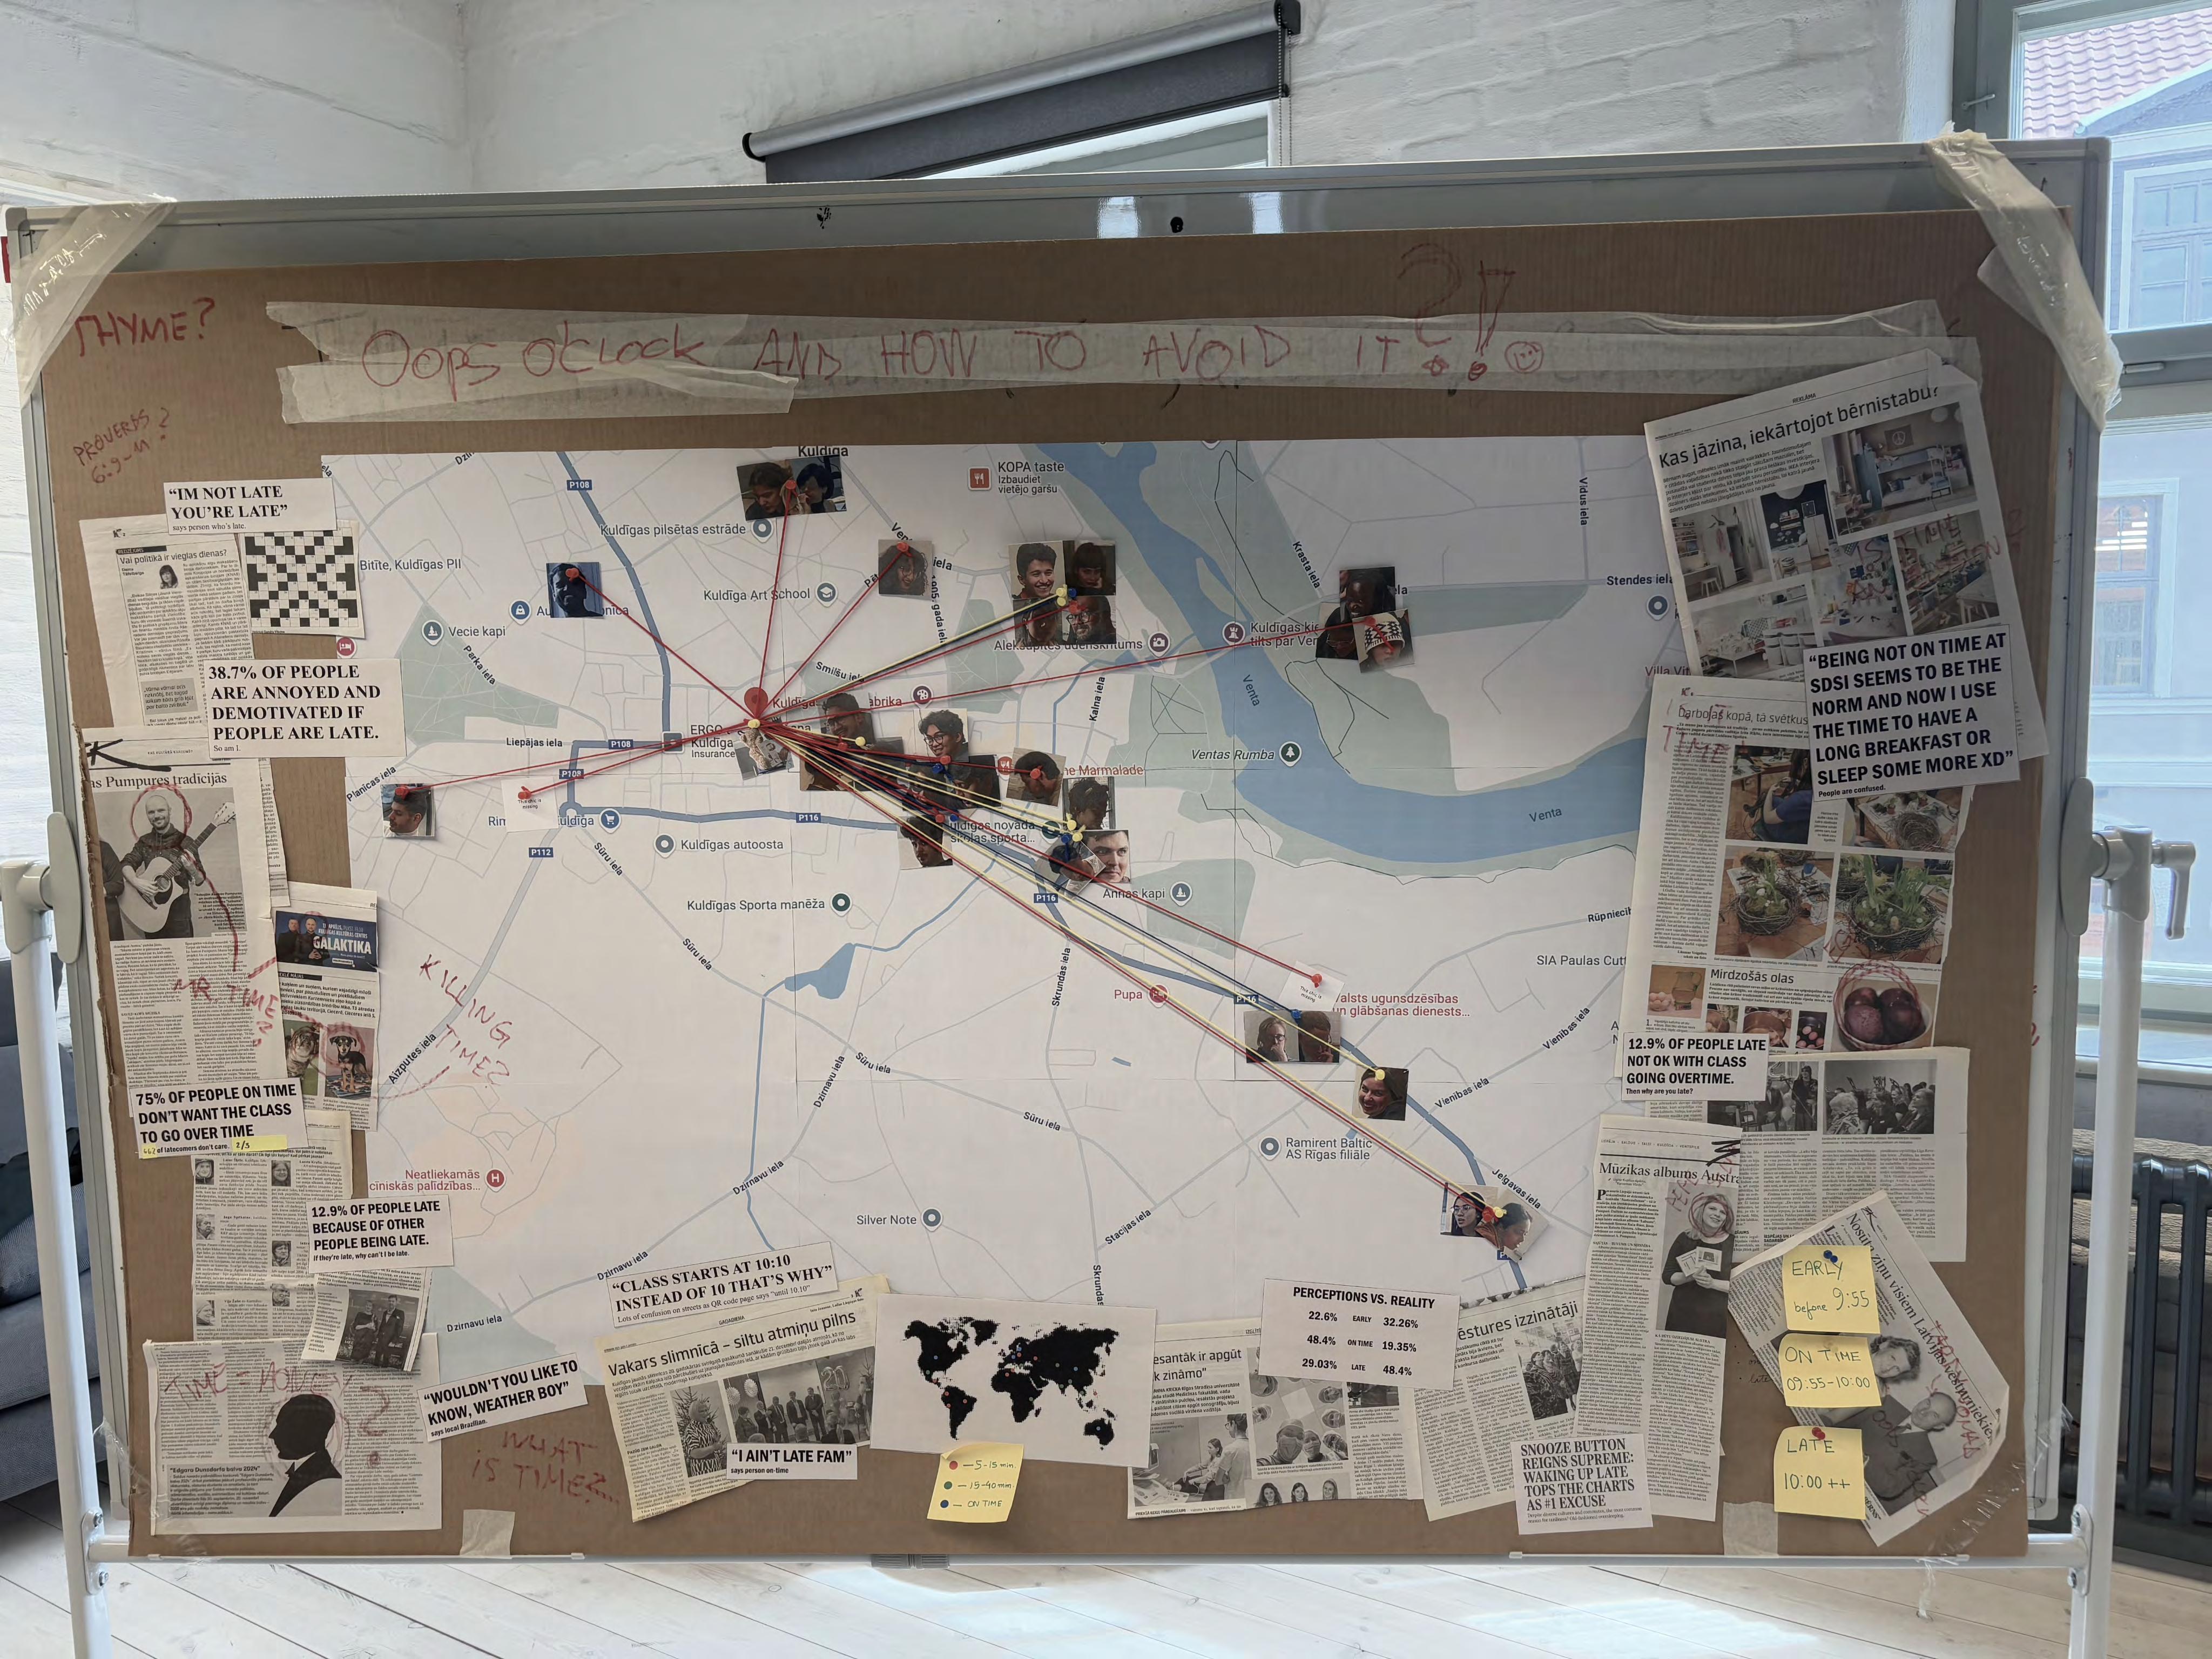
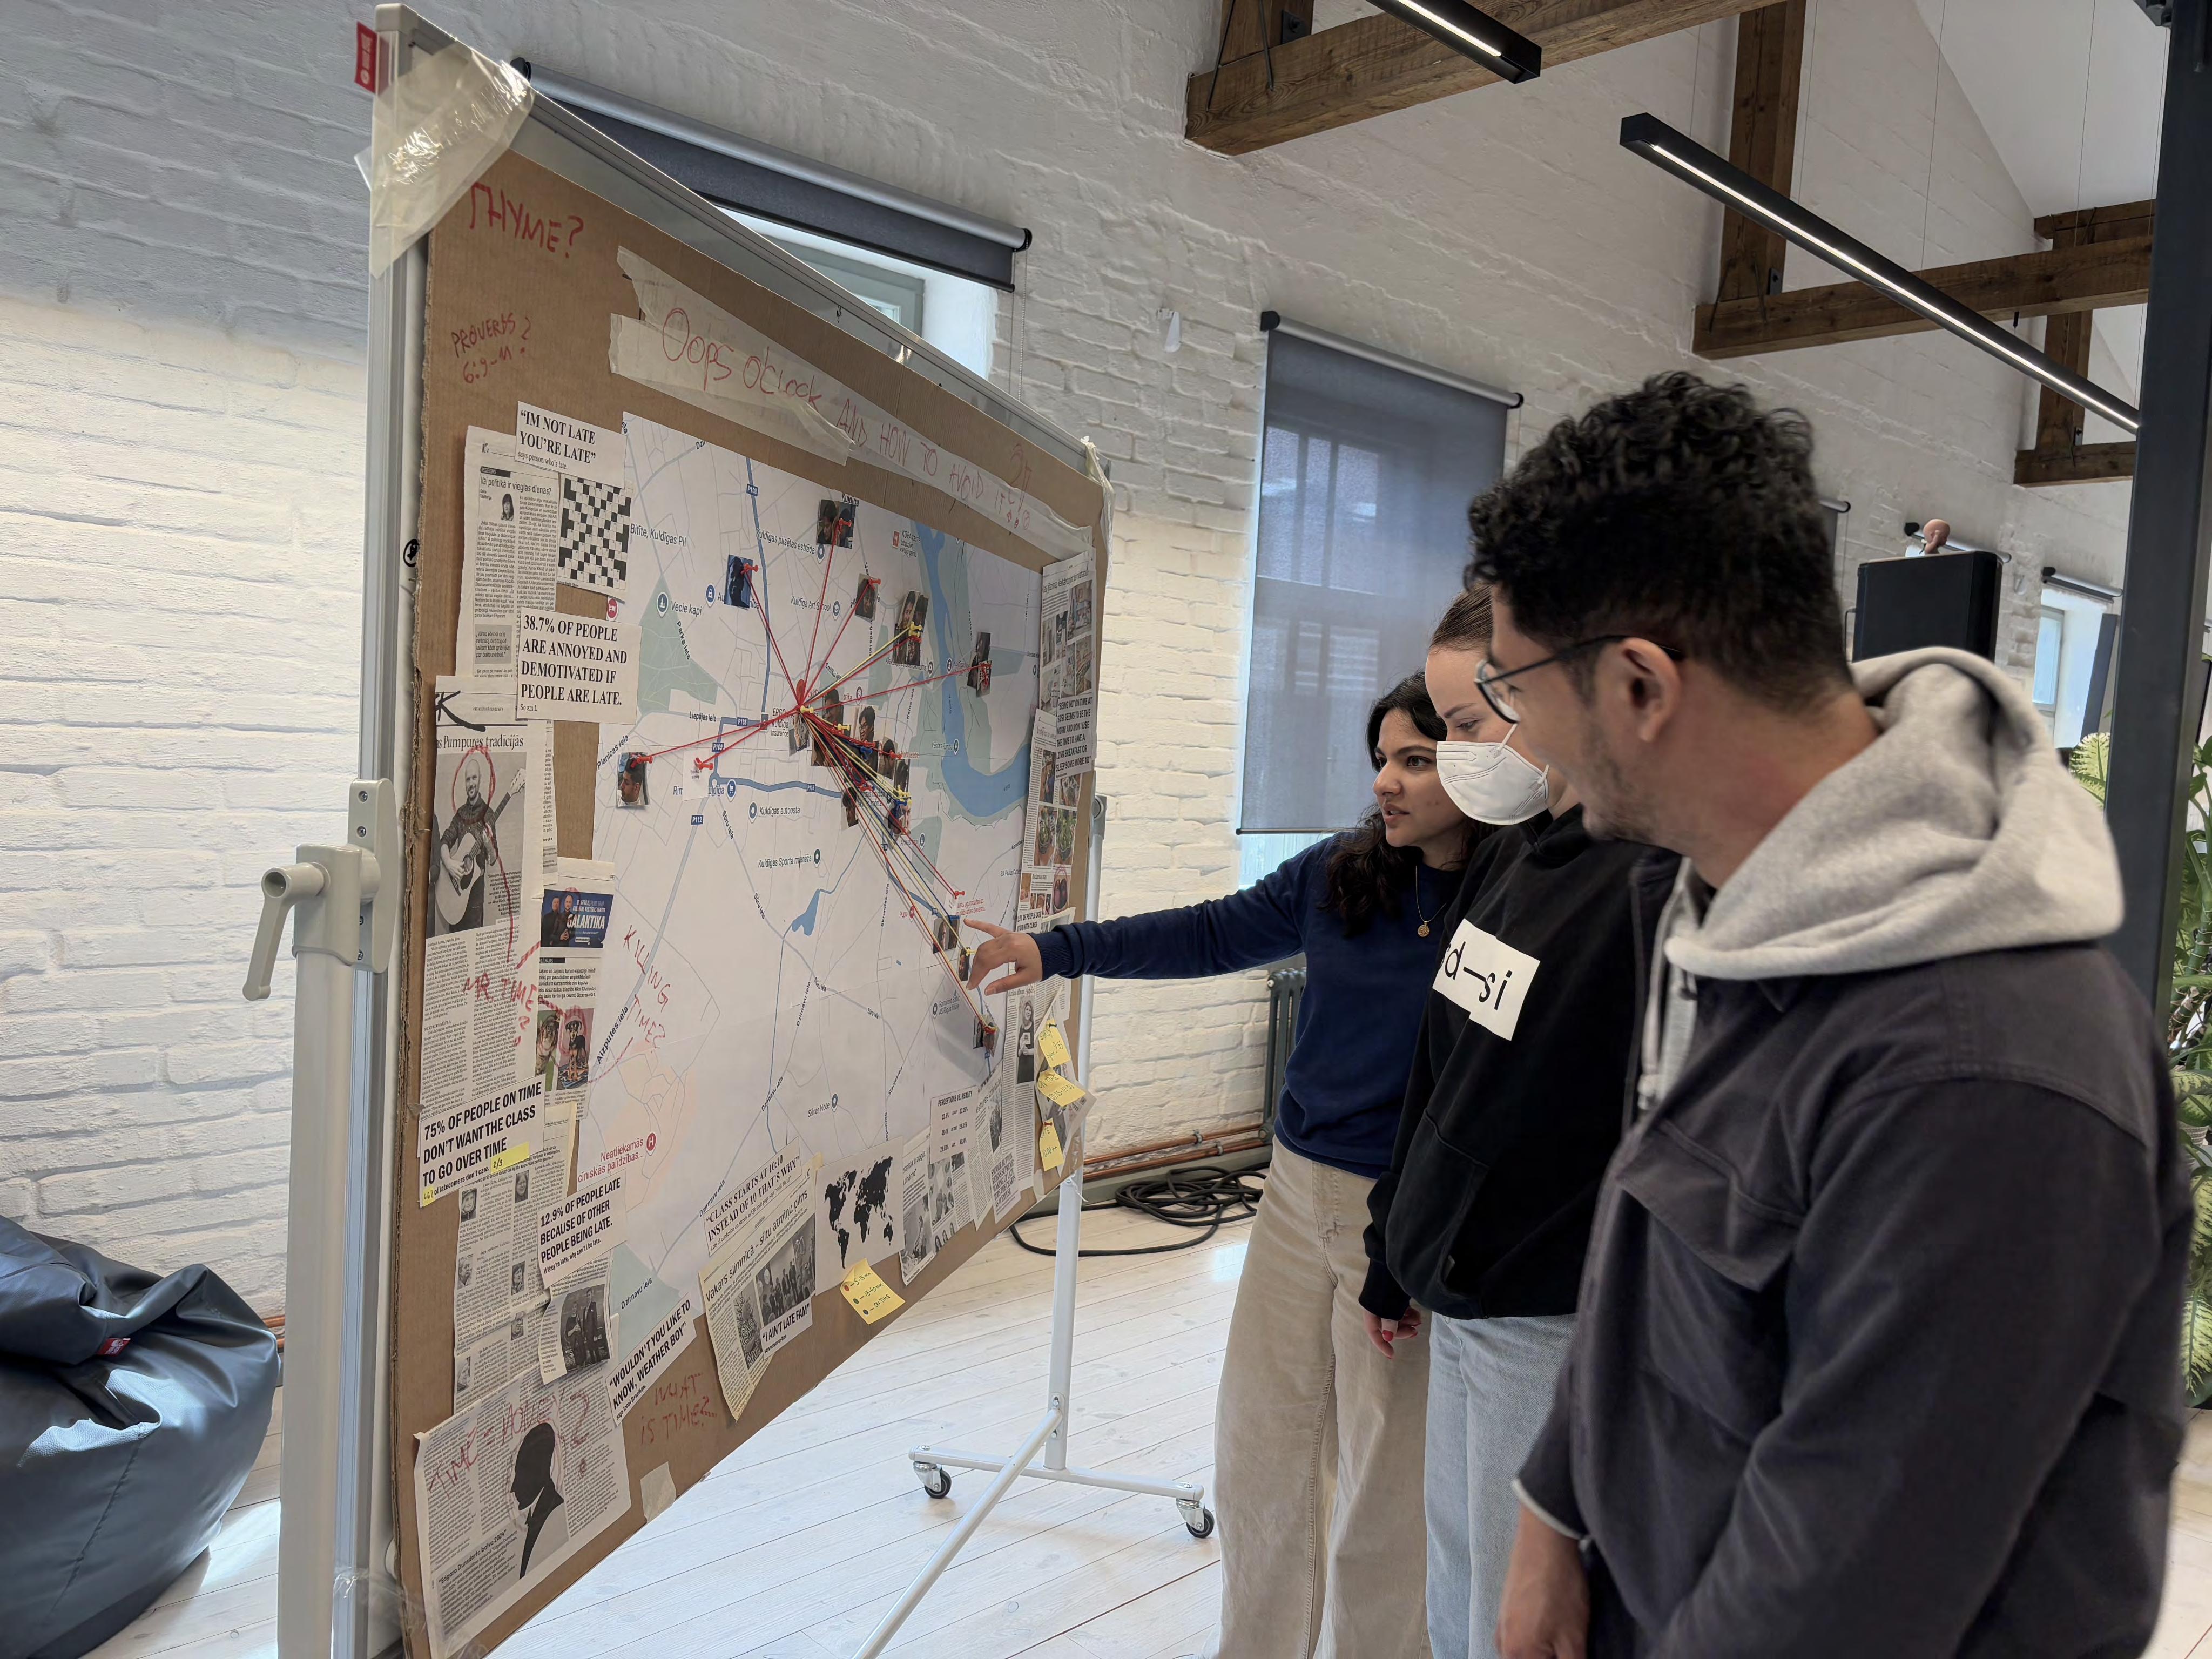
We began with what we could easily measure: where everyone lived. Each of our 31 classmates shared the distance from their home to the campus—some gave it in meters, others in kilometers. With this data in hand, we printed a map of Kuldīga, marked every location, and connected each home to the campus using colored strings. Red for those who arrived late, yellow for those who were usually on time, and blue

Late On time
Early birds

Despite 93% of students living within just 1.4 kilometers of campus, arrival times varied widely.
In some cases, people who lived in the exact same building showed up to class at very different times. Some of the earliest students lived the farthest away, while some of the latest lived just around the corner.
The map made it clear that being late wasn’t about how far you had to walk, but it was about something else entirely.
After seeing that distance wasn’t the root cause, we dug deeper. How do different people perceive time?
To find out, we cross-referenced two data points from our survey—the students’ home countries and how their cultures define being “late” to a class or meeting.
Our cohort is incredibly diverse, representing 22 countries: Algeria, Australia, Bangladesh, Brazil, China, Colombia, Estonia, Germany, Guatemala, India, Kazakhstan, Kenya, Kosovo, Latvia, Mexico, Pakistan, Peru, Philippines, Thailand, Tunisia, Ukraine, and the United States.
The results revealed something powerful. The idea of “being late” is not universal—it’s cultural.

Exactly on time (no other option)
15-40 minutes
5-15 minutes

For some, arriving five minutes late is still considered polite. For others, anything short of being five minutes early is already late. These subtle cultural expectations influence how we plan, prepare, and show up, often without us even realizing it. In a classroom like ours, made up of so many time perspectives, a single punctuality rule simply doesn’t fit all.
“Being not on time at SDSI seems to be the norm and now I use the time to have a long breakfast or sleep some more xD”
Said an anxious German classmate
From mental load to morning routines, peer influence to personal pace.

To uncover the deeper reasons behind lateness, we asked our classmates to share why they tend to be on time or why they sometimes arrive late.
Their responses were honest, varied, and often deeply personal.
Some mentioned the simple struggle of waking up in the morning. Others hinted at private challenges they chose not to fully disclose. Many pointed to time management issues, balancing multiple commitments, or getting caught up in daily routines. A few admitted that they were influenced by the habits of others around them.
To make sense of these diverse perspectives, we grouped the responses into a few broad categories.
The infographic below offers a closer look at the patterns we found.

As the global economy shifts, many young people aspire to become influencers. It turns out, influence isn’t just online. It’s in our classrooms too.
We discovered we have influencers among us, just not the kind you might expect.
While nearly 55% of our class arrives late to some degree, our data revealed something interesting. Some students weren’t originally latecomers but they were influenced to be.
In fact, almost 27% latecomers said they were influenced by others to arrive later than they normally would. Their reasons?
“Class starts late, so I come late.”
“It seems to be the norm to be late in class here.” “I have to sit lazily when it starts late so I come late.”
Social norms and peer behavior subtly shape how we act, even when it comes to showing up on time.
1 out of 5 latecomers were influenced by others



Being distracted by flowers/cats

Doom scrolling
Walking slowly
Focus, practice, and active effort can help our classmates manage time better.

According to our survey, 38.7% of the class feel bad, annoyed, or demotivated when class starts late.
While lateness might seem like a small, personal habit, it has clear social ripple effects. When a significant number of students arrive late, it can cause the class to begin later than scheduled, or in a disjointed way. This impacts not just the learning flow but also the energy and engagement of those who arrived on time.
Over time, this pattern can create a shared sense of frustration and even erode motivation and respect for the class environment. Some students reported feeling that their effort to be punctual was undervalued, while others began adopting the same late behavior just to avoid the awkwardness of waiting.



75% of people on time don’t want the class to go over time
87% of latecomers don’t care.
12.9% of people late because of other people being late.
If they’re late, why can’t I be late.
It’s safe to say the team couldn’t believe the AUDACITY.
The moss was barely dry on the field when pandemonium erupted during the 63rd Annual International Rock Ball Invitational and Coffee Expo (sponsored by Nut Dust™ and the village of Semi-Semi). With six teams, three referees, and absolutely no universally agreed-upon rules, the outcome was as predictable as a goose in a library. Rock Ball, for those unfamiliar (or cursed with sense), is the world’s leading full-contact, no-contact, mid-contact ground sport played primarily in uneven gravel pits across the Baltics. Each team consists of five players, a ceremonial goat, and one unpaid accordionist.

In response to students frequently arriving late, the SDSI management introduced a solution - a QR code system for attendance. The idea was simple, students would scan the code upon arrival to record their presence.
But beneath this well-meaning fix was a subtle flaw. The QR code came with a message: "till 10:10". This was intended as a grace period for latecomers. That small detail changed everything.
Teachers began waiting until 10:10 to start class, assuming it was now the official start time.
Students, seeing the same message, felt they had extra time and adjusted their routines accordingly.
The result?
People started arriving not just close to 10:10, but even later. And those who came on time grew frustrated as classes regularly began behind schedule.
A policy designed to manage time actually encouraged lateness.
Our observation revealed that system design, especially around time, must be precise, and clearly communicated.
Though it may be too late to change this practice for our current cohort, we hope our findings can help improve things for the next.


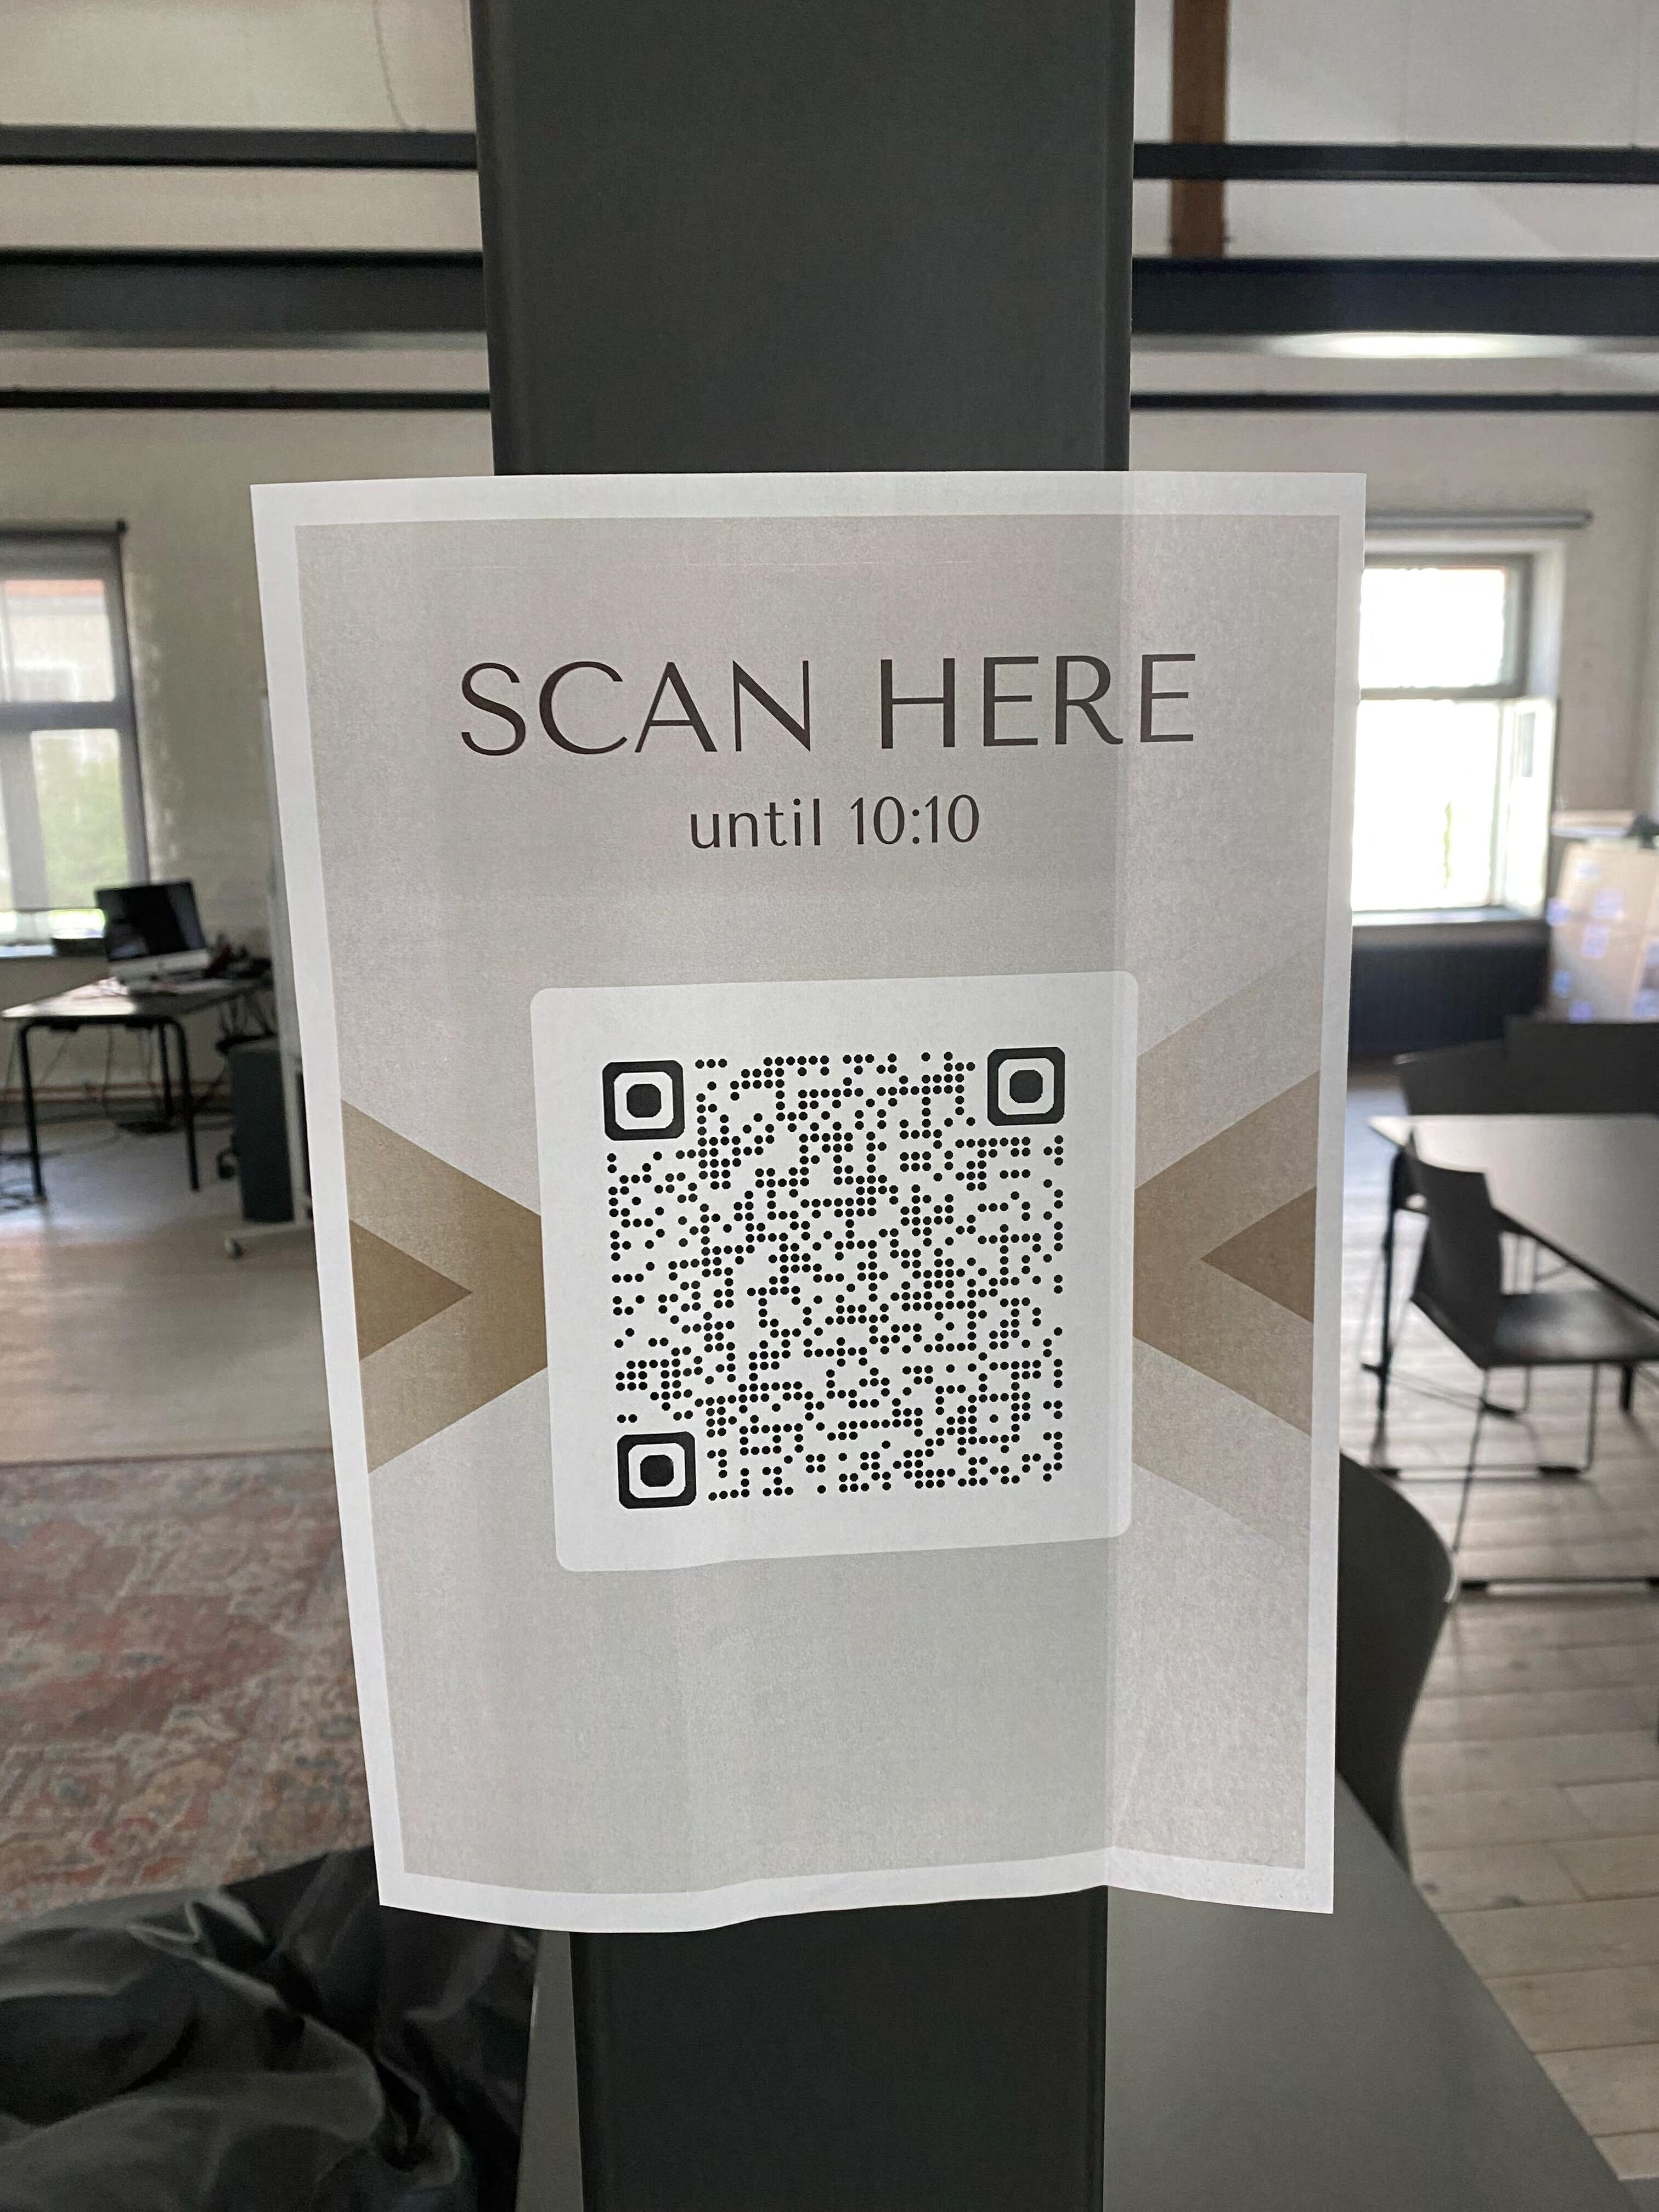

Our editorial team has proposed a new design for the attendance poster, labeling it the “greatest, most epic attendance poster of all time.”
SCAN HERE UNTIL 10.00



“I
What happens when you map people's habits —and show it to them.
From the outset, we knew that addressing lateness would be a delicate subject. Talking about people’s habits—especially in a shared space—can easily feel personal. And it did. Reactions ranged from amusement to discomfort, with some feeling intrigued, others feeling exposed.
Our goal wasn’t to judge, but to illuminate. Through the Information Design course, we learned how to engage the brain’s hippocampus, the part responsible for memory, by telling stories through data. And in that, we believe we succeeded.
One of our most striking visual pieces was a string map. We placed the faces of all 31 classmates onto a printed map and connected their homes to the campus with color-coded threads based on early, on-time, and late arrivals. It drew gasps. The visual impact made the invisible visible.
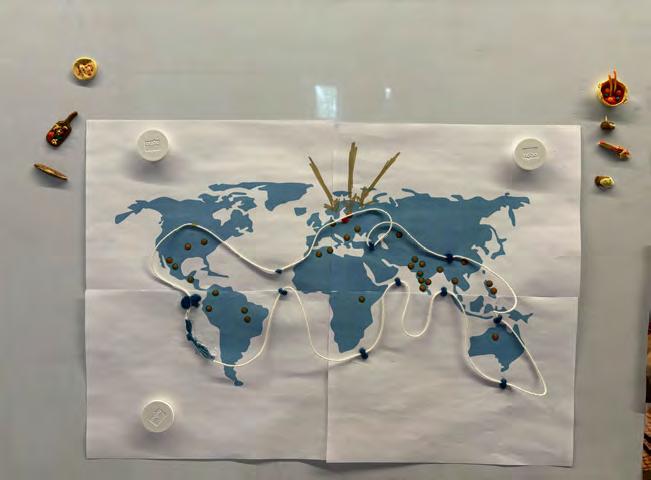
Another highlight was the world map, showing how different cultures define what it means to be “late.” It sparked reflection and amusement.
As we presented our findings to the class, we received a wide range of honest,


Morning reminders from roommates or friends can elp overcome inertia
Having accountability partners improves punctuality abits
Time awareness apps and s ared sc edules foster better group coordination
Combining structure wit social support works better t an just one or t e ot er.
T e 1 -minute grace period blurred t e line between “on time and “late.
Many began seeing 1 :1 as t e actual start time
Teac ers waited to start, students adjusted accordingly, and lateness spread
A clearer, more consistent time policy can elp reset expectations.
“I loved the process and methodologies, especially LATCH. It was an interesting class. Also working on a informative demonstration of time management practices had significant challenges, but we did good.” -Kazi
“I really liked working with the numbers and finding interesting data. It tells a lot about us.” -Ashwin
“Latecomers should be in prison.” - Erik
“Why are you late? We should cut fingers off.” - Vero
“I think we should make it like a newspaper. I mean the book.”
- Chaynika
“LATCH is rad.” - Rami


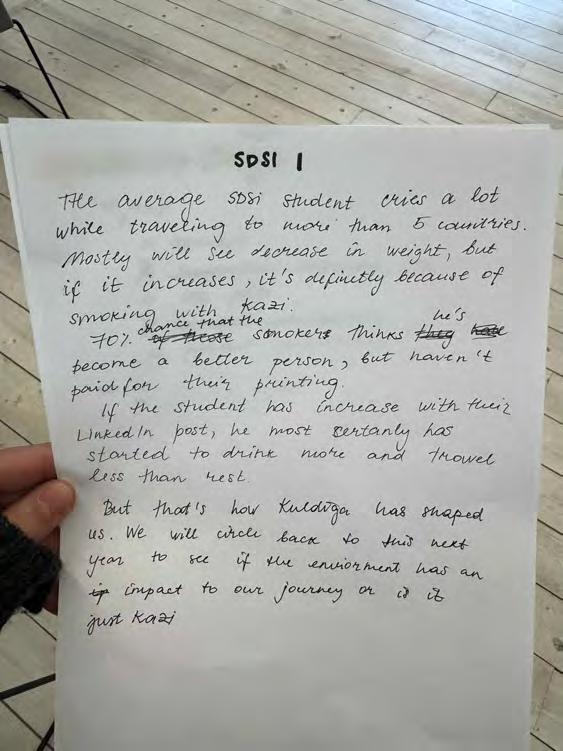
As we know, the hippocampo can be hard to tackle, so in order to not only scratch ours, but as well others, we decided that our information display will be focused on amusement. It might be our assumption, but month before summer break is hard time to be in class for 8 hours straight. With this project, we set out to explore our transformation during the first year of SDSI. Not to quantify our coursework or academic performance, but to humorously and honestly capture the emotional, physical, and mental shifts we've experienced.
We chose to tell a more personal story, one that invites empathy, laughter, and maybe even a bit of collective therapy. Through a fun survey framed around three areas (physical, mental, and emotional), we visualized the lived realities of our first year: the weight lost, the friendships formed, the identity shifts, and the Kazi factor in between.
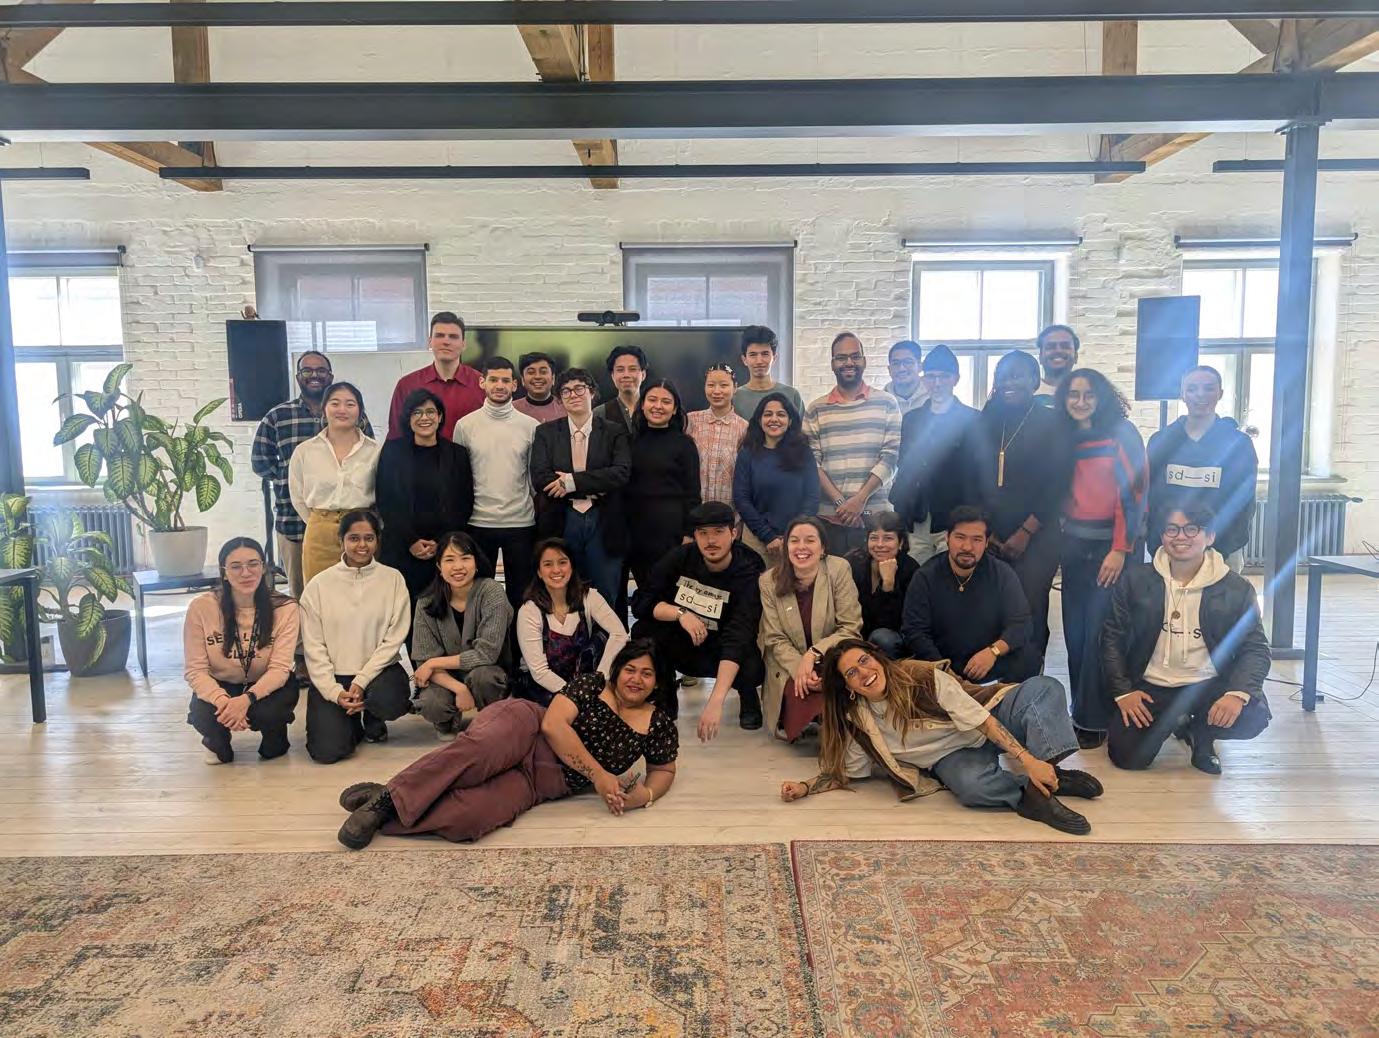
This project was born from a shared desire to create something that could meaningfully, and playfully, capture how this first year in the SDSI master’s program has shaped us. Instead of going down the typical academic or overly data-driven route, we wanted to explore the human side of this journey: how it has affected us physically, emotionally, and mentally after months of intense study, constant travel, and adapting to new places, people, and routines.
Our main goal was to build a collective self-reflection: not just a list of answers or stats, but a story. A snapshot of who we are at this halfway point, told through numbers, experiences, and a few odd choices. To do that, we crafted a short survey with ten questions, each linked to one of three categories: physical, mental, or emotional. These helped us frame what effects this experience might have on us beyond grades or projects.
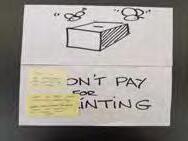
How many times have you paid for printing something?
Did you have any weight changes in SDSI?
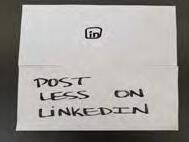
How much have you posted on LinkedIn before SDSI and now?
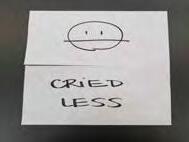
Have you increased your crying the last months ?
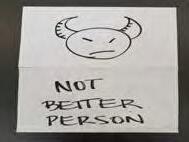
Do you think you're a better person, than in September?
Did your 3rd semester Location change for what you imagined?
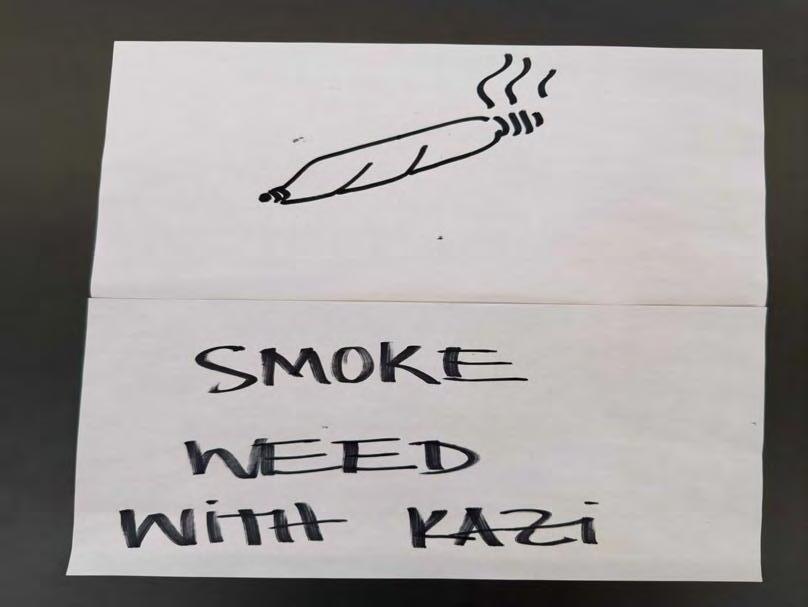
How many countries have you visited during SDSI Did you smoke W... with Kazi?
The questions ranged from light and fun, from “What’s your supermarket of choice?” or “Did you smoke weed with Kazi?” to deeper reflections like “Do you think you’re a better person than in September?” or “Have you increased your crying in the last months?” This mix wasn’t random. We wanted to balance humor with honesty, showing how messy, strange, and meaningful our shared experience was.
The big challenge on the presentation side was: How do you show something this human without flattening it into just data? We didn’t want to create charts for the sake of charts. We wanted something that resonates with everyone. Something that could reflect our transformation since we arrived here and the strange but exciting in-between spaces we’re navigating now.
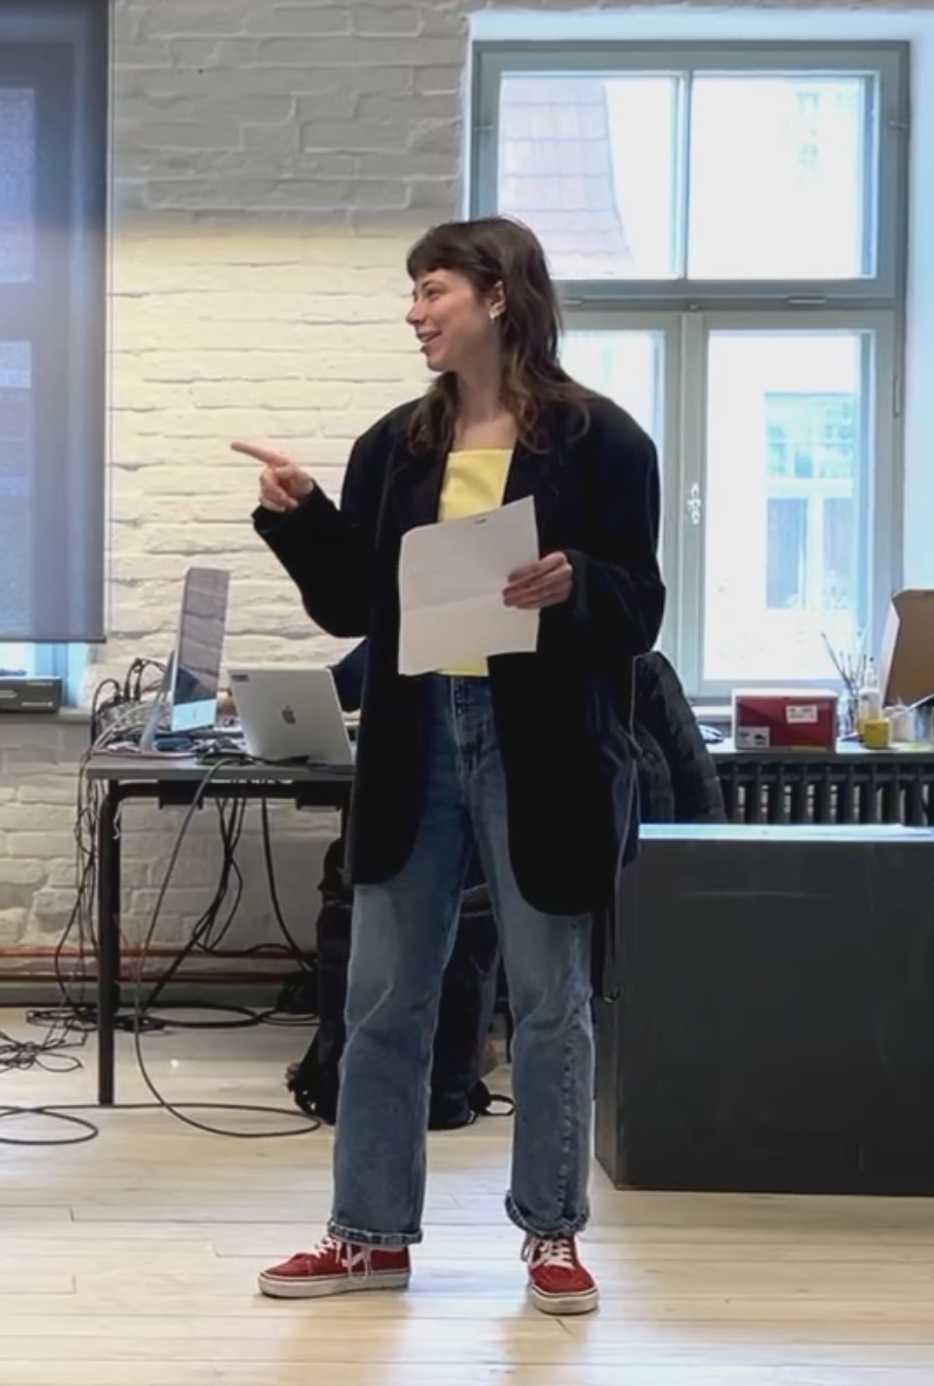
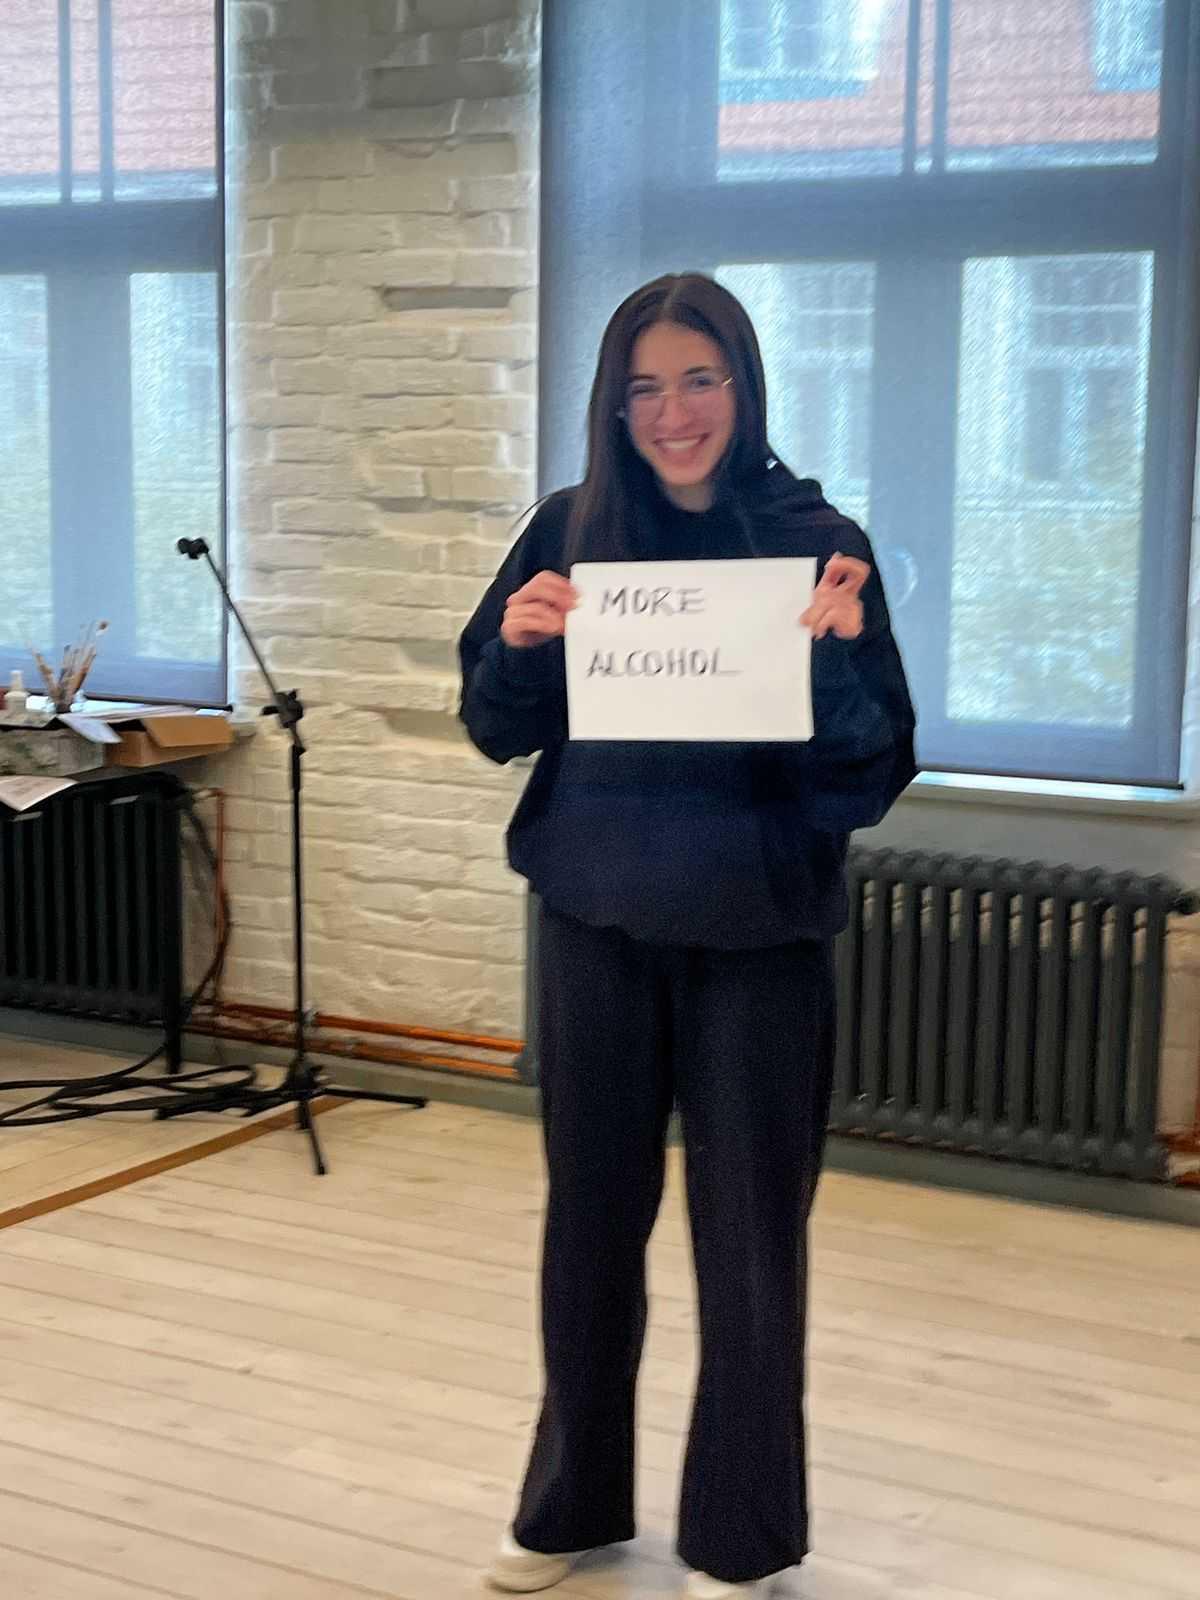
By choosing to play the role of the average SDSI student and show their choices, transformation, and evolution in real time, we aimed to be a mirror into everyone's eyes, to capture how this year has affected us, and maybe even to share a glimpse of who are we becoming in this journey.
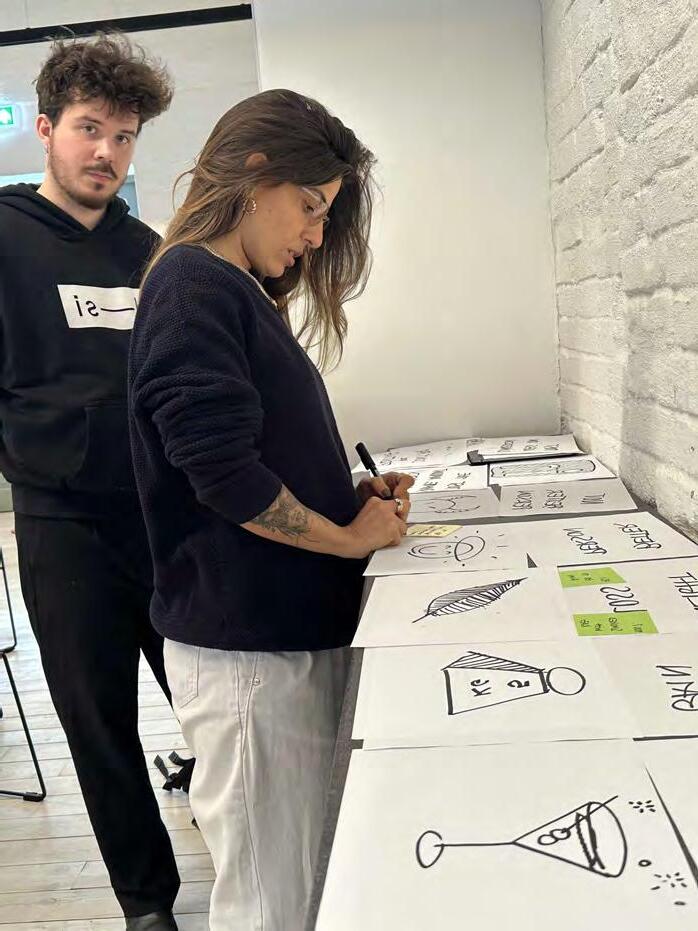
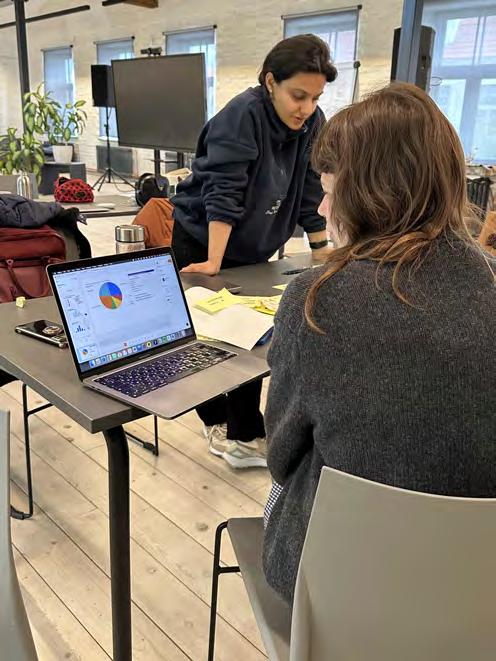
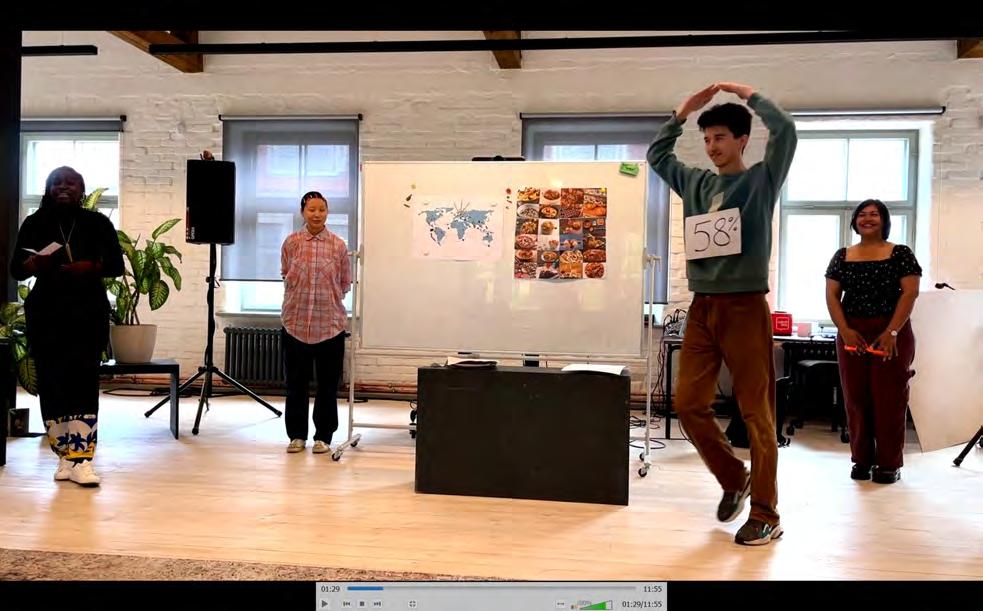
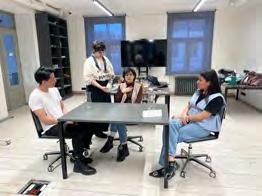
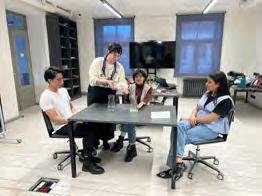
The ideation phase was dynamic and collaborative, focused on quickly exploring and shaping ideas through practice. After outlining the core concept and structure of our data performance, we dove into an experimental process: testing scenes, adjusting dialogue, and refining the overall flow. A key decision early on was shifting from a pathfollowing setup to a simpler frontal layout, which significantly improved clarity. Ideation here was less about abstract planning and more about hands-on exploration, allowing the concept to evolve organically through action.
Prototyping played a central role in transforming rough ideas into a tangible and engaging performance. We ran multiple rough playthroughs to test scene pacing, dialogue delivery, and transitions. Each iteration uncovered opportunities for fine-tuning—whether in tone, sequence, or timing. We also introduced sound effects as a layered element, which required several rounds of adjustments to feel natural and right. Our decision to skip a formal pre-presentation was also part of our prototyping logic. We aimed to preserve the surprise factor and comedic timing, which a second reveal might have diluted.
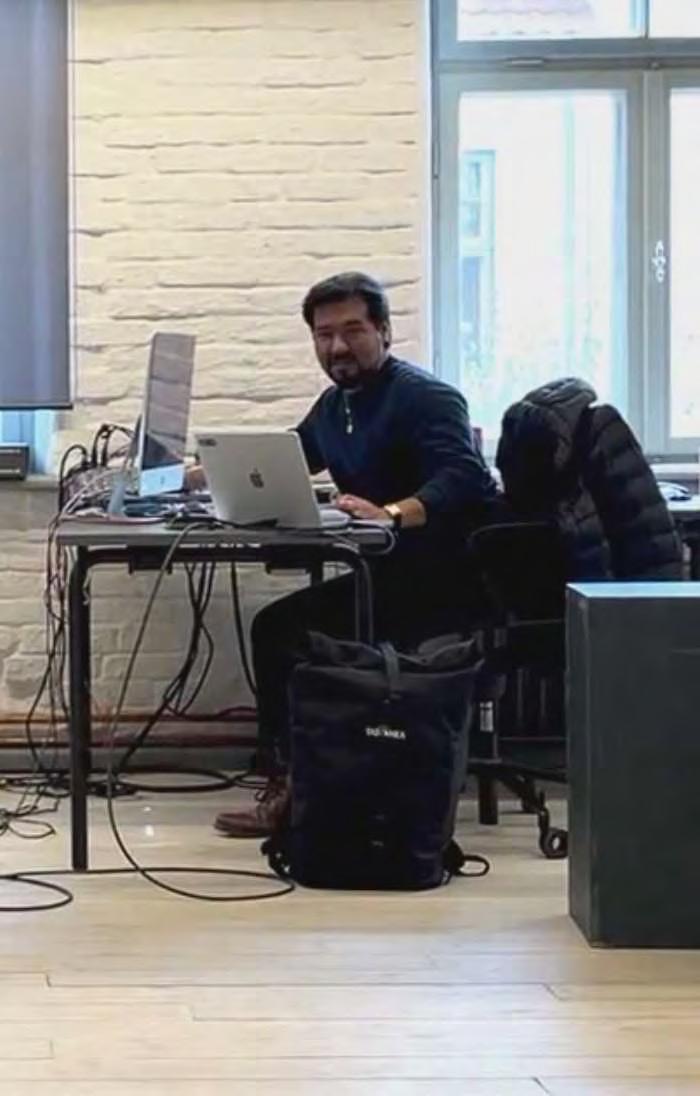
Audience testing was key. Mock audience was a pivotal move in testing the live dynamics of the piece. Reactions and questions gave us immediate feedback on clarity, rhythm, and engagement. Unlike a traditional technical rehearsal, this form of audience testing introduced a layer of spontaneity and interactivity that mirrored a real-world presentation. It helped us gauge how the piece resonated and validated our choice to maintain mystery and suspense until the actual reveal, keeping our performance authentic.
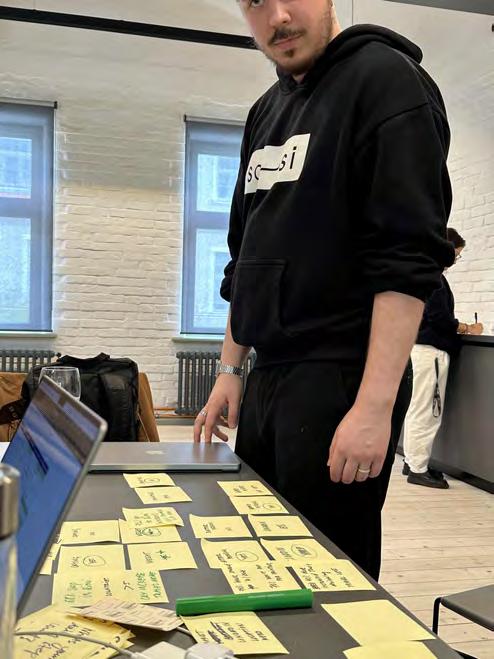
Nic p ototyping
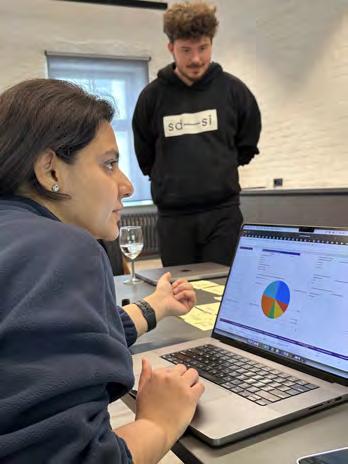
Sobia on the design

Jon and Nic double testing ideas
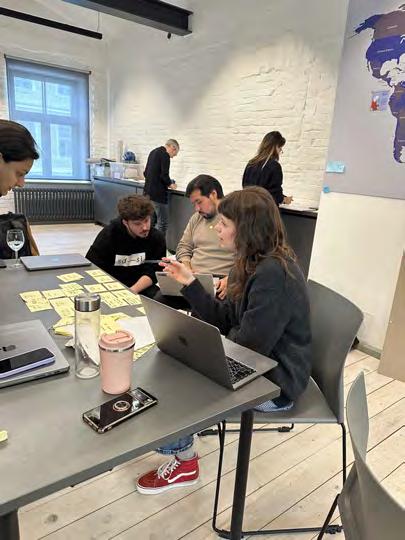
The whole team wo king

After developing the initial concept and structure for our data performance, we moved straight into testing and iterating. We began by finalizing the basic materials and running a first rough play through.


The process was organic: trying out scenes, adjusting wording, orientation, and flow. Early on, we shifted from a path-following setup to a cleaner frontal layout, which immediately improved clarity. Through multiple run-throughs, we refined pacing, phrasing, and timing. We also introduced sound effects as an extra layer, which meant several rounds of tweaking to get right.


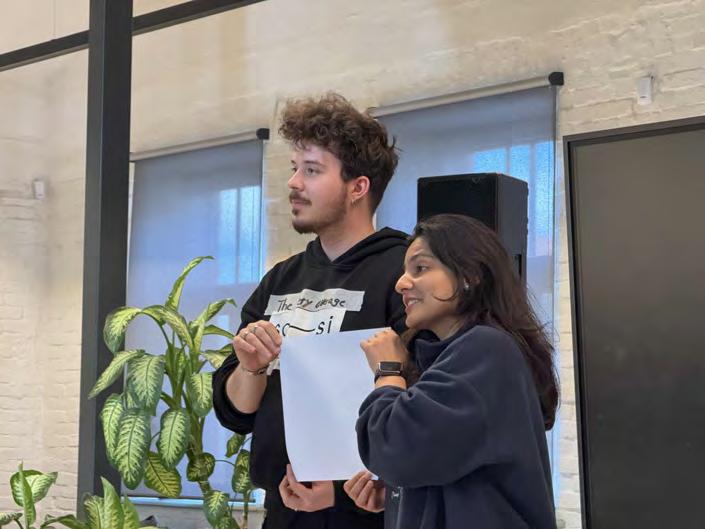
Flavia joined as a mock audience, reacting and asking questions, which helped us test live dynamics. Different to other groups, we skipped a formal pre-presentation to preserve the strength of our reveal, (a second presentation would not have been nearly as funny) keeping things mysterious and saving time.
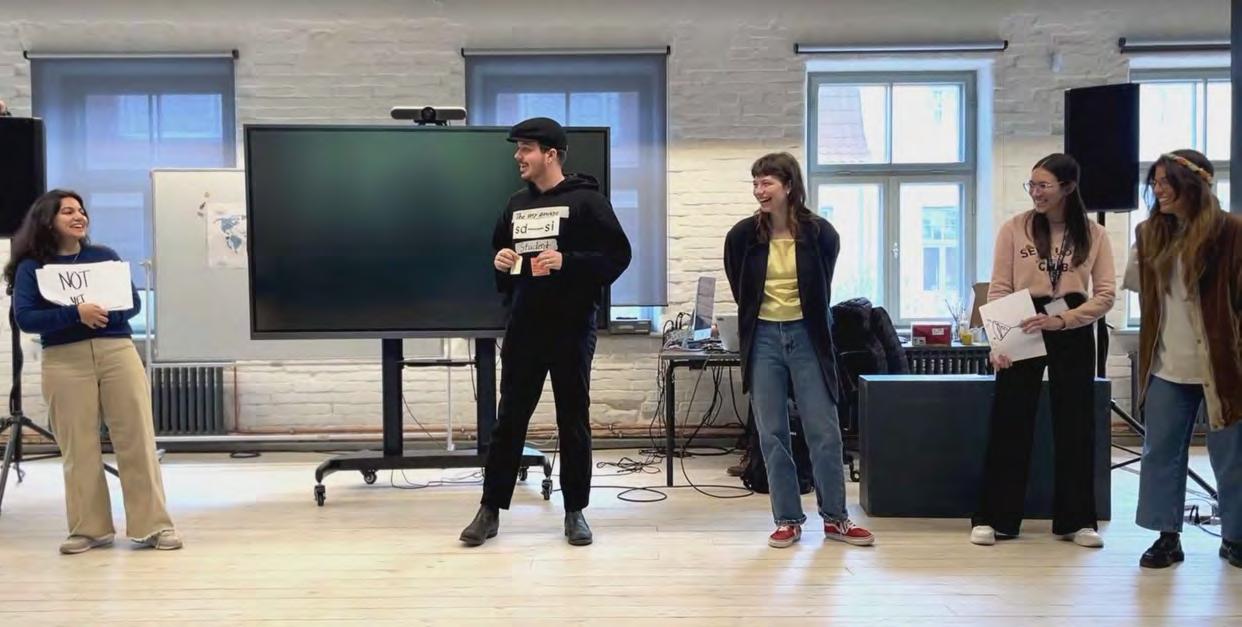
Ours was an exercise in… Applied playfulness in data-collection? Group introspection? A lightly held attempt at perspective? A rational/prerational blend of tossing data points back and forth until clusters formed and some real storylines emerged from the noise? Definitely maybe.
What this exercise certainly taught us is that information design can be kinetic, does not require pivot tables, yet can remain legible, relevant, and human. Our methods and structures weren’t perfect. But our outcomes are truthful. Share this with an incoming SDSI applicant and they’d feel how it feels to be here, more accurately than any recruitment video.
So maybe this was more than an exercise in playfulness or introspection or perspective. A design artifact of our time here, gently captured? A time capsule? A mental, emotional, social collage? Something we made lightly that’s worth keeping? Definitely, absolutely yes.

What I’m still sure of: We have to have fun doing whatever is standing in front of us. There is no other way to touch ours or others hippocampo. We need to be honest, sharp and fun. And for me probably the reassurance that short format takes more time thang long was just at the right moment.
Es ticu, ka komunikācijā pareizo uzsvaru izvēlēšanās un svarīgāko savienojuma vietu ievērošana ir prioritāra. Un tas ir rūpīgs, gadiem lolots talants, ko sevī atrast.


What I liked most about our project was that we let ourselves play, without really caring too much about the next step. That felt very non-academic in the best way. It helped me think of playfulness as an actual design tool.
Our format sort of shaped our message, based on timing, tone, and audience energy. I don’t know if this kind of performance-driven data design could work outside of SDSI. But it’s interesting enough to try it again.


My main takeaway from this experience is how the fine art of capturing the attention of the audience and using the human curiosity to your favor could actually lead you to talk and share what otherwise could be a pretty boring set of numbers and graphs and turn it into something enjoyable for the audience while still maintaining the value of the information. In this particular project it was very easy for us because we made it more about the performance, story and message we were trying to communicate than some kind of hard result we tried to achieve, and I believe people could actually see themselves in the results. Still it bears the question, would this have worked in a different environment or with a very strict goal in mind? I’m not completely sure, but in my opinion if you grab the audience and have their attention you are more than halfway there so I believe we are on the right track.

This class really got me thinking about how we present information, not just visually, but as full-on experiences. It pushed me beyond the usual slides, graphics, colors, and fonts, showing me how design can jump from two dimensions into something way more immersive.
Coming from a design background, I’ve always focused on making things look good, but this course made me realize it’s about feeling good too. Mixing service design into the process shifted everything, turning it into a dynamic, emotional, and even fun experience. It’s wild how design isn’t just about what we see. It’s about what we live.
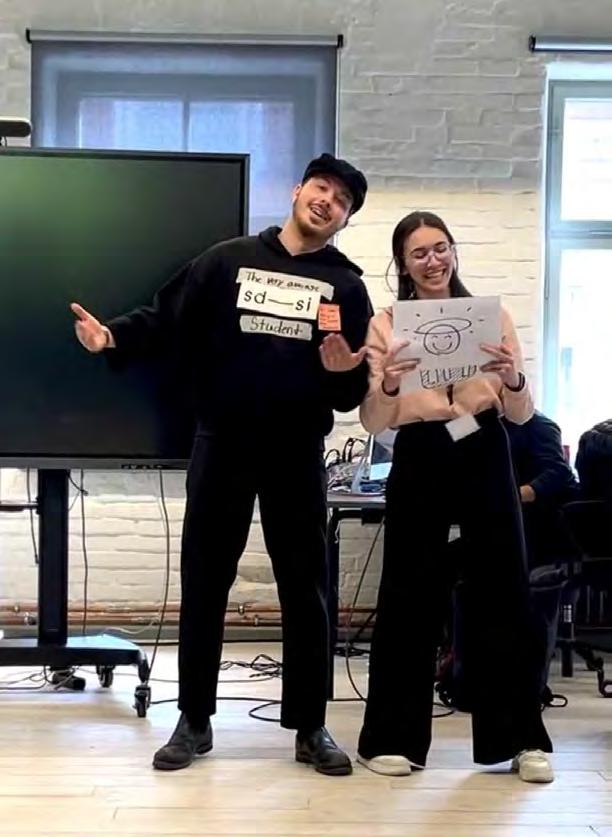

I really enjoyed working on this project. It felt more relaxed than most, and we gave ourselves permission to just have fun with it. The performance format worked surprisingly well, and I loved exploring a slightly humorous approach to presenting data. The only downside, for me, is wondering how well this kind of concept would translate to a more typical project. In our case, the topic, the format, and the audience all aligned nicely. But in a different setting, without a warmed-up crowd, it might not land the same way. Still, I will explore the idea of using humor for presentations further!


This class was nothing like I expected, in a good way. Learning LATCH by moving around the classroom made the concept fun and memorable. The sessions were filled with humor and hands-on learning. Through our project, I saw how raw data can feel disconnected when shown in charts, but adding storytelling and creativity made it more engaging and human. It taught me how design can turn information into something people actually enjoy exploring.






This project proved to me that information design is partly about giving the right information in the right way, at the right time, to the right audience. It could only have come out of this SDSI cohort now. Doesn’t matter whether or not our approach might work elsewhere. It worked here. It reflects us.
So I’m happy to have contributed where and how I could, though truly I’m usually happy whenever I can sketch cartoon icons by hand. At this scale, sleeves-rolled-up building physical stuff beats abstract planning and digital fidelity, not only in terms of raw delivery but also in surprising yet inevitable insights and immediacy. Hands down, more effective. More fun.


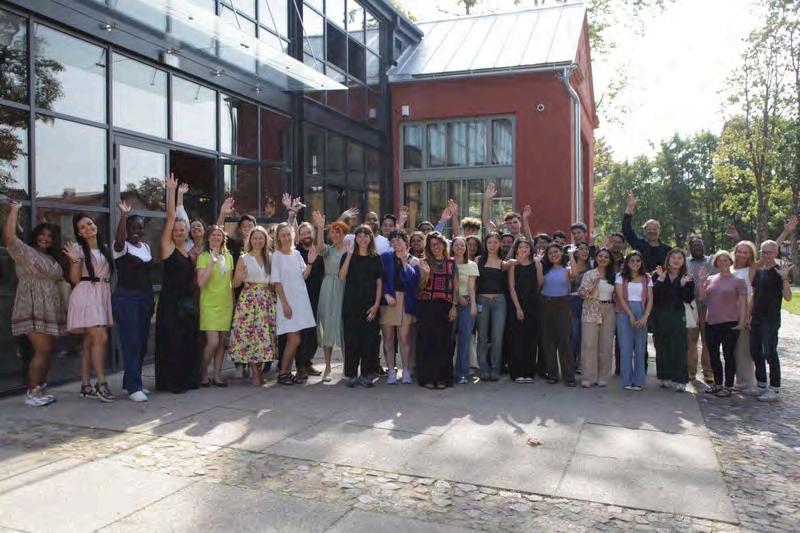
We’re 31 students from 22 countries, each bringing different perspectives to SDSI. After many chats about what’s working and what’s not, six of us teamed up to share feedback and help the program evolve.


Before joining SDSI, our cohort held a wide variety of roles in different industries. Our design expertise varied from senior level experience to junior designers to no design background. But we all arrived with a passion for service design.
Job title before SDSI
Analyst
Assistant Coordinator - Outreach & Communication
Business Developer & Innovation Officer
Business Development, Co-Founder
Creative Director
Creative Lead
Creative Strategy Lead
Customer Experience Designer
Digital Marketing Manager
Director of Strategy
Head of Gamification / Deputy Programs Director
Industrial Designer
Industrial Designer/ Student
Managing Director
Marine Engineer, Data Analyst
Multidisciplinary Designer
PM
Product Design Consultant
Professor
Project Manager (2)
Senior Associate
Senior Manager Content Strategy
Social Worker
Student (2)
Tech Sales
UI Designer Intern
UX Strategist
UX Writer
Since we left a lot of things behind, we obviously expected a lot in return. And most of these were expectations shared by all of us students. We simply expected:
We want to enter the European market, find opportunities, internships, jobs...
We want to gain technical knowledge on service design and practice our learnings with real industry partners in real projects
We want to become friends with international peers, travel, and learn about other cultures
We want to become the best version of ourselves <3
(as students coming froM A design Background)
We already have design skills, so we are looking to
We want to learn problem-solving, business skills, and grow as multi-disciplinary designers
(as students coming froM A non-design Background)
We are already experts in our fields, we came here to

We came here with an open mind to learn

We are almost finished with our first year here in Kuldiga, and there have been a lot of interesting courses. We thought that some of them very really valuable, and on the other hand thought that some did not add much value to our education.
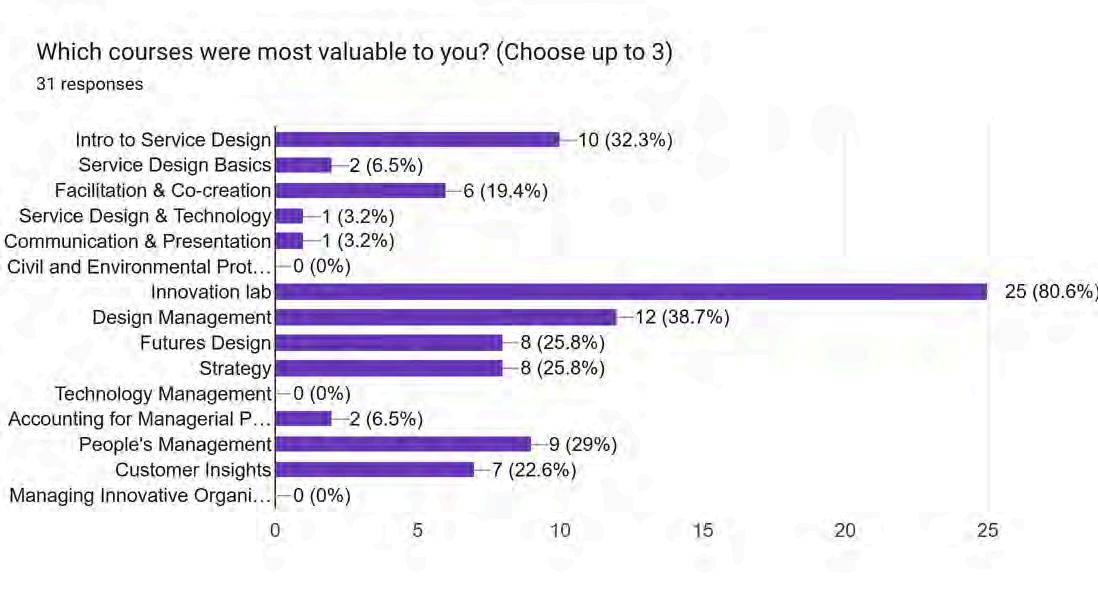
The courses that were included most often in top 3 valuable courses were Innovation Lab, Design Management, and Introduction to Service Design. And while around 30% people included Design Management and Introduction to Service Design in their top 3, a whopping 80% included Innovation Lab!
It seems that we really enjoyed getting our hands dirty and building our own business.
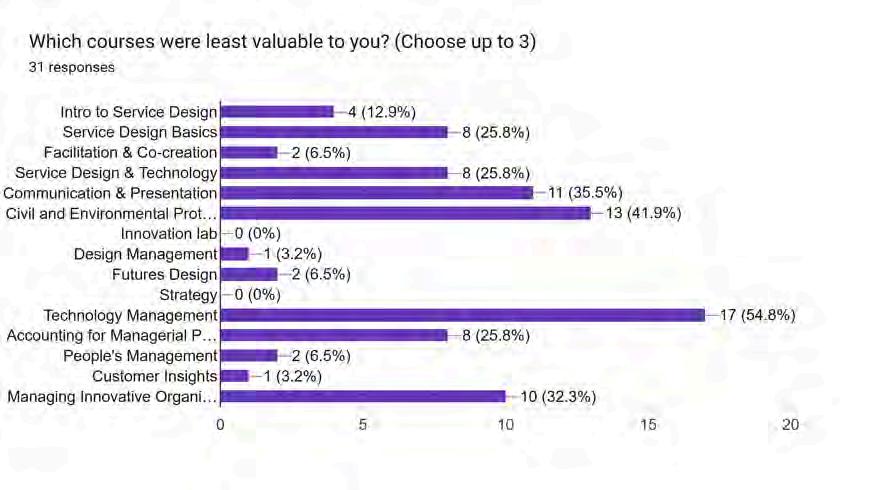
On the other side of the coin, the 3 courses that we most often voted least valuable were Technology Management, Communication & Presentation, and Managing Innovative Organizations.

Here’s how every course performed..

(and made us feel like maybe this was the right choice after all)
We didn’t expect our research to feel so personal. But as we started collecting reflections from our cohort— some long, some half-sentences typed during lectures—we noticed a pattern. Beneath the chaos of deadlines, overlapping Zoom calls, and whatever was happening on Miro that day, there was something surprisingly steady: appreciation.
Peers, Groupmates, and People
The most mentioned “highlight” wasn’t a course, a tool, or a workshop. It was each other. Working, failing, laughing, reworking. We were surprised by how often people said they learned more from their peers than from their professors. And honestly? We kind of agree.
There’s something about being thrown into a room full of people who are nothing like you, ex-consultants, art school kids, code-switching polyglots, career-shifting parents, and realizing you still speak the same design language. Or at least, you’re willing to learn each other’s dialects.
We had “fun groupmates,” sure—but also thoughtful ones, clever ones, brutally honest ones. The kind who give you good feedback even when they’re sleep-deprived. This program, more than anything else, has been about learning through each other.
Hands-on, Practical, Real Projects
We kept hearing about the first semester’s projects. Not because they were flawless (they weren’t), but because they felt real. Clients with unclear expectations. Constraints that didn’t fit neatly into post-it frameworks. The actual messy nature of design made visible. And that was energizing. It made everything else feel a little more meaningful.
Autonomy, Freedom, and Ownership
A lot of us came into SDSI expecting a full schedule. Instead, we got space. Unstructured time to freelance, travel, rest, work on side projects, or just think. At first, it felt like a glitch. But for many of us, it became a gift. The freedom to shape our own experience made the learning feel more ours—even if it meant occasionally drifting and having to course-correct. We didn’t always know what to do with that much freedom. But we liked having it.
Inspiring and Useful Courses
Some classes stood out. Especially in the second semester. We’re talking about the kind that didn’t just deliver knowledge but sparked curiosity. The ones where you left feeling a bit rattled—in a good way. It wasn’t always about the content. Sometimes, it was the way something was taught, or a moment where a theory clicked, or even just an exercise that felt well-timed. Were there enough of those moments? Not always. But the ones that landed really stayed with us.
Learning, Growth, and Challenging Ourselves
In quieter ways, people mentioned change. Growth. A sense of having learned something—often without realising it until they had to explain it to someone else. Whether it was navigating cross-cultural teams, sketching service blueprints faster, or just being more patient in the face of ambiguity, there was a sense of movement. Maybe even momentum. We didn’t all learn the same things. But we were learning.

(and the quiet ways they added up)
No one really wanted to write this section. Not because we didn’t have thoughts, but because we weren’t sure how to say them kindly. We decided the kindest thing we could do was be honest.
No Job, Internship, or Placement Support
This one came up a lot. People felt like they were left to figure things out entirely on their own when it came to jobs, internships, or even just connections to companies. We expected some kind of bridge between studying and working. It turns out there isn’t one.
Basic
A word that showed up more than we wanted it to. Some courses felt like a reintroduction to things we’d already seen— especially for those who had previous design experience. Even for people coming from outside the field, some sessions felt like they were aimed a bit too low. The phrase “intro to everything” came up. So did “starting from below bachelor level.” We weren’t looking for complexity for complexity’s sake. But we were looking for depth. And in some places, it just wasn’t there.
Low Academic Standards
Related to the above, this was less about the content and more about how it was structured. Assignments that didn’t feel like they built on anything. Sessions that felt thrown together. Evaluation that was vague at best. We expected to be challenged, but sometimes it felt like the bar was set low—and that made it hard to take some courses seriously.
Disappointing
This one was hard to hear because it wasn’t just about individual experiences—it was about a mismatch between expectations and reality. Students used words like “letdown” or said things just “didn’t meet expectations.” And while expectations are always subjective, the consistency of this sentiment stood out. We came in with hopes. And while parts of the program met them, others didn’t even come close.
No Guidance
This was mentioned in both big and small ways. From navigating Kuldīga to understanding course requirements, a lot of us felt like we were on our own. There weren’t enough touchpoints. No one really told us what to expect. And sometimes, we didn’t even know who to ask. Guidance doesn’t mean spoon-feeding. It just means someone helping make sense of the mess. We didn’t always have that.
Underwhelming
This wasn’t the loudest complaint, but it lingered. It was the feeling of something that could have been more. Not terrible, but not impactful either. The kind of feedback you give when you’ve stopped expecting much.
Shallow
Mostly about course content. Tools that were introduced but never practiced. Frameworks that were mentioned once and forgotten. It often felt like we were only scratching the surface—without being told how to dig deeper.
Disconnected
Some courses felt like they belonged in a different program entirely. There wasn’t a strong sense of progression. LMA felt one way. SSER another. We weren’t sure what story we were being taken through, or if there was one at all. That lack of cohesion made everything feel less meaningful, even when the content had potential.
Unclear Expectations
Not knowing what was expected of us, not knowing what we were supposed to be learning, not knowing what the program wanted to become. That’s a hard place to learn from. And a hard place to feel motivated in. Here’s the truth: SDSI has heart. But it needs a backbone. It needs structure. Clearer expectations. Better communication. A sense of direction that doesn’t rely on us crowdsourcing answers from each other in WhatsApp threads at midnight.
Let’s build a program that reflects the promise we saw when we applied.

We asked, we listened, and we reflected. After completing the first phase of the program, we took time to consider how SDSI could evolve, both for us and for the next cohorts. Like any good service, there’s always room to grow and improve. We gathered a wide range of feedback, representing different backgrounds, needs, and perspectives. To make sense of these, we organized them into three main categories:
Common Needs
Design Background
Non-Design Background

Structured, ongoing mentorship was a recurring suggestion. Many students expressed that having someone to guide them through the various stages of the program would add clarity and confidence:
“Personalized guidance would be extremely helpful.”
Many of us want to play a more active role in shaping our learning journey. Being included in parts of the curriculum development could help make the content more aligned with student needs and goals:
“We want to co-create the curriculum.”

Industry Exposure
Real-world application matters. The existing projects were valuable, but there’s interest in extending them beyond presentations, toward real client partnerships, long-term impact, and potential career opportunities:
“We want to work with real clients on real projects.”
Expert Faculty Service design is hands-on and ever-changing. Having instructors who are actively engaged in the field can strengthen the link between theory and practice, and help students understand current industry standards:
“We want practitioners from the field.”

→ More Depth in the Curriculum
Those with previous experience in design are looking to go deeper. There’s a desire for content that builds on foundational knowledge and introduces more advanced or specialized skills: “Being a designer is extremely demanding, and many skills weren’t mentioned”
→ Balance Between Group and Individual Work Group projects offer valuable collaboration, but some students, especially those from non-design backgrounds, found individual assignments equally important for building their own capabilities: “We need more individual projects to build our own capacity.”

We’re proud to be part of SDSI and believe in its potential. This feedback is about co-creation. We want to contribute to making SDSI one of the leading programs in the field of service design.
Let’s continue building it together.


“After an intense semester, the Information Design course offered a refreshing change of pace. It helped us reconnect with the creative side of design and explore new ways of visual communication. Though brief, the course proved to be valuable, both in terms of skills gained and the energy it brought back into our process. The three days were both informative and engaging. Thank you, Martin!”
Verone Kadriu

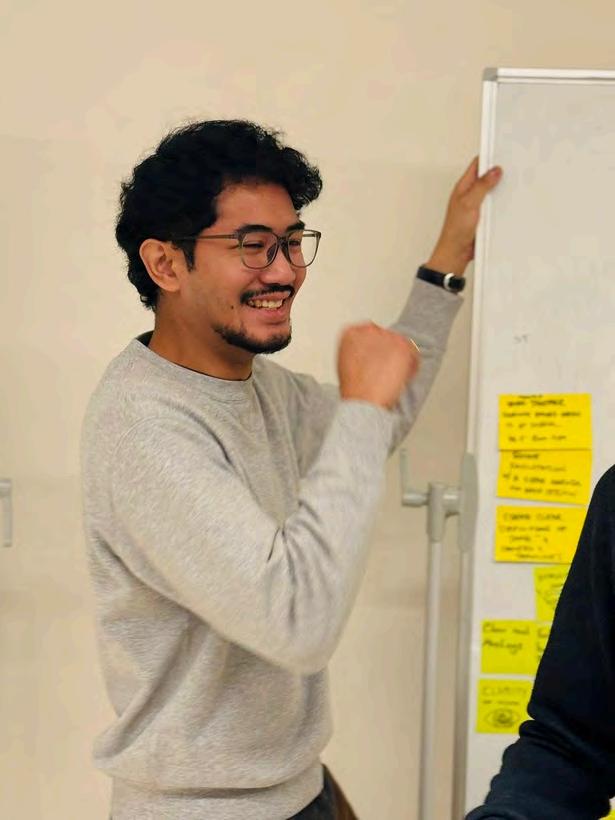
The three days were both informative and just plain fun. I especially loved the LATCH activity; it was such a cool way to figure out how to organize stuff. Working in groups was great too, as we all bounced ideas off each other. And getting to learn a bit about Viennese culture was a really unexpected and awesome bonus! Even though it was quick, the class was super helpful – we learned some good skills and it definitely got our creative juices flowing again. Thank you so much Martin!
Evan Palmejar
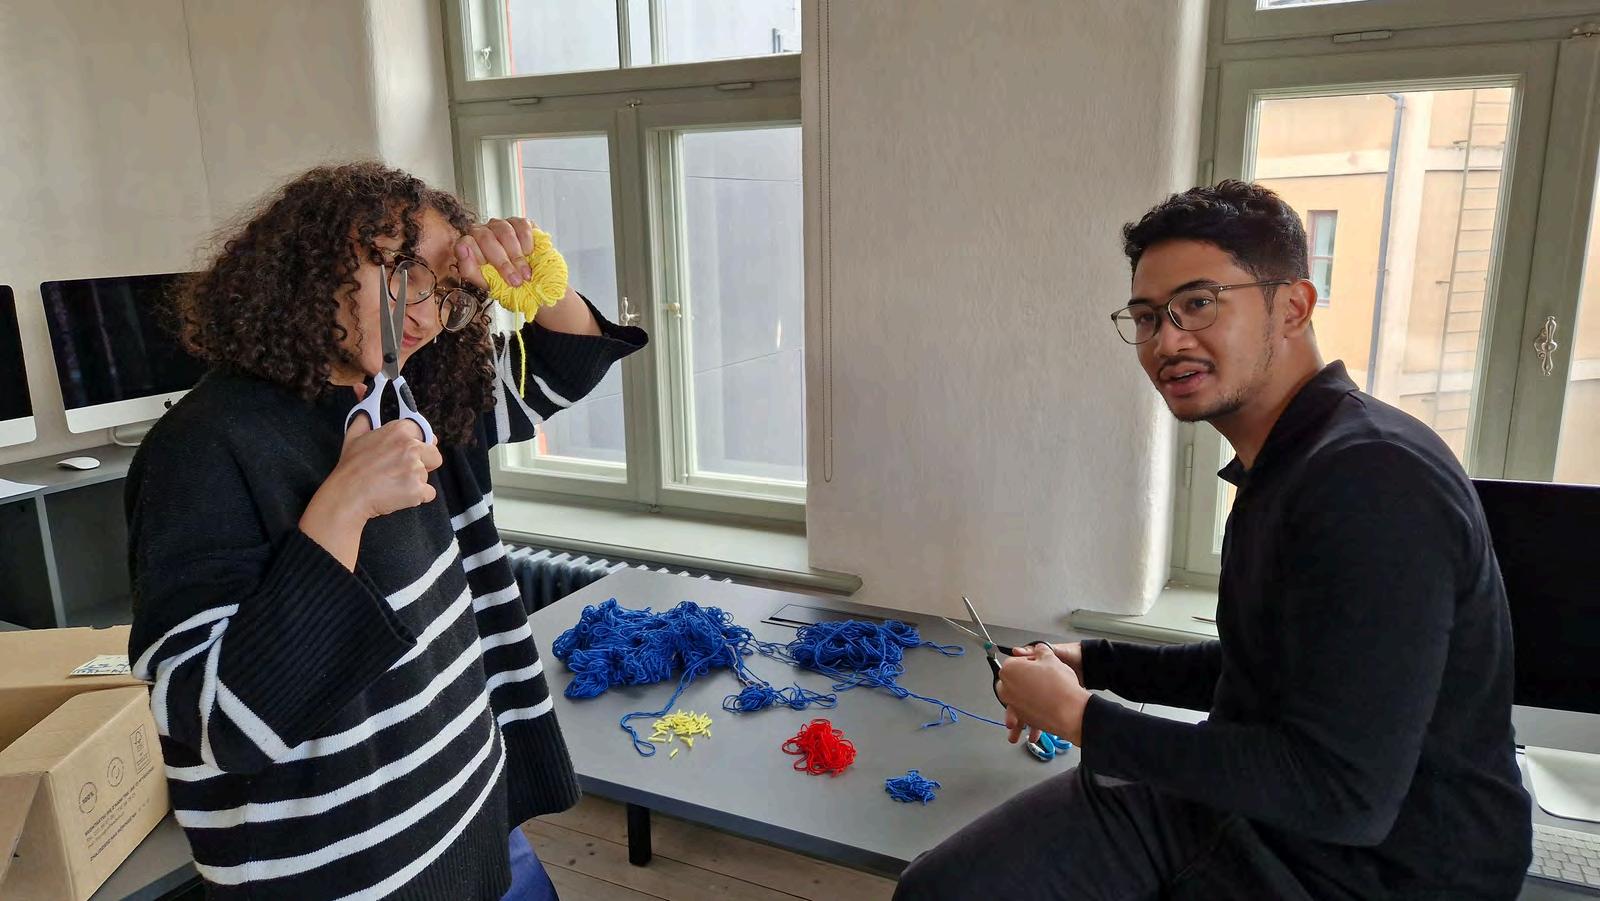
The highlight of this course for me is learning about the hippocampus! Predicting how people will perceive our work and designing to intrigue and “tickle” their hippocampus has inspired me to represent information differently. I now realize that effective design isn’t just about clarity and aesthetics but it’s also about creating memorable experiences that engage the brain’s natural curiosity and memory processes.
Thank you so much Martin!
Nada Jouibli


I’m grateful to have learned about the LATCH framework for organizing complex information. I’ll also remember the advice to “be the dog,” which I take to mean that it’s good to envision yourself as the content you’re trying to convey. I’m excited to continue to explore the principles we studied in greater depth. And, as always, I’m grateful for the VENKA (and a new A!) team’s collaborative spirit and great energy.
Kristen Kennedy


This course was such a breath of fresh air for me, and I am really grareful for that! I learnt a lot over the course of 3 days, about how our mind (and the hippocampus!) works, and processes and retains information. All the projects Martin shared were super insightful, and I especially loved that he stayed back to give us personal advice about our projects and career! I also enjoyed working with my hands with my lovely groupmates, and seeing the wonderful visual representations of otjer groups!
Aadi Rao


This course reminded me of the importance of information design in any service design project. I’m looking forward to applying the frameworks we learned in this course to future work, academically and professionally. I also enjoyed reuniting with my teammates (+Aadi) from first semester. We collaborate well and always find a way to make it fun. Thanks, Martin!
Abhijit Balaji


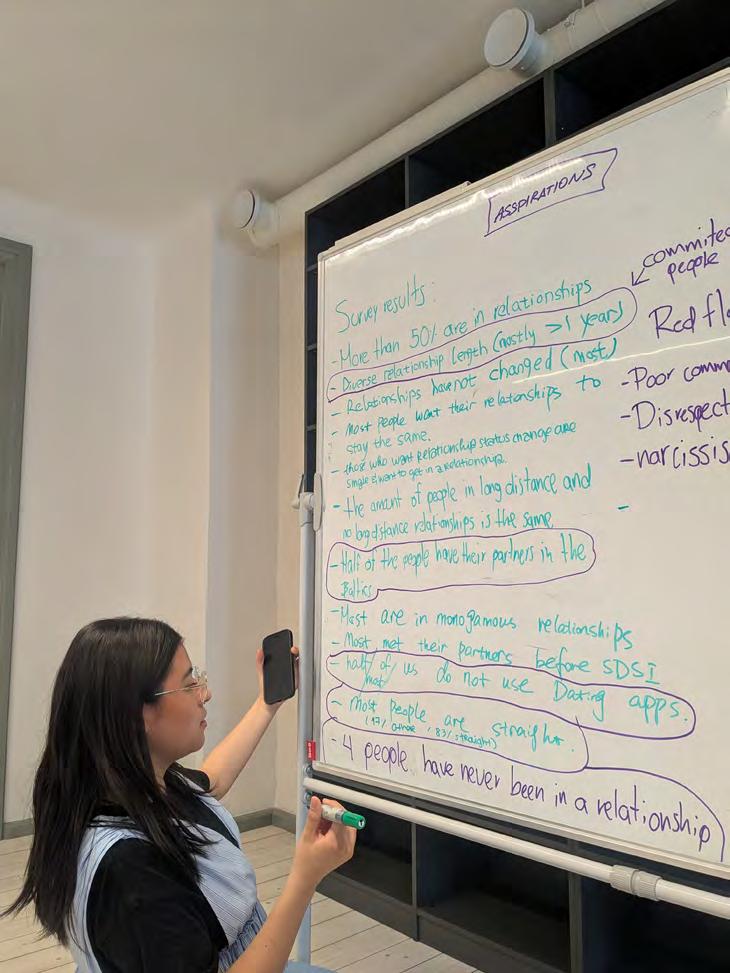
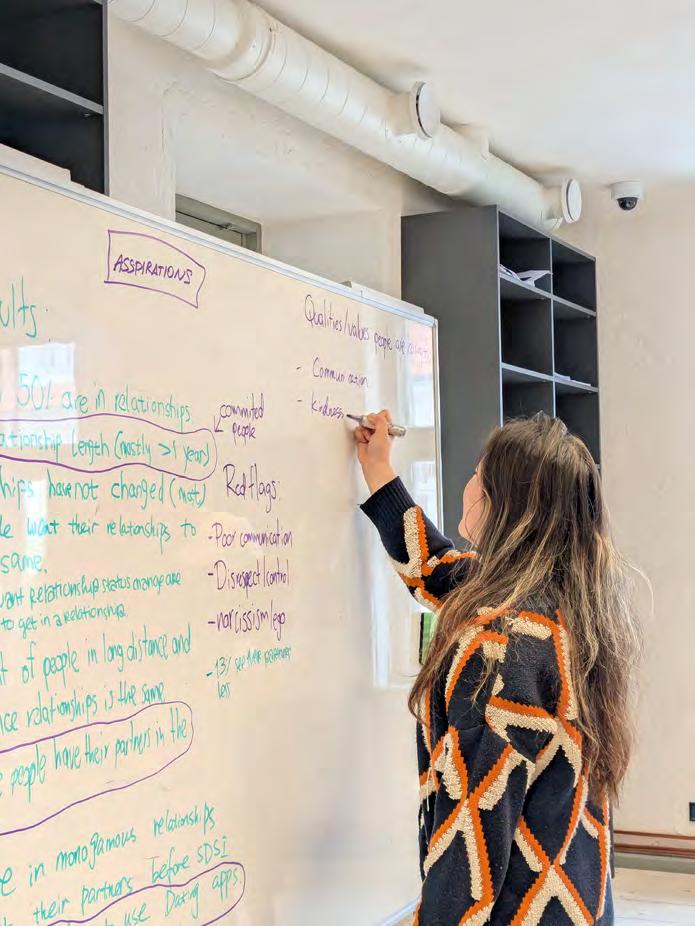


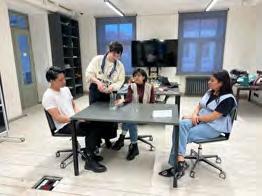


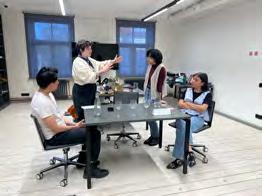
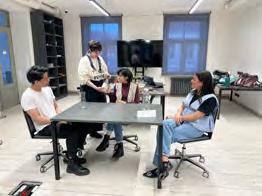


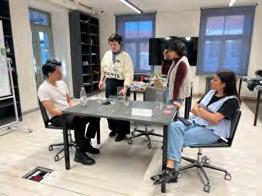







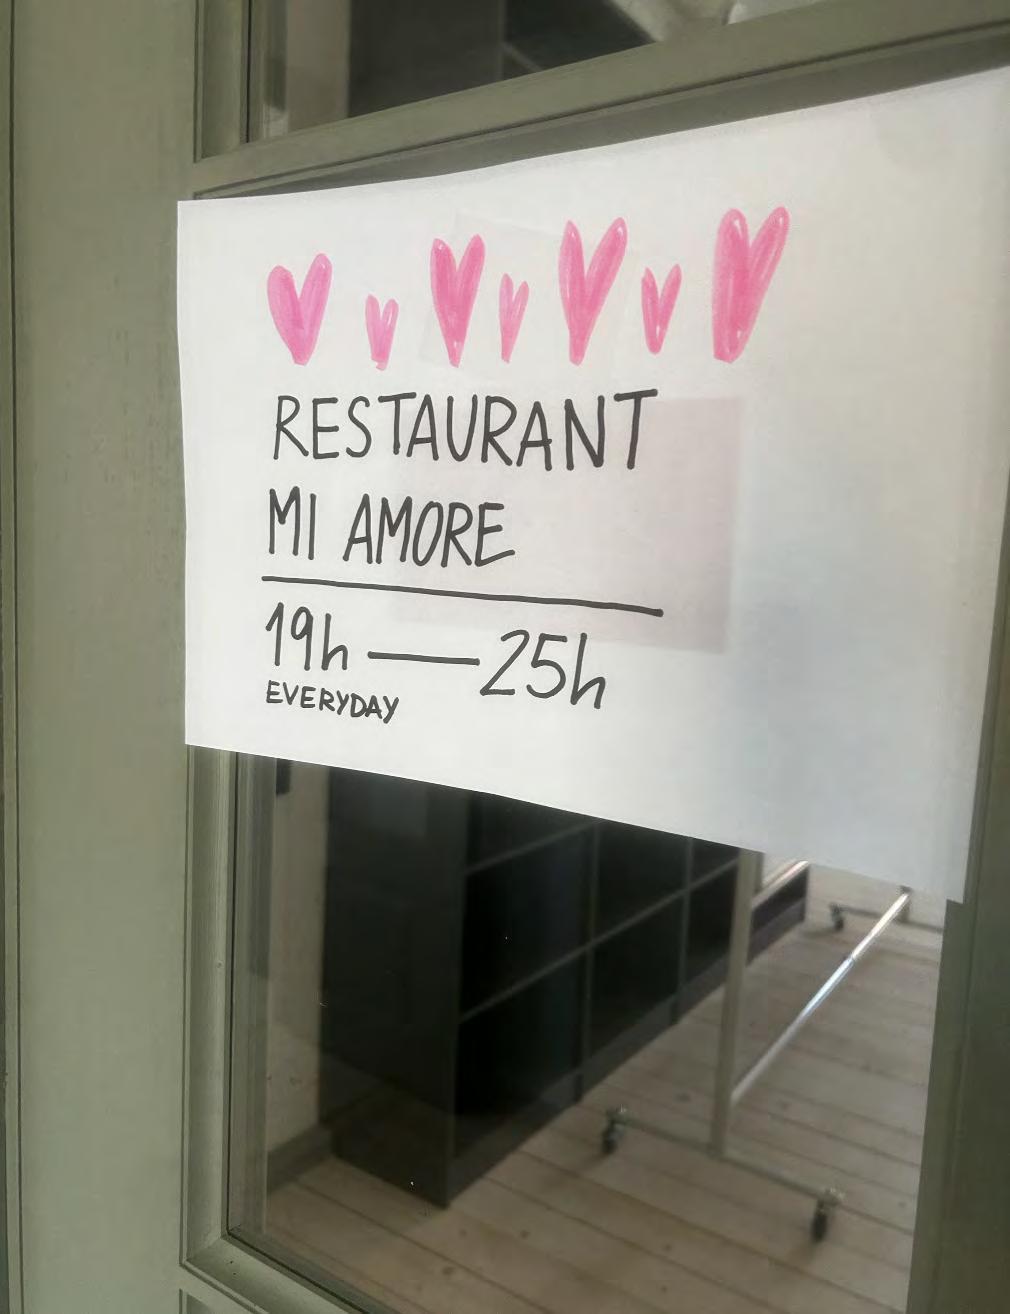










”As chefs of community, we came to the kitchen to mix memories, stir up laughter, and serve something warmer than just food—togetherness.“

——Greetings from the Chef Team




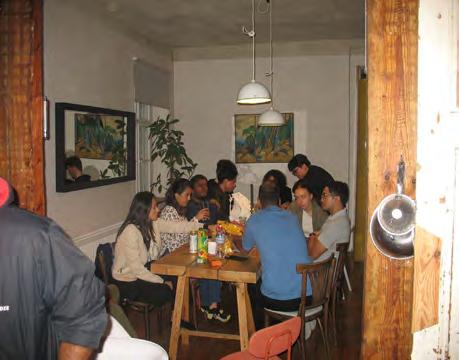
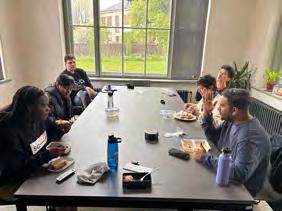
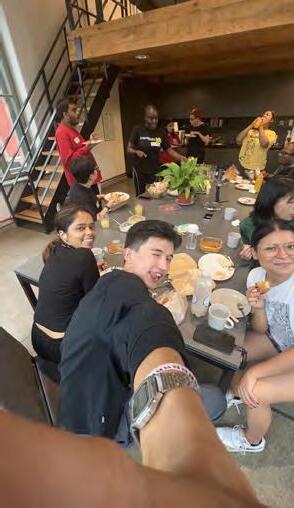


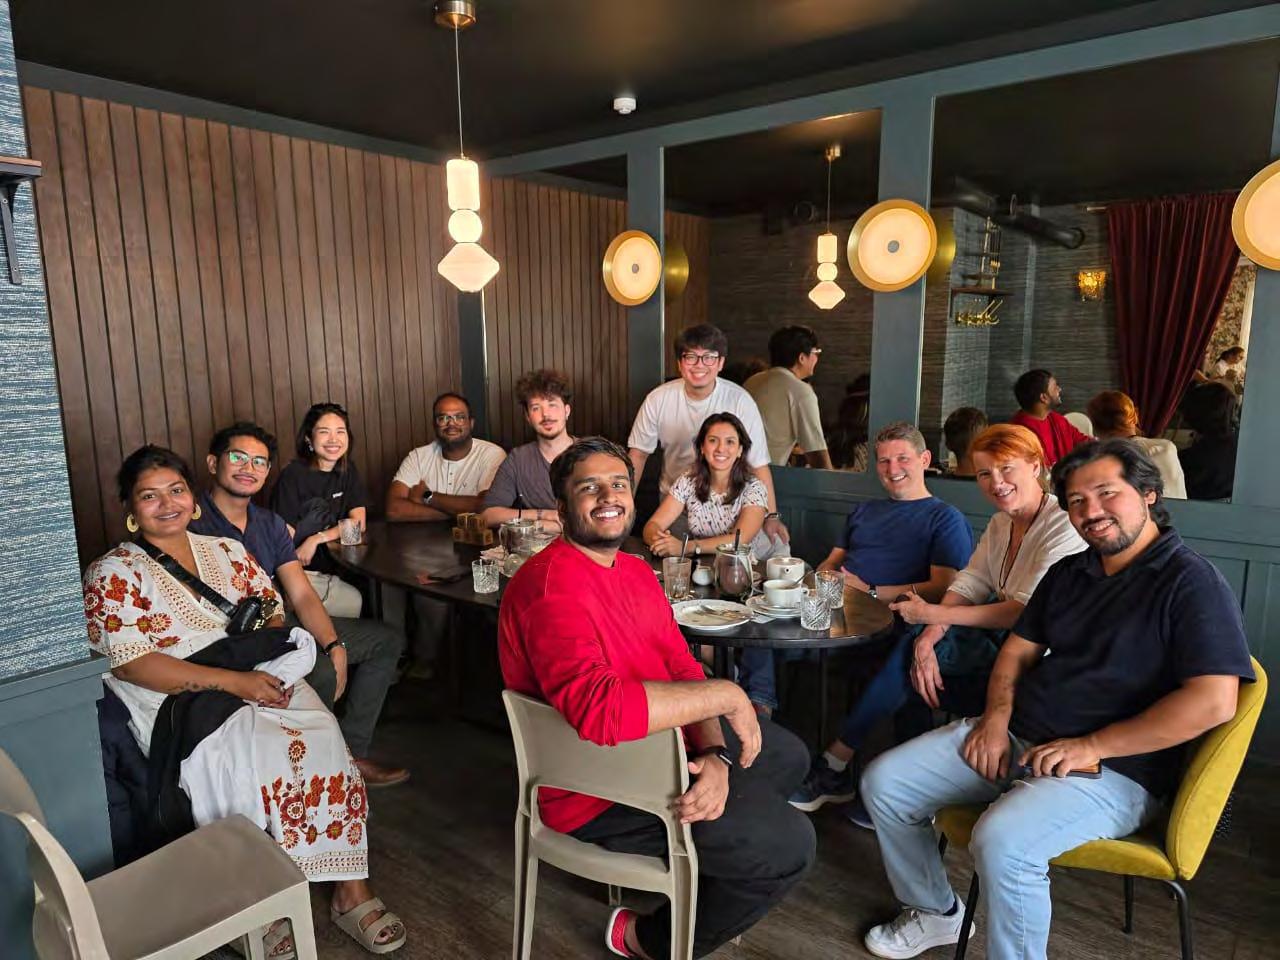


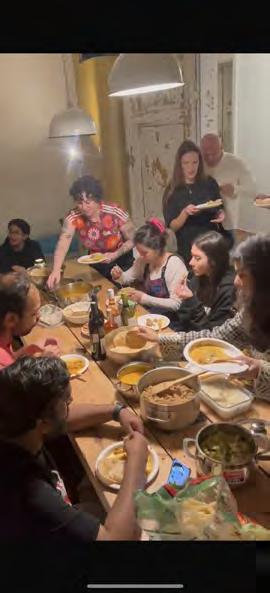



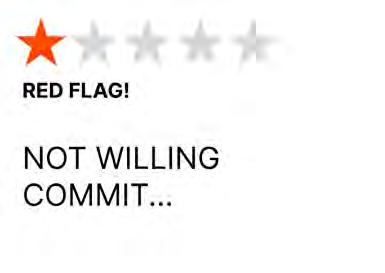
Chef’s Tip: Some bites aren’t bitter because they’re bad but because they remind you what you’re missing.


Shape narrative around “home” a theme that kept rising in food, places, and feelings
Turned insights into interactive moments like the hickpea ar, Sad Food eveal.


