
Executive Summary
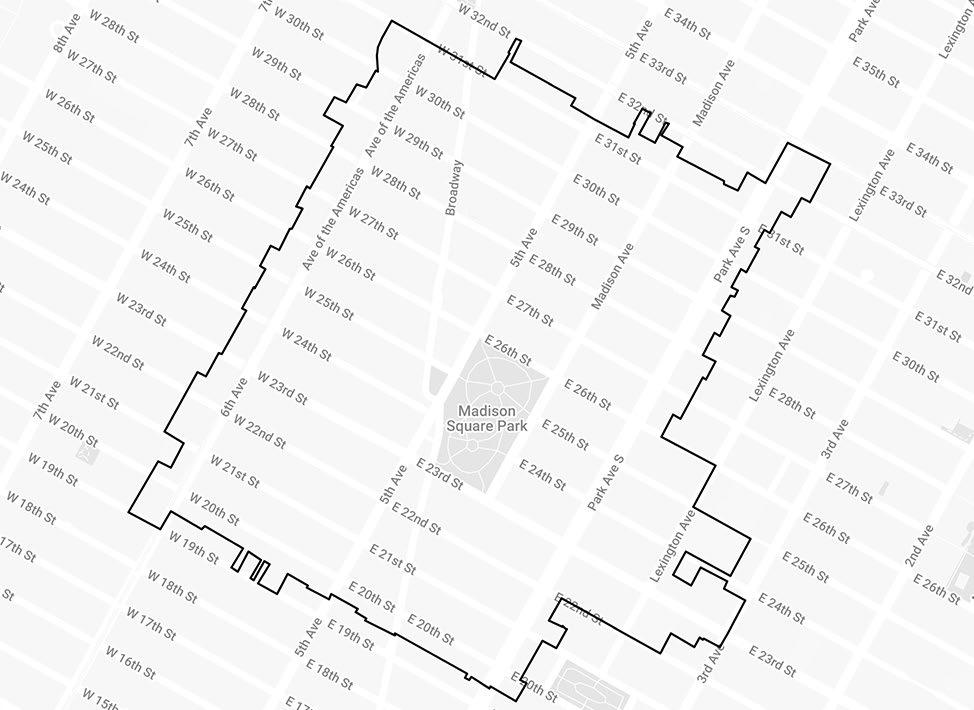
In January 2022, the Flatiron NoMad Partnership Business Improvement District (BID) service area expanded from Flatiron proper to include all of NoMad and extended to 20th Street and Sixth Avenue.
From January 3 - February 6, 2023, the Partnership conducted its annual community survey to gather neighborhood feedback. The survey was tailored to all stakeholders including residents, employees, visitors, students, and business and property owners. The online survey was shared via Partnership enewsletters, targeted social media outreach, QR-code decals in neighborhood public spaces, and USPS mailings. Results from this survey help inform and prioritize the Partnership's work.
The Partnership’s Mission
We are the Flatiron NoMad Partnership and we serve the businesses, people, and places that help make this district one of Manhattan’s most iconic and authentic destinations.
Home to a range of retailers and employers, cultural and educational institutions, and a thriving residential community, the Flatiron NoMad Business Improvement District (BID) is a center of activity. From neighborhood enhancements and community building initiatives to the championing of district businesses, we celebrate the quintessential New York attitude with a contemporary edge.
SANITATION
Clean streets, sidewalks, plazas, and public amenities are foundational to our thriving district. Our Clean Team keeps these spaces inviting to the tens of thousands of residents, commuters, and visitors who enjoy them every day.
PUBLIC SAFETY
Our Public Safety Officers (PSOs) wear many hats to ensure that Flatiron and NoMad are safe and welcoming to all. Their efforts supplement the services of the New York City Police Department (NYPD) and other City-agency partners.
HOMELESS OUTREACH
We are committed to offering a helping hand to those most in need in Flatiron and NoMad. Since 2007, we have worked with social services professionals from the New York City nonprofit organization Urban Pathways to assist people experiencing homelessness in the area.
MARKETING & EVENTS
Our marketing and events serve as the neighborhood cheerleader and megaphone: amplifying the messaging of our businesses and connecting them with enthusiastic locals, visitors, and a network of likeminded entrepreneurs.
STREETSCAPE & BEAUTIFICATION
Since our inception, we have provided the vision, placemaking, and daily tender loving care that have made beautiful public spaces a hallmark of Flatiron and NoMad. We’re tireless advocates for Flatiron and NoMad people-first places and spaces that are beautiful, safe, and accessible for all.
DISTRICT ADVOCACY
The interests of Flatiron and NoMad’s residents, employees, merchants, property owners, and visitors drive everything we do. That means not only providing our core services, but also communicating with government leaders about our district’s needs and working with them on solutions.
3
Table of Contents
Program Areas Field Operations Streetscape Marketing Contact Us 12 13 17 21 24 Major Findings 7 Survey Respondents 5
(click to go to page)
SURVEY RESPONDENTS

Visitor/Tourist 17% Employee 15% Property Owner / Manager 4% Student 1% Resident 63% RESPONDENT BREAKDOWN 52% 20% 28% RELATION TO THE BID BID Expansion Area Outside the BID 5% 46% 29% 18% 2% AGE 18 - 24 25 - 39 40 - 59 60+ Blank 1,095 6
MAJOR FINDINGS
10 11 15 28 30 134 169 662 2 27 16 20 18 64 152 351 I am a student I own / manage commercial property I am a visitor/tourist from outside NYC I own / manage a business I work in retail/service/restaurant/construction I work in an office building I am visiting from another NYC I live in the neighborhood Takeaway 1: The Partnership’s reach grows and diversifies each year. SURVEY RESPONSE GROWTH 3.4X SURVEY ACCESS Email Newsletter Postal Mailing (EDDM) Social Media Fliers & Decals (QR Code) EXPANDED RESIDENTIAL & EMPLOYEE REACH 2022 2023 57% 21% 12% 10% 73% 4% 23% 2022 2023 1.9X 2.1X 8 308 650 1,059 2019 2022 2023
Takeaway 2: The Partnership has had a positive impact in its first year in the expansion area.
Homelessness (2022 compared to 2021)
Much More Prevalent Slightly More Prevalent The Same Slightly Less Prevalent Much Less Prevalent
Cleanliness (2022 compared to 2021) Dirtier The Same Somewhat Cleaner Much Cleaner
felt cleaner
Public Safety (2022 compared to 2021) More Dangerous The Same Somewhat Safer Much Safer
EXPANSION AREA TOTAL
43%
47% felt safer
14% 10% 33% 34% 9% 43%
EXPANSION AREA 12% 17% 35% 29% 7% 36% TOTAL
felt less prevalent
59% TOTAL 9% 32% 40% 19% 67%
EXPANSION AREA 9% 24% 42% 25% 14% 43% 33% 10% 11% 42% 36% 11%
9
3 : Overall, stakeholders strongly approve of the Partnership's work . Homelessness and public safety remain top concerns in the neighborhood . TOP CHALLENGES FOR THE PARTNERSHIP TO PRIORITIZE 85% 2023 (1,095 respondents) 92% 2019 (308 respondents) 85% 2022 (650 respondents) BID APPROVAL RATINGS 19 22 51 62 94 95 142 214 338 Public Seating Amenities Public Art Streetscape Greenery / Beautification Community Events & Family Activities Sanitation (e.g., trash, graffiti) Ground Floor Business Vacancies Bicycle / Pedestrian Safety & Infrastructure Public Safety / Crime Homeless Outreach / Social Services 10
Takeaway
85% support redesigned and pedestrianized streets
73% of respondents from 2022 and
want more performances
Takeaway 4 : Flatiron and NoMad are pedestrian - first neighborhoods with an appreciation for public events and programming . DESIRED PUBLIC EVENTS & PROGRAMMING 2022 2023 244 335 417 600 775 154 265 252 367 452 Family-friendly activities Outdoor Fitness Classes Neighborhood Networking Arts & Culture Performances
2023
Driving 1% Commuter Rail 1% Rideshare 2% Bicycling 4% MTA Bus 4% Subway 20% Walking 68% 11 PRIMARY MODE OF TRANSPORTATION
PROGRAM AREAS
Field Operations Results
Sanitation
ARE FLATIRON & NOMAD STREETS CLEAN?
No, it’s a mess
74% feel Flatiron and NoMad are clean
(up from 69% last year)
77% support trash containerization efforts
No, they need work Yes, mostly Yes, always
17%
4% 22%
57%
14
Public Safety
and NoMad are
safe
64% support additional street lighting for safety
3% 15% 55% 27% IS FLATIRON & NOMAD SAFE? No Sometimes Yes, most of the time Yes, very
82% feel Flatiron
15
Homeless Outreach & Social Services
NEIGHBORHOOD HOMELESSNESS PERCEPTION
(compared to last year)
71% feel street homelessness has not increased (compared to last year)
PERCEPTION OF STREET HOMELESSNESS HAS DECLINED SINCE 2020
2021 compared to 2020 (2022 Survey) 2022 compared to 2021 (2023 Survey)
Much More Prevalent Slightly More Prevalent The Same Slightly Less Prevalent Much Less Prevalent
29% of 2023 respondents believe street homelessness is increasing year-over-year
compared to
50% of respondents in 2022
12% 17% 35% 29% 7%
27% 23% 12% 17% Much More Slightly More
16
Streetscape Results
405 406 534 561 599 600 628 700 Outdoor Dining Sidewalk Benches Curbside Trash & Recycling Containers Open Streets Sidewalk Planters Festive Lighting Public Art Installations Street Trees MOST DESIRED HORTICULTURE & PLACEMAKING EFFORTS Placemaking 18
TRANSPORTATION SAFETY CONCERNS 127 203 228 384 419 493 628 Unclear Rules Signage Sidewalk/Pedestrian Congestion Illegal Parking Speeding/Unsafe Drivers Unregulated Laws Intersection Conflicts E-bikes, scooters, mopeds 85% support redesigned and pedestrianized streets Neighborhood Transportation Driving 1% Commuter Rail 1% Rideshare 2% Bicycling 4% MTA Bus 4% Subway 20% Walking 68% PRIMARY MODE OF TRANSPORTATION 19
Public Space
WHICH PUBLIC SEATING AREAS DO YOU USE MOST? I'm not sure 15% No 9% Yes 76% ADEQUATE PUBLIC SEATING? ADEQUATE CITI BIKE DOCKS? ADEQUATE BIKE PARKING? I'm not sure 54% No 6% Yes 40% I'm not sure 40% No 8% Yes 52% 169 377 415 415 506 730 992 POPS Worth Square Broadway & 24th Street NoMad Piazza Pop-Up Broadway & 22nd Street Flatiron Public Plazas Madison Square Park 20
Marketing Results
Communication Channels & Content
77.1%
awareness
BID
INFORMATION ACCESS 2022 2023 SOCIAL MEDIA FOLLOW 2022 2023 Neighborhood Alerts 13% Press, Reports & Data 19% Local Business Recommendations 29% Local Events Recommendations 39% DESIRED CONTENT 10 20 49 163 169 230 295 511 19 41 83 108 34 135 210 384 LinkedIn Twitter Facebook Plaza Signs Postal Mailings Website Instagram Email Newsletter 22 483 25 61 79 91 426 236 42 75 63 106 267 None of the above LinkedIn Twitter Eventbrite Facebook Instagram
Events MOST DESIRED EVENTS & PUBLIC PROGRAMMING DESIRED EVENT TIMES Weekdays 47% Weekend 53% 108 352 857 Morning (before work) Lunchtime/ midday Afternoon (after work) 63 129 150 300 358 411 485 Facebook Postal Mailings Eventbrite Website General NYC "Things to Do" Instagram Weekly E-mail Newsletter GO-TO EVENTS RESOURCES 244 335 417 600 775 Family-friendly activities Outdoor Fitness Classes Neighborhood Networking Arts & Culture Performances 23

NICOLE MANDEL Economic Development & Research Manager nmandel@flatironnomad.nyc 212.741.2323 x 105 FLATIRONNOMADPARTNERSHIP 230 Fifth Avenue, Suite 1511 New York, New York 10001 P (212) 741-2323 FlatironNoMad.nyc
