

March 2025 Final Report


This study answers the following questions about office-to-residential conversions in the Flatiron/NoMad Business Improvement District:

What are the economic and physical drivers of feasibility?

Which + how many buildings in the district are likely best suited to conversions?
What are implications of public policies and initiatives for conversions?
What are the implications for the district?
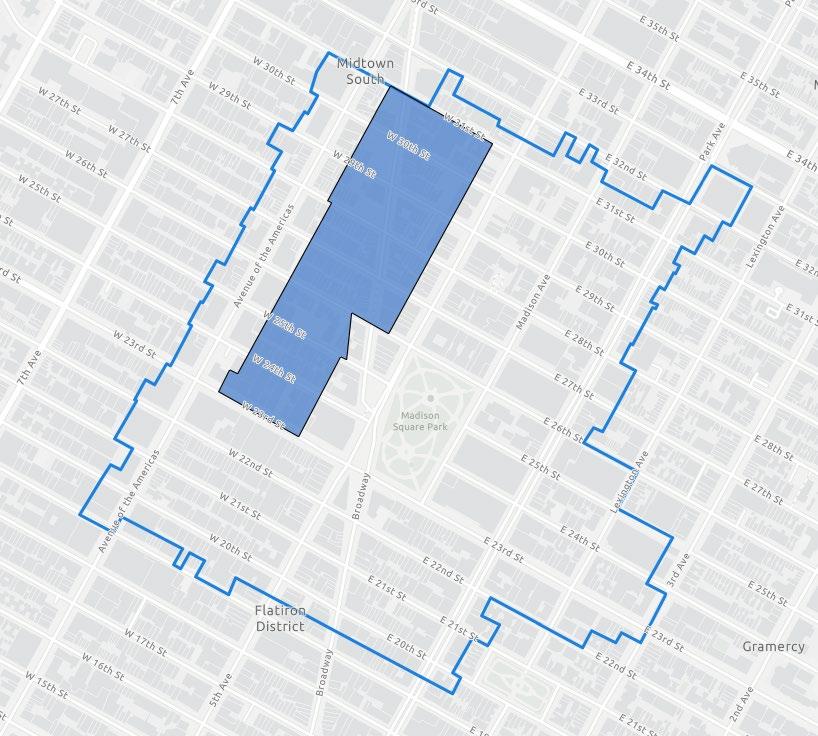
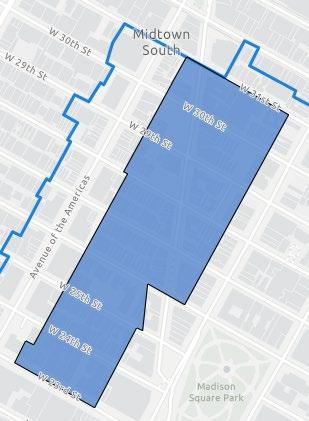
Flatiron/NoMad BID MS/MX Rezoning Area BID Boundary
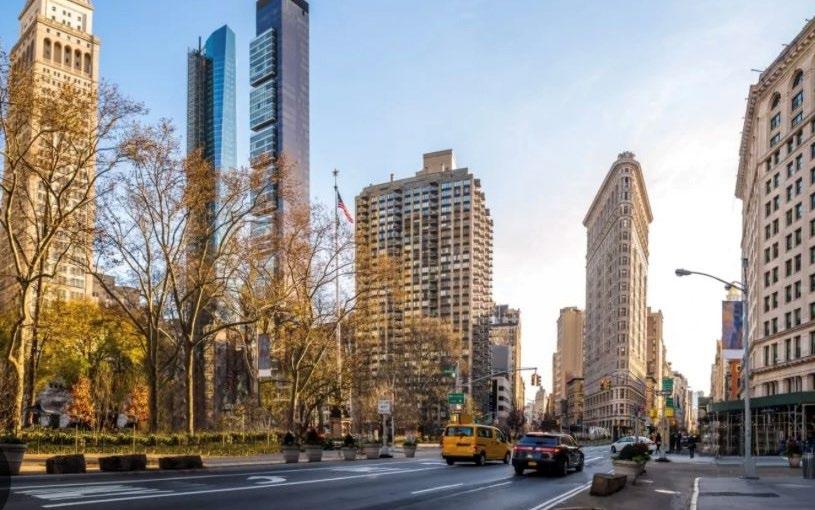
As a desirable neighborhood with a strong brand, Flatiron/NoMad’s office market does not appear to be deeply distressed.
• Flatiron/NoMad office rents are only 5% lower rent in 2024 than in 2019, a stronger rebound than the 16% decrease across Manhattan.
• Office vacancy in the BID (19%) exceeds Manhattan’s (15%) – but vacancy may in part be driven by recent renovations still leasing up.
• The BID experienced negative absorption of 5 million square feet of office space, or -14%, from 2020-2023, compared to -4% borough-wide.
Absorption in the district was positive in 2024.
Office Gross Rent (2014-2024)
Flatiron/NoMad Manhattan
Office Vacancy (2014-2024)


Average residential rents in Flatiron/NoMad are substantially higher than those for office
driving feasibility of many past and ongoing conversions, often without subsidy.
Office Rent per SF
Residential Rent per SF Annual Rents* by Class, Flatiron/NoMad
*Source: CoStar. Rents are per rentable (e.g. net) square foot. Residential rents include non-residential income (e.g. laundry)
The MS/MX rezoning will change the feasibility of conversions in a portion of the district, while other incentives and regulations will have a less significant impact.
Proposed zoning will now allow residential uses in an area with 84 office buildings – enabling conversions and also incentivizing new construction through significant new density.
The BID’s 2 historic districts only govern features that can be seen from the street and are not a meaningful obstacle to conversion.
467-m conversion incentive
This property tax abatement is generally not financially accretive in the district given the difference between market-rate and affordable rents.
Owners may pay fines for noncompliance rather than make expensive upgrades. However, if a building is already undergoing a conversion, the incremental cost of compliance is much smaller.
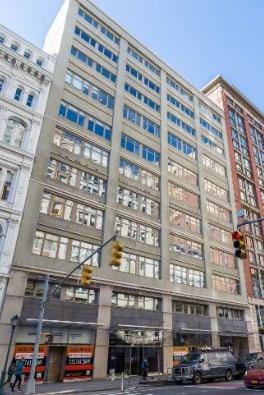
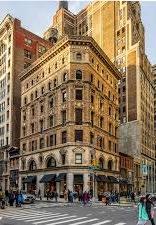
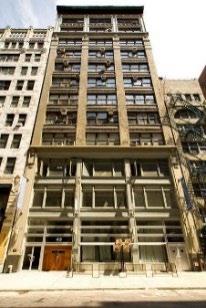
To analyze physical conversion feasibility, Gensler categorized buildings in the BID as “mid-block,” “corner,” or “high-rise”* and analyzed 9 representative properties.
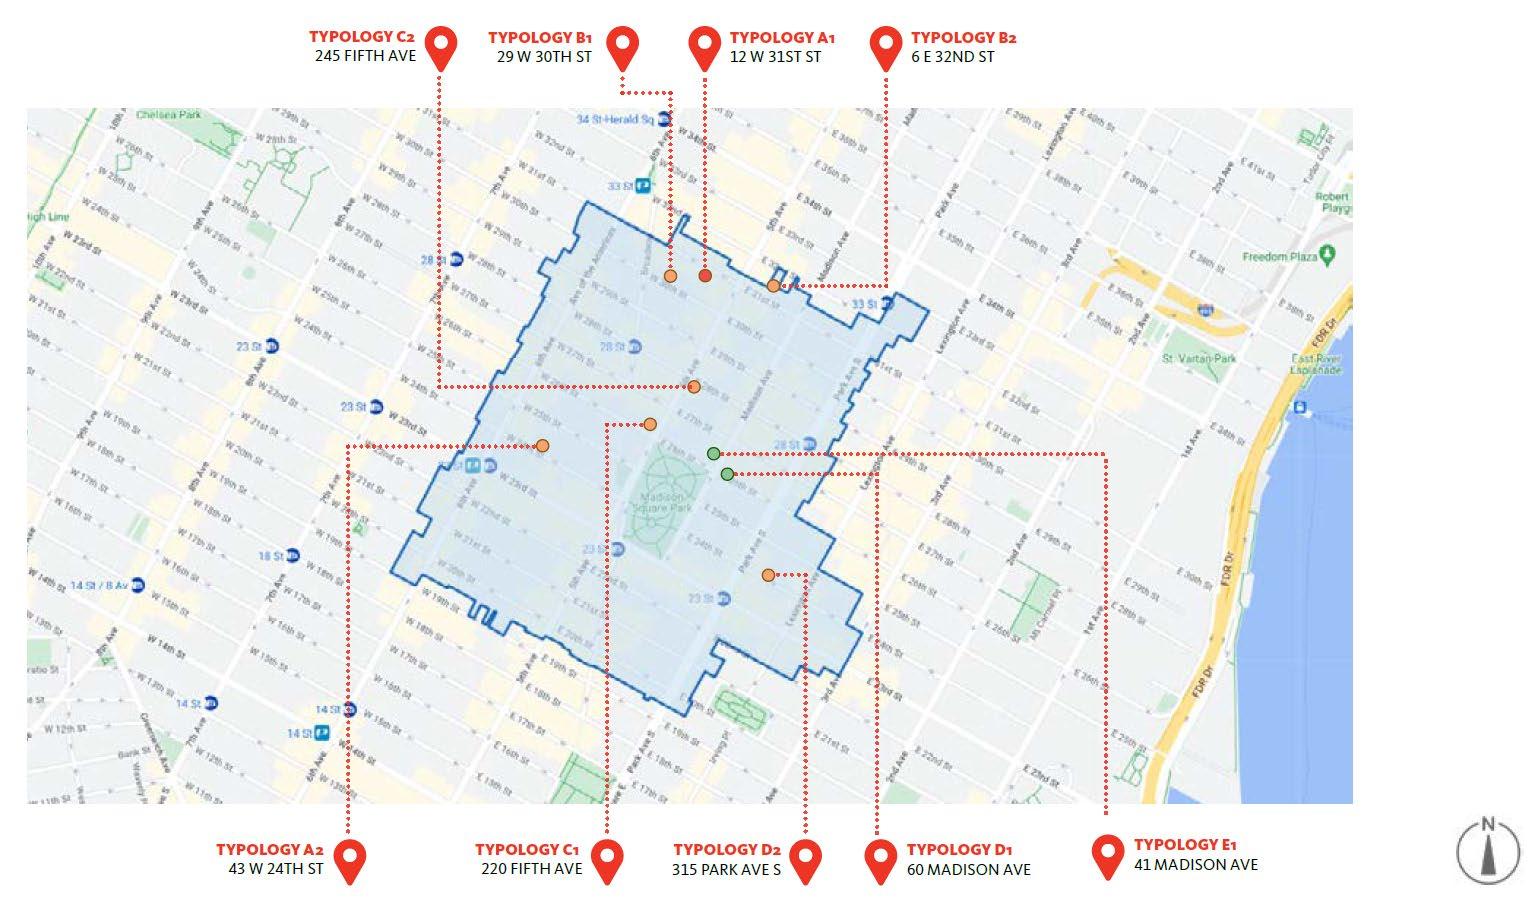
Gensler’s analysis found efficiency ratios – an important driver of financial feasibility –ranging from 75-80%. This suggests the majority of the buildings in the BID can be converted from a design perspective, but with some level of compromise.
Typology

Mid-block
4
4
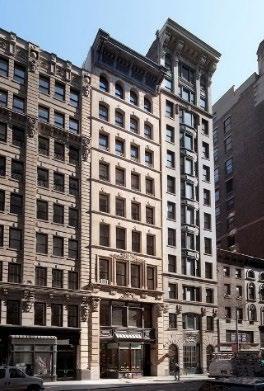
High rise
Number of Buildings in BID
Decreased by limited frontage with a substantial floor plate depth.
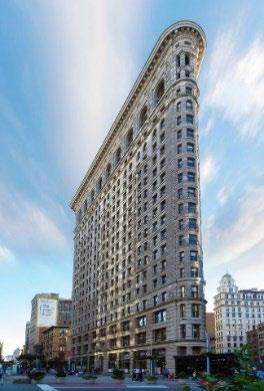
Increased due to more limited floor plate depth, larger frontage, and in some cases, additional facades providing natural light.
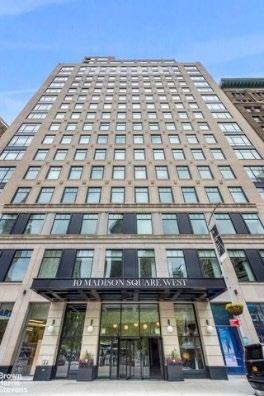
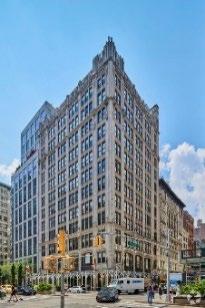
41 Madison’s corner location, limited core-to window depth, and 3 facades make it a good candidate for conversion.
Requirement for a greater number of elevators, however, results in a substantial core that reduces floor plate efficiency.
Our analysis assumes that office buildings face two paths forward: remain as office space or convert to residential. Conversions only happen when the cost of conversion plus the existing office value is less than the future value of a residential building.*
Key factors that will vary by building and influence conversion feasibility include:
Characteristics
• Efficiency ratio*
• Quality of apartment layouts
Revenue Drivers
• Mechanical upgrades
• Structural upgrades
• Curtain wall changes
• Current office rents/vacancy
• Expected residential rents/vacancy
• Time to vacate, construct, lease up
• Whether developer has to acquire
• Debt on building
• Desire to own/ operate new asset class
• Owner capacity
Break-even residential rents vary by building and are driven by existing office rents, vacancy, and building efficiency. Only 315 Park Ave South and 41 Madison require above-market residential rents because they are the best-performing office buildings.
BID Average Rent ($99/SF)
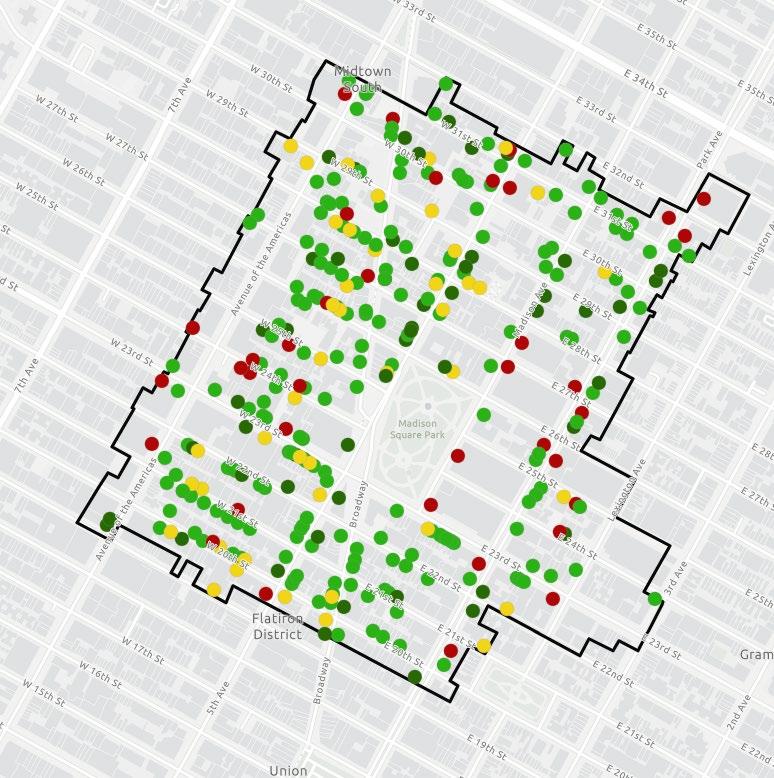
Extrapolating findings from the 9 buildings across the entire office inventory by typology results in 57% of office square footage profiling as having a high feasibility of conversion.
Conversion Feasibility, All Office Buildings
Office Inventory, by Feasibility of Conversion
For buildings for which rent/vacancy data were not available, HR&A imputed BID-average data. Numbers may not add up due to rounding. Assumes office vacancy of 20%; residential vacancy of 3%; 467m is not used; conversion by owner (no acquisition costs). Categories take into account specific buildings for which conversion likelihood is known – e.g., known planned conversions and recently built/renovated properties.
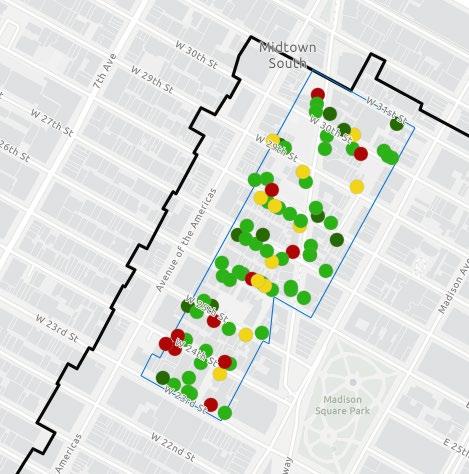
Within MS/MX, 77% of office SF ranks as High or Very High conversion feasibility, a higher share than the BID overall because of fewer buildings with significant recent investment.*
Conversion Feasibility, MS/MX Rezoning Area within BID Boundaries
*24 office buildings (comprising 7.7M SF) in the BID were classified as “Low” feasibility due to significant recent renovations, being recently built (1991 and later), or recently having signed a major lease. Just 0.5M of this 7.7M square feet fall within the MS/MX rezoning area. Analysis does not compare economics of office conversion to new construction under new zoning. Numbers may not add up due to rounding.
However, other factors, like existing debt on buildings – for which there is limited data – may reduce conversion feasibility.
• Of 328 office buildings in the BID, there is data on debt for 45.
• Before factoring in debt,* 95% of the square footage of these 45 buildings ranks as High/Very High feasibility; 19% does after debt.**
*When a building’s outstanding loan balance exceeds the building’s value appreciation upon conversion, the property is unlikely to secure a loan needed to convert the building and may be subject to foreclosure.
**Buildings’ post-debt categorization was calculated as follows on a PSF basis:
While we estimate that 57% of the office SF in the BID has a high feasibility of conversion, benchmarking against other factors and historic trends suggests a conversion rate of 10-20%.
• For the BID buildings for which debt data was available, only 22% of office SF ranked as High/Very High.
• 13% of office SF in Lower Manhattan was converted 1995-2006.*
• Using these benchmarks, conversion of 1020% of office SF in Flatiron/NoMad would produce 3,400-6,800 units.
• Based on historic absorption, these conversions would occur over 20 years.
• While a slower pace than conversions in Lower Manhattan, Flatiron’s office market is much healthier than Lower Manhattan’s in the 1990’s and early 2000’s.
Source: NY Citizens Budget Commission, 2022; Costar.
in
The strength of the residential market in Flatiron/NoMad makes conversion feasible for many buildings – though we expect only 10-20% of buildings to convert.
Office buildings with market-average performance (e.g., $60/sf, 20% vacancy) or lower are strong candidates for conversion, while higher-performing buildings face higher opportunity costs.
The feasibility of conversion will depend on whether the quality of resulting residential units can achieve adequately high residential rents.
Building-specific owner circumstances that might prevent conversion – not analyzed in our model – including debt on building, capacity to convert, desire to operate a new asset class, or the need to acquire the asset.
Individual building characteristics, such as curtain walls, or significant seismic strengthening requirements, can make conversions less feasible.
Given above factors as well as historic housing deliveries in the BID, 10%-20% of the BID’s office inventory could realistically convert over the next 20 years.