

FIELDNOTES
letter from the editors
Nearly a year has passed since our last edition, and we are so excited to be back again this quarter with another issue of FieldNotes! After many meetings in our little conference room in the Fisheries Science building brainstorming, writing, and editing, we bring you yet another journal flled with incredible research from undergraduate students in the College of the Environment.
This year’s feature article delves into mapping industrial changes in the Ecuadorian Amazon. Other research articles range from exploring urban agriculture to combat food deserts, to modeling changes in ocean temperature trends, and investigating the biofuorescence of Arizona tiger salamanders. They also examine the impacts of bark and ambrosia beetles on trees and the need for comprehensive salmon management as wildfre frequency increases. Within our editorial board, we investigate protective measures for the Cascade red fox, the role of adventure-based citizen science in data collection, the potential of small-scale regenerative agriculture, and so much more.
We would like to thank the College of the Environment for their continued support of the journal over the seven years since its inception, as well as Rachel Fricke and Julian Olden for their unwavering support and leadership as we collaborated to make another amazing issue of FieldNotes! We could not do it without them. We would also like to wish Rachel the best as she works toward graduating this upcoming spring with her PhD. Rachel has been with FieldNotes since the beginning and we wish her the best in all of her future endeavors!
We hope you enjoy reading the work of our hardworking undergraduate researchers and editors.
Best,
The FieldNotes Editorial Board

meet the team


LAUREN GRADY EDITOR-IN-CHIEF
KATE ALLHUSEN EDITOR
PHOEBE BERGHOUT EDITOR
FAN BU EDITOR
BRIANNA BONDS EDITOR
CLAIRE FARBER EDITOR
RACHEL FRICKE GRADUATE ADVISOR
JULIAN OLDEN FACULTY ADVISOR
SVEA HALLBERG EDITOR
COLIN LAU EDITOR
WILL MIXON EDITOR
MIRANE YACOUB EDITOR

PHOTO MADDY GLASSER
Mapping Land Transitions Agricultural and Industrial Change in the Ecuadorian Amazon
By
Sage Mailhiot, Environmental Science 2026
ABSTRACT
Industrial impacts have increased in the Ecuadorian Amazon over the past several decades in the form of monoculture cultivation and petroleum extraction. Using a combination of GIS and remote sensing tools, this study assesses the changes in petroleum infrastructure and land-use surrounding the Kichwa community of Loma del Tigre from 2011 to 2024. Results highlight increases in petroleum infrastructure over the past 13 years and quantify infrastructure proximity to local indigenous communities. These fndings suggest ecosystem services are decreasing and water and soil contamination have worsened. Forest presence decreased over the study period, while other land-use types – African palm and pasture – increased. The fndings of this study are benefcial in the advocacy for the expansion of land protection programs. I compile these results in a series of maps, to assist the community of Loma del Tigre in pinpointing the sources of contamination and land-use change in their surroundings.
INTRODUCTION
Against the backdrop of the climate crisis, petroleum production continues to increase. In addition to the negative impacts that fossil fuels have on the climate at large, petroleum production harms populations near the extraction sites. In the Ecuadorian Amazon, there has been petroleum activity since the 1960s. Petroleum production has signifcantly degraded the quality of life for occupants of the Joya de Los Sachas canton, or district.
Petroleum infrastructure comes in several forms. This study quantifes the presence of mecheros, oil pools, and oil wells, and displays the extent of the canton oil feld. Oil felds are regions of land identifed by petroleum geologists to have a high concentration of petroleum.
Petroleum companies concentrate their activities here, installing oil wells to extract the product from the earth. Mecheros are a secondary part of the process, where excess natural gas is burnt off before transportation in a huge fare. Oil pools are the result of unmanaged and abandoned oil wells. These oil pools exude petroleum into the soil, like an underground petroleum
spring. They are spread throughout the canton, and mostly originate from ChevronTexaco’s petroleum production in the region during the 1960s–1990s.
Information about petroleum infrastructure is hard to access. The locations of oil pools are not publicly available information — a challenge for local communities whose farms are signifcantly impacted. Oil pools are
“Since the 1960s... petroleum production has signifcantly degraded the quality of life for occupants of the Joya de Los Sachas canton.
often obscured in the landscape, and thus are diffcult to strategically avoid (Bezerra-Gastesi 2024). The locations of mecheros and oil wells are easier to deduce because they are features on the landscape, but it is diffcult to quantify how close communities are to this petroleum infrastructure without a map. Additionally, mapping these features provides a deeper understanding of where points of contamination are interwoven with waterways.
In the early 2000s, the cultivation of African palm began on a commercial scale in the region, and now it is one of Ecuador’s more lucrative crops. However, this economic proft is not evenly distributed. Large farming corporations beneft the most from African palm cultivation. Rural indigenous communities receive the fewest benefts from African palm, and instead experience negative impacts from its production such as contamination associated with pesticides (Dislich et al. 2016, Castellanos-Navarrete et al. 2021).
The relationship between African palm oil production and deforestation is not yet fully understood, especially on a local scale. Most research is focused
on the Amazon rainforest’s signifcance as a carbon sink, instead of considering local impacts on communities peripheral to the production. The native Amazonian forest contains many resources integral to traditional ways of life — fruiting plants, seeds and dyes used for traditional dress, and protein sources. Loss of forest and colonization of the area continue to have negative implications for the preservation of traditional ways of life. This study maps and quantifes agricultural and petroleum industry impacts experienced by the community of Loma del Tigre, and was developed in partnership with the community, as laid out in the environmental justice framework proposed by Van Horne et al. (2022).
The broad goal of this study is to anayze changes in land cover and the presence of petroleum infrastructure in the study region centered around the Kichwa community of Loma del Tigre over the past 13 years. Ultimately, I evaluate the trends of industrial agriculture and petroleum growth in the region, and how these factors interact with biodiversity loss and environmental health. Specifc objectives include (1) Quantifying petroleum infrastructure presence and its impacts to evaluate point contamination infuences on land-use change and consider the proximity of populated areas, and (2) Determining the change in land-use between 2011-


2024, using a geographic information system (GIS) and remote sensing to recognize trends of expansion or loss of African palm and forest cover.
METHODS
Study Area
This study was conducted in the Orellana province of Ecuador, in the eastern part of the Joya de Los Sachas canton. The Orellana province is the ancestral lands of the Kichwa, Shuar, Waorani, Achuar, and Taromenane people, who have lived in this region for time immemorial. The study region is a 11km x 11km zone, centered around the Kichwa community of Loma del Tigre. The region also includes the small towns of Pimampiro and 10 de Agosto, and the city of Joya de Los Sachas. The city of Joya de Los Sachas was established in 1972 to support the growing petroleum industry. The total area of the region is 120.9 km2
Petroleum Infrastructure
To identify the locations of the mecheros in the area, existing data from 2022 was used as a baseline. This map was geographically oriented in QGIS, and then approximate locations of mecheros were marked. Using these
location estimations as a guide, the majority of mecheros were located using a combination of 2019 Bing imagery and 2024 Planet imagery. Some mecheros were established after 2019, but were not discernible in the 2024 Planet imagery, and were only discovered while travelling the study region in-person. All mechero locations were confrmed in-person (Figure 1). By comparing highresolution 2011 Ortofotos imagery to the Planet imagery, it was determined if the mechero had been established before or after 2011. Additional data on petroleum infrastructure– including the location of oil wells, oil pools, oil spills, oil pipelines, canton road network, and hydrology –was sourced from the Municipality of Joya de Los Sachas, Dept. of Planning.
Land-use
An updated land-use map was created using supervised classifcation to correlate between satellite imagery and land-type classifcation data, which was collected both in the feld and classifed remotely. This correlation was then applied to the whole region. The supervised classifcation product was informed by 3220 hectares of land that fell into 9 different land-use
FIGURE 1 Example of mechero found in the feld that did not appear in satellite imagery
FIGURE 2 Field data gathered in Avenza. The orange polygon represents an anticipated location of plantain growth according to 2011 data, but on the ground, it was determined to be an empty feld.
classes. These include African palm oil, corn, cacao, pasture, forest, developed area, silviculture, mosaic agriculture, and empty felds. Of this total, 1845 hectares was data collected in the feld. Field visits were conducted using Avenza to note the land-use types from the road with a point, the crop type, and a cardinal direction (Figure 2). A total of 35 kilometers of road were covered in this manner.
Using the examples gathered in the feld, the appearance of land-use classes in satellite imagery were characterized. Certain land-use classes, such as mosaic agriculture and silviculture, are diffcult to identify from satellite imagery because their appearance is inconsistent and they only exist in small sections. Most classes have patterns that are easier to identify, as shown in Figure 3. 1375 additional hectares were classifed remotely.
In ArcGIS, the 2024 satellite imagery was frst segmented using the Segment Mean Shift tool. This breaks the satellite image down into homogenous regions, which streamlines the classifcation process. Images were classifed with the Classifcation Wizard feature, using the Support Vector Machine (SVM) method as the classifcation algorithm. I arranged the 2011 vector data to make it more compatible with this newly classifed raster data set in QGIS. The 44 land-use classes that are included in the 2011 data set were consolidated into the nine land-use classes listed above. In cases where the land-use evident in 2010 satellite imagery was not consistent with the 2011 land-use class, the vector data was corrected. For example, the 2011 land-use class of “matorral humedo muy alterado” covered sparse forest, pasture, african palm plantations, and cacao felds. The fnal corrected data set was converted to raster format

with a pixel size of 5m.
The fndings presented below are based on a comparison between the 2011 land-use survey of the Joya de Los Sachas canton and the product of supervised classifcation. In analyzing general land-use trends, I focus results on African palm, pasture, and forest because they are the most prominent land-use types throughout the study period. Some land-use classifcations have been omitted due to the inaccuracy that is inevitable when the total area is very small, such as silviculture, empty felds, and mosaic agriculture. While other trends like those in developed areas, cacao and
corn felds are relevant, they exceed the scope of this paper, and will only be discussed in the context of land use surrounding petroleum infrastructure mecheros. Land use was surveyed in a 1 kilometer radius of three mecheros described in the results, summing to a total area of 888.5 hectares.
Ethics
Before beginning feld work, I held a meeting with the community of Loma del Tigre and shared the general direction of the research. One of the driving motivations for this study was to create a map product that would be useful for the community of Loma

FIGURE 3 Examples of land-use class appearance from satellite imagery. (L-R: African Palm, corn, forest, pasture, developed area, cacao)
FIGURE 4 Presence of oil wells (yellow dots) in the study region, and established oil feld (brown area). There are 97 oil wells within the study region.
del Tigre. At this meeting, the room was opened up to feedback on topics of particular interest. In addition, I had individual conversations with community members throughout the research period to contextualize the fndings. This insight was integral in executing a study relevant to the local population. After data collection, fndings were presented to the community and printed maps were left as local resources. This article will also be translated into Spanish and sent to Loma del Tigre. Nothing was taken from sites during feld visits.
RESULTS
Petroleum Infrastructure
There is a high concentration of petroleum infrastructure in the study region. Oil wells are concentrated within the canton oil feld, particularly around Joya de Los Sachas (Figure 4). However, populated areas both within and outside of the oil feld are in close proximity to oil wells, oil pools,
and mecheros (Figure 5). Assuming a temporal lens, 10 of the study region’s 12 mecheros were established in the last 13 years (Figure 6).
Land-use
Land use changes across the entire region show increases in African palm plantations and pasture land, and decreases in deforestation. African palm plantations increased by 64%, from 14% in 2011 to 22% in 2024. Pasture land increased by 18%, from 29% in 2011 to 34% in 2024. Finally, forests decreased by 19%, from 31% in 2011 to 25% in 2024. I found that 48% of deforested land has been flled with pasture, and 27% has been flled with African palm plantations.
Land-use trends surrounding petroleum infrastructure differed from those across the entire region, as demonstrated in the relative land-use changes within a 1 km radius of three surveyed mecheros (Figure 7). None of the mecheros surveyed were present in 2011, so these results effectively

compare land-use before and after the presence of mecheros. Pasture was the most common land-use class in both 2011 and 2024 (Figure 8). Continuing to omit the mosaic agriculture and silviculture results, forest underwent the greatest reduction in areas around mecheros, with a 57% decrease from 2011 to 2024 (Figure 8). Notably, this is a more substantial reduction in forest (three times greater) than in the larger study region. Corn (2,008%) and developed areas (156%) had the largest increases in proportion of areas surrounding mecheros over the three year period (Figure 7).
DISCUSSION
Petroleum Infrastructure
This study identifed petroleum infrastructure throughout the study region, in the form of oil wells, mecheros, and oil pools. Here, I discuss the implications of petroleum infrastructure proximity to population centers – with particular focus on the indigenous community of Loma del Tigre.
Surrounding mecheros one typically fnds a circle of dead insects and wilted vegetation. These signs indicate their impact on nearby life, as mechero presence is correlated with decreased birth success rates (Cushing et al. 2020). In a study region with four population centers, local concentration of mecheros has serious implications for quality of life – both in terms of physical and mental health. A total of 12 mecheros were identifed within the study region, 10 of which were established after 2011 (Figure 6). This is a 400% increase in mecheros in the study region over the past 13 years. Though the petroleum industry has existed in the study region since the 1970s, this recent increase in mecheros is a rapid growth of the industry’s presence in this region and suggests health impacts will only continue to compound over time.
In addition, there are 97 oil wells within the study region and 187 uncontained abandoned oil pools. Oil pools can be equated with oil spills, as both are uncontained petroleum on the land. Oil spills have been
FIGURE 5 Points of contamination within 2.5km of Loma del Tigre. There are three mecheros (red dots), fve oil wells (yellow dots), and fve oil pools (green dots).

Cabrera et. al. 2023).
At a global scale, we must consider the two-fold impact of polluting industries. There are the impacts associated with a changing climate –such as sea level rise and intensifed weather patterns – all of which hit countries in the Global South with the highest severity. On top of that, local impacts at the extraction point of fossil fuels also impact countries in the Global South with greater intensity. Although the environmental impact regulations for petroleum extraction have become stricter in recent years, the industry continues to be synonymous with environmental degradation. Oil wells and mecheros are both integral parts of the oil extraction process –both of which have serious impacts on environmental and human health as detailed above.
Land-use
associated with poor soil health and higher rates of disease (Bezerra-Gastesi 2024, Johnston et. al. 2019), while oil felds and oil wells by association are associated with poor liver health (Johnston et. al. 2019). Across the board, oil spills and oil felds have long been understood to decrease water quality and aquatic habitat, at times even after remediation efforts (Cozzarelli et. al. 2017).
Communities located within oil felds face a high risk of exposure to environmental contaminants. For example, Loma del Tigre is located within a 2.5 km radius of 3 mecheros, 5 oil wells, and 5 oil pools (Figure 5). This exposure to petroleum infrastructure puts the community at high risk of contamination according to risk assessment metrics proposed by Facchinelli et. al. (2023), and the community feels the effects. The fsh found in nearby rivers are said to be full of parasites, and there is a history of
FIGURE 6 Presence of mecheros in the study region. 2 mecheros were established before 2011 (blue dots) and 10 were established after 2011 (red dots). A large majority of mecheros in the study region were established in the past 13 years. Mecheros are found in petroleum processing facilities, and as stand-alone features health problems in the region including cancer, lung issues, and skin lesions (Pellegrini et. al. 2020). To further compound the health risk assumed by inhabitants of Loma del Tigre, nearly all substantial nearby rivers are sourced in the urban area of Joya de Los Sachas. A high concentration of oil wells there further degrades the already poor urban water quality (Figure 4,
Of the nine categories of land-use change measured, increases in African palm plantations and decreases in forest cover were the most prevalent. African palm plantations have been correlated with diminished water quality and pesticide risks more so than other monocultures (Cabrera et. al. 2023). The two bodies of water that are

FIGURE 7 Percent change in land-use between 2011 and 2024 within the 1km radius of the three mecheros shown in Figure 8 (blue) and across the entire study region (orange). Positive values represent an increase in that land-use type and negative values represent a decrease. Land use change is more pronounced surrounding mecheros than in the entire study region

furthest from petroleum-related points of contamination run directly through extensive African palm plantations, meaning the region is likely lacking water sources free of contamination. African palm cultivation has also been linked to degraded soil (Mihai et. al. 2023), and a general decline in ecosystem services (Dislich et. al. 2016). Soil in abandoned African palm plantations that has been stripped of nutrients cannot serve local farmers, and costly pesticides and synthetic nutrients are required to cultivate any crop in these felds.
Deforested areas have largely been flled by pastures (48%), a historically common land-use trend in the Amazon (Hiraoka et. al. 1980). African palm plantations are also replacing forests (27%). The implications of African palm plantations replacing forests are different from the pasture-forest tradeoff. While previous studies have not identifed an increase in deforestation rates in recent years, they have shown an increase in forest fragmentation correlated to the expansion of African palm (López 2022). Given the negative environmental impacts of African palm plantations, the ramifcations of their extension are much more profound than that of pasture-related deforestation.

Proportional land-use changes for some cover types were signifcantly higher in the secondary study area adjacent to mecheros compared to the entire study region. For example, decreases in forest cover were almost three times higher within the secondary study region, and increases in developed areas and corn cover were three and twenty times higher,
respectively. Mecheros have been found to have negative effects on soil quality (Lo Presti 2023). Given mecheros’ negative effects on soil quality, there is reason to expect a decrease in forest around mecheros. Still, crops commonly dependent on the use of agrochemicals such as corn grew in prevalence (Cabrera et. al. 2023). This may suggest that

PHOTO A mechero burns in the middle of a patch of forest near Loma del Tigre. Photo by Camille Terracina
FIGURE 8 (A) 2011 and (B) 2024 land-use in a 1km radius of the three mecheros (black dots) closest to Loma del Tigre, shown in Figure 5
contaminated soil from mechero exposure can only support agriculture if agrochemicals are involved. Contamination from mecheros – along with other contaminating infrastructure (Bezerra-Gastesi 2024) – could be a driver of change in land-use towards monocultures and pesticide use. Furthermore, deforestation appears to correlate with proximity to petroleum infrastructure. While petroleumrelated development is not a driver of deforestation on the same scale as African palm, the introduction of mecheros occurs in tandem with forestreplacing development.
Amazonian forests provide many ecosystem services – including fresh water for drinking and bathing, supporting traditional food sources, and serving as habitat for endangered species. Reductions of forests equates to reductions in ecosystem services, `impacting the local indigenous population who are reliant on forests for traditional forms of living. At a global scale, the Amazon rainforest serves as a massive global carbon sink and its preservation is critical to curbing climate change (Brienen et.
“ ” To curb climate change and protect ecosystem services for future generations, it is imperative that we collectively take action in support of indigenous communities’ safety, wellness, and sovereignty on their ancestral lands.

al. 2015). Locally, forests managed by indigenous groups are typically superior in condition to forests that are not (United Nations 2022). Thus, preservation of indigenous-managed forests is a crucial part of climate action. In this study, deforestation occurred on ancestral Kichwa land where colonization is prevalent through industrial farming and petroleum development. Colonization dilutes Kichwa sovereignty and thus hinders the ability of the Kichwa people to manage the forests as they see ft.
CONCLUSION
These fndings should be employed to advocate for the expansion of conservation programs such as Socio Bosque that attach an economic incentive to forest protection. In addition, results will beneft the Apaguen Los Mecheros movement, which is working to ban mecheros from close proximity to populated areas. The maps from this study will also aid the community of Loma del Tigre by allowing residents to pinpoint sources of contamination in their surroundings. To curb climate change and protect ecosystem services for future generations, it is imperative that we collectively take action in support of indigenous communities’ safety, wellness, and sovereignty on their ancestral lands.
ACKNOWLEDGEMENTS
I would like to express my deep gratitude to all that assisted in the realization of this study. This includes but is not limited to Hector Vargas, Xavier Silva, Ana Maria Ortega, and Diana Serrano, my advisor Carolina Freire, and the community of Loma del Tigre.
PHOTO Petroleum secreting from the soil into a waterway; the result of an uncontained oil pool. Photo by Camille Terracina
research communications communications


PHOTO APRIL MORROW
A Hot Year for Oceans Analyzing 2023 Temperature Trends with Argo Data
By Coco Lipe, Atmospheric Science
In 2023, global ocean temperatures reached a historic milestone, surpassing pre-industrial levels by 1°C for the frst time. This unprecedented warming is a critical indicator of the ongoing climate crisis: higher ocean temperatures fuel severe weather events, such as hurricanes and tropical storms, contribute to increased ocean stratifcation, and drive rising sea levels. These changes also disrupt marine ecosystems and infuence biogeochemical cycles in the ocean. This past summer, I had the opportunity to investigate these extreme temperatures as an intern at NOAA’s Pacifc Marine Environmental Laboratory. Working with my mentor Greg Johnson, we analyzed global and regional ocean temperature felds from 2023, comparing them to temperature data from the past 30 years to identify key features and potential drivers of the exceptional temperature anomalies observed this year.
The Argo program, a decades-long international collaboration, has fundamentally transformed our understanding of the ocean’s temperature structure. Argo foats are autonomous instruments that drift through the ocean, measuring temperature, salinity, and pressure at different depths. They descend to about 2,000 meters, collect data as they rise to the surface, then transmit their observations via satellite before sinking again for another cycle. The global Argo network — consisting of thousands of foats — provides continuous, high-resolution data on
Unprecedented warming is a critical indicator of the ongoing climate crisis: higher ocean temperatures fuel severe weather events, such as hurricanes and tropical storms, contribute to increased ocean stratifcation, and drive rising sea levels.
‘26
ocean conditions (Scripps Institute of Oceanography). These foats are a crucial part of modern oceanographic research, as they improve our understanding of climate change, ocean circulation, and heat content.
In this project, we utilized Random Forest Regression Ocean Maps (RFROM) developed by Johnson and Lyman (2023), which are produced using machine learning techniques. By training a random forest model on known data points, it can predict temperatures in unsampled regions, improving the accuracy of global ocean heat content estimates. These maps integrate satellite data with Argo observations to create high-resolution, monthly temperature felds at a 1° × 1° grid scale, producing a profle to depths of 2000 meters. This technique allows us to represent mesoscale features such as eddies and fronts which are crucial for understanding oceanic variability at smaller spatial scales.
To assess the ocean temperature trends, we developed a model based on 30 years of temperature data (1993–2022). The model included a baseline mean temperature (calculated for 2008, the midpoint of the dataset), a linear trend to capture the effects of global temperature change, and a seasonal cycle represented by sine and cosine functions (with frequencies corresponding to 1–6 cycles per year). These components allow us to isolate year-to-year variations not explained by broader long-term trends or seasonal patterns.
We examined the global average of residual temperatures, comparing it across the 31-year period, in order to understand the ocean’s temperature structure over the past few decades. Including in the linear trend clearly shows the upward trajectory in global ocean temperatures, particularly over the last decade; excluding the trend reveals more nuanced temperature changes, allowing us to observe the distinctive temperature patterns linked to specifc climatic events such as El Niño and La Niña. This methodology helped isolate each year’s unique temperature feld characteristics, offering insights into specifc events, such as El Niño, La Niña, and marine heatwaves.
Further exploring 2023’s temperature anomalies, we focused on three years with signifcant El Niño events: 1997, 2015, and 2023. Comparing surface and 200-meterdepth temperatures across these years highlighted both shared features and differences in 2023. Notably, both 2015 and 2023 experienced surface marine heatwaves, but with

Globally averaged residual temperature felds from the surface to 500 m over the last 31 years (1993–2023). Upper plot shows temperature anomalies with the trend included, highlighting overall warming. Lower plot shows anomalies without the linear trend, with strong El Niño and La Niña signals visible. Strong El Niño years (1997, 2015, 2023) indicated in boxes.
varying spatial patterns (Figure 1). In 2015, heating was concentrated in the North Pacifc, whereas 2023 saw stronger heating in the North Atlantic (Figure 2).
This heating in the North Atlantic was the most striking anomaly between other years and 2023 (Flanders Marine Institute 2021). The surface waters in this region were signifcantly warmer than in previous years, with temperatures 0.3°C above the global ocean average. This warming cannot be fully explained by the linear trend, which suggests an acceleration of warming in the Atlantic, a separate marine heatwave event, or a combination of the two factors.

FIGURE 2 Residual 2.5 dbar ocean temperatures in 2015 and 2023 (Pawlowicz 2020). Upper maps are residual temperatures with the trend included in respective years, and lower maps are residual temperature felds without the linear warming trend. Strong surface warming is visible in the North Pacifc in 2015 and the North Atlantic in 2023.
FIGURE 1
We extended our analysis by comparing temperature profles between the global ocean and the North Atlantic, specifcally focusing on the region between 5° and 20°N. The temperature gradient between surface and 300-meter depths was similar in both the global ocean and the North Atlantic, showing a 12°C difference. Within the 5°-20°N region, the temperature difference was more pronounced at 15°C.
Stratifcation differences between the global ocean and the North Atlantic were even more dramatic when we analyzed the rate of temperature change with respect to pressure (dP/dT) (Figure 3). In all three regions, the rate of temperature change peaked at depths of 50–60 meters. However, when we compared the residual temperature feld for 2023 with the mean temperature feld, we observed a notable increase in stratifcation. The global ocean saw a 4.9% increase in the rate of temperature change, while the North Atlantic saw a 7.7% increase.
Our analysis of global ocean temperatures in 2023 highlights several key factors that contributed to recordbreaking warmth: the ongoing linear warming trend, the development of a strong El Niño event, and unprecedented marine heatwaves. Notably, we observed an acceleration of surface warming in 2023 and increased ocean stratifcation, with the most pronounced changes occurring in the tropical North Atlantic. These shifts in stratifcation have important implications for ocean dynamics and atmospheric
“Enhanced stratifcation has been linked to the rapid intensifcation of hurricanes, reducing the time available for warning and preparation before landfall.
“interactions, potentially increasing the frequency and intensity of severe weather events. Enhanced stratifcation has been linked to the rapid intensifcation of hurricanes,

reducing the time available for warning and preparation before landfall. While future research will further explore the impact of these changes on extreme weather events, this study provides a valuable foundation for understanding the complex interactions within Earth’s climate system in the face of rapid warming.
FIGURE 3 Mean (blue), mean plus residual with trend (orange dashed), and mean with trend (yellow dashed) stratifcation shown as the rate of temperature change with respect to pressure (dP/dT) by depth (m) in the global ocean (left) compared to the North Atlantic (right).
Holistic Management of Salmon and Forest Ecosystems Amidst Increasing Wildfres
By Nina Pursai
Environmental Studies ‘25
As environmental disturbances persist, Pacifc salmon in Washington State such as coho (Oncorhynchus kisutch), chum (Oncorhynchus keta), and Chinook (Oncorhynchus tshawytscha) are under threat. Over the last 40 years, anthropogenic forces such as commercial fshing, dam creation, biodiversity loss, and warming stream temperatures have led to a signifcant decline in salmon abundance relative to their historical population size, from about 1,200,000 to 473,000 (Crozier et al. 2021). Salmon are generally disturbance-dependent species and have adapted to many environmental changes over time; however, they cannot keep up with the current disturbances driven by climate change. In tandem, wildfres in Washington are becoming more intense, severe, and frequent due to warmer and drier fre seasons. Shorter snowpack seasons, hotter global temperatures, and fuel buildup create more opportunities for fres to occur (Prichard et al. 2021).
Extensive research has been conducted on the biophysical effects of wildfres on stream ecosystems and salmon, but not on the social linkages between forest and salmon managers (Lamborn and Smith 2023). To explore these linkages, I conducted research as part of an internship with the Nature Conservancy and UW EarthLab and asked (1) How can a social-ecological systems approach be used to determine the cultural, ecological, and economic impacts of

PHOTO Adult sockeye salmon (Oncorhynchus nerka). Photo from University of Washington.

FIGURE 1 A section of the full systems map showing the effects of wildfres on different governance systems in Washington, as well as how these systems interact with each other. This section represents areas of expertise needing more holistic communication and management between forest and salmon resource managers. Wildfres (orange box) are the disturbance to the system, the other boxes are governance systems (pink), and arrows indicate positive (blue) and negative (orange) relationships.
wildfres on salmon populations in Washington State? and (2) How can rights-holders in forest and salmon management collaborate to effectively manage these systems in response to wildfres?
To break down the complex interactions of the effects of wildfres on salmon in Washington, I created a systems map using a social-ecological systems (SES) framework. This framework determines how disturbances alter ecosystem stability by incorporating how humans are also affected by these disturbances (Ostrom 2009, Lamborn and Smith 2023).
Using an SES framework to create a systems map is especially helpful in this context because it breaks down the interactions between humans, forests, and salmon to answer complex questions. These answers, in turn, can inform collaborative forest and salmon management. I used Mental Modeler Mapping — a systems mapping software — to portray the direct and indirect effects of wildfres on forest and stream ecosystems, people who harvest salmon, and governance systems.
Many governance systems direct forest and salmon management, such as federal, state, local, and Tribal governments, and these entities also infuence one another (Figure 1). In addition, I conducted interviews with eight different forestry and salmon management experts. Experts were questioned about the social-ecological effects of wildfres on salmon populations and their relative valuation of social science research on collaboration between forest
managers, salmon managers, and traditional Indigenous restoration practices
Wildfre has many negative effects on people, and one might assume fre would also have negative impacts on stream ecosystems and salmon. However, after creating the systems map and interviewing experts, my own perception of fre became more positive than negative.
Ellen Wohl, professor of geomorphology at Colorado State University, described how large wood falls into streams postfre, creating cool water refugia for salmon to recover in. Furthermore, post-fre sedimentation creates shelter for salmon
eggs by introducing clean gravel in between cobbles and boulders in streams (Wohl 2024).
Education about the positive effects of wildfre on salmon and stream ecosystems is helpful in changing public perception of fre’s ecological benefts. Brian Harvey, a UW professor of forestry, says, “It’s really hard to get away from the fact that some use of fre suppression is always going to have to be there from a human safety standpoint. But knowing when to create the fexibility for fres to do the ecological work within the bounds of historic fre takes fexibility to not put the fre out and let it play its role” (Harvey 2024).
The experts I interviewed all agreed that while there is research being done on the effects of wildfres on salmon, the way it is communicated and brought to communities needs to be accessible and easy to understand. Monique Wynecoop, a fre ecologist with the US Forest Service and Northwest Bureau of Indian Affairs, explained “We may be subject matter experts, but we can’t do our job well unless we’re involving the local community. No matter how many models we make, it’s not going to be worth anything unless we’re talking to the people on the ground” (Wynecoop 2024). By encouraging dialogue between different rights holders involved in forest and salmon management — through councils, working groups, forums, and other conversations — managers can devise approaches that incorporate the community voices and perspectives.
Although it is essential to ensure that prescribed and cultural burns are contained, their promotion should be a priority for forest managers because of the cultural, educational, and ecological benefts they provide (Wynecoop et al. 2019). Indigenous burns were suppressed for over 100 years because colonists thought they were dangerous to human health. Currently, there are only a few examples of cultural burns by the US Forest Service in Washington. If cultural burns are incorporated into Forest Service management approaches at a federal scale, there could be the potential for less uncharacteristic wildfres overall, which will in turn beneft salmon populations. Wynecoop says, “It’s not a matter of if a fre will occur, it’s when” (Wynecoop 2024). Controlling fre conditions is essential in mitigating intense, severe, and frequent wildfres that are worsening under climate change. “In the future, I’d love to see cultural burns taking place on the Forest Service side but it really takes letting go of the reins and letting the Tribes take the lead” (Wynecoop 2024). Wildfre benefts salmon by adding in-stream wood and clean gravel for spawning, and can potentially be used as a tool to manage and restore salmon
watersheds (Figure 2). Instead of focusing solely on fuel reduction, fre practitioners should also center Indigenousled burning – a holistic approach to fre management. Salmon are a central part of life to the Coast Salish Tribes of Washington, and their populations should be restored for their own sake and the sake of the Indigenous Peoples who value salmon for cultural, spiritual, and nutritional purposes. Elaine Harvey, a watershed manager for the Columbia River Inter-Tribal Fish Commission, says “Salmon have sustained our people for thousands of years. Without the salmon and the wildlife plant species, frst foods, and medicines, our people wouldn’t have lived to today” (Harvey 2024). There is a need for more research centering holistic management approaches to effectively inform decisions that bridge gaps between forest and salmon management. By educating others on the benefts of wildfre, opening dialogue between forest and salmon managers through councils and funding, and reintroducing cultural burns on a landscape scale, managers can control the intensity, frequency, and severity of fres, which will in turn beneft watersheds, salmon, and people.

FIGURE 2 Benefts of large wood in stream ecosystems (Sloniker 2022). Image from The Nature Conservancy.
Bark and Ambrosia Beetle Dynamics
A New Lens for Forest Management Practices
By Abigail Rocke
Environmental Studies ‘25
Bark and ambrosia beetles are often viewed as pests, but they are a key part of healthy forests. These tiny woodboring insects contribute to forest dynamics such as decomposition and habitat formation for various wildlife species. Both beetles exhibit intricate relationships with
these beetles and forest management strategies, particularly through the lens of girdling — an intentional tree-stressing technique used to enhance habitat diversity. By analyzing beetle presence across girdled trees of different tree species, size, and health status, this research discusses how forest management services can employ beetle ecology to create more resilient, biodiverse landscapes.
While you might have never heard of a bark or ambrosia beetle, you have undoubtedly seen their handiwork. These beetles are incredible carpenters, boring intricate channels in wood and causing widespread scarring ranging from driftwood on the beach to household furniture. Ambrosia beetles eat fungi, extracting nutrients from the wood, whereas bark beetles consume the wood itself, making them notorious in the lumber industry for their costly infestations.
made removing deadwood, their main food source, from the forests a common practice.
Bark or ambrosia beetles target stressed and dying trees,when the host’s defenses are low. Though beetle presence is often negatively associated with tree health, (snags) are important resources for many species of wildlife
because they provide foraging, roosting, perching, denning, and nesting habitat. Ongoing research suggests that beetles play a big role in this regard. Beetles sustain a healthy forest
patches of different “ages, densities, species compositions, and stages of succession” (Progar et al. 2009).
This study aimed to explore the prevalence of bark
trees. Research was done in collaboration with the Great Peninsula Conservancy (GPC) — an organization whose mission is to improve wildlife shelter, habitat, and structural diversity for wildlife species in forested landscapes. From 2021 to 2024, GPC girdled 800 trees on 8 preserves, aiming to improve wildlife habitat in the form of standing and downed dead wood. Girdling is a treatment that intentionally stresses a tree by making two parallel cuts in the trunk of a tree, using an ax or chainsaw to peel the bark. We asked (1) What is the relationship between bark and ambrosia beetles and dead and stressed trees? and (2) Can bark and ambrosia beetle ecology support forest management practices?
occurrence of ambrosia and bark beetles. This was determined by assessing the base of each tree for exit
boring action of beetles — and pitch clumps — a sticky, protective substance which is released by trees when attacked by beetles. If these signs were observed, a chisel and mallet were used to scrape a small portion of the bark from the tree to survey for their galleries (Figure 1). Beetle presence was marked positive if one or more of these signs
portion of the beetle samples were preserved in ethanol to and bark beetle gallery presence. Multiple beetle species
biodiversity within the ecosystem (Figure 2).

FIGURE 1 A bark beetle larva chews through wood, leaving dark frass throughout the gallery. Photo by Abigail Rocke.

Our results showed that the likelihood of beetle presence increased with time since girdle wound and tree health generally declined with beetle presence, as the proportion of dead trees increased with increasing beetle prevalence (Figure 3). We then ran a binomial generalized linear model of beetle presence as a function of years since girdle,
whether tree species were conifer or deciduous. We found that years since girdle (z = –1.75, p z = –1.85, p predictors of beetle presence. In other words, larger, older trees are more likely to have evidence of beetles.
are more likely to attract beetles. Red alders, which have
a relationship with the red alder bark beetle, are also more susceptible. Red alders make up a large portion of Great Peninsula forests and tend to have more specialized bark qualities (Lee et al. 2023). Regardless, specialized beetles are not likely to attack live trees that have strong defenses against herbivory (Ambrosia Beetles 2011). Western redcedars had a smaller sample size than other tree species,
Correlations between beetle presence, tree species, and tree size offer insight into augmenting girdling practices.
may aid management goals, as these species are more susceptible to beetles. Restoration management should also consider the climax — or most established and stable — species of these forests, which at many sites, hemlocks and other species are less common.

than other tree species may help balance the ecosystem and increase tree biodiversity. Additionally, tree size is important for creating bird habitat. Cavity-nesting birds have preferences in tree size, “sapwood and heartwood decay, and wood hardness”
attract pileated woodpeckers, which excavate holes in trees to feed. Woodpeckers can more easily excavate cavities in trees with thinner bark and a greater proportion of sapwood 2001). Many birds require larger
FIGURE 2 (A–C) Collected bark and ambrosia beetles photographed with a microscope (not to scale). Each beetle is a different species, and some frass and fungus are visible on specimen B. Photos by Abigail Rocke.
FIGURE 3 Beetle presence (black circles) and tree die-off (brown squares) as percentage of sampled trees by years since girdle.

trees, so girdling in plots with young, thin trees may not provide the best habitat. Beetles’ preference for larger trees ultimately supports better bird habitat. Managers should also consider exploring a mosaic of different girdle techniques in forest systems. For example, a combination of fungal inoculation, girdling, and tree-topping beetles’ attraction to fungi could support forest management through prescription of girdles to bigger, older trees with the goal of attracting the insects. Furthermore, softwood species fungi in snag creation demonstrates that bark and ambrosia 2009).
Girdling trees in clumps can promote successful snag creation and enhance forest mosaics. GPC did not girdle many trees close together as was prescribed, in part to
mimicking natural disturbances helps create heterogeneous landscapes. This can be achieved by girdling trees in clumps. Bark and ambrosia beetles do not travel far to reproduce and thus facilitate patchy landscapes and structural diversity endemic behaviors, they remove older, weaker, and dominant trees, letting light into the understory vegetation (Progar et al. 2009). The spectrum of tree conditions in our results may signify a healthy forest that is resilient to stressors and biodiverse enough to break down stressed and dead trees.
This work assessed bark and ambrosia beetles because they create dead and decaying wood, are prevalent in abundant and susceptible tree species, seek out fungal decay, and generally occur in patchwork patterns across the landscape. on overall forest health than minute variations in girdle dynamics in established forest systems could save forest managers time, money, and resources through facilitation of a net negative factor in forest management.
“
The spectrum of tree conditions in our results may signif a healthy forest that is resilient to stressors and biodiverse enough to break down stressed and dead trees.
“
FIGURE 4 Percentage of surveyed tree species by health status: alive (blue), stressed (peach), or dead (brown). Numbers above each bar are the number of trees sampled for each species.
By Sophia von der Ohe, Marine Biology and Environmental Science ‘27
In the still, pristine waters of high mountain ponds, a subtle light show unfolds as aquatic salamanders begin to glow in the fading light of the day. Patterns on their skin reveal a to other salamanders. This luminescent display cannot be easily detected by the human eye, and its purpose remains largely unexplored. Could this phenomenon be more than just a visual marvel? Might it serve as a secret signal in the intricate dance of salamander courtship, or is it simply an evolutionary quirk? This summer, I attempted to unravel these mysteries at the Mexican Cut in Colorado, delving into these striking amphibians.
“ Glow and Behold Investigating Biofluorescence and Attraction in Arizona Tiger Salamanders
absorb light and re-emit it at longer, lower-energy but has only recently been discovered in a growing range
prompting questions about its ecological and evolutionary

PHOTO light. Photos by Mexican Cut Crew 2023.

Salamanders (Ambystoma mavortium nebulosum), a species known for its distinctive patterns and behaviors. I was particularly interested in whether the re-emission of blue mate choice. By studying this phenomenon, I aimed to might play, from communication and predator avoidance, to navigation and mate choice.
To investigate, I conducted a series of controlled experiments to test salamander responses to different
ponds at the Mexican Cut near Crested Butte, Colorado. A total of 130 adult salamanders (65 males and 65 females) participated as “chooser” individuals, meaning they were placed in experimental setups and given the opportunity to select between different stimuli. Age determination between adults and larvae was based on external morphology,
genitalia. Adults were selected based on presence of visibly swollen genitalia, which indicated that they were actively breeding.
In the glow stick choice experiments, salamanders were placed in a three-chamber tank with one trap containing a green glow stick and the other containing either a blue, red, or no glow stick (Figure 1). An equal number of trials were conducted on males and females for each experimental
0.05. The “no choice” option was excluded from analysis when all salamanders made a choice, and in single-treatment experiments, individuals that did not choose were grouped with those selecting the no-treatment side.
I found that both male and female salamanders were equally attracted to blue and green light, but showed little to no interest in red light. Interestingly, females demonstrated
Each experiment lasted for a maximum of 10 minutes, during which salamanders could explore the tank and make a choice. A total of 10 trials were conducted per sex for both the blue vs. green and red vs. green glow stick comparisons, while 5 trials per sex were conducted for the green vs. no experiment, 20 trials were conducted per sex. Salamanders were tested individually in each trial to prevent social
is not a decisive factor in mate choice for this species.
““While both male and female salamanders demonstrated attraction to both green and blue light, females avoided
selection in this species. Instead, the results suggest that despite visual cues like light playing an important role in factor in mate choice. Regardless, this general attraction to blue and green light raises important questions about how
information in their ecological interactions.
salamander sensory ecology. Salamanders are sensitive to blue and green light wavelengths, which are most prominent in their low-light habitats during dusk and dawn. This
serve other ecological functions such as communication between individuals, navigation in complex environments, or predator avoidance by confusing or deterring potential threats. Although this study unveiled many new discoveries, females indicated that much is still to be learned about this species. Future research questions could explore the
As amphibians face increasing threats from habitat loss, pollution, and climate change, understanding their subtle behavioral and ecological dynamics becomes essential for conservation. Amphibians are key bioindicators,
““sensitive to environmental changes due to their permeable skin and complex life cycles. Studying phenomena like population health and understanding ecological interactions. Glow sticks, for instance, offer a promising non-invasive

method for tracking declining amphibian populations. By and blue light, researchers can monitor populations and behaviors without causing stress or disruption.
Tiger Salamanders are strongly attracted to blue and by females raises further questions about the evolutionary purpose of this trait, highlighting the need for continued research. As we work to understand these subtle yet complex conservation techniques — helping to protect amphibians in a rapidly changing world.

PHOTO
Urban Agriculture as a Method for Reducing Food Insecurity in Seattle’s Food Deserts
By Zoe Warren, Environmental
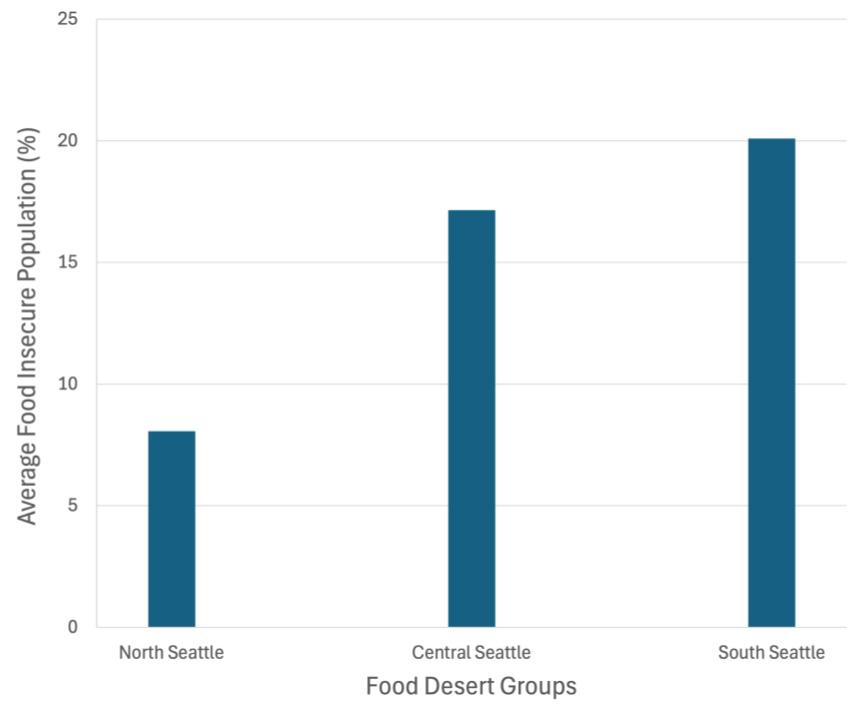
Access to nutritious food is critical for survival. However, a substantial portion of the global population, including over 20% of adults in Seattle and 20% of University of Washington students, face food insecurity (Economist Impact 2022, Drewnowski et al. 2021, Kromer 2024).
food insecurity as “limited or uncertain availability of nutritionally adequate and safe foods, or limited or uncertain ability to acquire acceptable foods in socially acceptable ways” (Rabbitt et al. 2022). Food insecurity can be exacerbated by food deserts, which are census tracts
income (>30%) and located approximately half a mile or more from a grocery store in urban areas, or 10–20 miles in rural areas (Rhone 2022). According to the USDA’s Food
zones in Figure 3) and food insecurity in these areas ranges from 6–27% (Seattle Race and Social Justice Initiative).
Simply building a grocery store
food insecurity for two main reasons:
systemic discrimination. First, creating new grocery stores does not guarantee affordability to nearby residents and (Sevilla 2021). Second, redlining — a process designed to disenfranchise minority groups by limiting access
income areas that offer better food access, green spaces, clean air, and contributed to the creation of food deserts (Redlining and Food Justice in America 2020). This has caused
Eight of Seattle’s 18 food deserts have are primarily located in the central and
Studies ‘25
southern regions of the city (Figure 1). These same areas experience the highest rates of food insecurity (Figure 2). Although now illegal, the effects of redlining continue to endure, restricting access to stable housing and essential resources (Lathan 2023).
Urban agriculture has the potential to provide social
Given longstanding systemic challenges to remedying food insecurity by solely developing grocery stores, this study explored urban agriculture as a method to reduce food insecurity in Seattle’s food deserts.
To determine if urban agriculture could feasibly address food insecurity within Seattle’s 18 food deserts, this study looked for open spaces that could support urban agriculture. The Seattle Outside Citywide Public Space Explorer plots

FIGURE 1 Racial makeup of Seattle food deserts (map in Figure 3A) split into three groups geographically. North
Urban agriculture has the potential to socialprovide and environmental the local population while aiding a ofportionSeattle’s food-insecure population.
“
over 10,000 acres of public open space in Seattle (green zones in Figure 3A). After excluding cemeteries, walking and biking trails, established community gardens, Indigenous land, and golf courses from the calculations, only 892 acres of available space within food deserts remained (blue zones in Figure 3B–C).
Methods used by Ackerman et al. (2013) in a study conducted for New York City were replicated to calculate the space needed to grow fruits and vegetables for Seattle’s 103,000 residents in food deserts
Management). Ackerman’s method involves averaging the yields of commonly eaten fruits and vegetables from two different growing methods and dividing them by estimates of pounds of fruits and vegetables retailers would need to sell to feed the given population. Combining growing techniques revealed that food deserts could meet 75% of their residents’ fruit and vegetable needs with just 630 acres of land. The missing 25% comes from citrus fruits, dry beans, and peas which cannot be reasonably
I combined information about average fruit and vegetable consumption in the US with Seattle’s food desert populations and potential production per acre, as derived from my earlier calculations. Results indicate 887 acres of land would be needed to supply 75% of the fruit and vegetable demand in Seattle’s food deserts. With both sets of yield calculations in mind, Seattle would need to convert between 630 and 887 acres of public open space to urban agriculture to alleviate food insecurity in food deserts. Conveniently, 892 acres of open space within Seattle’s food deserts could be used for urban agriculture.
exist to implementing the changes necessary to reduce food insecurity in Seattle. Food insecurity is measured in a variety of ways, and most research related to urban agriculture’s effect on food insecurity is theoretical, so implementation would have to occur before an exact impact could be determined (Siegner et al. 2018). Additionally, project success would likely depend on whether food desert residents are willing to participate in the growing process and if Seattle zoning laws would allow such initiatives (Santo et al. 2016).
outweigh the costs. Urban farms could reduce grocery bills for food desert residents. With urban agriculture meeting 75% of their fruit and vegetable needs, residents could spend 15% less on produce each month, potentially saving families hundreds annually (Bishop 2024). Additionally, urban agriculture fosters community building and environmental
education (Ackerman et al. 2014). Community gardens strengthen social bonds, create diverse networks, and help immigrants integrate (Santo et al. 2016). Incorporating nearly 900 acres of new community gardens into the city’s infrastructure would fundamentally change how Seattle residents connect to their communities and provide opportunities for social development.
pollution, mitigating Seattle’s urban heat island effect, and lowering food transportation emissions. Expanding green of pollutants annually (Yang et al. 2008), and alleviate summer heat in vulnerable areas (Calhoun et al. 2024). Additionally, local food production could cut transportation carbon emissions by up to 831,000 kilograms annually (Lee et al. 2015). While addressing food insecurity is a complex challenge, implementing results from this study could help transform Seattle’s food systems and urban landscape.
quarters of residents’ fruit and vegetable needs through urban agriculture. These urban farms could improve residents’ health, support community initiatives, lower grocery bills, increase access to fresh food, and reduce racial and economic barriers. However, urban agriculture
ASeattle’s food deserts have enough space to meet threequarters of residents’ fruit and vegetable needs through urban agriculture.“
is not a standalone solution. Food insecurity intersects with other socioeconomic and systemic issues that urban agriculture cannot fully address. The overall reduction of food insecurity among Seattle residents and nationwide will require multiple fundamental adjustments to how our food systems are structured and managed, as well as recognizing systemic racism and taking action against it.

communityfeatures

The Last Frontier
Adventure-Based Citizen Science in Alpine Research
By Kate Allhusen, Marine Biology ‘26, Lauren Grady, Marine Biology ‘25 & Phoebe Berghout, Environmental Science, Aquatic & Fishery Sciences ‘26
As scientists seek to help address the critical environmental challenges facing society, they have increasingly turned to citizen science. Citizen science involves the recruitment of the general public to gather data for environmental science research (Vasiliades et al. 2021). Adventure-based citizen science (ABCS) programs – which employ outdoor
smartphones, opportunities for the public to engage in citizen science programs have skyrocketed (Pew Research Center 2024). Research projects now operate at a much broader scale of data collection, often recruiting generational participation. Working with communities is also critical for eliciting engagement in conservation efforts. Studies show that citizen science can elicit physiological and psychological
positive emotions, strengthening connection to community and place, and enhancing attention to detail (Day 2022).
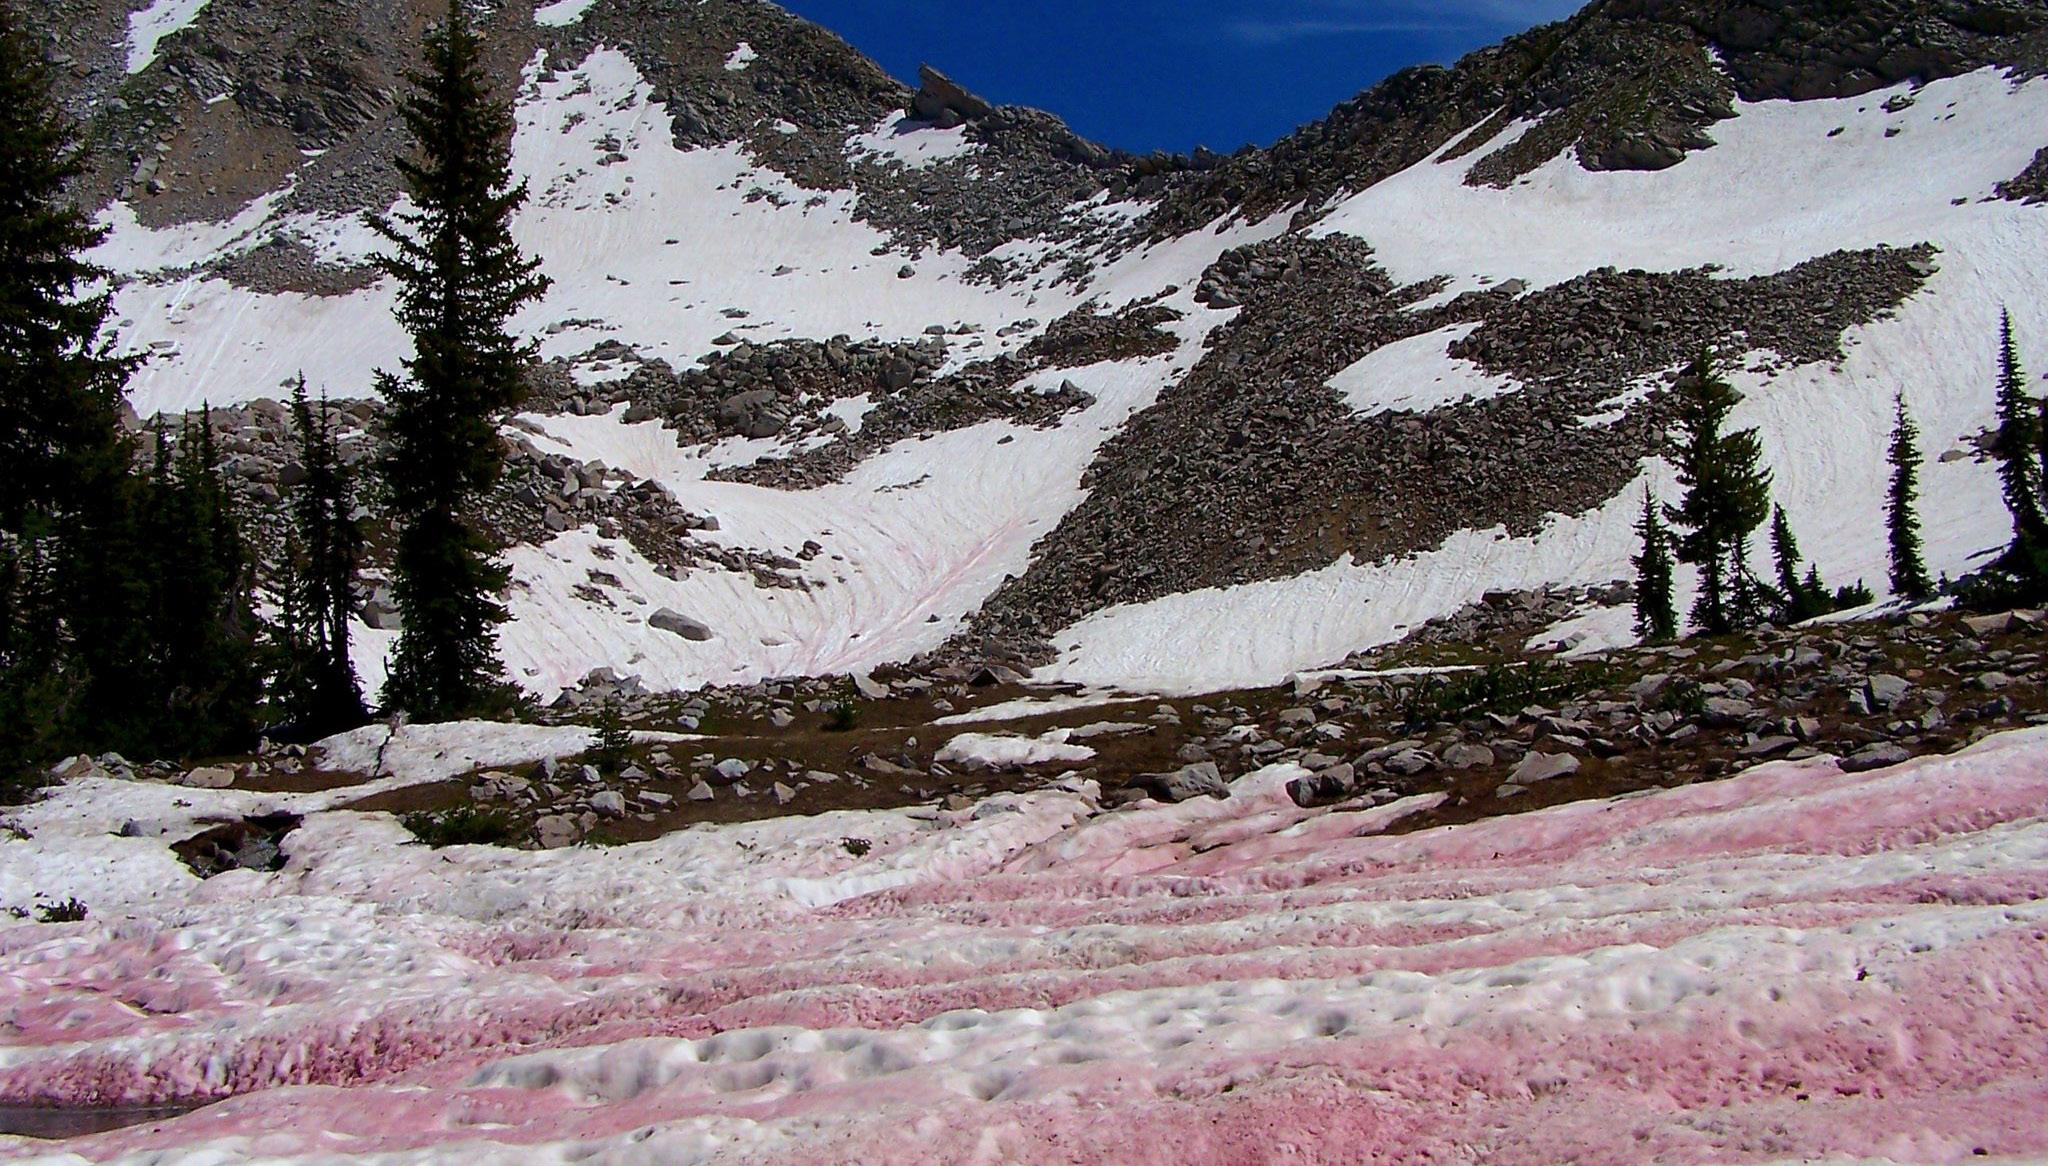
Dr. Robin Kodner at Western Washington University was climbing Washington’s Glacier Peak a few years ago when she encountered bright red puddles in the snow. Awestruck by a massive snow algae bloom, Kodner’s curiosity led her to begin piecing together the taxonomy of these microalgae found in high alpine environments growing on snow. The Living Snow Project, a citizen science effort designed by Kodner, enables mountain recreators to understand the environments they love by enabling
mountaineering trips, alpine climbing approaches, or spring backcountry skiing adventures. When they come across snow algae, they collect a sample, snap a photograph, and record the location’s coordinates. Unlike other citizen science projects, it was “designed to work around people’s activities,” Kodner remarked. “It is meant to be brought along with you wherever you go.”
Snow algae collections from volunteers are incredibly valuable. The algae grow in remote backcountry locations with technical terrain and varying weather conditions, so
PHOTO Citizen scientists hike to their survey site in Glacier National Park. Image from National Park Service. recreationists to collect data in and monitor hard to reach ecosystems –are less common than citizen science broadly but are growing in popularity. Examples of ABCS activities include mountaineering, ice climbing, SCUBA diving, and backcountry hiking. ABCS programs create an immersive experience in which participants engage in their favorite outdoor activities while simultaneously contributing to datasets for places once thought inaccessible.
The idea of engaging communities in science is nothing new. With improved access to the internet and over 91 percent of Americans now owning

season. However, since the project’s commencement in 2017, Kodner and her lab have received roughly 1,000 samples from the Cascades and other mountain ranges. Support to bolster participant recruitment for the program comes from the Northwest Avalanche Center and Patagonia and has allowed the project to reach many outdoor recreationists. These collections have contributed to valuable research by the Kodner Lab, yielding valuable information on the temporal and spatial variability of algae across an entire mountain range, within a region, or on a single peak. They also explore snow algae taxonomy, describing new species and identifying previously undetected ice algae in the Cascades. Alpine environments are some of the most rapidly changing ecosystems on our planet and the opportunity to understand the biodiversity of these communities is critical.
Many outdoor enthusiasts are witnessing the decline
personal contributions to habitat degradation alongside inspiration for stewardship. To bridge this gap, Adventure Scientists connects conservation scientists with recreationists capable of accessing remote regions (Adventure Scientists). The organization recruits, trains, and manages volunteers to collect data for climate and conservation projects. It also works globally to collect data on understudied regions. For example, on a trip on Mount Everest, mountaineering guide Willie Benegas collected moss samples to send back to a lab in the United States. There, environmental microbiologist Tim McDermott analyzed the samples to
understand how fungi work symbiotically with plants to survive in extreme conditions. This research revealed fungi can withstand frost exposure and high ultraviolet radiation. Furthermore, McDermott and other scientists showed fungal spores can amplify crop tolerance to extreme weather in
“Alpine environments are some of the most rapidly changing ecosystems on our planet and the opportunity to understand the biodiversity of these communities is critical.
PHOTO
the face of climate change (Farrell 2024). Collaborating with recreationists who are equipped with the knowledge, gear, and skills to access such remote settings is vital for developing innovative approaches to adapt to global change.
An outdoor enthusiast himself, Dr. Scott Hotaling of Utah State University has studied glacier recession in remote settings for more than a decade. His project Mountain Futures investigates how glacier recession impacts biodiversity and water resources, and how climate change is impacting mountain ecosystems. To understand alpine landscapes, Hotaling and his team travel long distances over rough terrain by various modes – including miles of hiking, snowshoeing, ski touring, canoeing, and mountaineering. When putting together a team, Hotaling looks for people with enthusiasm and experience in the mountains. Most of the time, these are skiers, climbers, and mountain-oriented people who want to do science in the places they recreate. Outside of his research, Hotaling prioritizes working with community partners and the public to increase awareness about our changing climate. Unlike the previously discussed programs that employ public participation for their data collection, the 50 Peaks Projects recruits student interns for its research. Founded in 2021 by Dr. David Giblin of the UW Herbarium, 50 Peaks is an ongoing research project that seeks to understand alpine plant diversity and patterns of spatial change across non-volcanic peaks in the Cascade mountains. When asked about his research, Giblin echoed Hotaling and Kodner’s sentiments regarding our limited knowledge of these unique and sensitive ecosystems. “The alpine zone is one of the least documented and understood plants is super important for climate change and genetic diversity.”
During 50 Peaks research expeditions, student interns hike into the alpine wilderness and spend the day surveying
“Adventure-based citizen science is integral to the creation of baseline datasets in remote ecosystems like the alpine.”

their assigned peak, identifying species, recording relative abundance, and collecting leaf tissue. Loose soil, poor visibility, and falling rocks all pose risk in the alpine. These day hikes are also conducted during the summertime when weather is warm and sun exposure is high, leading to potential for heat stress. When asked about his thoughts on incorporating citizen science into his data collection, Giblin was hesitant. “Field-based images are helpful for a number of reasons, [but] I don’t feel comfortable encouraging even more people to go into the alpine for my own research interests,” he said, referring to the fragility of alpine ecosystems. However, Giblin also stated that he is not ruling out the possibility of using citizen scientists in his research in the future.
As Hotaling and Kodner also noted, adventure-based citizen science is integral to the creation of baseline datasets in remote ecosystems like the alpine. Without baselines, long-term ecosystem changes go undetected, and the vulnerability of these ecosystems cannot be fully understood. ABCS programs are especially vital to fragile ecosystems such as coral reefs that require increasing
like Adventure Scientists, the Living Snow Project, Mountain Futures, and 50 Peaks will continue to collect information on understudied ecosystems. By including communities invested in stewardship with research on the natural world, they are working to make science more accessible and enhancing our understanding of remote ecosystems in a changing climate.
PHOTO
Galvanizing Community to Protect the Cascade Red Fox
By Brianna Bonds, & Colin Lau,
Living in the frigid, alpine habitat of the southern Cascades Range, the Cascade red fox (Vulpesvulpes cascadensis)is an iconic species with deep historical and tribal connections. Having journeyed across the Bering land bridge over 300,000 years ago, this species has adapted to high-elevation meadows with open forests and deep snowpacks (Lewis et al. 2022). However, climate change and forest encroachment have shrunk their range by over 50%, and they are now limited to the Cascade Range in Washington exclusively. With a recent population estimate of less than 200 individuals and dwindling genetic diversity that is equivalent to 16 individuals, scientists and tribal the future (Akins et al. 2018).
Incorporating indigenous communities is essential to conservation, as they provide insight into ecological and behavioral changes in the Cascade red fox (Jessen et al. 2022). Alisa Woodruff, a member of the Skokomish Indian Nation, has worked to preserve and bring these stories to light through Storyworks — a collection of songs, dances, and stories from different tribes — she pieces together historical context and traditional ecological knowledge of the foxes (Smith Woodruff et al. 2020). “Not much Indigenous knowledge gets published because they don’t have peers

PHOTO Nate Redon tracks a collared individual in Mt. Rainier National Park. Photo by Gretchen Kay Stuart.

Incorporating indigenous communities is essential to conservation, as they provide insight into ecological and behavioral changes in the Cascade red fox.
to review their work, ” Alisa notes in a personal interview, emphasizing the importance of going the extra mile to validate and share these perspectives.
Other tribes focus on educating future generations and providing hands-on conservation experience. The Yakama Nation, for example — as part of a recently awarded National Fish and Wildlife Foundation grant — are collaborating with Heritage University and the Cascades
Carnivore Project to offer community outreach programs
students pursuing higher education, many of whom return to work at the tribe full-time after graduation. Mark Nuetzmann, a wildlife biologist from the Yakama Nation, describes this type of relationship as a “circle”, where tribal
but eventually come back to serve the tribe and protect the lands that they were raised in.
Research efforts for the Cascade red fox also involve governmental agencies and conservation groups. Nathan Redon, a PhD student at the University of Washington, uses collar tags and genetic sampling to track Cascade red fox movement and population dynamics in his research. “Trapping and tagging the animal in an ethical manner is challenging and time-consuming, but it provides valuable data on predation sites and den locations which are still vastly unknown,” he recently explained. Redon also partners with researchers from the Cascades Carnivore Project to collect and analyze scat and camera trap data. They then use this data to assess the fox’s distribution and diet (Akins 2016). These research efforts help inform conservation decisions, such as installing wildlife corridors across busy
PHOTO A camera trap capturing a Cascade red fox traversing upslope. Photo by Nate Redon.
“Trapping and tagging the animal in an ethical manner is challenging and time-consuming, but it provides valuable data on predation sites and den locations which are still vastly unknown.
“
roadways to improve habitat connectivity. However, much is still unknown about the species, making continued research and conservation efforts even more essential for its survival.
Legislative efforts to protect the species are ongoing, including work by Noah Greenwald, the Endangered Species Director at the Center for Biological Diversity. He is in the process of petitioning for the Cascade red fox to be listed as federally endangered, which would ensure more protections for the fox. Accomplishing this is no easy feat, however. First, the US Fish and Wildlife Service (USFWS) must respond within 90 days for the petition to be considered. After 12 months, Greenwald explains, “they’re supposed to
USFWS not meeting the 12-month deadline, and Greenwald has to set up a court date to challenge them a few years out. Given the current administration’s funding priorities, Greenwald is not optimistic for change in the next four years, but remains determined.
As climate change progresses, risks to the Cascade red fox are increasing. Predator and conifer encroachment, along with a shrinking snowpack, decrease the Cascade red fox’s habitat in connectivity and in size (Greenwald 2024).
many communities come together to form innovative solutions. With their combined work, the Cascade red fox and their habitat can be conserved, protected, and restored.

PHOTO Fox print size compared to a human glove. Photo by Nate Redon.
Seattle has long been recognized as an innovative city, attracting considerable talent from across the globe. The city’s population has rapidly increased, and housing prices have skyrocketed in response. The Department of Housing and Urban Development ranks the Seattle metropolitan area’s housing market as the sixth most expensive in the nation (Jones 2024). High rental costs have subsequently prompted a rise in homelessness (Oron 2024).
To address these issues, Seattle is setting its sights on a new vision: The One Seattle Plan, a comprehensive 20-year program aiming to address urban challenges such as housing affordability, public transportation, and sustainability. “To bring down costs, support current residents, and prepare for future growth, Seattle needs more housing and more housing choices – it’s that simple,” said Mayor Bruce Harrell (Beekman 2024). Mayor Harrell’s proposal includes increasing the city’s zoning capacity to over 330,000 new
units, expanding the Mandatory Housing Affordability program, and implementing a new state law that allows for more middle-density housing types in residential areas. The plan also focuses on increasing housing density along frequent transit routes to promote sustainable public transportation (Toay 2024). Though the One Seattle Plan offers a bright vision for Seattle’s future, it also raises environmental concerns. How the new housing development plan may impact key environmental features — such as green spaces, parks, and Seattle’s balanced urban landscape — is up in the air.
commitment to housing affordability and inclusivity, yet to many it also introduces a host of broader challenges that the city is ill-prepared to tackle. Seattle seeks to prioritize greater residential density to address the persistent housing shortage and promote more equitable access to housing. However, many residents worry this plan will negatively affect the city’s environment and quality of life, which attracted many to these concerns is Seattle’s failure to meet its own projections under the Urban Forest Management Plan, which aims to achieve 30% tree canopy cover by 2037

developers, and community members are grappling with how to protect and expand the urban tree canopy while balancing the need for sustainable growth and livability in an evolving urban landscape.
their concern over the One Seattle Plan. While many agree that addressing housing affordability is long overdue, others fear the long-term effects of higher urban density. Many residents, particularly renters and young professionals, view the plan as a necessary step toward making Seattle more affordable. A resident of the University District said: “The housing price now is too
PHOTO An aerial view of downtown Seattle. Photo by the City of Seattle.
high, especially in areas like the University District. The rent for a studio is around $1,900, and for a room in a [two bedroom two bathroom] apartment is around $1,500. I think having more houses will hopefully decrease the price and make living in Seattle more affordable. Although there will be fewer trees, people need to
Despite these optimistic views, others worry about the environmental impact

of the plan, particularly the potential loss of Seattle’s tree canopy. A University of Washington student who has been living in Seattle for close to 20 years expressed that: “Although Washington is known for its trees, and Seattle is the [most] famous city in Washington, there are not that many trees in Seattle compared to other cities in Washington. I understand the need for more housing, but I also want to see more trees in Seattle. The feeling of nature helps me release my stress.”
in the city due to the high cost of housing, which has forced

them to move to more affordable neighboring areas. Some readily express that it also introduced new challenges, such as longer commutes and more expensive homes in onceaffordable areas. To address this problem, careful planning, infrastructure spending, and dedication to creating an equitable community are needed in Seattle. When asked about house costs in Seattle, a University of Washington staff member said, “Seattle housing is too expensive. I was forced to live in Tacoma. Even with how far the commute is, that is the only choice I had.”
The One Seattle Plan is a bold initiative to address increasing housing needs and promote urban development. However, as the city grows, it must maintain a delicate balance between urban development and environmental
just aesthetic but also call attention to the need to protect the natural elements that improve the quality of urban life. Eventually, the success of the One Seattle Plan will depend on Seattle’s ability to innovate in housing, transportation, and sustainable practices. The decisions people make today will shape Seattle’s urban landscape for generations and hopefully ensure that the city remains green, vibrant and a place that Seattleites are proud to call home.
PHOTO Aerial view of the University District from the southwest with the Ship Canal Bridge in the foreground. Photo by Anton Fateev.
PHOTO An example of tree retention (City of Seattle 2024). Photo by Sama Jim Canzion, Haeccity Studio Architecture.

Pulling the Plug on Renewables
Trump’s Diagnosis of the US Energy Profile
By Claire Farber,
Environmental Studies ‘ 26 & Will Mixon,
Marine Biology ‘
Somewhere buried in the sea of executive orders (EOs) signed by President Trump on January 20, 2025, America declared a national energy emergency and called for an imminent, large-scale reform of the country’s energy portfolio. Trump’s now-infamous rallying cry to “drill, baby, drill” has become an emblem for the new administration’s energy policies: heightened fossil fuel production and a (Martínez and Mai 2024). Expanding US energy generation through renewable infrastructure appears to be off the table for the Trump Administration, a sentiment extending to the administration’s newly appointed energy executive Chris Wright. “There is no climate crisis,” Wright said in 2023. “And we’re not in the midst of an energy transition, either” (Jacobo 2024).
26
US energy portfolio would create jobs for “Americans forgotten in the present economy,” increase gross domestic product (GDP) through heightened international trade, and strengthen alliances while simultaneously asserting dominance over “hostile foreign powers” (The White House 2025). The media has been swirling with combinations of Trump’s campaign promises and often fear-mongering
than ever. No matter what version of America’s future energy portfolio may come into fruition under the Trump Administration, questions must be raised regarding the possible environmental implications of the revival of the American fossil fuel empire.
PHOTO Oil and gas production remained high during the Biden administration, even reaching record levels. Image from BLM Wyoming.
One of the Trump administration’s main arguments for is the desire for national energy independence. In his executive order, Trump squarely places the blame for high costs on a “reliance on foreign energy.” However, in 2023, the US closed out the year producing more energy than it had consumed by a record amount (US Energy Information Administration 2024). This continues a trend that started in
Trump’s administration has claimed inadequate domestic supply and infrastructure are increasing energy prices, but national trends tell a different story. The retail
the last decade, meaning the share of energy as an expense for households has not increased (US Energy Information Administration 2024). For example, gas station prices — a
The landscape of energy consumption in the US has also dramatically changed. In 2023, wind and solar power climbing to 9.3% (US Energy Information Administration 2024). Renewable energy’s rapid growth as an industry
2023 the overall number of jobs grew by 2.0% while clean energy jobs increased by 4.2% (US Energy & Employment Jobs Report 2024). These changes are partly the result and infrastructure more sustainable. Two major pieces of
“In 2023, the US closed out the year producing more energy than it had consumed by a record amount .
“
Reduction Act, which created over 300,000 jobs in clean energy (Environmental Defense Fund 2024).
When juxtaposed with global trends, it is clear that the US is not alone in its energy transition. The European Union eliminated it entirely (Sengupta 2025). Saudi Arabia, despite being the world’s largest exporter of oil, aims to produce half its energy from renewables by 2030. Most notable are the

PHOTO Turbines off the coast of Rhode Island contribute to wind’s growing share of energy production. Image from Ionna22, Wikimedia Commons.
US’s existential competitor. In 2023, China’s renewable energy use was similar to the US at 9.4% of total consumption, but its production of renewable
higher. China is now a leading producer of solar panels, electric vehicles, and lithium batteries
these exports are being fueled by China’s extensive use of coal, its vast production of renewable materials has slowed the country’s increase in emissions and reduced the cost of solar energy worldwide.
Trump’s plans for

America’s energy future are at odds with the rest of the promised to halt the production of new wind turbines in the country (Spring 2025). This attempt to stymie wind power is dissolving of environmental programs.
Obama Administration that Trump was successful in passed laws explicitly protecting sustainable infrastructure. where Republicans have a narrow majority (Gross and Sall 2024).
many of the Trump Administration’s changes to energy policy less colossal than they appear. Trump only has four policy, should the next administration choose to roll them and re-entry into the Paris Agreement – an international, non-binding agreement among signatory nations to meet emission reduction standards that contribute to climate change, adopted in 2015 – has been a prime example of this phenomenon. The Trump Administration’s withdrawal from the Paris Agreement in both 2020 and 2025 had little to no
should they desire.
At the onset of Trump’s second term, the US is not in the midst of an energy emergency. Despite his claims, American energy independence is at an all-time high, with its most
Trump’s emergency declaration and subsequent actions are nation less globally competitive and sustainable. However, by his political opposition. Many of the administration’s promises regarding the payoff of these changes operate under a long-term pretense and may not be fully realized in a period as short as a four-year presidency. Trump may these essential infrastructures can be just as easily plugged abandonment of renewable energy, many fear a four-year period of halted progress under the Trump administration’s assertion of US superiority and independence.
“
“ At the onset of Trump’s second term, the US is not in the midst of an energy emergency.
withdrawal won’t formally occur until 2026 (Pullins and
PHOTO Solar panel production in Shanghai, China. Image from Jiri Rezac.
Can Small-scale Regenerative Farming Feed Us? An Exploration of Skyroot Farms
By Svea Hallberg, Environmental Science ‘25
In light of our warming climate and changing weather patterns, it’s clear that present-day food systems are the Intergovernmental Panel on Climate Change’s (IPCC) report from 2020, agriculture, forestry, and other land use account for about 23% of total anthropogenic greenhouse gas from their traditional farming practices and increasingly Industrial farming techniques like chemical pesticides, large machinery, and monocropping are well recognized for their question: why are so many farms structured this way?
Increasing hopes to overcome food insecurity have been fueled by growing innovations in agriculture practices
there was pressure on farmers to increase their yields to
helped farmers boost their food production, but it wasn’t
solution was increased machinery and the coalescing of an estimated 500 million kilograms of pesticides each year
techniques were needed to prevent food scarcity, the Regenerative farming is viewed as a way to not only should hold greater responsibility for the food they produce
PHOTO In industrial agriculture, heavy machinery enables farmers to increase yield and quality of crops, while reducing labor costs. However, it can lead to soil compaction, which reduces the soil’s water holding capacity, decreases aeration, and promotes high soil erosion. Photo from rawpixel.com, USDA consumers.


basic approaches of regenerative agriculture are maintaining soil cover, minimizing soil disturbance, minimizing biodiversity impacts, maintaining living roots, minimizing chemical use, and – in some cases – using livestock or other
Regenerative agriculture’s aims are largely centered a whole relies on healthy soil – without it, the soil cannot crop rotation can improve soil structure, support nitrogen practices, farmers can increase their yields while also by students for his passionate teaching style and work in that even when he tried not to grow things, he couldn’t help partner and incredible farm manager, he was able to start Rather than throwing the weeds away, they toss them into their compost facility with other crop clippings and animal the waste, and after some time, the compost is ready to be
helps reduce waste and emissions, and cuts down on input pandemic limited labor availability and increased input
“
Regenerative agriculture’s aims are largely centered on the long-term preservation of soil health. Agriculture as a whole relies on healthy soil –without it, soil cannot support life.
PHOTO Skyroot farm in Summer 2014. Multiple crops are growing next to each other, increasing the biodiversity of the ecosystem and promoting soil health. Photo by Eli Wheat..

FIGURE 1 USDA report on price change (%) for major Consumer Price Index (CPI) categories, 2020–2024. Aside from transportation, food costs (red) increased the most for US consumers. Source: USDA, Economic Research Service using US Department of Labor, Bureau of Labor Statistics, Consumer Price Index data.
equipment, and seeds
challenge created by the current administration is agricultural communities are creating uncertainty for many immigrant farmers as to whether they will be able to remain in the
create a labor shortage in the agricultural industry, which is still recovering
impacting the agricultural is still hope for the future
sometimes critical of new ideas, but are very open to the the consequences, it doesn’t take long for a whole system
farms are beginning to shift their practices after seeing the future, both small and large farmers will have the resources to practice regenerative agriculture methods that can heal the
has already enacted 25% tariffs on all steel and aluminum
PHOTO Eli Wheat wants to be an example for other farms by testing new methods of regenerative farming and showing it is possible to grow food while also combating climate change. Photo from Eli Wheat. tariffs from impacted nations, which will further destabilize the global food
continue to drive up food costs in the near future: international trade,
commodity foods like soybeans are at risk if retaliatory tariffs are
negatively impact the vulnerable farms in working-class communities
cost of many necessary input costs, including fertlizer, chemicals, fuel,

MAPPING LAND TRANSITIONS: AGRICULTURAL AND INDUSTRIAL CHANGE IN THE ECUADORIAN AMAZON BY SAGE MAILHIOT
Bezerra-Gastesi, A. 2024. Oil in soils: Comparative study of cacao health in farms of different proximities to petroleum facilities in the Ecuadorian Amazon. SIT ISP Drive.
Brienen, R., Phillips, O., Feldpausch, T. et al. 2015. Long-term decline of the Amazon carbon sink. Nature. 519: 344–348
Cabrera, M., Capparelli, M. V., Ñacato-Ch, C., Moulatlet, G. M., López-Heras, I., Díaz González, M., Alvear-S, D., & Rico, A. 2023. Effects of intensive agriculture and urbanization on water quality and pesticide risks in freshwater ecosystems of the Ecuadorian Amazon. Chemosphere. 337: 139286.
Castellanos-Navarrete, A., de Castro, F., & Pacheco, P. 2021. The impact of oil palm on rural livelihoods and tropical forest landscapes in Latin America. Journal of Rural Studies. 81: 294–304.
Cozzarelli, I. M., Skalak, K. J., Kent, D. B., Engle, M. A., Benthem, A., Mumford, A. C., Haase, K., Farag, A., Harper, D., Nagel, S. C., Iwanowicz, L. R., Orem, W. H., Akob, D. M., Jaeschke, J. B., Galloway, J., Kohler, M., Stoliker, D. L., & Jolly, G. D. 2017. Environmental signatures and effects of an oil and gas wastewater spill in the Williston Basin, North Dakota. Science of the Total Environment. 579: 1781–1793.
Cushing, L. J., Vavra-Musser, K., Chau, K., Franklin, M., & Johnston, J. E. 2020. Flaring from Unconventional Oil and Gas Development and Birth Outcomes in the Eagle Ford Shale in South Texas. Environmental Health Perspectives. 128(7): 077003.
Dislich, C., Keyel, A. C., Salecker, J., Kisel, Y., Meyer, K. M., Auliya, M., Barnes, A. D., Corre, M. D., Darras, K., Faust, H., Hess, B., Klasen, S., Knohl, A., Kreft, H., Meijide, A., Nurdiansyah, F., Otten, F., Pe’er, G., Steinebach, S., & Tarigan, S. 2016. A review of the ecosystem functions in oil palm plantations, using forests as a reference system. Biological Reviews. 92(3): 1539–1569.
FAO and FILAC. 2021. Forest Governance by Indigenous and Tribal People. An Opportunity for Climate Action in Latin America and the Caribbean. Santiago. Hiraoka, M., & Yamamoto, S. 1980. Agricultural Development in the Upper Amazon of Ecuador. Geographical Review. 70(4): 423.
Johnston, J, et al. 2019. Impact of Upstream Oil Extraction and Environmental Public Health: A Review of the Evidence. Science of the Total Environment. 657: 187–199.
López, S. 2022. Deforestation, forest degradation, and land use dynamics in the Northeastern Ecuadorian Amazon. Applied Geography. 145: 102749.
LoPresti, F. 2024. Impacts of Gas Flaring on Soil Quality in the Ecuadorian Amazon: Orellana. SIT Digital Collections.
Mihai, R. A., Melo Heras, E. J., Terán Maza, V. A., Espinoza Caiza, I. A., Pinto Valdiviezo, E. A., & Catana, R. D. 2023. The Panoramic View of Ecuadorian Soil Nutrients
the Metabolism of Important Crops. Toxics. 11(2): 123.
Pellegrini, L., Arsel, M., Orta-Martínez, M., & Mena, C. F. 2020. International
Chevron Case From the Ecuadorian Amazon. Journal of International Economic Law. 23(2): 455–468.
Van Horne, Y. O., Alcala, C. S., Peltier, R. E., Quintana, P. J. E., Seto, E., Gonzales, M., Johnston, J. E., Montoya, L. D., Quirós-Alcalá, L., & Beamer, P. I. 2022. An applied environmental justice framework for exposure science. Journal of Exposure Science & Environmental Epidemiology. 33: 1–11.
A
HOT
YEAR FOR
OCEANS: ANALYZING 2023 TEMPERATURE TRENDS WITH ARGO DATA BY COCO
LIPE
Flanders Marine Institute. 2021. Global oceans and seas, v1. Flanders Marine
Lyman, J.M., and Johnson, G.C. 2023. Global high-resolution random forest regression maps of ocean heat content anomalies using in situ and satellite
Pawlowicz, R. 2020. M_Map: A mapping package for MATLAB, version 1.4m
HOLISTIC MANAGEMENT OF SALMON AND FOREST ECOSYSTEMS AMIDST INCREASING WILDFIRES
BY NINA PURSAI
Crozier, L. G., Burke, B. J., Chasco, B. E., Widener, D. L., & Zabel, R. W. 2021. Climate change threatens chinook salmon throughout their life cycle. Communications
Interview with Brian Harvey, Associate Professor of Forest Sciences at the University of Washington
Interview with Elaine Harvey, Watershed Manager for the Columbia River Inter-Tribal Fish Commission
Interview with Ellen Wohl Interview, Professor of Fluvial Geomorphology at Colorado State University
Interview with Monique Wynecoop, Tri-Regional Fire Ecologist for the US Forest Service and the Northwest Bureau of Indian Affairs
Fisheries: A study of the Kenai River Fishery (Alaska, usa). Marine and Coastal Ostrom, E. 2009. A general framework for analyzing sustainability of social–ecological systems. Science 325:419–422.
Prichard, S. J., Hessburg, P. F., Hagmann, R. K., Povak, N. A., Dobrowski, S. Z., Hurteau, M. D., Kane, V. R., Keane, R. E., Kobziar, L. N., Kolden, C. A., North, M., Parks, S. A., Safford, H. D., Stevens, J. T., Yocom, L. L., Churchill, D. J., Gray, R. W., Huffman, D. W., Lake, F. K., & Khatri-Chhetri, P. 2021. Adapting western North
University of Washington. Ocean competition cited in declining size of Sockeye
Wynecoop, M. D., Morgan, P., Strand, E. K., & Sanchez Trigueros, F. 2019. Getting
BARK AND AMBROSIA BEETLE DYNAMICS: A NEW LENS FOR FOREST MANAGEMENT PRACTICES
BY ABIGAIL ROCKE
Case MJ, Ettinger AK, & Pradhan K. 2023. Forest restoration thinning accelerates
Demkovich L. 2024. Beetles Killing More Trees in Washington, Likely Due to
Furniss, M.M., Johnson, J.B. 2002. Field guide to the bark beetles of Idaho and adjacent regions. Univ. of Idaho, Agric. Pub. Moscow, ID. Station Bulletin 74. Hallett JG, Lopez T, Borysewicz MA, O’Connell MA. 2001. Decay dynamics and avian
Huler J, Neil Mccoy Design. 2013. Ambrosia Beetle Ecology. Ambrosia Symbiosis;
Lee GYS, Wertman DL, Carroll AL, Hamelin RC. 2023. Filamentous fungal associates of the alder bark beetle, Alniphagus aspericollis, including an undescribed species journal.pone.0284393.
ambrosia beetles (Coleoptera: Scolytidae) in northeastern Oregon. In: Pan-
Progar RA, Eglitis A, Lundquist JE. 2009. Some ecological, economic, and social consequences of bark beetle infestations. In: The Western Bark Beetle Research Group: a unique collaboration with Forest Health Protection-proceedings of a symposium at the 2007 Society of American Foresters conference. Portland,
pnw_gtr784_071.pdf.
Reilly M, Spies T. 2015. Regional variation in stand structure and development in forests of Oregon, Washington, and inland Northern California. Ecosphere;
USDA. 2011. Ambrosia Beetles. U.S. Department of Agriculture; [accessed 2024 Aug
URBAN AGRICULTURE AS A METHOD FOR REDUCING FOOD INSECURITY IN SEATTLE’S
FOOD DESERTS
BY ZOE WARREN
Ackerman K, Conard M, Culligan P, Plunz R, Sutto M-P, Whittinghill L. 2014. Sustainable Food Systems for Future Cities: The Potential of Urban Agriculture.
Bishop L. 2024 Jan. Average Household Budget: How Much Does the Typical American
Calhoun ZD, Willard F, Ge C, Rodriguez C, Bergin M, Carlson D. 2024. Estimating the effects of vegetation and increased albedo on the urban heat island effect with s41598-023-50981-w.
Drewnowski A, Rose CM, Otten JJ, Lewis LR, Buszkiewicz J, Collier SM, Sivaramakrishnan B, Ismach A, Nguyen E. 2021. Food Security and Access Amid COVID-19: A Comprehensive Look at the Second Survey of Washington State
Economist Impact. 2022 Sep 20. Global Food Security Index (GFSI). Global Food food-security-index.
Handley A, Carson J. 2020. Andrea Handley in conversation with Jerome Carson.
Research-and-Development-Technical-Reports-Archive.
Lathan N. 2023 Sep 20. 50 years after being outlawed, redlining still drives redlining-still-drives-neighborhood-health-inequities.
Lee G-G, Lee H-W, Lee J-H. 2015. Greenhouse gas emission reduction effect in the transportation sector by urban agriculture in Seoul, Korea. Landscape and Urban
Outside Citywide Public Space Explorer. City of Seattle.
Rabbitt M, Hales L, Reed-Jones M, Coleman-Jensen A. 2022 Oct 17. USDA ERS -
Rhone A. 2022 Oct 20. USDA ERS - Documentation. USDA Economic Research
and Limitations of Urban Agriculture. Johns Hopkins Center for a Livable Future. pdf.
Siegner A, Sowerwine J, Acey C. 2018. Does Urban Agriculture Improve Food Security? Examining the Nexus of Food Access and Distribution of Urban Produced Foods in the United States: A Systematic Review. Sustainability. 10(9):2988.
age-sex-race-and-hispanic-origin.
Yang J, Yu Q, Gong P. 2008. Quantifying air pollution removal by green roofs in
THE LAST FRONTIER: ADVENTURE-BASED CITIZEN SCIENCE IN ALPINE RESEARCH
BY KATE ALLHUSEN, LAUREN GRADY & PHOEBE BERGHOUT
Day, G., Fuller, R.A., Nichols, C., and Dean, A.J. 2022. Characteristics of immersive citizen science experiences that drive conservation engagement. People and Nature. 4(4): 983-995.
Farrell, R. 2024, Nov 14. The mountaineers and hikers collecting data in extreme environments-that-scientists-cant-reach.
Giblin, D. Personal interview. 11 February 2025.
Hotaling, S. Personal interview. 4 February 2025. Kodner, R. Personal interview. 11 February 2025.
Pew Research Center. 13 November 2024. Mobile Fact Sheet. Pew Research Center.
Vasiliades, M.A., Hadjichambis, A.C., Paraskeva-Hadjichambi, D., Adamou, A., Georgiou, Y. 2021. A systematic literature review on the participation aspects of environmental and nature-based citizen science initiatives. Sustainability. 13(13): 7457.
GALVANIZING COMMUNITY TO PROTECT THE CASCADE RED FOX BY BRIANNA BONDS & COLIN LAU
Akins, J. 2016. Ecology & Conservation: The Cascade Red Fox. The Mazama Blog
Akins, J., Aubry, K. B., & Sacks, B. 2018. Genetic integrity, diversity, and population structure of the Cascade red fox. Conservation Genetics, 19, 969-980. Jessen, T. D., Ban, N. C., Claxton, N. X., & Darimont, C. T. 2022. Contributions of Indigenous Knowledge to ecological and evolutionary understanding. Frontiers in Ecology and the Environment, 20(2), 93–101.
Lewis, J. C., Akins, J. R., & Chestnut, T. 2022. Status Report for the Cascade Red Fox Washington Department of Fish & Wildlife.
Greenwald, N. 2024. Petition To List The Cascade Red Fox (Vulpes vulpes cascadensis) Under The Endangered Species Act And Concurrently Designate Critical Habitat. Center for Biological Diversity.
Greenwald, N. Personal Interview. 12 February 2025. Nuetzmann, M. Personal Interview. 20 February 2025. Redon, N. Personal Interview. 11 February 2025.
Smith Woodruff, A., Arques, S., Miles, M., Palacios, S. L., Peacock, M., & Chestnut, T. E. 2020. Cascade Red Fox: Through the Eyes of Our Ancestors to Present Day Knowledge. American Geophysical Union Fall Meeting Abstracts.
Smith Woodruff, A. Personal Interview. 28 February 2025.
Stuart, G. 2023. The Cascade Red Fox’s Fate in Washington State. National Wildlife
MORE HOMES, FEWER
TREES: IS THE ONE SEATTLE PLAN THE SOLUTION?
BY FAN BU & MIRANE YACOUB
Beekman, D. 2024, October 18. Seattle Mayor Bruce Harrell unveils new version of
Jones, J. 2024, November 14. U.S. cities with the highest rent prices [2024 edition].
the-most-expensive-rents
Oron, G. 2024, April 3. Everybody’s hurting: Seattle’s growing housing crisis
housing-crisis-means-anyone-could-become-homeless
Toay, A. 2024, October 17. Seattle mayor Bruce Harrell releases revised housing 73524c13-8ff0-4816-bc4f-708463a5e683
PULLING THE PLUG ON RENEWABLES: TRUMP’S DIAGNOSIS OF THE US ENERGY PROFILE
BY CLAIRE FARBER & WILL MIXON
Bradsher, K. 2024, March 8. How China Came to Dominate the World in Solar Energy.
The White House. 2025, January 20. Declaring a National Energy Emergency.
Gross, S., & Sall, L. 2024, July 30. Trump has big plans for climate and energy policy, but can he implement them? Brookings Institution. Retrieved March 3, 2025,
Environmental Defense Fund. 2024, September 20. How the Biden-Harris clean
Jacobo, J. 2024, November 19. Chris Wright, Trump’s pick for energy secretary, is
Martínez, A., & Mai, H.J. 2024, November 13. Trump wants to ‘Drill, baby, drill.’ What does that mean for climate concerns? NPR. Retrieved March 3, 2025, drilling-in-the-u-s-to-boost-fossil-fuel-production
Sabin Center for Climate Change Law. n.d. President Trump Announces Withdrawal agreement-0
Pullins, T., & Knijnenburg, S. 2025, January 21. US Withdrawal from the Paris Agreement: Impact and Next Steps. White & Case LLP. Retrieved March 3, 2025, impact-and-next-steps
US Energy Information Administration. 2024, September 11. Retail electricity prices
Sengupta, S. 2025, January 23. Trump’s Retreat From Clean Energy Puts the US Out of Step With the World. The New York Times. Retrieved March 3, 2025, from html
Spring, J. 2025, February 16. Trump’s war on wind power threatens blue state climate
H5 Bird Flu: Current Situation. 2025, February 28. Centers for Disease Control and IPCC. 2020. Climate Change and Land. Summary for Policymakers. ISBN 978-92-9169154-8
Ivanchuk, Nataliia. 2025, August 15. Regenerative Agriculture Practices and
2024 US Energy & Employment Jobs Report. n.d. Department of Energy. Retrieved
jobs-report-useer
US Energy Information Administration. 2024, July 15. US energy facts explained.
US Energy Information Administration. 2024, June 26. US energy production exceeded consumption by record amount in 2023. Retrieved March 3, 2025,
CAN SMALL-SCALE REGENERATIVE FARMING FEED US? AN EXPLORATION OF SKYROOT FARMS BY SVEA HALLBERG
Adan, M., Shakya, T., Kipreos, C.B., Riegle, A., & Keane, S. 2025, February 8. Migrant
Kosmerick, Todd. 2017, August 23.“World War I and Agriculture.” NC State University agriculture.
Minsberg, T. 2025, March 13. A Timeline of Trump’s On-Again, Off-Again Tariffs. The trump-tariff-timeline.html
“Regenerative Organic Agriculture.” 2020, October 29. Rodale Institute,
Sharma, A., Kumar, V., Shahzad, B., Tanveer, M., Sidhu, G.P.S., Handa, N., Kohli, S.K., Yadav, P., Bali, A.S., Parihar, R.D., Dar, O.I., Singh, K., Jasrotia, S., Bakshi, P., Ramakrishnan, M., Kumar, S,. Bhardwaj, R., & Thukral, A.K. 2019. Worldwide pesticide usage and its impacts on ecosystem. SN Applied Sciences. 1(1446).
Swanson, A., Austen, I., & Romero, S. 2025, March 4. Trump’s Tariffs on Canada,
Wheat, E. Personal Interview. 23 Feburary 2025.
Astill, G., Zahniser, S., & Ruiz, B.A. 2023, December, 14. Fruit and Vegetable Imports from Mexico Continue Upward Trend as Mexico’s Growers Adopt U.S. Food
Cerullo, M., & Lee, A.M. 2025, March 10. China’s retaliatory tariffs are a direct hit
Dodd, E., Welsh, C., & Glauber, J. 2024, May 2. Setting the Record Straight on Ukrain grain-exports.
Farm Labor Programs Work to Bring In the Crops. n.d. Oregon Secretary of State, sos.
Farms and Farm Households. Updated 2025, Janurary 1. USDA Economic
Food Prices and Spending. Updated 2025, February 14. Ag and Food Statistics:
Fred, M., & Harold, V.E. 2021. Ch. 11. Diversifying Cropping Systems. In: Building Soils for Better Crops: Ecological Management for Healthy Soils. Sustainable Agriculture Research and Education.
