

FIELDNOTES
letter from the editors
After a quarter flled with brainstorming, researching, writing, and revising, our latest journal issue is here sharing insights from undergraduate students in the College of the Environment.
This year’s feature article details how paleobiology databases can be used to understand the history of marine benthic communities. Other research articles in this issue explore greenhouse gas emissions from hydroelectric power sources, cultivating sustainable agriculture in desert environments, psychedelic mushroom diversity on the University of Washington (UW) campus, and the use of lionfsh ear bones to track their migration patterns.
In our community features, we investigate the environmental impacts of UW football’s switch to the Big Ten, the complicated debate around gray wolf protection, and the need for meaningful Indigenous land acknowledgements in academic institutions. We also discuss timed-entry systems in U.S. National Parks, the long-lasting effects of war on the environment, and lastly, the growing cost of insurance plans with climate change-induced natural disasters.
We thank the College of the Environment for their immense generosity and continued support of FieldNotes over the years. We would also like to thank Rachel Fricke and Julian Olden for their support, guidance, and enthusiasm in creating this journal. Their passion for science communication and outreach can be felt during each board meeting and throughout every journal issue, and we could not do it without them! We hope you enjoy this issue of FieldNotes and all of the incredible writing and research from our featured authors.
Best,
The FieldNotes Editorial Board

meet the team


BRIGITTE WORSTELL EDITOR

MIDORI SYLWESTER EDITOR

RILEY RAMIREZ EDITOR

JARED MCGLOTHLIN EDITOR


LAUREN GRADY EDITOR-IN-CHIEF
CLAIRE FARBER EDITOR
CHELSEA WHITING EDITOR
CLAUDIA STILE EDITOR
ABBY MEYERS EDITOR
LUCY ALLEN EDITOR
RACHEL FRICKE GRADUATE ADVISOR
JULIAN OLDEN FACULTY ADVISOR
JULIAN GONZALES EDITOR
ABBY CARIÑO EDITOR
EVOLUTION OF BENTHIC ECOSYSTEM STRUCTURES: TIERING AND MOTILITY INSIGHTS FROM THE CAMBRIAN TO THE CRETACEOUS BY ATTICUS CARTER, OCEANOGRAPHY ‘25
PSILOCYBE DIVERSITY ON UNIVERSITY OF WASHINGTON’S CAMPUS GRAHAM GAIMARI, ENVIRONMENTAL STUDIES ‘24
QUANTIFYING THESE DAM EMISSIONS! EVALUATING GREENHOUSE GAS EMISSIONS FROM HYDROPOWER RESERVOIRS
feature article

PHOTO JACKSON PAGE-ROTH
Evolution of Benthic Ecosystem Structures
Tiering and motility insights from the Cambrian to the Cretaceous
By
Atticus Carter, Oceanography ‘25
ABSTRACT

The marine benthic environment has been a cradle for biodiversity and ecological complexity throughout Earth’s history. A wealth of data to investigate these dynamics is provided by the Paleobiology Database (PBDB), but our understanding of how benthic communities have historically adapted and evolved in response to environmental shifts remains incomplete. Therefore, this paper uses advanced analytical techniques to interrogate the PBDB, uncovering patterns of resilience and change within benthic ecosystems and shedding light on the evolutionary strategies that underpin their survival and diversity. The methodology involves rigorous data collection and analysis, ensuring high taxonomic resolution and comprehensive temporal coverage to reveal shifts in ecosystem structures and motility patterns. Findings reveal signifcant shifts in marine ecosystems, underscored by the resilience of epifaunal organisms which live on the surface of the seabed or attached to objects on the seafoor, and the rapidly evolving dynamics of motility strategies. Despite challenges such as incomplete data and preservation biases, this study demonstrates the vital role of paleobiological databases in understanding past marine biodiversity. By addressing data gaps and enhancing analytical methods, this research contributes to broader knowledge of marine biodiversity, offering insights into the relevance of historical ecological studies for contemporary conservation and understanding evolutionary processes. This work emphasizes the importance of reconstructing extinct ecologies to inform future ecological and evolutionary research, advancing the understanding of marine biodiversity through historical lenses.
INTRODUCTION
Paleobiology explores the biology of ancient organisms by studying their history through fossils. This discipline is particularly concerned with extinct ecology, examining how these organisms interacted with their environments and each other throughout history. By analyzing the morphology (shape) and taphonomy (decay and preservation processes) of fossils, researchers can infer the behavior and ecological roles of extinct species.
Understanding the structure and dynamics of ancient ecosystems provides valuable insight into the evolutionary processes that have shaped life on Earth. Gaining this knowledge is crucial not only for advancing scientifc understanding within the discipline but also for
informing contemporary conservation efforts and predicting future ecological changes in the face of human impacts and climate change.
One important concept in paleobiological research is tiering, which describes the vertical distribution of different types of organisms within their environment, particularly in benthic (ocean foor) communities. This concept is vital for understanding the structure of both ancient and modern ecosystems. Researchers have investigated the changes in composition and size of benthic communities over time, revealing substantial shifts in ecological dynamics and organism motility throughout geologic history. For instance, studies by Bottjer and Ausich (1986), Ausich and Bottjer (1991), and Wood (2010) have extensively described these relationships. Additionally, Clapham and Bottjer (2007) and Bush et al.

(2007) have focused on how these communities’ compositions have evolved, highlighting signifcant changes over time.
This study seeks to understand how ecosystem tiering and motility have evolved in marine benthic communities from the Cambrian to the Cretaceous periods. These eras offer high resolution insight into morphological descriptors of life modes, as well as an adequate sample size of exceptionally preserved marine fossils. By analyzing changes in ecosystem tiering and motility across the Paleozoic and much of the Phanerozoic eon (541 - 66.0 mA), this research aims to provide a clearer understanding of regime shifts and macroevolutionary processes.
Data sourced from the Paleobiology Database (PBDB), a public resource that provides aggregated high-resolution taxonomic and paleontological data, serves as the foundation for this analysis (Alroy et al. 2001, Peters and Heim 2010). The primary goal of this study is to evaluate how effectively PBDB data can describe benthic ecological systems from the Cambrian to the Cretaceous periods and assess whether the data quality is suffcient to draw statistically signifcant conclusions.
METHODS
Species records were sourced from the Paleobiology Database (Peters and McClennen 2016, Marshall 2020).
To increase the confdence of the identifcation, and therefore motility and tiering data, the taxonomic resolution – defned as the level of detail in classifying organisms –was narrowed down to the species level. Time periods were organized according to the International Chronostratigraphic Chart as published by the International Commission on Stratigraphy (Cohen et al. 2013). As such, data was sourced from 538.8 Ma to 66.0 Ma to represent the chosen time frame from the beginning of the Phanerozoic to the end of the Mesozoic (Figure 1).
The data was inclusive of all locations and formations, with no preference in lithology or modern-day collection environments. Abundance values were selected in terms of the number of specimens or individuals in the collection instead of being reported as percent coverage.
To refne the analysis and enhance the quality of the dataset, each species was then manually evaluated and compared to the taxon environment. This fltering omitted any misinputted terrestrial fauna from the dataset. The dataset was then standardized to facilitate comparison across different time periods and geographic locations. This involved aligning taxonomy nomenclature with the latest standards and converting all measurements to a consistent unit of analysis, eliminating discrepancies arising from varied reporting methods. The dataset was
then subsequently partitioned into several fles tailored for distinct analytical approaches. In the frst fle, tiering and motility data retained their complex, original descriptors (e.g., “low-level epifaunal; facultatively mobile, attached”). The second fle simplifed these classifcations into broader categories, such as “epifanal” and “infaunal”, to facilitate more generalized and standardized analysis. This approach ensured that the analysis remained reliable and meaningful, allowing comparisons across different periods, allowing comparisons across different periods despite varying fossil preservation.
Using a power analysis (Cohen 1988), it was determined that for this particular dataset the minimum number of species per interval needed to be 33 to ensure statistical reliability. This threshold is consistent with standards found in relevant literature. Statistical tests conducted included descriptive statistics to summarize the data and inferential statistics (such as correlatory tests and regression analysis), to identify signifcant differences and relationships in tiering and motility across different intervals. These tests used allowed for robust comparisons and conclusions to be drawn from the dataset.
RESULTS
Relative abundance of ecological tiers over time provides several insights into changing biotic elements across
FIGURE 1 Timeline of geologic eons, eras, and periods in million years ago (Ma).
geological epochs. Large-scale regime shifts and tiering restructuring events (TREs) are clearly demarcated in the aftermath of major extinction episodes, underscoring recurrent patterns of mass mortality followed by evolutionary radiations. TREs rapidly alter the composition and structure of benthic communities through geologic time, and PBDB data is consistent with TRE time scales reported at smaller intervals (Bottjer and Ausich 1986, Ausich and Bottjer 1991).
Epifaunal organisms maintain the highest rates of occurrence across geological time, accounting for 55.09% of occurrences (Figure 2). This enduring prevalence is attributed to signifcant biomass contributed by reef-building entities and organisms that engage in epibiosis – a relationship where one organism lives on the surface of another. Ecological niches are among the frst to be rebuilt following TREs. Prominent taxa occupying this ecological tier are reef
builders such as corals and rudist bivalves, alongside epibiont species like brachiopods and mussels (Wetzel 1991, Clapham and Narbonne 2002).
An epibiont is an organism that lives on the surface of another living organism.
Following epifaunal organisms, nektonic organisms comprise the second largest portion of species (18.54%). This tier is dominated by classes like Conodonta and Cephalopoda, and can be described as taxa that often interact with the greater benthic community via predation, competition, and community structure without living exclusively on a substrate. Despite their primary habitat in the water column, nektonic species like ammonites can have signifcant post-mortem contributions to the benthic environment, as their shells provide habitats and substrates for benthic organisms. Exclusively pelagic organisms, which live and complete their life cycles entirely within the open water column and do not interact with the seafoor, were excluded from this dataset to focus on organisms that directly impact the benthic
FIGURE 2 Relative abundance of ecological tiers over geologic time, averaged at 1 million year intervals. Geological periods and major mass extinction events are indicated above and below the plot and with vertical black bars, highlighting their impact on the distribution and dominance of ecological strategies among marine organisms. The colors in the stacked area chart represent different ecological tiers as follows: Epifaunal (red), Infaunal (orange), Nektobenthic (blue), Nektonic (yellow), Planktonic (green), Solitary (dark green), Boring (purple), and Clonal/Colonial (pink).


FIGURE 3 Relative abundance of motility strategies over geological time, averaged at 1 million year intervals. Geological periods and major mass extinction events are indicated above and below the plot and with vertical black bars, highlighting their impact on the distribution and dominance of motility strategies among marine organisms. The colors in the stacked area chart represent different motility strategies as follows: Actively Mobile (red), Attached (orange), Fast-moving (blue), Mobile (yellow), Passively Mobile (green), Slow Moving (dark green), and Stationary (purple).

FIGURE 4 Photos of specimens from the 8 most represented classes over geological time.
community’s composition and function (Bromley and Ekdale 1986, Buatois and Mángano 2003).
The third most abundant tier displayed in this timeframe is infaunal organisms, which live buried in the sediment of the seafoor. Following the Tr/J extinction event, a substantial amount of ecospace is shifted to infaunal life modes. This is due in large part to the dominance of Bivalvia and the fall of Rhynchonellata throughout the MMR. This regime shift represents a large TRE in which ecospace of attached sessile organisms began to fall behind the more derived infaunal bivalves.
Relative abundance of motility types does not correlate closely with relative abundance of ecological tiers and is highly variable across short time periods (Figure 3). Variations may be due to motility’s direct impact on survival strategies, such as predator avoidance and resource acquisition, which can drive faster evolutionary
responses (Bromley and Ekdale 1986, Underwood and Fairweather 1989). In contrast, ecological tiering refects an organism’s position within an ecosystem and seems to evolve more slowly because it involves more complex interactions and dependencies within the ecosystem (Ausich and Bottjer 1982, Wetzel 1991). Motility ecospace is more likely to be volatile and change often, without the largescale, statistically signifcant shifts seen in TREs.
Competition shapes the motility ecospace within relatively fast time scales (Bottjer and Ausich 1986, Clapham and Narbonne 2002). The visualization in Figure 2 highlights the episodic nature of these shifts, suggesting that certain periods in Earth’s history may have fostered rapid evolutionary innovations or adaptations in motility as a direct response to ecological pressures or opportunities (Droser et al. 1994, Signor and Vermeij 1994). However, motility changes are
not shown to be statistically related to major extinction events. This could be due to the constant nature of change within the marine benthos or limitations in the PBDB and the greater fossil record (Bush et al. 2007, Servais et al. 2010).
Regime shifts are common among the top 8 classes (Anthozoa, Bivalvia, Cephalopoda, Conodonta, Gastropoda,
FIGURE 5 Relative abundance of the 8 most represented classes over geological time, averaged at 1 million year intervals. Geological periods and major mass extinction events are indicated above and below the plot and with vertical black bars, highlighting their impact on the distribution and dominance of classes among benthic communities. The colors in the stacked area chart represent different classes as follows: Anthozoa (red), Bivalvia (orange), Cephalopoda (blue), Conodonta (yellow), Gastropoda (green), Rhynchonellata (dark green), Strophomenata (purple), and Trilobita (pink).


FIGURE 6 The left panel illustrates relative abundance of species richness over geological time, while the right panel is the Shannon Diversity Index over the same period. The orange line is species richness (R 2 = 0.20, p = 1.34e-05) in the left panel and Shannon Diversity Index(R 2 = 0.34, p = 1.41e-03) in the right panel. Red dashed lines indicate the trendline for each metric, and black dashed lines mark signifcant mass extinction events.
Rhynchonellata, Strophomenata, and Trilobita) (Figure 4). One example is the long dominance of class Trilobita until its eventual termination at the P/Tr. Species diversity built up just before the mass extinction, indicating a complex ecosystem was about to face catastrophic change. Visually and statistically, the impact of the Great Dying during the P/Tr event is the most pronounced among mass extinctions (Figure 5). Notably, the highly abundant Strophomenata brachiopods reach close to 40% relative abundance before their rapid extinction. This pattern aligns with the aforementioned ecospace shift from epifaunal organisms (i.e., Strophomenata) to the infaunal Bivalvia class which arose quickly in the aftermath of the P/Tr , demonstrating the rapid restructuring of marine life in the face of cataclysmic events (Harper 2006, Hautmann et al. 2015). The precipitous decline of the Trilobita and the Strophomenata around the P/Tr boundary illustrates the vulnerability of certain classes to global changes, while the concurrent rise of Bivalvia shows the opportunistic nature of evolutionary processes in flling vacated ecological niches.
To further assess the PBDBs coverage of marine benthos dynamics, Figure 4 integrates the Species Richness and Shannon-diversity indexes into the analysis, offering a different way of visualizing ecological variations across temporal scales. This addition reveals a pronounced uptick in species richness immediately preceding mass extinction events, a pattern that resonates with existing scientifc literature and correlates strongly with the trends observed in Figures 1 and 2. Such an increase suggests a possible ecological saturation or a period of heightened competition among species, potentially making ecosystems more vulnerable to environmental stressors. The corresponding analysis of Shannon-diversity, which considers both abundance and evenness of species, provides a comprehensive measure of ecosystem diversity and complexity, further illuminating the intricate balance of marine life before catastrophic declines. This data shows the cyclical nature of biodiversity through geological epochs, where periods of rapid diversifcation and fourishing life are often followed by abrupt reductions in diversity due to
mass extinctions which in turn lead to the cycle repeating again (Hargrave and Thiel 1983, Poulin et al. 2001, Reiss et al. 2015).
DISCUSSION
The results of this study underscore the complex and dynamic nature of marine benthic ecosystems from the Cambrian to the Cretaceous.
The analysis of species richness and Shannon Diversity Index, alongside the examination of ecological tiering and motility strategies, provides valuable insights into how these communities have evolved in response to various environmental pressures and extinction events. One of the key fndings is the notable resilience and dominance of epifaunal organisms across geological time. Epifaunal species consistently occupy a signifcant portion of the benthic community. This is likely due to their role in reef-building and epibiosis, where organisms live on the surface of others, contributing to substantial biomass and ecological stability. The prevalence of taxa such as corals, rudist bivalves, brachiopods, and mussels further supports this observation. The analysis also highlights the episodic nature of motility strategy shifts. Unlike ecological tiering, motility patterns appear to be more volatile, driven by immediate survival strategies such as predator avoidance and resource acquisition. This variability suggests that motility changes are more sensitive to short-term environmental fuctuations and competitive pressures, whereas tiering refects more stable, long-term ecological interactions.
Historical oceanographic conditions provide numerous explanations for the rapid changes observed in ecological tiering, motility, and class diversity. Fluctuations in thermohaline circulation, nutrient upwelling zones, sea-level changes, and temperature gradients directly impact marine biodiversity and ecosystem structure. For instance, the breakup of Pangea during the Mesozoic era is believed to have enhanced thermohaline circulation patterns, facilitating the upwelling of nutrient-rich deep waters in certain regions and fostering diverse and productive marine ecosystems. This enhancement of nutrient availability likely drove the increased Shannon
Diversity Index (Figure 6). Similarly, eustatic sea-level changes, infuenced by glacial-interglacial cycles, periodically expanded or contracted available marine habitats, altering spatial distributions and causing rapid fuctuations in marine organism motility (Cheung et al. 2009).
Ocean anoxia events (OAEs), characterized by widespread reductions in oceanic oxygen levels and often triggered by massive volcanic eruptions, led to increased nutrient input from enhanced weathering and have been linked to several mass extinction events and the reorganization of marine ecosystems. These events resulted in the stratifcation of the water column and the expansion of anoxic zones, exerting selective pressure on marine life, infuencing motility patterns, habitat preferences, and community compositions as organisms adapted to changing conditions or faced extinction (Kennett and Stott 1991, Lowery et al. 2020). The signifcant shifts observed in the aftermath of mass extinction events, particularly the Permo-Triassic (P-Tr) and the Triassic-Jurassic (Tr-J) events, illustrate how these cataclysmic periods act as catalysts for ecological restructuring. The rapid decline of certain taxa, such as trilobites and strophomenata brachiopods, and the concurrent rise of opportunistic groups like bivalves, demonstrate the adaptive nature of marine organisms in flling vacated ecological niches. These patterns align with the concept of tiering restructuring events (TREs), where post-extinction ecosystems undergo rapid changes in community composition and structure.
However, several limitations must be acknowledged. The Paleobiology Database (PBDB) data, while extensive, is not exhaustive. Incomplete fossil records and inherent biases, such as the “Pull of the Recent,” where more recent periods have better representation, can skew interpretations. Additionally, inconsistent paleogeographic resolutions across samples limit the ability to conduct detailed spatial analyses. To mitigate these limitations,
future research should focus on enhancing data completeness and consistency. Integrating modern technologies such as remote sensing and machine learning for data analysis, along with fostering interdisciplinary collaborations, will be crucial. These efforts will improve the utility of databases like the PBDB, providing more robust insights into past marine biodiversity and guiding conservation strategies in the face of ongoing environmental changes.
In conclusion, this study highlights the importance of reconstructing extinct ecologies to inform future research and conservation efforts. The lessons learned from ancient marine ecosystems offer invaluable perspectives on the resilience and adaptability of life, emphasizing the need for a long-term view in understanding and managing contemporary marine biodiversity.
research communications communications


PHOTO JACKSON PAGE-ROTH
Psilocybe Diversity on University of Washington’s Campus
By Graham Gaimari
Environmental Studies ‘24
The fungal genus Psilocybe contains over 150 globally distributed and diverse species (Bradshaw et al. 2024, Guzmán et al. 1998, Van Court et al. 2022). Mushrooms in Psilocybe produce various psychoactive tryptamines, designated as psilocybin compounds. These compounds are similar in molecular structure to serotonin and other neuroregulators, producing psychedelic effects when ingested (Hofmann et al. 1959, Van Court et al. 2022). The psychoactive capabilities of Psilocybe are relatively new to popular modern society, having been used in spiritual ceremonies by the indigenous people of Meso- and South America for thousands of years before such practices were effectively driven into secrecy by Spanish missionaries


(Guzmán 2008, Nichols 2020, Wasson 1957). Only a short but very psychedelic decade after the mind-altering effects of these mushrooms were revealed to popular science and culture, psilocybin and other hallucinogenic drugs were classifed as Schedule I substances in 1968. Scientifc interest in the potential use of these compounds for psychotherapy was immediately curbed and funded research on the topic was not picked up for another 30 years (Bradshaw et al. 2022, Carhart-Harris and Goodwin 2017, Gabay 2013, Lopez & Tadi 2022).
Despite illegalization, fascination with Psilocybe continued to spread among the public during the 1970s. Psilocybin-producing mushrooms were identifed in the temperate regions of Europe and North America, primarily growing on woody debris (Guzmán et al. 1998). Recreational foraging for Psilocybe rapidly increased and these unassuming, little brown mushrooms quickly became ubiquitous on wood chips from Vancouver, B.C., to San Francisco, California.
Psilocybe cyanescens Wakef. is common among the wood-inhabiting, psilocybin-producing species found in Seattle, Washington. The holotype specimen of P. cyanescens was collected by Elise Wakefeld from the Royal Botanic Garden, Kew, of London, U.K., in 1946. The holotype collection is the very frst documented specimen of a new biological species, which all subsequent taxonomy of that species is based upon. Several other wood-inhabiting species similar in morphology to that of P. cyanescens have since been described and collectively designated as the Psilocybe cyanescens complex (P. azurescens Stamets & Gartz, P. serbica M.M Moser & E. Horak, P. subaeruginosa Cleland, P. weraroa Borov., Oborník & Noordel, etc.).
Psilocybe allenii Borov., Rockefeller & P.G. Werner – which exhibits a more rounded and dome-like shaped cap than the characteristic wavy cap of P. cyanescens – is the most recent taxonomic addition to this complex (Borovička and Rockefeller 2012). The holotype collection of this species was made on the University of Washington campus in 2009 by John Allen. Although morphologically distinguishable from P. cyanescens, gene sequencing specimens of P. allenii revealed a 5 base-pair difference in the internal transcribed spacer (ITS) rDNA region as well (Borovička & Rockefeller 2012). ITS, known as the universal DNA barcode for
FIGURE 1 Example of freshly collected P. cyanescens, found growing on wood-chips at the University of Washington in 2023, exhibiting variable morphological forms and stages of growth. Image by Celeste Louden.
FIGURE 2 Example of freshly collected P. allenii, found growing on wood-chips at the University of Washington in 2023, exhibiting variable morphological form and stages of growth. Image by Graham Gaimari.
fungi, is a region of non-functional ribosomal RNA that contains variable and conserved regions of DNA (Schoch et al. 2012). A 5 base-pair difference in the ITS region suggests a different species, but must be paired with morphological characterizations and phylogenetics to be conclusive. Yet, P. allenii and P. cyanescens are found to be indistinguishable regarding their spores and cystidia, which are microscopic

features used for the morphological identifcation of species. Spores are the billions of reproductive cells produced along the gills of mushrooms, with variation in color, size, and shape across genera and species of fungi. The presence and form of cystidia on mushrooms’ gill edges are also useful for identifcation, but these cells’ true function is still inconclusive within mycology. The comparable macroscopic, microscopic, and genetic characteristics throughout the cyanescens complex causes intense debate about the biological origins and relationships of these species (Borovička et al. 2010, McTaggart et al. 2024, Van Court et al. 2022).
In Autumn 2021 and 2023, the author made multiple collections of Psilocybe mushrooms on wood chips around the University of Washington campus. Based on macroscopic morphology, four of the collections were suspected to be P. cyanescens (Figure 1), and three of the collections to be P. allenii (Figure 2). To fully understand the taxonomy of the Psilocybe collected, a study of dried specimens was performed. Samples of dried gill material from the collections were mounted in 3% KOH for rehydration, and an examination of their microscopic features was
conducted using a compound microscope. Documentation and measurements of the spores and cystidia from both collections validated the suspected species of these Psilocybe The smooth, thick-walled, and ellipsoid-shaped spores observed from both collection groups were essentially identical (Figure 3). Measurements of the spores in the profle view determined a mean size of (10-13) 11.7 x 6.4 (5.5-7) µm in collection Group A and (11-15) 12.4 x 6.4 (5-7.5) µm in collection Group B. Cystidia in both collections were also observed in their previously known lance to ovate shape with a sometimes clubbed tip (Figure 4). An in-depth examination of the cystidia of P. allenii and P. cyanescens could reveal insight into their microscopic distinction.
The ITS rDNA region of the seven collections, sequenced by Molecular Solutions LLC, were analyzed on GenBank using NCBI nucleotide BLAST. This feature cross-references a given DNA sequence to the publicly available database of sequences. The statistical signifcance of regions of similarity is calculated and a list of the most similar sequence entries is provided. The previously shown 5 base-pair difference was observed between Groups A and B. However, BLAST results of the separate collection groups displayed overlap in
Washington campus. Photographed at 500 X magnifcation (top) and 1250 X magnifcation (bottom), in 3% KOH by Graham Gaimari.

their list of matching sequences. Specimen and sequence designations, especially for Psilocybe, are commonly incorrectly identifed throughout public databases (Bradshaw et al. 2022, 2024, Hofstetter et al. 2019, Van Court et al. 2022). Alexander Bradshaw at the University of Utah is currently improving the taxonomy of Psilocybe with the development of a holotype specimen sequence based phylogenetic tree of the genus. Taxonomic certainty is necessary to properly document, describe, and communicate the unique properties of any organism. Comparing the ITS sequences of these collections directly to the sequence data of holotype specimens within the cyanescens complex would be conclusive to their exact species identifcation given the affrmative results yielded so far. Bradshaw’s statistical analysis of the sequences with the existing phylogenetic tree confrmed that the presented collections made around the University of Washington campus are composed of both P. cyanescens and P. allenii. (Figure 5).
This collaborative research is conclusive to the species identifcation of these collections
FIGURE 3 Spores of P. cyanescens collections (A), and P. allenii collections (B), made on the University of Washington campus. Photographed at 1250 X magnifcation in 3% KOH by Graham Gaimari.
FIGURE 4 Cystidia (brackets) protruding from the gill edges (arrows) of P. cyanescens collections (A), and P. allenii collections (B) made on the University of
and confrms previous fndings on P. allenii and P. cyanescens (Borovička 2008, Borovička & Rockefeller 2012). It is also the frst biological study of the Psilocybe species specifc to the University of Washington campus. These species have previously been documented on campus, but the ecology of the University is likely experiencing transformations from the construction of infrastructure and changes in landscaping practices. Climate change is increasing the amount of dry and warm days in Seattle and could possibly be limiting the growth habits

FIGURE 5 The cyanescens complex from ITS-based phylogenetic analysis of the genus Psilocybe. Holotype specimen sequences are denoted by red text, and branch numbers denote bootstrap statistical support. The phylogenetic clades of P. cyanescens and P. allenii are highlighted in grey and labeled A and B, respectively. Collections sequenced for and used in this study are labeled GEG. Courtesy of Alexander Bradshaw.
of mushrooms as well (Blow 2023). All fungi are likely adapting to these changes, but those that produce psilocybin compounds are of particular interest here. These compounds have recently attracted high-profle interest for their ability to treat conditions such as depression, anxiety and other mental health complications (Carhart-Harris et al. 2017, Lee et al. 2023, Van Court et al. 2022). Presently, the University of Washington’s own School of Medicine is receiving state funding to study the use of psilocybin compounds in treating PTSD (Talbott 2023). In 2021, Seattle also joined many other cities and states that have decriminalized psilocybinproducing mushrooms, refecting a progressive shift in attitudes toward their use (Peha 2021). However, due to their historical stigmatization, scientifc understanding of Psilocybe is decades behind other genera (Bradshaw et al. 2022, 2024, Meyer & Slot 2023, Van Court et al. 2022). There is a general need for the taxonomic reclassifcation of this genus in association with quality genomic sequence data and morphological descriptions. Furthermore, the variability, quantity, and genomic pathways of psilocybin compounds
Due to their historical stigmatization, scientifc understanding of Psilocybe is decades behind other genera.
are known to differ across the genus, among species, and even individual specimens of a single species; yet this is still widely unexplored within the diversity of Psilocybe (Beug & Bigwood 1982, Bradshaw et al. 2022, Reynolds et al. 2018).
Establishing a greater understanding of the enigmas surrounding these compounds could lead to further advancement in their safe and effective use in clinical and recreational contexts (Van Court et al. 2022). This study aims to bring recognition to these various biological sources of psilocybin compounds found on the University of Washington campus. More in-depth and continual research of these mushrooms is an opportunity for the University of Washington to take advantage of its own mycological diversity and make signifcant contributions to this momentous intersection of biology and psychiatry.
Acknowledgments: I would like to thank UW professor emeritus and renowned mycologist, Joe Ammirati, for guiding this study; Matt Gordon with Molecular Solutions LLC for providing ITS gene sequences of the specimens; and Alexander Bradshaw with the Dentinger Lab for phylogenetically analyzing the sequences and correspondences in the writing of this paper.
Note: Some of the most deadly mushroom species look remarkably similar to and proliferate in the same habitats as those in the Psilocybe cyanescens complex, particularly Galerina marginata. Identifcation should be taken incredibly seriously.
Tracking Invasive Lionfish Migrations Using Otolith Microchemistry
By Aly Liu
Marine Biology ‘24
Coral reef ecosystems are currently threatened by a multitude of stressors, from climate change, to microplastic pollution, to ocean acidifcation, to overfshing and beyond. Recently, native coral reef fsh have fallen victim to yet another threat: an invasive scorpionfsh with deadly venomous spines and a very large appetite. The invasion of Indo-Pacifc lionfsh (Pterois volitans) (Figure 1) throughout the Western Atlantic, the Gulf of Mexico, and the Caribbean is the most studied marine fsh invasion to this date due to its rapid growth and severe ecological consequences (Côté and Smith 2018) (Figure 2). Lionfsh are native to the Pacifc Ocean; they were frst observed in the Western Atlantic off the coast of Florida in 1985, where they were likely discarded into the ocean by aquarists who no longer cared for them. They have since proliferated throughout the entire tropical Western Atlantic at an alarming, unprecedented rate. (Gardner et al. 2015).
Lionfsh have been highly successful at rapidly colonizing many ecosystems including coral reefs, mangroves, seagrass beds, and the seafoor for several reasons. First, they are voracious generalist predators who prey upon over 70 species of fsh and invertebrate species, with a stomach that can expand more than 30 times in volume (Morris 2009). These prey are very naïve and unable to defend themselves against this new effcient and very numerous predator. Second, lionfsh have incredibly high rates of reproduction that allow them to increase their population sizes very quickly. Lionfsh become sexually mature at an early age, at which they can spawn every 2-3 days year-round, producing over 2 million eggs annually with up to a 26-day larval dispersal period (Airey et al. 2023, Côté and Smith 2018, Gardner et al. 2015). Thirdly, these invaders are tolerant of a wide range of habitats as both euryhaline and eurythermal scorpionfshes, which means they can survive in a wide range of salinity and temperature without enduring physiological stress. They can survive at salinities as low as 7 ‰ (parts per thousand) for at least one month, can maintain equilibrium throughout salinity


fuctuations of about 28‰ every six hours, and have a low thermal minimum of 10°C (Jud et al. 2015, Morris 2009).
Tolerance of a broad range of environmental conditions allows lionfsh to explore deeper into the ocean where they can prey upon a whole new suite of native deep-reef fsh species, many of which could be rare or endemic to the region (Jud et al. 2015, Tornabene and Baldwin 2017).
Lionfsh have not been established within their invaded ecosystems for long enough to develop relationships with local predators; hence, there are currently no predators to keep introduced lionfsh populations under control (Lionfsh Invasion n.d.). In conjunction, this suite of characteristics
FIGURE 1 Photos of invasive lionfsh (Pterois volitans) by Anadolu Agency.

makes this fsh a fantastic invasive predator, as well as an ecological menace.
Lionfsh presence has been linked to drastic declines in the abundance, recruitment, density, biodiversity, and biomass of native coral reef fsh species (Airey et al. 2023, Jud et al. 2015, Morris 2009). Recently, lionfsh have been found as deep as 300 meters; however, removal by spearfshing is currently limited to the top 30 meters of the reef due to the traditional limits of SCUBA diving. The impacts of lionfsh on reef ecosystems have been thoroughly documented in shallow reef zones, but are widely understudied on deep-reefs below 40 meters (Andradi-
3 Fish otolith photo by Sandy Sutherland that is annotated to show the core, where the fsh was born, with alternating semi-annual translucent and opaque growth bands extending all the way to the rim, where the lionfsh died.

source of replenishment for shallow populations (Airey et al. 2023). Therefore, we seek to determine whether or not lionfsh vertically migrate throughout their lives, or if there are resident deep-water lionfsh avoiding spearfsh removal and potentially spawning. Effective management plans will require a holistic understanding of this invasive predator’s migration patterns and where they are on the reef at different life stages.
Microchemistry of fsh otoliths has emerged as a powerful tool in examining fsh ecology. Otoliths are paired inner ear bones of teleost fshes made of calcium carbonate used for hearing and balance (Morissette and Whitledge 2022). These calcifed structures grow throughout the fsh’s life, with two new layers of aragonite deposited every year around the core (Figure 3). These growth bands exist as alternating opaque and translucent growth bands, with each pair of zones representing one year of growth. Lionfsh otoliths have been used to examine size-at-age, determine settlement age, produce growth models, and most recently, investigate post-settlement dispersal (Aguilar Perera and Quijano Puerto 2016, Airey et al. 2023, Dahl et al. 2019,
Brown et al. 2017, Tornabene and Baldwin 2017). Scientists know that deepreef populations exist, but lack an understanding of the connectivity, or lack thereof, between deep and shallow populations. It is important to fll this knowledge gap, as deep-reefs may be serving as refuges from spearfshing at the surface, allowing deep populations to potentially act as a near-infnite

in Curaçao.
Eddy et al. 2019, Edwards et al. 2014, Savva et al. 2020). A key aspect of these structures is that they incorporate the chemical properties of the surrounding water as they grow, and are therefore records of the environmental conditions the fsh experienced throughout its life (Airey et al. 2023, Morissette and Whitledge 2022).
I am analyzing a sample of 8 of the 40 lionfsh otoliths I extracted from specimens collected by divers and a submersible in Curaçao off the coast of Venezuela in 2019 and 2022 (Figure 4, Figure 5). The greatest known depth that lionfsh otoliths have been previously collected from is 93 meters by Airey et al. (2023); I will look at otoliths taken from lionfsh found at depths as great as 190 meters, thus extending our understanding of lionfsh ecology by about 100 meters. I will obtain oxygen stable isotope ratios, or δ18O, by using a micromill to produce aragonite powdered
FIGURE
FIGURE 4 Deep-water lionfsh samples being speared and collected by the CuraSub submersible
FIGURE 2 Map of reported invasive lionfsh sightings in 2020 by the U.S. Geological Survey. The site of lionfsh sample collection, Curaçao, is marked with a star.

5 Lionfsh sample being dissected for otolith collection.
samples that will be analyzed for isotopic composition using isotope ratio mass spectrometry (IRMS). The fractionation factor of otolith δ18O is dependent on water temperature, and otolith δ18O is in equilibrium with the δ18O values of the surrounding water (Helser et al. 2018, Lin et al. 2012). Thus, variations in oxygen isotopic signatures from the core to the rim of the otolith will indicate changes in water temperature across the lifespan of the lionfsh from settlement to adulthood, with higher δ18O values indicating lower temperatures (Martino et al. 2020, von Leesen et al. 2021). Because temperature varies with depth, this approach will tell us if lionfsh migrate between deep and shallow reefs throughout their lives, how frequent and long these migrations are, and ultimately whether they are susceptible to removal by spearfshing.
Once the otoliths are micromilled and δ18O values are obtained from IRMS, four potential results can be
anticipated (Figure 6). First, δ18O could remain constant from the core to the rim of the otolith, indicating no migration occurred (6a). Alternatively, δ18O values could be lower at the core and increase towards the rim, suggesting that lionfsh migrate once from shallow to deeper waters (6b), possibly due to density-dependent spillover (Airey et al. 2023). This pattern would imply that lionfsh are migrating to a deep-water refuge, where they are inaccessible to spearfshing and protected to spawn. Conversely, lionfsh might be born in deeper waters and migrate to shallower areas, where larvae may prefer warmer temperatures, and are eventually removed as adults (6c). Another possibility is that δ18O values fuctuate in a sinusoidal pattern, indicating continuous vertical migration throughout their lives (6d). This could be driven by seasonal prey availability, optimal spawning and feeding locations, or varying environmental preferences at different life history stages.
If this study reveals that otoliths can effectively trace lionfsh migration, we can aid management actions through a deepened understanding of the connectivity between deep and shallow populations, which may involve expanding the management of invasive populations to greater depths. Lionfsh-specifc traps in the Gulf of Mexico offer a promising method to capture deep-water lionfsh with minimal environmental impact and bycatch of native reef fshes (Harris et al. 2020). Invasive predators like lionfsh can disrupt food webs and trophic interactions, posing a threat to the ecosystem’s balance and functionality (Gallardo et al. 2015).
FIGURE 6 Four potential scenarios that could be found from the results of isotope ratio mass spectrometry (IRMS). Distance from the core, which is analogous to age, is represented on the x-axis. ∂18O is plotted on the y-axis, which is inversely related to temperature, which is then used as a proxy for depth.

Coral reefs, among the most biodiverse ecosystems on the planet, provide crucial ecosystem services and socioeconomic value to hundreds of millions of people in coastal communities (Baumgarten et al. 2015). These fragile ecosystems, already stressed by global warming and other anthropogenic factors, are less resilient to additional threats such as invasive predators. Addressing the ecological impacts of lionfsh is a critical step in the broader effort to protect coral reefs and the people who depend upon them.
Acknowledgments: I would like to extend my deepest gratitude to Dr. Luke Tornabene for his guidance and expertise throughout this process. Additionally, this project would not have been possible without the unwavering support of my mentor Sarah Yerrace. Thank you both for inspiring me by your immense passion, deep curiosity, determination, and love for fsh. This invaluable experience helped me explore my interests within marine science and grow as an undergraduate student. I would also like to thank UW SAFS and the Fish Collection for providing the resources and spaces used for this research. Lastly, thank you to the Mary Gates Endowment for supporting my work.
FIGURE
Farming in the Desert Equitable and Sustainable Agriculture in Arid Climates
By Miranda O’Herron, Environmental Studies and Nutrition
The desert climate presents a multitude of challenges within agriculture, hindering accessibility to fresh produce (O’Callaghan 2004). Climate change is projected to threaten the agricultural viability of desert lands which will exacerbate food insecurity and disproportionately affect low-income communities (Sinclair 2020; Hall 2023). Despite these obstacles, arid climates can offer vast agricultural opportunities through the application of sustainable agriculture techniques.
Desert farming is faced with signifcant hurdles, primarily water scarcity, high summertime heats, and infertile soils. Limited rainfall and high temperatures are correlated to reduced crop yields, contributing to food insecurity (Randall et. al 2022). Areas in which access to fresh produce is limited are commonly referred to as “food deserts” (Sinclair 2020). Monocropping is the practice of
cultivating a single crop over extensive areas of land for extended periods of time and is the most prevalent technique utilized in U.S. agriculture (Olafsson 2023). While monocropping is intended to maximize yields of commodity crops, there are signifcant ecological disadvantages (Popescu 2019). In contrast, sustainable practices like permaculture offer ecological and human health benefts. Permaculture is the utilization of natural processes to cultivate crops while simultaneously supporting the diversity and stability of local ecosystems. During my work with Cactus Park Elementary School in Las Vegas, Nevada, my team implemented an educational garden that employs permaculture techniques on a smallscale with the goal of distributing fresh produce to underserved communities. In conjunction with my internship, my research aims to identify optimal desert agricultural practices to maximize
sustainability and improve food accessibility.
To guide my research, I asked the following question: What are the best farming practices within desert agriculture to optimize sustainability and improve food accessibility? To address this question, I conducted qualitative research through interviews with local farmers in Las Vegas, Nevada and a literature review. Conducting formal interviews with local Las Vegas farmers gave me valuable insight into the methods of farming in an arid climate and helped me to understand the challenges of desert farming as well as how to overcome these barriers. Through interviews, frsthand experience during my internship, and a literature review, I concluded that incorporating local and Indigenous farmer knowledge, native and desert adapted crops, and permaculture techniques on small-scale farms can produce more reliable crop yields. Integrating these practices into
1 Native plants’ root networks are more evolved to the water conditions of arid climates than non-native crops, allowing for greater water absorption and retention.

FIGURE

arid agriculture can not only enhance food security but also contribute to the restoration of desert ecosystems.
Local
and Indigenous Farmer Knowledge
Local and Indigenous farmer knowledge is crucial for success within desert agriculture, yet often undervalued due to industrialization (Sumane et. al 2018). In order to maximize profts, commercial farms prioritize standardized practices over localized knowledge. In contrast, through years of trial and error, local farmers have developed specifc land-based knowledge. Las Vegas farmers emphasize the importance of working with the seasons (Hansen 2024; Ruben 2024). The summer necessitates low-water crops that are adapted to high heats and farmers recommend constructing shade structures for additional crop protection. Conversely, the fall and winter seasons allow for a greater diversity of crops, with less waterintensive options still preferred. Farmers advocate for timely planting, preparation, and suitable crop selection based on seasonal conditions, cultivating resilient approaches to desert farming.
Historically excluded from agricultural discussions, Indigenous farmers are also highly undervalued within agriculture (Melash et. al 2023). As a part of its colonial agenda, the U.S. government has continually suppressed Native farming practices as a means to erase Native communities and culture. This suppression in conjunction with the displacement of Native populations, has led to a profound underappreciation of Native food production methods (McNulty 2022). Native populations were early pioneers of “intercropping”, an agricultural technique in which multiple plant varieties are grown in close proximity. Various forms of intercropping have been employed throughout human history, one of the most well known being the “three sisters” technique, cultivated by the Haudenosaunee Nation in which legumes, squash, and corn are grown in a close radius to support each other’s growth (Cardinale 2007). While the three sisters technique was not originally utilized in the desert climate, generations
of farmers have domesticated crops to withstand the intense conditions of the desert. Intercropping is known for promotion of biodiversity as the technique mimics the diversity of plant growth in nature. Agroforestry is another popular form of intercropping that integrates trees into the farming landscape. Agroforestry has been used by Indigenous groups in the Americas for generations and is found to be highly benefcial in desert agriculture as trees provide shade for sun-sensitive crops (Nabhan et. al 2020). Desert legume trees used for agroforestry, such as mesquite, provide services to neighboring plants such as redistributing water and nutrients, improving soil functionality and underground biodiversity (Figure 1) (Barron-Gafford et. al 2017). In the ongoing evolution of agriculture in the face of climate change, it is imperative to integrate Native voices and traditional knowledge to create resilient food systems (NSUOK 2024).
“
In the ongoing evolution of agriculture in the face of climate change, it is imperative to integrate Native voices and traditional knowledge to create resilient food systems.
“
Native Crops in Farming
Native desert plants have evolved to endure intense heat and drought, making them ideal for arid agriculture as they need minimal resource inputs like water and fertilizers (Figure 1) (NPS 2022; Clear Choices 2020). Desert crops such as Cacti and Agave are highly tolerant of heat, drought, and saline rich soils, making them an ideal candidate for
FIGURE 2 Permaculture techniques that are utilized and recommended by local Las Vegas farmers, outlining the benefts these methods have on desert ecosystems.

crop production. Additionally, perennial grasses, woody shrubs, and nurse trees native to the desert are known to be highly effective in mitigating soil erosion (Gairola et. al 2023). These desert species provide pollinator services, attracting an array of native pollinator species. Moreover, succulent plants are found to be high in probiotic properties, supporting human immune, cardiovascular, and kidney functions (Nabhan et. al 2020). These benefts can improve nutrition and support greater insulin metabolism, fghting against nutrition related diseases that are prominent in food insecure regions. Similarly, desert-adapted crops can sustain arid climates, yielding reliable harvests without excessive resource inputs (Gatzke 2012). Although they are not necessarily native, desert-adapted crops are immensely useful for cultivating crops during drought.
Cultivating both native and desert-adapted plants can restore self-reliance, improve access to culturally relevant and nutritious foods, and enhance the resilience of desert ecosystems against the effects of climate change.
Arid Permaculture
Throughout my interviews, farmers discussed the use of permaculture methods such as composting, cover cropping, crop rotation and intercropping. These permaculture methods are particularly important in desert farming so as to maintain the quality of the soil, minimize resource inputs, and support healthy crop growth (Hansen 2024; Ruben 2024). Compost maintains soil fertility which is essential for robust plant development in the desert. Especially when paired with native crop selection, compost helps the soil retain water and prevent erosion (O’Callaghan 2004). Cover cropping refers to the planting of a single crop to cover the soil and is used to improve soil fertility, maintain nutrient retention, prevent erosion, and add organic material to the soil. Rather than focusing on harvesting, cover crops allow the soil to rebuild and prepare for the next growing season. Farmers suggest planting cover crops, such as sweet potatoes, during the summer to maintain soil health without excessive inputs and attention. Crop rotation, essential in preventing soil depletion and enhancing yields, is the practice of sequentially planting different crops on the same plot of land. While this practice requires forethought, desert farmers highly recommend this technique to prevent the
depletion of nutrients in the soil. These techniques, though demanding, are indispensable for sustainable agriculture and offer resilience against climatic challenges in the desert (Figure 2).
Starting Small-Scale
Achieving sustainability on a large industrial scale can be diffcult, therefore small-scale, local initiatives offer a more tangible method to implementing permaculture. Localized agriculture can not only decrease the supply chain between farms and consumers, but it can also place the power of food into the hands of the people (Klavinski 2013). Educational farms and small-scale community gardens can empower people with agricultural knowledge and promote food sovereignty (Figure 3). These initiatives equalize access to fresh and affordable produce, mitigating environmental harms caused by industrial agriculture and fostering community resilience against climate change. Small-scale and local initiatives make healthy, fresh foods more accessible and affordable for all people, regardless of geography and income.
Conclusion
While the agricultural methods discussed above have been utilized by people for millennia, they remain undervalued in the U.S. food systems, particularly in arid regions. Local and Indigenous farmer knowledge, native crops, and permaculture techniques offer solutions to nutritional defciencies, ecosystem restoration, and resource conservation in the U.S.. Employing these techniques on a small-scale can ensure stable crop yields during variable climates and grant low-income communities access to quality foods. Through such farms, communities gain food sovereignty and access to culturally signifcant foods that have inhabited the U.S. since time immemorial. Empowering the utilization of these methods promotes more resilience and sustainable food systems in the arid regions of the United States.
FIGURE 3 Students engage with the garden by planting radish seeds during the garden build day at Cactus Park Elementary School. School gardens help create excitement around community food production and contribute to food sovereignty.
Quantifying These Dam Emissions!
Evaluating greenhouse gas emissions from hydropower reservoirs
By Ethan Bouvet, Biology ‘25
Freshwater systems facilitate the fow of carbon between the land, oceans, and atmosphere. High quantities of dissolved greenhouse gases, such as carbon dioxide (CO2) and methane (CH4) relative to the atmosphere are common in most of the world’s lakes, rivers, and reservoirs (Cole et al. 1994). Understanding the fux of these gases from reservoirs into the atmosphere allows us to assess the environmental impact of large-scale hydroelectric projects, and is crucial to understanding the impact of hydroelectric power on climate change.
Active Pipe Theory
In the past, it was assumed rivers accept carbon from terrestrial ecosystems (allochthonous carbon), and transfer it to the oceans without major loss to the atmosphere or lithosphere (IPCC 2001). The idea that carbon is transported through rivers directly to the ocean without major CO2 effux is known as “passive pipe theory.” Rivers simply act as a
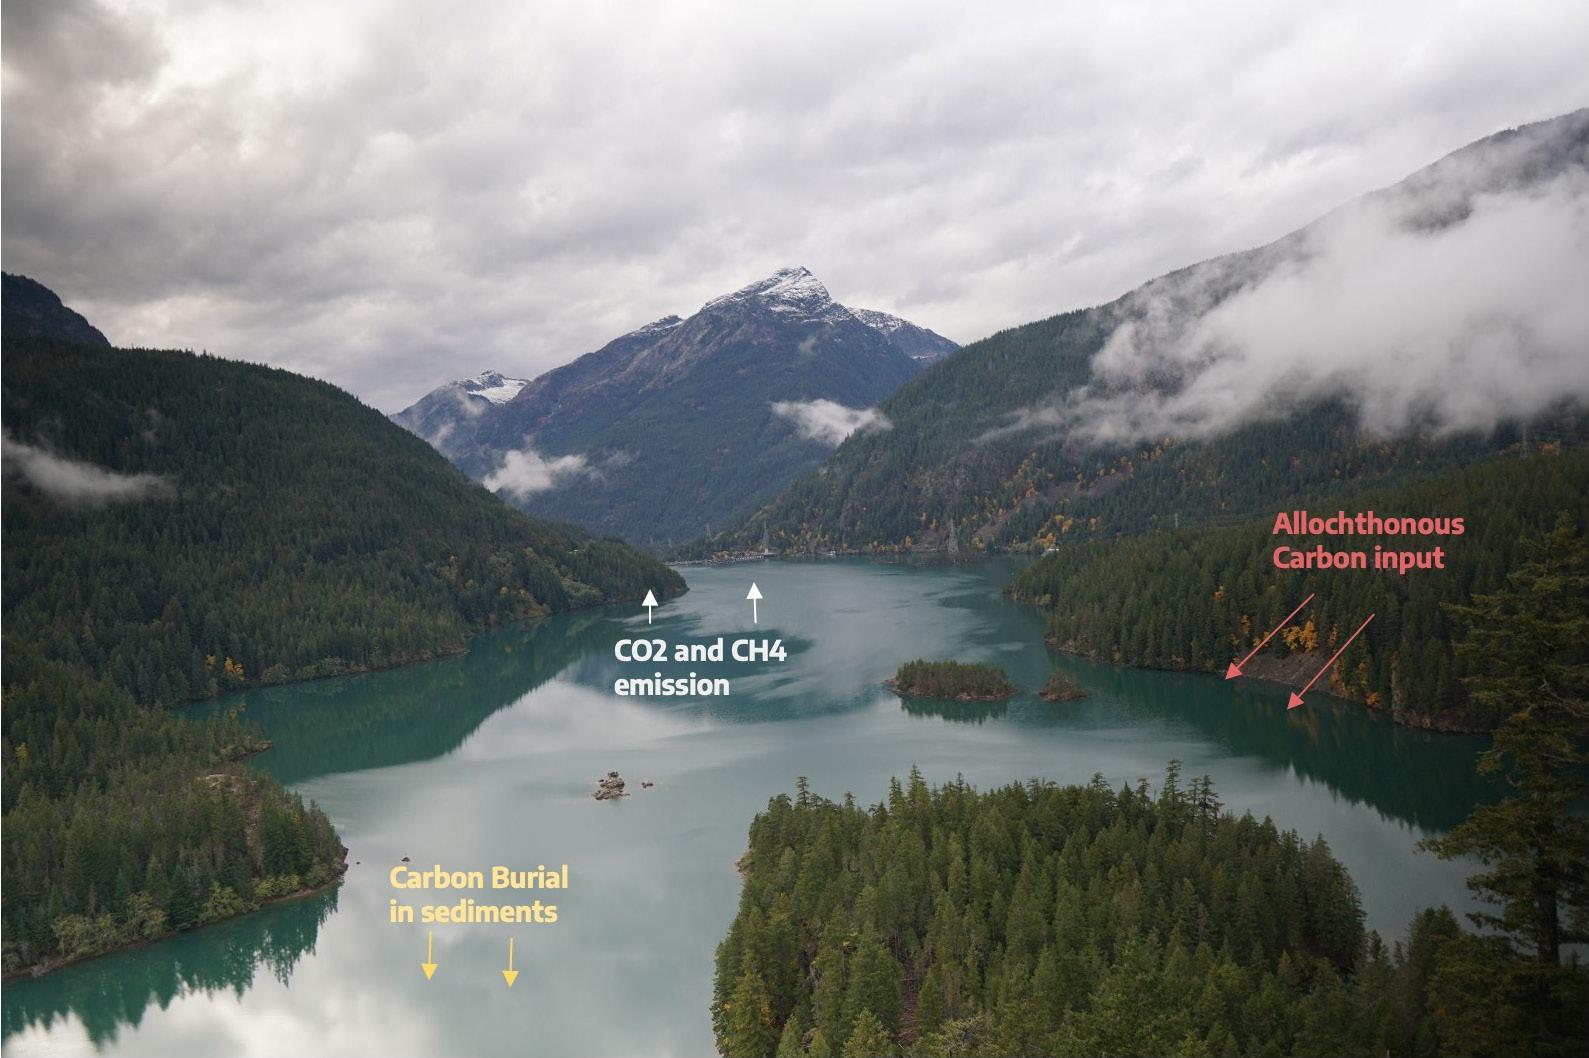
1 CO2 and CH4 fux in reservoirs.
closed-off or “passive” pipe that take carbon from terrestrial and geologic sources to the oceans. In 2007, this theory was modifed to account for dissolved gas effux from freshwater to the atmosphere as CO2 and CH4, as well as carbon storage in sediments on their way to the ocean. This modifed model is known as Active Pipe Theory because it accounts for the “activity” of carbon as it travels through freshwater systems. An example of this model can be seen in Figure 1, which pictures Ross Lake, a reservoir in the North Cascades (Cole 2007).
The Chemical Processes
When we are thinking about Active Pipe Theory or “dissolved organic carbon” it is important to understand what is happening on a chemical level. For example, when a leaf falls into a river, decomposers will slowly break it down into smaller and smaller molecules. Eventually, it will be broken down into a 2-carbon chain, often as Acetate/Acetic acid (Equations 1 and 2). From here it can be broken down even further into CO2 and CH4 (Miller et al. 2022).
1. CH3COOH → CO2 + CH4
EQUATION 1 Acetate fermentation
2. CO2 + 8H+ + 8e - → CH4 + 2H2O
EQUATION 2 Carbonate reduction
A great metaphor for understanding the chemistry of freshwater systems is to think of them as a cup of tea. Tea, like freshwater, is made with dissolved organic carbon (DOC) and is slightly acidic like most freshwater systems are. The darker the tea, ie. the more DOC it contains, the more acidic it is, and CO2 and CH4 production will often increase. However many other factors impact the amount of CO2 and CH4 production and emission, such as the damming of a river.
Understanding the flux of these
gases from reservoirs
into the atmosphere [...] is crucial to understanding the impact of hydroelectric
power
on climate change.
FIGURE
The Impact of Dams
What happens to dissolved organic carbon when a river is dammed to produce hydroelectric power? Multiple studies have found that the reservoirs created by dams are hotspots for CH4 effux and that they can even affect the CH4 and CO2 emissions downstream of the dam (Kemenes 2007, Barros 2001, Soumis et al. 2004).
Dams create two environments that bring changes into this process. The reservoir above the dam, and the now altered river below it, which is known as the tailrace. Residence time, or the time it takes for the water that enters a system to exit it, varies drastically in these environments. The reservoir above the dam generally has a high residence time whereas the tailrace, or water immediately below the dam, has a lower residence time. This means that the water in the reservoir circulates for a long period before being fushed at a greater speed downriver (Francisco et al. 2006). Due to greater residence times, reservoirs above dams collect sediments and dissolved organic matter from upstream, which can allow large amounts of dissolved CO2 and CH4 to develop from bacterial respiration (Pacheco et al. 2015).
There are three fates for the gases produced in reservoirs (Figure 2). The frst two are that they directly fux across the surface of the water, either above or below the dam. The fnal option is that they fux into the air as they pass through the turbine of the dam (Barros et al. 2011). The amount of gases that eventually pass into the atmosphere can vary wildly between reservoirs. In a study conducted on 85 hydroelectric reservoirs worldwide, daily emissions ranged from near zero to greater than 2000mg/m2 of CO2 and 500mg/m2 CH4 (Barros et al. 2011).
Recent studies have addressed what factors have led to large differences in gas fuxes. One study looked to answer this question by looking at emissions from a series of reservoirs in the Western US (Soumis et al. 2004). Unfortunately, they were only able to strongly correlate surface pH with an increase in CO2 fuxes. The study was

FIGURE 2 Spatial gas fuxes in reservoirs.
not able to fnd any link between CO2/CH4 emissions and variables such as surface dissolved organic carbon and water temperature (Soumis et al. 2004). Because these reservoirs are located in the temperate climates of the Western US, their rates of greenhouse gas production are much lower than those found in tropical climates (Soumis et al. 2004, Barros et al. 2011). It is possible that stronger correlations between dissolved organic carbon concentrations and gas fuxes could be found in tropical reservoirs.
Due to the high amount of fuxes from the reservoir and turbine into the atmosphere, the tailrace is often unsaturated with CO2. Because of this, CO2 can fux from the atmosphere into the water below the dam (Figure 2). This fnding has yet to be studied in depth and raises many questions. One is how far downstream from a dam the tailrace returns to supersaturation. This process is being studying by the Ecosystem Biogeochemistry Group at the University of Washington with the goal of creating a more accurate carbon budget that can account for fuxes into and out of hydroelectric reservoirs.
Conclusion
Research on greenhouse gas emissions from hydropower reservoirs highlights a critical aspect of freshwater systems and their role in the global carbon cycle. The transition from the Passive Pipe Theory to the Active Pipe Theory has fundamentally changed our understanding of how rivers and reservoirs interact with carbon. By acknowledging the dynamic nature of carbon fux in freshwater systems, we can better appreciate the environmental impact of hydroelectric dams.

PHOTO Grand Coulee Dam in Eastern Washington. Image by Ted McGrath on Flickr.
communityfeatures

PHOTO
The BIG(10) Switch Conference Realignment Will Double Carbon Emissions
Riley Ramirez & Abby Cariño, Environmental Studies ‘24
On August 4th, 2023, the University of Washington (UW) announced their plans to withdraw from the Pacifc-12 athletic conference (Pac-12) and join the Big Ten starting in the 2024 season. The news came over a year after the University of Southern California and the University of California, Los Angeles declared their intentions to join the Big Ten. After UW, the University of Oregon would reveal their departure as well. The conference realignment did not end there. News would continue to break over the following weeks that six of the remaining eight schools in the Pac-12 would also leave for other conferences, including the Big 12 and the Atlantic Coast Conference (ACC).
In the National Collegiate Athletics Association (NCAA), there are over 350 Division I schools across the country. The intention of having different conferences within NCAA Division I was to create regions of play for competing teams. The Pac-12’s predecessor, the Pacifc Coast Conference, was originally created to group teams on the West Coast together, while the Big Ten historically included teams in Midwestern states (USC Trojan Force 2016). The division of these conferences allowed for shorter distances to

be traveled for games and series, creating regional cohesion, competitiveness, and historic rivalries among teams.
However, with the realignment of ten Pac-12 teams to other conferences, the landscape of college sports has completely changed. The Pac-12 will likely cease to exist in the near future if the remaining two teams, Washington State University and Oregon State University, leave for the Mountain West Conference. These decisions will have massive implications that stretch farther than just the programs switching conferences, but also on the teams that have to play them, most notably on travel distances and times. Instead of traveling mainly across the western states, the UW teams and others in the conference will potentially travel from one coast to the other. This additional travel will have powerful implications on climate change and the carbon footprints of college sports.
The University of Washington’s decision to join the Big Ten was primarily driven by fnancial gain. The Big Ten conference offered signifcantly better compensation for UW than remaining in the Pac-12 could guarantee. This switch ensures a more stable and consistent media rights deal, as well as increased screen time exposure for UW teams that could exponentially increase UW Athletics income. As the University of Washington joins the Big Ten, the new media rights deal offers the UW Athletics Program 30 million dollars per year, with an increase of 1 million dollars annually.
Businesses such as UW Athletics aim for proft by increasing overall revenue. In many cases, this can mean that efforts to promote fnancial gain take precedence over community needs. The switch from the Pac-12 to the Big Ten presents ethical and moral concerns for student athletes. In an KNKX/NPR interview released at the same time the switch was announced, sports writer Christian Caple spoke on concerns about student athlete wellbeing. He said that with the impending switch to the Big Ten, student athletes face longer commercial fights and more missed class time (Kendrick 2023).
PHOTO Husky Stadium on October 14th, 2023. Washington vs. Oregon game.

Over the past year, general discussion of the switch has also surfaced through social media. Non-football athletes have pointed out important issues concerning the change. Caple detailed student athletes’ opinions on the move to the Big 10, with comments such as, “Hey, I signed up to play in the Pac-12. I wanted to play on the West Coast. My family wanted me to be on the West Coast. I’m not really too pleased about this move” (Kendrick 2023). With more time spent in the air and away from home, student athletes are given less time to complete school work and pursue their academic degrees. The switch raises questions about what considerations should be given to student athletes, and whether the conference switch had been discussed with the student athlete community before its implementation. There is also the question of where the new infux of money to the UW Athletics Program will be distributed.
Substantial increases in travel distances have led the public to question whether, and if so what, measures are being taken to address the sustainability of the UW Athletics Program. In a “Letter to the Editor’’ in the Seattle Times, Seattle resident Gretchen Hawley writes that “The news that the Huskies are leaving the Pac-12 is disappointing in so many ways,” including how the carbon footprint of increased air mileage has seemingly been unaccounted for in the university’s decision. Hawley emphasizes that this is yet another instance where proft has been chosen over the health
of the planet (Hawley, Seattle Times 2023).
As expressed in Hawley’s letter, joining the Big Ten means increased fight mileage due to the longer distances that student athletes and spectators will have to travel (Figure 1). In a regular season game last year, the longest distance fown by a UW Athletics team was just over 1,500 miles to Tucson, Arizona. However, this mileage will nearly double in the Big Ten regular season, as UW teams will fy nearly 2,900 miles to play in New Brunswick, New Jersey. Travel is a carbon-intensive activity. According to the Environmental Protection Agency, in 2022, “transportation accounted for 29% of total U.S. greenhouse gas emissions, making it the third largest contributor of U.S. greenhouse gas emissions,” while aircrafts contributed to about 9% of those emissions (EPA 2022). This does not account for the air pollution and aircraft-produced contrails that also contribute to climate change (Kärcher 2018).
In order to fully appreciate the environmental repercussions of switching from the Pac-12 to the Big Ten, we calculated the carbon emissions of each trip required by teams during the 2024 football season (Sustainable Travel International). This included both the direct and indirect carbon mileage of the entire schedule, meaning both the fights that the UW football team will take to play away games and also fights that visiting teams will take to Seattle for home games. Our results were staggering.
FIGURE 1 Map of travel distances and locations of the Pac-12 Conference (as of 2023) versus the Big 10 Conference (as of 2024) once the University of Washington, University of Oregon, UCLA, and USC joined.
During the 2024 UW season, Big Ten football teams will travel around 17,312 miles to and from Seattle alone (Figure 2). When calculating the carbon emissions generated by fights for these games, our results showed that approximately 8.11 metric tons of carbon dioxide will be produced. In comparison, the 2023 Pac-12 regular season generated around 4.85 metric tons of travel-related greenhouse gas emissions. This means the switch from the Pac-12 to the Big Ten nearly doubles the carbon emissions generated by a UW football season (Figure 2). Furthermore, over 5,000 miles will be added to the total travel of just the football team for the 2024 season, as compared to the 2023 season.
This is alarming, especially given that these metrics only account for football and do not include the carbon mileage that nineteen other varsity sports teams from the University of Washington will incur. Carbon emissions as a whole warm the planet and destroy unique environmental processes that have been in place for centuries. The university’s increased carbon footprint will be damaging for years to come, leaving us wondering how and if UW will work to offset its extra emissions.
While conference realignment has ignited concern about climate impacts and student athlete welfare, there are also some benefts of the Big Ten switch (Calkins 2023). One pro is that more exposure through the media rights deal will mean better competition for UW Athletics teams. The prestige of being a member of the Big Ten offers student athletes the opportunity to compete at the highest level in college football with potential for the largest payout—a national trophy. However, the cons of
“
The university’s increased carbon footprint will be damaging for years to come, leaving us wondering how and if UW will work to ofset its extra emissions.
“
conference realignment are seemingly dominant in the question of whether the switch is justifed. Between a lack of sustainability, negative climate impacts, and the potential for student athlete mental and physical fatigue, there are extensive negative attributes to monitor as UW joins the Big Ten. Environmental well being should be a priority that is considered when it comes to large carbon-intensive decisions such as this one.
In addition, mitigation efforts for air fight travel are increasingly necessary as global warming continues to trend upward. UW Athletics has an opportunity to consider operational approaches that mitigate its exponentially increased carbon mileage. A NOAA Study from 2020 shows about 3.5% of cumulative climate change is from aviation emissions, emphasizing just how important it is to acknowledge the extent to which UW’s switch to Big Ten may impact the environment (Kiest 2023).
As the switch from the Pac-12 to Big Ten nearly doubles carbon emissions generated by a UW football season, UW Athletics needs to take accountability for detrimentally increasing its carbon footprint. Furthermore,
FIGURE 2 Change in travel distances and carbon emissions between the 2023 Pac-12 UW football regular season schedule and the 2024 Big 10 schedule. (A) Conference realignment will result in substantial increases to travel distances for UW and the teams that play them in Seattle. (B) UW’s direct and indirect carbon emissions will nearly double due to increased travel taken during the regular season games. Note: This chart does not include post-season games. 12 games will be played, including 3 pre-season games and 9 regular season games. Additionally, only air travel was considered within these calculations. There are several other, less relevant sources of carbon emissions that contribute to UW’s carbon footprint.

the department should also prioritize transparency in communicating how its increased revenue will be allocated. Will these funds beneft the University of Washington at large, or merely serve to further infate Athletics’ operations and impacts?
By looking at ways to decrease carbon intensive activities like airplane travel, businesses are doing their part to protect people and the environment.
Switching to the Big Ten raises defnite concerns about UW’s commitment to sustainable, climateconscious practices, all of which can be addressed by UW Athletics reevaluating their critical role in exorbitant carbon-intensive activity.
Politicizing the Gray Wolf
By Abigail Meyers, Environmental Science and Resource Management ‘27 & Brigitte Worstell, Economics and Environmental Studies ‘26

On April 17, 2024, a man in Wyoming used his snowmobile to chase down and disable a gray wolf. Then, he taped the wolf’s mouth shut and paraded the animal around a local bar, taking photos to celebrate the event (Koshmrl 2024). Finally, he killed the wolf. According to news reports, the Wyoming Game and Fish Department fned the man $250. His only crime: possession of a live wild animal.
The history of the gray wolf is complicated, to say the least. By the 1970s, their numbers in the continental United States had plummeted to around 1,000 due to decades of harassment, poisoning, and slaughtering by farmers and
ranchers who considered them a threat to livestock (Milman 2020). The eradication of gray wolves wasn’t solely caused by overhunting; it was also embedded in policy. “Essentially, in the late 1800s and early 1900s, there was a branch of the government that was dedicated to extirpating large carnivores from the contiguous forty-eight,” said University of Washington PhD student Lara Volski. Numerous states even offered cash bounties for hunting and trapping wolves; the public responded by killing thousands. In the time since gray wolves were listed as endangered under the Endangered Species Act (ESA) in 1974, the population has rebounded
PHOTO Gray Wolf. Image from U.S. Fish and Wildlife Service.
somewhat, and it now stands at around 6,000 wolves in the lower 48 states (DOI 2020).
The Endangered Species Act was enacted in 1973 (ESA). Its stated purpose is “to provide a means whereby the ecosystems upon which endangered species and threatened species depend may be conserved” (NOAA). Ultimately, the goal of the ESA is to conserve endangered and threatened species, ensuring their long-term survival in the wild. Species are listed as either “endangered” or “threatened” according to an evaluation of the extent to which the species is at risk of extirpation. An “endangered” species is “any species which is in danger of extinction throughout all or a signifcant portion of its range” and a “threatened” species is “any species which is likely to become an endangered species within the foreseeable future.” Species are listed on a state level and a federal level (NOAA).
In Washington State, wolves are classifed differently under the federal ESA based on their geographical location. They are delisted in the eastern third of the state but remain federally listed in the western two-thirds. However, since they are listed as endangered on a state level, they remain protected in some capacity across the entirety of Washington State (Washington Department of Fish and Wildlife). Because of this, conservation efforts are primarily focused
on sites in Western Washington where gray wolves are struggling to reach stable populations. For instance, while it is illegal to kill a wolf in any part of Washington, if a wolf were to harm livestock in Eastern Washington a person may ask the state to have the wolf removed.
In 2020, the Trump administration decided that the gray wolf population had fully recovered and, as such, delisted them from their “endangered” designation. This led to a huge decline in protections and conservation measures for the species. However, in early 2022 a federal district court reinstated ESA protections for wolves in the lower 48 states. This decision refects concerns raised by conservation groups and scientists regarding the potential impacts of delisting gray wolf populations.
Currently, House Republicans are urging the Biden administration to roll back gray wolf protections, pointing to the species’ growing population size and confict with ranchers and farmers. Cliff Bentz, the Oregon representative leading the GOP coalition, says, “It’s imperative that the U.S. Fish and Wildlife Service promptly act to delist the gray wolf so that those in the western United States who are burdened by the reintroduction of an admittedly recovered apex predator species can protect themselves” (Representative Cliff Bentz, 2024). The rhetoric behind Bentz’s goal of

PHOTO U.S. Department of Agriculture employees unspool turbo fadry for installation on Walton Ranch in Jackson Hole, Wyoming.
empowering people to “protect themselves from an apex predator species” purposefully works against these conservation efforts by exacerbating confict and hostility.
The National Resource Defense Council has seen immense success in their work of increasing support to those who have livestock and are living near wolves. They work with farmers to repair the relationship between humans and wolves and offer them nonlethal tools for protecting their animals, especially in the Northern Rockies. By implementing preventative solutions in Washington, such as proactively setting up a type of temporary electrical fencing called turbo fadry, Wildlife Services can protect both livestock and wolves. Wolves avoid the fence because they are fearful of the motion of the fags and they receive a shock if they eventually become bold enough to approach
and touch the electrifed wire (Hu 2022).

Conservation efforts in Washington State are focused on improving the relationship between wolves and humans. “The biggest threat to wolves is people,” Volski said. Developing practices to reduce the threat wolves pose to humans without causing them any harm is a crucial part of reintroduction.
Once federal endangered species status is removed for gray
“
The biggest threat to wolves is people.
“
wolves, they will be subject to a patchwork of state and local laws. Some new laws seek to encourage and legalize the trapping and killing of wolves. For example, after wolves were delisted in Wisconsin, the frst wolf hunting season resulted in 218 dead wolves, which exceeded the intended hunt limit by 100 wolves and removed 20% of the state’s wolf population in just two days (Kaeding 2024). Moreover, states such as Idaho and Montana have re-implemented bounty systems highly reminiscent of the very systems that drove the species to the brink of extinction (Peacher 2021). These states have established bounties as high as $2,000 per wolf in an attempt to eradicate their wolf population by 90%.
Additionally, climate change is expected to exacerbate the species’ endangerment through habitat fragmentation, extreme temperatures, and increased severity and frequency of natural disasters. The dangers posed by climate change
make the ecological signifcance of wolves even more critical. Gray wolves are a keystone species, meaning they play an essential role in ecosystems. Eradication of a keystone species is incredibly detrimental to the health and stability of an ecosystem. Not only do they control the populations they prey on – often improving the population health of elk, deer, and other prey – but the cascading effects of just one species being killed are remarkable.
A sudden decline in wolf populations can trigger an ecological collapse, as it did in Yellowstone National Park in the 1920s (Hu 2022). Without wolves in Yellowstone, elk populations exploded, resulting in severe overgrazing of willows and aspen, and, subsequently, the disappearance of beavers from the park (Farquhar 2023). Coyotes assumed the role of apex predator, reducing populations of pronghorn antelope, red fox, rodents, and bird populations. Only when wolves were reintroduced to the park was the coyote population placed under control, resulting in all other animal populations thriving once again. If protections are removed from the gray wolf, similar ecological disarray could ensue.
“
“ If protections are removed from the gray wolf . . . ecological disarray could ensue.
The state of the gray wolf has political as well as environmental signifcance. In the face of increased legislative efforts to federally delist species and confict over how to conserve them, strong state and local laws must be enforced in order to protect these species. Without these protections in place the species will suffer irreparable damage, serving as a warning for any species perceived as a threat to humans, livestock, or hunting rights.
PHOTO Gray Wolf. Image from U.S. Fish and Wildlife Service.
The Hidden Price of Climate Change
Climate Disasters and Growing Inaccessibility to Insurance
By Jared McGlothlin,
Atmospheric Science ‘24 & Lucy Allen, Environmental Science and Resource Management ‘25
Natural disasters are nothing new for the United States, and climate change has only worsened the danger. As global temperatures rise, the atmosphere is holding more water vapor, leading to heightened fooding risk from hurricanes and severe rainstorms. Rising sea levels result in devastating storm surges when hurricanes and other storms make landfall on the Gulf and East Coasts. Prolonged drought and drier summers in the Western US have turned forests into tinderboxes. As climate change has steadily increased the severity of wildfres, hurricanes, and fooding over the last two decades, insurance trends have previously been slow to respond. However, in recent years, both private and public insurers have changed how they assess risk; increasing rates
pays their insurance provider a premium, a repeated payment that the company allocates to pay off claims. For better coverage, which is the amount of damage an insurance company will cover with a policy, an individual usually pays a higher premium. Annual premiums for catastrophe insurance are not allowed to increase by more than 18%, as capped by governmental regulations (FEMA 2024). That does not mean anything less than 18% is trivial. Since 2012, the price of premiums have been steadily increasing each year (III). Homeowners across the nation are faced with unsustainable insurance rates, or the looming risk of covering major losses out-of-pocket.
In August 2017, Hurricane Harvey made landfall on the Texas Coast as a category 4 hurricane. Devastating winds and storm surge tore into coastal communities like Rockport and Port Aransas on the barrier islands of the coast. But the worst of the damage occurred later, when the storm slowly moved north, dumping a deluge of water over the Houston metropolitan area for the next three days. The sheer amount of water overwhelmed Houston’s food prevention infrastructure, drowning neighborhoods, highways, and people (Blake et al 2018). and reducing coverage in response to these dangers. Still, the lack of insurability combined with the increased risk of damage has set up a timebomb of lost property value that could be devastating for homeowners across the US.
Most homeowner’s insurance provides coverage for natural events such as hail storms and high winds. For disasters such as earthquakes, forest fres, and fooding, separate catastrophe insurance plans are usually required (FEMA). The individual
“
Offcials are worried that if another storm like Harvey hits, there will not be enough money available to pay out even a fraction of the claims fled.

PHOTO Hurricanes Irma and Jose spin in the Atlantic. Image from NESDIS/NOAA.

The cost of this storm totaled over $125 billion, causing signifcant fnancial solvency problems for the state-run insurance program. Insurance claims following Harvey wiped out over two-thirds of the Texas Windstorm Insurance Association’s reserves, and private insurance companies leaving the state in recent years have massively increased the public insurer’s coverage. Offcials are worried that if another storm like Harvey hits, there will not be enough money available to pay out even a fraction of the claims fled (Frank 2023). Florida and Louisiana are facing similar challenges.
Both states’ last resort public insurers are seeing rapidly growing coverage with fat or declining reserves to support claims (Ryan 2023). All 3 states are also facing increased risks from storm surge due to the low elevation of their coastal plains. Louisiana in particular suffers from both sea level rise and land subsidence, while the overdevelopment of swamps in Florida has eliminated tidal buffers that slow the surge of water inland. Many of these threats are not likely to disappear soon and could intensify over time as Florida and Texas continue to grow in population.
Flooding has increased in frequency and magnitude across the nation, while simultaneously, the US population and demands for housing are growing. The convergence of these two trends is very dangerous when climate disasters destroy homes. In July of 2022, St. Louis resident Steve Gibson woke up to a frantic call from his neighbor. Mr. Gibson’s car was foating down the street. Upwards of 9 inches of rain fell over St. Louis in one night, surpassing any previous 24-hour rainfall record and
the 7.31-inch average this Midwestern city sees during July and August combined (Berger 2022). Sudden foods will continue to be the new normal across the country. Research suggests foods will become “fashier”, meaning their intensity will increase, but their duration will shorten. Flashier foods lead to more damage and less time to mitigate the situation. Mr. Gibson canceled his food insurance long before the food in 2022, so he could save money to support his wife through cancer treatment. In the 25 years he and his family have lived in St. Louis, they have never experienced water damage. Now, they have lost countless family treasures and their home has endured an insurmountable amount of damage (Berger 2022). Losses from storms and foods are becoming more common and yet, the coverage needed to support people in times of these climate disasters is proving harder to obtain.
In late August of last year, a spark from a security light on a power pole started one of the most destructive fres of the summer in Washington (Epperly 2024). The Gray fre started near Medical Lake, WA, and quickly consumed the surrounding communities. Hot and dry weather combined with strong winds allowed the fre to rapidly grow to almost 10,000 acres over less than 24 hours (WA DNR 2023). The fre ended up burning 240 homes southwest of Spokane. This disaster in particular highlighted some of the human factors that are contributing to fres becoming more dangerous. The expansion of the wildland-urban interface has increased the

PHOTO An overturned boat found half a mile from the shore in Port Aransas following the landfall of Hurricane Harvey. Photo by Jared McGlothlin.
PHOTO Victims of a food in Coralville, IA. Photo by Don Becker, USGS.
number of human frestarts and human exposure to wildfres (Radeloff 2023). The full impact of this expansion has not been felt in past decades due to effective suppression work by frefghting agencies. However, suppression tactics and climate change-induced drought have turned many forests in the Western US into massive areas of ready-to-burn fuel. Insurers have recognized this reality before the general public. Many homeowners near Leavenworth WA have been notifed that their home insurance plans will not be renewed, even in cases where they have not fled claims or
Complex risk model reevaluations have placed many mountain communities at elevated threat of wildfre damage, leaving over a ffth of Washington homes in moderate or greater fre danger.
seen signifcant damage (Moss 2023). Complex risk model reevaluations have placed many mountain communities at elevated threat of wildfre damage, leaving over a ffth of Washington homes in moderate or greater fre danger. A growing number of communities in Washington are having to choose between unaffordable last resort insurance programs and forgoing insurance altogether.
Fires and rainstorms will only continue to worsen in intensity, which raises the question of how high insurance rates are destined to increase. Families across America are canceling their unaffordable insurance plans and switching over to cheaper options with less coverage, or going without insurance altogether due to the cost. In other cases, companies will not even offer insurance in risky areas, forcing homeowners onto the already overburdened public options. Without meaningful efforts to address climate change at the root of these issues, millions of Americans will be part of a massive loss of property value. These sacrifces should not have to be made. Fortunately, there are many solutions. While fghting climate change would be the most effective path across the board, local climate adaptation programs can help reduce the risk vulnerable communities face. Prompt action in the face of this looming danger is essential to prevent signifcant economic and societal consequences.

PHOTO The Lick Creek Fire burns in the Umatilla National Forest near Clarkston, WA. Image from USFS.
Beyond Land Acknowledgements
The Importance of Indigenous Perspectives on the Environment
By Chelsea Whiting, Environmental Studies
‘25 &
Midori Sylwester,
Economics and Environmental Studies ‘24
Land acknowledgments have gained signifcant attention in the national conversation. The rationale behind them is to remind society of the importance in recognizing Indigenous history and land rights. A land acknowledgment serves as a formal statement recognizing the traditional Indigenous inhabitants of a specifc region. In the context of the United States, understanding Indigenous history is crucial for the general public to grasp the depth of cultural heritage and the ongoing impacts of colonization. Properly recognizing and honoring Indigenous land history can also foster a deeper connection to the environment, encouraging stewardship and sustainable practices that beneft ecosystems and biodiversity. The necessity of more tangible and impactful recognitions that go beyond mere words will be emphasized here, as we confront and challenge the current state of how we address this issue, both within and beyond the University of Washington. We also explore how and why this practice so greatly favors our relationship with the environment. Indigenous land acknowledgements are criticized by some for the lack of genuine impact they exert. While it’s important to draw attention to the heavy injustices and violent history Indigenous communities have faced and continue to face, land acknowledgements are often perceived as superfcial and performative (Ambo and Rocha Beardall 2023). In an interview with NPR, an Indigenous individual expressed, “if I hear a land acknowledgement… what I’m hearing is, ‘There used to be Indians here. But now they’re gone. Isn’t that a shame?’ And I don’t wish to be made to feel that way” (2023). The proposed intention behind these statements is to refect on each individual’s role in perpetuating colonialism, consciously or not (Bell 2020). Questioning whether addressing Indigenous land has truly infuenced non-Indigenous communities’ compliance in colonialism is central to understanding whether these short moments of recognition carry adequate substance. In the aforementioned NPR article, a lecturer utilized a land acknowledgment as a means of providing real resources. She inserted a QR code in her presentation that directed attendees to a fund for an Indigenous garden, pausing during her presentation to invite audience members to take
tangible action (2023). Taking thirty seconds to honor the space being occupied is simple yet often empty of genuine intention; providing material resources in conjunction with land acknowledgements can be most effective in achieving land acknowledgments’ fundamental goal. Thinking critically about how to call on settlers to refect on their role in preventing Indigenous communities from receiving land back, while uplifting and supporting Indigenous communities fnancially, is the critical frst step towards meaningful progress.
Importance of Education and Environmental Action Moving past mere mentions of whose land we are on, we can integrate Indigenous perspectives and practices
FIGURE Map of North America showing Indigenous territories. Image from the Library of Congress, Wikimedia Commons.

into environmental teachings. Indigenous knowledge is deeply rooted in sustainable practices and understanding of ecosystems, offering valuable insights into effective environmental allyship. By empowering Indigenous voices, we not only honor their deep connection to the land, but also have the opportunity to gain wisdom in implementing strategies that promote biodiversity, resilience, and harmony with nature. Indigenous culture emphasizes the value of intergenerational learning, where sustainable practices and ecological values are taught to younger generations (Nadasdy 2005). Including Indigenous communities in the spaces where curriculums, policy, and economic decisions are being made can allow for this transfer of knowledge to manifest in the public eye, creating an increasingly environmentally conscious community. This integration goes beyond symbolic gestures like land callouts; it actively engages Indigenous communities in decision-making processes and fosters mutual learning.
Paving the way for more inclusive and impactful environmental action is crucial. After interviewing multiple members of faculty at the University of Washington, the consensus was that there is “absolutely room to improve” the current state of Indigenous rights and land education. Julian Olden, professor at the School of Aquatic and Fishery Sciences, feels positively about the increasing prevalence of land acknowledgements on campus, but hopes they are “more thoughtfully articulated commitments by academic units to respect and honor the Indigenous Peoples of the land on which we work.” Land acknowledgments serve as a good starting point for implementing Indigenous practices and knowledge. To better respect the historical and ongoing connections Indigenous peoples have with the land, more resources need to be promoted in order to foster meaningful collaboration within the environmental sector. Promptly starting this integration process is essential for creating real change and ultimately achieving the goals land acknowledgments seek to fulfll.
Considering how the environment has gained traction in a variety of disciplines can stand as a model for integration of Indigenous culture, knowledge, and history into curriculums in all academic subjects. The Program on the Environment at the University of Washington has begun to incorporate Indigenous knowledge and experience in teachings. Classes like ENVIR 460 call on students to meaningfully refect and discuss the role of Indigenous knowledge and history in defning ambiguous concepts like “nature” or “wilderness”. Encouraging these types of steps to continue at the University of Washington and other higher education institutions can be the catalyst for larger change to take place. Ambo and Rocha Beardall (2023) investigated the effectiveness of land acknowledgements at universities, where they determined their results challenge these institutions to address the “social and historical context [of their relationships] with dispossessed Indigenous nations, and offer material campus resources to Indigenous students and tribal nations associated with the institution”. As teachings focused on Indigenous experience become
more comprehensive with time, Indigenous representation in vital discussions must also increase. In conjunction with integrating Indigenous perspectives and knowledge into environmental education efforts, providing educational and fnancial resources for adjacent communities is imperative to advancing the impact of land acknowledgements.
Organizations such as Real Rent Duwamish empower Indigenous communities by supporting their land rights and preserving their cultural knowledge. We must ensure that the efforts of organizations making substantial differences like this are widely recognized and supported. To enhance engagement and educational outreach, it is vital to integrate modern technology into these initiatives. Presentations or materials that utilize land acknowledgements as a predecessor to content can trade performative words for tangible action by directing the audience and readers to resources associated with Indigenous communities. By placing QR codes in educational materials and community spaces, students and the public can easily access detailed information, opportunities to fnancially support them, and other resources related to Indigenous history and contemporary issues. Encouraging students to take the time to scan these codes not only fosters a deeper understanding and appreciation of Indigenous cultures. This approach bridges the gap between traditional knowledge and digital accessibility, creating a more informed and inclusive society.
Moving forward, it is vital to hold professors, students, speakers, and institutions accountable for meaningful land acknowledgments that go beyond mere lip service. Recognizing the importance of Indigenous communities extends past the present; it is about recognizing their historical contributions to environmental stewardship. It is about integrating their knowledge and practice into environmental solutions; it is about welcoming Indigenous communities a seat at every table, while simultaneously amplifying their voices. More than enough damage has been done to Indigenous communities; let us attempt to rectify this harm by improving the way we tangibly address their land, culture, and sovereignty. By challenging our university and institutions to make land acknowledgments worthy through actionable steps and genuine engagement, we hope for a future with a more inclusive, respectful, and impactful approach to environmental initiatives that beneft all.


Real Rent Duwamish:
https://duwamishtribe.networkforgood. com/projects/35157-real-rent-duwamish
UW Center for American Indian & Indigenous Studies: https://caiis.uw.edu/
The Weaponization of the Environment in the RussoUkrainian War
Claudia Stile, Marine Biology
‘27
& Julian Gonzales, Environmental Studies ‘24
As war persists throughout the world, the way people interact with each other and the ecosystems around them change. Perhaps unsurprisingly, the environment is quickly forgotten during times of war, leaving ecosystems decimated, destabilized, and unprotected. War utilizes the environment through the destruction of the natural environment by deliberate or negligent human action, which is often referred to as an ecocide (Killean, 2022). Nature has been weaponized in war through the use of the physical environment and destruction of natural resources, resulting in devastating harm to land, human life, resources, and ecosystem health.
One only has to look at the ongoing Russo-Ukrainian War to get a glimpse into the potential long-lasting environmental degradation caused by large-scale confict. Infrastructure is one of the essential resources targeted by war opponents because it impacts livelihoods and resource availability. According to the Kyiv School of Economics, the Russo-Ukrainian War has resulted in an estimated $147.5
over $1.3 billion in damages as 4.3 cubic miles of water was released (LittleJohn et al. 2023; Marsi and Mirovalev, 2023). The impact on the environment consists of washed away vegetation, eroded river banks, contaminated runoff going into various water bodies, polluted sediment and groundwater, the alteration of natural biogeochemical processes, wastewater spread into surrounding areas, as well as a release of 150 tons of heavy oil into the environment (Shumilova el al. 2023). These environmental impacts will be long-lasting, impacting Ukraine’s “breadbasket” agricultural industry for decades into the future.
In times of crisis, when resources for survival are under threat, gaining access to clean, safe water is often compromised. Suppressing access to water can most often be used as a trigger, where the control of access to water leads to overall violence (Glelick et al. 2023). Targeted attacks on water infrastructure have been carried out repeatedly throughout Ukraine. The country’s water infrastructure and landscape revolves around many reservoirs, canals, and pipelines to direct water to industry, agriculture, and communities. Many of these tactics have been successful in restricting access to water, with over 64 related water casualties and more extreme events like the explosion that blasted apart Kakhovka Dam in Ukraine (Glanz et al. 2023). This caused a massive food that killed 58 people and had extensive destructive impacts on the surrounding landscape as well as cut off water to many farmlands.
Dismantling the power grid of the invaded country is a common strategy during times of war. In the case of Ukraine, a nation involved in the global effort to switch to renewable energy, Russia destroyed many of their renewable energy sources. In doing this, there has been a larger accumulation of harmful particulate matter in the atmosphere. Additionally, as war displaces jobs, nearly 50% of solar stations and 75% of wind stations in Ukraine have become decommissioned. Advancing renewable energy is certainly not a priority during war; however, this will certainly lead to greater production of carbon and carbon related gasses in the future. Within a year after the outbreak of the Russo-Ukrainian War, it is estimated that 22 million tons of carbon dioxide equivalent gasses were released billion in damages to Ukraine’s infrastructure (Hryhorczuk et al. 2024). Without proper infrastructure, local communities become dismantled as jobs and schooling are halted, industry and agriculture are restricted, illness persists without healthcare, as well as countless further social issues.
The destruction of the Nova Kakhovka Dam in Ukraine acts as a blatant example of an ecocide. As a critical aspect of the Ukrainian economy, the dam provides power, irrigation, and river navigation to more than 1 million people within the region. Its destruction has totaled
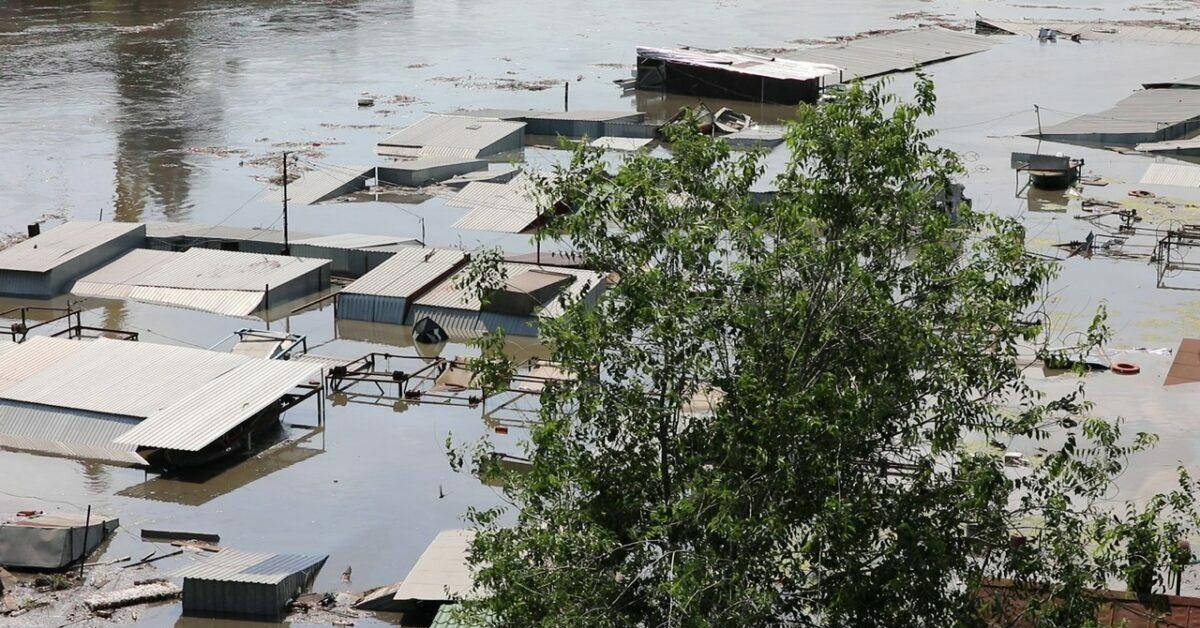
PHOTO Flooding in Kherson after the destruction of the Kakhovka Dam in 2023. Image from Wikimedia Commons.
from military activities, along with an additional 18 million tons from war-related fres in Ukraine alone (Hryhorczuk et al., 2024). Wartime efforts contribute to increasing CO2 and other harmful chemical emissions through smoke from bombs, particles from explosions, building destruction, fres, fuel, and more.

War involves the use of weapons and machinery, leading to signifcant damage due to military activities across the war-torn landscapes (Hryhorczuk et al., 2024). Military bases may be located on sensitive environmental lands, as these areas are typically distant from more urbanized areas. Natural preserves act as a prime landscape for machinery and weapons to be both built and tested.
More than 80% of the world’s conficts occur within biodiversity hotspots. These places support countless species, but with the interruption of war into these regions, species can be threatened (Anthes, 2022). Additionally, the process of forming a military base can lead to signifcant ecological harm, as invasive species can make their way into containers and packing materials, which are then transported globally (Santini et al. 2023). As these resources arrive at military bases, invasive species are released into new territories, many of which are previously protected lands. Native species can be signifcantly impacted by the war-time arrival of invasive species. The illegal poaching of species and the intent to destroy the biodiversity of resources further causes populations to decline. Considering that the rural regions of Ukraine host over 35% of Europe’s biodiversity, the potential for catastrophic species loss is signifcant (World Wide Fund For Nature, 2022).
Nature is commonly weaponized to help assist in war efforts. The act of digging trenches, burying mines, and building forts all greatly alter natural landscapes. Another use, “defensive wilding,” is the process of planting vegetation to hide from enemy combatants (CEOB, 2024). Shelling, chemicals, as well as materials left behind, additionally
have considerable effects on the environment. War methods such as the scorched Earth policy, or purposeful destruction of resources for proft, also cause immense harm. The World Wildlife Fund reports that over 1.2 million hectares of protected area in Ukraine have been affected by these war tactics (World Wide Fund For Nature, 2022). Through particular methods of war, the weapons involved, and the use of nature itself to fght, there is no way to avoid devastating ecosystems.
“
“ Through particular methods of war, the weapons involved, and the use of nature itself to fght, there is no way to avoid devastating ecosystems.
The responsibility of maintaining connections between individuals and the environment falls on the country in which the specifc ecosystem inhibits. Yet, if particular methods of war are utilized and the environment is involved or drastically affected, should it be a criminal offense? If the environmental costs of war are weighted as a war crime, who would decide–the UN? Even if there are regulations placed on war contributions to the environment, how would this be enforced, especially with countries who have not prioritized climate mitigation? In the case of Russia and Ukraine, as the war is far from over, the totality of the environmental impacts are yet unknown.

PHOTO Smoke rises from Odesa, Ukraine, after shelling. Image by Petros Giannakouris.
PHOTO War materials polluting the landscape. Image by Zohra Bensemra.
Navigating Mount Rainier’s Popularity
Investigating TimedEntry Reservations in the National Park Service
By Claire Farber, Environmental Studies ‘26 & Lauren Grady, Marine Biology ‘25
Nature is in high demand. Since 2017, United States National Parks have seen 1.8 billion visits, with a recordbreaking 1.67 million people pouring into Mount Rainier National Park in the summer of 2023 (Miller et al. 2023, National Park Service 2024). In response to this infux of nature lovers to Mt. Rainier, the park established a timedentry reservation system for two popular areas this summer: the Nisqually to Paradise Corridor and Sunrise Road. The National Park Service (NPS) cites visitor experience and ecosystem conservation as the two primary reasons for this decision, as overcrowded trails, litter, and road traffc have
permit program for its most popular hike, Angel’s Landing (Pennington 2024). Many argue that these timedentry and reservation systems have proved successful in improving visitor satisfaction and reducing overcrowding. Cadillac Mountain in Acadia National Park, for example, has a limited number of parking spots at the summit. The implementation of a reservation system has alleviated congestion, allowing visitors to view the sunrise at this peak without stressing about parking (Pennington 2024). In Arches, visitors reported improvements in all aspects of park visitation, including crowding, safety, protection of historic and cultural areas, and visitor attitudes (Miller et al. 2023).
Similar successes are expected in Mt. Rainier with its new timed-entry system. At the Sunrise Road and Nisqually entrances, wait times to enter the park can last up to three hours, causing major traffc congestion, impeding local access to driveways, and limiting emergency vehicles (National Park Service 2024). Within the park, unregulated entry has led to overcrowding on popular hiking trails. To avoid the crowds, hikers will oftentimes venture off the beaten path, trampling meadows and increasing the potential for human-wildlife conficts in the process (Lewis et al. 2021, National Park Service 2024).
One primary issue with implementing timed-entry in national parks lies in its perpetuation of preexisting socioeconomic inequities regarding access to nature. Acquiring a reservation is no small feat. The vast majority of tickets for Mt. Rainier are released online 90 days prior all plagued the park as visitor numbers have increased (National Park Service 2024).
Despite being new to Mt. Rainier, timed-entry access has existed in other national parks for years. Arches and Rocky Mountain currently use a timed-entry system. Rocky Mountain, the fourth-most visited U.S. national park, initiated timed-entry in response to the COVID-19 pandemic and a 129% increase in visitors from 2012 to 2019 (Patterson 2021, Creany et al. 2024). Other parks like Acadia, Haleakala, and Glacier mandate vehicle reservations for popular roads and viewpoints. Shenandoah and Great Smoky Mountains now require day-use tickets and parking tags, respectively. One park, Zion, began a lottery

PHOTO Crowds at the beginning of the Skyline Trail. Photo by Joe Mabel.

to the date of entry, a practice that is diffcult for those with full-time jobs, families, or others that may have challenges planning so far in advance. To secure their slot, aspiring park-goers must huddle around their laptops at 8am PST, refreshing the Recreation.gov tab in hopes of an opening. This entirely-online process itself disadvantages those without easy access to a computer or mobile device, highspeed internet, and an understanding of how to navigate the website – which, additionally, is currently only available in English (Kwak-Hefferan 2023). Requiring park-goers to plan three months out, coupled with the potentially stressful nature of the reservation system, is often enough to deter prospective visitors from attempting to secure a spot, particularly those without the socioeconomic means to comfortably navigate the process.
If a timed-entry reservation system is considered the long-term solution to managing overcrowding in Mount Rainier National Park, then the system should adapt to accommodate for inequities. The Rocky Mountain reservation system’s design acts as a model for promoting equal accessibility. Acknowledging the disadvantages of online reservations, Rocky Mountain allots a large amount of tickets to be sold by retailers in northern Colorado. This decision boosts the local economy while simultaneously reducing the monopoly Recreation.gov has on the timed-entry reservation process. Furthermore, the park signifcantly increased the amount of day-before reservations available online, providing opportunities for those who cannot afford to plan a trip three months in advance. Despite these benefcial accommodations, the question of how to reduce the reservation system’s daunting nature and increase the likelihood of securing a spot remains unanswered throughout NPS.
Alternatively, the solution to Mt. Rainier’s problem may not lie in a timedentry reservation system at all, but rather in its need for refurbishment – both in terms of its infrastructure and management. Investing in the revamping of other park entry points could reduce foot-traffc at Sunrise Road and Nisqually, potentially removing the need for a reservation system altogether. One such entrance is Carbon River, located in the northwest corner of the park. Attracting visitors to this zone would require reestablishing a road from the entrance to the Ipsut Creek campground along the Carbon River; otherwise, the gate lacks shorter day hike accessibility to a view of Mt. Rainier itself, acting as an immense deterrent for use of the area. (Note: Mountain views are accessible from Mowich Lake, which is accessed at a fork in the road to Carbon; however, this area is only open for a few months in summer and experiences overcrowding due to limited parking). Unfortunately, this solution is highly unlikely, as it requires taking on the Wilderness Act and asking for federal permission to construct a new road in wilderness. Another faw in the park’s current design is its limited number of campsites relative to its size and popularity. Despite covering a quarter of a million acres, Mt. Rainier only has three drive-in campgrounds with 450 sites in total (National Park Service 2023). This disproportionate lack of camping opportunity has largely made Mt. Rainier a “day park,” with visitors staying nearby and re-entering through the gates each morning. Investing in campsites would increase opportunities for overnight access and reduce the need for daily re-entry, decreasing both gate traffc and emissions from individual vehicles. Another commonly proposed solution to the timed-entry conundrum is to implement a public transit system into Mt. Rainier. Crystal Mountain, just northeast of the park, has a preexisting shuttle system that brings in visitors from Enumclaw to Crystal in the winter, and even offers a ride from Crystal to Rainier via the Sunrise entrance in summer (Crystal Mountain 2024). There are plans to expand the winter shuttle system to both Tacoma and Seattle, reducing the need for personal vehicles exponentially. Collaboration between Crystal Mountain and Mt. Rainier could offer a solution to the gate traffc problem.
PHOTO Cars in line at Stevens Canyon entrance. Image from Wikimedia Commons.
The shuttles could operate for Mt. Rainier in the summer and Crystal Mountain in the winter, thus reducing traffc and emissions and expanding access to Mt. Rainier for individuals without personal vehicles.
As climate change continues, outdoor recreational activities are expected to shift north to higher latitudes, meaning that Mt. Rainier’s popularity will only continue to increase (Monz et al. 2020). Wildfre frequency in the Pacifc Northwest (PNW) is also projected to increase with climate change. Despite decreased air quality from wildfres, visitation to PNW national parks remains stable. These conditions pose danger not just to park visitors, but to the environment as well, as diminished air quality is compounded by vehicle exhaust emissions (Brown et al. 2024). Limiting human disturbance is necessary to mitigate environmental impacts, but may interfere with visitor satisfaction and preserving access to nature. Numerous national parks have settled on timed-entry as the solution to these problems, and the same could be true for Mt.
Rainier. However, only integrating a timed-entry system may not prove to be a suffcient solution to the management challenges Mt. Rainier is facing.The park is also plagued by complex infrastructure issues and accessibility limitations, furthering socioeconomic inequities. For Mt. Rainier’s timed-entry system to succeed, the park must also account for these challenges and invest in amending them, acknowledging that there is no simple solution to the multidimensional questions surrounding park management.
“ “
There is no simple solution to the multidimensional questions surrounding park management.

PHOTO Start of the Skyline Trail. Photo by Jasperdo on Flickr.
EVOLUTION OF BENTHIC ECOSYSTEM STRUCTURES BY ATTICUS
CARTER
Replit repository: https://replit.com/@Atticus-Bradley?path=folder/ESS%20450
Alroy, J., Marshall, C. R., Bambach, R. K., Bezusko, K., Foote, M., Fursich, F. T., Hansen, T. A., Holland, S. M., Ivany, L. C., Jablonski, D., Jacobs, D. K., Jones, D. C., Kosnik, M. A., Lidgard, S., Low, S., Miller, A. I., Novack-Gottshall, P. M., Olszewski, T. D., Patzkowsky, M. E., Raup, D. M., ... Webber, A. 2001. Effects of sampling standardization on estimates of Phanerozoic marine diversifcation. Proceedings of the National Academy of Sciences of the United States of America. 98(11): 6261–6266. https://doi.org/10.1073/pnas.111144698
Ausich, W. I., and Bottjer, D. J. 1991. History of tiering among suspension feeders in the benthic marine ecosystem. Journal of Geological Education. 39(4): 313-319. Bottjer, D. J., and Ausich, W. I. 1986. Phanerozoic development of tiering in soft substrata suspension-feeding communities. Paleobiology. 12(4): 400-420. https://doi.org/10.1017/S0094837300003134
Bromley, R. G., and Ekdale, A. A. 1986. Composite ichnofabrics and tiering of burrows. Geological Magazine. 123(1): 59–65. doi:10.1017/S0016756800026534
Buatois, L. A., and Mángano, M. G. 2003. Sedimentary facies and ichnology of the Mesón Group (Cambrian–Ordovician) in northwest Argentina: A compound estuary-paralic complex in the early evolution of the Puna Basin. Gondwana Research. 6(4): 785-801.
Cheung, W., Lam, V., Sarmiento, J., Kearney, K., Watson, R., and Pauly, D. 2009. Projecting global marine biodiversity impacts under climate change scenarios. Fish and Fisheries. 10: 235-251. https://doi.org/10.1111/J.14672979.2008.00315.X.
Clapham, M., and Narbonne, G. 2002. Ediacaran epifaunal tiering. Nature. 415: 10151018.
Clapham, M. E., and Bottjer, D. J. 2007. Late Triassic and Early Jurassic extinction events. The Paleontological Society Papers. 13: 33-52.
Cohen, K. M., Finney, S. C., Gibbard, P. L., and Fan, J.-X. 2013. The ICS International Chronostratigraphic Chart. Episodes. 36(3): 199-204.
Droser, M. L., Hughes, N. C., and Jell, P. A. 1994. The ordovician trilobite genus Opipeuter: Systematics and evolutionary relationships. Journal of Paleontology 68(4): 815-826.
Harper, E. M. 2006. Dissecting post-Paleozoic arms races. Palaeogeography, Palaeoclimatology, Palaeoecology. 232(2-4): 294-321.
Hautmann, M., Bucher, H., Brühwiler, T., and Goudemand, N. 2015. The frst evolutionary stasis of the Mesozoic Marine Revolution: Conch morphology, muscle scars and mode of life of Upper Triassic rhynchonelliform brachiopods. Journal of Systematic Palaeontology. 13(7): 551-596.
Kennett, J., and Stott, L. 1991. Abrupt deep-sea warming, palaeoceanographic changes and benthic extinctions at the end of the Palaeocene. Nature. 353: 225229. https://doi.org/10.1038/353225A0.
Lowery, C., Bown, P., Fraass, A., and Hull, P. 2020. Ecological response of plankton to environmental change: Thresholds for extinction. Annual Review of Earth and Planetary Sciences https://doi.org/10.1146/annurev-earth-081619-052818.
Marshall, C. R. 2020. A simple method for bracketing global extinction events in time. Proceedings of the National Academy of Sciences. 117(39): 23934-23943.
Peters, S., and Heim, N. 2010. The geological completeness of paleontological sampling in North America. Paleobiology. 36: 61-79. https://doi. org/10.2307/25609444
Peters, S., and McClennen, M. 2015. The Paleobiology Database application programming interface. Paleobiology. 1: 1-7. https://doi.org/10.1017/ pab.2015.39
Poulin, R., Closs, G., Lill, A. W. T., Hicks, A., and Herrmann, B. A. 2001. Aquatic parasites shape ecosystem structure: Nestedness and network structure in parasite-host systems. Ecology Letters. 4(6): 599-607.
Reiss, K. C., Jennions, M. D., and Bromham, L. 2015. A unique evolutionary pattern of reverse sexual size dimorphism in shorebirds driven by feeding ecology. Proceedings of the Royal Society B: Biological Sciences. 282(1805): 20151944.
Servais, T., Perrier, V., Danelian, T., and Munnecke, A. 2010. The Ordovician cherty limestone of the Bini-Deri Formation (western North Africa): a new biostratigraphic, palaeoecologic and sedimentologic interpretation. Geological Society, London, Special Publications. 338(1): 175-193.
Signor, P. W., and Vermeij, G. J. 1994. The Mid-Paleozoic precursor to the Mesozoic Marine Revolution. Paleobiology. 20(2): 230-240.
Stanley, S. M. 2008. Predation defeats competition on the seafoor. Paleobiology 34(1): 1–21. http://www.jstor.org/stable/20445572
Underwood, A. J., and Fairweather, P. G. 1989. Supply-side ecology and benthic marine assemblages. Trends in Ecology & Evolution. 4(1): 16-20. https://doi. org/10.1016/0169-5347(89)90008-6
Vermeij, G. J. 1977. The Mesozoic Marine Revolution: Evidence from snails, predators and grazers. Paleobiology. 3(3): 245–258. http://www.jstor.org/stable/2400374
Wetzel, A. (1991). Ecologic interpretation of deep-sea trace fossil communities. Palaeogeography, Palaeoclimatology, Palaeoecology. 85(1): 47-69. https://doi. org/10.1016/0031-0182(91)90025-M
Wood, R. 2010. Reef Evolution. Oxford University Press.
PSILOCYBE DIVERSITY ON UNIVERSITY OF WASHINGTON’S CAMPUS
BY GRAHAM GAIMARI
Bradshaw, A. J., Backman, T. A., Ramírez-Cruz, V., Forrister, D. L., Winter, J. M., Guzmán-Dávalos, L., Furci, G., Stamets, P., and Dentinger, B. T. M. 2022. DNA authentication and chemical analysis of Psilocybe mushrooms reveal widespread misdeterminations in Fungaria and inconsistencies in Metabolites. Applied and Environmental Microbiology. 88(24): e01498-22. https://doi. org/10.1128/aem.01498-22
Bradshaw, A. J., Ramírez-Cruz, V., Awan, A. R., Furci, G., Guzmán-Dávalos, L., and Dentinger, B. T. M. 2024. Phylogenomics of the psychoactive mushroom genus Psilocybe and evolution of the psilocybin biosynthetic gene cluster. Proceedings of the National Academy of Sciences. 121(3): e2311245121. https://doi. org/10.1073/pnas.2311245121
Borovička J., Rockefeller, A., and Werner, P.G. 2012. Psilocybe allenii – a new bluing species from the Pacifc Coast, USA. Czech Mycology. 64(2): 181-195. http:// www.czechmycology.org/_cmo/CM64207.pdf
Borovička J. 2008. The wood-rotting bluing Psilocybe species in Central Europe – an identifcation key. Czech Mycology. 60(2): 173–192. https://typeset.io/pdf/thewood-rotting-bluing-psilocybe-species-in-central-europe.pdf
Borovička J., Noordeloos, M.E., Gryndler, M., and Oborník, M. 2010. Molecular phylogeny of Psilocybe cyanescens complex in Europe, with reference to the position of the secotioid Weraroa novae-zelandiae Mycological Progress. 10: 149-155. https://www.researchgate.net/publication/226231019_Molecular_ phylogeny_of_Psilocybe_cyanescens_complex_in_Europe_with_reference_ to_the_position_of_the_secotioid_Weraroa_novae-zelandiae
Blow, A. 2023. Climate change is infuencing Seattle’s unusual Spring heatwave. The Urbanist https://www.theurbanist.org/2023/05/17/climate-change-isinfuencing-seattles -unusual-spring-heatwave/
Gabay, M. 2013. The Federal Controlled Substances Act: Schedules and pharmacy registration. Hospital Pharmacy. 48(6): 473–474. https://doi. org/202105160217580003
Guzmán, G., Allen, J., and Gartz, J. 1998. A worldwide geographical distribution of the Neurotropic Fungi, an analysis and discussion. Ann Mus Civ Rovereto. 14. Guzmán, G. 2008. Hallucinogenic mushrooms in Mexico: An overview. Econ Bot. 62: 404–412. https://doi.org/10.1007/s12231-008-9033-8
Hofmann, A., Heim, R., Brack, A., Kobel, H., Frey, A., Ott, H., Petrzilka, Th., and Troxler, F. 1959. Psilocybin und Psilocin, zwei psychotrope Wirkstoffe aus mexikanischen Rauschpilzen. Helvetica Chimica Acta. 42(5): 1557–1572. https:// doi.org/10.1002/hlca.19590420518
Nichols, D.E. 2020. Psilocybin: from ancient magic to modern medicine. J Antibiot. 73: 679–686. https://doi.org/10.1038/s41429-020-0311-8
Lopez, M. J., and Tadi, P. 2022. Drug Enforcement Administration Drug Scheduling. In StatPearls. StatPearls Publishing. http://www.ncbi.nlm.nih.gov/books/ NBK557426/
Peha, J. 2021. City Council Affrms Support for Decriminalization of Entheogens. Seattle City Council Blog https://council.seattle.gov/2021/10/04/city-councilaffrms-support-for-decriminalization-of-entheogens/
Schoch, C.L., Seifert, K.A., Huhndorf, S., Robert, V., Spouge, J.L., Levesque, C.A., and Chen, W. 2012. Nuclear ribosomal internal transcribed spacer (ITS) region as a universal DNA barcode marker for Fungi. Proc Natl Acad Sci U S A. 109(16): 62416. https://pubmed.ncbi.nlm.nih.gov/22454494/
Talbott, C. 2023. Psychiatrist to lead state-mandated psilocybin trial: UW Medicine will facilitate a small-scale study to explore the potential beneft of psychedelic mushrooms with psychotherapy. UW Medicine Newsroom https://newsroom. uw.edu/blog/psychiatrist-lead-state-mandated-psilocybin-trial Van Court, R. C., Wiseman, M. S., Meyer, K. W., Ballhorn, D. J., Amses, K. R., Slot, J. C., Dentinger, B. T. M., Garibay-Orijel, R., and Uehling, J. K. 2022. Diversity, biology, and history of psilocybin-containing fungi: Suggestions for research and technological development. Fungal Biology. 126(4): 308–319. https://www. sciencedirect.com/science/article/pii/S1878614622000095?cas
TRACKING INVASIVE LIONFISH MIGRATIONS USING OTOLITH MICROCHEMISTRY
BY ALY LIU
Aguilar Perera, A., and Quijano Puerto, L. 2016. Relations between fsh length to weight, and otolith length and weight, of the lionfsh Pterois volitans in the Parque Nacional Arrecife Alacranes, southern Gulf of Mexico. Revista de Biología Marina y Oceanografía. 51(2): 469–474. https://dialnet.unirioja.es/servlet/ articulo?codigo=5614975
Airey, M. E., Fogg, A. Q., and Drew, J. A. 2023. Invasive lionfsh dispersal between shallow- and deep-water habitats within coastal Floridian waters. Biological Invasions https://doi.org/10.1007/s10530-023-03153-w
Baumgarten, S., Simakov, O., Esherick, L. Y., Liew, Y. J., Lehnert, E. M., Michell, C. T., Li, Y., Hambleton, E. A., Guse, A., Oates, M. E., Gough, J., Weis, V. M., Aranda, M., Pringle, J. R., & Voolstra, C. R. 2015. The genome of Aiptasia, a sea anemone model for coral symbiosis. Proceedings of the National Academy of Sciences 112(38): 11893–11898. https://doi.org/10.1073/pnas.1513318112
Côté, I. M., & Smith, N. S. 2018. The lionfsh Pterois sp. invasion: Has the worst-case scenario come to pass? Journal of Fish Biology. 92(3): 660–689. https://doi. org/10.1111/jfb.13544
Dahl, K. A., Edwards, M. A., and Iii, W. F. P. 2019. Density-dependent condition and growth of invasive lionfsh in the northern Gulf of Mexico. Marine Ecology Progress Series. 623: 145–159. https://doi.org/10.3354/meps13028
Eddy, C., Pitt, J., Oliveira, K., Morris, J. A., Potts, J., and Bernal, D. 2019. The life history characteristics of invasive lionfsh (Pterois volitans and P. miles) in Bermuda. Environmental Biology of Fishes. 102(6): 887–900. https://doi. org/10.1007/s10641-019-00877-4
Edwards, M. A., Frazer, T. K., and Jacoby, C. A. 2014. Age and growth of invasive lionfsh (Pterois spp.) in the Caribbean Sea, with implications for management. Bulletin of Marine Science. 90(4): 953–966. https://doi.org/10.5343/ bms.2014.1022
Gallardo, B. Clavero, M., Sánchez, M. I., and Vilà, M. 2015. Global ecological impacts of invasive species in aquatic ecosystems. Global Change Biology. 22(1): 151-163. https://doi.org/10.1111/gcb.13004
Gardner, P. G., Frazer, T. K., Jacoby, C. A., and Yanong, R. P. E. 2015. Reproductive biology of invasive lionfsh (Pterois spp.). Frontiers in Marine Science. 2. https:// www.frontiersin.org/articles/10.3389/fmars.2015.00007
Harris, H. E., Fogg, A. Q., Gittings, S. R., Ahrens, R. N. M., Allen, M. S. 2020. Testing the effcacy of lionfsh traps in the northern Gulf of Mexico. PLOS ONE. 15(8).
Helser, T., Kastelle, C., Crowell, A., Ushikubo, T., Orland, I. J., Kozdon, R., and Valley, J. W. 2018. A 200-year archaeozoological record of Pacifc cod (Gadus macrocephalus) life history as revealed through ion microprobe oxygen isotope ratios in otoliths. Journal of Archaeological Science: Reports. 21: 1236–1246. https://doi.org/10.1016/j.jasrep.2017.06.037
Jud, Z. R., Nichols, P. K., & Layman, C. A. 2015. Broad salinity tolerance in the invasive lionfsh Pterois spp. May facilitate estuarine colonization. Environmental Biology of Fishes. 98(1): 135–143. https://doi.org/10.1007/s10641-014-0242-y
Lin, H.-Y., Shiao, J.-C., Chen, Y.-G., and Iizuka, Y. 2012. Ontogenetic vertical migration of grenadiers revealed by otolith microstructures and stable isotopic composition. Deep Sea Research Part I: Oceanographic Research Papers. 61: 123–130. https://doi.org/10.1016/j.dsr.2011.12.005
Lionfsh Invasion. (n.d.). In NOVA Ocean Invaders
Martino, J. C., Doubleday, Z. A., Chung, M.-T., and Gillanders, B. M. 2020. Experimental support towards a metabolic proxy in fsh using otolith carbon isotopes. Journal of Experimental Biology. 223(6): jeb217091. https://doi. org/10.1242/jeb.217091
Morissette, O., and Whitledge, G. W. 2022. Listening with the invasive fsh ear: Applications and innovations of otolith chemistry analysis in invasive fsh biology. Environmental Biology of Fishes. 105(2): 327–343. https://doi. org/10.1007/s10641-022-01217-9
Morris, J. A., Jr. 2009. The biology and ecology of the invasive Indo-Pacifc lionfsh— ProQuest. https://www.proquest.com/openview/01363dce696af4a57552a3191 ff2c20a/1?pq-origsite=gscholar&cbl=18750
Savva, I., Chartosia, N., Antoniou, C., Kleitou, P., Georgiou, A., Stern, N., Hadjioannou, L., Jimenez, C., Andreou, V., Hall-Spencer, J. M., and Kletou, D. 2020. They are here to stay: The biology and ecology of lionfsh (Pterois miles) in the Mediterranean Sea. Journal of Fish Biology. 97(1): 148–162. https://doi. org/10.1111/jfb.14340
Tornabene, L., and Baldwin, C. C. 2017. A new mesophotic goby, Palatogobius incendius (Teleostei: Gobiidae), and the frst record of invasive lionfsh preying on undescribed biodiversity. PLOS ONE. 12(5): e0177179. https://doi. org/10.1371/journal.pone.0177179
von Leesen, G., Bardarson, H., Halldórsson, S. A., Whitehouse, M. J., and Campana, S. E. 2021. Accuracy of otolith oxygen isotope records analyzed by SIMS as an index of temperature exposure of wild Icelandic cod (Gadus morhua). Frontiers in Marine Science. 8: 698908. https://www.frontiersin.org/articles/10.3389/ fmars.2021.698908/full
FARMING IN THE DESERT
BY MIRANDA O’HERRON
Barron-Gafford, G. A., Sanchez-Cañete, E. P., Minor, R. L., Hendryx, S. M., Lee, E., Sutter, L. F., Tran, N., Parra, E., Colella, T., and Murphy, P. C. 2017. Impacts of hydraulic redistribution on grass–tree competition vs facilitation in a semi-arid savanna. New Phytologist Foundation. 216(3): 825–838.
Cardinale, B.J., Wright, J.P., Cadotte, M.W., Carroll, I.T., Hector, A., Srivastava, D.S., Loreau, M., and Weis, J.J.. 2007. Impacts of plant diversity on biomass production increase through time because of species complementarity. Proceedings of the National Academy of Sciences. 104(46): 18123–18128.
Gairola, S. U., Bahuguna, R., and Bhatt, S. S. 2023. Native Plant Species: a Tool for Restoration of Mined Lands. Journal of Soil Science and Plant Nutrition. 23(2): 1438–1448.
Gatzke, H. 2012. Selecting Vegetable Crops for Small-Scale Desert Production. University of Nevada Cooperative Extension Hall, L. 2023, Oct 26. Food Insecurity Increased in 2022, With Severe Impact on Households With Children and Ongoing Racial Inequities. Center on Budget and Policy Priorities https://www.cbpp.org/blog/food-insecurity-increased-in-2022with-severe-impact-on-households-with-children-and-ongoing Hansen, N. 2024, Jan. 24. Interview. Conducted by Miranda O’Herron. Klavinski, R. 2013, Apr 13. 7 benefts of eating local foods. MSU Extension https:// www.canr.msu.edu/news/7_benefts_of_eating_local_foods
McNulty, A. 2022, Jan. 21. Native agriculture never went away. Now it is on the rise. & the West. Stanford University https://andthewest.stanford.edu/2022/nativeagriculture-never-went-away-now-it-is-on-the-rise/
Melash, A.A., Bogale, A.A., Migbaru, A.T., Chakilu, G.G., Percze, A., Ábrahám, É.B., and Mengistu, D.K. 2023. Indigenous agricultural knowledge: A neglected human based resource for sustainable crop protection and production. Heliyon. 9(1). Northeastern State University. 2024. Three Sisters Legend. Northeastern State University. https://nsuok.edu/heritage/three-sisters-legend.aspx
O’Callaghan, A., and McKie, P. 2004. Creating an Organic Garden In Southern Nevada. UNR Extension. 1-4.
Ólafsson, B. 2023, Sep 27. What Monoculture Farming Is, and Why It Matters. Sentient Media https://sentientmedia.org/monoculture/#:~:text=By%20some%20 estimates%2C%20monoculture%20felds
Popescu Slavikova, S. 2019, Jun. 16. Pros and Cons of Monoculture Farming. Greentumble https://web.archive.org/web/20210521100534/https:// greentumble.com/advantages-and-disadvantages-of-monoculture-farming/ Randell, H., Gray, C., and Shayo, E.H. 2022. Climatic conditions and household food security: Evidence from Tanzania. Science Direct. 112: 102362.
Ruben, M. 2024, Feb. 12. Interview. Conducted by Miranda O’Herron. Sinclair, D., 2020. Food Deserts of Las Vegas: An Overview with a Vertical Solution. Journal of the West. 59(4): 80–93.
Sumane, S., Kunda, I., Knickel, K., Strauss, A., and Tisenkopfs, T. 2018. Local and farmers’ knowledge matters! How integrating informal and formal knowledge enhances sustainable and resilient agriculture. Science Direct. 59: 232-241. Toledo Lake Erie. 2020, Sep 4. Native Plants & and Water. Clear Choices Clean Water https://toledolakeerie.clearchoicescleanwater.org/pledges/native-plants-andpollinators/plant-1/
U.S. National Park Service. 2022, Nov 16. Plant Adaptations. National Park Service. https://www.nps.gov/teachers/classrooms/plant-adaptations. htm#:~:text=Desert%20plants%20are%20adapted%20to.
QUANTIFYING THESE DAM EMISSIONS! BY ETHAN BOUVET
Abril, G, et al. 2005. Carbon dioxide and methane emissions and the carbon budget of a 10-year old tropical reservoir (Petit Saut, French Guiana). Global Biogeochemical Cycles. 194.
Barros, N, et al. 2011. Carbon emission from hydroelectric reservoirs linked to reservoir age and latitude. Nature Geoscience. 4(9): 593-596.
Cole, J.J. et al. 1994. Carbon dioxide supersaturation in the surface waters of lakes. Science. 265: 1568-1570. DOI:10.1126/science.265.5178.1568
Cole, J.J., Prairie, Y.T., Caraco, N.F. et al. 2007. Plumbing the global carbon cycle: Integrating inland waters into the terrestrial carbon budget. Ecosystems. 10: 172–185. https://doi.org/10.1007/s10021-006-9013-8
Francisco R., Moreno-Ostos E., and Armengol, J. 2006. The residence time of river water in reservoirs. Ecological Modelling. 191(2): 260-274.
Kemenes, A, et al. Methane release below a tropical hydroelectric dam. Geophysical Research Letters. 34(12).
Knowles, R. 1982. Denitrifcation. Microbiological Reviews. 46(1): 43-70.
Liu, L., et al. Spatial and temporal variability of methane emissions from cascading reservoirs in the Upper Mekong River. Water Research 186 (2020): 116319.
Miller, B. L., Holtgrieve, G. W., Arias, M. E., Uy, S., and Chheng, P. 2022. Coupled CH4 production and oxidation support CO2 supersaturation in a tropical food pulse lake (Tonle Sap Lake, Cambodia). Proceedings of the National Academy of Sciences of the United States of America. 119(8): e2107667119. https://doi. org/10.1073/pnas.2107667119
Pacheco, F. S., et al. 2015. The effects of river infow and retention time on the spatial heterogeneity of chlorophyll and water–air CO2 fuxes in a tropical hydropower reservoir. Biogeosciences. 12(1): 147-162.
Shi, W, et al. 2023. Spatial patterns of diffusive greenhouse gas emissions from cascade hydropower reservoirs. Journal of Hydrology. 619: 129343.
Soumis, N, et al. 2004. Greenhouse gas emissions from reservoirs of the western United States. Global Biogeochemical Cycles. 18(3).
THE BIG(10) SWITCH BY RILEY RAMIREZ & ABBY CARIÑO
Calkins, M. 2023. “Why Joining the Big Ten Is the Right Move for UW.” The Seattle Times. www.seattletimes.com/sports/uw-husky-football/why-joining-thebig-ten-is-the-right-move-for-uw/#:~:text=In%20short%2C%20more%20 money%2C%20more,one%20of%20the%20nation%27s%20elite Environmental Protection Agency. 2024, May 15. Sources of Greenhouse Gas Emissions. https://www.epa.gov/ghgemissions/sources-greenhouse-gasemissions#transportation
Hawley, G. 2023, August 9. UW in Big Ten: “Placing proft over the health of the planet” [Letter to the editor]. The Seattle Times. https://www.seattletimes.com/ opinion/letters-to-the-editor/uw-in-big-ten-placing-proft-over-the-health-ofthe-planet/
Kärcher, B. 2018. Formation and radiative forcing of contrail cirrus. Nature Communications. 9(1824). https://doi.org/10.1038/s41467-018-04068-0 Kendrick, K. 2023. “The Lives of Many UW Athletes ‘just got harder’ with Jump to Big Ten.” KNKX Public Radio. www.knkx.org/sports/2023-08-07/university-ofwashington-big-ten-conference-pac-12
Kiest, K. 2023. “Aviation Is Responsible for 3.5 Percent of Climate Change, Study Finds.” NOAA Research. research.noaa.gov/2020/09/03/aviation-is-responsiblefor-35-percent-of-climate-change-study-fnds/
Sustainable Travel International. (n.d.). Calculate your travel carbon footprint. Sustainable Travel International. https://sustainabletravel.org/our-work/carbonoffsets/calculate-footprint/ USC Trojan Force. 2016. USC Conference History. https://usctrojanforce.com/pcchistory
POLITICIZING THE GRAY WOLF
BY ABIGAIL MEYERS & BRIGITTE WORSTELL
Bentz, C. 1 April 2024. Icymi: As gray wolves terrorize farms and ranches, GOP lawmakers demand endangered species delisting. https://bentz.house.gov/ media/press-releases/icymi-gray-wolves-terrorize-farms-and-ranches-goplawmakers-demand-endangered#:~:text=Representative%20Cliff%20Bentz,ICYMI%3A%20As%20gray%20wolves%20terrorize%20farms%20and%20 ranches%2C%20GOP,lawmakers%20demand%20endangered%20species%20 delisting&text=FIRST%20ON%20FOX%3A%20A%20group,conficts%20with%20ranchers%20and%20farmers.
Endangered Species Act. 28 December 1973. Endangered Species Act. https://www. fws.gov/law/endangered-species-act Farquhar, B. 22 June 2023. Wolf reintroduction changes ecosystem in Yellowstone. Yellowstone National Park. https://www.yellowstonepark.com/things-to-do/ wildlife/wolf-reintroduction-changes-ecosystem/ FWS.gov. 29 October 2020. Gray Wolf Final Delisting Determination Questions and answers.
Gray Wolf. Washington Department of Fish & Wildlife. (n.d.). https://wdfw.wa.gov/ species-habitats/species/canis-lupus
Guardian News and Media. Milman. O (2020, October 29). Trump administration ends gray wolf’s endangered species protections. The Guardian. https://www. theguardian.com/environment/2020/oct/29/gray-wolf-endangered-speciestrump-administration
Horn, H. S. 15 February 2024. The war on wolves will hurt humans too. The New Republic. https://newrepublic.com/post/179013/gray-wolves-war-hurt-humans Hu, S. 21 April 2022. America’s Gray Wolves get another chance at Real Recovery. Be a Force for the Future. https://www.nrdc.org/stories/americas-gray-wolves-getanother-chance-real-recovery
Kaeding, D.10 January 2024. DNR: Wisconsin Wolf population dropped 14 percent after controversial Wolf Hunt last year. WPR. https://www.wpr.org/agriculture/ dnr-wisconsin-wolf-population-dropped-14-percent-after-controversial-wolfhunt-last-year
Koshmrl, M.16 May 2024. Eyewitness describes Wyoming Wolf’s fnal hours in the Green River Bar. WyoFile. https://wyofle.com/wolfs-capture-torment-putswyoming-on-path-toward-legal-reform/ Kowatsch, T. 23 April 2024. WA wolf packs have grown so much, they may lose ‘endangered’ label. The Seattle Times. https://www.seattletimes.com/seattlenews/environment/washington-wolf-total-steadily-increasi%20g-survey-fnds/ National Oceanic and Atmospheric Administration. Fisheries, N. (2023, June 13). National Oceanic and Atmospheric Administration. https://www.fsheries.noaa. gov/national/endangered-species-conservation/endangered-species-act Peacher, A.17 April 2021. State of Idaho Funds Controversial Wolf Bounty program. Boise State Public Radio. https://www.boisestatepublicradio.org/ environment/2019-03-28/state-of-idaho-funds-controversial-wolf-bountyprogram
U.S. Department of the Interior. (n.d.). Wolf restoration. National Parks Service. https://www.nps.gov/yell/learn/nature/wolf-restoration.htm
U.S. Fish & Wildlife Service. https://www.fws.gov/press-release/2020-10/gray-wolffnal-delisting-determination-questions-and-answers Volski, Lara. Interview. Conducted by Abigail Meyers, 26 April 2024.
THE HIDDEN PRICE OF CLIMATE CHANGE BY
JARED MCGLOTHLIN & LUCY ALLEN
Role of Insurance, FEMA. https://www.fema.gov/sites/default/fles/documents/ fema_role-insurance.pdf
Blake, E. and Zelinsky, D. 2018. Tropical Cyclone Report Hurricane Harvey. National Hurricane Center. AL092017. https://www.nhc.noaa.gov/data/tcr/AL092017_ Harvey.pdf
Berger, E. 2022, July 26. “Flash Floods Swamp St. Louis Area, Breaking a Century-Old Rain Record.” The New York Times. https://www.nytimes.com/2022/07/26/us/ fash-fooding-st-louis-missouri.html
Frank, T. 2023, April 17. Growing insurance crisis spreads to Texas. E&E News. https:// www.eenews.net/articles/growing-insurance-crisis-spreads-to-texas/ Ryan, M.. 2023, September 6. Louisiana’s insurance market is in crisis. New head says less regulation is the answer. New Orleans Public Radio. https://www.wwno. org/2023-09-06/louisianas-insurance-market-is-in-crisis-new-head-says-lessregulation-is-the-answer
Moss, R. 2023, Sep 19. How wildfre risk scoring puts WA homeowners in insurance jeopardy. The Seattle Times. https://www.spokesman.com/stories/2024/feb/06/ sparks-from-inland-power-light-caused-gray-fre-dn/
Radeloff, Volker et al. 2023. The 1990-2020 wildland-urban interface of the conterminous United States - geospatial data (4th Edition). United States Forest Service. https://www.fs.usda.gov/rds/archive/catalog/RDS-2015-0012-4 Wildland Fire Management Division. 2023. Wildfre Season 2023. Washington Department of Natural Resources. https://app.leg. wa.gov/ReportsToTheLegislature/Home/GetPDF?fleName=2023_ AnnualWildfreSeasonReport_DNR_0f10b0a0-51ba-41b3-8868-f2a8fca57a2c. pdf
Epperly, E. 2024, Feb 6. Sparks from Inland Power light caused Gray fre, DNR investigation fnds. The Spokesman-Review. https://www.spokesman.com/ stories/2024/feb/06/sparks-from-inland-power-light-caused-gray-fre-dn/ January 19, 2024. “Cost of Flood Insurance for Single-Family Homes under NFIP’s Pricing Approach.” FEMA. https://www.fema.gov/food-insurance/work-withnfp/risk-rating/single-family-home
“Facts + Statistics: Homeowners and renters insurance | III.” Insurance Information Institute (III). https://www.iii.org/fact-statistic/facts-statistics-homeowners-andrenters-insurance
BEYOND LAND ACKNOWLEDGMENTS
BY CHELSEA WHITING & MIDORI SYLWESTER
Ambo, T., and Rocha Beardall, T. 2023. Performance or progress? The Physical and rhetorical removal of Indigenous Peoples in settler land acknowledgments at land-grab universities. American Educational Research Journal. 60(1): 103–140. https://doi.org/10.3102/00028312221141981
Bell, C. 2020. Unsettling existence: Land acknowledgement in contemporary Indigenous performance. Performance Research. 25(2): 141–148. https://doi.org /10.1080/13528165.2020.1752587
Duwamish Tribe. (n.d.). Real Rent Duwamish. Network for Good. Retrieved May 21, 2024, from https://duwamishtribe.networkforgood.com/projects/35157-realrent-duwamish
Nadasdy, P. 2005. The anti-politics of TEK: The institutionalization of co-management discourse and practice. Anthropologica. 47(2): 215–232. http://www.jstor.org/ stable/25606237
Rottschafer, S. 2023. Land Acknowledgement. Studies in American Indian Literatures. 34(3): 1-26. https://www.proquest.com/scholarly-journals/landacknowledgement/docview/2817727589/se-2
University of Washington. (n.d.). Center for American Indian & Indigenous Studies. Retrieved May 21, 2024, from https://caiis.uw.edu/ U.S. Senate. (n.d.). Morrill Land Grant College Act. Retrieved May 21, 2024, from https://www.senate.gov/artandhistory/history/common/civil_war/ MorrillLandGrantCollegeAct_FeaturedDoc.htm
Veltman, C. 15 March 2023. So You Began Your Event with an Indigenous Land Acknowledgment. Now What?. National Public Radio. https://www.npr. org/2023/03/15/1160204144/indigenous-land-acknowledgments
THE
WEAPONIZATION OF THE ENVIRONMENT IN THE RUSSOUKRAINIAN
WAR
BY CLAUDIA STILE & JULIAN GONZALES
Anthes, E. 13 April 2022. A ‘Silent Victim’: How Nature Becomes a Casualty of War. The New York Times. https://www.nytimes.com/2022/04/13/science/warenvironmental-impact-ukraine.html
Beckmann, A. 2022. Assessing the environmental impacts of the war in Ukraine. World Wildlife Fund For Nature. https://wwfcee.org/our-offces/ukraine/ assessing-the-environmental-impacts-of-the-war-in-ukraine CEOBS. 2024. Nature. United Nations Environment Programme. https://ceobs.org/ ukraine-confict-environmental-briefng-nature/ Gleick, P., Vyshnevskyi, V., and Shevchuk, S. 2023. Rivers and water systems as weapons and casualties of the Russia-Ukraine war. Earth’s Future. https://doi. org/10.1029/2023EF003910
Hryhorczuk, D., Levy, B.S., Prodanchuk, M. Kravchuk, O., Bubalo, N., Hryhorczuk, A., and Erickson, T.B. 2024. The environmental health impacts of Russia’s war on Ukraine. Journal of Occupational Medicine and Toxicology. 19:1. https://occupmed.biomedcentral.com/articles/10.1186/s12995-023-00398-y
Killean, R. 30 March 2022. The Benefts, Challenges, and Limitations of Criminalizing Ecocide. IPI Global Observatory. https://theglobalobservatory.org/2022/03/thebenefts-challenges-and-limitations-of-criminalizing-ecocide/
Littlejohn, J.R., Balian, R., and Simmons, L. 1 August 2023. The Ukraine War Is an Environmental Catastrophe with Global Consequences. Scientifc American. https://www.scientifcamerican.com/article/the-ukraine-war-is-anenvironmental-catastrophe-with-global-consequences/ Marsi, F., and Mirovalev, M. 16 June 2023. Fears of environmental disaster mount after Ukraine dam break. Al Jazeera. https://www.aljazeera.com/ news/2023/6/16/fears-of-environmental-disaster-mount-after-ukrainedam-blast#:~:text=The%20destruction%20of%20the%20Nova,that%20 submerged%20villages%20and%20farmland.
Santini, A., Maresi, G., Richardson, D.M., and Liebhold, A.M. 2023. Collateral damage: military invasions beget biological invasions. Frontiers in Ecology and the Environment. 21(10): 469-478. https://esajournals.onlinelibrary.wiley.com/doi/ full/10.1002/fee.2640
Shumilova, O., Tockner, K., Sukhodolov, A., Khilchevskyi, V., De Meester, L., Stepanenko, S., Trokhymenko, G., Hernández-Agüero, J. A., and Gleick, P. 2023. Impact of the Russia–Ukraine armed confict on water resources and water infrastructure. Nature Sustainability https://doi.org/10.1038/s41893-02301068-x
NAVIGATING MOUNT RAINIER’S POPULARITY
BY CLAIRE FARBER & LAUREN GRADY
Brown, M., Jenkins, J., and Kolden, C. 2024. Decreased air quality shows minimal infuence on peak summer attendance at forested Pacifc West national parks. Journal of Environmental Management. 358: 120702. https://doi.org/10.1016/j. jenvman.2024.120702
Creany, N., Monz, C.A., and Esser, S.M. 2024. Understanding visitor attitudes towards the timed-entry reservation system in Rocky Mountain National Park: Contemporary managed access as a social-ecological system. Journal of Outdoor Recreation and Tourism. 45: 100736. https://doi.org/10.1016/j. jort.2024.100736
Crystal Mountain 2024. Parking and Shuttles. Crystal Mountain Resort. https://www. crystalmountainresort.com/plan-your-trip/parking-and-shuttle-information
Kwak-Hefferan, E. 27 March 2023. Getting a national park reservation can be a pain. Here’s what you should know. National Geographic. https://www. nationalgeographic.com/travel/article/how-make-national-park-reservation
Miller, Z.D., Tendick, A., Meyer, C., Pettebone, D., Meldrum, B., and Lawson, S. 2023. Comparing visitor perceptions, characteristics, and support for management actions before and during a pilot timed entry system at Arches National Park. Sustainability. 15(13): 10035. https://doi.org/10.3390/su151310035
Monz, C.A., Gutzwiller, K.J., Hausner, V.H., Brunson, M.W., Buckley, R. and Pickering C.M. 2020. Understanding and managing the interactions of impacts from nature-based recreation and climate change. Ambio: A Journal of Environment and Society. 50: 631-643. https://doi.org/10.1007/s13280-020-01403-y National Park Service. 16 October 2023. Camping at Mount Rainier. National Park Service. https://www.nps.gov/thingstodo/camping-at-mount-rainier.htm
National Park Service. 19 April 2024. Timed Entry Reservations FAQs. National Park Service. https://www.nps.gov/mora/planyourvisit/timed-entry-reservations-faq. htm
Patterson, K. 31 March 2021. Rocky Mountain National Park Will Begin Pilot Timed Entry Permit Reservations May 28 Through October 11. National Park Service. https://www.nps.gov/romo/learn/news/rocky-mountain-national-park-willbegin-pilot-timed-entry-permit-reservations-may-28-through-october-11.htm
Pennington, E. 2 January 2024. These 10 National Parks Will Have Timed-Entry Reservations This Year. Outside Online. https://www.outsideonline.com/ adventure-travel/news-analysis/national-parks-reservations-2024/

PHOTO JACKSON PAGE-ROTH
