1.0 30 April 2024 101/2024FC Prepared for in principle adoption
2.0 25 June 2024 157/2024FC Adopted changes as endorsed in June 2024 Council meeting
3.0 11 October 2024
4.0 6November2024
Revised with recommendations from the University of Newcastle independent review and updated Strategic Asset Management Plan data. Revised for in principle adoption.
IncorporateAlternate2scenariooflockinguptemporary SRV with no further additional income from general rates.
1 INTRODUCTION
This Long Term Financial Plan (LTFP) provides the strategic framework including ten year forward projections based on a range of scenarios to direct Council’s longer-term financial sustainability. The LTFP is updated annually to respond to any changes in the previous year, and to ensure it is always projecting out ten years, so itisessentiallyarollingplan. TheLTFPisalsoupdatedatothertimesasandifrequired. Forexample,torespond to significant impacts to Council’s forecast revenue and/or expenditure. This can be from things such as major emergency events, new grants being received for major projects, other unexpected expenditure requirements for example on Council assets/services, and as a result of any changes to rate income, such as from any special rate variations if applied for and received.
The information and scenarios allow Council to make decisions and adapt and respond to challenges and opportunities whilst managing its long-term financial sustainability. It also allows the establishment of key financial principles that when executed, will ensure Federation Council continues to be financially sustainable and responsible, as it delivers the services that are valued and in many cases required (for critical services) right across the vast Federation Council Local Government area.
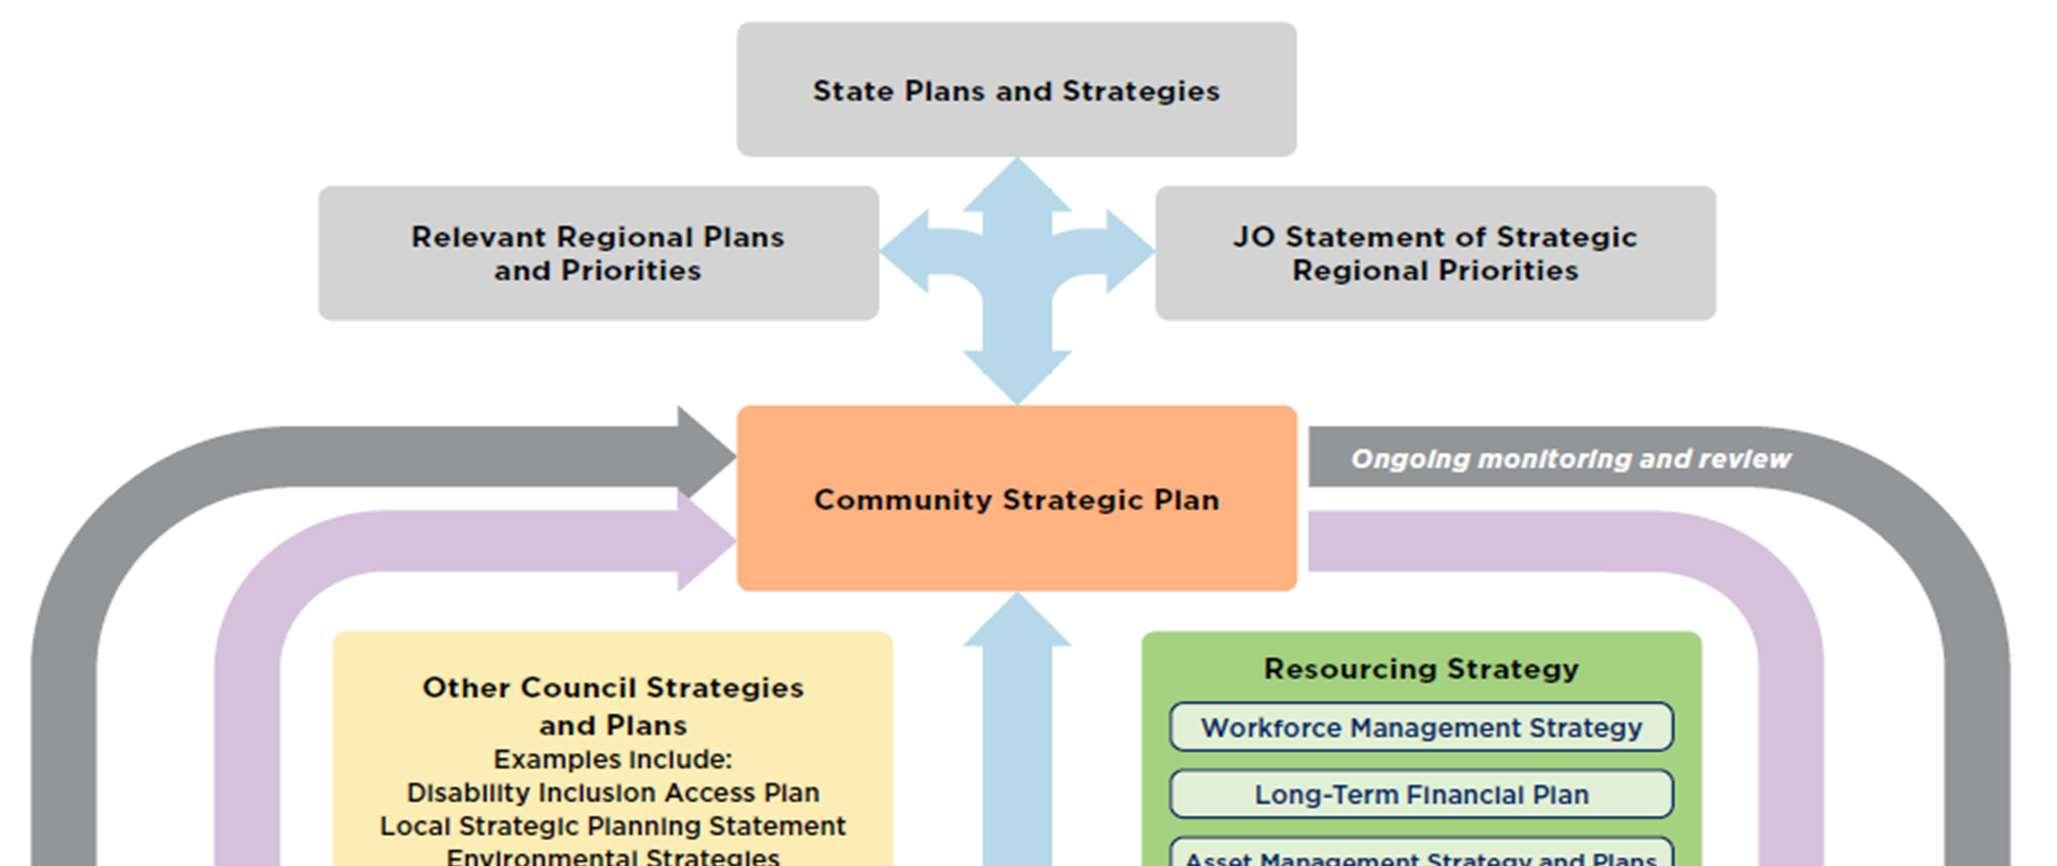
Council is required to follow the Integrated Planning and Reporting requirements set out by the NSW Government. See below for a diagram of how these strategic documents interact to inform from a 10-year horizon, down into Council’s 4 and 1 year plans (in blue). This LTFP is within the Resourcing Strategy set of plans.
Figure 1 – NSW Local Government Integrated Planning and Reporting Framework
The Community Strategic Plan outlines the needs and aspirations of the Federation community, delivered through the Delivery Program and Operational Plans of Council. The Resourcing Strategy is critical to ensuring Council has the capability and capacity to deliver the services as planned.
The LTFP aligns the delivery of services as outlined in the community expectations with the requirement for responsible management of Council’s current and future financial sustainability. The aim of the LTFP is to provide the Council with sound financial information upon which to make decisions. Decisions made by Council will likely require continual revision of the LTFP as estimates of revenues, expenditures and capital investments are refined and become more accurate.
As decisions are made, more detail can be added to the LTFP. For example, as the council finalises its Delivery Program, the first four years of the LTFP will become firmer. As the Operational Plan is completed, the detailed budget will form the first year of the LTFP.
In mid 2023, Council commissioned an independent review by the University of Newcastle, led by Professor Joseph Drew. The review was focused on the advantages and disadvantages of the merger and Council’s Financial Sustainability Journey.
The review resulted in a 137 page report and 77 recommendations to address Council’s financial sustainability challenge and to respond to disenfranchisement felt by northern residents.
Work is continuing on considering these recommendations and implementing improvement actions to address the matters that have been raised. A number of recommendations have been progressed and included in this LTFP. Quarterly updates are provided to Council to report on progress of implementing agreed actions.
The LTFP has been prepared following a detailed financial review of the services provided by Council and recommended asset renewal, primarily from the Strategic Asset Management Plan. Estimates have been prepared for future incomes and expenditure by service.
Consistent with the requirements of Section 8B of the Local Government Act 1993, Council has applied the following principles of sound financial management in preparing plans for 2024/25 and future year estimates:
Council spending should be responsible and sustainable, aligning general revenue and expenses.
Council should invest in responsible and sustainable infrastructure for the benefit of the local community.
Council should have effective financial and asset management, including sound policies and processes for performance management and reporting, asset maintenance and enhancement, funding decisions and risk management practices.
Council should have regard to achieving intergenerational equity, including ensuring policy decisions are made after considering their financial effects on future generations and the current generation funds the cost of its services.
Of note in 2024/25, particular emphasis has been placed on the following matters:
Recommendations from the recent independent review by Professor Joseph Drew of the University of Newcastle.
Renewal of existing assets not creation of new assets, with a particular focus on roads and drainage.
Emphasis on accommodating needs before wants.
Pricing review to send “appropriate price signals”.
Focus on asset maintenance.
Council’s current financial position and the constraints resulting from Council’s unrestricted cash balance.
The October 2022 flooding caused significant damage to Council and community infrastructure. The majority of the cost of repairing flood damaged infrastructure will be claimable under NSW Disaster Assistance Arrangementsor Council’sinsurance policy.Councilhasbeenadvisedthatdamage to Regional Roads underthe Essential Public Asset Reconstruction Works has been approved at $4.5 million. Council has two years to complete restoration works up to this value. Work not completed in 2023/24 will be carried forward into 2024/25. At the time of this plan being prepared, the claim for damage to Local Roads has been lodged with Transport NSW and is under assessment. Expenditure for repairs to flood damaged roads and the associated funding will not be included in the LTFP until there is greater certainty on the value of the damage. The LTFP will be updated when this information is confirmed.
In the LTFP 2023-2033, Council had been seeking a permanent SRV increase across 4 years from 2023/24 to 2026/27 of 19.00%, 17.00%, 14.00% and 10.00% respectively (cumulative increase of 74.59%). IPART approved a temporary Special Rate Variation on 15 June 2023. The LTFP includes the approved temporary increase to general rates of 19.00% in 2023/24 and 17.00% in 2024/25 (cumulative increase of 39.2%).
IPART acknowledged that Council had demonstrated a financial need for the Special Rate Variation however determined that there was opportunity to improve community awareness and understanding of the need for the significant increase.
In this LTFP the following five scenarios have been modelled:
Baseline – models the financial impact of delivering current services with some minor service reductions, renewing assets in accordance with Council’s updated Strategic Asset Management Plan and no future increase above the rate peg to general rates. Calibrate investment income plus reflecting other updates since the adoption of the 2024 – 2034 LTFP in June 2024.
Baselinewithintervention–modelsthefinancialimpactofdeliveringcurrentserviceswithsomeminor service reductions, renewing assets at a significant reduction based on Council’s updated Strategic Asset Management Plan and no future increase above the rate peg to general rates. Calibrate investment income plus reflecting other updates since the adoption of the 2024 – 2034 LTFP in June 2024.
Alternate – models the financial impact of delivering current services with some minor service reductions, renewing assets in accordance with Council’s updated Strategic Asset Management Plan and a cumulative 163.93% increase to general rates over three years (70.00% in 2025/26, effectively including the temporary 19.00% and 17.00% SRV increases, 35.00% in2026/27 and 15.00% in 2027/28) to provide a financially sustainable solution for the ten years of the LTFP. Calibrate investment income plus reflecting other updates since the adoption of the 2024 – 2034 LTFP in June 2024.
Independent review scenario – models the financial based on recommendation by Professor Joseph Drew with cumulative 69.94% increase to general rates over 2 years (52.01% in 2025/26, effectively including the temporary 19.00% and 17.00% SRV increases, 11.80% in 2027/28). Calibrate investment income plus reflecting other updates since the adoption of the 2024 – 2034 LTFP in June 2024.
Planned (Recommended) – models the financial impact of delivering current services with some minor servicereductions,renewingassetsatamoremoderatereductionbasedonCouncil’supdatedStrategic Asset Management Plan. Adopting the Independent Review’s recommendations of cumulative 69.94% increase to general rates over 2 years (52.01% in 2025/26, effectively including the temporary 19.00% and 17.00% SRV increases, 11.80% in 2027/28). Calibrate investment income plus reflecting other updates since the adoption of the 2024 – 2034 LTFP in June 2024.
Alternate 2 – models the financial impact of delivering current services with some minor service reductions, renewing assets at a less significant reduction based on Council’s updated Strategic Asset Management Plan. Implementing proposed increase in general rates by 33.87% by converting the temporary 19.00% and 17.00% SRV increases in 2023/24 and 2024/25 to permanent. Calibrate investment income plus reflecting other updates since the adoption of the 2024 – 2034 LTFP in June 2024.
Adjustment made to reflect updates since the adoption of the 2024 – 2034 LTFP in June 2024 mentioned above refers to:
o Update FY2025/26 rate peg with the announced rate for both Baseline scenarios.
o Adopt the Independent Review’s recommendation to reduce income from saleyard in line with the forecast of decline in throughput.
o Revised Financial Assistance Grants forecast for Year 2 onwards based on actual allocation for FY2024/25.
It is acknowledged that the Baseline scenario will not be acceptable under any circumstances given the dire financial position that it results in. Accordingly, the Baseline with intervention scenario was developed to understand Council’s position in the event that there is no future SRV. This scenario provides a significant reduction in asset renewal, well below recommended levels. This will result in assets deteriorating further, however will provide time for significant service reform to occur.
The Alternate scenario is unlikely to be palatable to ratepayers. It provides the level of rate increase required to be financially sustainable over the ten years, assuming no significant external events that impact Council’s financial position.
The Planned scenario is the recommended scenario. The Planned scenario will provide the additional revenue required to progress asset maintenance and renewalover the next five to seven years. This time frame willalso allow progress to be made on implementing improvement actions from the independent review, comprehensive asset management work to be progressed and any changes to the local government financial environment to be introduced, such as Roads to Recovery funding or other funding changes.
In late 2023, Council commissioned the University of Newcastle, led by Professor Joseph Drew, to progress a number of financial sustainability recommendations from the original independent review. In particular the work includes the requirements to progress a future permanent SRV application. This updated version of the Long Term Financial Plan reflects the work undertaken by University of Newcastle following Professor Drew’s community engagement in July 2024.
This report presents a full suite of financial statements for 2024/25 to 2033/34.
2 ABOUT FEDERATION COUNCIL
2.1
Federation Council area
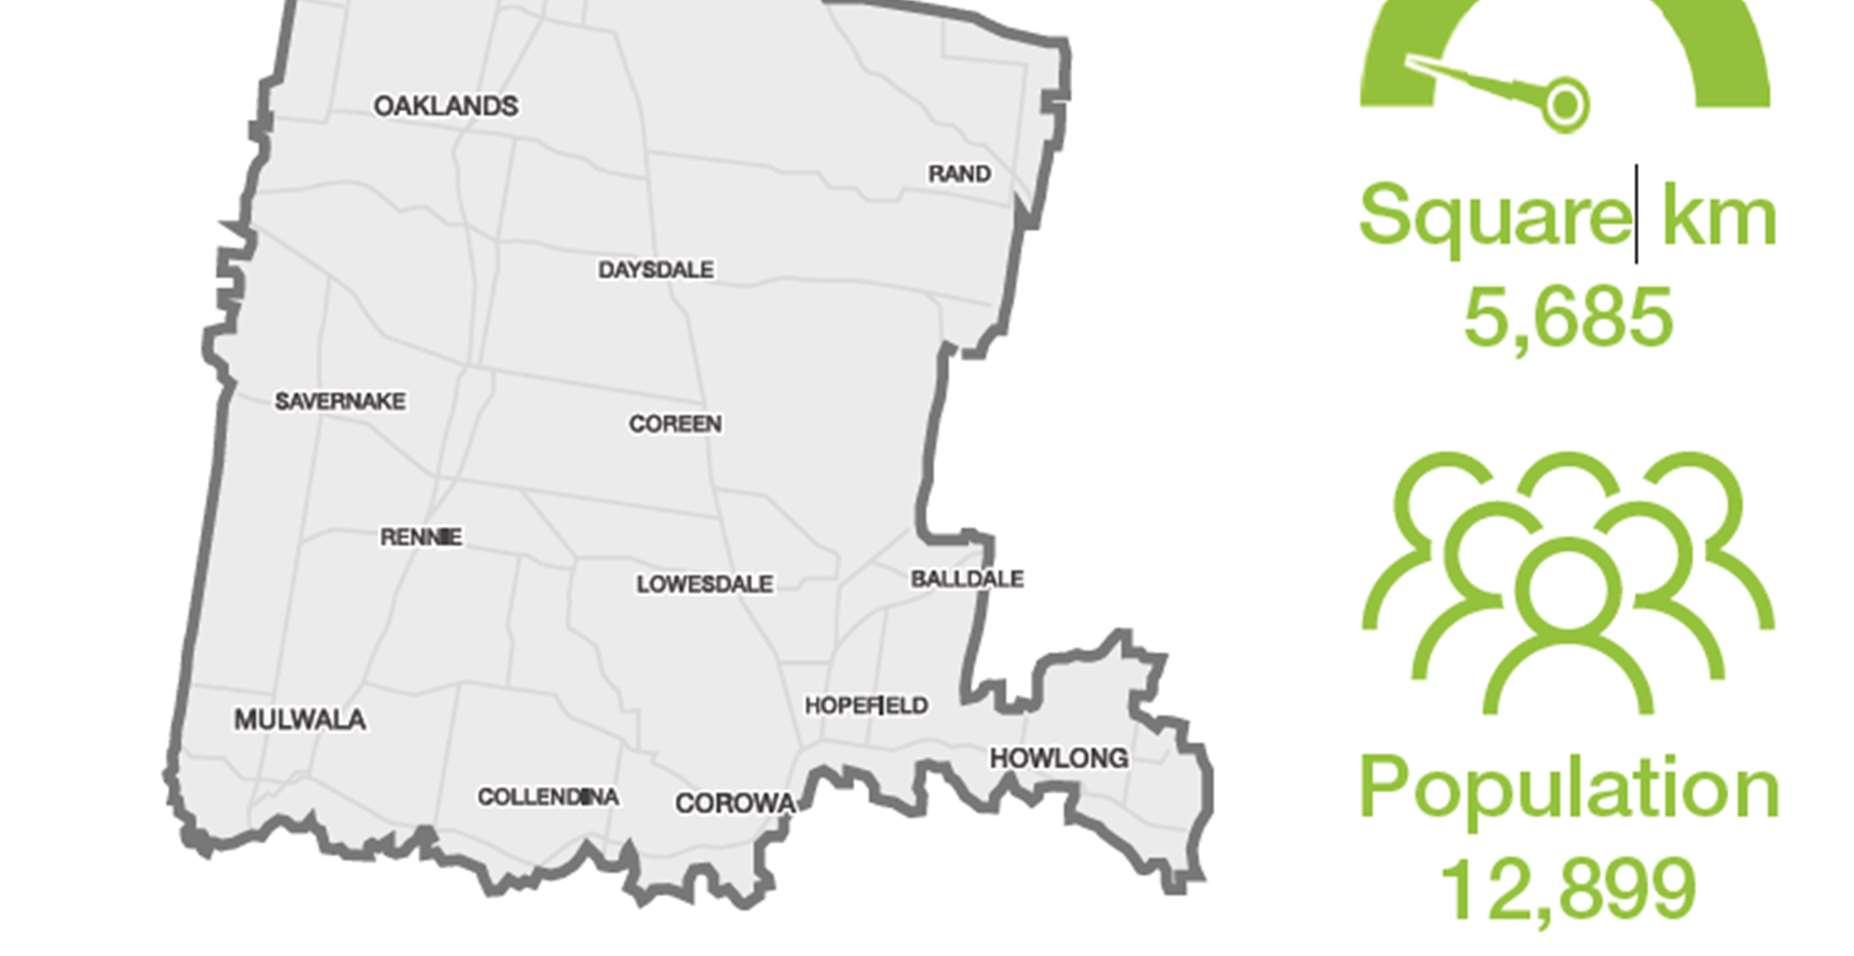
Federation Council was formed in May 2016 as a newly merged Council from the former Urana and Corowa ShireCouncils. FederationCouncilislocatedintheSouthernRiverinaMurrayareaofNewSouthWales. Council has an estimated resident population of 12,899 (ABS Census 2021), up from 12,377 in the 2016 census. The Council area is 5,685 square kilometres and comprises vast productive farming land (mostly dry land and some irrigation to the south and central areas), that is predominantly used for cereal cropping and to lesser extent livestock, including sheep, cattle and pigs. The larger towns in the south also support some other industry including Manufacturing and Construction, Retail, Transport and Agriculture related industries especially. The bulk of the population reside in the southern sections of the Council area, including in the Murray River towns of Corowa, Howlong and Mulwala whilst the rural areas of Corowa Rural and Urana and Surrounds contain a mix of small towns, villages, localities and those who live on farms.
Whilst the Council area itself has only experienced moderate population growth since the last census, there is somegrowingdiscussionthat the area will begantoseemore accelerated growthpatterns. Some ofthe factors for this including a growing awareness of the affordability of property in the region, and the relatively close proximity to Melbourne and other attractive liveability features such as wineries and snowfields nearby, excellent sporting and community amenities, low crime rates and good health and education services.
In recent times, the Federation Council Local Government Area has again been listed as one of the Top 10 affordable regional areas, in the nation, as part of PRD Real Estate report into stand out regions. See –https://www.prd.com.au/research-hub/article/roaring-regions-top-10-affordable-regional-areas-2023/
2.2 Federation Council entity
Since merger Council has been awarded significant grants funds to invest in many new and upgraded community assets right across the Council region. These include skate parks, tennis and netball courts, boat ramps,extensiveplaygrounds,anewyearroundpoolinCorowa,alakesidefunctionfacilityforUrana,upgraded saleyards, upgraded Murray River foreshore facilities and the list goes on. This has been possible through Commonwealth and State Government funding programs, from Stronger Communities Fund, Stronger Country Communities Program, COVID Stimulus, Drought Funding, Active NSW and other grant programs.
New and improved facilities are enhancing the area’s reputation for liveability. Council has also undertaken significant grant funded investment into its roads and related infrastructure network, however there remains a significant challenge in managing these assets with current revenue levels.
Council as an entity has experienced rapid changes and growth since its creation in May 2016. Both former Councilshadhistoricallylowratebasesanddisproportionateassetbasestopopulationlevels. Thesechallenges include a road network of 2,310 km of roads broken into 999 km of sealed roads and 1,311 km of gravel roads. Council also due to having 14 towns and villages, have a large amount of relatively low usage but high priority to the community, facilities, such as halls, courts and ovals. These are spread across the towns and villages of Corowa, Howlong, Mulwala, Urana, Balldale, Boree Creek, Buraja-Lowesdale, Coreen, Daysdale, Morundah, Oaklands, Rand, Rennie and Savernake. Council also has varying service levels across each of these facilities.
Council’s total non-current assets are recorded at $737,869,000, with an annual depreciation amount of $14,580,000 from Council’s 2022/23 Financial Statements. Prior to the creation of Federation Council, both Councils had infrastructure backlogs, being $17,693,000 (Corowa Shire) and $3,433,000 (Urana Shire) as taken from the last financial statements from each Council. This backlog was attributed due to low rate bases and historic issues of cost shifting from the State Government, and general underfunding from State and Federal Governments.
Council has maintained very low general rate charges over many decades. This has been due to rate pegging, strong consideration towards the rural rate base and economic factors. Some significant achievements have been made by the Council given the limited rate revenue and the high level of infrastructure and service demands.
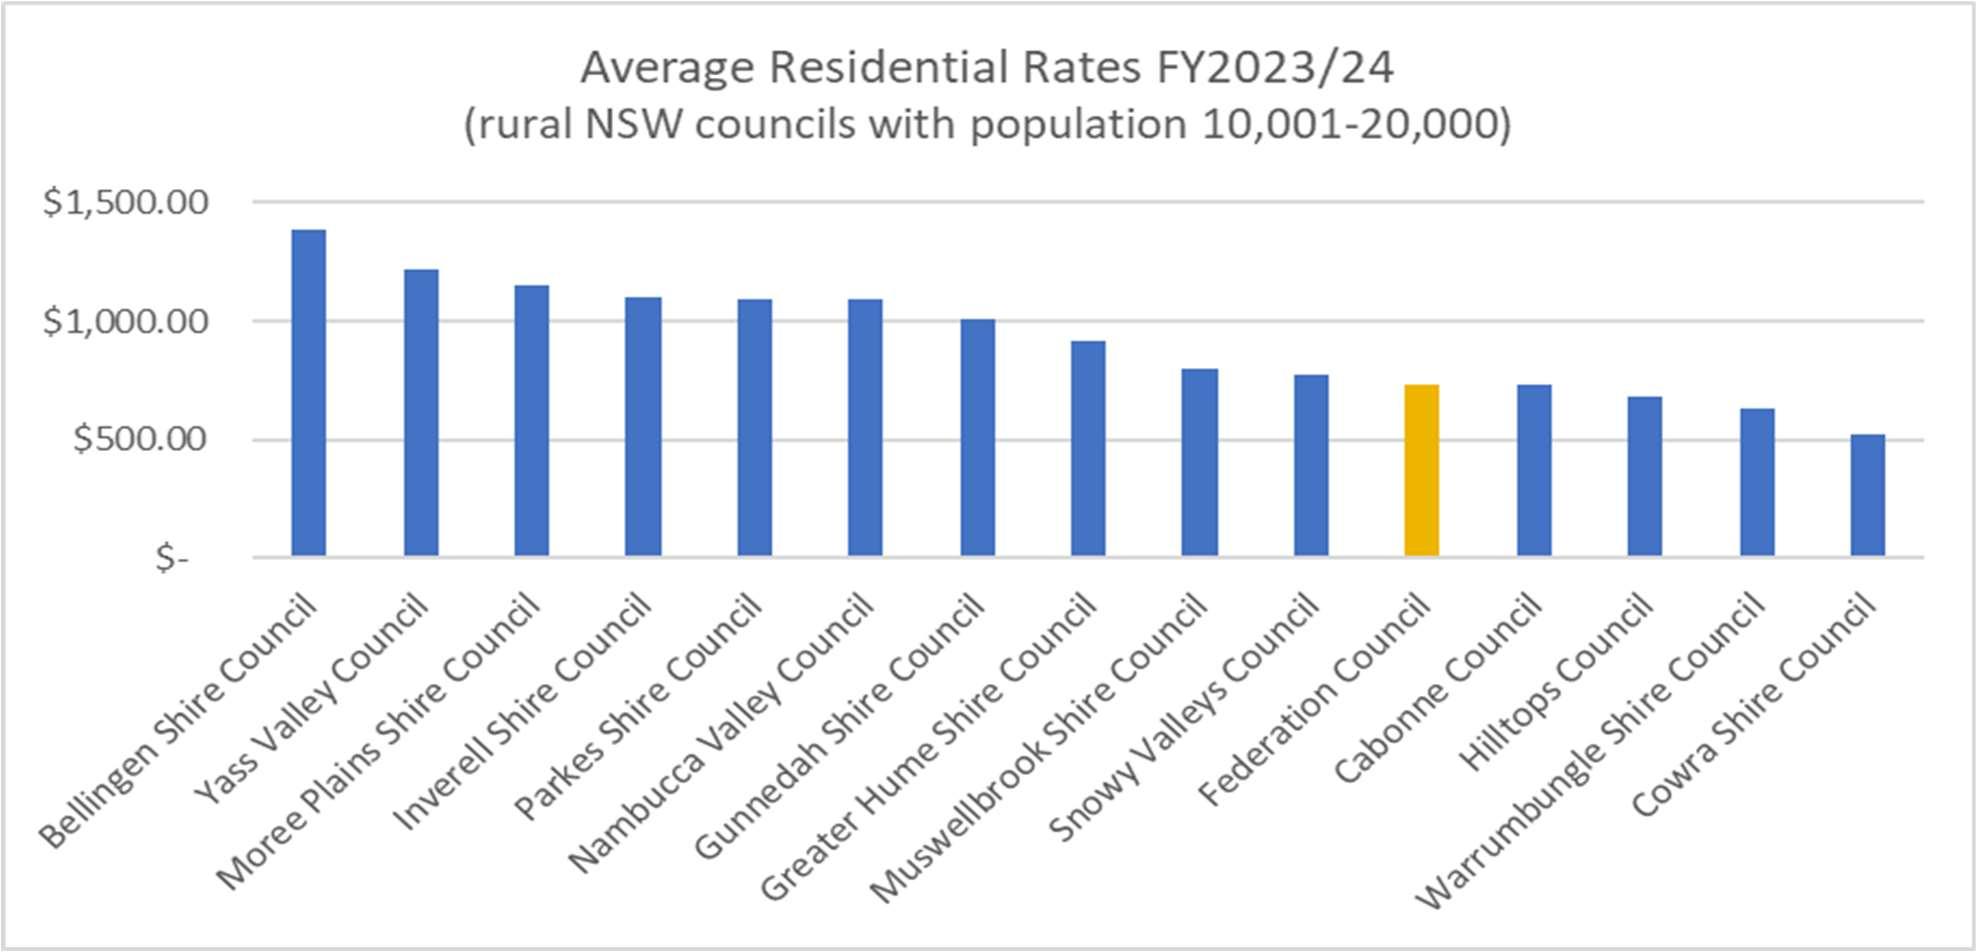
Currently average overall rates are amongst the lowest in NSW. When compared to other NSW rural councils with population between 10,0001 and 20,000, Federation Council average residential rates for 2023/24 are the fifth lowest, as reported in the graph below.
It is noted that this graph includes the temporary 19.00% SRV applied to Federation Council’s 2023/24 general rates and 17.00% on the following year.
2.3 Council Services
Council provides forty-five (45) separate services that include statutory responsibilities and other services that are not required under the current enabling legislation, the Local Government Act 1993, or other statutes. The provision of other services that require full or part subsidisation from the general rate revenue is a challenge for Council’s financial planning. Past cost-shifting from other levels of government to Council without adequate funding places further stresses upon the financial planning of Council.
The identified 45 services are as follows:
Aerodrome
Bridges
Caravan Parks
Cemeteries
Communication & Engagement
Community Services
Corowa Saleyards
Council Buildings
Customer Services
Depots
Development Assessment & Building Control
Directorate Support
Domestic Waste
Drainage
Economic Development
Electrical Services
Emergency Management
Engineering & Design
Environmental Services & Natural Resources
Event Management
Executive Services
Finance
Fleet Management
Footpaths
Governance
Grants
Human Resources
Information Technology
Land Management
Landfills
Libraries
Mobile Pre-School
Procurement
Quarries
Regulation & Compliance
Risk & Safety
Roads
Service NSW
Sewerage Operations
Sporting Playgrounds Presentation
Strategic Land Use Planning
Swimming Pools
Tourism
Waste Management
Water Operations
Mandatory services undertaken by Federation Council include the provision of roads, drainage, bridges, footpaths, cemeteries, waste, emergency management, environmental and natural resources, land management, regulation, water and sewerage, disability inclusion activities, as well as the community leadership, advocacy and management functions of the Council.
Some of the other service areas undertaken by Federation Council to support a stronger community include:
Libraries,
Corowa Aquatic Centre and other swimming pools,
Industrial Subdivision developments,
Parks, gardens and sporting grounds,
Corowa Saleyards,
Corowa Aerodrome,
Caravan Parks (Ball Park Caravan Park Corowa and Urana Caravan Park), and
Services relating to Youth, Aged, Medical Services (GP) support, Mobile Preschools, Health, Early and Seniors Education, Social, Arts and Culture, Tourism and Economic Development.
Council values and acknowledges that these services are a priority, given that they make a place more liveable and a place that visitors want to visit, as has been communicated by the community in various forums over the past years. In addition, Council acknowledges its role in supporting economic activity in the Council area, as evidenced by its commitment to developing industrial land and operating caravan parks and the Corowa Saleyards. These activities are able to generate economic activity for local businesses and result in more employment opportunities. In addition, over time these activities will be able to generate a financial return to Council which will assist in alleviating the rates burden.
Council is progressing its plan for service reviews to better understand future needs and expectations of community members, as well as community appetite to fund such services. A service review of the Corowa Aquatic Centre was undertaken in 2023. Service reviews are also currently being undertaken on the following services: Corowa Aerodrome, Water Services, Sewerage Services and Community Engagement.
Over the coming four years, levels of service provided in many areas will be reviewed in consultation with the community.
It is the responsibility of Council to plan and prioritise services through the LTFP, which inevitably includes balancing financial needs of these services, as well as the affordability of the rate and charges burden upon the community.
3 OBJECTIVES
The objectives of the Federation Council LTFP are to:
Understand thecumulativeeffectsof Council’sservicerequirements, assetmanagement commitments and the community aspirations.
Identify the financial opportunities and threats confronting Council.
Provide a basis for sound and strategic decision-making.
Ensure that Council’s decision-making processes are undertaken within a framework of financial sustainability.
Meet the requirements of the Office of Local Government (OLG) Integrated Planning and Reporting (IP&R) framework.
4 FINANCIAL SUSTAINABILITY
Financial sustainability is about having the capacity to deliver services, absorb changes and shocks and make decisions in the best interests of the community over the long term (10 years plus). This focus is to ensure Council’s decisions made today regarding financial, physical and human resources take account of the longterm impacts, which include:
Meeting the agreed service needs of the community;
Maintaining, operating and upgrading infrastructure and equipment to an acceptable condition and capacity to meet service needs;
Absorbing foreseeable changes and unexpected shocks without having to make disruptive revenue or expenditure adjustments;
Having strong governance and management frameworks in place covering community engagement, planning, monitoring, reporting and decision making; and
Reflects the objectives of Federation Council to progress to a financially sustainable position across its 10-year planning horizon.
4.1 Approach to financial sustainability
Following the merger of the former Corowa and Urana Shire Councils in May 2016, Council’s priority had been establishing itself as a new, larger, more mature organisation, and delivering on the significant community projects funded through the Stronger Communities Program.
With a more robust organisation now in place, Council has been strongly focused on its financial sustainability challenges. Council have considered the need for, and purpose of, a different revenue path to canvas alternatives to the rate rise by:
Identifying and implementing service level reduction and cessation all across modelled scenarios (details in section 5).
Forecasting a cost reduction of $8 million annually in the baseline scenario with drastic 32% slashing of cash operating expenditure (details in section 5.2).
Improving asset renewal program for better asset management (details in section 6.2).
Setting appropriate fees and charges (details in section 6.8 and 6.9).
Lobbying for increase in grant funding (details in section 6.10).
Disposing underutilised asset (section 8).
It has been primarily doing this based on:
engaging with the community on current services provided, reviewing service levels and obtaining clarity on community expectations.
implementing improvements to asset management practices across all asset classes (moving from a reactive to a proactive approach and undertaking greater prioritisation of works).
establishing targets and monitoring key financial performance measures to guide long term financial planning and improve Council’s financial position.
identifying opportunities and implementing measures to improve productivity and contain costs.
maximising the quality of grant applications into competitive Commonwealth and State Government funding programs
maximising other revenue streams, such as income from the saleyards, property holdings, caravan parks and aquatic centres.
In mid 2023, Council commissioned an independent review by the University of Newcastle, led by Professor Joseph Drew. The review was focused on the advantages and disadvantages of the merger and Council’s Financial Sustainability Journey.
As stated previously, the review resulted in a 137 page report and 77 recommendations to address Council’s financial sustainability challenge and to respond to disenfranchisement felt by northern residents.
Work is continuing on considering these recommendations, particularly those relating to Council’s financial sustainability challenge, and implementing improvement actions. A number of recommendations have been progressed and are included in this LTFP.
These recommendations include:
Provide better price signals and targeting full cost recovery for non-regulated prices except where a clearly articulated subsidy is in place (recommendation 1).
For merit subsidies, Council should clearly articulate the nature, goal and review process of the subsidy (recommendation 2).
A renewed focus needs to be made on the core remit of Council (recommendation 3).
Establish a stronger focus on maintenance (recommendation 4).
Ball Park Caravan Park business needs to be divested (recommendation 11).
Service levels need to be reviewed (recommendation 13).
Decision-makers need to clearly convey to the community that financial sustainability concerns dictate that, in future, ‘needs’ must be prioritised over ‘wants’ (recommendation 15).
Strong support in the community for reductions to tourism expenditure (recommendation 26).
Councillors and staff should vigorously engage on the long list of tasks that need to be dealt with prior to being in a position to lodge a compelling SRV application (recommendation 27).
Additional resourcing allocated for the Planning and Development Team (recommendation 36).
In the words of Professor Drew, “there is no one simple solution – this predicament has developed over many decades and is the result of a number of complex problems. The situation therefore calls for decisive action whereby all remedies warrant serious consideration in view of the circumstances.”1
Even with these measures, given the quantum of funds required to be invested into existing roads and other infrastructure assets, Council has little choice but to proceed with increased general rates to maintain and restore assets to the level expected by the community. Further detail on this is contained in section 5.
4.2 Financial sustainability ratios
Key financial performance measures to guide long term financial planning and improve Council’s financial position have been established. The table below provides a summary of the targets with the immediate focus on measures to address short term financial sustainability.
1 ProfessorJosephDrew,page5, The Advantages and Disadvantages of Amalgamation and Federation Council’s Financial Sustainability Journey - Recommendations
Analysis of the performance ratios by fund is presented in each scenario in section 9 for the 2024/25 Budget and future years. These ratios by fund provide a more meaningful analysis and enables better targeting of strategies to address ratios that do not meet recommended targets.
Ratios for the Waste Fund have not been included. This fund provides the domestic kerbside collection service only and isoutsourced to the regionalwaste contract.There are no assetsor liabilitiesin thisfund, and financial transactions primarily relate to monthly invoices from the service provider.
Consolidated ratios are contained in section 9, with financial performance indicators by fund contained in section 10.
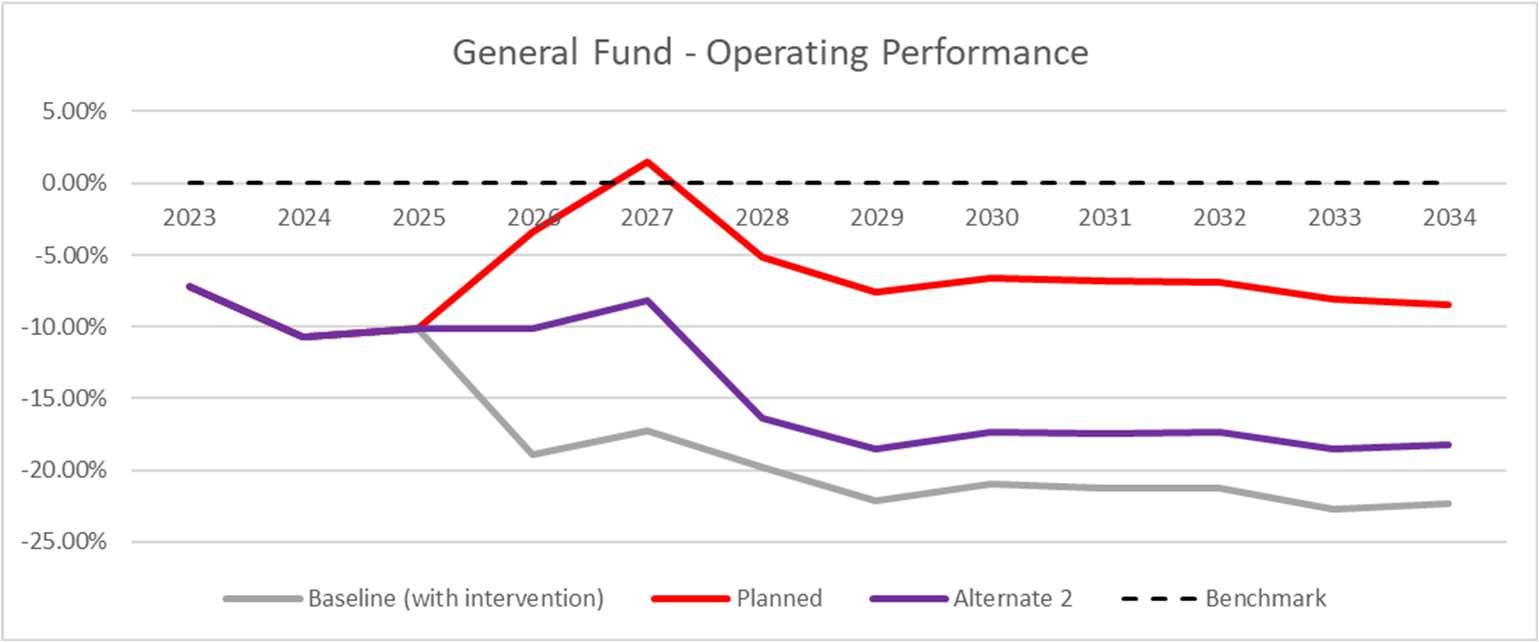
4.2.1 Financial sustainability ratio – General Fund – Operating Performance
Council manages its finances using a Funds accounting approach. Separate funds are established for water, sewerage and waste (kerbside collection) services and assist Council to manage its compliance with the Local Government Act, in that funds collected for these services are only able to be expended on these services. The remaining Council responsibilities and services are managed through the General Fund. The SRV is associated with the General Fund only.
General Fund - Operating Performance ratio
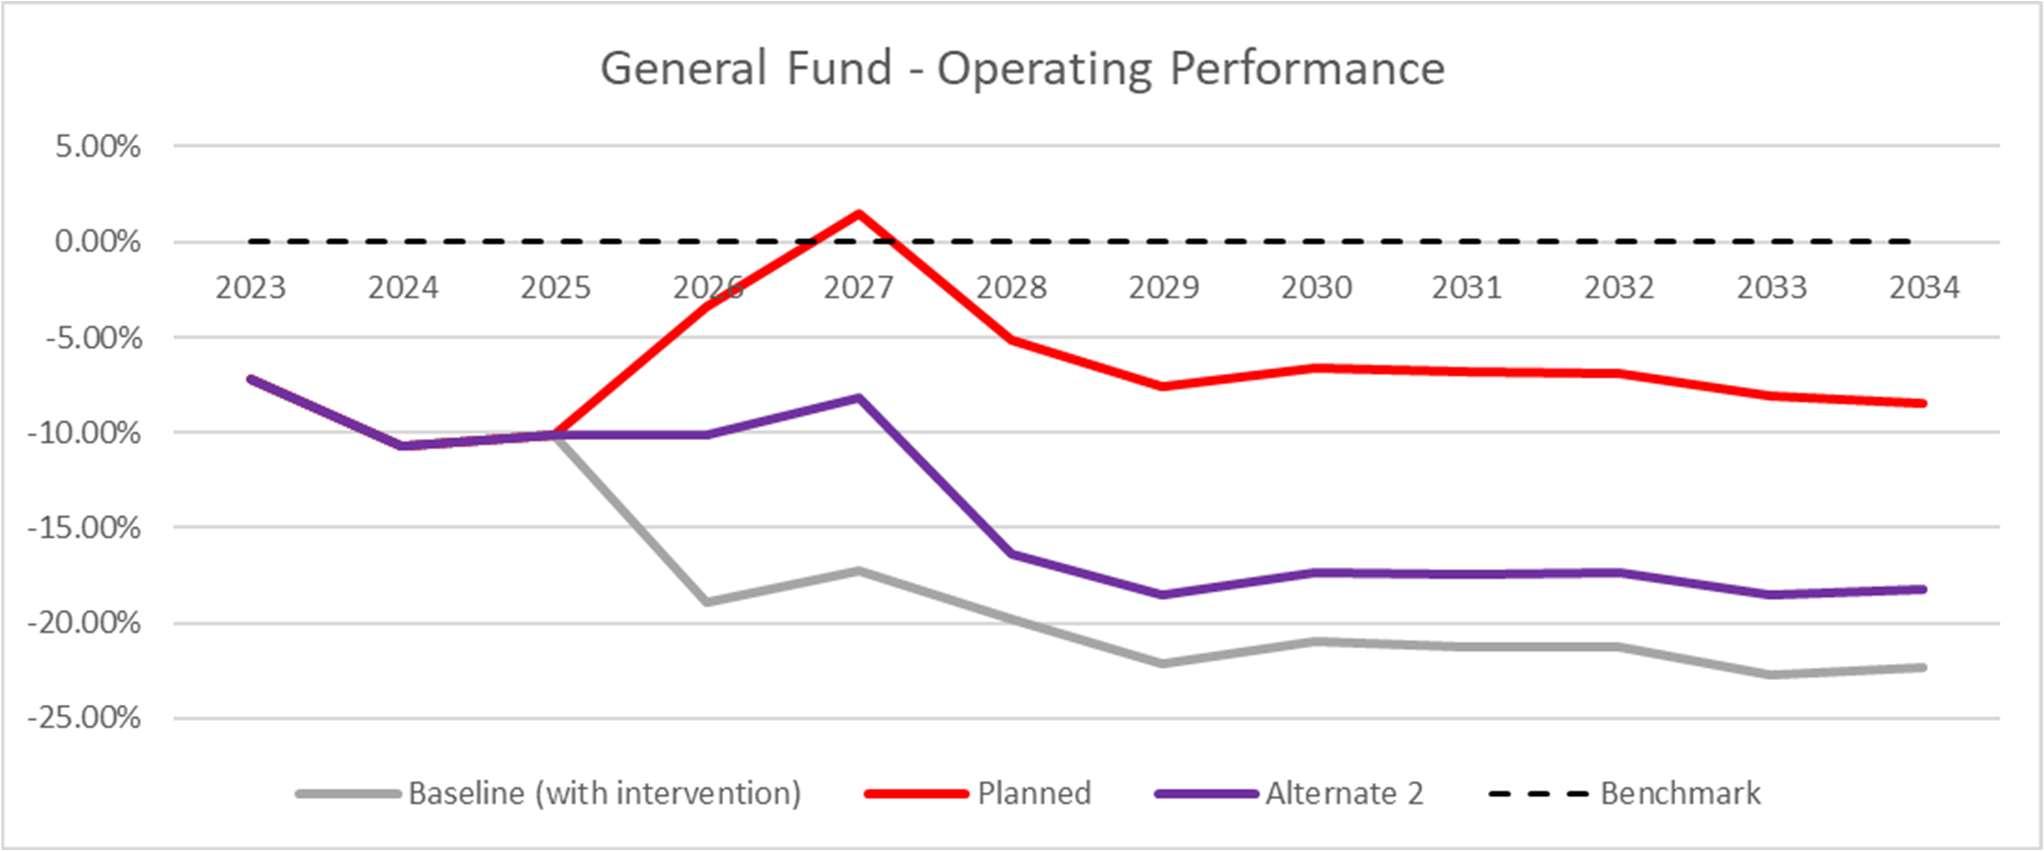
The result of Operating Performance ratio on General Fund for all 5 scenarios against the OLG recommended target shown below.
The Operating Performance ratio measures Council’s net operating result relative to operating revenue. When this ratio is positive, Council is able to provide the existing range of services and appropriately plan for the renewal of assets. It may also mean that Council is able to invest more in discretionary services and infrastructure, such as sporting ovals and community halls.
When the ratio is negative, Council is unlikely to be able to both provide the existing range of services and appropriately plan for the renewal of assets. This means that compromises are made between delivering services and renewing Council assets, such as roads, footpaths, halls, etc.
In the Planned (recommended) scenario (red in the graph below), with a cumulative SRV increase of 69.94%, the Operating Performance ratio will surpass zero in Year 3 however remains negative for the following seven years. Baseline scenario (in grey) will not achieve an operating surplus in any of the ten years. Same result achieved with the Alternate 2 scenario (in purple), with locking in the temporary scenario.
4.3 Asset management improvements
The State of our Council Infrastructure Asset (SOCIA) report was presented to the November 2022 Council meeting, providing a summary of the current situation of council’s assets based on a risk assessment approach. The report informs the Strategic Asset Management Plan (SAMP) and the report on infrastructure assets contained in the annual financial statements.
Council’sStrategicAssetManagementPlan(SAMP),adoptedinearly2023,definesitsstrategicdirection(where Council wants to be, considering the current situation) and objectives to keep it on track. While the SOCIA Report identifies the cost of work required to bring all assets to a satisfactory standard, the SAMP outlines council’s limited financial capacity and utilising a risk management approach and prioritises the assets that can be brought to a satisfactory standard.
The Baseline and Alternate scenarios contain 100% of the recommended asset renewal from the updated SAMP. The Baseline with intervention scenario has a significant reduced level of asset renewal in order to provide more time to determine future service levels available to the community. Meanwhile the Planned scenario only marginally trim the recommended asset renewal.
A Roads Strategy Committee was previously established to provide a better understanding of Council’s asset management and renewal requirements with respect to roads, enabling appropriate long term financial planning to be undertaken. Work will continue with this Committee in 2024/25 to progress improvements.
Figure 2 – Operating Performance Ratio (General Fund)
5 SCENARIOS
Under the NSW Integrated Planning and Reporting framework, the development process for the LTFP should include financial modelling of different scenarios (e.g., planned/optimistic/conservative). The use of scenarios providestheCouncilwith anidea ofhowmuch flexibilityis inthePlanand howmuchlatitudeit haswithvarious projects and scenarios.
The scenarios modelled are important when discussing the financial implications of the Community Strategic Plan with residents and will also assist councillors in developing suitable actions for the Delivery Program.
If councils are considering applying for a special rate variation, one of the financial scenarios developed must address this option. This will help to enable the discussion with the community about the costs and benefits of any potential increases in rates.
For the purpose of this LTFP 2024-2034, four options have been prepared plus another scenario reflecting the outcomefromthecommissionedindependentreview.Year1isthesameineach,beingthedraft AnnualBudget for 2024/25, when the approved temporary SRV will cease.
Year 1 provides a $55.0 million annual operating program and $19.3 million capital program for 2024/25. Year 1 includes changes in service levels relating to General Fund service delivery as compared to 2023/24. The modelling includes the following:
Increase service level in:
o Asset renewal with 100% of recommended road and other General Fund infrastructure asset renewal recognised per the Strategic Asset Management Plan. Total capital program is estimated to cost $240 million over 10 years;
o $1 million building preventative maintenance program over 10 years; and
o Provide additional resourcing for improved planning and building services with projected total of $7 million over 10 years.
Reduce service level in:
o Community recognition weeks, e.g., Youth Week, Seniors Week, Volunteer Week by reducing allocation of $150,000 over 10 years; and
o $420,000 less budget provision for Parks and gardens over 10 years.
Cease service in:
o Community Grants Program by removing allocation of $600,000 over 10 years.
These changes are maintained through the duration of the LTFP. Further service level changes may be considered as Council’s financial sustainability work continues.
There are no proposed changes to service levels in Water Fund and Sewerage Fund services. The LTFP includes the expansion of the three-bin domestic waste collection service commencing 1 July 2024 for those properties currently serviced by one bin. This is contained in the Waste fund is cost neutral to Council.
Changes in service levels continues in Year 2 and 3 in all scenarios:
Year 2 onwards:
o Reduction in tourism program allocation of $450,000 over 9 years;
o $1.6 million reduction over 9 years in subsidy to Ball Park Caravan Park; and
o Decrease subsidy to Service NSW service through additional government service fee or even potential service cessation, which is estimated to cost Council $300,000 over 9 years.
Year 3 onwards:
o $600,000 reduction in allocation for Noxious Weeds program over 8 years.
Again, further service level changes may be considered as Council’s financial sustainability work continues.
The table below illustrates the differences between the scenarios:
Planned Scenario (Recommended):
Council is proposing cumulative SRV of 69.94% over 2 years to improve Council’s financial sustainability (effectively includes the temporary increases of 19.00% and 17.00% levied in 2023/24 and 2024/25)
This scenario provides a $607.4 million operating program and $210.7 million capital program over the 10 years. It contains special ratevariation increase for two years from 2025/26 and 2026/27 being 52.01% & 11.80% (cumulative increase of 69.94%) and provide $646.6 million operating income over the 10 years. This cumulative increase effectively includes the temporary increases of 19.00% and 17.00% levied respectively in 2023/24 and 2024/25.
This scenario includes an increase in roads, footpaths, and drainage maintenance by approx.$14 millionover 7 years from Year 4 onwards.This will assist in addressing the asset management demands of existing infrastructure over an extended period (both maintenance and renewal) and address communityconcernsregardingservicelevelsacrossnumerousservices,suchas planning and building services.
Asset renewal is not at recommended levels however this level of general rate increase enables further analysis and assessment of asset needs and risks to occur over coming years.
Council will have exhausted its unrestricted cash by 2033/34 (Year 10).
Baseline Scenario:
Council demonstrating the impact of delivering planned services and renewing infrastructure assets when recommended, without additional income from SRV or other sources.
Baseline (with intervention) Scenario:
Council modelling a reduce service delivery to address the absence of additional income from SRV.
This scenario provides a $617.8 million operating program and $279.1 million capital program over the 10 years. It does not contain any additional income from special rate variation and provide $581.2 million operating income over the 10 years.
Council will have exhausted its unrestricted cash by 2025/26 (Year 2).
This scenario modelled an increase in roads, footpaths, and drainage maintenance byapprox.$14millionover7 yearsfromYear4 onwards however this will not be possible without an SRV or revenue from other sources. This scenario demonstrates Council capacity to meet what is expected of it: address the asset management demands of existing assets (both maintenance and renewal) and address community concerns regarding service levels across numerous services.
This scenario provides a $583.6 million operating program and $177.5 million capital program over the 10 years. It does not contain any additional income from special rate variation and provide $580.7 million operating income over the 10 years.
Council will have exhausted its unrestricted cash by 2029/30 (Year 6).
This scenario incorporates a reduction in maintenance expenditure and asset renewal from Year 4 onwards. This follows the end of the NSW Government three year funding program that is supporting increased road maintenance from 2024/25 to 2026/27. This will put Council in difficult position to meet the future community needs.
This is the scenario that Council will progress if it is not able to secure a permanent SRV.
Alternate Scenario:
Council is modelling cumulative SRV of 163.93%, which is what needed for Council to be financially sustainable.
(effectively includes the temporary increases of 19.00% and 17.00% levied in 2023/24 and 2024/25)
Independent Review Scenario:
Council is modelling cumulative SRV of 163.93%, which is what needed for Council to be financially sustainable.
(effectively includes the temporary increases of 19.00% and 17.00% levied in 2023/24 and 2024/25)
Alternate 2 Scenario:
Council is modelling cumulative SRV of 33.87%, which is the cumulative SRV increase of 2023 to 2025 temporary SRV plus 2025/26 rate peg.
(effectively includes the temporary increases of 19.00% and 17.00% levied in 2023/24 and 2024/25)
This scenario provides a $617.8 million operating program and $279.1 million capital program over the 10 years. It contains Special Rate Variation increase for three years from 2025/26 to 2027/28 being 70.00%, 35.00% & 15.00% (cumulative increaseof 163.93%) and provide $718.7 million operatingincome over the 10 years.
This cumulative increase effectively includes the temporary increases of 19.00% and 17.00% levied in 2023/24 and 2024/25.
This scenario includes an increase in roads, footpaths, and drainage maintenance by approx.$14 millionover 7 years from Year 4 onwards.This will address the asset management demands of existing infrastructure over an extended period (both maintenance and renewal) and address community concerns regarding service levels across numerous services, such as planning and building services.
Council will have adequate unrestricted cash throughout the 10 year outlook.
This scenario provides a $645.2 million operating program and $240.3 million capital program over the 10 years. It contains Special Rate Variation increase for two years from 2025/26 to 2026/27 being 52.01% & 11.80% (cumulative increase of 69.94%) and provide $645.2 million operating income over the 10 years.
This cumulative increase effectively includes the temporary increases of 19.00% and 17.00% levied in 2023/24 and 2024/25.
This scenario includes an increase in roads, footpaths, and drainage maintenance by approx.$14 millionover 7 years from Year 4 onwards.This will address the asset management demands of existing infrastructure over an extended period (both maintenance and renewal) and address community concerns regarding service levels across numerous services, such as planning and building services.
Council will have exhausted its unrestricted cash by 2027/28 (Year 4).
This scenario provides a $604.3 million operating program and $190.1 million capital program over the 10 years. It contains one off Special Rate Variation increase for 2025/26 being 33.87% and provide $611.2 million operating income over the 10 years.
This cumulative increase effectively includes the temporary increases of 19.00% and 17.00% levied in 2023/24 and 2024/25.
This scenario includes an increase in roads, footpaths, and drainage maintenance by approx.$14 millionover 7 years from Year 4 onwards.This will address the asset management demands of existing infrastructure over an extended period (both maintenance and renewal) and address community concerns regarding service levels across numerous services, such as planning and building services.
Council will have exhausted its unrestricted cash by 2030/31 (Year 7).
5.1 Planned (recommended) Scenario
The Planned (recommended) Scenario provides for a significant general rate increase, with a permanent increase to general rates of 52.01% in 2025/26 and 11.80% in 2026/27 (a cumulative increase of 69.94%). This effectively includes thetemporary general rate increases of19.00% and 17.00% levied in2023/24 and 2024/25.
This scenario has been modelled with a $55.0 million annual operating program and $19.3 million capital program for 2024/25 and a $210.7 million total capital program over the 10 years.
This would provide capacity for Council to address the asset management demands of existing infrastructure over an extended period, improve service levels in infrastructure areas, generally maintain similar levels of service to those currently delivered in other areas and continue to support its financial sustainability journey. As for all scenarios, it will require some service level reductions as detailed in section 5.
This would enable Council to address the concerns being raised within the community regarding Council’s local road network and other ageing infrastructure. It would also enable Council to progress improvements in planning and building service levels, another area of community concern.
The following table summarises the result of the key financial sustainability indicators over the ten years of the LTFP:
Capital expenditure ratio measures capital expenditure in proportion to annual depreciation to measure whether asset is being replaced at the same rate as they wear out. Planned capital works only possible with access to cash flow, which in this scenario will be exhausted by 2033/34 (Year 10).
General rates in the Federation Council area have been amongst the lowest against comparable Councils. To provide services that community members expect requires additional revenue to support. Where possible this is supported by increased fees and charges. Where these services are public goods that provide benefits to all community members, then general rates are recognised as an appropriate funding source.
The Planned scenario will provide the additional revenue required to progress asset maintenance and renewal over the next five to seven years. This time frame will also allow progress to be made on implementing improvement actions from the independent review, comprehensive asset management work to be progressed and any changes to the local government financial environment to be introduced, such as Roads to Recovery funding or other funding changes.
This is the adopted scenario for Federation Council for the period commencing 1 July 2024.
5.2 Baseline Scenario
The Baseline Scenario provides for general rates to increase by the rate peg only. It contains rate increases at 4.50% for 2024/25 and 4.80% for 2025/26 as announced by IPART, followed by anticipated rate increases of 3.50% for future years. The future rate peg is higher than the recommended rate set the Office of Local Government (OLG) Guidelines as Council is seeking to capture the target range for inflation forecasted by the Reserve Bank of Australia (RBA).
This scenario has been modelled to demonstrate the financial impact of delivering planned services and renewing infrastructure assets when recommended, without additional income from SRV or other sources.
This scenario would reduce Council capacity to address the asset management demands of existing infrastructure, further reduction of levelsof service in addition to thosein the pipeline and critically deteriorate Council’s financial position.
This scenario results in Council having no unrestricted cash by 2025/26. This would mean that Council is unable to pay its invoices when they are due and payable nor pay staff wages for work undertaken. This financial positionwouldnot beacceptabletoCouncil,thecommunityortheNSWGovernment.Accordingly,theBaseline
scenario with intervention (section 5.3) has been developed to clearly identify Council’s financial approach if there is no future SRV approved and implemented.
The following table summarises the result of the key financial sustainability indicators over the ten years of the LTFP for Baseline scenario:
Ratio Target GeneralFund WaterFund SewerFund
Operating Performance >0 Notachievedoverten years Achievedfromyear2 Achievedfromyear4
OwnSourceRevenue >60% Notachievedoverten years Achieved Achieved
Capital expenditure ratio measures capital expenditure in proportion to annual depreciation to measure whether asset is being replaced at the same rate as they wear out. Planned capital works only possible with access to cash flow, which in this scenario will be exhausted by 2025/26 (Year 2).
To addressthisisinthe short term,without increasingrevenue,wouldrequire anadditional reductionincapital renewal program or an additional annual reduction in operating expenditure (or a combination). This is containedintheBaselinewithinterventionscenarioandwouldtranslatetosubstantialreductionintheservices that Council provides the community.
To address this is in the longer term, without increasing revenue, would require an average annual reduction of circa $8 million, or 32% of cash operating expenditure, from Year 2 onwards. This would require drastic service level reductions and could include ceasing all non-legislated services and reducing services where possible, such as:
ceasing community programs, tourism events, hard copy communications, visitor information services, youth programs, seniors programs, etc.
selling underutilised community halls
reducing opening hours of libraries, swimming pools, Council’s customer service centres, etc
reducing the number of parks and gardens maintained by Council and reducing the standard to which remaining are maintained at
introducing limitations on vehicles able to use roads and in times of wet weather
leasing out or sale of Council buildings.
Community engagement would need to occur prior to any decisions being made to identify which of these is most important to residents in the Federation Council area.
Alternatives to significant service reductions have been considered and this principle underpins Council’s financial sustainability approach contained in section 4.
5.3 Baseline with intervention Scenario
The Baseline with intervention Scenario provides a variation of the Baseline scenario. It implements changes that can be made in the short term to delay reaching a position of inadequate unrestricted cash.
Consistent with the Baseline scenario, it contains rate increases at 4.50% for 2024/25 and 4.80% for 2025/26 as announced by IPART, followed by a rate increase of 3.50% for future years. The future rate peg is higher than the recommended rate set the Office of Local Government (OLG) Guidelines as Council is seeking to capture target range for inflation forecasted by the Reserve Bank of Australia (RBA).
This scenario would reduce Council’s capacity to address the asset management demands of existing infrastructure, further reduction of levelsof service in addition to thosein the pipeline and critically deteriorate Council’s financial position.
It models a significant reduction in recommended asset renewal, effectively delaying when Council will be able torenew assets.Thiswill result in assetsdeteriorating,likelybeyond standardsexpectedbyour communityand likely to be adversely impacting safety also.
The following table summarises the result of the key financial sustainability indicators over the ten years of the LTFP for Baseline scenario with intervention:
Ratio Target GeneralFund WaterFund SewerFund
Operating Performance >0 Notachievedoverten years Achievedfromyear2 Achievedfromyear4
OwnSourceRevenue >60% Notachievedoverten years Achieved Achieved
This scenario results in Council in having no unrestricted cash by 2029/30 (year 6) as reported in the Council Reserves report. This would mean that Council is unable to pay its invoices when they are due and payable nor pay staff wages for work undertaken. This is not an acceptable financial position for Council.
To addressthisisinthe short term,without increasingrevenue,wouldrequire anadditional reductionincapital renewal program or an additional annual reduction in operating expenditure (or a combination). This would translate to substantial reduction in the services that Council provides the community.
To address this is in the longer term, without increasing revenue, would require an average annual reduction of circa $8 million from Year 2 onwards. This would require drastic service level reductions and could include ceasing all non-legislated services and reducing services where possible, such as:
ceasing community programs, tourism events, hard copy communications, visitor information services, youth programs, seniors programs, etc.
selling underutilised community halls
reducing opening hours of libraries, swimming pools, Council’s customer service centres, etc
reducing the number of parks and gardens maintained by Council and reducing the standard to which remaining are maintained at
introducing limitations on vehicles able to use roads and in times of wet weather
leasing out Council buildings.
Community engagement would need to occur prior to any decisions being made to identify which of these is most important to residents in the Federation Council area.
Alternatives to significant service reductions have been considered and this principle underpins Council’s financial sustainability approach contained in section 4.
5.4 Alternate Scenario
The Alternate Scenario demonstrates the required Special Rate Variation for Council to generate an operating surplus and to have adequate unrestricted cash in the 10-year plan. It contains rate increases at 4.50% for 2024/25, followed by a Special Rate Variation for three years from 2025/26 to 2027/28 being 70.00%, 35.00% & 15.00% (cumulative increase of 163.93%). This effectively includes the temporary general rate increases of 19.00% and 17.00% levied in 2023/24 and 2024/25.
This scenario has been modelled with a $55.0 million annual operating program and $19.3 million capital program for 2024/25 and a $279.1 million total capital program over the 10 years.
This would enable Council to address the concerns being raised within the community regarding Council’s local road network and other ageing infrastructure. It would also enable Council to progress improvements in planning and building service levels, another area of community concern.
The following table summarises the result of the key financial sustainability indicators over the ten years of the LTFP:
months AchievedexceptforYear 2and10
AchievedfromYear2 onwards
Maintaining a long-term strategic focus, this scenario:
2to4 AchievedinYear1and5 to8
Provides operating surplus in the General Fund for from Year 2 onwards; and
Provides recommended investment in the renewal of existing infrastructure assets.
General rates in the Federation Council area are low against comparable Councils. To provide services that community members expect requires additional revenue to support. Where possible this is supported by increased fees and charges. Where these services are public goods that provide benefits to all community members, then general rates are recognised as an appropriate funding source.
This scenario will address the maintenance and renewal needs of Council’s infrastructure assets.
5.5 Independent Review Scenario
The Independent Review Scenario provides with a permanent increase to general rates of 52.01% in 2025/26 and 11.80% in 2026/27 (a cumulative increase of 69.94%). This effectively includes the temporary general rate increases of 19.00% and 17.00% levied in 2023/24 and 2024/25.
This scenario has been modelled with a $55.0 million annual operating program and $19.3 million capital program for 2024/25 and a $240.3 million total capital program over the 10 years.
Modelling was not based on the updated SAMP as it was still in progress when the review was conducted. This scenario will require some minor service level reductions as detailed in section 5.
This would enable Council to address the concerns being raised within the community regarding Council’s local road network and other ageing infrastructure. It would also enable Council to progress improvements in planning and building service levels, another area of community concern.
The following table summarises the result of the key financial sustainability indicators over the ten years of the LTFP:
Capital expenditure ratio measures capital expenditure in proportion to annual depreciation to measure whether asset is being replaced at the same rate as they wear out. Planned capital works only possible with access to cash flow, which in this scenario will be exhausted by 2027/28 (Year 4).
5.6 Alternate 2 Scenario
The Alternate 2 Scenario provides for a modest general rate increase, with a permanent increase to general rates of 33.87% in 2025/26. This effectively converts the temporary general rate increases of 19.00% and 17.00% levied in 2023/24 and 2024/25 to permanent plus 4.80% rate peg as approved by IPart for 2025/26.
This scenario has been modelled with a $55.0 million annual operating program and $19.3 million capital program for 2024/25 and a $190.1 million total capital program over the 10 years.
This scenario would notably reduce Council’s capacity to address the asset management demands of existing infrastructure, further reduction of levelsof service in addition to thosein the pipeline and critically deteriorate Council’s financial position.
The palatable increase in general rate means that a significant reduction in recommended asset renewal, effectively delaying when Council will be able to renew assets. This will result in assets deteriorating, likely beyond standards expected by our community and likely to be adversely impacting safety also.
The following table summarises the result of the key financial sustainability indicators over the ten years of the LTFP for Baseline scenario with intervention:
Capital expenditure ratio measures capital expenditure in proportion to annual depreciation to measure whether asset is being replaced at the same rate as they wear out. Planned capital works only possible with access to cash flow, which in this scenario will be exhausted by 2030/31 (Year 7).
6 SENSITIVITY/ASSUMPTIONS
The following is an overview of key assumptions which have been in the preparation of the Operating, Delivery Program and Long Term Financial Plan:
6.1 Levels of Service
Current levels of service for infrastructure assets (roads, footpaths, bridges, halls, etc) are assumed to be unsatisfactory. This conclusion is drawn from community feedback received in relation to infrastructure assets and professional assessment of the assets and their current and future asset management needs. Council is seeking to address this through the proposed Special Rate Variation and this is planned for in this LTFP.
Minor service level reductions have been factored into the LTFP as detailed at the commencement of section 5.
Current levels of service for other services are assumed to be satisfactory and have therefore been used as a baseline for the costing to financial projections. These service levels will be reviewed over the coming four years.
6.2 Asset Renewal Predictions
This LTFP has been informed by asset renewal predictions using broad assumptions at a program level.
A comprehensive ten-year plant and fleet program has now been developed to inform the LTFP. Renewal of other assets has been taken from the draft Strategic Asset Management Plan for 2024. Condition and capacity assessments are improving, providing increased confidence in predictions of when individual assetswill require renewal or upgrade. Asset management process improvements continue to be made, providing more detailed assessment and predictions of asset renewals at an asset level.
6.3
Indexation Rates
A range of indexation has been applied to the income, expenditures and capital works planning. The following table details the minimum indexation rates applied in the financial statements for 2024/25.
6.4 Workforce Levels
Workforce levels have been budgeted based on the organisational structure that was adopted in September 2019 and minor amendments that have been made since that time. A Workforce Management Strategy was adoptedinJune2022andiscurrentlybeingimplemented.Thisisdirectingcapacityandcapabilityenhancement over the coming years, with a key focus on organisational culture.
The proposed permanent Special Rate Variation to commence from 2025/2026 is proposed to provide increased investment in Council’s extensive asset network. Over time there will be an increase in capital investment. As this progresses, analysis will be undertaken to deliver this increased capital investment in the
most efficient and effective manner. This may result in changes to workforce levels. Any changes will be included in updates to this plan.
6.5 Roads to Recovery Funding and Own Source of Funds Expenditure:
Council is required to maintain at least $1.982 million expenditure on roads per year, funded from own source funds such as rates and charges, to meet the requirements of the Roads to Recovery (RTR) funding agreement.
This Federal Government RTR program provides Council with an average amount of around $1.65 million in annual funding, primarily for use on Council Local Roads and Streets.
6.6 Rate Pegging:
The rate peg has been modelled 4.50% for 2024/25 and 4.80% for 2025/26 as announced by IPART follow by 3.50% for the remaining years of the LTFP.
6.7 Rate Income:
The level of rate income modelled in this plan varies for each of the scenarios:
Planned scenario (as recommended): 2025/26 and 2026/27 with SRV increase of 52.01% and 11.80% (cumulative increase of 69.94%), then followed by 3.50% increase for the remainder of the LTFP (this effectively includes the temporary increases of 19.00% and 17.00% levied in 2023/24 and 2024/25).
Baseline scenarios: rate peg of 4.50% for 2024/25 and 4.80% for 2025/26 followed by 3.50% applied to 2026/27 onwards.
Alternate scenario: 2025/26 to 2027/28 with SRV increase of 70.00%, 35.00% and 15.00% (cumulative increase of 163.93%), then followed by 3.50% increase for the remainder of the LTFP (this effectively includes the temporary increases of 19.00% and 17.00% levied in 2023/24 and 2024/25).
Independent Review scenario: 2025/26 and 2026/27 with SRV increase of 52.01% and 11.80% (cumulative increase of 69.94%), then followed by 4.50% increase for 2027/28 and 3.50% for the remainder of the LTFP (this effectively includes the temporary increases of 19.00% and 17.00% levied in 2023/24 and 2024/25).
Alternate 2 scenario: 2025/26 with SRV increase of 33.87%, then followed by 3.50% increase for the remainder of the LTFP (this effectively includes the temporary increases of 19.00% and 17.00% levied in 2023/24 and 2024/25).
Council have adopted a change in rating structure for FY2024/25 by maintaining the base rate and any increase in general rates will be collected through ad valorem.However, this does not have any impact to the total rates that Council is permitted to levy on rateable properties in the Council area.
6.8 Water and Sewer Fees and Charges
A number of major upgrades in the Water and Sewerage Treatment Plants (Mulwala Water, Howlong and Corowa Sewerage) are expected to be planned, designed and costed (and in some case commenced) over the period of the LTFP. In addition to the treatment plants, further asset assessments are likely to reveal major replacements or upgrades of other aspects of the network, such as additional reservoirs, ring mains, and pump and valve replacements.
Pricingin the areasofwater and sewerwillbemore comprehensively reviewedin2024/25 asmore information becomes available for the detailed design and operations for the new treatment plants and the other factors outlined above.
An increase of 8% has been applied to the sewer fees and charges across the 10 year LTFP and this is likely to be increased as more asset data is obtained.
Water Access fees have been increased to $242.55 for 20mm meter size to align charges with Best Practice Water Supply and Sewerage guidelines with an appropriate split between the revenue generated from access charges to consumption charges (recommended 25/75, currently at 23/77), while usage fees have been
increased to $2.05 per kl for water consumption up to 350 kl and at $3.05 per kl thereafter. 2024/25 charges increase by 10% for access charges and 7% for consumption and 5% increase for the remainder of the LTFP.
6.9 Fees and Charges
Federation Council applies a range of fees and charges for services provided to the community. These are reviewed annually and set as part of Council’s Revenue Policy. Regulatory fees have been increased in accordance with legislation. However, non-legislated fees and charges increase at minimum by rate peg of 4.50% for first year followed by 3.50% thereafter with some exception including:
Cemetery fees - Council will be formulating strategies towards full cost recovery model and harmonising fees across the local government area in the coming years;
Urana newsletter – advertising charges increase by 20%; and
Kerbside waste collection – with the execution of new Cleanaway contract, 3-bin collection fee for existing serviced properties will increase by 11% and transitioning properties by 33%.
Further work is anticipated on fees and charges as per recommendations 1 and 2 from the Independent Review led by Professor Joseph Drew, which in summary recommend Council moves to cost recovery for non-mandated services, or if not acceptable, clearly articulating to the community where merit based subsidies are in place.
6.10 Grants Provided for Operational Purposes
Financial Assistance Grants (FAGs) are received from the Commonwealth Government and are a major source of Council’s revenue.
The amount of the FAGs provided to Council eachyear has varied over the past 10 yearswithvariations ranging from no increments to an increase equivalent to CPI. Further lobbying is occurring both state and nationally to gain an increase in this funding.
Currently, Federation Council is also reliant on the Federal Government to maintain the Roads to Recovery Program for an average amount of $1.65 million. This amount has also been noted as operational revenues though it can only be utilised for Capital Works associated with transport services. A conservative grant index (CPI) of 1.5% has been applied to recurrent grants anticipated across the 10-year LTFP except for grants tied up with Council staffing, e.g. Library, road safety and mobile preschool with 3.5% indexation applied.
6.11 Capital Grants
Capital grants of a competitive nature have been included at the cost of the project, or the anticipated portion. Projects relying upon capital grants (competitive) will only continue if the funding expected is received, or otherwise prioritised by Council.
6.12 Expenditure - Maintenance Costs (Materials and services)
Maintenance budgets have been reviewed by respective management areas. Considering the current inflation, indexation is set at 3.5% across the 10-year of the LTFP.
6.13 Expenditure - Wages Increase (inclusive of employee benefits and on-costs)
Alabourindexationapplied to wagesovertheLTFP are3.5%plusoneoff bonus inthe first2yearsasnegotiated by the Union under the new Local Government Award that have taken effect from 1 July 2023.
6.14 Expenditure – Non-Capital (Depreciation and Amortisation)
Federation Council will continue to undertake a revaluation program on all Council assets as required for financial reporting purposes.
Depreciation costs used in the LTFP relate to existing assets and any proposed capital works. The results of future asset revaluations may result in depreciation estimates being revised over time.
Depreciation estimates remain static through the duration of the LTFP. Depreciation will increase when new assets are purchased or constructed. There are minimal new assets proposed over the next ten years. The key focus in thisplan isto renew existingassets.There willalso bechange when revaluations areundertaken. Given the level of uncertainty, future annual estimates have not been made.
6.15 Expenditure –Other Operating Expenses
Approximately 85% of Council other expenses is made of contribution or levies to other levels of governments, i.e. emergency service levy. Indexation of 3.5% were applied throughout the LTFP.
6.16 Borrowings
Council is forecast to have borrowings of approximately $12.95 million by 30 June 2024 and interest expense has been projected based on the interest rates applicable for each loan. No additional borrowings have been included in the ten year outlook.
Strategic work is currently underway to determine future needs of Council’s water and sewer services, particularlytherenewaloftheCorowaSewageTreatment PlantandtheMulwalaWaterTreatmentPlant.There are some government grant programs to assist councils in renewing water and sewer infrastructure. Further assessment of future borrowing requirementsfor the Water and Sewer Funds will be undertaken inthe coming year as the strategic work on water and sewerage services advances.
6.17 Reserves
There are numerous restrictions on Council cash that are required to be maintained. In particular, funds collected from the provision of water supply services, sewerage services and domestic kerbside collection are only able to be expended on the respective service being supplied. There are also restrictions where grant funding is received for a specific purpose and may only be expended on that purpose. These are referred to as external restrictions.
Council also has internal restrictions set aside to meet future obligations, such as employee leave entitlements, quarry rehabilitation costs, landfill rehabilitation costs or the repayment of borrowings related to specific activities. Annual increase of $200,000 for Waste Reserve is included in internal restriction to ensure that Council has adequate funds available when it is required to rehabilitate its landfills.
7 PRODUCTIVITY IMPROVEMENTS AND COST CONTAINMENT STRATEGIES
Council is committed to delivering services in an efficient and effective manner. To achieve this Council has a continuing focus on identifying and implementing opportunities to improve productivity and contain costs. Productivity improvements and cost containment initiatives that Council are being progressed in the following areas:
Increase productivity of employees through training, the use of technology and implementation of different methods of working
Reduce cost of energy across Council operations
Dispose underutilised assets
Protect and increase revenue streams
Improve financial management practices
Other initiatives to reduce expenditure
Implement initiatives to reduce risk and avoid costs
Changed service levels
Improve asset management practices
The following table overleaf provides a summary of initiatives currently underway and estimated savings.
Increase productivity of employees through training, use of technology and implementing different ways of operating
Implement Forms Express Flexipay for managing direct debits
Implement HR management software for improving communication with staff
Implement Corowa Saleyards software to reduce administration for processing weekly sales
Implement Cemetery software to streamline operations and meet regulatory requirements
Introduce automation of Routine Tasks -
Implement self-service portals, chatbots, or automated response systems for common IT and customer service inquiries. This reduces the need for human intervention and lowers operational costs.
Invest in training programs (inhouse and external) to enhance staff skills.
Continue integration of TRIM and authority to facilitate electronic application management (in conjunction with records and IT)
Introduce wide range of templates in the various application management modules in Authority (DAs; CCs; Vegetation Removal permits; S 68s etc) which pre-populate with data from corporate system
Continue to identify and implement other technology improvements
Productivity saving No
Productivity saving No
Productivity savings / Cost reduction No
of energy across Council operations
practices
Energy audit - change of contracts
Implement energy-efficient IT infrastructure and equipment to reduce electricity consumption and lower utility costs. This includes measures such as energy-efficient servers, and power management systems.
and implement leasing policy
fee for stormwater drainage improvements
Introduce fee for service: Flood Affect Certificate (from 1 July 2024) - a certificate required by private certifiers prior to issuing a complying development certificate. Previously provided free of charge.
Introduce fee for service: Contributions payable Certificate - a certificate required by private certifiers prior to issuing a complying development certificate; Construction certificate or Occupation Certificate. Previously not provided, or info provided via email when requested.
Review and update plant hire rates to ensure full cost recovery of providing the service
Review fees and charges - e.g cemeteries
increase / expenditure reduction
increase
Other initiatives to reduce expenditure
Renegotiate Service NSW agreement to secure either an increased subsidy or align services to match the current subsidy level.
Negotiate contracts with IT vendors and service providers to obtain the best value for money. Consolidate purchasing agreements where possible to leverage volume discounts and reduce overall costs.
print run and mail out of Urana newsletter to those residing outside the Council
Implement tiered supervision model for Corowa Aquatic Centre
Consider Tiered Supervision model for Howlong pool
Ceased community grants program
8 CAPITAL WORKS PLAN
Capital works are asset acquisitions or building and engineering works that construct an asset. Capital works projects would typically include purchase of plant and fleet, construction of new infrastructure and upgrade of existing infrastructure.
Capital expenditure is undertaken to;
Renew or replace - existing asset or a component of an asset that has reached the end of its useful life. With the exception of land, assets have limited useful lives and decline in value due to wear and tear –for example, reseal an existing sealed road or replace a roof on a building such as a public hall.
New - to construct an asset that did not previously exist.
Upgrade (growth or enhancement) - to increase the capacity of existing assets beyond their original design capacity or service potential – for example, widen a bridge or extend a building.
Disposal or decommission - to remove an asset from service that is no longer required.
Council’s Capital Works Plan has been extensively reviewed as an outcome of the service planning process and development of Asset Management Plans.
The priority over this ten year period is to renew existing assets, rather than to create new assets.
A comprehensive ten-year plant and fleet program has been developed to inform the LTFP. Renewal of other assets has been taken from Council’s Strategic Asset Management Plan. Condition and capacity assessments are improving, providing increased confidence in predictions of when individual assets will require renewal or upgrade. Asset management process improvements continue to be made, providing more detailed assessment and predictions of asset renewals at an asset level.
In developing the Capital Works Plan for the LTFP, Council has applied a disciplined approach to the selection and prioritisation of projects, as well as application of a project decision making framework. The decisionmaking framework includes the progression of projects through stages from concept through to execution and closure. Generally, only projectsthat have reached a stage of initiation have been included in the LTFP. Projects that are either at concept or planning phase require further definition before they can be included in the LTFP. This may require further prioritisation to remove or reduce the scope of projects currently included in the LTFP to enable further projects to the included.
Key water and sewer upgrades planned for in the ten-year period include:
Priority Howlong water network upgrade (to be completed in 2024/25)
AnimportantcomponentoftheLTFPistheabilitytomonitorthefinancialperformanceofFederationCouncilwithin the parameters of the plan. To achieve this, Council is closely monitoring the financial performance of outcomes of the plan in accordance with the requirements of Fit for the Future performance measures.
The following indicators are based on consolidated financial result for the planned scenario.
Using consolidated results can mask financial performance. Accordingly key financial sustainability indicators by fund have been prepared for each scenario. A summary of the results is contained in section 5 with the detail contained in section 10.
9.1 Council wide measures
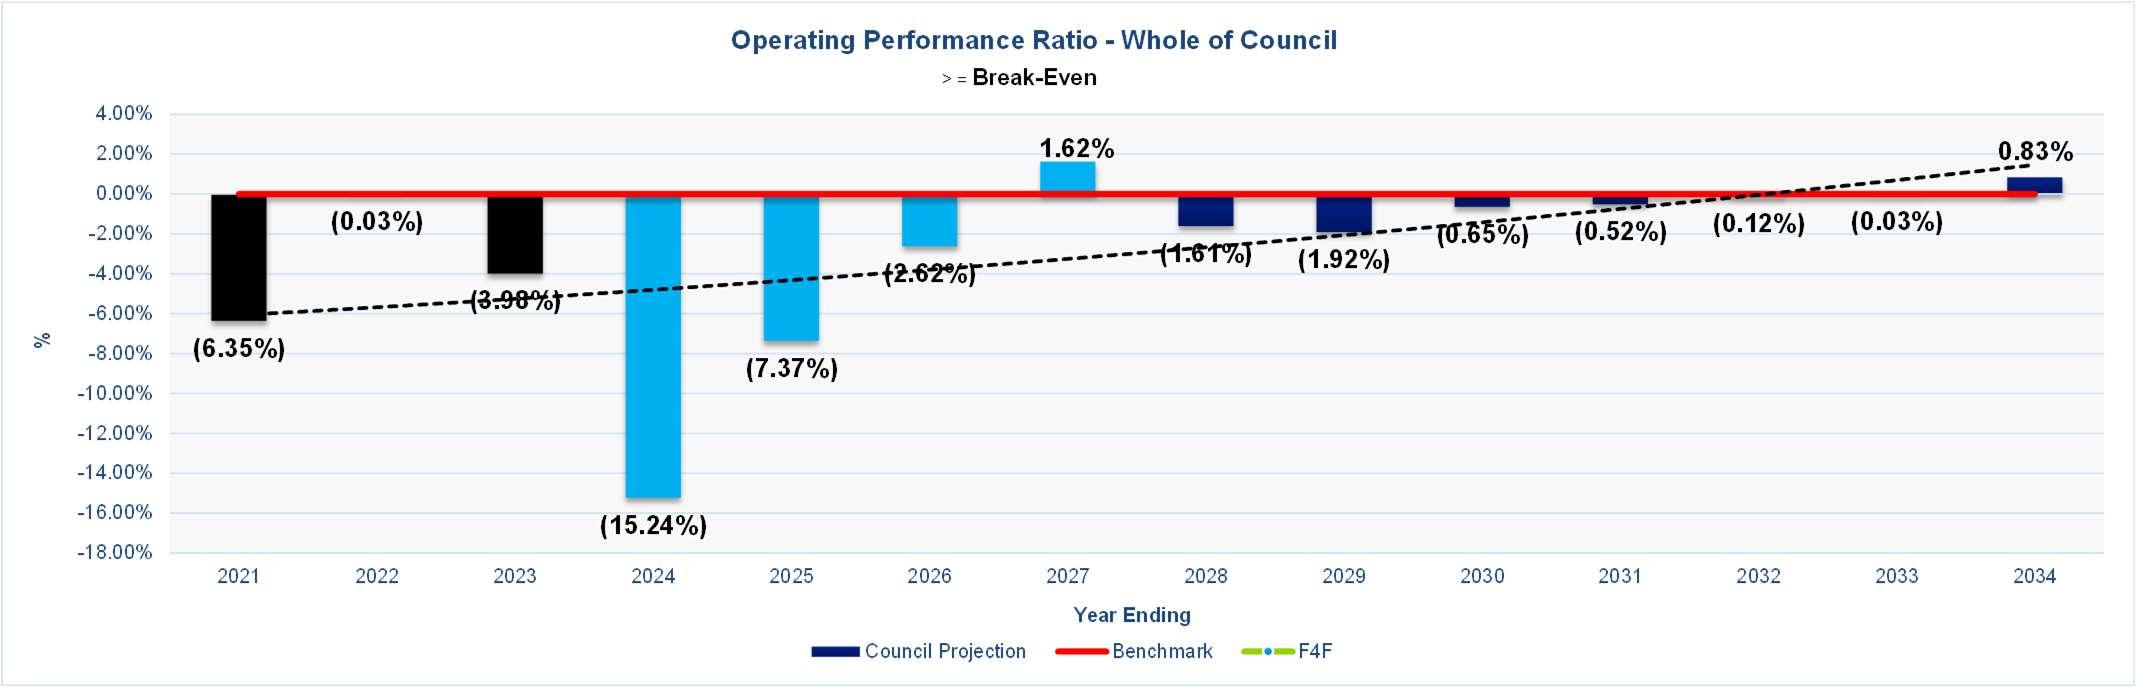
Operating Performance Ratio
Operating Revenue (excl Capital Grants & Contributions) minus Operating Expenses over Operating Revenue (excl Capital Grants & Contributions)
Figure 3 – Operating Performance Ratio
Figure 3 reports that Council is producing a negative operating performance ratio for most of the years except for a breakeven in Year 3. This is due to operating revenue not being adequate to fund the cost of providing services at current levels.
The key for sustainability is whether Council can produce sufficient cash over the long term to replace assets when required. This is more accurately reflected in the Statement of Cashflows, where the cash required for asset renewals is based upon the asset management planning and the Capital Works Plan.
This ratio improves over time due to the proposed Special Rate Variation, water and sewerage service income and the implementation of productivity improvements and cost containment strategies.
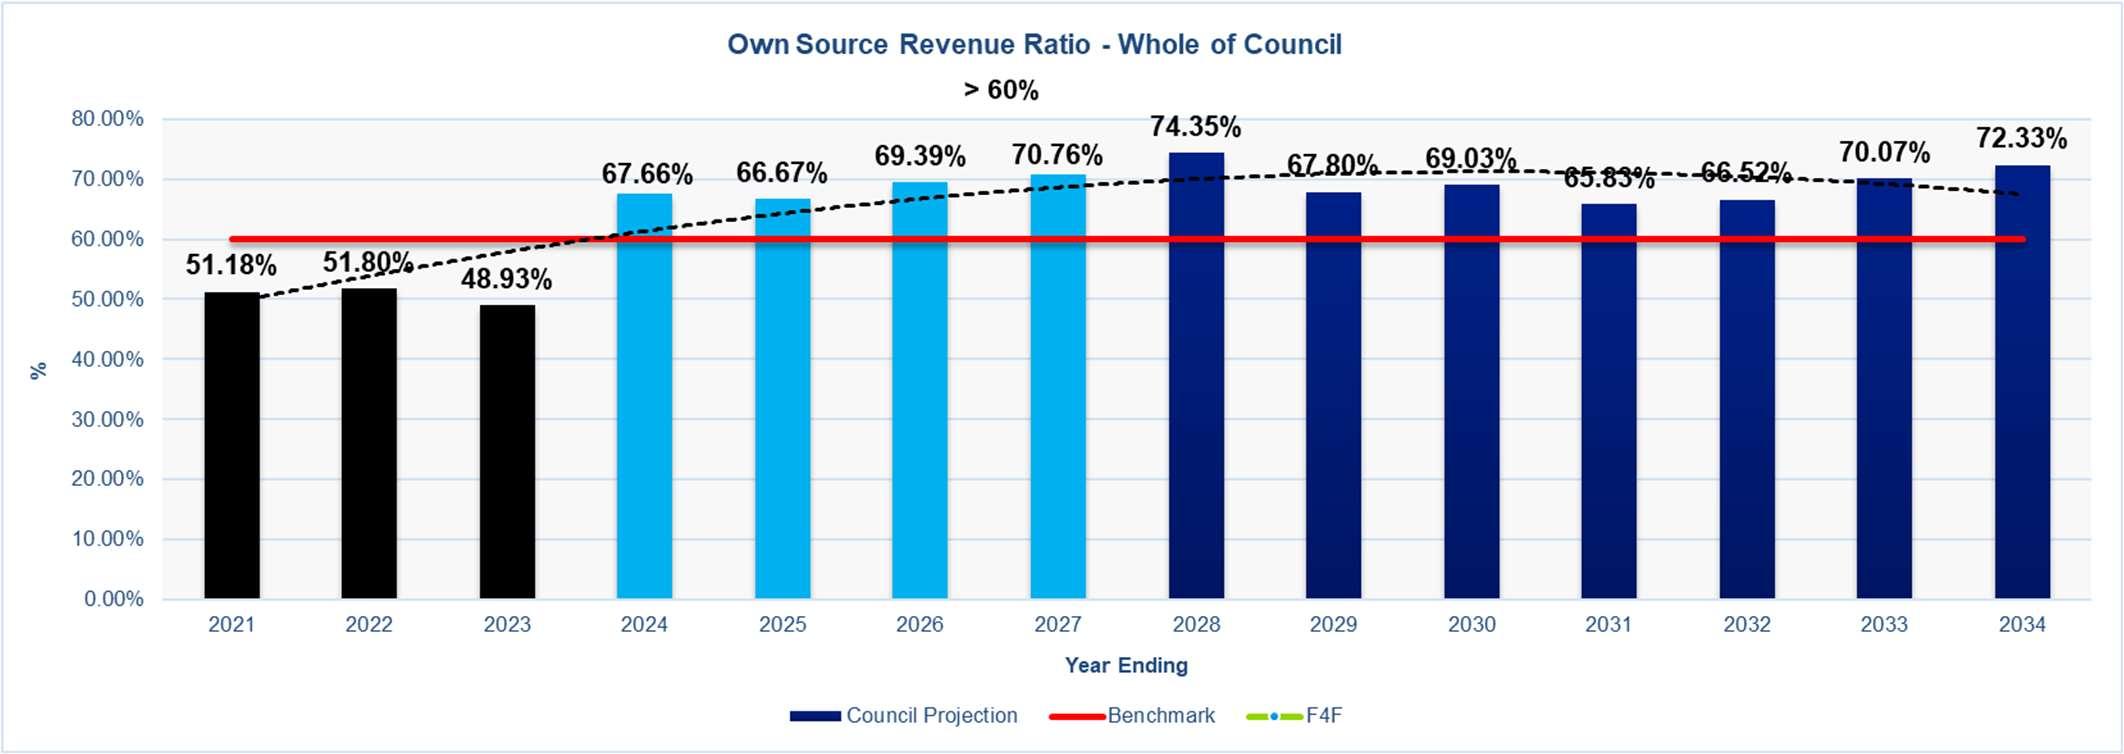
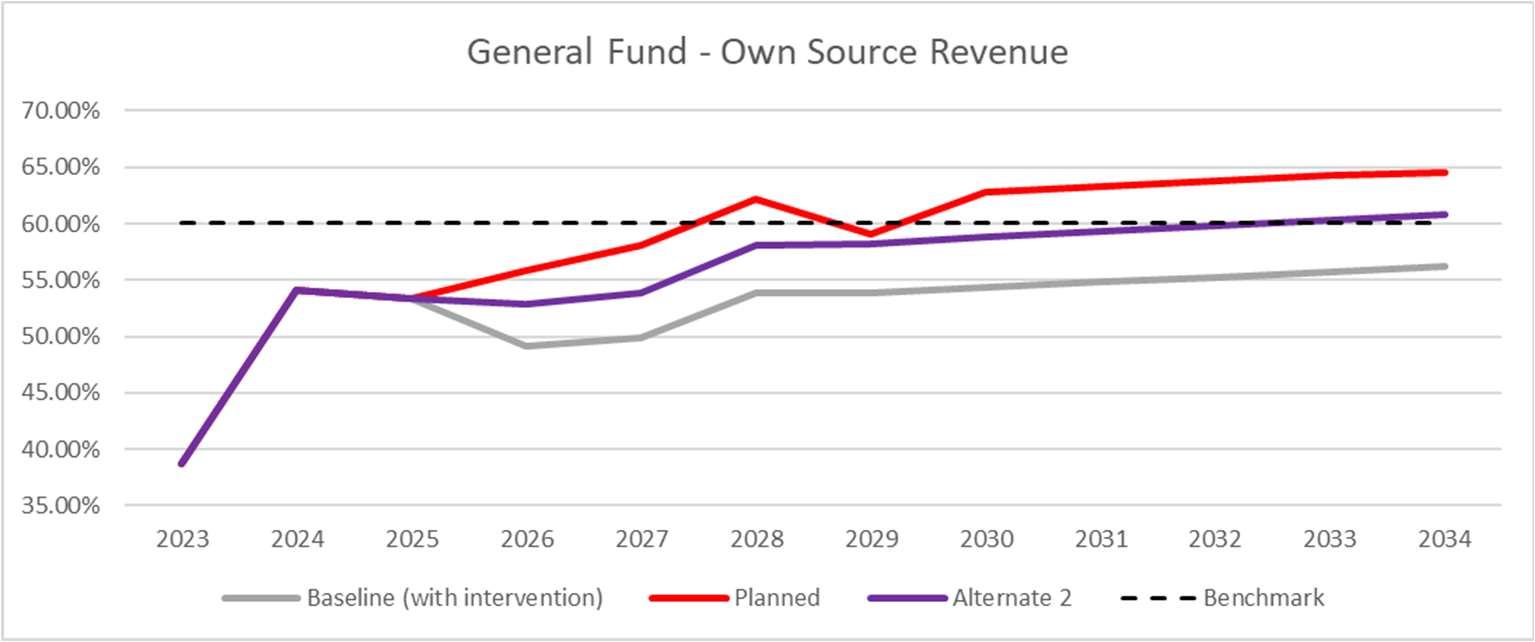
Total Continuing operating revenue minus all grants & contributions over Total Continuing operating revenue inclusive of Capital Grant
Figure 4 indicates that Council’s own source revenue as a percentage of the total revenue maintains over the 10year period of the LTFP. This reflects stability as the proposed Special Rate Variation is implemented and with additional income is received in the Water and Sewer Funds.
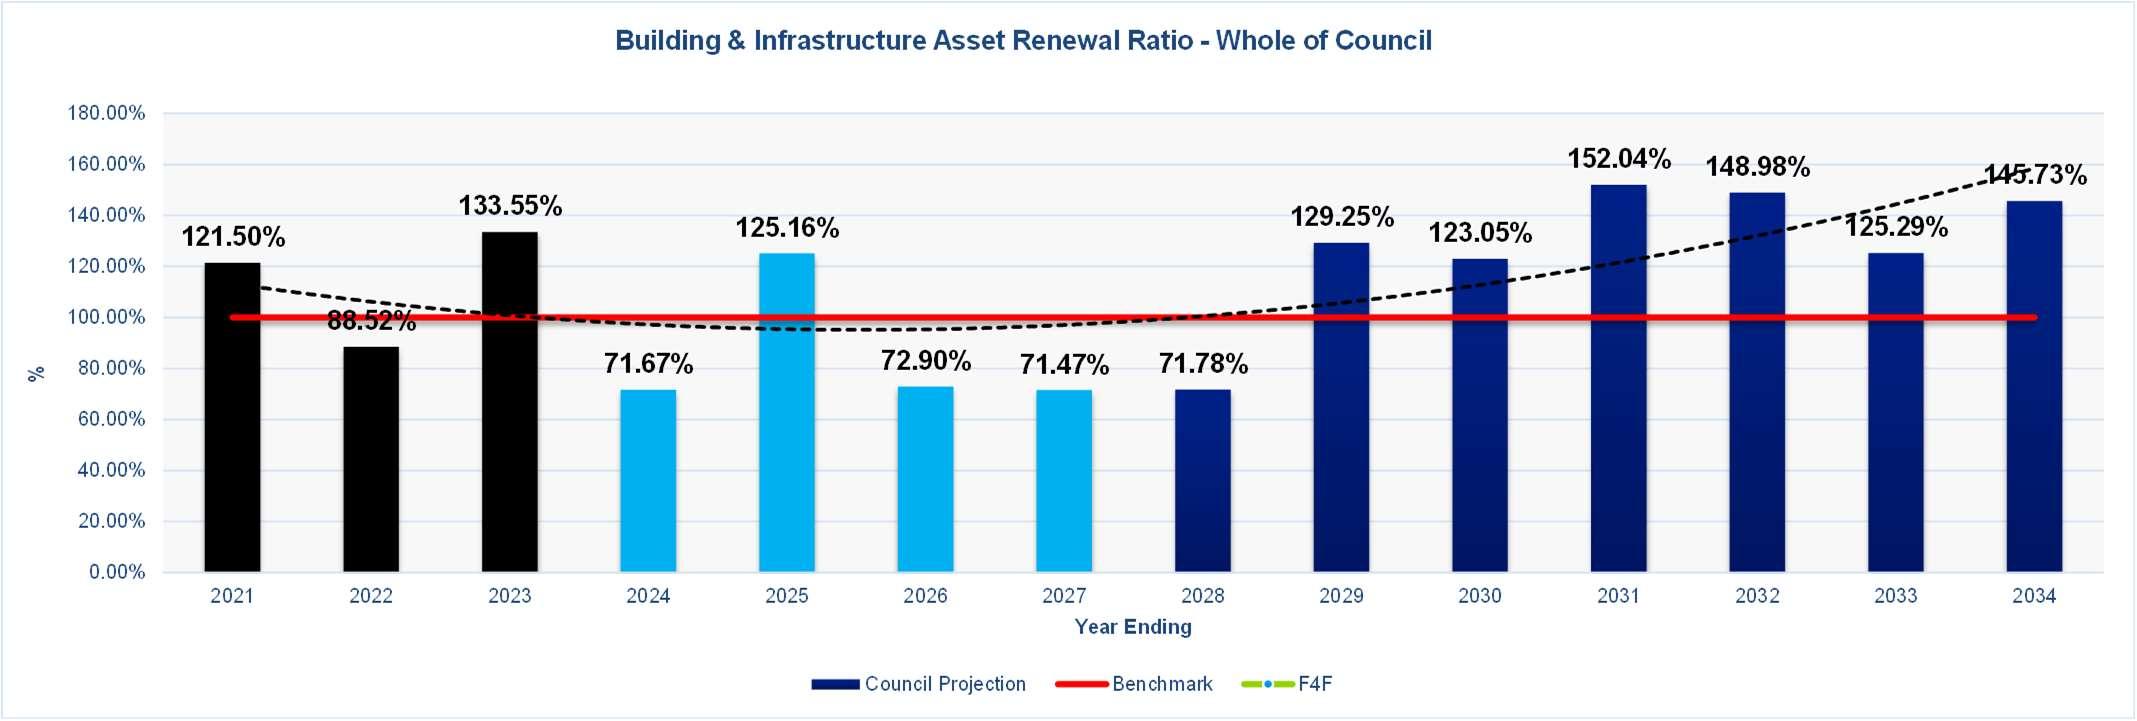
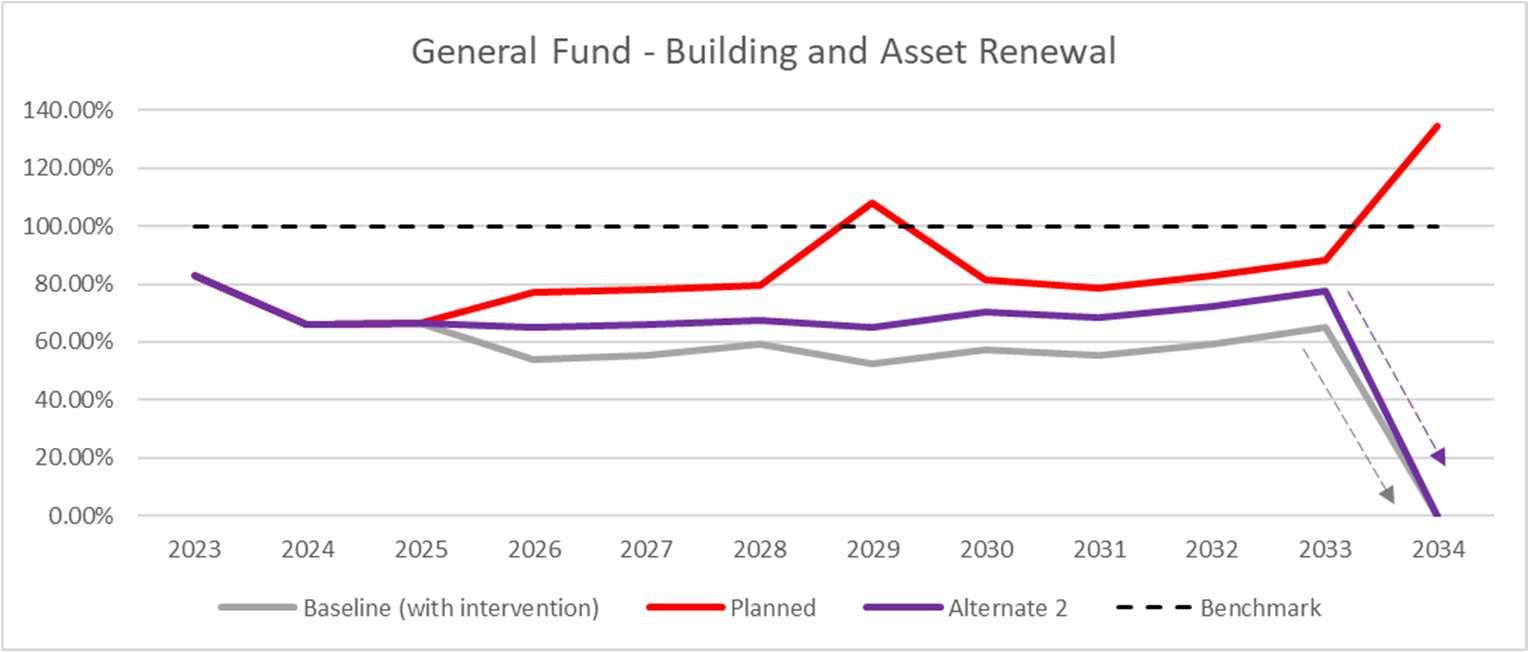
Building and Infrastructure Asset Renewal Ratio
Assetrenewals(building&infrastructure) over Depreciation,amortisation&impairment(building&infrastructure).
Figure 5 indicates that Council has invested heavily in the years 2021 and 2023 on renewal of assets and continues to plan to invest in renewals in the future years. Following this period, Council plans to invest and move towards surpassing the benchmark in the later years of the LTFP. This is only possible through the funds received under the proposed Special Rate Variation.
Figure 4 – Own Source Revenue Ratio
Figure 5 – Building and Infrastructure Asset Renewal Ratio
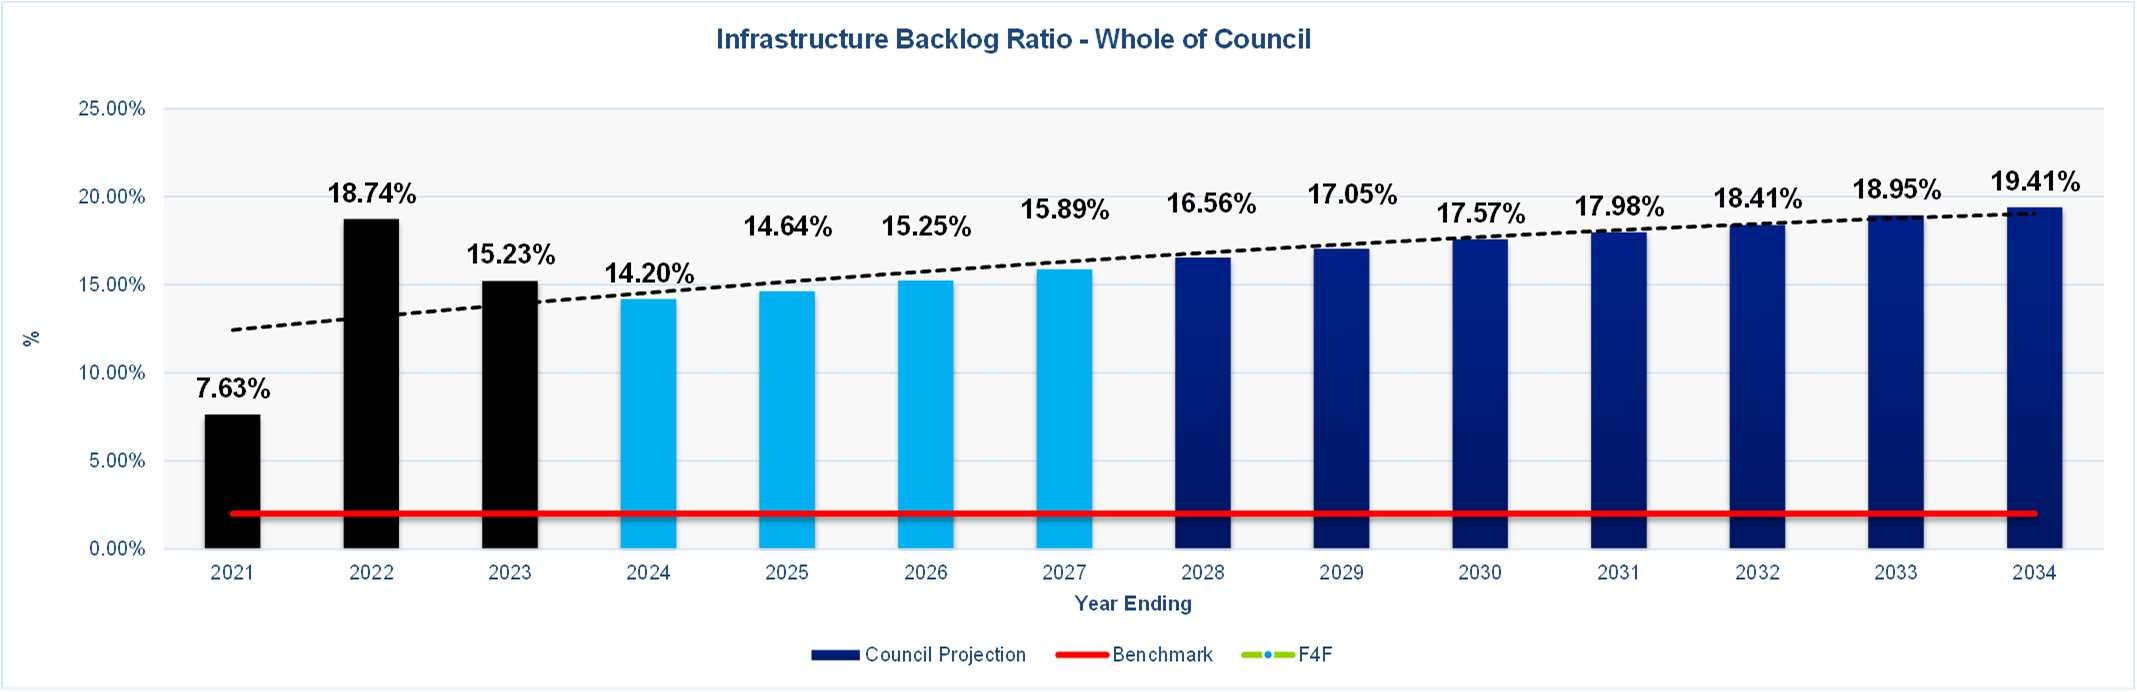
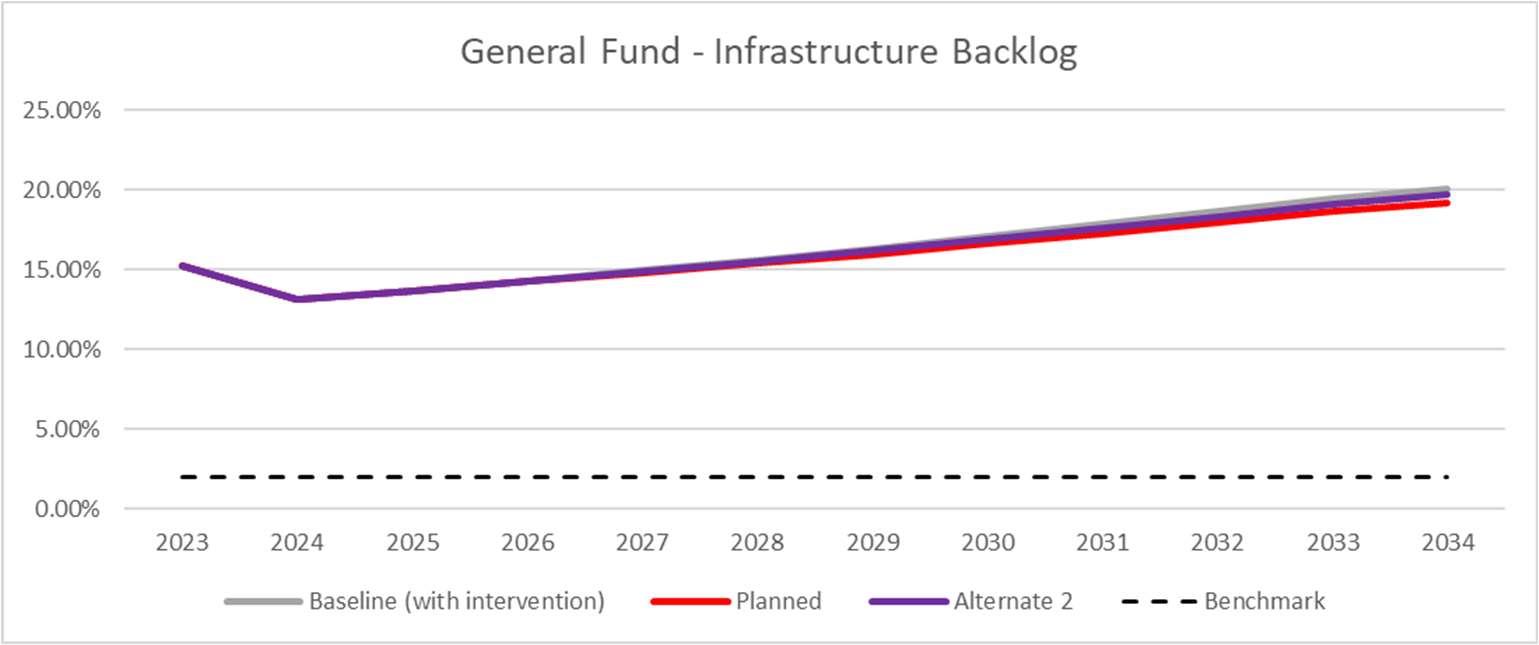
Infrastructure Backlog Ratio
Estimated cost to bring assets to a satisfactory condition over Total Written Down Value of infrastructure, building, other structures & land improvements
Figure 6 – Infrastructure Backlog Ratio
Figure 6 indicates that Council plans to expend sufficient funding in the renewal of existing assets to reduce the backlog by each year across the 10 years of the LTFP. This is possible only if additional funds obtained through the Special Rate Variation are invested in renewing existing assets. This ratio has deteriorated in 2022 as further asset management has been undertaken and a better understanding of the condition of assets is obtained. The impact of the 2022 flood event has not yet been included as it is still being assessed and quantified.
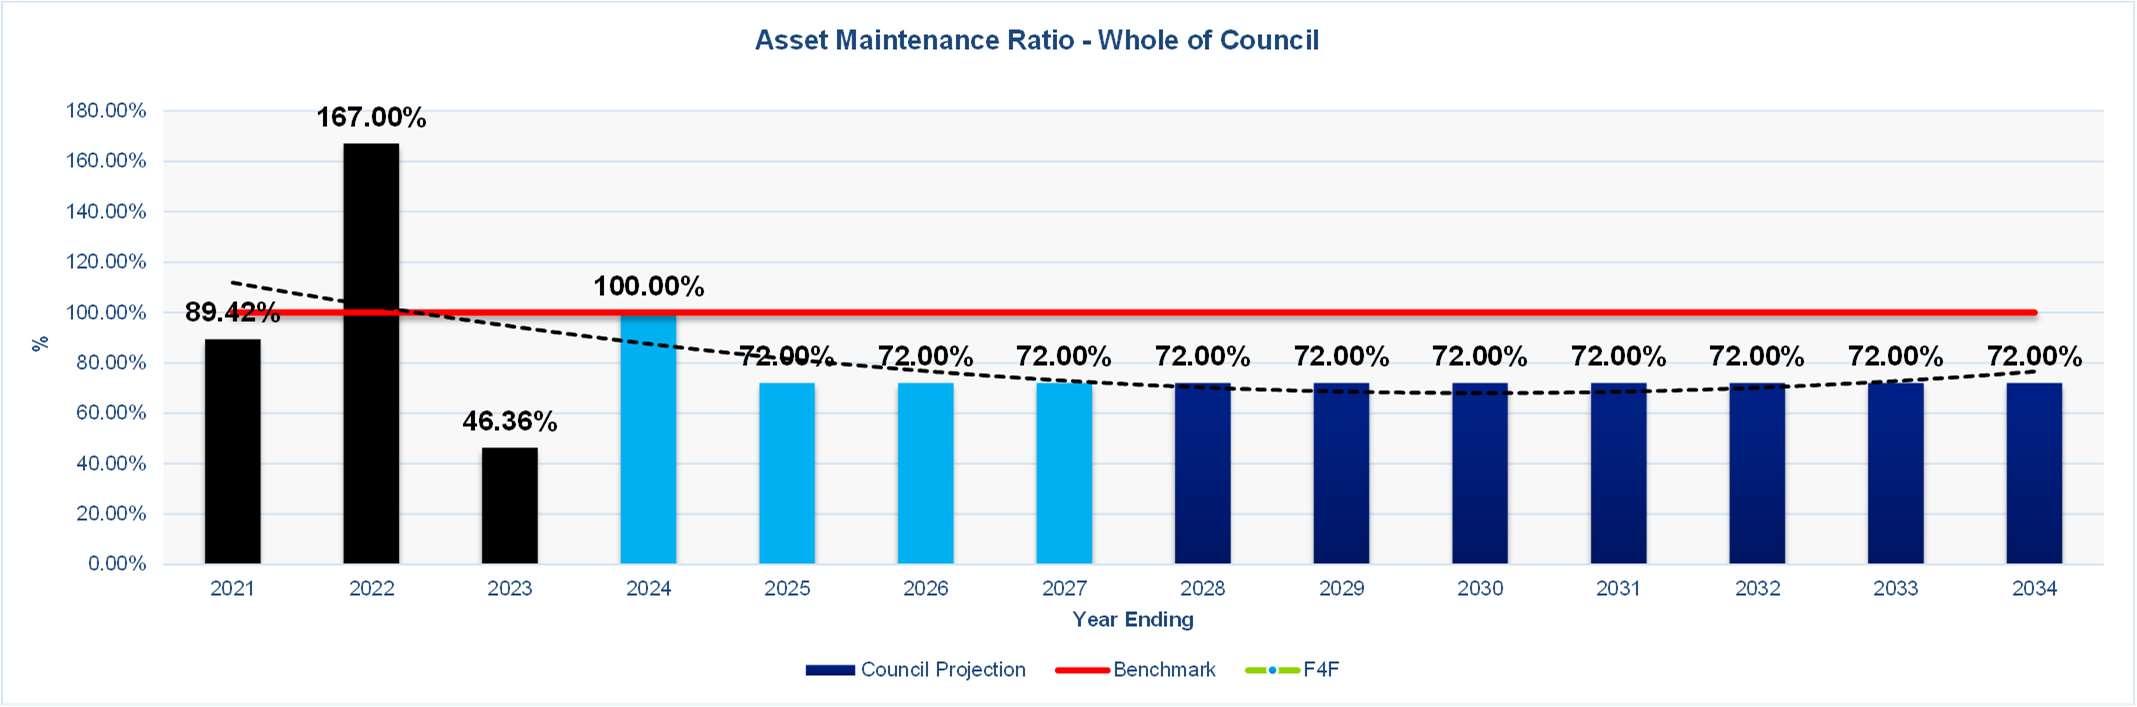
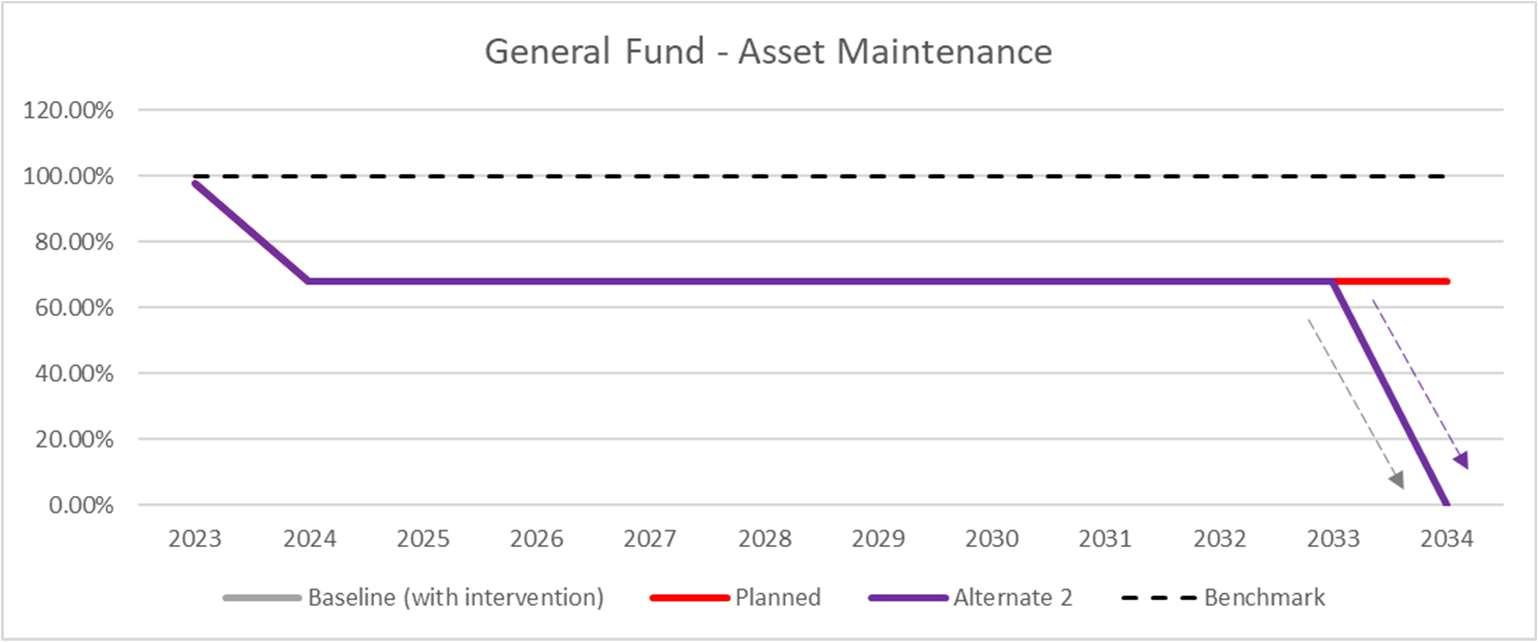
Asset Maintenance Result Ratio
Actual Asset Maintenance over Required Asset Maintenance
Figure 7 indicates that over the ten year LTFP Council is not investing adequate funds into the maintenance of its assets. This will require further management attention to develop robust maintenance programs that it can afford and consider assets that may be divested.
Figure 7 – Asset Maintenance Ratio
Debt Service Ratio
Cost of debt service (interest expenses & principal repayments) over Total continuing operating revenue (excluding capital grants & contrib.).
Figure 8 indicates that Council maintains affordable borrowings over the 10-year LTFP. This is reliant upon a low interest rate.
Real Operating Expenditure per Capita ratio
Real Operating Expenditure over Population
–
Projection in figure 8 based on stagnant population growth in the Council’s local government area in line with zero population growth factored in the rate peg for 2024/25.
Figure 8 – Debt Service Ratio
Figure 9
Real Operating Expenditure per Capita
Operating Performance Ratio
Operating Revenue (excl Capital Grants & Contributions) minus Operating Expenses over Operating Revenue (excl Capital Grants & Contributions)
Figure 10 – Operating Performance Ratio (General Fund)
The red line (Planned) in Figure 10 is a further elaboration of Figure 3. First 3 years is showing improvement and peakedat0.09%beforedecliningandhoversbetween-7.48%to-11.62%.Thisisduetooperatingrevenuenotbeing adequate to fund the cost of providing services at current levels. However, it is performing closer to the benchmark compared to both the Baseline and Alternate 2 scenarios.
Own Source Revenue
Total Continuing operating revenue minus all grants & contributions over Total Continuing operating revenue inclusive of Capital Grant
Figure 11 – Own Source Revenue Ratio (General Fund)
Figure 11 the improvement in this ratio reflects a decreasing reliance upon grants as the proposed Special Rate Variation is implemented in both Planned and Alternate 2 scenarios with the latter scenario taking a longer time to surpass the benchmark. Planned (in red) met the target by Year 4 with slight decrease in the following year but Alternate 2 scenario achieve the target 5 years later in Year 9. Without any additional income from general rates (in grey), Council will not meet the benchmark in the next 10 years.
12 - Building and Infrastructure Asset Renewal Ratio (General Fund)
Both Baseline and Alternate 2 scenarios never met the benchmark duringthe10-year forecast and will plungewhen Council’s cash position is in the negative. Meanwhile, the Planned scenario continue to improve as Council would be in the favourable cash position tocontinue deliverasset renewalin excess of the rate it wearsout.All 3 scenarios weremodelled basedon thereduced recommended capital worksunder theupdated SAMP.Baseline scenario with significant reduction on recommended capital works, followed by moderate reduction in Alternate 2 scenario and Planned scenario with a lesser cut.
Infrastructure Backlog Ratio
Estimated cost to bring assets to a satisfactory condition over Total Written Down Value of infrastructure, building, other structures & land improvements
13 – Infrastructure Backlog Ratio (General Fund)
Baseline (with intervention) scenario has a higher ratio from reduction in capital works program compared to the other scenarios. The reduction is projected to prolong Council’s cash holding but is putting a strain on the infrastructure backlog. The aim is for the line to be pointing downwards towards the benchmark of 2.00%.
As the backlog increases, risk of asset failure increases. This can have significant implications for the safety of the public and of staff.
Figure
Figure
From 2024 onwards, Council is steadily hovering around 30% under the benchmark before plummeting from cash exhaustion in both the Baseline and Alternate 2 scenarios.
Debt Service Ratio
Cost of debt service (interest expenses & principal repayments) over Total continuing operating revenue (excluding capital grants & contrib.).
Figure 15 indicates that Council able to afford to service borrowings over the 10-year LTFP in all scenarios.
Figure 14 – Asset Maintenance Ratio (General Fund)
Figure 15 –Debt Service Ratio (General Fund)
10 FINANCIAL STATEMENTS
The pages following contain the 10-year financial statements for the following:
Planned (Recommended) Scenario Statements
2024/25 to 2033/34 – Consolidated & Individual Funds Income Statements
Increase/(Decrease)inCashAssetsHeld (1,509)597802(10,012)(9,923)(14,408)(16,102)(14,692)(15,054)(16,240)(17,691)(25,021) CashandCashEquivalentsatBeginningofReporting Period 10,2618,7529,34910,151139(9,784)(24,192)(40,294)(54,986)(70,040)(86,279)(103,970)
Increase/(Decrease)inCashAssetsHeld 2,6213,004(3,594)5308121,478332(341)(633)1,1534,0494,384 CashandCashEquivalentsatBeginningofReporting Period 2,2604,8817,8854,2914,8225,6347,1127,4447,1046,4717,62311,672
CashandCashEquivalentsatBeginningofReporting Period 10,2618,7529,34910,15110,09610,2459,3848,4777,0765,7173,777751 CashandCashEquivalentsatEndofReportingPeriod8,7529,34910,15110,09610,2459,3848,4777,0765,7173,777751(9,115) plusInvestmentsonHand-EndofReportingPeriod24,211-----------
CashandCashEquivalentsatBeginningofReporting Period 10,2618,7529,34910,1516,2488,0808,6798,2909,89911,75913,04713,481 CashandCashEquivalentsatEndofReportingPeriod8,7529,34910,1516,2488,0808,6798,2909,89911,75913,04713,4816,999 plusInvestmentsonHand-EndofReportingPeriod24,211-----------
and Cash Equivalentsat End of Reporting Period 8,7529,34910,15111,34313,08412,19510,5888,4286,3853,778139(10,335) plus Investments on Hand - End ofReporting Period24,211-----------
Total Cash, Cash Equivalentsand InvestmentsatEnd of Reporting Period 32,9639,34910,15111,34313,08412,19510,5888,4286,3853,778139(10,335)
ALTERNATE 2 REVIEW SCENARIO FINANCIAL STATEMENTS – WATER FUND CASH FLOW STATEMENT