

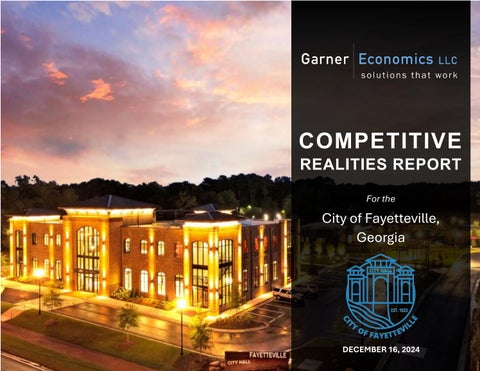
In August 2024, the City of Fayetteville retained Garner Economics, LLC, to help the City prepare an economic development action plan that considers the market dynamics and propels the City into more high-value economic growth.
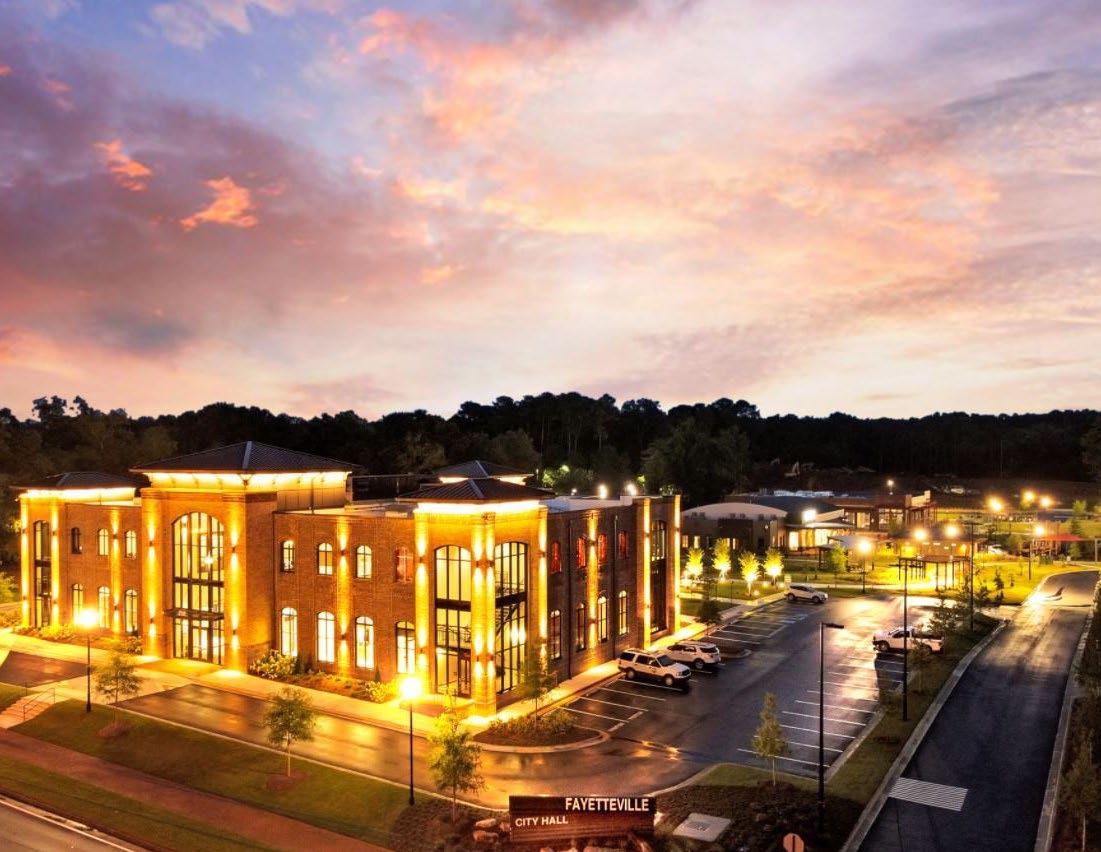
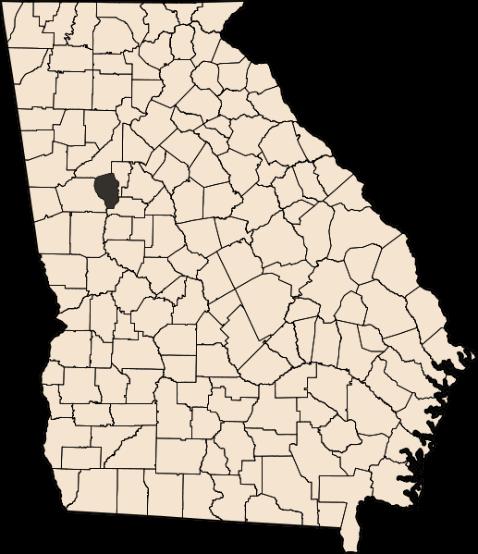
Located south of Atlanta within the greater Atlanta metropolitan area, the City of Fayetteville has a population of more than 20,000 people as of 2023. The City is working diligently to enhance the economic vitality of the community and pave the way for a new chapter of success.
This engagement aims to help the City’s Economic Development Department and its partners understand the necessary product improvements, workforce development, marketing strategies and organizational structure needed to strengthen its competitive position. The ultimate objective is to attract and retain businesses that will continue to create jobs and opportunities for the population. This project includes:
• A comprehensive and holistic assessment of key forces driving the economy and its shifting dynamics;
• An Assets & Challenges Assessment of the city from the perspective of a site-location consultant that facilitates investment decisions;
• Validation and recommendations for business targets suitable for the city, based on our research and analysis; and
• A set of implementable recommendations that the Economic Development Department or its partners can utilize to enhance the area’s economic well-being, make the city more desirable for business and talent, and boost its quality of place.
This COMPETITIVE REALITIES REPORT (CRR) is the first of two reports. It documents the work elements of the project scope and summarizes the findings of the Phase I Discovery. A compilation of facts and data points with quantitative analysis and some subjective opinions, the CRR includes:
• A Stakeholder Engagement Summary;
• Economic and Community Analysis; and an
• Assets & Challenges Assessment.
This document informs the process and provides the basis for the final strategy report and its recommendations.
This CRR offers no recommendations. The final strategy report will consist of the business target suggestions, conclusions, and recommendations for how the City and its partners can align business, workforce, and community development with entrepreneurship and quality-of-place efforts to optimize Fayetteville’s competitive position.

Garner Economics held three virtual focus groups of key stakeholders representing Fayetteville businesses and community partners as part of the discovery process. An electronic survey was also distributed to reach a broader audience, and 67 respondents were received. The Garner Economics site visit to Fayetteville included one in-person focus group with the mayor and city council. Chapter 3 outlines key themes and responses from stakeholders.
3.8 3.6 2.8
City of Fayetteville Entrepreneur Self-Employed Rating of Business Climate Rating Support Rating Entrepreneur Support
Ratings are evaluated on a scale of 1 to 5, with 5 being best.
Demographic, labor and community indicators were evaluated as positive, neutral, or challenge based on the comparison to benchmarks, change over time, or both. Neutral ratings generally resulted from factors with both negative and positive aspects. Each chapter begins with a visual summary of indicators and then a narrative presenting the key themes affecting the standing of the City of Fayetteville. Most indicators were positive, showing growth, while 9 were neutral, and 4 were deemed a challenge. Several of these, such as graduation rates, had positive and negative aspects (growing over time but also below several benchmarks). Chapters 4-6 contain the details from the data analysis.
This assessment provides an overview of the city’s strengths and weaknesses through the lens of a company or site location consultant evaluating Fayetteville for potential corporate investment. Over 50 community factors were used in this assessment across six categories, rated with an asset, challenge, or neutral indicator.
*Several individual indicators within categories were evaluated differently from the overall category. The Quality Of Place category was deemed a positive trait for Fayetteville; however, housing, property crime, and cost of living were rated as neutral or a challenge.
Community input is one of the most critical elements in building an economic development action plan. Garner Economics believes that engaging stakeholders in the process provides vital intelligence on the city and establishes “buy-in” from local businesses and community partners. Utilizing different tools and audiences offers insight and helps establish patterns and validation of data accumulated in the project’s Discovery Phase.
To understand stakeholder sentiment about the business climate and economic development potential in the City of Fayetteville, Garner Economics solicited feedback from various groups using several methods.
114 Total Stakeholder Contacts
4 Focus Groups 47 Focus Group Participants 67 Survey Participants
• Three virtual focus groups with key stakeholders who are engaged with economic development and represent economic development partners;
• One focus group in person with the Fayetteville Mayor and City Council;
• An electronic survey of a broader group of businesses in the City of Fayetteville that engage in or are affected by economic development efforts;
• One-on-one interviews with key economic development champions.
Forty-seven stakeholders participated in focus groups facilitated by Garner Economics during this project. Each group was asked the same questions via an interactive polling platform to leverage responses from the entire group. Replies shown in real-time led to engaging in discussions on Fayetteville’s business climate and economic development assets.
The online survey, which garnered 67 participants, included nearly identical questions. The online questionnaire allowed a wider range of Fayetteville employers, workers, and residents to share their perspectives on the business climate and livability of the city.
Data collected from stakeholders and the discussion in the focus groups revealed several themes. The following review highlights the key topics and top answers to the combined stakeholder responses from the four focus groups and 67 survey respondents.
Stakeholders from both the focus groups and survey rated Fayetteville’s business climate well above average, with a score of 3.8 on a scale of one to five, with five being the best. For this survey, business climate is defined as those policies and laws enacted by the city that impact local businesses, either positively or negatively.
Focus group participants ranked the business climate question higher, with employers and community partners averaging 4.2 out of 5.
Survey respondents gave the City of Fayetteville a 3.5 business climate rating.
The Fayette County government’s policies were rated 3.3 out of 5.
3.8 City of Fayetteville Business Climate Rating
Stakeholder rating of business climate from 1 to 5, with 5 being the best.
Fayetteville’s entrepreneurial ecosystem was rated highly across multiple groups, with one striking exception – the self-employed. Employers, government, and community partners rated efforts above average. But self-employed individuals taking the online survey rated entrepreneurial programs below average at 2.8. The overall rating is 3.6 out of 5.
Several survey respondents mentioned that they were unaware of programs to help entrepreneurs in the city. Some commented about the lack of venture capital or funding in general and offered that there should be more grants, with some targeted to minority business owners.
Stakeholders relayed aspirational programs in other areas like Start Up Fayette with a pitch competition and the Greenville, South Carolina Chambers’ robust entrepreneurship program. A tech-based incubator was also a response in identifying possible target businesses or programs for Fayetteville.
Rating of entrepreneurship efforts from 1 to 5, with 5 being the best.
“I just want to ensure small businesses have a place in our growth. Access to resources and information.”
-Focus Group Participant
Combined focus group and survey responses
Proximity to airport
Ability to grow/ open to new ideas
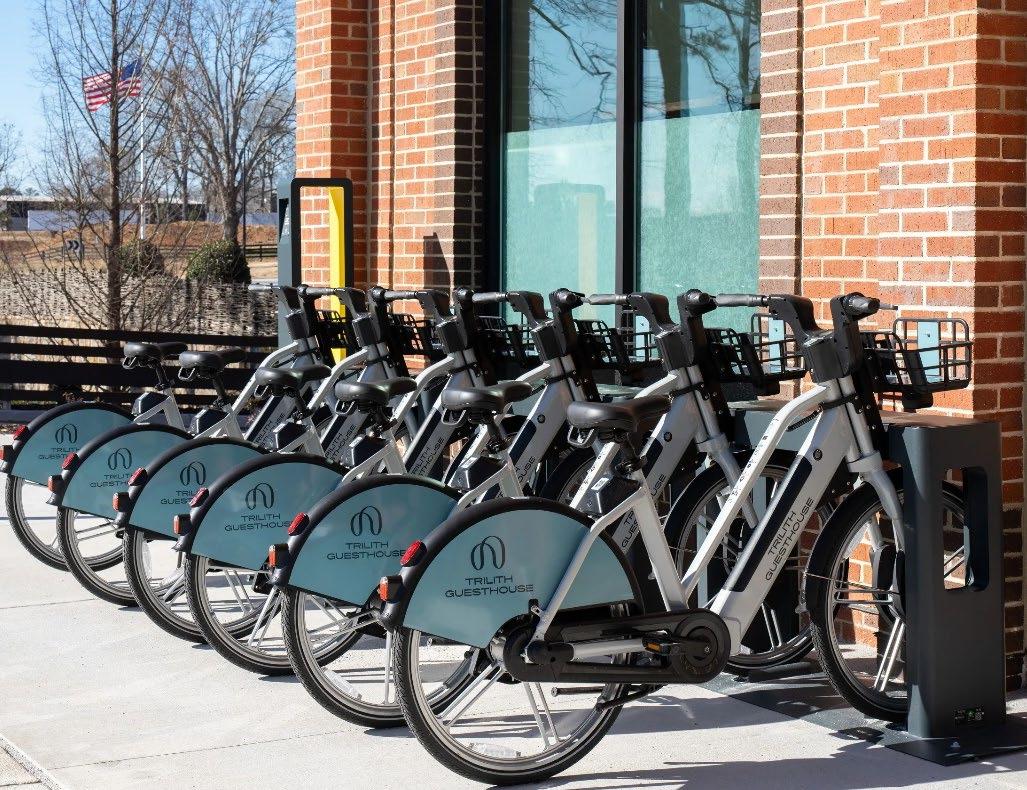
Trilith
City leadership & staff
Proximity to
What do you think are some of the biggest obstacles that inhibit Fayetteville in its ability to attract , expand or retain businesses and investment ?
“Hard” infrastructure is defined as the physical networks such as roadways, utilities, broadband internet, airports, or ports.
“Soft” infrastructure refers to institutions or places that support the economic, health, and cultural climate of a place.
Figure 3.4 Possible
Desired business sectors for Fayetteville
Both focus groups and survey participants suggested business sectors that would be a good fit for Fayetteville. Overwhelmingly, quality of place assets such as hospitality & restaurants, retail, sports/activities & entertainment were suggested as targets. These were the top three responses, totaling 56% of all answers for the question, “What types of business sectors do you think would be a good fit for the City?” Technology-based businesses were the 4th target, followed by healthcare & wellness businesses. Creative and film businesses, along with Financial & professional services, were included in the target suggestions.
During stakeholder engagement, the Garner Economics team seeks to find underlying themes and uncover what could be an “aha!” discovery. One question asked during focus groups and in the web survey was, “The film industry has had a profound impact on the City of Fayetteville. What’s Fayetteville’s next WOW?”
Responses to this question varied, but many felt that the U.S. Soccer HQ and complex might be the next big transformative project. Other comments included downtown activity and the development of the 38 acres downtown.
When asked about missing or lacking infrastructure in Fayetteville, the number one response was the desire for more paths, specifically a network of paths for bikes, golf carts, and hiking. Other responses were closely related to the desire for connected transit options –walkability, sidewalks, streetscaping, and connectivity within the city. Connecting to the development at Trilith was especially important to many stakeholders. Traffic and accessibility were noted as obstacles for Fayetteville.
Touting many assets, stakeholders relayed that proximity to Atlanta and Atlanta Hartsfield - Jackson International Airport as a strong positive. Fayetteville’s charm, positive business environment, existing employers, and developments like Trilith rounded out positive sentiments about the city. While some noted an openness to new ideas, others perceived opposition to growth as a possible obstacle.
The cost of living is among the top ten obstacles stakeholders mention, as is housing affordability. This theme was joined by the desire for more quality of place amenities and aesthetically pleasing gateway corridors, such as GA Highway 85.
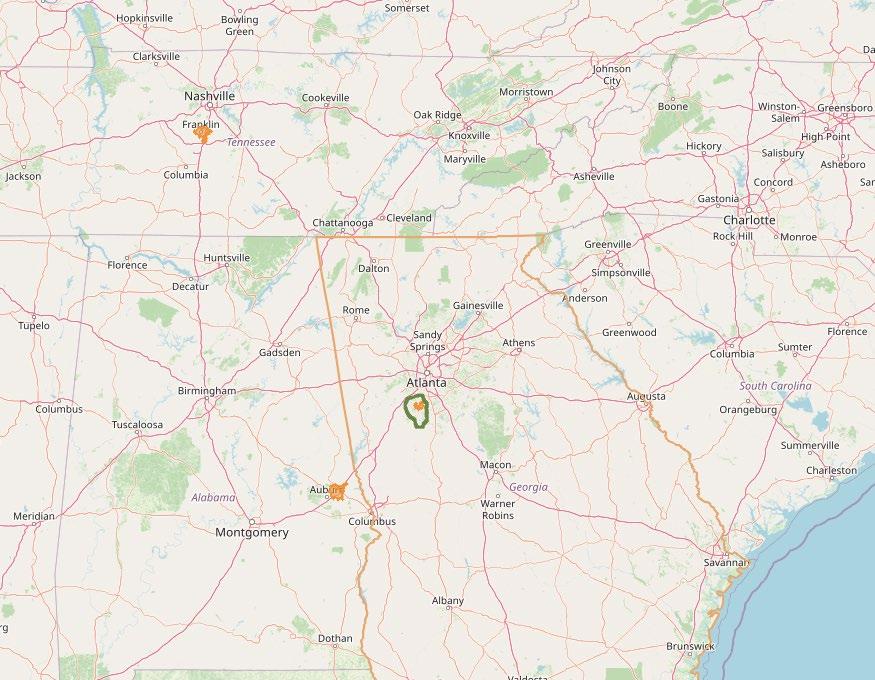
The Phase 1 Discovery process examines the economic standing and competitiveness of the City of Fayetteville, Georgia. It is located just southwest of Atlanta and twenty minutes from the busiest airport in the world, Atlanta Hartsfield-Jackson International Airport. Fayetteville is home to more than 20,000 people and is part of the Atlanta Metro. As part of the Discovery process, the City of Fayetteville was examined in terms of people, place and economic trends.
Chapters 4-6 analyze Fayetteville’s economic, community, and workforce dynamics. They present the findings on how the city has changed in the past five years and compare its current state and trends to those of Fayette County, Georgia, and the nation. Additionally, the City of Fayetteville selected two benchmark cities, Frankin, TN, and Opelika, AL. These
• Fayetteville, GA
• Fayette County, GA
• Georgia
• United States
• Franklin, TN
• Opelika, AL
municipalities were chosen due to similarities or their aspirational qualities, such as effective Main Street programs and sports tourism.
Indicators in Chapters 4 and 5 were evaluated as positive, neutral, or challenge based on the comparison to the benchmarks, change over time, or both. Neutral ratings generally resulted from factors with both negative and positive aspects. Each chapter begins with a visual summary of indicators and detailed data on each indicator.
This analysis heavily relies on raw, objective data from government or impartial third-party agencies. Garner Economics conducted all unique calculations and computations using the original and most currently available data (as of October 2024).


Indicators were evaluated as positive, neutral, or challenge based on the comparison to state and national benchmarks, change over time, or both. Neutral ratings generally resulted from factors with both negative and positive aspects.
• Population growing 11.6% over the past 5 years and nearly 23% over past decade. This is above all benchmarks except Franklin, TN.
• Projected growth is highest along Veterans Parkway towards and encompassing Trilith.
• A steady stream of new residents, with more than 3,000 who moved to Fayetteville in the past year (not including outmigration).
• Fayetteville has 48% of the population above 25 years who have earned an associate degree or higher.
• In the past 5 years, the number of Fayetteville residents earning an associate degree increased by 4.5%.
• More than half of Fayetteville’s households are earning above $75,000 annually.
• Poverty rates are low for the entire population and children.
• Poverty rates fell by -7.8% for children over the past 5 years.
• Violent crime for 2023 was the lowest except for Fayette County.
• Proximity to Hartsfield-Jackson Atlanta International Airport (20 minutes away) has 220 nonstop destinations.
• Broadband is available in Fayetteville to most households at speeds of 250 Mbps (megabytes per second of internet speed). More than half (57.6%)of the city’s households have access to 1 Gig service (1,000 Mbps).
• Broadband internet average speeds are relatively high and sufficient for modern internet use.
• Fayetteville has a higher Walkscore and Bike Score than Frankin and Opelika.
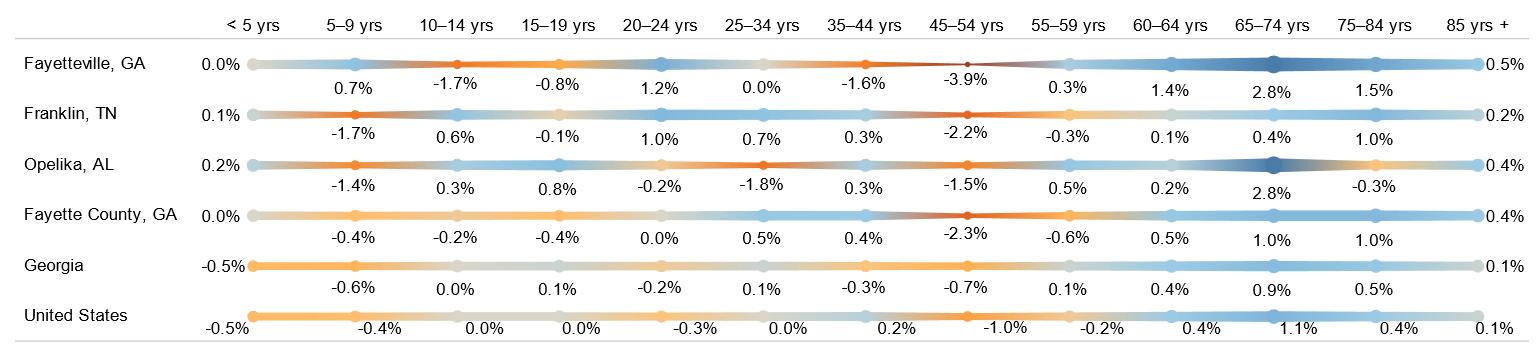
• Fayetteville is growing in its share of the older population – age 65-74 years grew by 2.8% in the past 5 years. However, the percentage of the population aged 20-24 increased by 1.2% during this same period.
• Fayetteville’s diversity index is 69.5%, higher than most benchmarks except the state and nation, but is growing slower than the county, state and country.
• The graduation rate of 91.2% for Fayette County High School in 2024 is less than some benchmarks but higher than the state and Opelika. This rate has been growing since 2018.
• Median household income is the third highest among benchmarks, behind Frankin, TN and Fayette County.
• Households with higher incomes are growing. However, so are several low-income groups. Fayetteville is not increasing its share of wealthier households as much as other benchmarks.
• The MIT estimated living wage for Fayette County families is high. It is higher than Opelika and the overall Georgia wage figure, and similar to Williamson County (Franklin).
• Housing values are less than Williamson County but higher than all other benchmarks.
• Median rental rates fall between Fayette County and Williamson County for 2024.
• Property crime rates are higher than Franklin, Fayette County and national levels per 1,000 residents.
• The highest concentration of population by age is 65 to 74 years (13.1%), and the median age is 43.4, the oldest among all benchmarks.
• Fayette County High School’s composite ACT score for 2023 is below all benchmarks except Opelika. The composite ACT score has been declining since 2021.
• Cost of Living is slightly higher than the national level. Housing, in particular, is higher than all comparisons except Franklin, TN.
• Rental rates grew by 15% (adjusted for inflation) – higher than all other benchmarks.
percentage change in yellow.
U.S. Census Population Estimates, Garner Economics
20,083 2023 Fayetteville Population
11.6% 5-Year Growth
Figure 4.3 Projected Annual Growth in the Fayetteville, GA area 2024-2029
Annual projected growth by census block groups
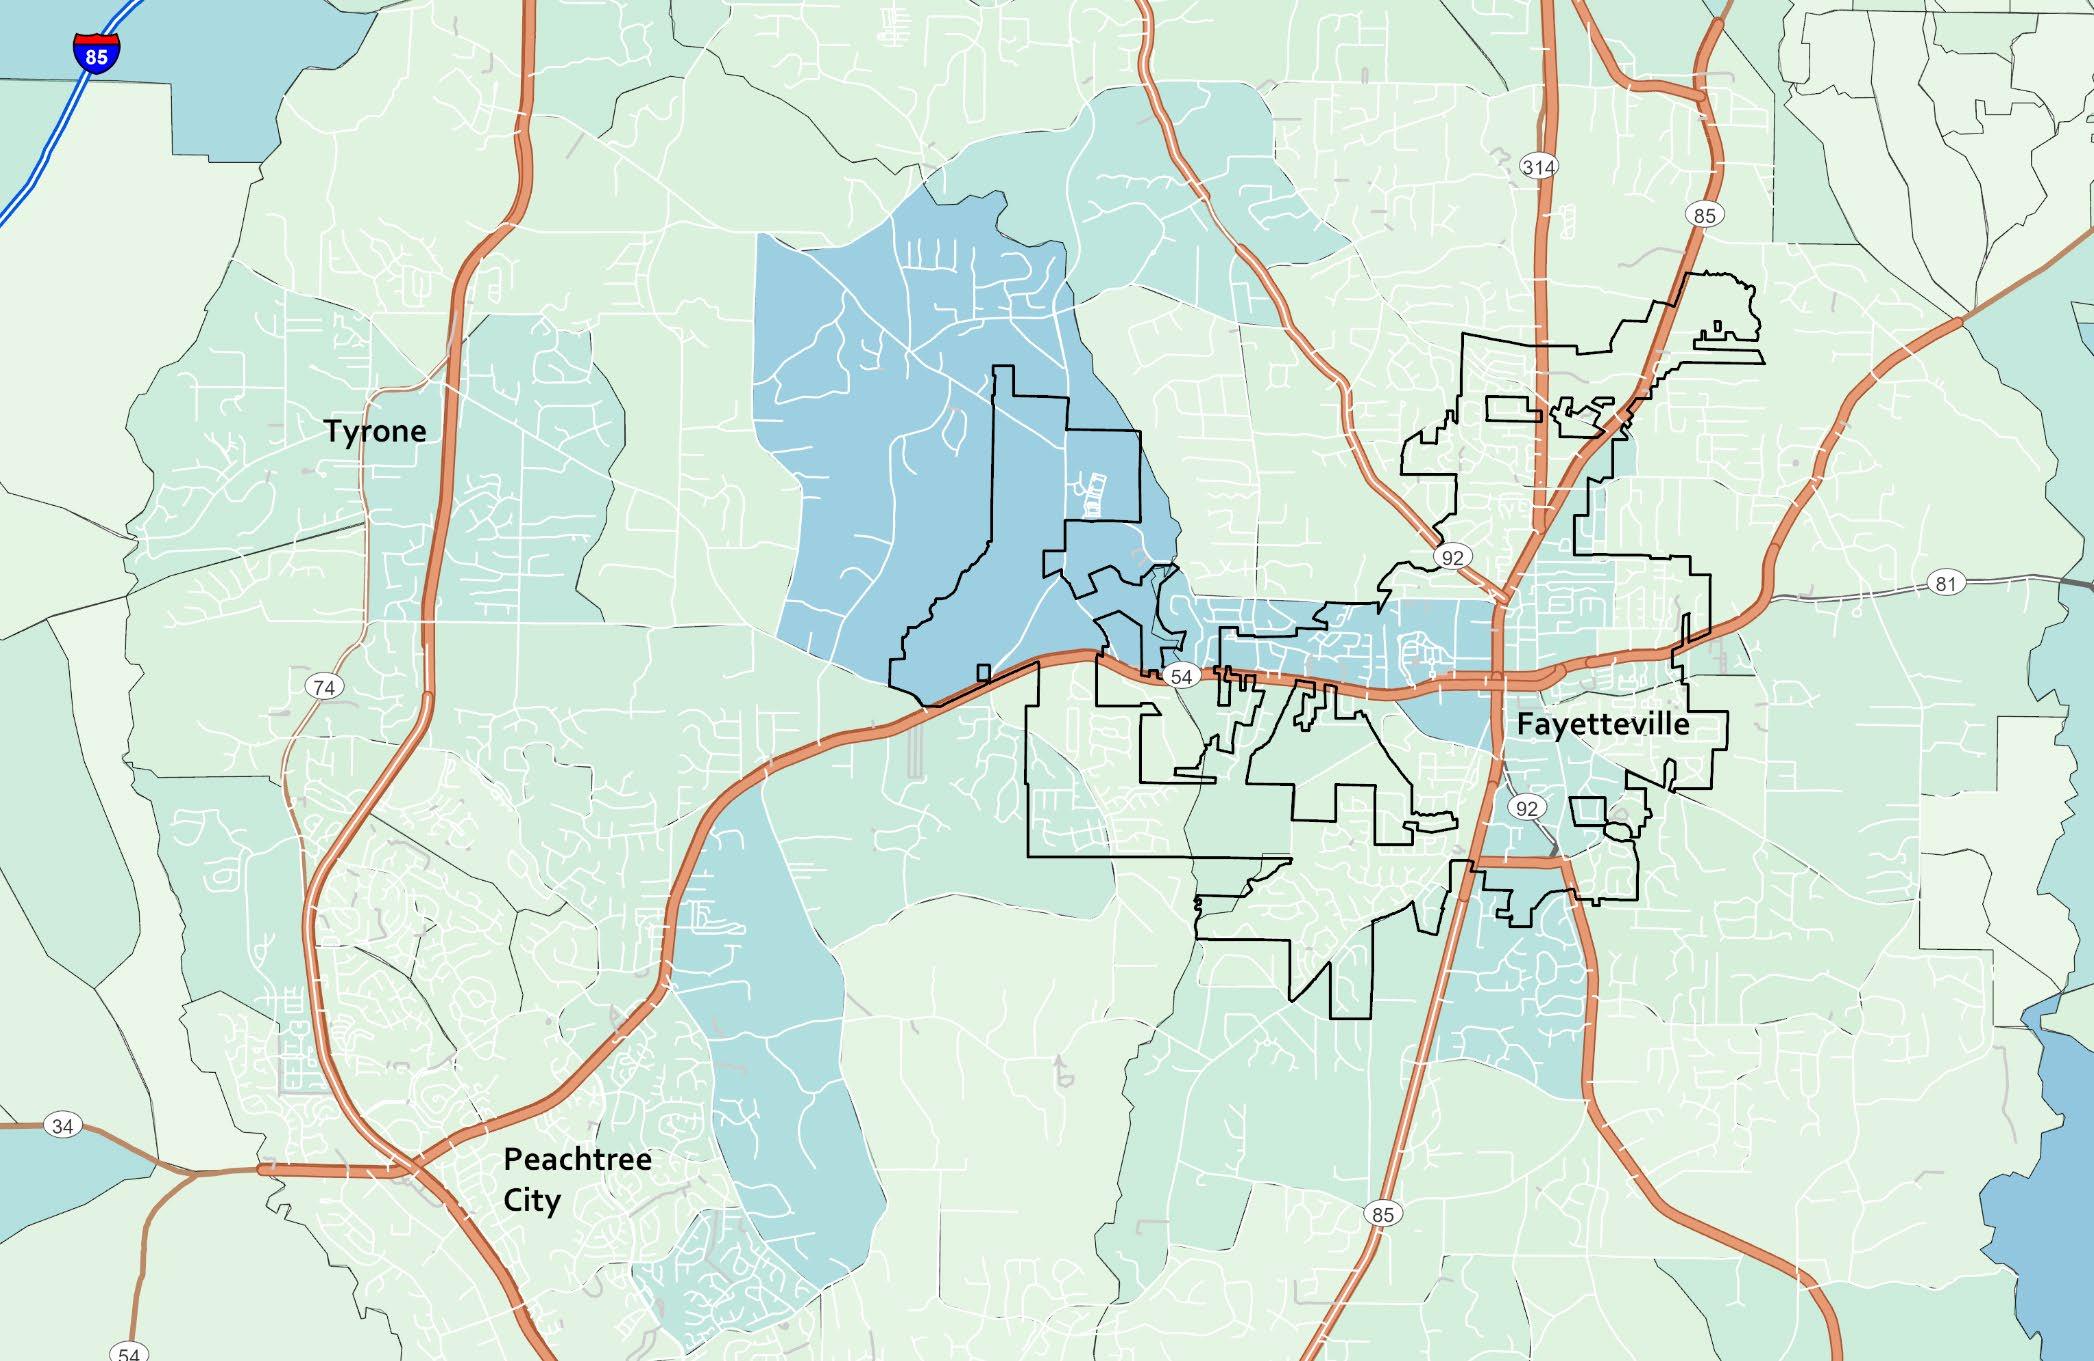


Source: ESRI Population Growth Estimates, Garner Economics


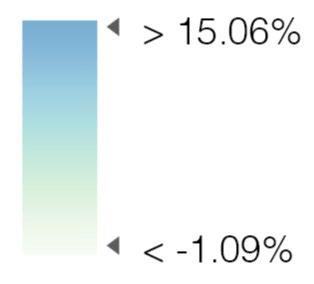
Figure 4.4 Age Group Distribution, 2022
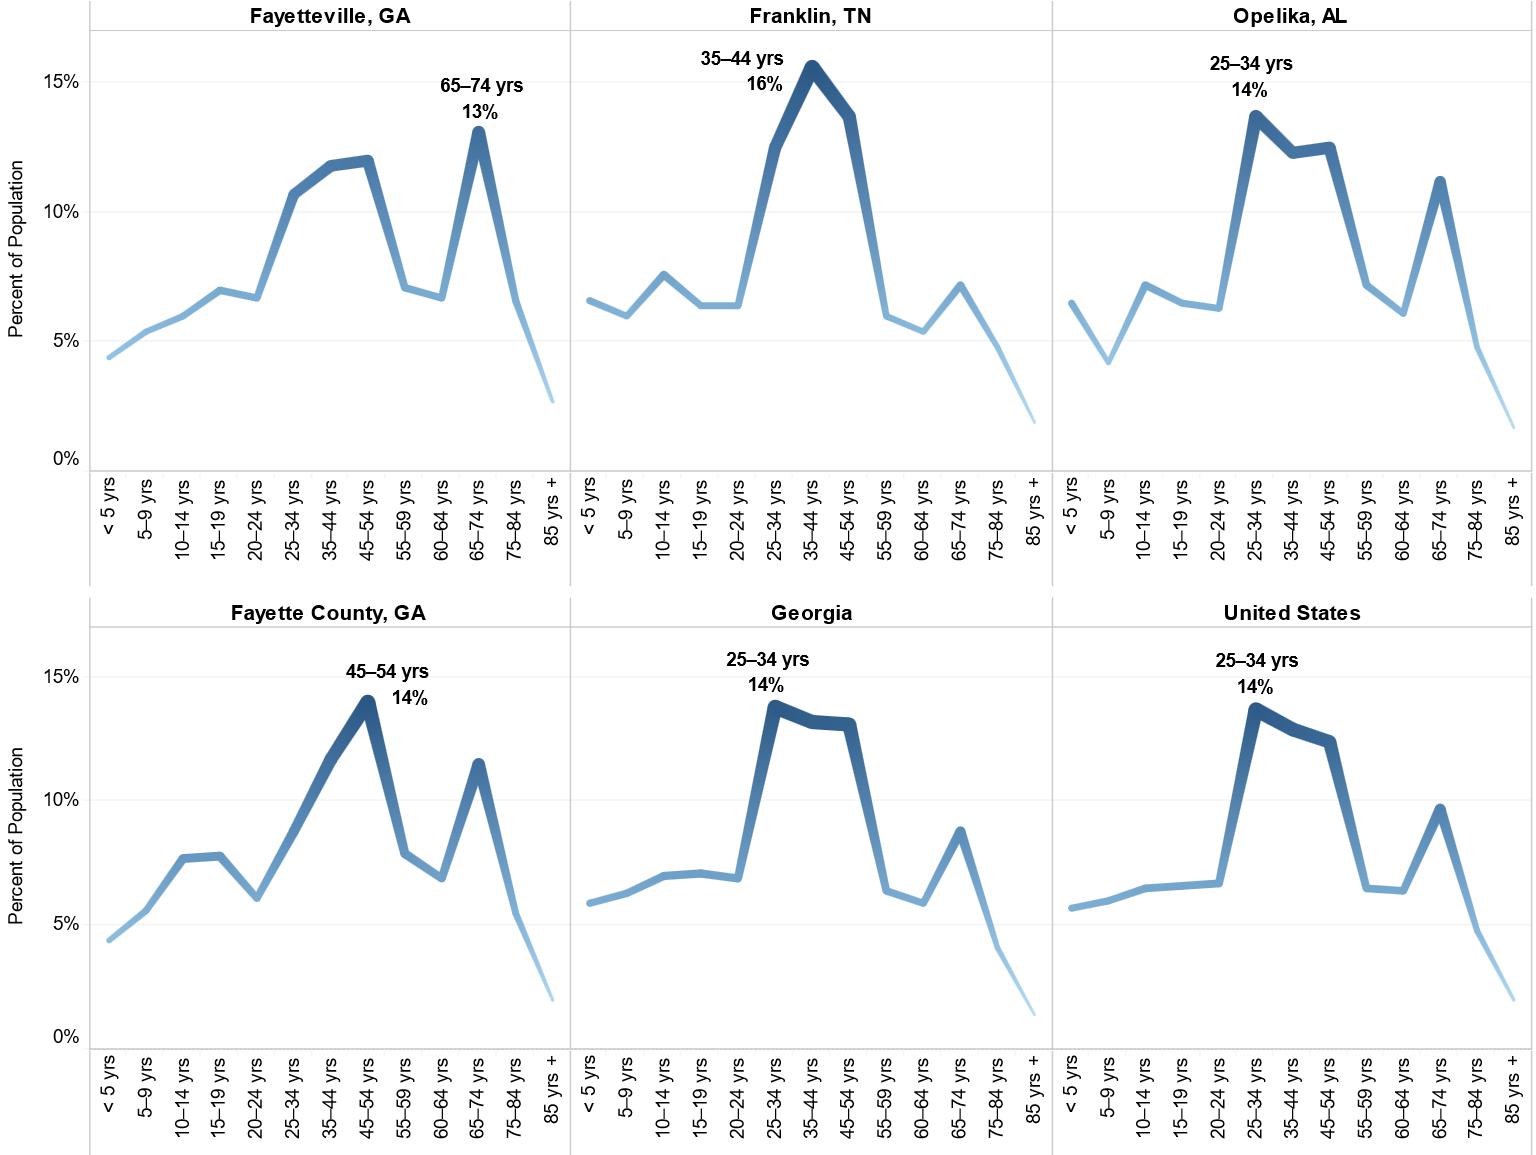


Source: U. S. Census Bureau American Community Survey, 2022 (5-year average), Garner Economics
Highest age group for each geography in yellow
Source: U. S. Census Bureau American Community Survey, 2022 (5-year average), Garner Economics
Change in share of total population
Source: U. S. Census Bureau American Community Survey, 2022 (5-year average), Garner Economics
Where people moved: households that lived in a different house 1 year ago. Blue cells contribute to new residents*
Abroad Figure 4.6 Movers
Source: U. S. Census Bureau American Community Survey, 2022 (5-year average), Garner Economics.
*Data shows total incoming migration to an area and not NET migration. Out-migration of existing resident is not counted.
Table 4.4 Diversity Index
Highest rate in yellow
Same city
Same county
Different county , same state
Different state

Of Fayetteville’s new residents move from elsewhere in Georgia. 84%

Racial diversity is not a determining factor in local economic competitiveness by itself, although some firms may prefer higher diversity rates to attract and retain workers. There is also a growing recognition that being welcoming leads to prosperity. Talent attraction and retention are key factors in economic development success.
The Diversity Index measures the probability that two people chosen randomly in a given area will be from different races and ethnic groups. Values close to 100% indicate that people in the population have different racial and ethnic characteristics.
Source: ESRI, Garner Economics
Figure 4.7 Educational Attainment, 2022
Population ages 25 years or older
Table 4.5 Educational Attainment, 2022
48%
Hold an associate degree or higher in Fayetteville (Population Age 25 Years+)
4.5%
Increase in share of population with an associate degree over 5 years in Fayetteville (Population Age 25 Years+)
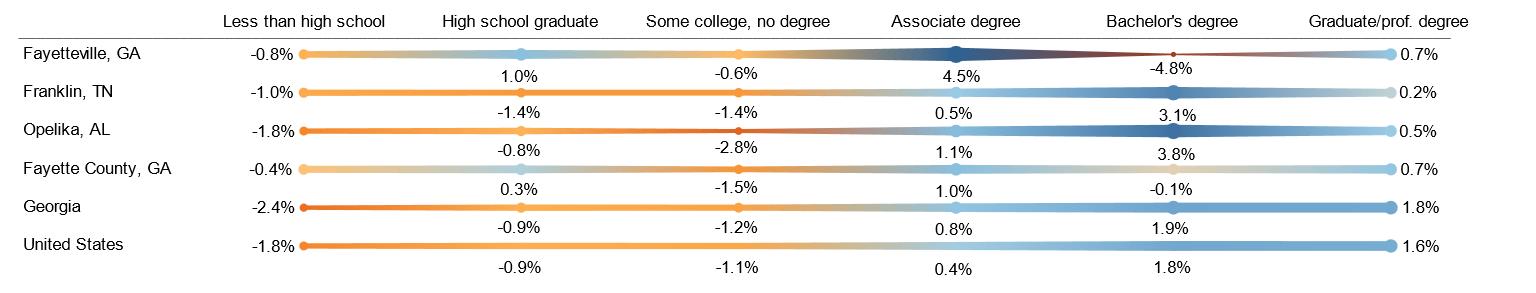
Figure 4.9 Four-Year Cohort Graduation Rate*
Students that graduate public high school within 4 years
Table 4.6 Four-Year Cohort Graduation Rate*
Students that graduate public high school within 4 years
Sources: National Center for Education Statistics, Georgia Dept. of Education, Tennessee Dept of Education, Alabama Dept. of Education, Garner Economics. *Graduation rates were not released in Georgia for 2020 and 2021.
4.10
Figure 4.11 Poverty, 2022
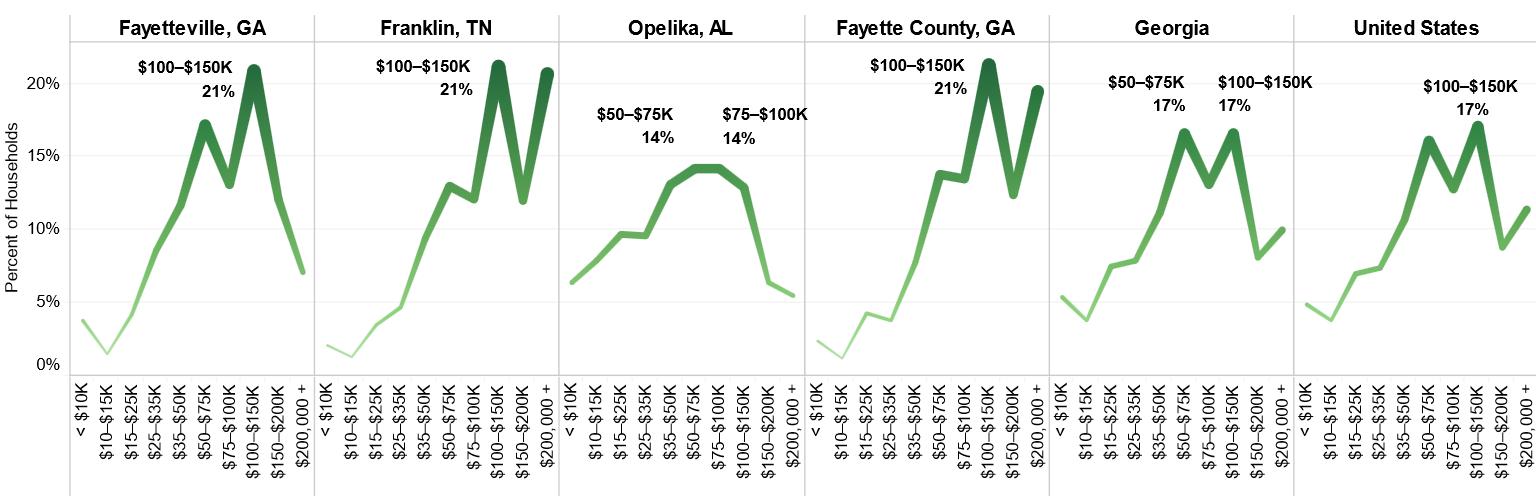
Table 4.8 Household Income Distribution, 2022
Income Percentage for Each Geography in Yellow
Source: U. S. Census Bureau American Community Survey, 2022 (5-year average), Garner Economics
Figure 4.12 Change in Household Income Share, 2017-2022
, GA
AL
Source: U. S. Census Bureau American Community Survey, 2022 (5-year average), Garner Economics
Median Household Income
Figure 4.13 Median Household Income, 2022
$79,865 Fayetteville Median Household Income
$102,967 Fayetteville Median Family Income
Source: U. S. Census Bureau American Community Survey, 2022 (5-year average), Garner Economics
Figure 4.14 Poverty
Percent of population determined to be below the federal poverty level Poverty, 2022 Change in Poverty Levels, 2017-2022
Source: U. S. Census Bureau American Community Survey, 2022 (5-year average), Garner Economics
Wage
Table 4.10 Cost of Living Index, 2023
Source: Areavibes, Garner Economics. Based on C2ER COLI survey, 2023
Table 4.11 Housing Values
Source: Zillow, value shows the Zillow House Value Index (ZHVI), 12-month average rent Sept -Aug for each year shown. *2019 values adjusted for inflation
Figure 4.15 Overall Cost of Living Index, 2023
$422,859
Median home value in City of Fayetteville
Table 4.12 Median Monthly Rental Costs
$2,124
Average monthly rent in City of Fayetteville 2024
Source: Zillow, Observed Rent, 12-month average rent Sept -Aug for each year shown. Data for Opelika was only available for 4 months in 2024
Source: FBI Uniform Crime Reporting, Garner Economics. Data represents crimes reported to law enforcement.
Source: Airport websites, Bureau of Transportation Statistics, T-100 Market, Garner Economics.
Atlanta Hartsfield-Jackson Airport is the busiest Airport in US (2023)
Direct Destinations from Atlanta HartsfieldJackson Airport
Table 4.14 Percent of Households with Broadband Access by Internet Speed, 2023
Highest percentage for each category highlighted in yellow. Download/Upload
Source: Broadbandmap, As of December 2023
Source: highspeedinternet.com, 2024
Figure 4.19 Average Internet Speed, 2024
Source: highspeedinternet.com, 2024, Garner Economics. Data reflects the internet speed test performed in each area from January to September 2023. Mbps refers to megabytes per second of internet speed and network
Walk & Transit Scores
Walk Score
Walk Score is a branded measure of the walkability to nearby amenities by analyzing walking routes. Amenities within a 5-minute walk (.25 miles) are given maximum points, with no points given after a 30-minute walk. Walk Score also measures pedestrian friendliness by analyzing population density and road metrics.
For reference, San Francisco generally has the highest Walk Score of 89, with New York a close second at 88 in 2021.
The Bike Score conveys whether a location is good for biking. For a given location, a Bike Score is calculated by measuring bike infrastructure (lanes, trails, etc.), hills, destinations, and road connectivity as well as the number of bike commuters. Component scores are based on United States Geological Survey, Open Street Map, and the U.S. Census data.
Minneapolis has the highest Bike Score of 83, and Portland, Oregon, scored 82.7 (2021).
Weighted averages by city with a perfect score of 100. Source: Walk Score, www.walkscore.com accessed October 2024, City websites, Garner Economics
The availability of labor is the most important factor in the site selection decision making process, according to the annual corporate location survey by Area Development Magazine. 1 This chapter focuses on Fayetteville’s labor market. A labor draw area, set at a 45-minute drive time from a central point in the city, was included to determine the potential workforce.

The data then transitions to employer-based information, including employment, industry composition, wage comparisons, and additional workplace statistics for those working in the area – Fayetteville zip codes.
Once again indicators in this chapter were evaluated as positive, neutral, or challenge based on benchmark comparison, change over time, or both.


Indicators were evaluated as positive, neutral, or challenge based on the comparison to state and national benchmarks, change over time, or both. Neutral ratings generally resulted from factors with both negative and positive aspects.
1 https://www.areadevelopment.com/Corporate-Consultants-Survey-Results/q1-2024/38th-annual-corporate-survey-unrealized-predictions-of-an-economic-slump-leading-small-to-midsize-companies-to-put-off-expansion-plans.shtml
• Labor force growing moderately by 4.8% in five years.
• 5-year job growth of 835, a 3.6% increase.
• Commuting patterns show Fayetteville is an employment magnet and there is a net gain of in-commuters.
• The labor draw area comprises nearly 2 million people and 1 million workers.
• The labor draw area has 48% of its population with an associate degree or higher.
• New firms employed more than 2,800 people in 2023 Q1 with a 21% job creation trend over five years.
• Diverse economic base with four sectors employing more than 10% each.
• Higher education institutions in a 30-minute drive have more than 17,000 students enrolled.
• Higher education institutions in a 30-minute drive granted nearly 6,000 credentials in 2023, primarily certificates under the Associate degree level
• Fayetteville’s startup rate is below Williamson County (Franklin, TN) and the exit rate is third highest among benchmarks.
• Fayetteville has moderate Work-from-Home rate and growth in the middle of benchmarks.
• Annual average wage per worker is below all but one benchmark and growth is in between benchmark levels.
• Labor force participation is lower than all benchmarks and decreased by -4.6% over 5 years.
• Self-employment is lower than all other benchmarks and decreased by 0.4% 1.1% over 5 years.
Source: JobsEQ (Bureau of Labor Statistics), Garner Economics.
Table 5.2 Labor Force Participation, 2022
5.2 Labor Force Participation by Category, 2022
TOTAL Population 16 years + WORKING AGE Population 20 to 64 years
GENDER Male
Female
FEMALE WITH CHILDREN
With children < 6 years only
With children < 6 and 6-17 years
With children 6-17 years only
Fayetteville, GA
Fayetteville, GA
Franklin, TN
Franklin, TN
Opelika, AL
Opelika, AL
Fayette County , GA
Fayette County , GA
Georgia United States
Georgia United States
Source: U.S. Census Bureau American Community Survey, 2022 (5-year average), Garner Economics.
Figure 5.3 Fayetteville Commuting Patterns, 2022
Work in Fayetteville and live elsewhere


14,448
95% of employees that work here live outside of the city

Figure 5.4 Fayetteville In-Commuters, 2022
Where workers live (county)
In Commuting by County

812
Residents live and work in Fayetteville
Live in Fayetteville and commute to jobs outside


7,264
90% of residents work outside of the city

Figure 5.5 Fayetteville Out-Commuters, 2022
Where residents are employed (county)
Out Commuting by County
Source: U.S. Census Bureau, Longitudinal Employer-Household Dynamics (LEHD), Garner Economics. One primary job per worker.
Labor Market Draw
Figure 5.6 Labor Draw Area, 2024 45-minute drive from Fayetteville, GA
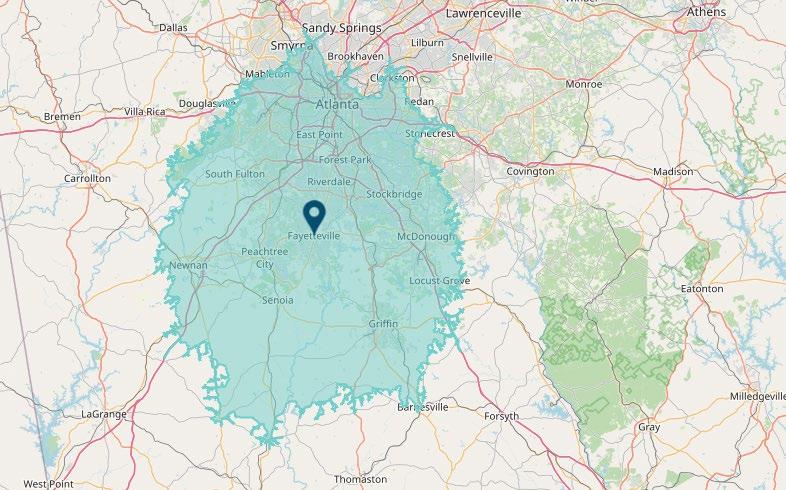
Source: ESRI, Garner Economics
1,965,361
2024 Estimated Population
1,033,357
2024 Estimated Labor Force Age 16 years+
694,703
2024 Labor Force Age 25-54 Years 48.3%
2024 Population has a degree (Associate degree or higher)
Table 5.3 Startup & Exit Rates, 2022
Establishments created and closed during past 12 months
Highest percentage in yellow
Source: U.S. Census Business Dynamics, Garner Economics
Startup Employment
Table 5.4 Employment by New Firms, 2023
Source: U.S. Census QWI, Employment at firms under 1-year-old beginning of Q1, Garner Economic
Figure 5.7 Establishment Startups & Exits, 2022
Establishments created and closed during past 12 months
5-Year growth of employment at new firms Fayette County, 2023
Figure 5.8 Self-Employment, 2022 Employment in Incorporated and Unincorporated Businesses
Table 5.5 Self-Employment, 2022 Highest
Source: U.S. Census Bureau American Community Survey, 2022 (5-year average), Garner Economics.
Source: U.S. Census Bureau American Community Survey, 2022 (5-year average), Garner Economics.
Table 5.6 Residents Working from Home
in yellow
Source: U.S. Census Bureau American Community Survey, 2022 (5-year average), Garner Economics.
9.3%
Residents work from home Fayetteville, GA, 2022
Table 5.7 Average Wage, 2024
Wages and change (adjusted for inflation). Highest value in yellow
Figure 5.9 Average Annual Wages, 2024
Average wage per worker for all industries, adjusted for inflation
Major Employers
Table 5.8 Fayetteville Area Employers
Source: JobsEQ, 2023 for all industries, Adjusted for inflation. Garner Economics
Source: Data Axle, Accessed October 2024, Fayette County Annual Comprehensive Financial Report 2023, Fayette County Public Schools.
Table 5. 9 Industry Sector by Share of Employment
Ranked by Fayetteville, GA employment sectors
Highest percentage for each geography in yellow
Source: JobsEQ, All employment, four-quarter average ending 2024 Q1, Garner Economics. City-level employment is by zip code. Please see Figure 5.11.
Table 5.10 Occupational Group by Share of Employment
Ranked by Fayetteville, GA employment sectors
Highest percentage for each geography in yellow
Source: JobsEQ, All employment, four-quarter average ending 2024 Q1, Garner Economics. City-level employment is by zip code. Please see Figure 5.11.
Zip code, city and county boundaries for each city in this study.
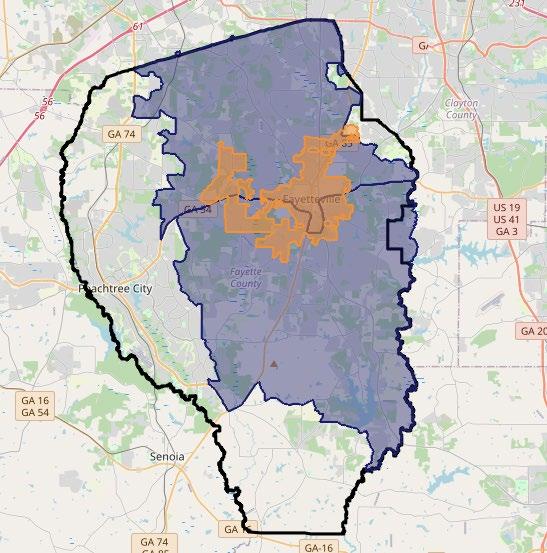
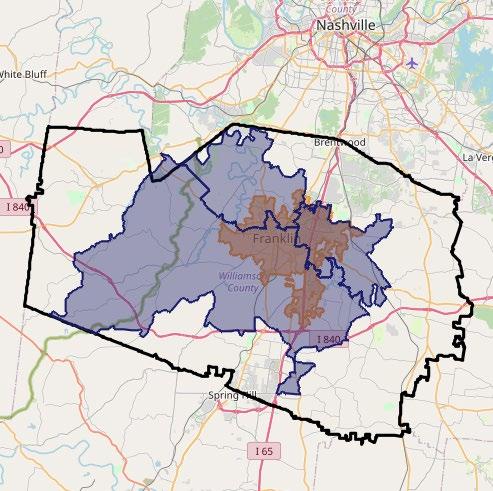
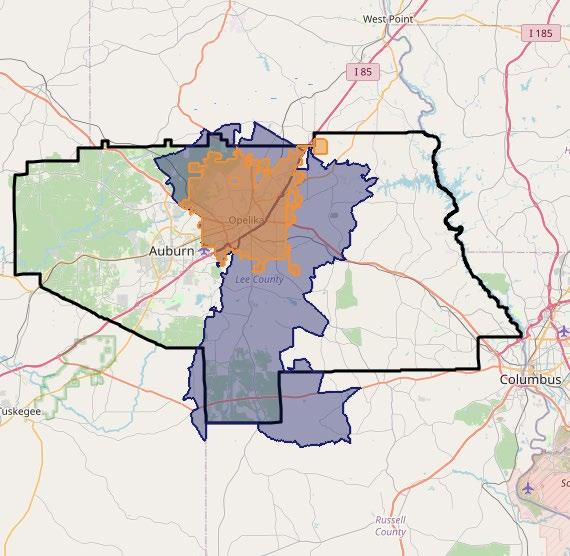
Source: ESRI, Garner Economics
Table 5.12 College & University Enrollment, 2023
Within a 30-minute drive of Fayetteville
Source:
Table 5.13 College & University Credentials Awarded, 2023
Within a 30-minute drive of Fayetteville
Figure 5.12 Credentials Awarded by Level, 2023
Within a 30-minute drive of Fayetteville
17,297
Students enrolled in colleges & universities within 30 minutes of Fayetteville
5,939
Credentials awarded by colleges & universities within 30 minutes of Fayetteville
Source: National Center for Education Statistics, Garner Economics
Health Professions and Related Programs
Liberal Arts and Sciences , General Studies and Humanities
Business , Management , Marketing, and Related Support Services
English Language and Literature/ Letters
Mechanic and Repair Technologies / Technicians
Computer and Information Sciences and Support Services
Culinary , Entertainment , and Personal Services
Family and Consumer Sciences / Human Sciences
Source: National Center for Education Statistics, Garner Economics
The following section provides a more detailed and in-depth assessment of Fayetteville and Fayette County’s employment. This analysis examines the economy from several perspectives, each adding a supporting layer of information. The goals are to provide historical context and reveal areas of unique specialization or concentration measured by Location Quotient (LQ). Data is as of the first quarter of 2024 unless otherwise noted.
Table 6.1 Industry Sector Employment Employment concentration (LQ) above 1 in yellow. Sorted by employment change
The Location Quotient (LQ) compares local employment in an industry sector or occupation as a percentage of total employment to this same ratio nationally. This helps to uncover emerging trends and opportunities. An LQ of 1.2 or higher is an indicator of specialization or strength for that occupation or industry. For instance, the film industry LQ is 3.0 in Fayetteville (part of the Information sector also in table).
Source: JobsEQ, All employment, four-quarter average ending 2024 Q1, Garner Economics. Fayetteville is defined as two zip codes (30214 & 30215). Mining is not listed due to 0 jobs in city.
Figure 6.1 Employment Change
5-Year job change by industry sectors (sorted by absolute change)
Source: JobsEQ, All employment, four-quarter average ending 2024 Q1, Garner Economics. Fayetteville is defined as two zip
23,991
Source: JobsEQ, All employment, four-quarter average ending 2024 Q1, Garner Economics. Fayetteville is defined as two zip codes (30214 & 30215)
Figure 6.3 Fayetteville Average Industry Sector Wages by Employment & Growth, 2024 2024 employment (thickness of bar) and 5-year change (color of bar)
Source: JobsEQ, All employment, four-quarter average ending 2024 Q1, Garner
This visualization portrays the average wage rate by industry with the current employment level (thickness of bar) and 5year change in employment (color scale). This perspective indicates whether higherpaying industries are large employment sectors and whether they are growing.
Table 6.2 Fayetteville Industry Specialization, 2024
Analyzed by concentration (LQ) and employment change
Sector
Source: JobsEQ, All employment, four-quarter average ending 2024 Q1, Garner Economics Fayetteville is defined as two zip codes (30214 & 30215)
Industry specialization and assessment for Table 6.2 and Figure 6.4 are intended to illustrate general trends from purely quantitative analysis and do not present definite conclusions. The main goal is to provide an understanding of the industry landscape.
Specialization is measured using Location Quotient (LQ) or each sector’s employment concentration. LQs compare local employment in an occupation or industry as a part of the total employment to national employment in that occupation or industry as a part of the national employment. An LQ of 1.2 or higher is an indicator of specialization for that occupation or industry.
As a guide, the table and bubble chart are labeled with four categories:
• Competitive: Locally specialized and recent local job gains.
• Emerging: Not locally specialized but experienced recent local job gains.
• Declining: Not locally specialized and recent local job losses.
• At-Risk: Locally specialized but has recent local job losses.
Analyzed by concentration (LQ) and employment change
Sectors employing 20 or more people.
This visualization shows the relative specialization and recent job change. Motion Picture & Video is a subsector of Information but is included separately due to its significance in Fayetteville. This shows that it has a high concentration/ specialization but has lost jobs in the past five years. This subsector employs 171, so the size of the marker is relative to larger employment sectors such as retail trade (employing 3,856).
Table 6.4 Fayetteville Occupational Group Employment
Employment concentration (LQ) above 1 in yellow
Sorted by absolute change
Source: JobsEQ, All employment, four-quarter average ending 2024 Q1, Garner Economics. Fayetteville is defined as two zip codes (30214 & 30215)
Figure 6.5 Employment Change
5-Year job change by occupation groups (sorted by absolute change) Fayetteville, GA
Source: JobsEQ, All employment, four-quarter average ending 2024 Q1, Garner Economics. Fayetteville is defined as two zip codes (30214 & 30215)
Figure 6.7 Fayetteville Average Occupational Wages by Employment & Growth, 2024 2024 employment (thickness of bar) and 5-year change (color of bar)
Business and
Educational
This visualization portrays the average wage rate by segment which could be across industry sectors. Each bar represents an occupational group along with the current employment level (thickness of bar) and the 5year job change (color scale). This perspective indicates whether higher-paying roles are large employment sectors and whether they are growing.
Source:
Table 6.5 Fayetteville Occupational Specialization, 2024
Analyzed by concentration (LQ) and employment change
Occupational specialization and assessment for Table 6.5 and Figure 6.8 are intended to illustrate general trends from purely quantitative analysis and do not present definite conclusions. The main goal is to provide an understanding of the occupational roles in the city’s economy.
Specialization is measured using Location Quotient (LQ) or each group’s employment concentration. LQs compare local employment in an occupation or industry as a part of the total employment to national employment in that occupation or industry as a part of the national employment.
As a guide, the table and bubble chart are labeled with four categories:
• Competitive: Locally specialized and recent local job gains.
• Emerging: Not locally specialized but experienced recent local job gains.
• Declining: Not locally specialized and recent local job losses.
• At-Risk: Locally specialized but has recent local job losses.
Source: JobsEQ, All employment, four-quarter average ending 2024 Q1, Garner Economics. Fayetteville is defined as two zip codes (30214 & 30215)
Analyzed by concentration (LQ) and employment change
Sectors employing 150 or more people.
The Assets and Challenges Assessment provides an overview of Fayetteville’s (and, in some instances, Fayette County’s) strengths and weaknesses through the lens of a company or site location consultant evaluating Fayetteville for potential corporate investment.
Garner Economics analyzed over 50 community factors as part of this assessment across six categories, rated with an asset, challenge, or neutral indicator.
An Asset rating indicates a positive feature of the city that would be evaluated and rated as a competitive strength.
A Neutral rating is defined as normal in the realm of economic development opportunity and competitiveness.
A Challenge rating indicates a negative trend or challenge within the area that hinders growth or the city’s ability to be competitive.

Fayetteville is the county seat of Fayette County, GA and just 25 miles (approx. 45 minutes by automobile) from downtown Atlanta. It is located within a day’s drive to over 61.5 million people.
Interstate highways
Rail service (regional)
Air service (regional)
3 interstate highways are within 30 minutes of the City, I-75, I-285 and I-85.
CSX through Fayette County (north/south).
20 minutes via automobile from Hartsfield-Jackson International Airport (ATL), which offers direct flights to 70 international destinations in 50 countries, and access to 80 percent of the U.S. market within a two-hour flight.
Broadband
Nearly all households in the City of Fayetteville have access to the internet at speeds of 250 mbps (megabytes per section) or higher. More than half (57.6%) have access to 1 Gig service (1,000 mbps). Download and upload speeds are comparable to other benchmarks and sufficient for most modern internet activity.

Managerial/Admin

Availability
Pages 42-53
Hospitality & Creative
Cost of labor
Higher education and vocational training
1,493 managerial occupations and 2,694 administrative support staff.
3,016 Food prep and serving occupations, 2,804 Salesrelated positions, and 465 Arts, Design and Entertainment occupations.
The majority of average wages by occupation are below national averages.
These institutions all have a presence in Fayette County:
• Southern Crescent Technical College
• Clayton State University

Fayetteville has limited space options for commercial growth. Policymakers and local stakeholders desire to work with existing commercial property owners to re-develop or enhance commercial strips to be more aesthetically pleasing and offer new development options. The Town at Trilith (located in the city of Fayetteville) has a significant growth plan, and in the CBD of Fayetteville, there is a 38-acre tract that is being designed as a live, work, play development (also known as Fayetteville Town Center).

Stakeholders in the community focus groups and the e-survey ranked the City’s entrepreneurial efforts high But, there are no formal programs offered and no venture or early-stage capital for entrepreneurial startup or early-stage activity directly through the city. The Fayette Chamber of Commerce has some entrepreneurial programs. 2
Stakeholders representing business in the City of Fayetteville give very high marks to the City’s policymakers (Mayor and City Council) for a very favorable business climate, and the execution of those policies by city staff.
See pages 5-8 for additional comments and constituent(s) ratings.
2 https://growthzonecmsprodeastus.azureedge.net/sites/1268/2023/07/2022-Annual-Report-Revised-a09604af-ec03-4cce-ae17-f2462c515805.pdf
Executive-level housing
Moderate-level housing
Apartments

Level of crime
Medical facilities
Higher-end hospitality (hotel) properties
Restaurant options
3 https://www.piedmont.org/media/file/2024-03-PFH -Fact -Sheet.pdf
According to Zillow, there are 115 active listings of homes for sale in the price range of $500,00 to no maximum within the city limits of Fayetteville as of 11/3/2024.
According to Zillow, 70 homes are available in the City as of 11/3/2024, with a sale price of $300,000 to $499,000.
94 units available for rent in the City (Apartments.com 11/3/2024)
Fayetteville has a cost of living index of 108, slightly higher than the national average (100). Fayetteville is behind Franklin (132) but above all other benchmarks. See page 23.
Fayetteville has a low violent crime rate; however, the property crime rate is above all other benchmarks except Opelika. See page 24.
Piedmont Fayette Hospital is highly rated in Georgia and the U.S. 3
Trilith Guest House, with 193 rooms, is an AAA four-diamond property located within the City of Fayetteville at Trilith.
Diverse dining establishments including several new options at the Town of Trilith (a live, work, play community).
The Fayetteville CBD continues to go through a transformation and re-imaging. The Town of Trilith shows very well as a new, masterplanned community.
The Garner Economics team met with the City of Fayetteville Mayor and City Council on October 10, 2024, at a called session to hold a focus group. Additionally, three virtual focus groups were conducted on October 23 and 24, 2024, with key stakeholders engaged with economic development in Fayetteville. An interactive poll gathered feedback and spurred discussion, giving people different opportunities to express their perceptions through discussion or electronic means. Collectively, 47 people participated in the focus group process. Participants include:
• Faith Bannister, Fayette Pavilion/5 Rivers Commercial Real Estate
• Karen Baxter, Artistic Fusion
• Chuck Brown, Brightmoor Hospice
• Dan Cathy, Trilith Studios/Development
• Renee Coakley, Georgia Downtown Association
• Colleen Davison, Junk Mama
• Winchell Elibert, Kingdom Corners Plaza/Smoothie King Owner
• Amanda Fields, Fayette County Development Authority
• Ivy Finnessy, Fun Spot America
• Virgil Fludd, Revival Wine & Dessert Bar
• Aaron Fortner, Canvas Planning Group
• Wendy Gallacher, Rochester DCCM
• Ray Gibson, Fayetteville City Manager
• Niyah Glover, Fayetteville City Council
• Daniel Gray, Fayette Pavilion/5 Rivers Commercial Real Estate
• Melodie Green, Fayetteville City Staff
• Glenn Gresham, Gremlin Growlers
• Heather Gresham, Gremlin Growlers
• Rick Halbert, Trilith
• Eric Hanson, QTS
• Rich Hoffman, Fayetteville Mayor Pro Tem
• Michele Holmes, Fayetteville City Staff
• Ed Johnson, Fayetteville Mayor
• Evan Karona
• Darryl Langford, Fayetteville City Council
• Tiffany Loveless, Marked Society
• Leonardo McClarty, Fayette Chamber of Commerce
• Sarah Murphy, DDA/Main Street Board
• Nancy Musselwhite, DDA/Main Street Board
• Rob Parker, Trilith Development
• Jake Pittman, Trilith Development
• Amanda Poliak, Awkward Brewing
• Andrew Poliak, DDA/Main Street Board
• Katie Quatellbaum, Fayette County Development Authority
• Sean Rawson, Southtree Commercial
• Robert Rowlinson, Fayette Pavilion/5 Rivers Commercial Real Estate
• Maury Seitel, Johnny's Pizza
• Jon Sizemore, QTS
• Scott Stacy, Fayetteville City Council
• Alan Taylor, Twisted Taco / Rickshaw Thai
• Kingslea Thompson, The Hummingbird Wine Bar / 240 Glynn
• Niki Vanderslice, Fayette County Development Authority
• Dan Vano, DDA/Main Street Board
• William Ware, Piedmont Fayette Hospital
• Geneva Weaver, Fayetteville Care Clinic / Kiwanis
• Lindsey Wooddy, Trilith Studios
• Jamie Wyatt, DDA/Main Street Board
A survey with the same questions was distributed to business and community partners in Fayetteville in October 2024. The survey was open for several weeks and received 67 responses. Below are the demographics of participants based on their responses to several identifying questions.
Do you live or work in the City of Fayetteville?
I work in Fayetteville but live elsewhere.
I live & work in Fayetteville.
I
I
How
If you live in Fayetteville, how long have you lived here?
1. What are several words or phrases that describe Fayetteville, whether it's positive, negative, or neutral?
2. What do you think are some of the biggest obstacles that inhibit the City in its ability to attract, expand or retain businesses and investment?
3. What do you see as the City's assets in attracting and retaining business and investment?
4. What "hard" or "soft" infrastructure is missing or unsatisfactory in the City?
"Hard" infrastructure is defined as the physical networks such as roadways, sewer, broadband internet, airports and/or ports; "soft" infrastructure refers to institutions or places that support the economic, health, and cultural climate of a place.
5. On a scale of 1 to 5 with 5 being best, how would you rate the business climate of:
1 - Worst 2 - Below Average 3 - Average 4 - Above Average 5 - Best
o City of Fayetteville?
o County of Fayette?
o Peachtree City? (if you have done work in PTC before) *
For the purposes of this question, business climate is defined as those policies and laws enacted by local jurisdictions that impact local businesses, either positively or negatively.
*Not included on the web survey.
6. The film industry has had a profound impact on the City of Fayetteville. What's Fayetteville's next WOW?
7. How would you rate the City's efforts to help, support, and grow entrepreneurs?
1 - Worst 2 - Below Average 3 - Average 4 - Above Average 5 - Best
8. Give some examples of local, unique and innovative programs or initiatives that you believe are having a positive impact on enhancing the global competitiveness of the City?
9. Are there public/private initiatives in peer or competitor regions that the City should consider for this area?
10. What types of business sectors do you think would be a good fit for the City, and why?
11. What types of business do you not want to see locate in the City, and why?
12. Without regard to money or politics, what would you work to change about the City to make it a more competitive location for new investment, talent recruitment, business retention and quality of place?
13. How could the City's economic development efforts be improved?*
14. Are there any other issues of concern to you regarding the economic vitality of the City of Fayetteville?
Web survey had multiple choice for most questions with an option of selecting "other" to add a unique response.
Fayetteville zip codes and Fayette County industry listing details are included below with major category headers in blue and specialized industries with location quotients greater than 1.2 highlighted in yellow.
Source: JobsEQ, 2024Q1, Garner Economics. *This data reflects Fayetteville zip codes.(30214 & 30215)
Fayetteville zip codes and Fayette County occupation listing details are included below with major category headers in blue and specialized occupations with location quotients greater than 1.2 highlighted in yellow.
Source: JobsEQ, 2024Q1, Garner Economics. *This data reflects Fayetteville zip codes.(30214 & 30215)