
This page intentionally left blank.
This page intentionally left blank.
Edward J. Johnson, Jr.
Joe Clark
Rich Hoffman
Darryl Langford
Scott Stacy
Niyah Glover
Ray Gibson
David Rast Director of Community and Economic Development
Brian Wismer Director of Economic Development
Denise Brookins Planning and Zoning Manager
Julie Brown Senior Planner
Nicole Gilbert Planner
Katherine Pricket Planner
Tony Whitley GIS Analyst
Sarah Murphy
Ken Collins
Debi Renfroe
Toby Spencer
Chairman, Planning and Zoning Commission
Chairman, Planning and Zoning Commission
Planning and Zoning Commission
Planning and Zoning Commission
David Hildebrandt Planning and Zoning Commission
Jamie Wyatt Vice-Chairman, Downtown Development Authority
Dan Vano Downtown Development Authority
Sam Burch Downtown Development Authority
Nancy Musselwhite Downtown Development Authority
Brandon Sherman Downtown Development Authority
This page intentionally left blank.
This page intentionally left blank.
Today, more than 19,000 people call the City of Fayetteville “home”, and many thousands more shop, dine and work here. We are known for our overall high quality of life with high educational standards, low crime rate, and a great sense of community. As Fayetteville grows, and as more people desire to live, work, shop and play here, we are presented with the challenge of maintaining the high quality of life generations of families have come to expect. In response to this challenge, we will encourage smart, collaborative, and managed growth.
The Comprehensive Plan is a community-based vision for future growth and development within the City of Fayetteville. The plan addresses land use, housing, economic development, transportation, parks and recreation, and natural resources, with a strong focus on how land is used, developed, and/or conserved.
The City’s current Comprehensive Plan was adopted in 2017 and since that time, Fayetteville has experienced significant population growth and economic development. The 2022 Update builds on the previous plan and provides a five-year update as required by Georgia’s local planning rules centered around reevaluating key elements.
The 2022 Update includes a review of the Community Work Program, which identifies projects and initiatives to assist in implementing the Community Goals. While the Comprehensive Plan as a whole incorporates policies and strategies for a 20-year planning period, the Community Work Program outlines specific implementation strategies in a 5-year timeframe.
The Capital Improvements Element identifies capital investments the city intends to make in the next five years to facilitate achieving the city’s goals.
The 2017 Comprehensive Plan provided a road map for the city as it continues to grow and evolve. The comprehensive plan used different forms of public engagement and reflects the ideas, values, and desires of the community, aligning these with a range of plans, policies, and initiatives in place or underway in both Fayetteville and the wider region.
The Strategic Plan serves as a tool to help guide the community toward its desired outcomes. The plan is intended to be a living document, meaning it will be updated and amended as needed to reflect progress made, changing conditions in Fayetteville and the region, and the evolving needs of the community. The updated plan serves as a reinvigorated foundation for the city, establishing a comprehensive vision for the future, refreshed land use recommendations, and implementation recommendations to guide the city moving forward.
The 2021 LCI Study established a community-wide vision and plan for the downtown core. A part of the study evaluated previous planning documents and their recommendations for downtown development. The 2021 LCI study has served the city well and provided comprehensive analysis and recommendations for the downtown area's land use, zoning, and development regulations.
The 2022 housing study provided a demographic review, market demand data, and identify potential residential development opportunities in the city.
This page intentionally left blank.
This page intentionally left blank.
The City of Fayetteville is located in the center and serves as the county seat of Fayette County. Historically, Fayetteville was predominantly an agricultural area with sprawling homes on large lots. In recent years the city has worked to restore the historic streetscape and downtown charm while still welcoming new residents and housing market trend in Fayetteville.
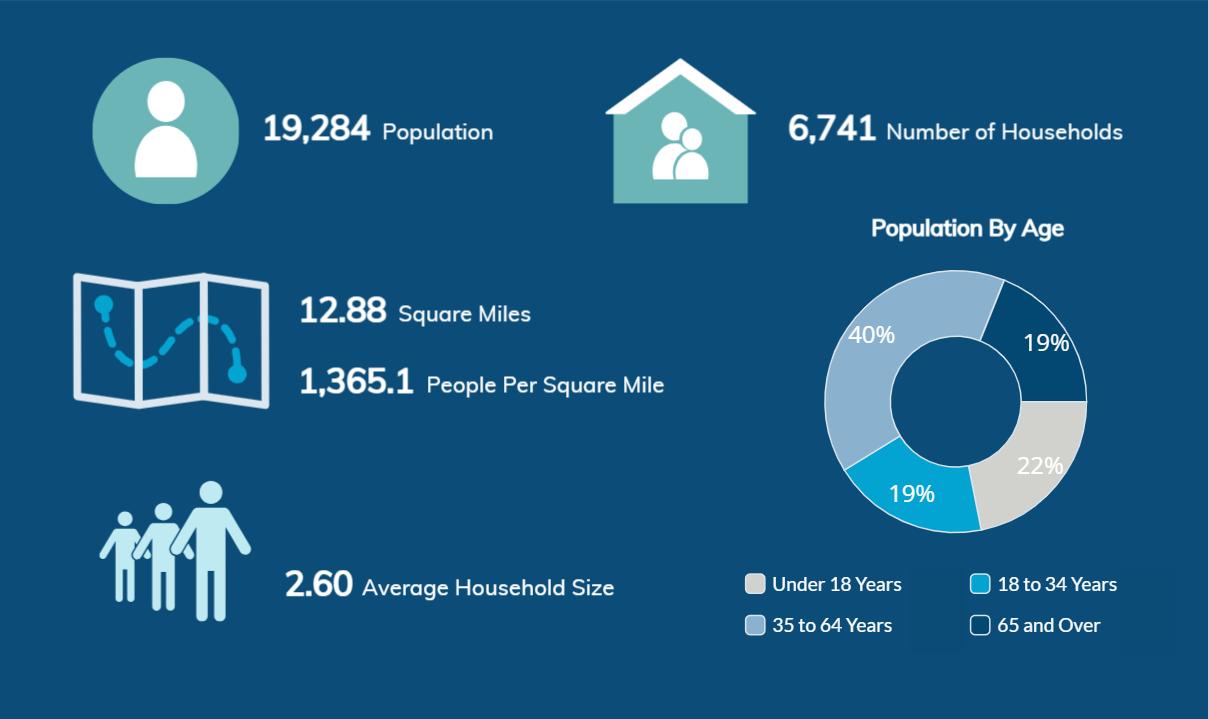
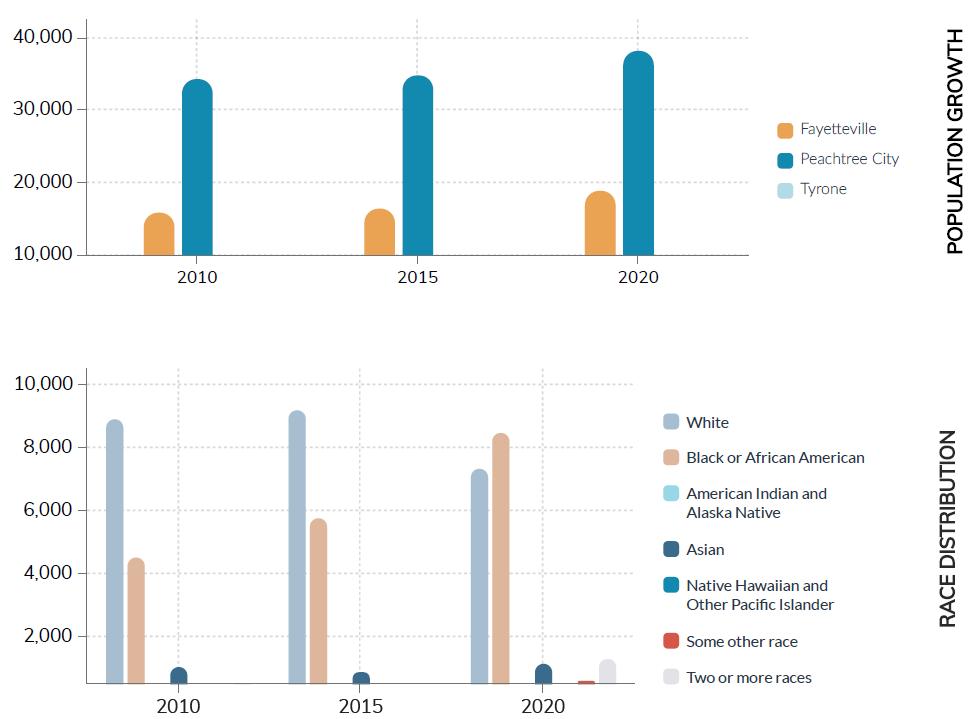
Between 2010 and 2022 the population in downtown Fayetteville increased from 3,426 to 3,786 people per square mile, demonstrating a 10% increase in population density. Census statistics show the younger population has increased within the downtown core and the southern portion of the city, while the northern arc has experienced a decrease in the younger population. The shift in age is predominantly due to high-performing schools being located to the west and south of the City, close to Peachtree City and south of the City, as well as job opportunities for younger adults located to the west (Trilith Studios, the Town at Trilith and Piedmont Fayette Hospital) and manufacturing and light industrial-related jobs to the east and north.
Since 2010, the census tracts encompassing Downtown Fayetteville have also identified a 10% increase in the 55+ age group, which is consistent with similar growth patterns in neighboring communities. For instance, Peachtree City to our west has experienced a significant increase in residents aged 55 and over, which bodes well as Fayetteville continues to provide opportunities for downsizing and senior living facilities.
The median age in Fayetteville is 42, and population growth has been steady since 2010. Based on census-based estimates, the strongest growth will have occurred from 2010 – 2022, with an 18.2% population increase, or just over 1.5% per year.
Population growth over the last ten years has grown steadily in the 18-34 and 55-85+ age groups, with a steady increase in the Black/African American and Asian populations. These numbers point to a growing number of young singles and professionals as well as empty nesters and retirees, all of which will require a greater variety of housing products. Decreases in the 5-17 and 35-54 age groups indicates a decreasing number of younger families moving to the city.
Fayetteville is located in the Atlanta-Sandy Springs-Roswell Metropolitan Statistical Area (MSA). The Atlanta MSA encompasses 29 counties, with ten central counties belonging to the Atlanta Regional Commission (ARC) and forming the core of the MSA. Roughly 78% of the population of the MSA lives within this ten county core including Cherokee, Clayton, Cobb, DeKalb, Douglas, Fayette, Forsyth, Fulton, Gwinnett, Henry and Rockdale.
Between 2000-2010 only 67% of all population growth within the MSA occurred within this ten county core. Since 2010 roughly 85% of all population growth within the MSA occurred in this ten county core as younger and older generations increasingly sought walkable neighborhoods both in urban and suburban areas. Fayette County had considerable growth from 2000 to 2010 with an annual growth rate of 1.6%. However, the story for the City of Fayetteville is more positive.
From 2000-2010 population growth within Fayetteville outpaced many of the fastest growing counties in the MSA with a 3.6% annual growth. Since 2010 the city's growth rate is still strong and has outpaced all counties in the MSA except for Cherokee County with an annual growth rate of 1.7%.
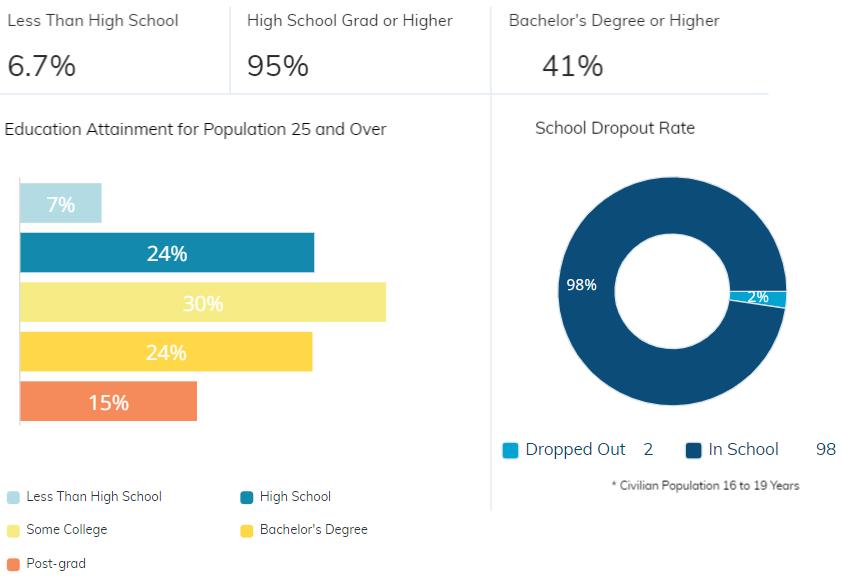
Concentrations of highly-educated residents and households are attractive to both office and retail employers. Prospective office tenants desire proximity to a highly-educated workforce. Retailers often use educational attainment levels as a key metric when determining site locations. Additionally, households with high educational attainment levels have shown to include higher income potential and are strong indicators of neighborhood stability.
The northern and eastern portions of the city of Atlanta and the north metro suburbs have the highest concentrations of high educational attainment households in metro Atlanta. On the southside of Atlanta, Fayette County stands out, but a lack of high concentrations of educated households and workforce continues to limit major office growth and/or relocation.
Nearly 40% of Fayetteville residents 25 years and over have obtained a Bachelor's degree or higher. Historically, college-educated individuals in Fayette County have been concentrated in the west and southwest near Peachtree City and Tyrone, but over the past few decades collegeeducated individuals have been pushing west, increasing the educational attainment in Fayetteville, and within Fayette County, as a whole.
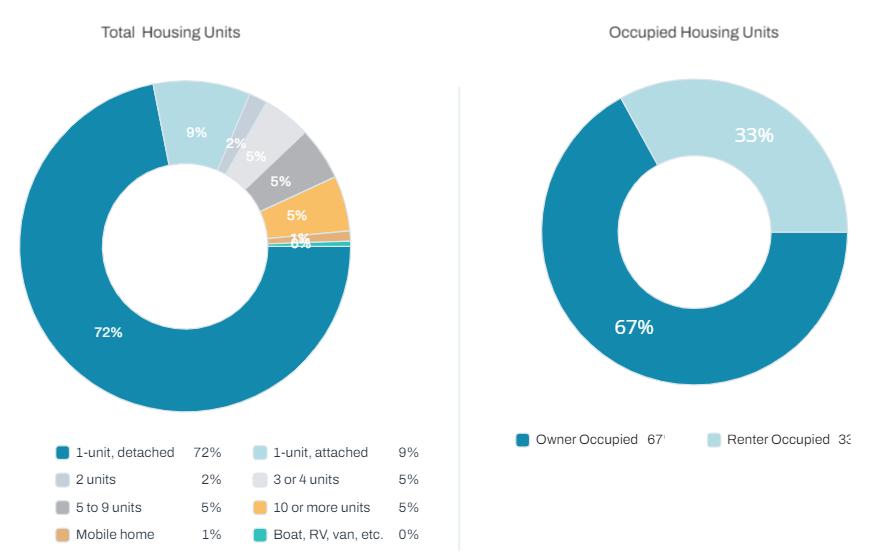
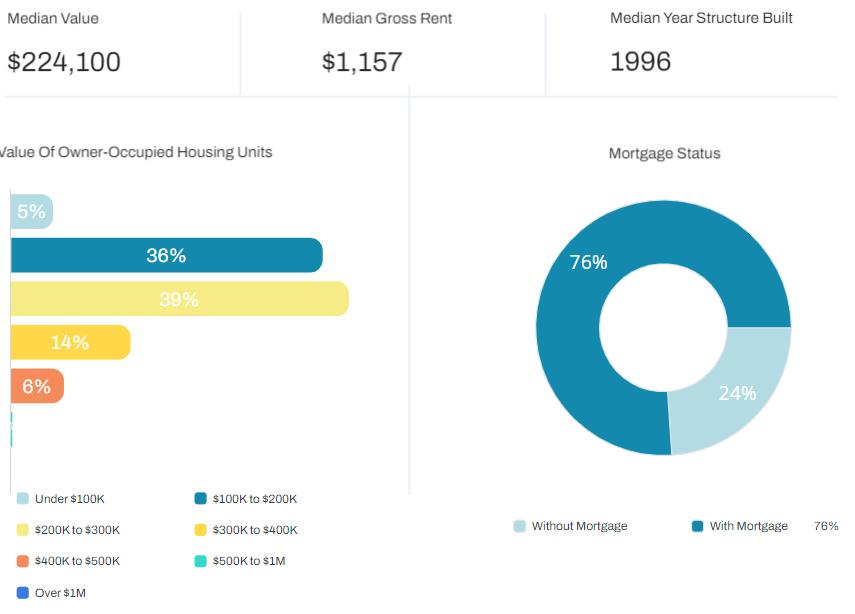
As of 2022, Fayetteville has 6,949 total housing units, the majority of which were constructed after 1991 and include single-family detached, townhomes, condominiums and apartments.
Approximately 36% of all dwelling units were constructed in the 1990's. While more than 71% of all housing units within the city are owner-occupied, the recently completed Housing Study indicated a lack of product diversity, with an estimated 72% being conventional single-family detached structures.
Statistics show a healthy rental vacancy rate typically hovers around 7-8%, while a healthy homeowner vacancy rate is much lower, at 2% or below. Of the city's 6,949 housing units, an estimated 97% are occupied, and 3% are vacant. Vacancy rates within the city are currently 2.7% for rental units and 0.2% for residential structures.
When vacancy rates dip below 5%, studies show the demand for housing is outstripping the supply. Rental market vacancy rates in the 5-7% range show the market is providing adequate housing choices. Low rental vacancy rates can be harmful to communities because it can lead to unjustified rent increases, provide a disincentive for property owners to maintain facilities, and reduce the choice and opportunity for renters. Additionally, when rental vacancy rates fall below 5%, there is the possibility that rents will increase making some rental properties less affordable.
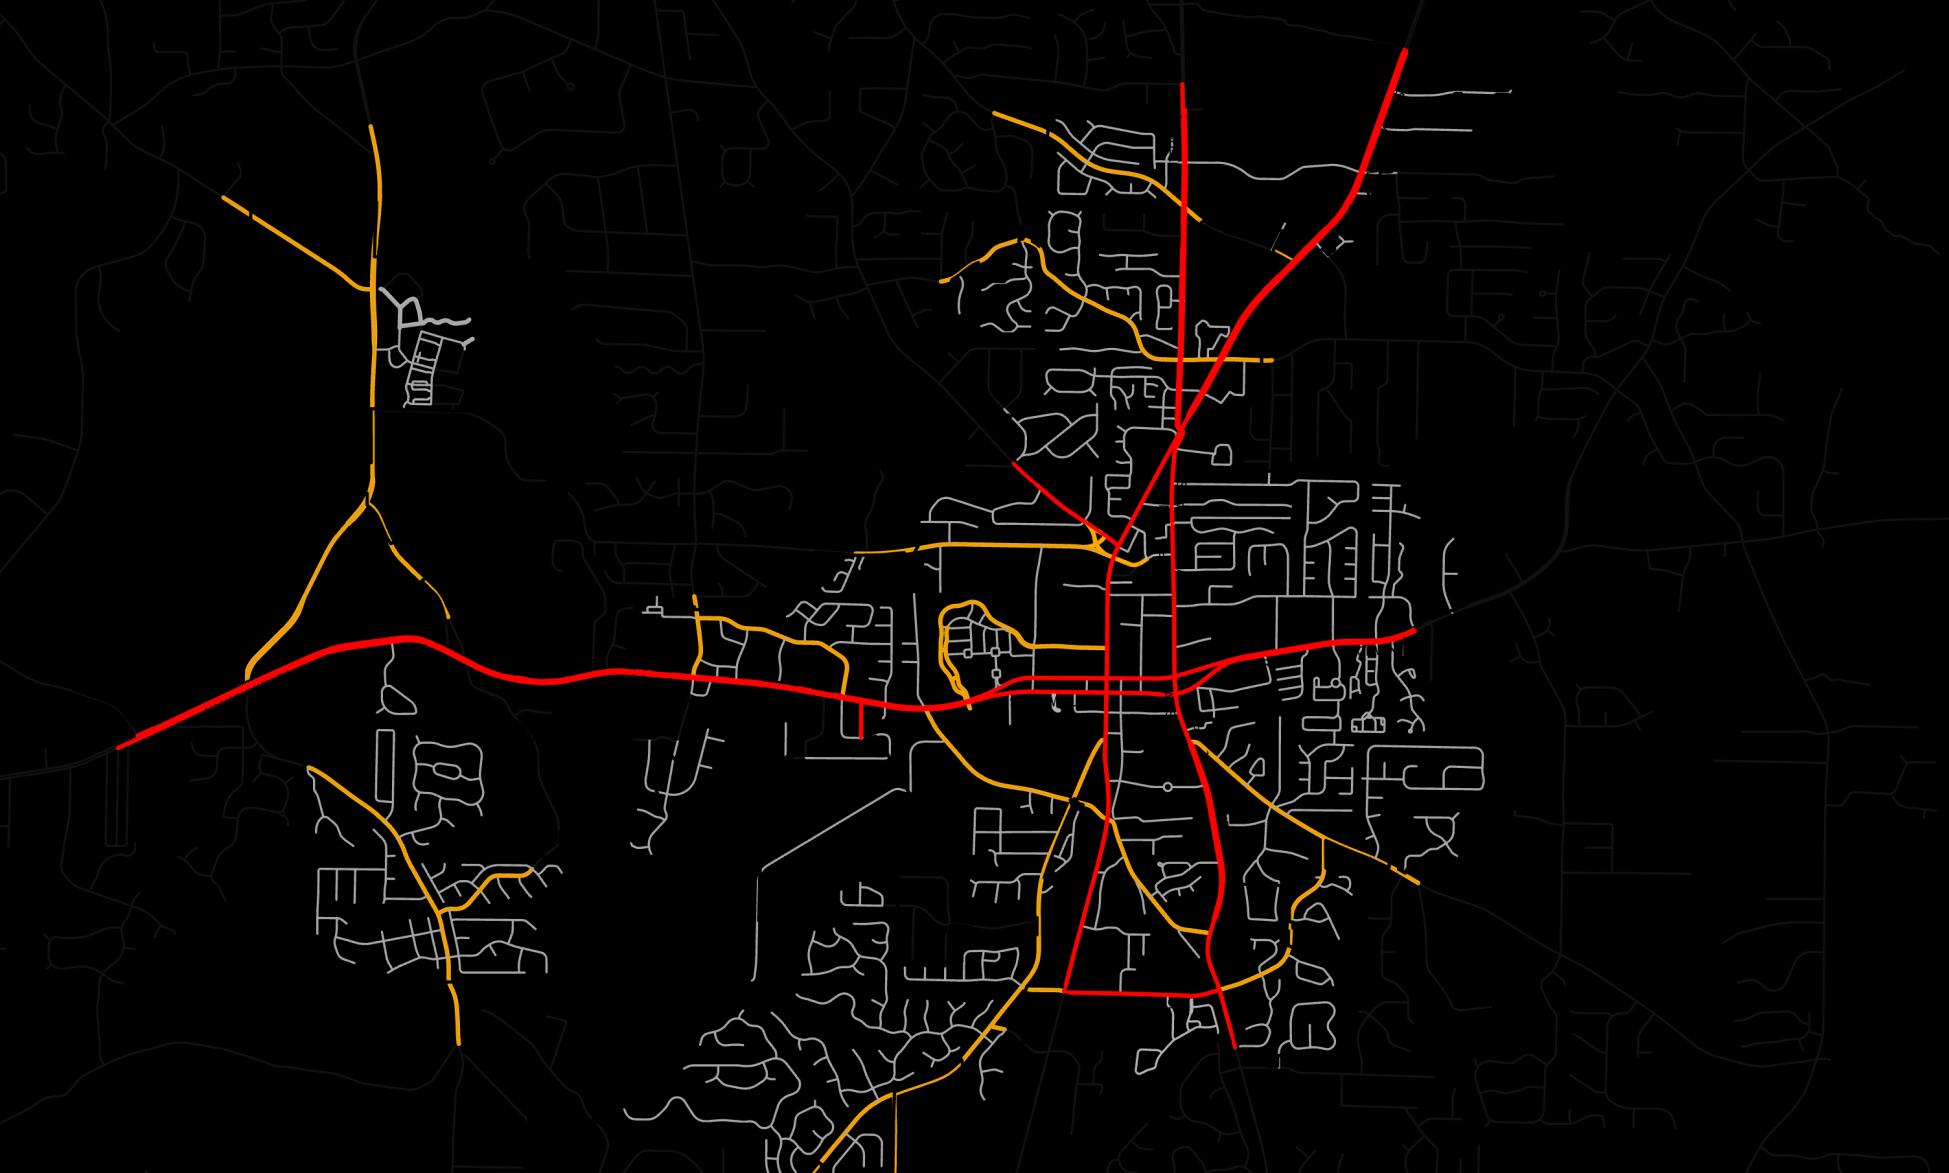
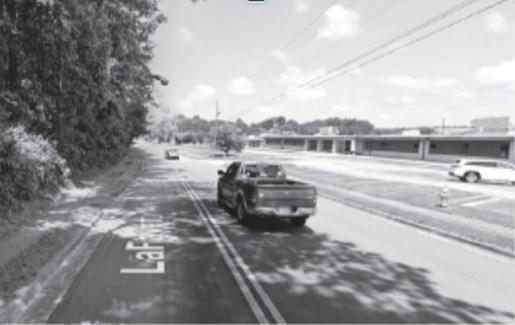
The assessment of existing traffic patterns, access points, and conditions of the street network is an integral part of the Comprehensive Plan because land use and the street system are interdependent.
Historically commercial establishments generate high traffic volumes and pursue locations along major thoroughfares with high traffic capacity and visibility. Industrial and warehousing operations generate heavy truck traffic and are typically located adjacent to similar uses. Office and industrial employment centers generate high peak hour volumes and require convenient routes to expressways. For example SR 85, SR 92, SR 314 and SR 54 have higher traffic volumes than other roads in the city and, therefore, provide more opportunity to capture a segment of the pass-by traffic. Conversely, the arrangement of land uses can influence traffic flow. Residents often desire convenient access to work and shopping but generally want safe, low-volume streets in their neighborhoods. A well-designed street system can safely accommodate a mix of traffic generated by each land use.
Street Functional Classifications
Functional Classification
Street Functional Classifications with Neighborhoods
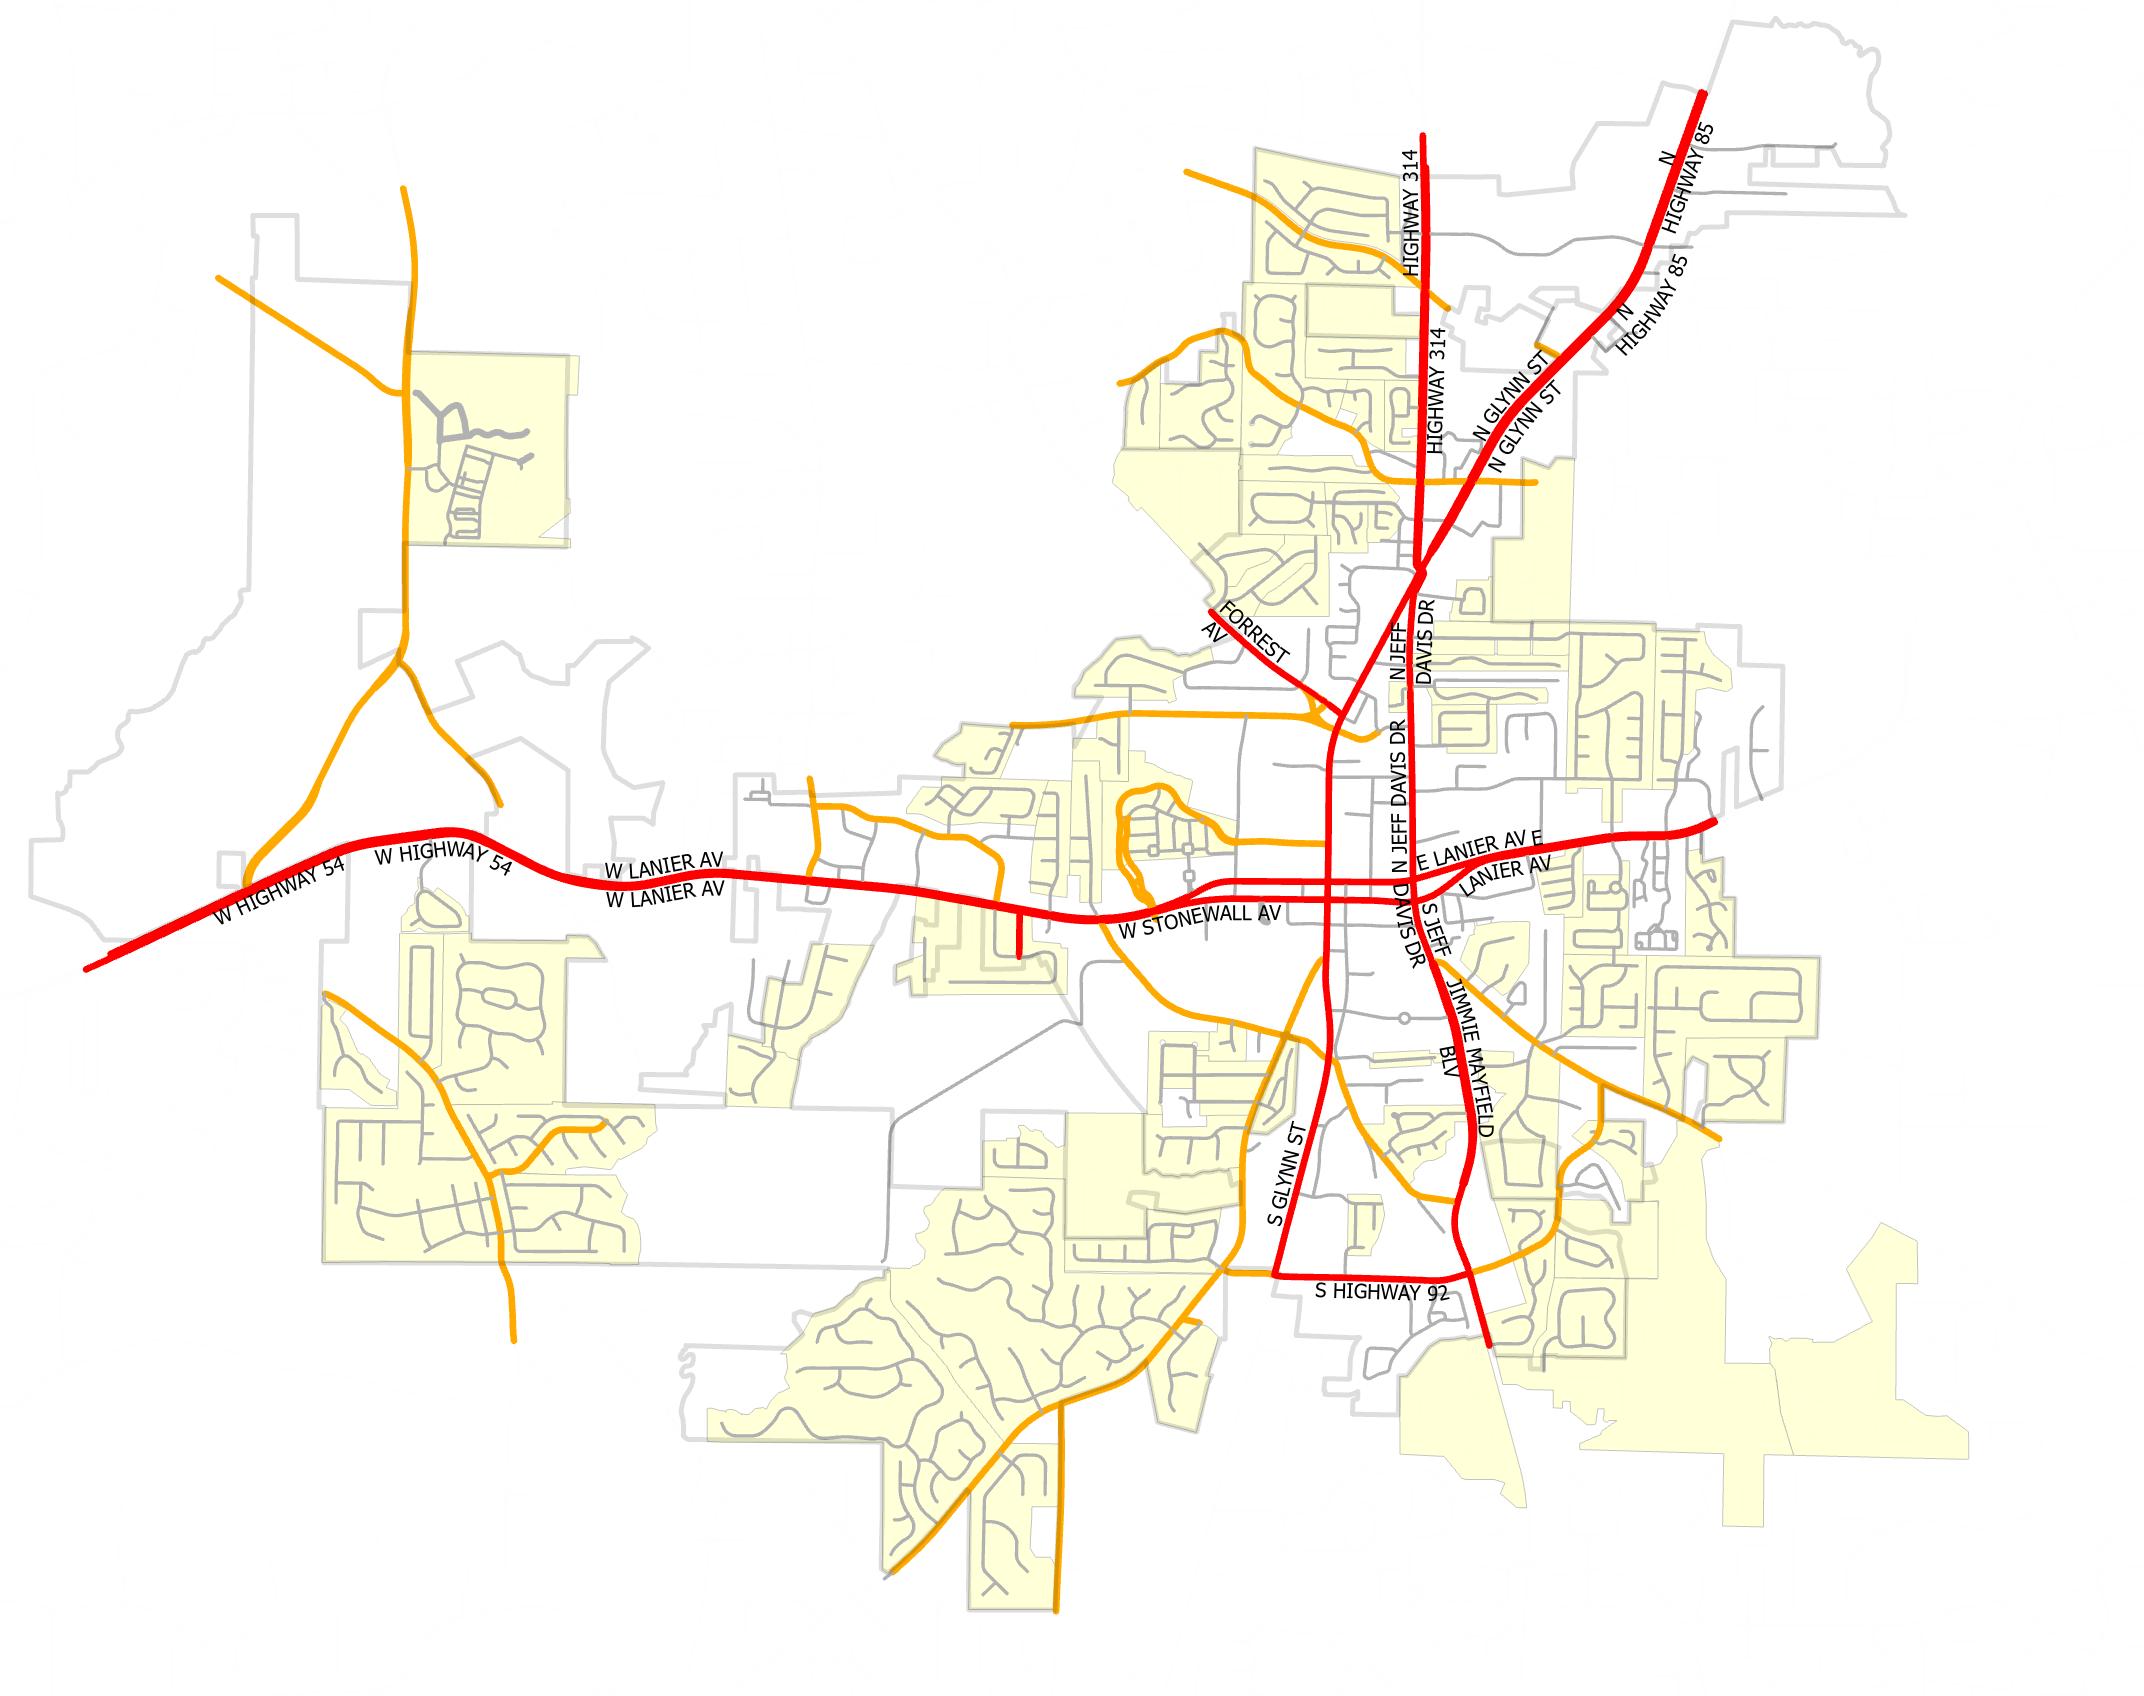
The city has an estimated 150 miles of streets, with limited connections where motorists can travel to other parts of the city without depending on major corridors. While limited connectivity discourages traffic on local streets, it also constraints residents from entering and departing their neighborhood. The city's road network is not comprised of the traditional grid pattern. Between the early 1950's to the 1990's, the street network began to shift from grid to traditional suburban street patterns when regulations focused on reducing and even eliminating through movements on many residential streets and having them take place on main arterials.
The opportunities for pedestrian mobility or even bicycles are even more constrained. As the population increases, this could cause further conflict, congestion, and potential safety concerns among all road users.
Currently, the vast majority (81%) of city residents who are employed drive alone to work while 8% carpool, 0.5% use transit (bus or rail), and 8% work from home. Most households (98%) have at least one automobile. The average city resident takes 33 minutes on average to travel to work.
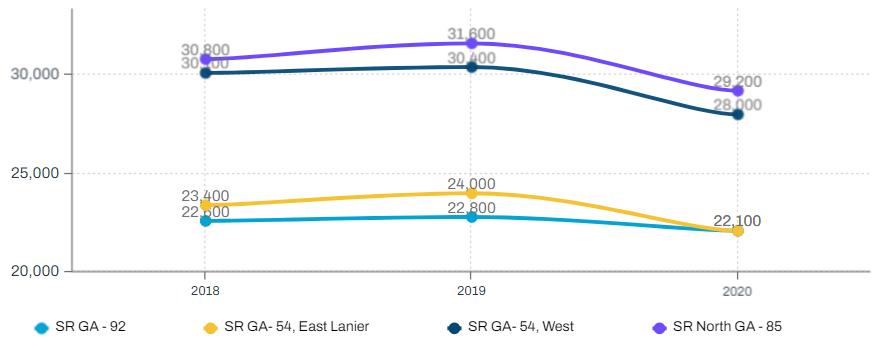
The table below shows there are currently sixty-four (64) signalized intersections in the county with the majority located within Fayetteville along state routes. Even with the growth in population, traffic volumes on arterials has declined slightly. Further review should be conducted to confirm the decline is not related to the pandemic or other issues. Fayetteville moves forward by considering how streets are not only efficient, but safe for all users.
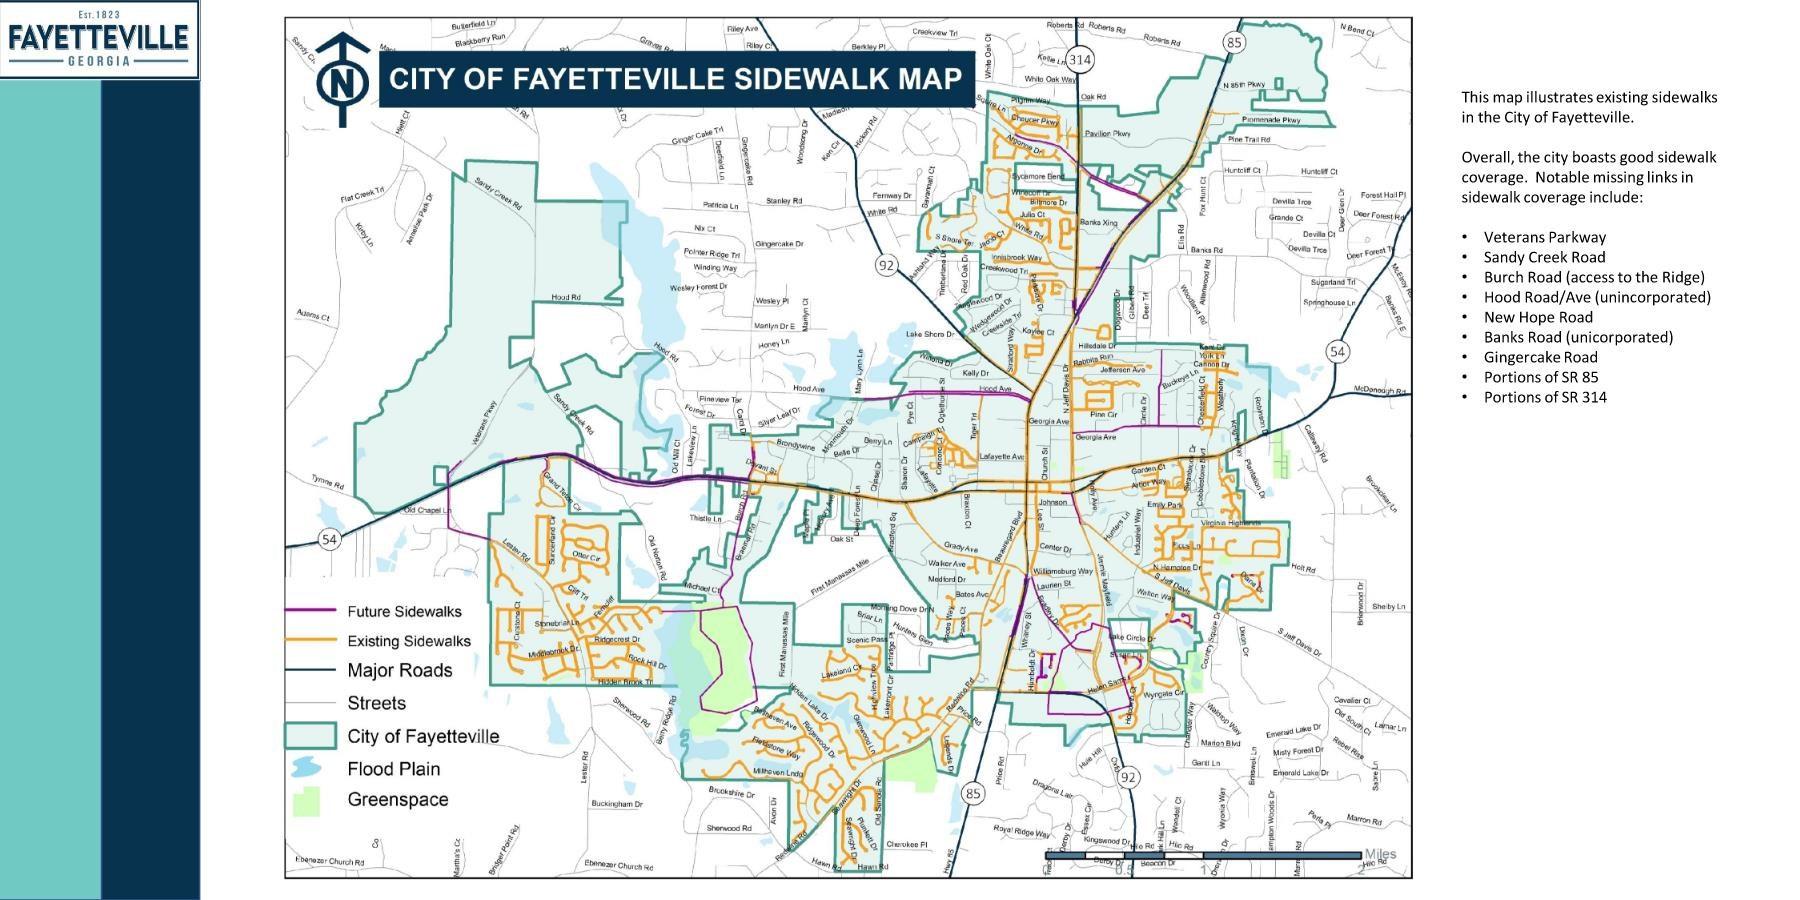
The map below shows a rough estimate of the city sidewalk network in 2019. Overall, the city boasts good sidewalk coverage, but the pedestrian experience when traveling varies greatly and is dependent on factors such as:
Traffic volume
Sidewalk width and physical condition
Quality of the sidewalk surface
Obstructions
The presence of landscaping and street furniture
Public art
Building frontages
Neighboring use
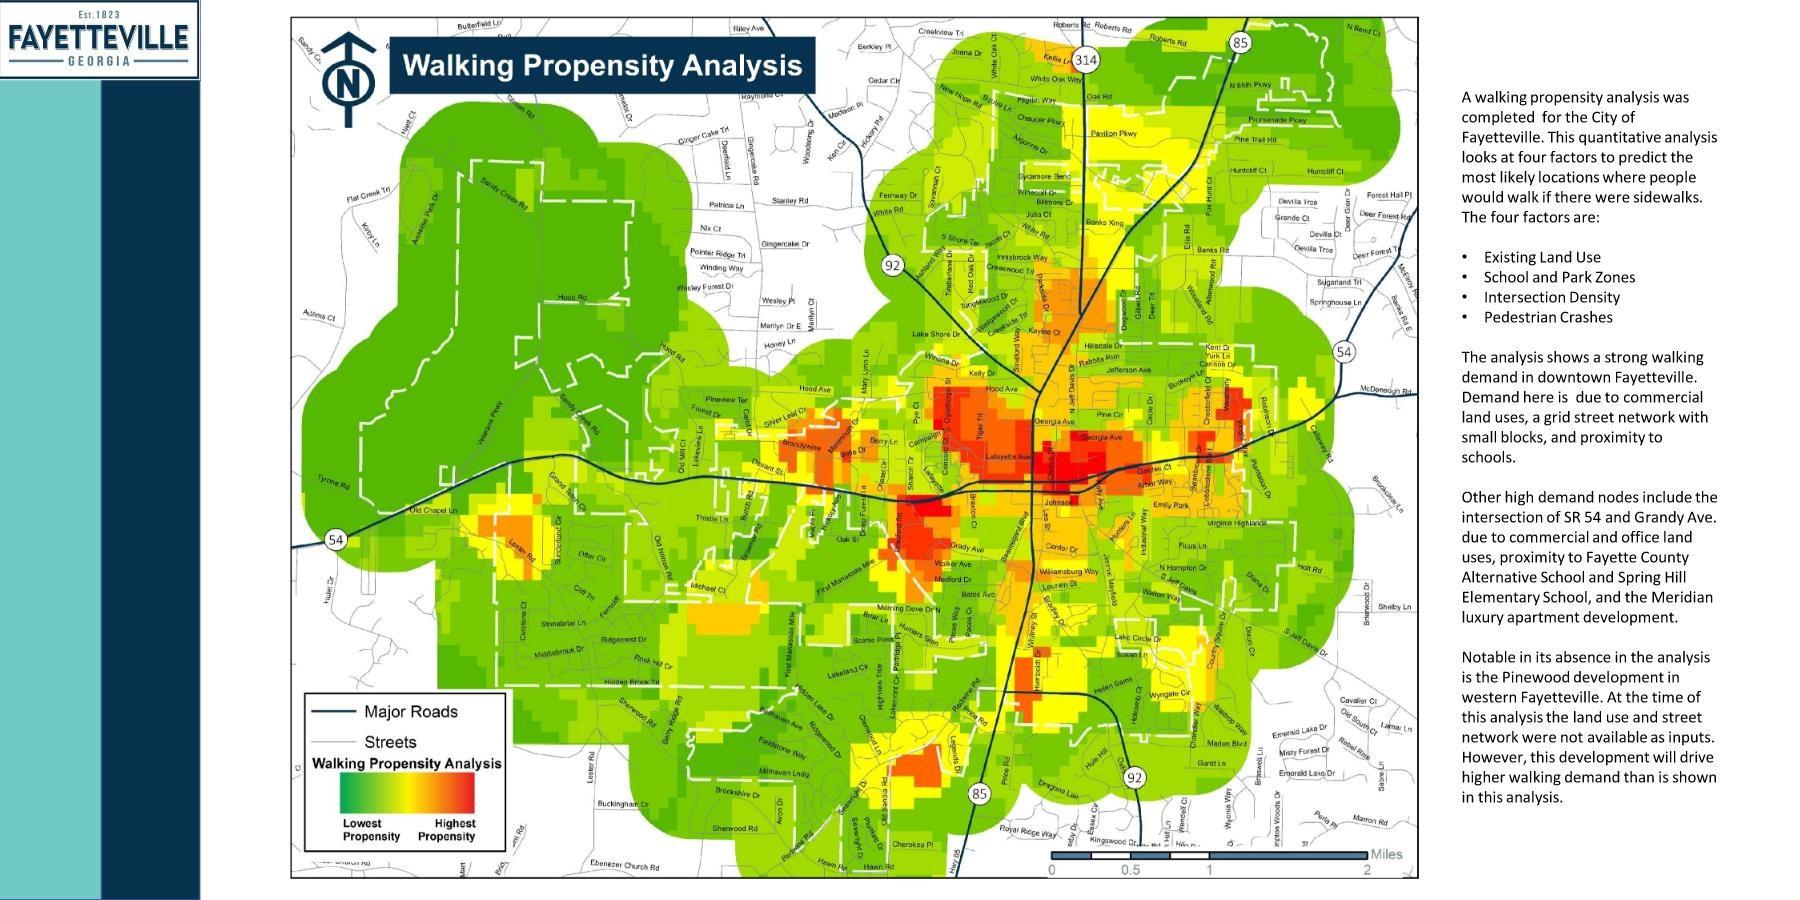
In 2019 a walking propensity analysis was conducted as a part of the city's Master Path Plan. This quantitative analysis reviewed four factors to predict the most likely locations where people would walk if there were sidewalks.
The four factors included:
Existing Land Use
School and Park Zones
Intersection Density
Pedestrian Crashes
The analysis showed a strong walking demand in downtown Fayetteville which was due to commercial land uses, a grid street network with small blocks, and proximity to schools. Other high demand nodes include the intersection of SR 54 and Grady Avenue due to commercial and office land uses, proximity to Fayette County Alternative School and Spring Hill Elementary School, and the Meridian apartment development.
The analysis did not include Trilith Studios or the Town at Trilith due to the fact this area was still
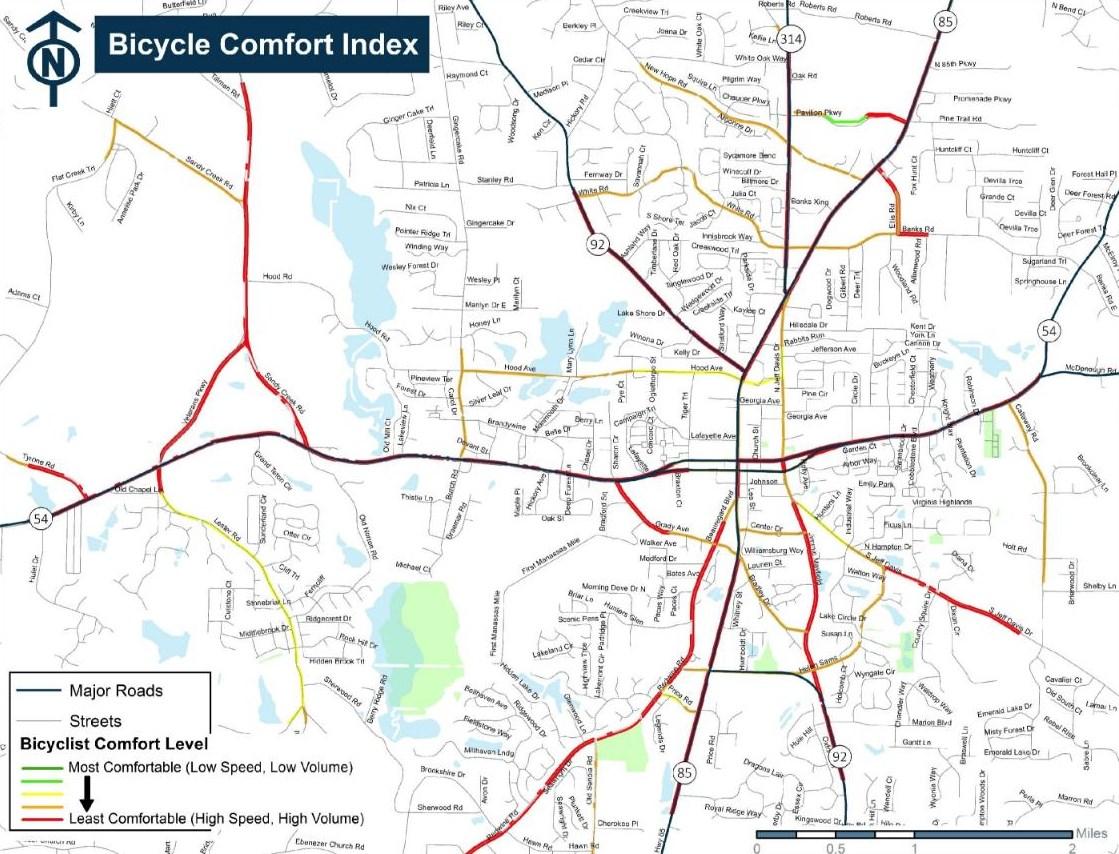
The Master Path Plan also evaluated existing streets throughout the city to determine how comfortable they were for biking. Among other factors, the Bicycle Comfort Index analyzed the speed and volume of automobile traffic. The index assumes that as travel speed the volume of traffic increase the road becomes less comfortable for cyclists.
This map shows level of comfort by color. Roads in green are the most comfortable to ride on. Those yellow and orange are progressively more uncomfortable to ride on. Those in red are the most uncomfortable to ride on. The results show that almost all of longer routes are uncomfortable to ride a bicycle on.
The City of Fayetteville undertook an LCI Study in 2002 which identified a series of transportation improvements intended to improve connectivity and circulation within the downtown core. The LCI recommendations mainly focused on congestion relief strategies, safety improvements, and nonmotorized travel alternatives. Specifically, the study recommended implementing intersection and traffic signal improvements along SR 85/Glynn Street between Lafayette Avenue and SR 54/ Stonewall Avenue. The study also recommended safety improvements for SR 85/Glynn Street, namely the installation of medians.
The 2010 LCI Supplemental Study was an update to the 2002 LCI Study. Like the 2002 study, the 2010 LCI Supplemental addressed connectivity and circulation within Downtown Fayetteville. The LCI Supplemental placed an increased focused on walk-ability and access management. It also presented concept plans for:
Extending Hillsdale Drive to SR 85/Glynn Street
Extending Church Street to Kathy Avenue
Intersection improvements at SR 92/Forrest Avenue at SR 85/Glynn Street
Church Street at Kathy Avenue
Hood Avenue at SR 92/Forrest Avenue Roundabout
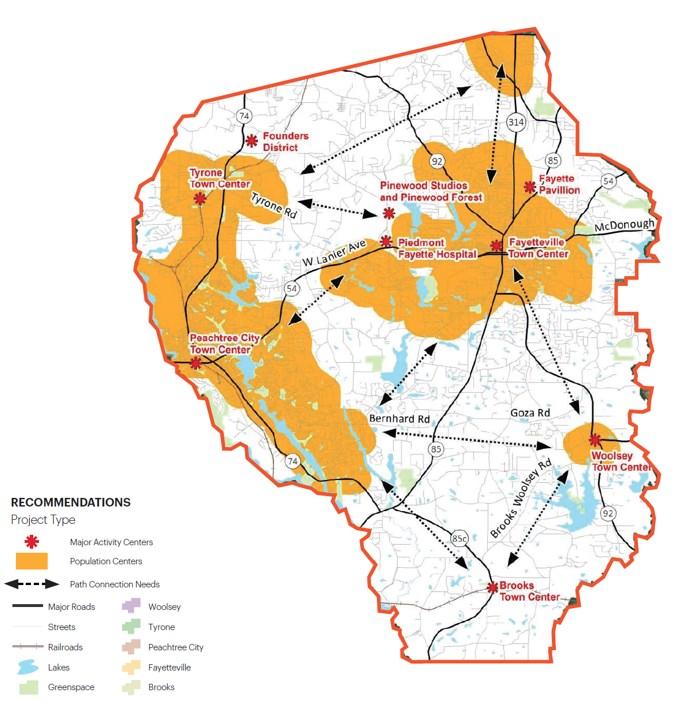
In March of 2018, a community stakeholder meeting was conducted that focused on the Master Path Plan and the development of a county-wide network of sidewalks, side paths (bi-directionally multi-use path along side of roadways), greenway trails, and bicycle routes. This meeting brought a variety of community members from various backgrounds together in an effort to identify common community interests. Community desires for various locations for bicycle routes, pedestrian walkways, and golf cart facilities including side paths, greenway trails, shoulder bikeways, signed shared roadway, and sidewalks were discussed and cataloged.
The meeting generated a significant amount of feedback for desired pathway connections. Common desired connection locations included a side path connections between Peachtree City and Fayetteville along Redwine Road, a side path on SR 54, and bicycle facilities on Bernhard Road and Brooks Woolsey Road. Common desired connection destinations include a regional trail connection in southern Peachtree City as well as connections to the Starr’s Mill school cluster as a starting point for the development of the Master Path Plan. The Master Path Plan includes design guidelines that cover the specifics of the path designs and how they should be constructed in relation to the existing environment.
The Master Path Plan discusses a City Hall project that will update land-use, pedestrian transportation networks and traffic patterns within the downtown area, while at the same time being integrated with expansion efforts of paths and sidewalks throughout the city, including enhancing the network of streets connecting SR 54, SR 85, Beauregard Blvd, and Grady Avenue.
The Master Path Plan will connect population centers, schools, parks, commercial land use, and other recreational opportunities, as well as accommodate pedestrians, bicyclists, and golf cart users.
This LCI study of the downtown area focused on implementation and hence featured a multidisciplinary team that integrated urban planning & design, existing conditions, community engagement, market analysis, transportation, and zoning, in a collective vision for the Downtown Fayetteville study area. The transportation section reviewed operational characteristics, potential changes and improvements to the mobility network.
The following frameworks recommendation were proposed:
• Recognizes the physical constraints, context, and character of the surrounding built and natural environment. It recommends policies and projects that strengthen the pedestrian, bicycle, and vehicle transportation network
• Defines ideal standards for Complete Streets in local areas. “Complete Streets” refer to the concept that roadways should be designed with all users in mind, not just motorists. These standards apply context-sensitive design approaches to roadway redesign that enable safe, convenient, and comfortable travel or access for users of all ages and abilities regardless of their mode of transportation. This effort will support walking and bicycling within Fayetteville.
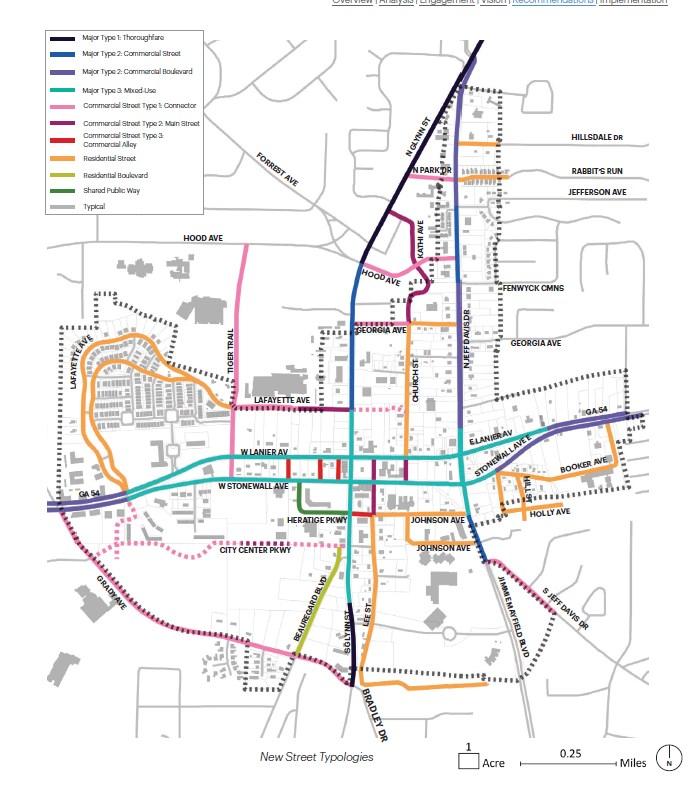
• Establish a Street Typology, the traditional functional classifications of streets provide a hierarchy that correlates traffic flow to land access. Traffic volume, speed, and level of service provide the basis for roadway design criteria. However, this classification system falls short in considering non-vehicular users of the public right-of-way (pedestrians, bicyclists, and transit) and is void of context for how the street impacts adjacent land uses and vice versa.
• Advocates for (re)developing Fayetteville’s core transportation network to work for the city’s residents, businesses, and visitors. This requires flexibility in its design application and implementation so that mobility priorities and guidance for transportation investments are identified to improve resident’s quality of life and access to goods or services.
The 2019 Fayette Transportation Plan is Fayette County’s Comprehensive Transportation Plan (CTP) and identifies a set of short-term, intermediate, and long-range transportation system development opportunities. As it relates to the City of Fayetteville, the Fayette Transportation Plan primarily identifies the following policy changes recommendation:
• Veterans Parkway Overlay district that will encourage best practices in access management
• County-Wide Truck Route Ordinance restrictions through truck movements
• Refine Path Design Guidelines
• Sandy Creek Road Needs Assessment
Additionally, the Fayette Transportation Plan lends support for the City of Fayetteville’s use of Special Purpose Local Option Sales Tax (SPLOST) program funding, and the development of the Fayetteville City Center. In 2017, in a county-wide referendum, Fayette County citizens voted to approve the 1% (or 1¢) SPLOST. The following is the status of the 2017 SPLOST transportation projects.
From the comprehensive plan, previous studies, public input, and staff review, the following list of high priority projects were compiled. Some of the projects did not have identified funding sources.
• Citywide – add sidewalks
• SR 85 South –widen to four lanes
• Work with GDOT and other stakeholders to make SR 54 and SR 85 in the downtown area safe and pedestrian friendly
• Improve and add sidewalks citywide
• Improve and update the multi-use path
• Fayette Bypass complete
• Citywide –create grid street network/connect neighborhoods
• Hood Avenue – connect to Sandy Creek
• Advocate for citywide – synchronize traffic signals
• SR 85, SR 314, and Jeff Davis – improve flow, add safety improvements
• City Center Engineering and Constructions
• S.R. 54 Multi-Use Bridge-Crossing
Fayetteville is well-positioned geographically to the City of Atlanta, Hartsfield-Jackson Atlanta International Airport and to I-85 and I-75 which makes it convenient for residents, business owners and industrial tenants to travel for business and/or pleasure. The city has a wealth of natural, cultural, historical, and commercial resources that provide an amenity for residents, a destination for tourists, and an attractive location for commercial business and industry.
The unemployment rate within the city in 2022 is 3.7% which is a slight increase over 2020 (3.4%).
Revenue continues to be steady in most sectors, while sectors affected by the pandemic (hotel/ motel tax, excise tax and court-related revenue) have started to normalize. The financial position of the city continues to improve from the recent recession, with three years of positive growth in the tax digest. Most revenue sources are stabilizing and some are showing slight increases. The city continues to maintain adequate fund balances consistent with the reserve fund policy, while also monitoring of revenue and expenditures.
A household includes all the persons who occupy a housing unit as their usual place of residence. The 2021 census data indicates that Fayetteville has 6,741 households, with approximately 69% identified as owner-occupied. Of the owner-occupied households, 25% of the occupants earn less than $50,000 annually, 33% earn between $50-$100,000 annually, and 41% earn more than $100,000 annually. Most homeowners are married couples between the ages of 45-64 with a combined income exceeding $100,000. A growing number of single residents and those between the ages of 25-34 also purchasing homes in the city.
In the rental-occupied households, 34% are occupied by residents earning less than $35,000 annually; 24% are occupied by residents earning between $50-$75,000 annually; and 29% are occupied by residents earning more than $75,000 annually. Statistics show that households earning less than $35,000 annually are likely renting due to income restrictions and a lack of affordable housing options. Statistics also show there is a growing number of renters who could afford to own but choose to rent. Within the city, rental-occupied households are split evenly amongst household type (singles, married couples, and other family) and age distribution (25-34, 35-44, and 45-54).
In 2019 the average median income of residents in the downtown district was between $52,700$83,500. Through the years there has been a steady increase in the average median income with concentrations of high-earning households within the western and southern portions of the city. This trend is consistent with the median income in unincorporated Fayette County which also shows a concentration of higher median income households to the west and south of the city. Typically these areas are occupied predominantly by families and/or empty nester homeowners
Between 2018 and 2019 the median home value in Fayetteville increased 4.1% from $215,200 to $224,100, which was 0.93% less than the national average of $240,500.
Within downtown Fayetteville home values have decreased 4% since 2010. On average the median home value within the city is 30% less than median home values within unincorporated Fayette County ($281,400). Home values not only vary within the city limits but also throughout the county depending on location and proximity to school complexes, other jurisdictions (Peachtree City, Tyrone, etc.) and larger lot sizes and open space available within the unincorporated county. This disparity can be attributed to a deficit of new housing being built within the city limits.
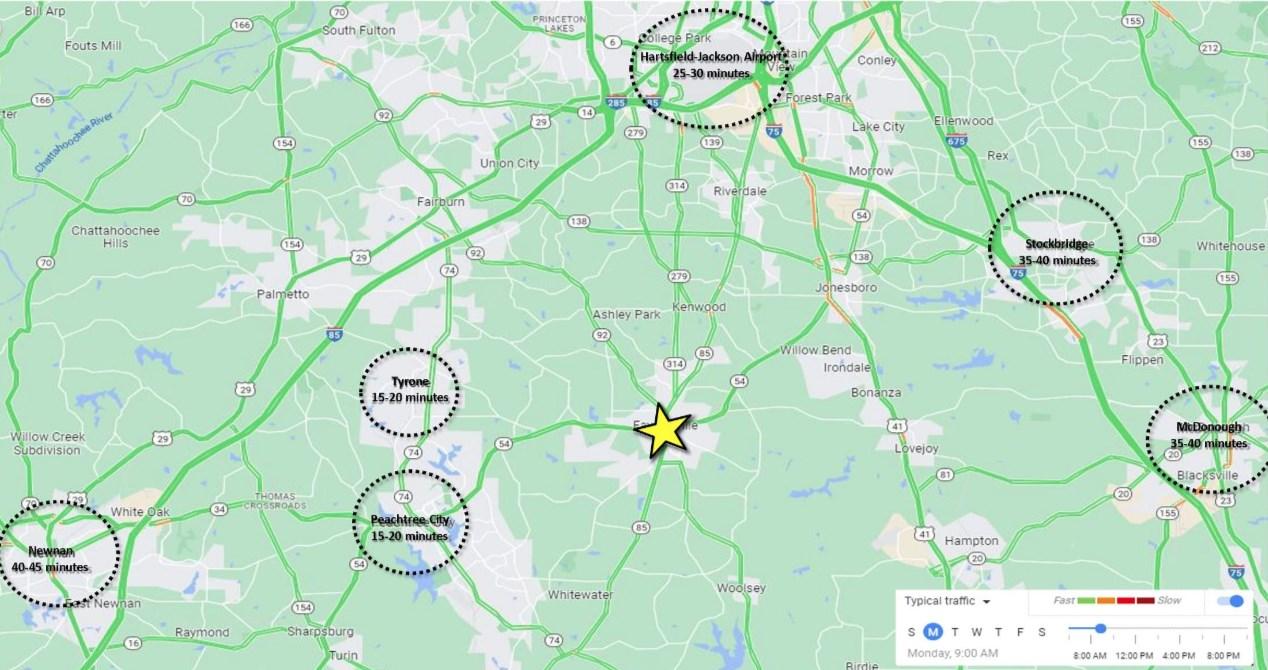
The city's proximity to I-85 and I-75 hinders the ability to market the city to larger industrial and/or office uses. In contrast both Newnan and Peachtree City have direct access to the interstate and established industrial parks which make them more marketable to industrial, manufacturing and logistics facilities. Fayetteville is situated to provide for a short commute to major employment centers within the southern crescent of metro-Atlanta, including Hartsfield-Jackson International Airport, the Aerotropolis, as well as businesses and industries located within the I-85/I-75 corridors. As seen in workflow patterns, the majority of workers commuting to and from the city tend to live in the surrounding communities, work locally or commute from these areas into other employment centers.
An estimated 14,310 people are employed within the city limits with approximately 41% earning more than $40,000 annually; 31% earning between $15-$40,000 annually; and 28% earning less than $15,000 annually. The majority of jobs paying more than $40,000 annually are in the healthcare or public administration fields.
Of those individuals working within the city limits, an estimated 13,609 commute to work which indicates a potential shortage of housing options for those wanting to live and work within the city. Approximately 17% of people who work in the city live within a 4-mile radius of the city limits while another 12% within or close to Tyrone, Peachtree City and Jonesboro.
Employment data managed by the city indicates the public sector employs a significant number of individuals who work within the city. While the public sector provides high quality jobs for residents, it does not directly add to the tax base of the city especially since these properties are tax-exempt.
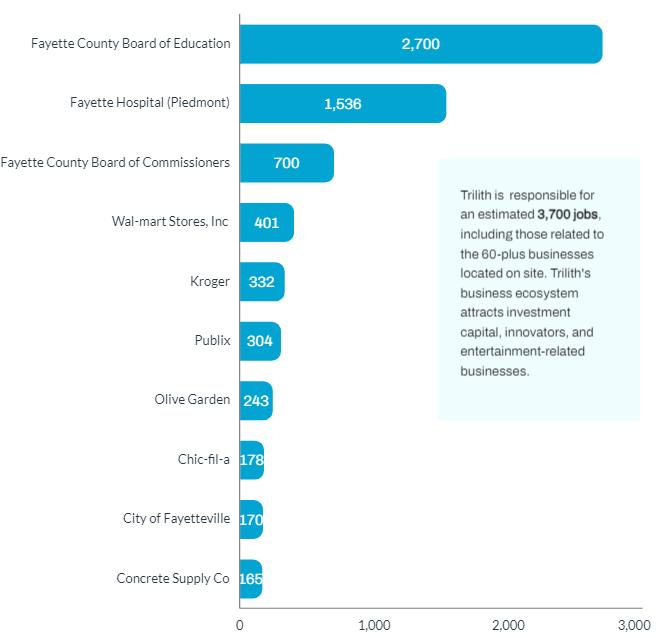
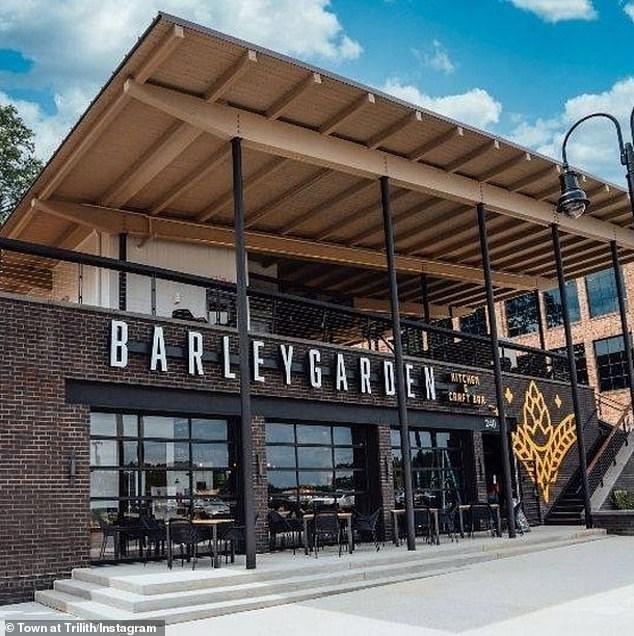
Trilith is responsible for an estimated 3,700 jobs, including those related to the 60-plus businesses located on site. Trilith's business ecosystem attracts investment capital, innovators, and entertainment-related businesses.
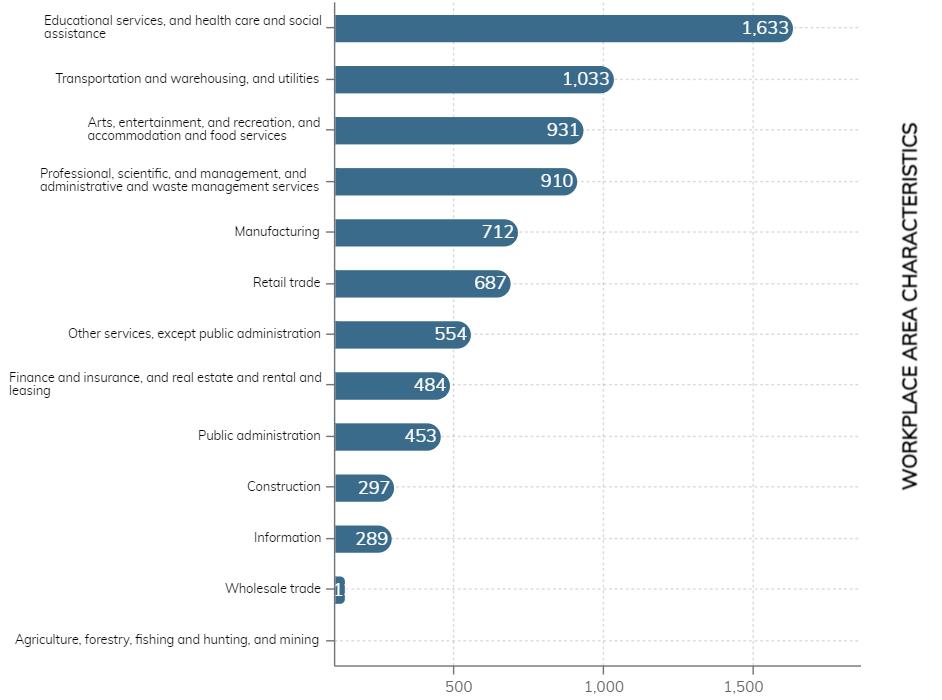
The latest census data shows the largest employment sectors within the city are educational services and healthcare, followed by transportation and arts/entertainment. Construction/ manufacturing/warehouse jobs are primarily within the eastern and northern sectors while medical and technical jobs are primarily to the west. Most public sector and public administration jobs are concentrated downtown.
The city's target industry sectors include small business, retail and film production support services, professional and corporate office users, computers and technology, and health services.
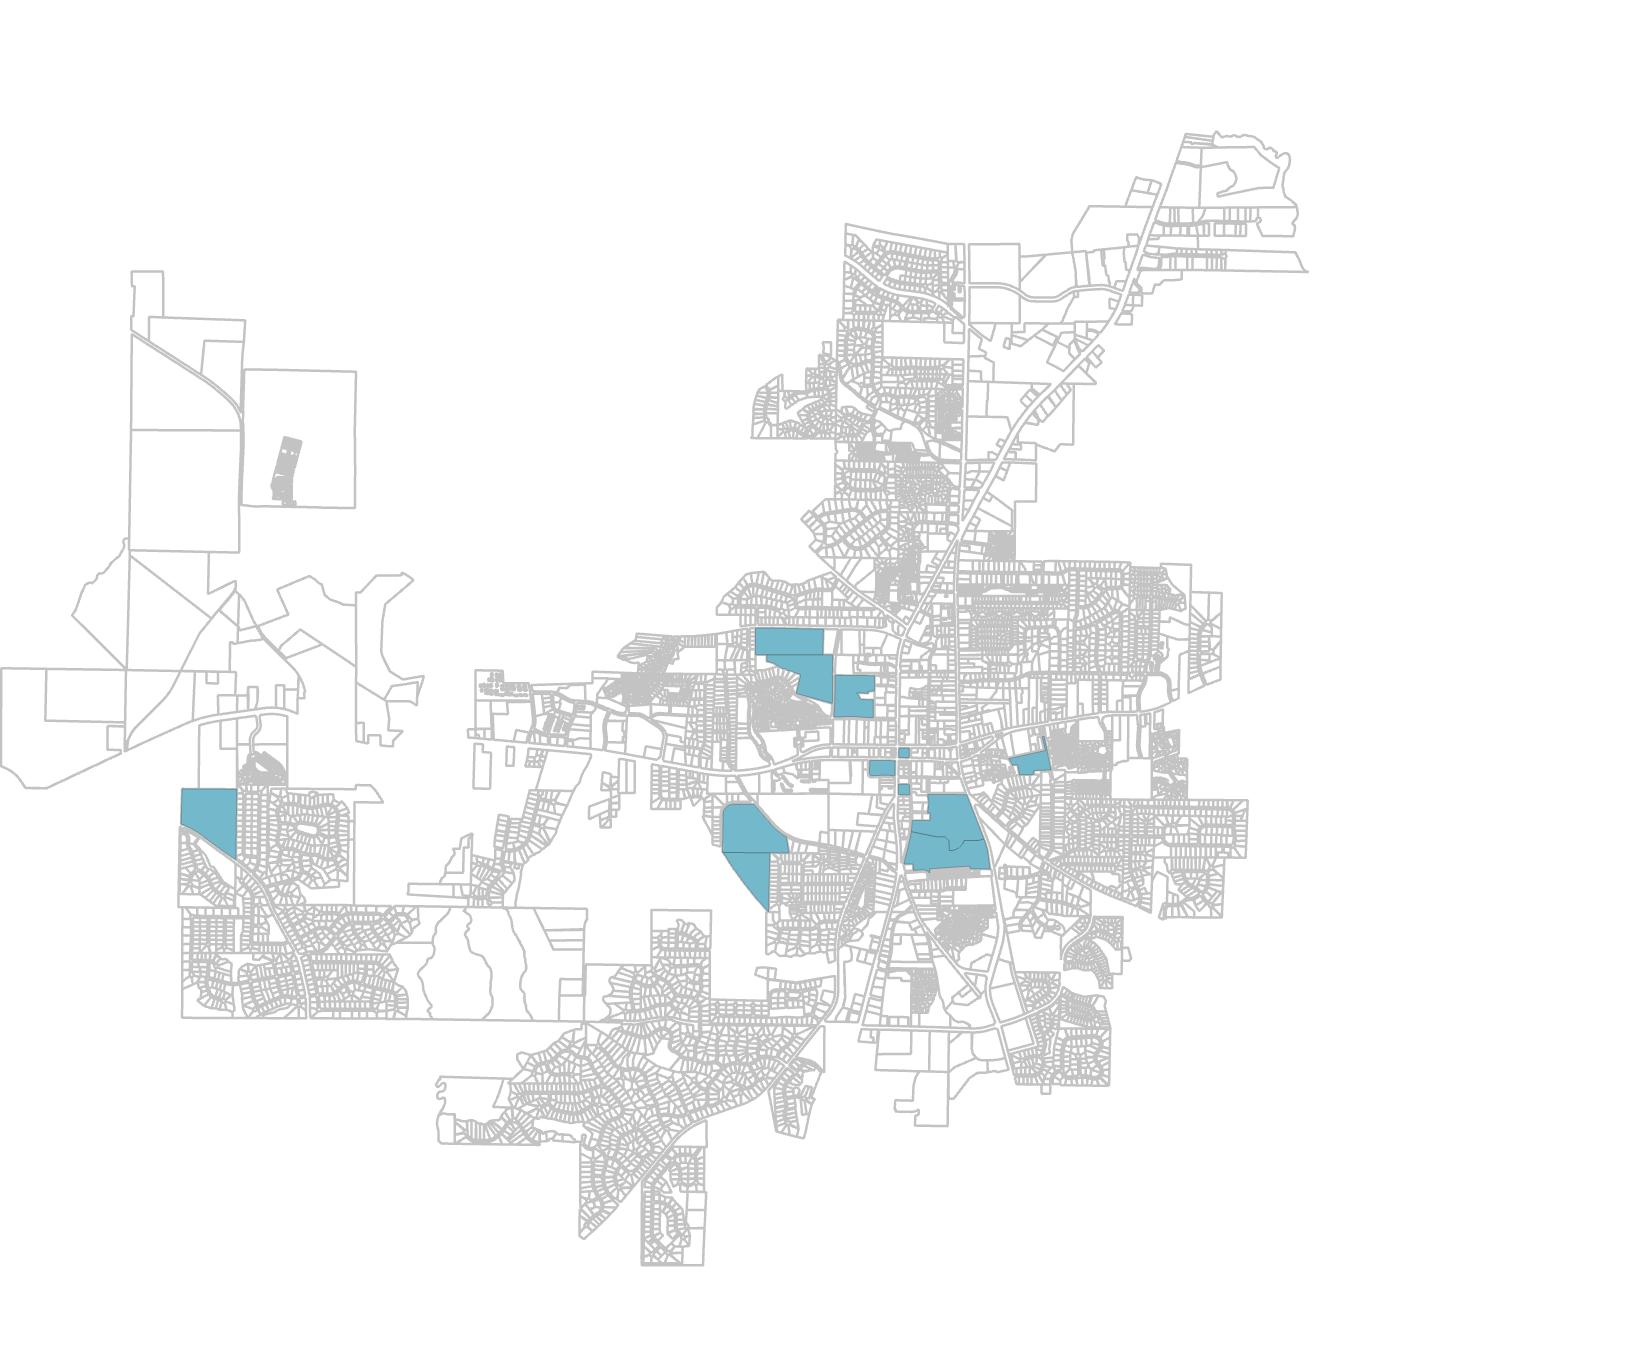
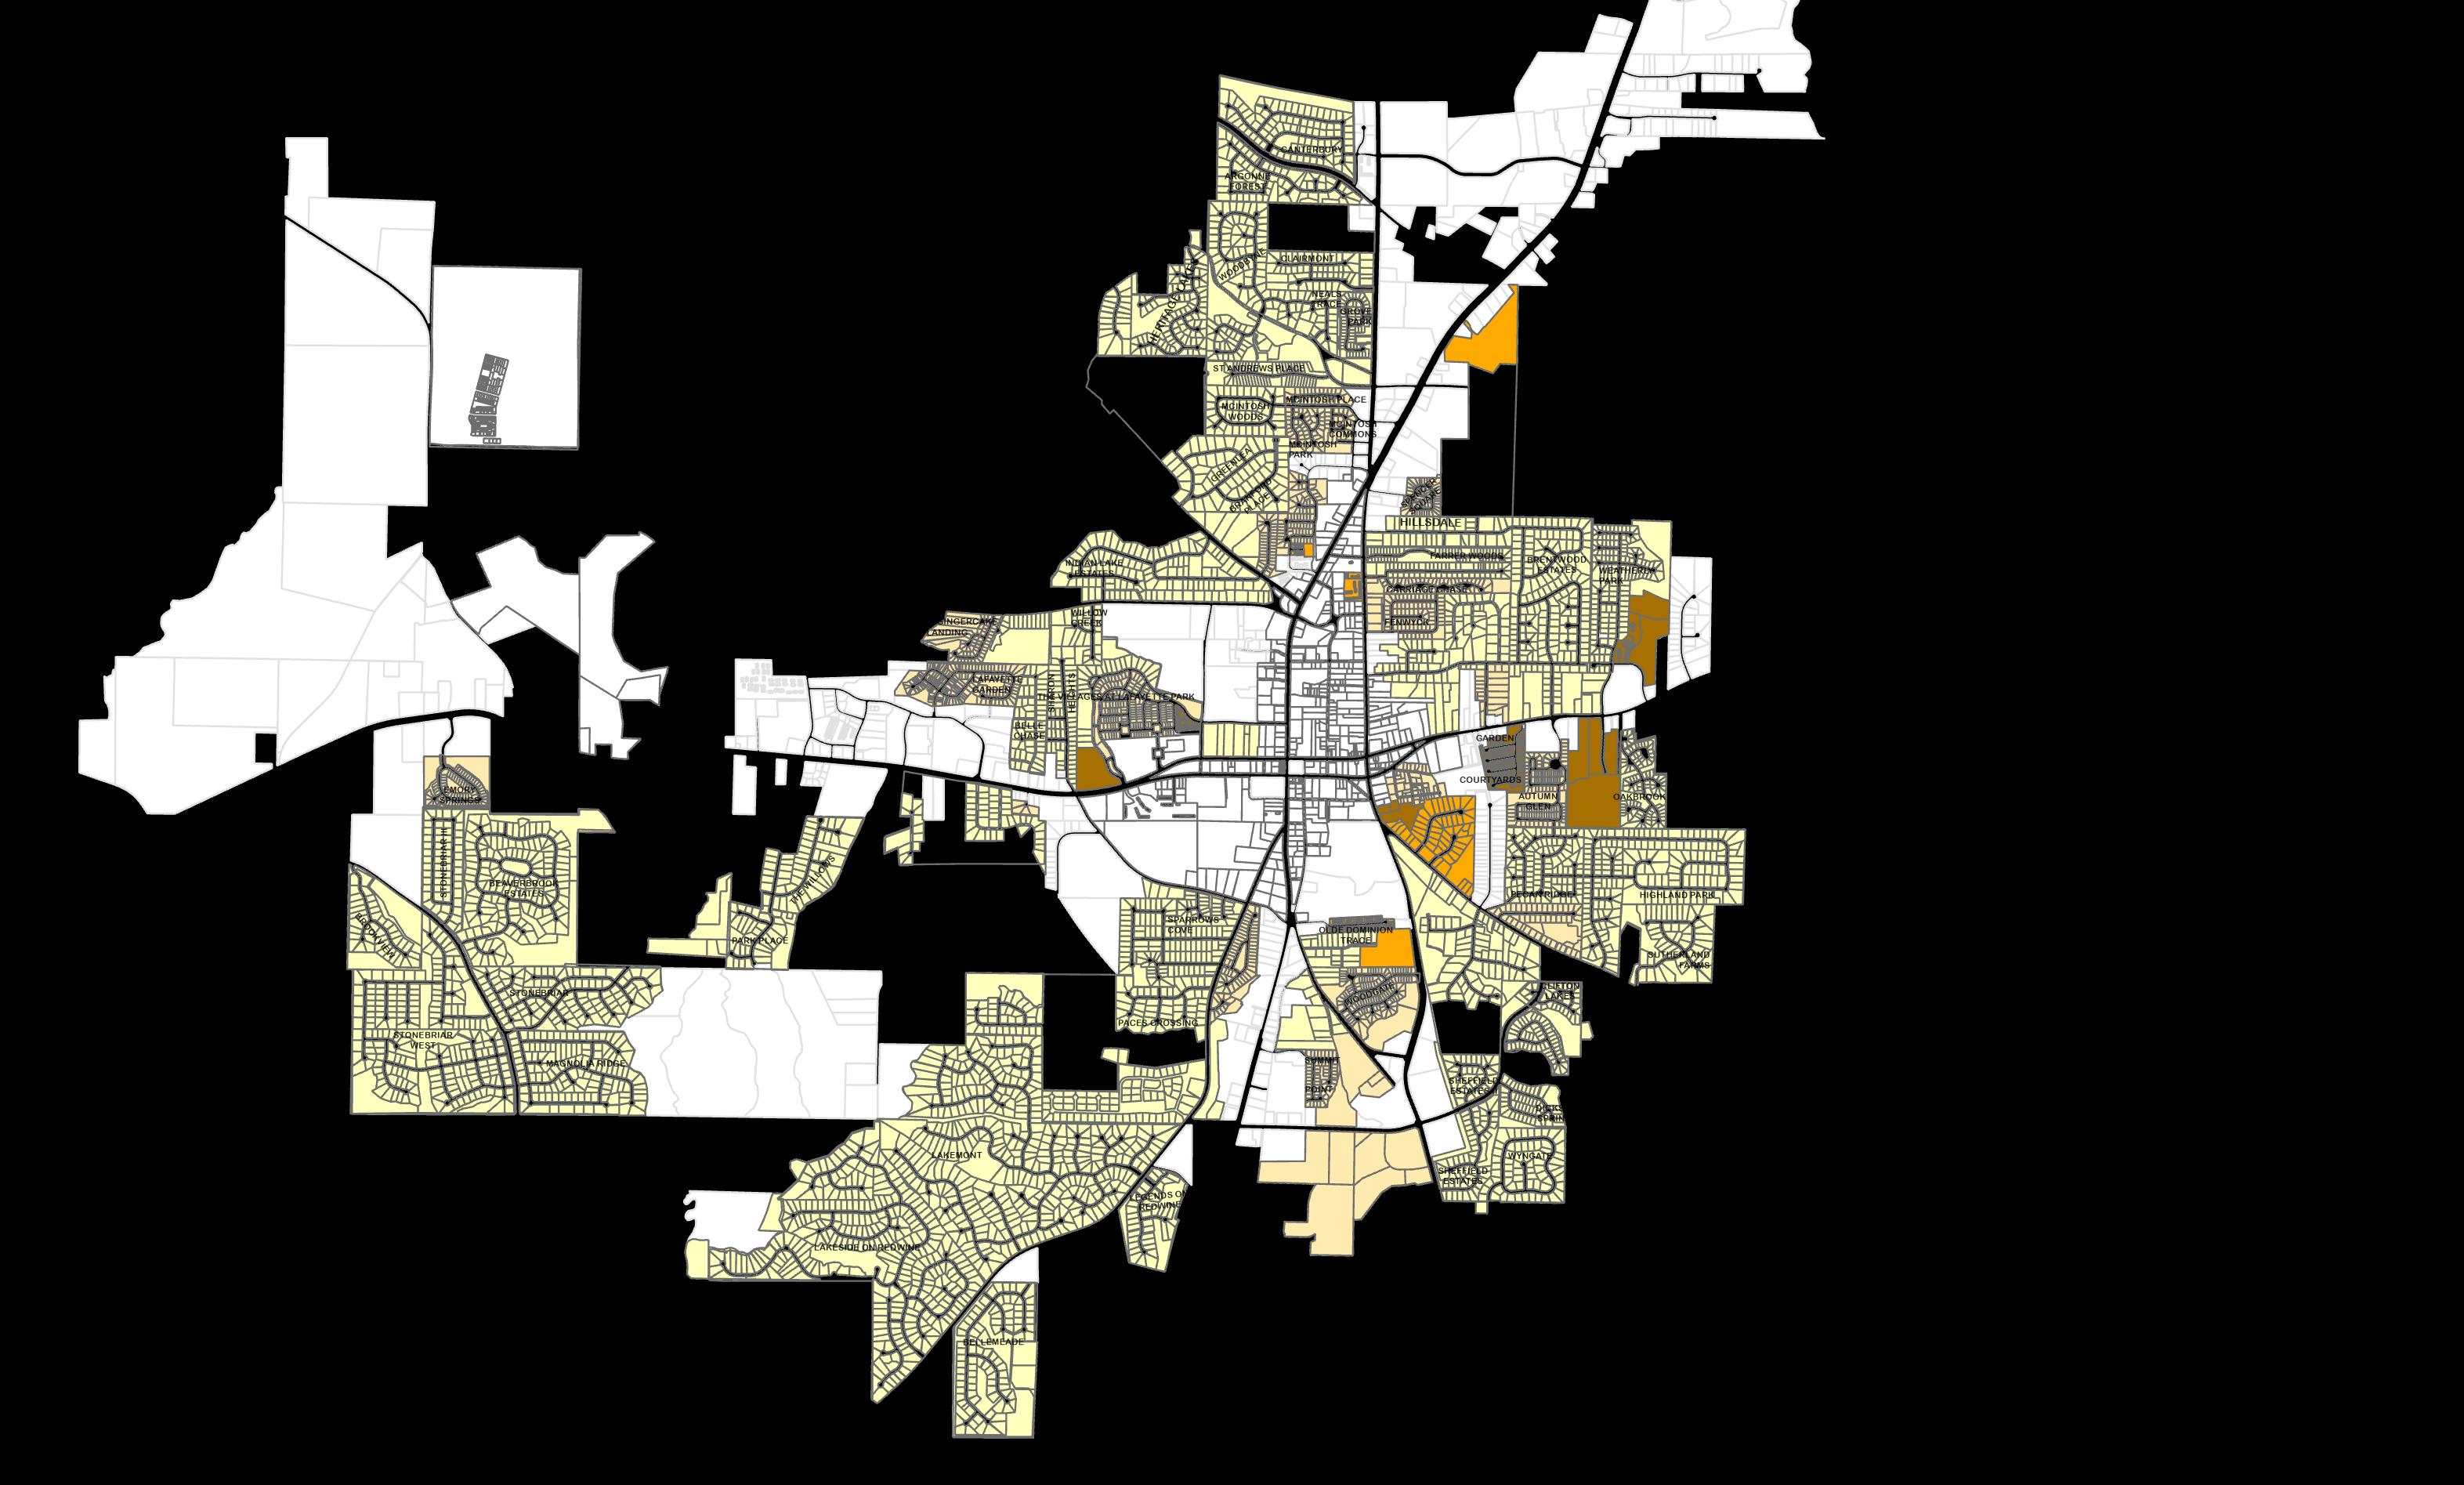
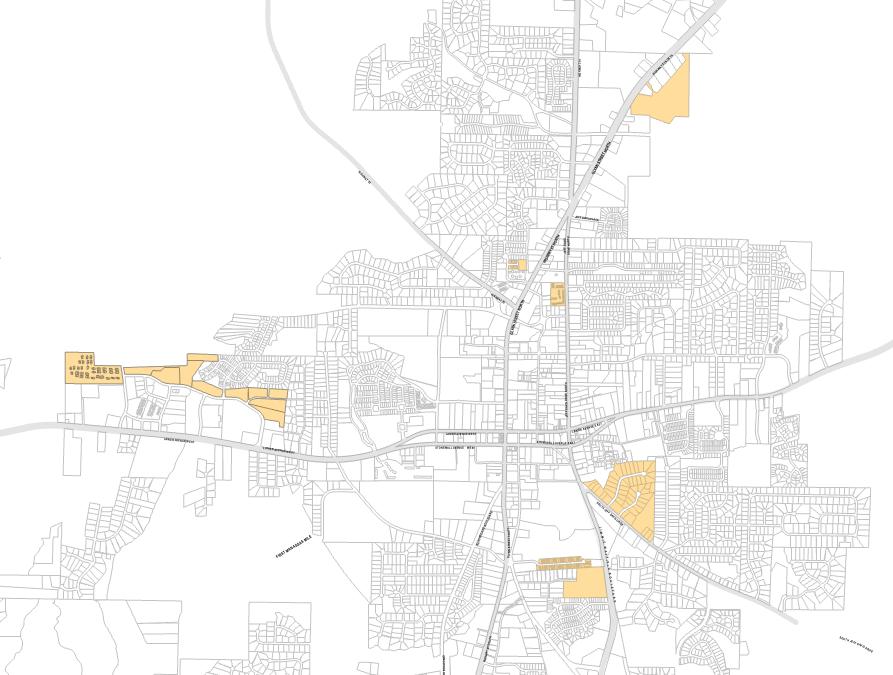
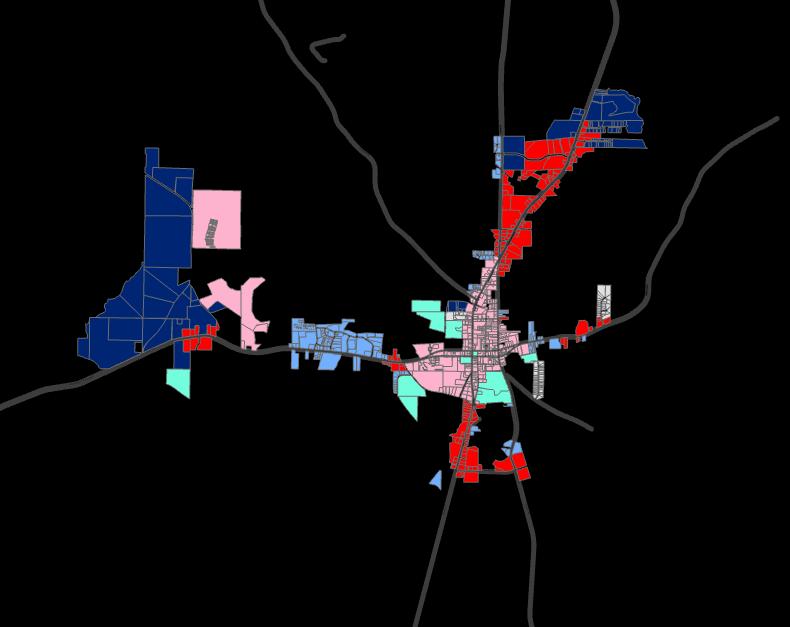
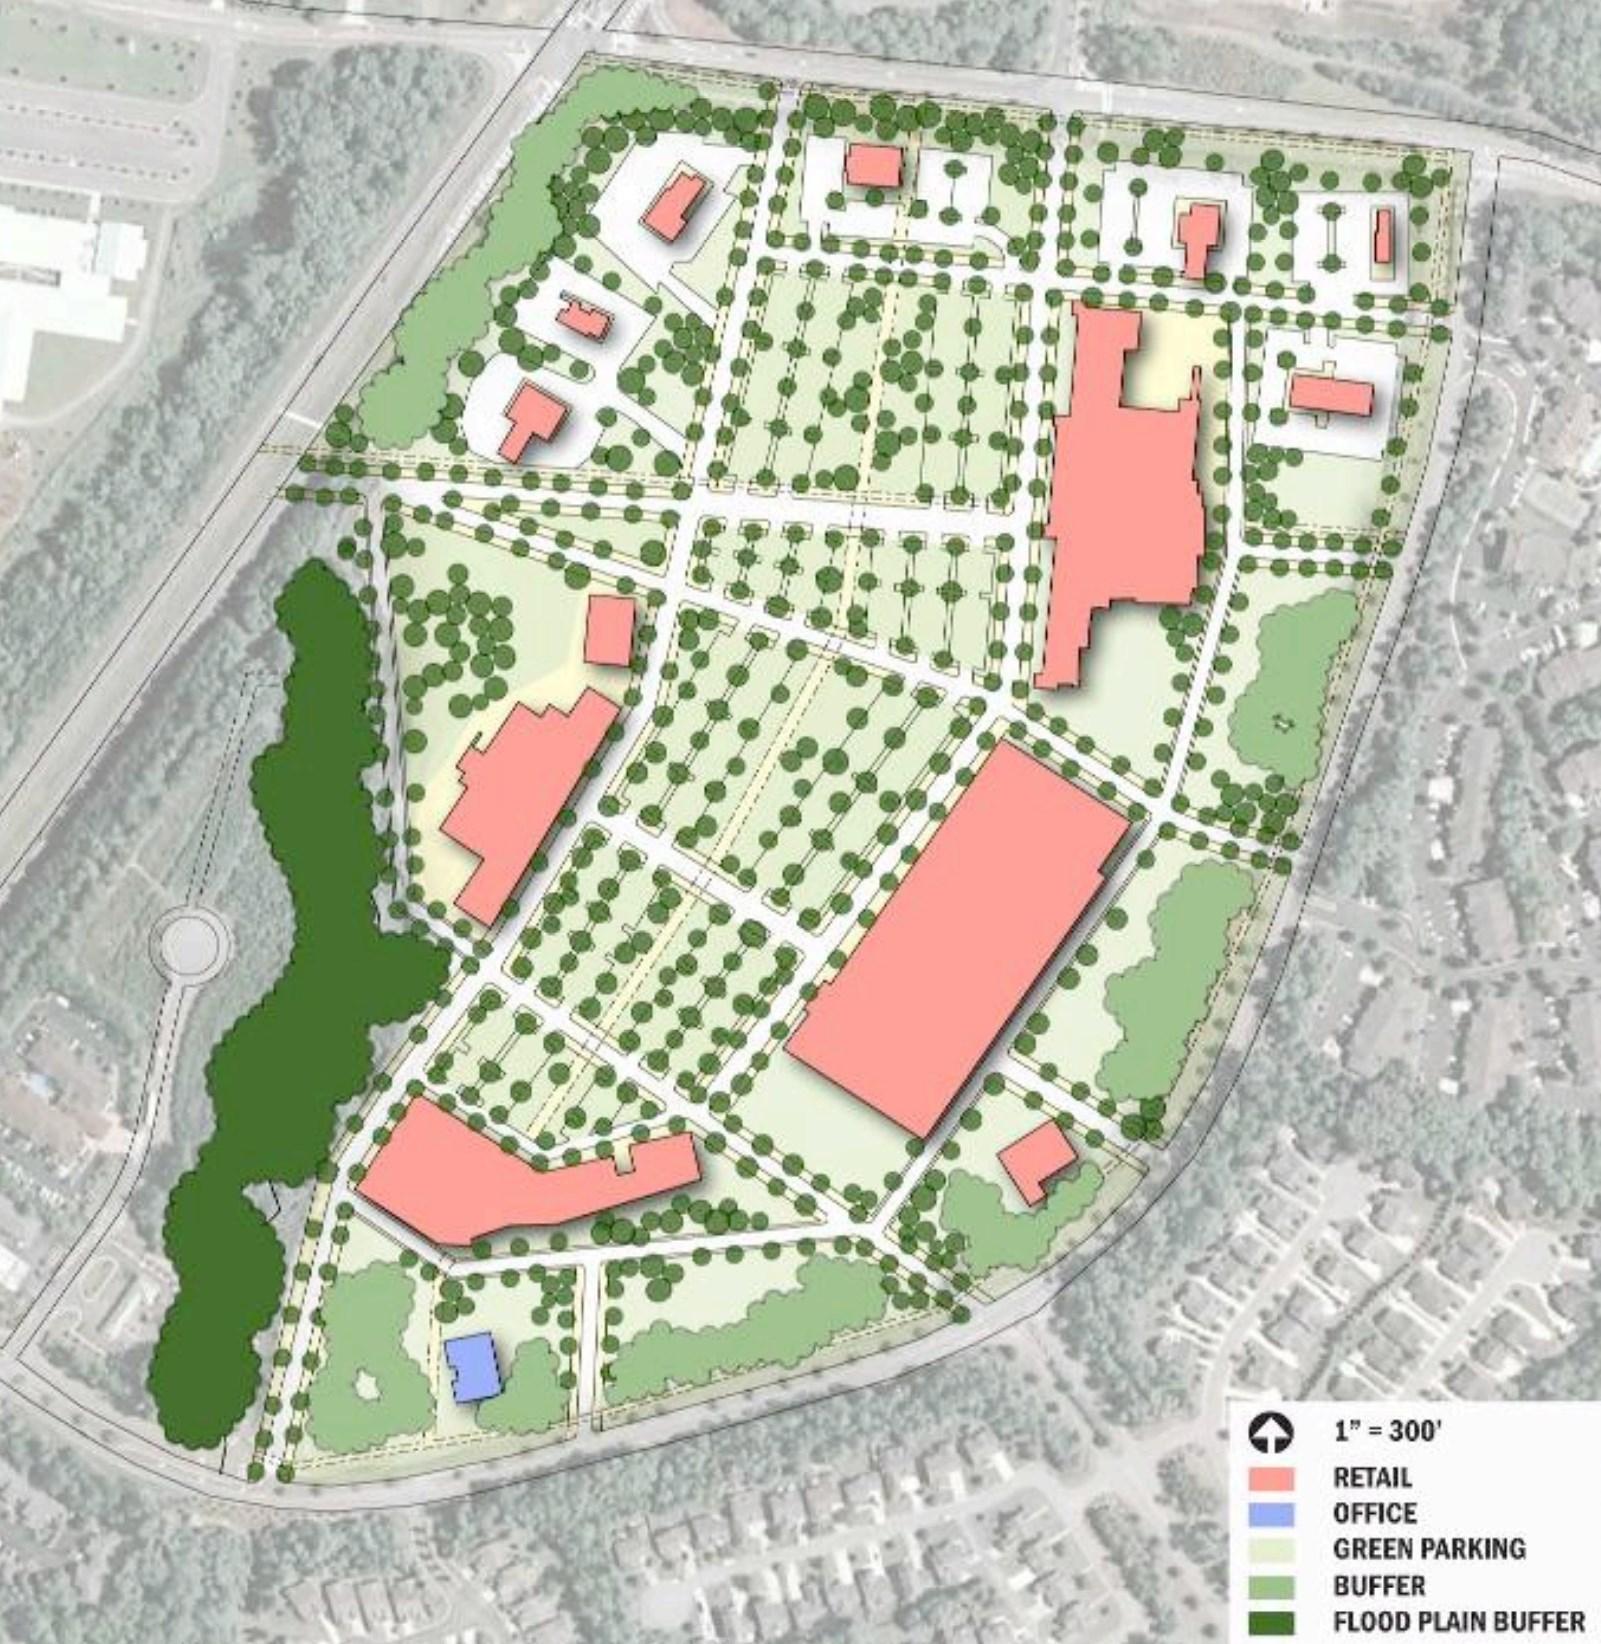
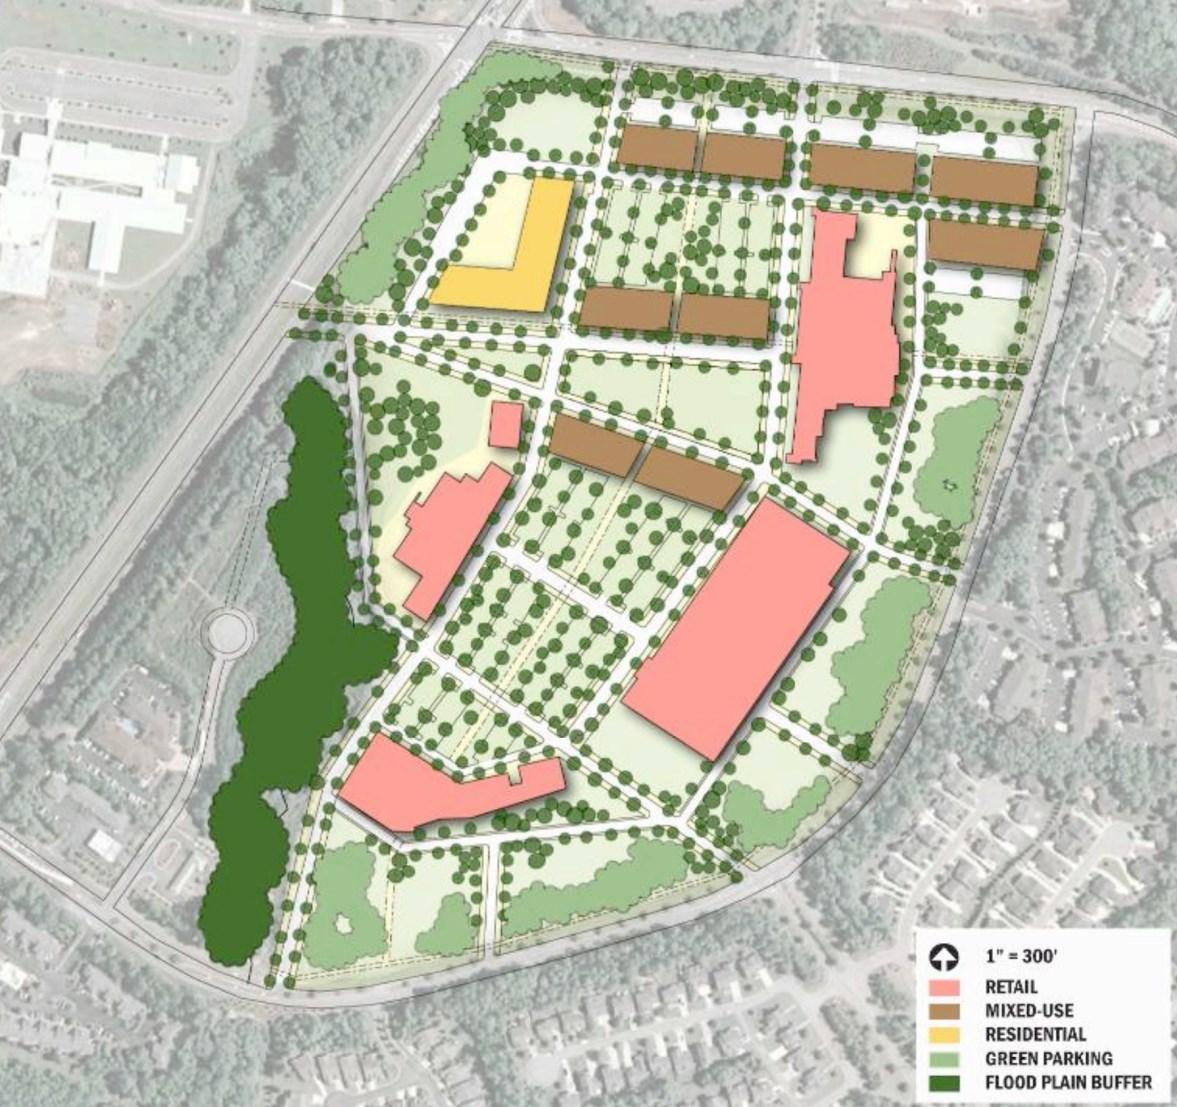
Activity Centers are areas within the city that are currently or anticipated to become locations of significant commercial and/or mixed-use development. This 2022 Update identifies four major Activity Centers : Innovative Mixed Use (Trilith), Medical Complex (Piedmont Fayette), Downtown Core, and the 85 North Corridor (Fayette Pavilion).
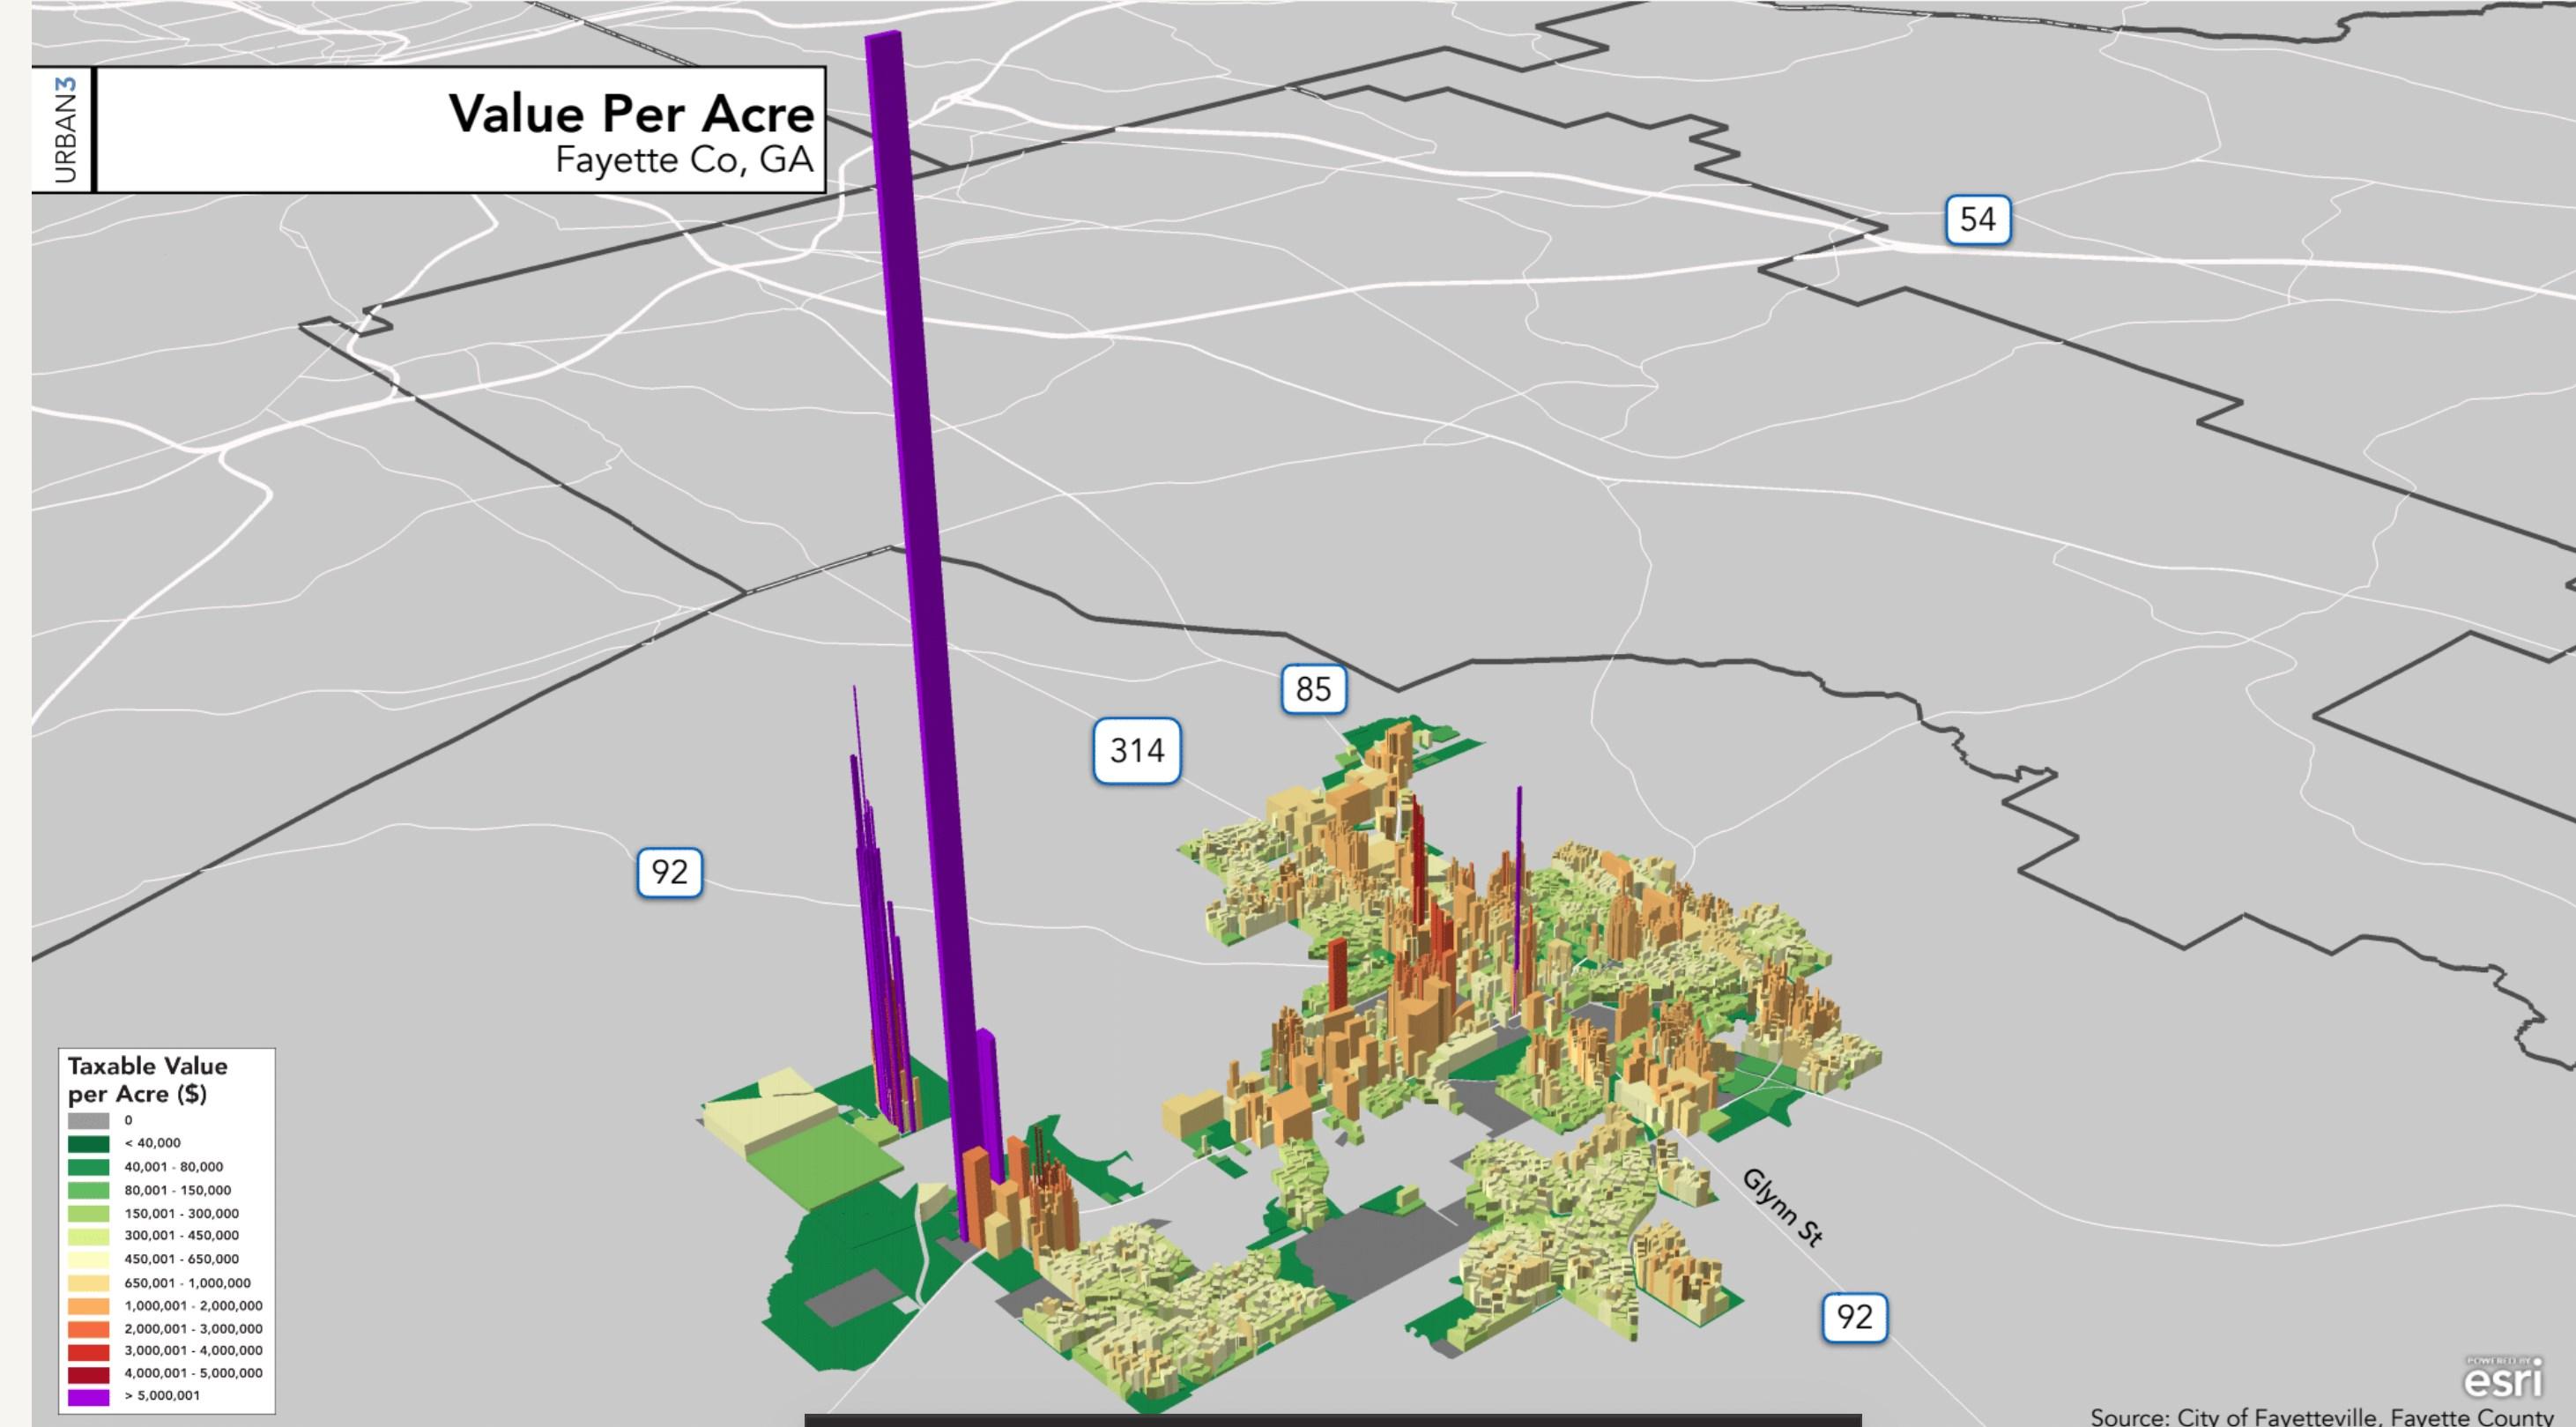
In 2020 the city commissioned Urban 3 to analyze property tax generation and value per acre trends within the city. The Value Per Acre Analysis (below) shows the two areas within the county that dominate the value per acre map - the taller purple spike represents Piedmont Fayette Hospital and the associated medical offices with the second purple spike represents Trilith Studios and the Town at Trilith.
The Urban 3 analysis suggested that fiscally-healthy cities should have a downtown core that is six times as productive as the surrounding county. Downtown Fayetteville is about twice as productive as the rest of Fayette County. Medical offices around Piedmont Fayette Hospital and the construction near Trilith Studios are currently making up much of the difference. These more productive developments put Fayetteville in a position that allows the city to focus on growing the downtown.
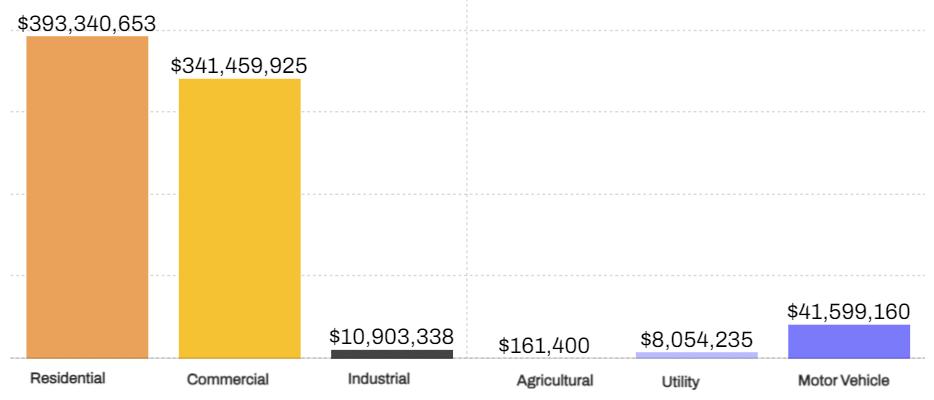
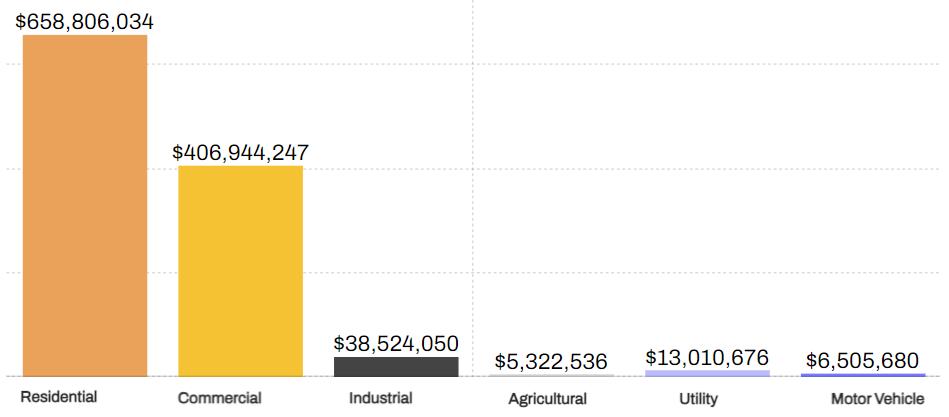
One of the primary funding sources for local governments is derived from property taxes and charges for services. Residential properties are the highest contributor in Fayetteville. A tax base that is balanced between commercial/industrial and residential uses will ensure reasonable property tax rates in the future.
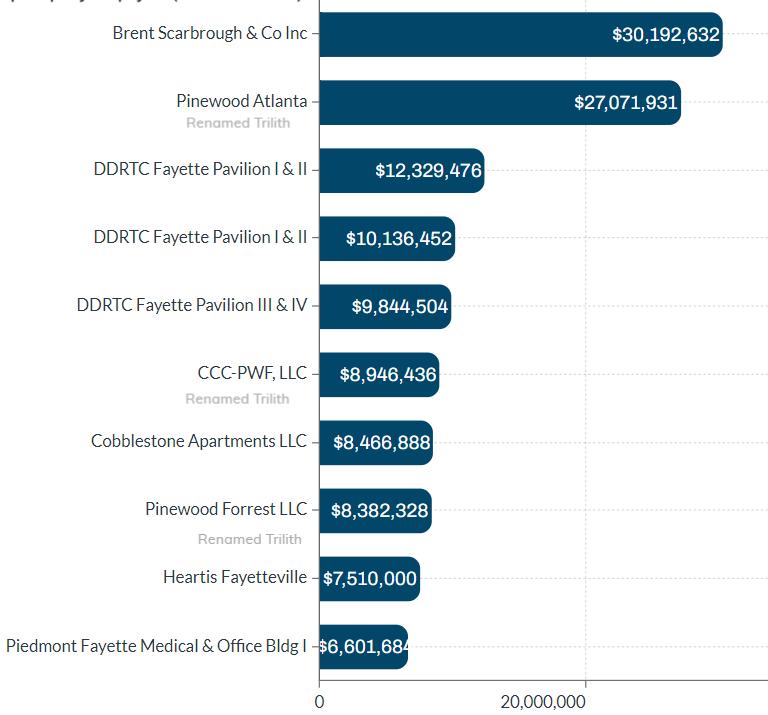
Top Tax Value (Assessed Value) By Land Use - 2021
Top Tax Value (Assessed Value) By Land Use - 2021
The chart below provides an overview of the assessed value for the top property taxpayers in 2021. As mentioned in the Urban 3 study and evident from the revenue generation data, leveraging the development and redevelopment of existing commercial nodes increases vibrancy, character, and a sense of community and provides a substantial economic impact.
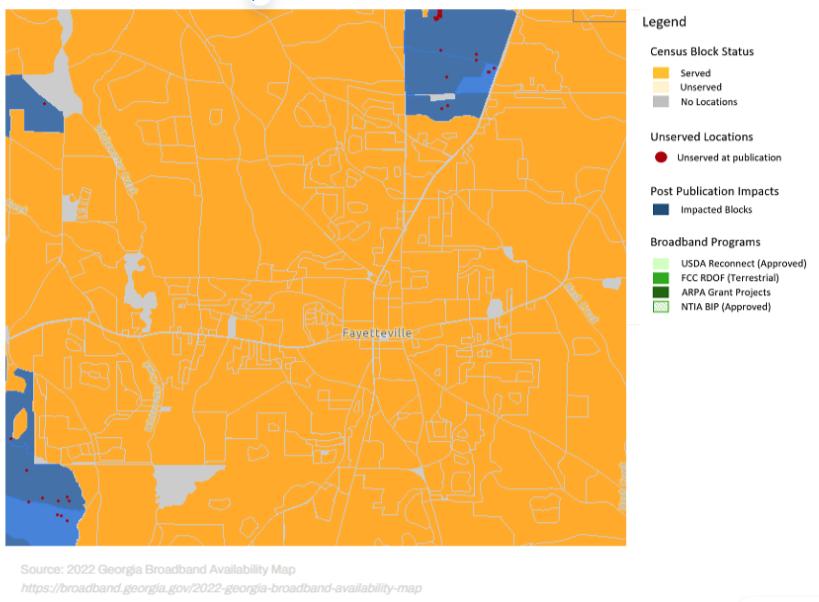
Broadband is typically defined as a specific type of internet connection faster than non‐broadband internet, it uses wide bandwidth, and the service provides multiple signals at once. Bandwidth refers to the maximum rate at which an internet connection can transmit data. The Georgia Broadband Program defines an area as being served by broadband if at least 80% of locations within a census block have access to a fixed, terrestrial broadband provider with at least 25 megabits per second (Mbps) download speeds and 3 Mbps upload speeds.
Critical Infrastructure like utilities, transportation facilities, and technology are essential to everyday business function and community growth. In 2018 the Georgia General Assembly amended the provisions of local planning in Georgia by passing the "Achieving Connectivity Everywhere (ACE) Act," intended to facilitate the enhancement and extension of high-speed internet access in communities that lack such infrastructure and the vast resources it provides. As the first step in planning for this critical, potentially catalytic infrastructure, the "Ace" Act requires all local governments to incorporate the "promotion of the deployment of broadband internet services" into their local plan.
The map below shows that the city is well served with broadband service. Both the Federal Communications Commission and the Georgia Department of Community Affairs data indicate that citywide broadband service and high-speed internet coverage are available with several service providers. Also the latest American Community Survey (ACS) stated that 95 percent of households had a computer and 89 percent are served with broadband internet.

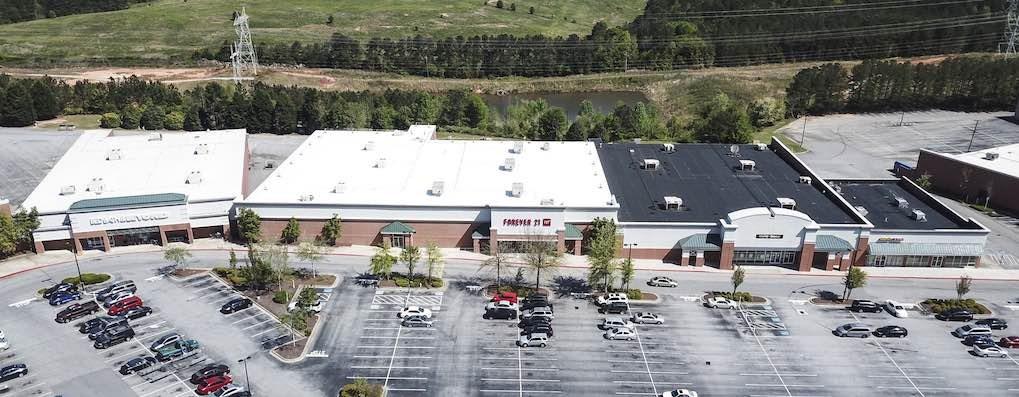
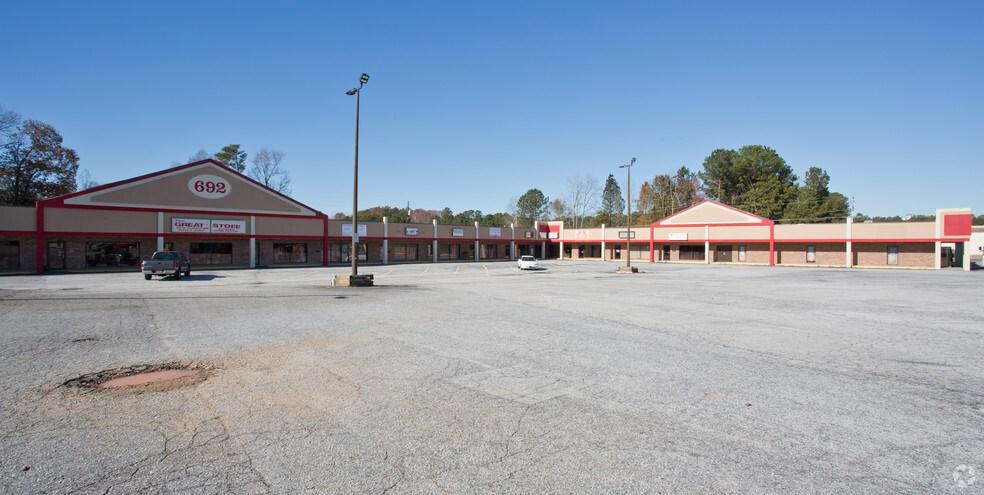
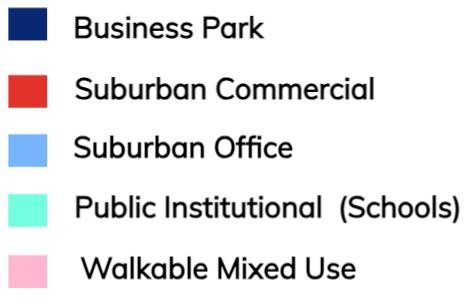
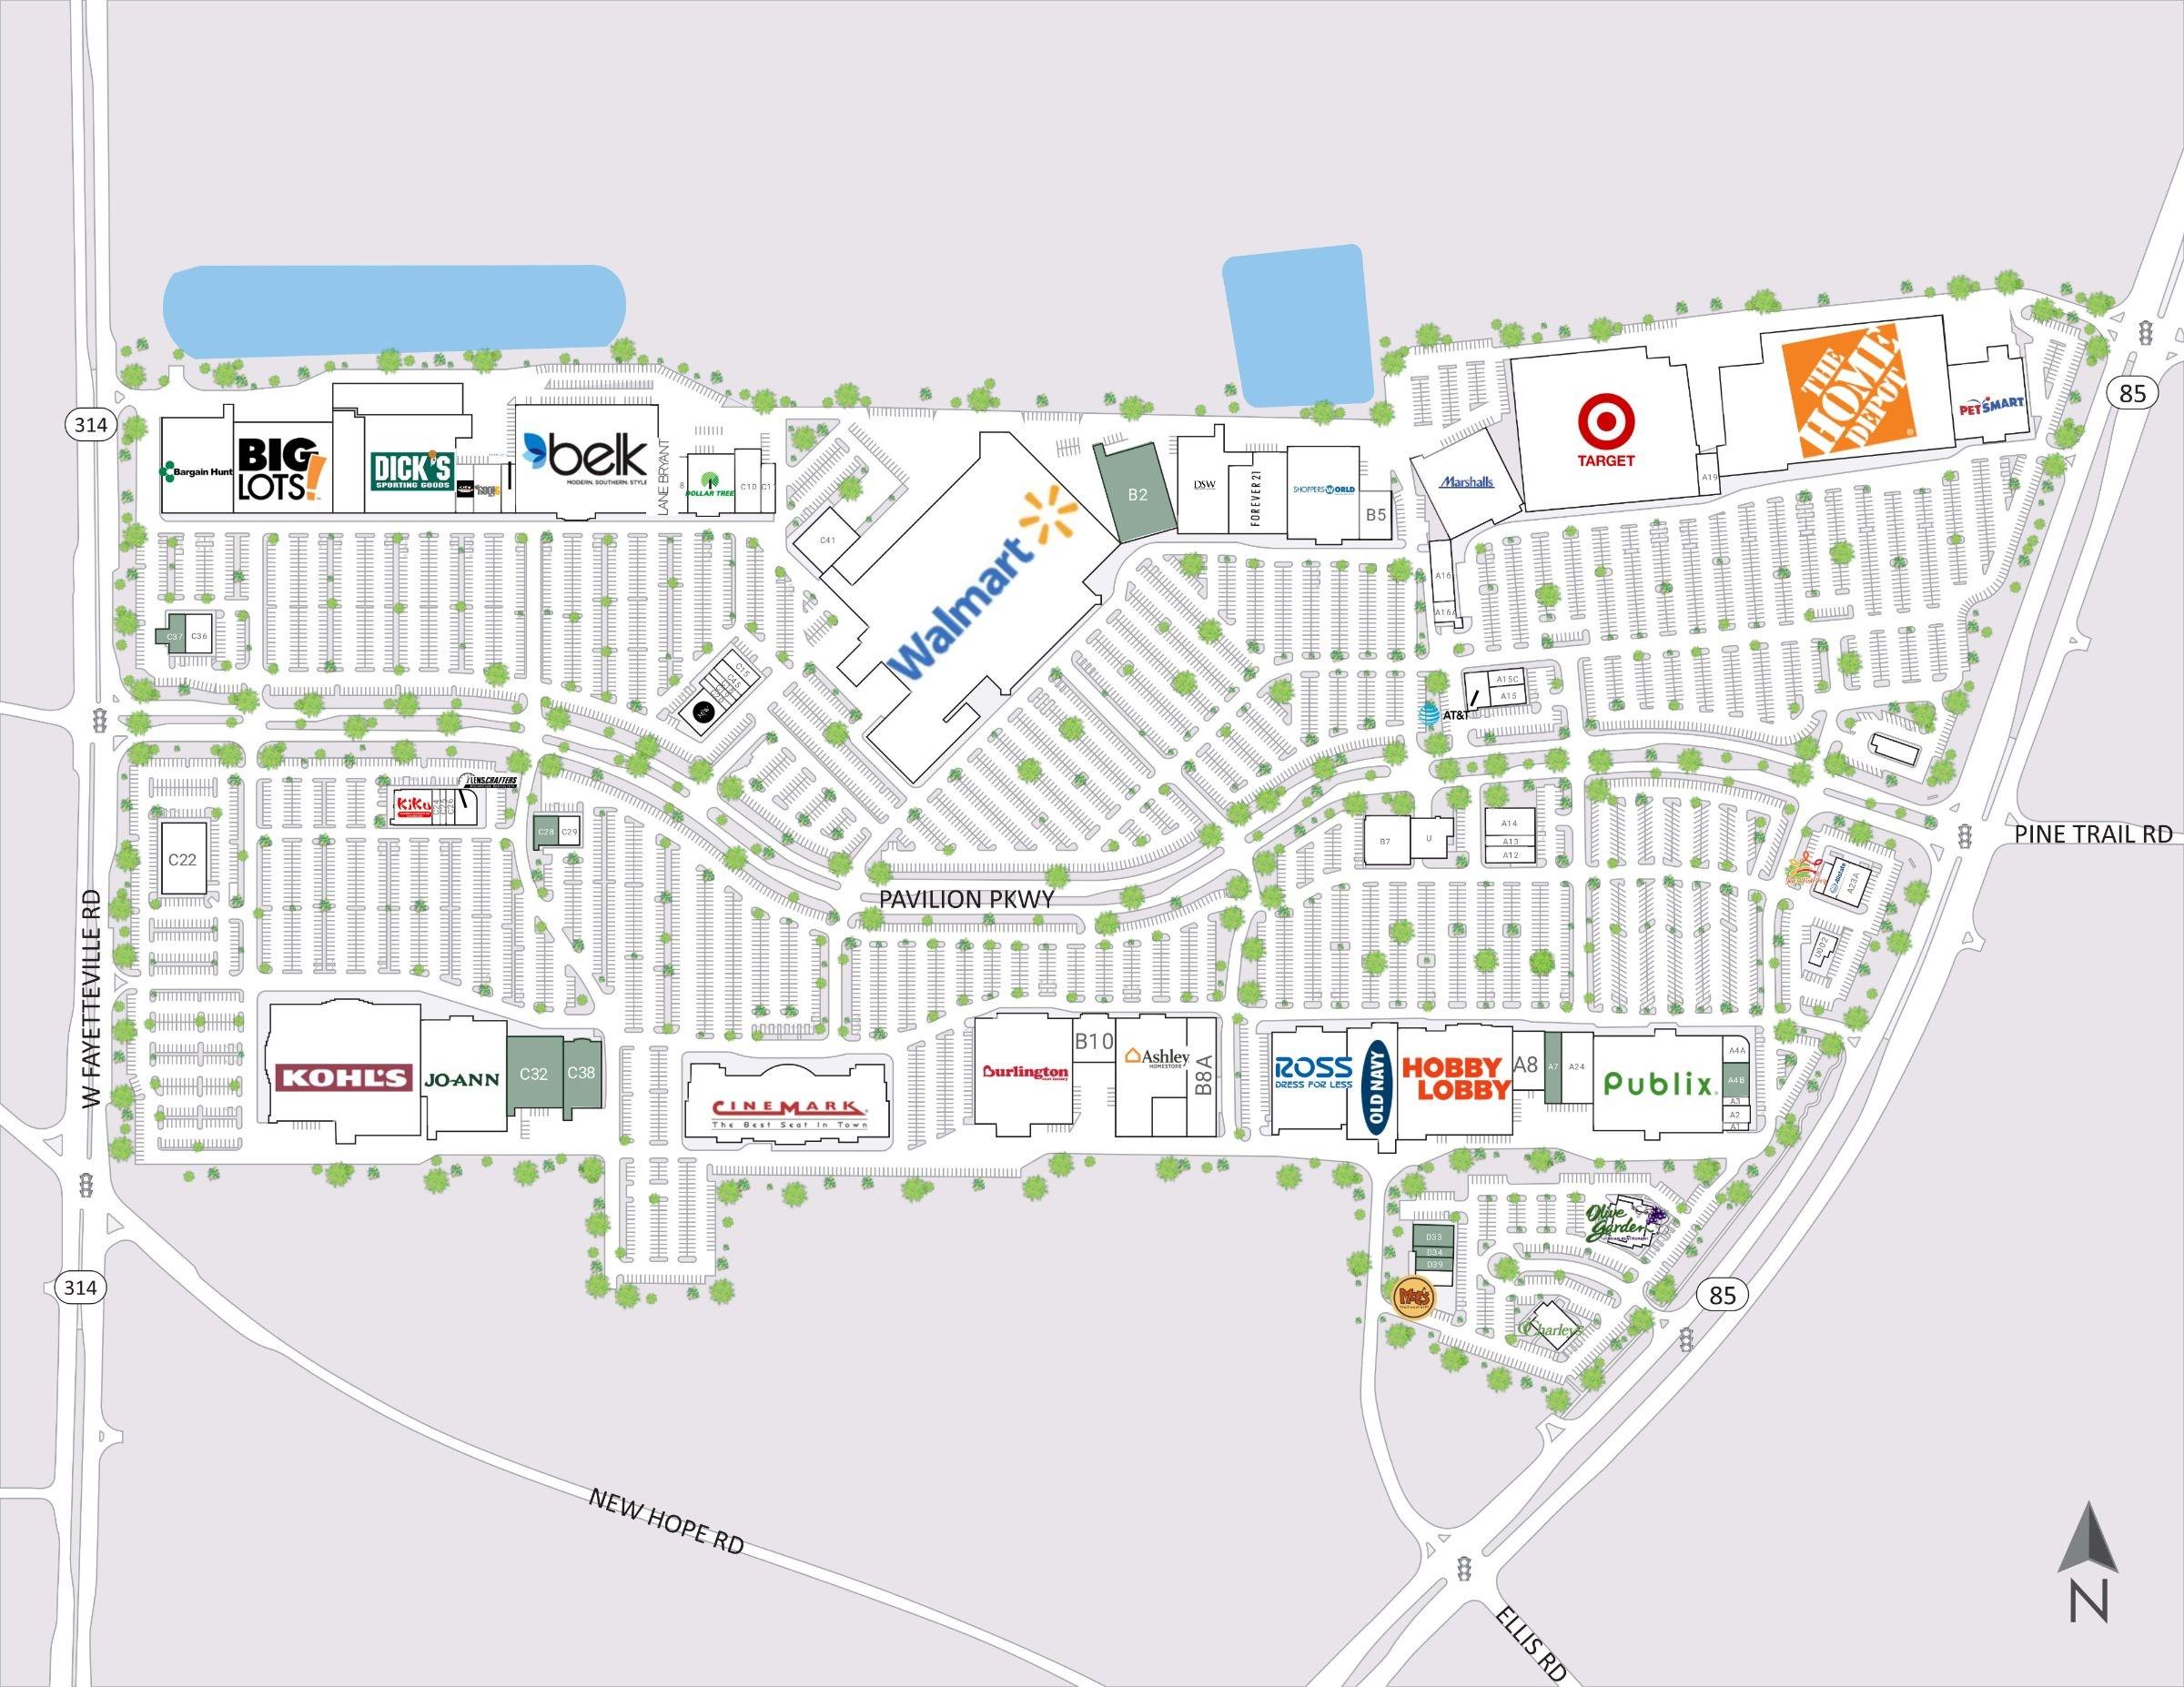
The City of Fayetteville encompasses 12.8 square miles. The majority of land is developed with single family detached residential subdivisions. Approximately 14% of the overall land mass is consumed with commercial development, primarily concentrated along Highway 85 and culminating with the Fayette Pavilion shopping center. Fayette Pavilion has in excess of 1.5 million square feet of big box retail and at one time was the largest assemblage of commercial space within the state. Fortunately the retail complex continues to draw patrons from outside the Fayetteville/Fayette County zip codes, increasing sales tax revenue for both the city and county.
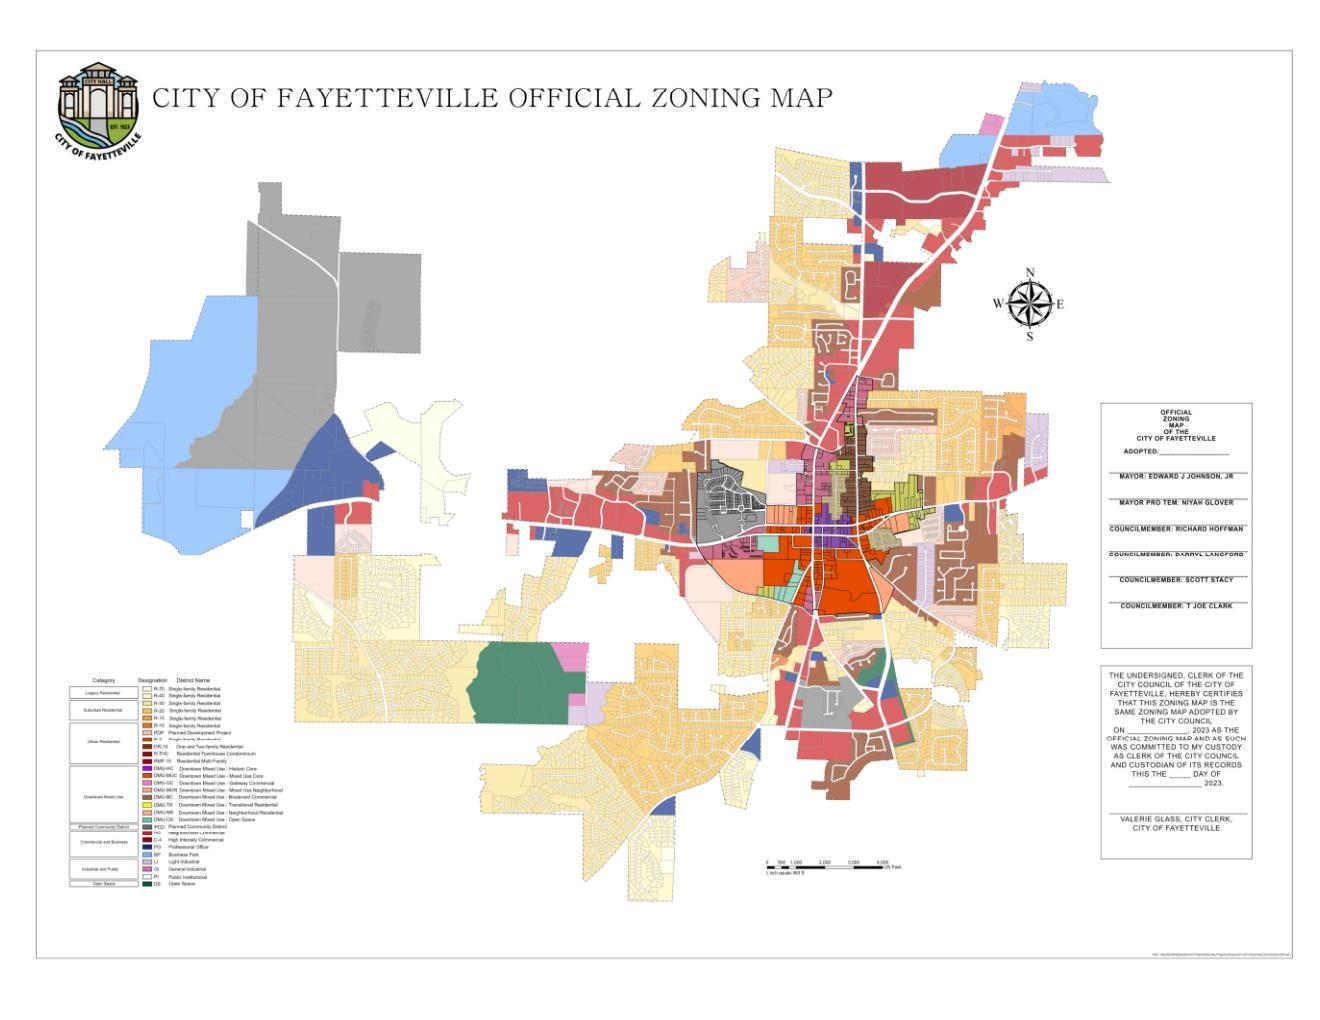
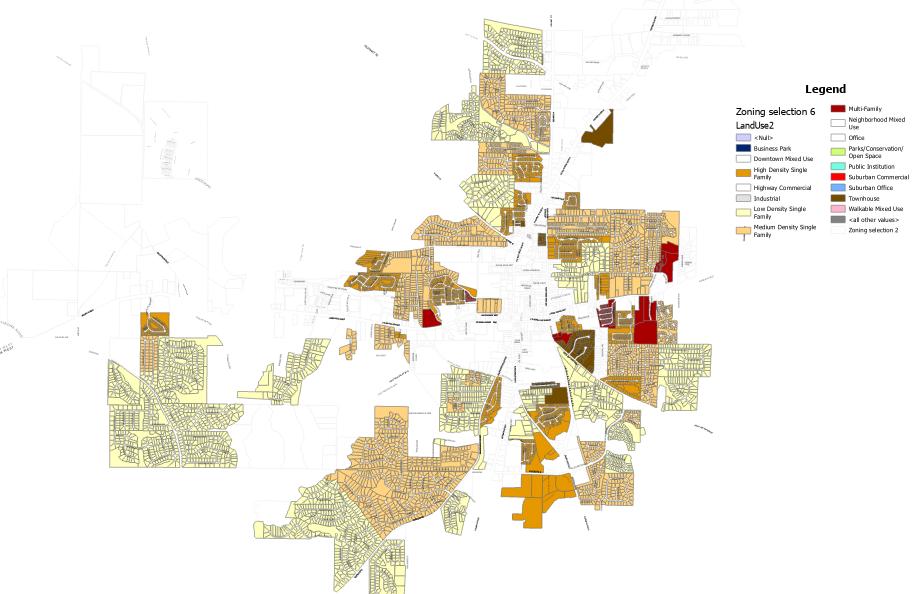
The Existing Land Use Map provides a citywide perspective of current growth and land-use patterns. The analysis was completed by conducting a thorough review of GIS data provided by
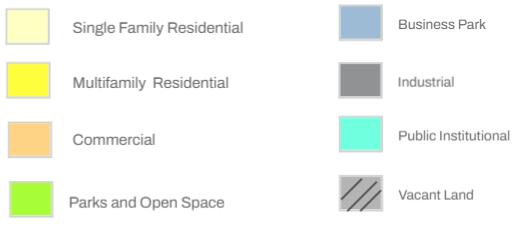
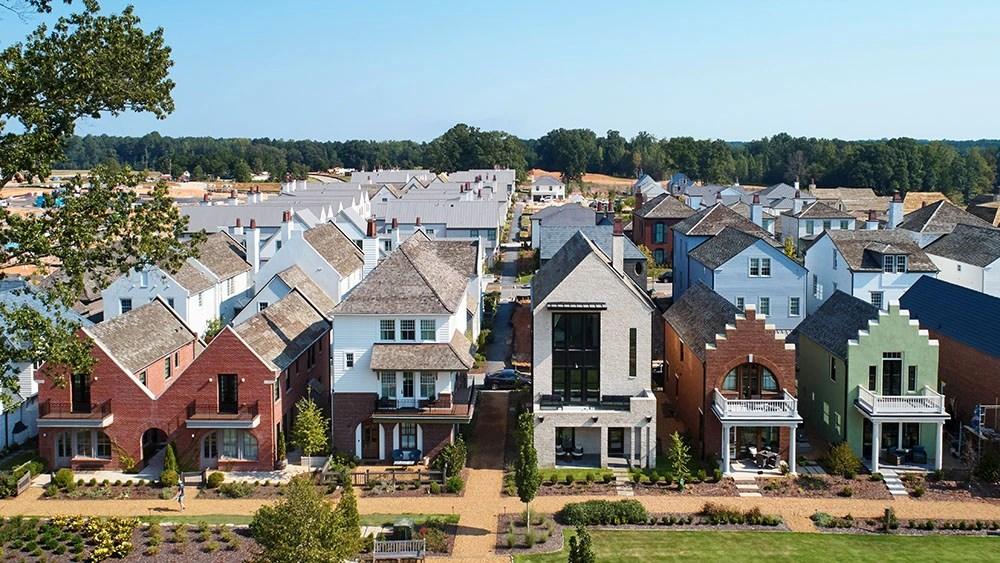
Over 50% of all parcels within the city are zoned for residential use, with the most significant development being the Town at Trilith. Single-family detached residential developments occupy the majority of the city's land mass, Permit records show the majority of multi-family residential development occurred in the 1990's and early 2000's prior to the 2007 recession. Since then the bulk of residential development within the city has centered around the single-family detached product.
In recent years the city has experienced an increase in requests for multi-family developments of all sizes and scopes. In several public work sessions the discussion has centered on the need to redevelop certain areas with mixed-use development which has led to the approval of two multiuse residential projects within the downtown core.
As available land becomes scarce, new residential development has been more dependent on infill, rezoning request and redevelopment opportunities. Developers have requested greater densities to offset the higher land values and development costs.
Commercially zoned land is primarily located along major corridors and state routes, and there are limited areas zoned for industrial development.
Commercial uses in the City have historically benefited from the lack of retail in smaller cities in the area and the regional transportation routes. While many neighborhoods in the City were established in the 1990s, commercial growth followed the traditional development patterns with commerce at the center of town, then expanding along the corridors as the population increased. There has been less commercial growth in recent years as the real estate market has changed.
The City has experienced limited redevelopment of older commercial properties, and residents have been outspoken during public meetings about the necessity for projects to revitalize the aging shopping centers. Recent changes in retail and office markets have added uncertainty to the continued possible development options for some commercial properties in the City.
There are considerable commercial properties throughout the City with the potential for
Other cities and counties in the Atlanta Metro area have encouraged this autocentric type of development and are now experiencing budget short falls.
Fayetteville’s decisions on future development will determine the direction of the City’s fiscal health for decades.
How well Fayetteville handles further growth will be the deciding factor in what type of city it becomes. Encouraging traditional neighborhood design, infill development, and a more connected road network could lead to an economically-sustainable city. On the other hand, if left unchecked, development will likely move towards auto-centric shopping centers and suburbs that are ultimately unable to pay for the infrastructure they require. As the city nears build out, much of the remaining opportunities to shape future growth will be through infill of under-developed properties or through redevelopment of obsolete or declining areas.
This page intentionally left blank.
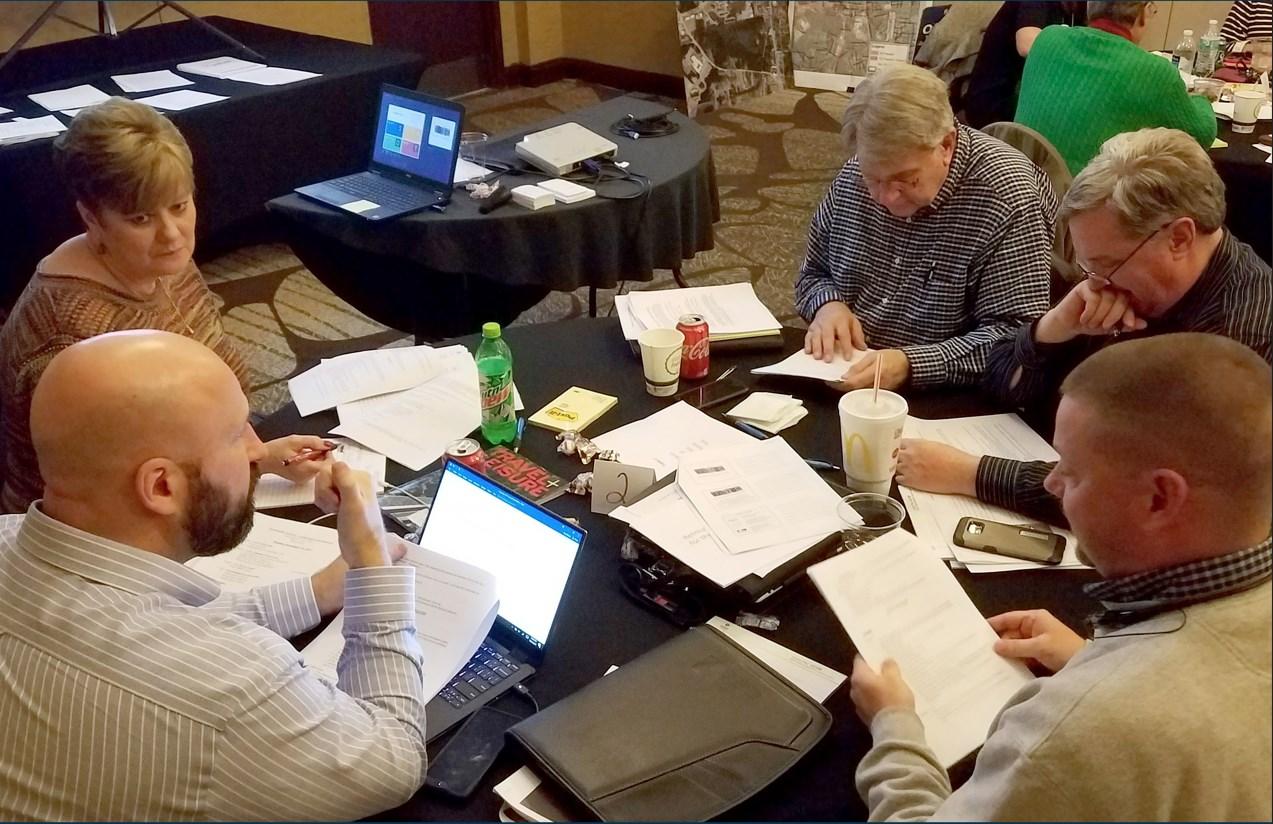
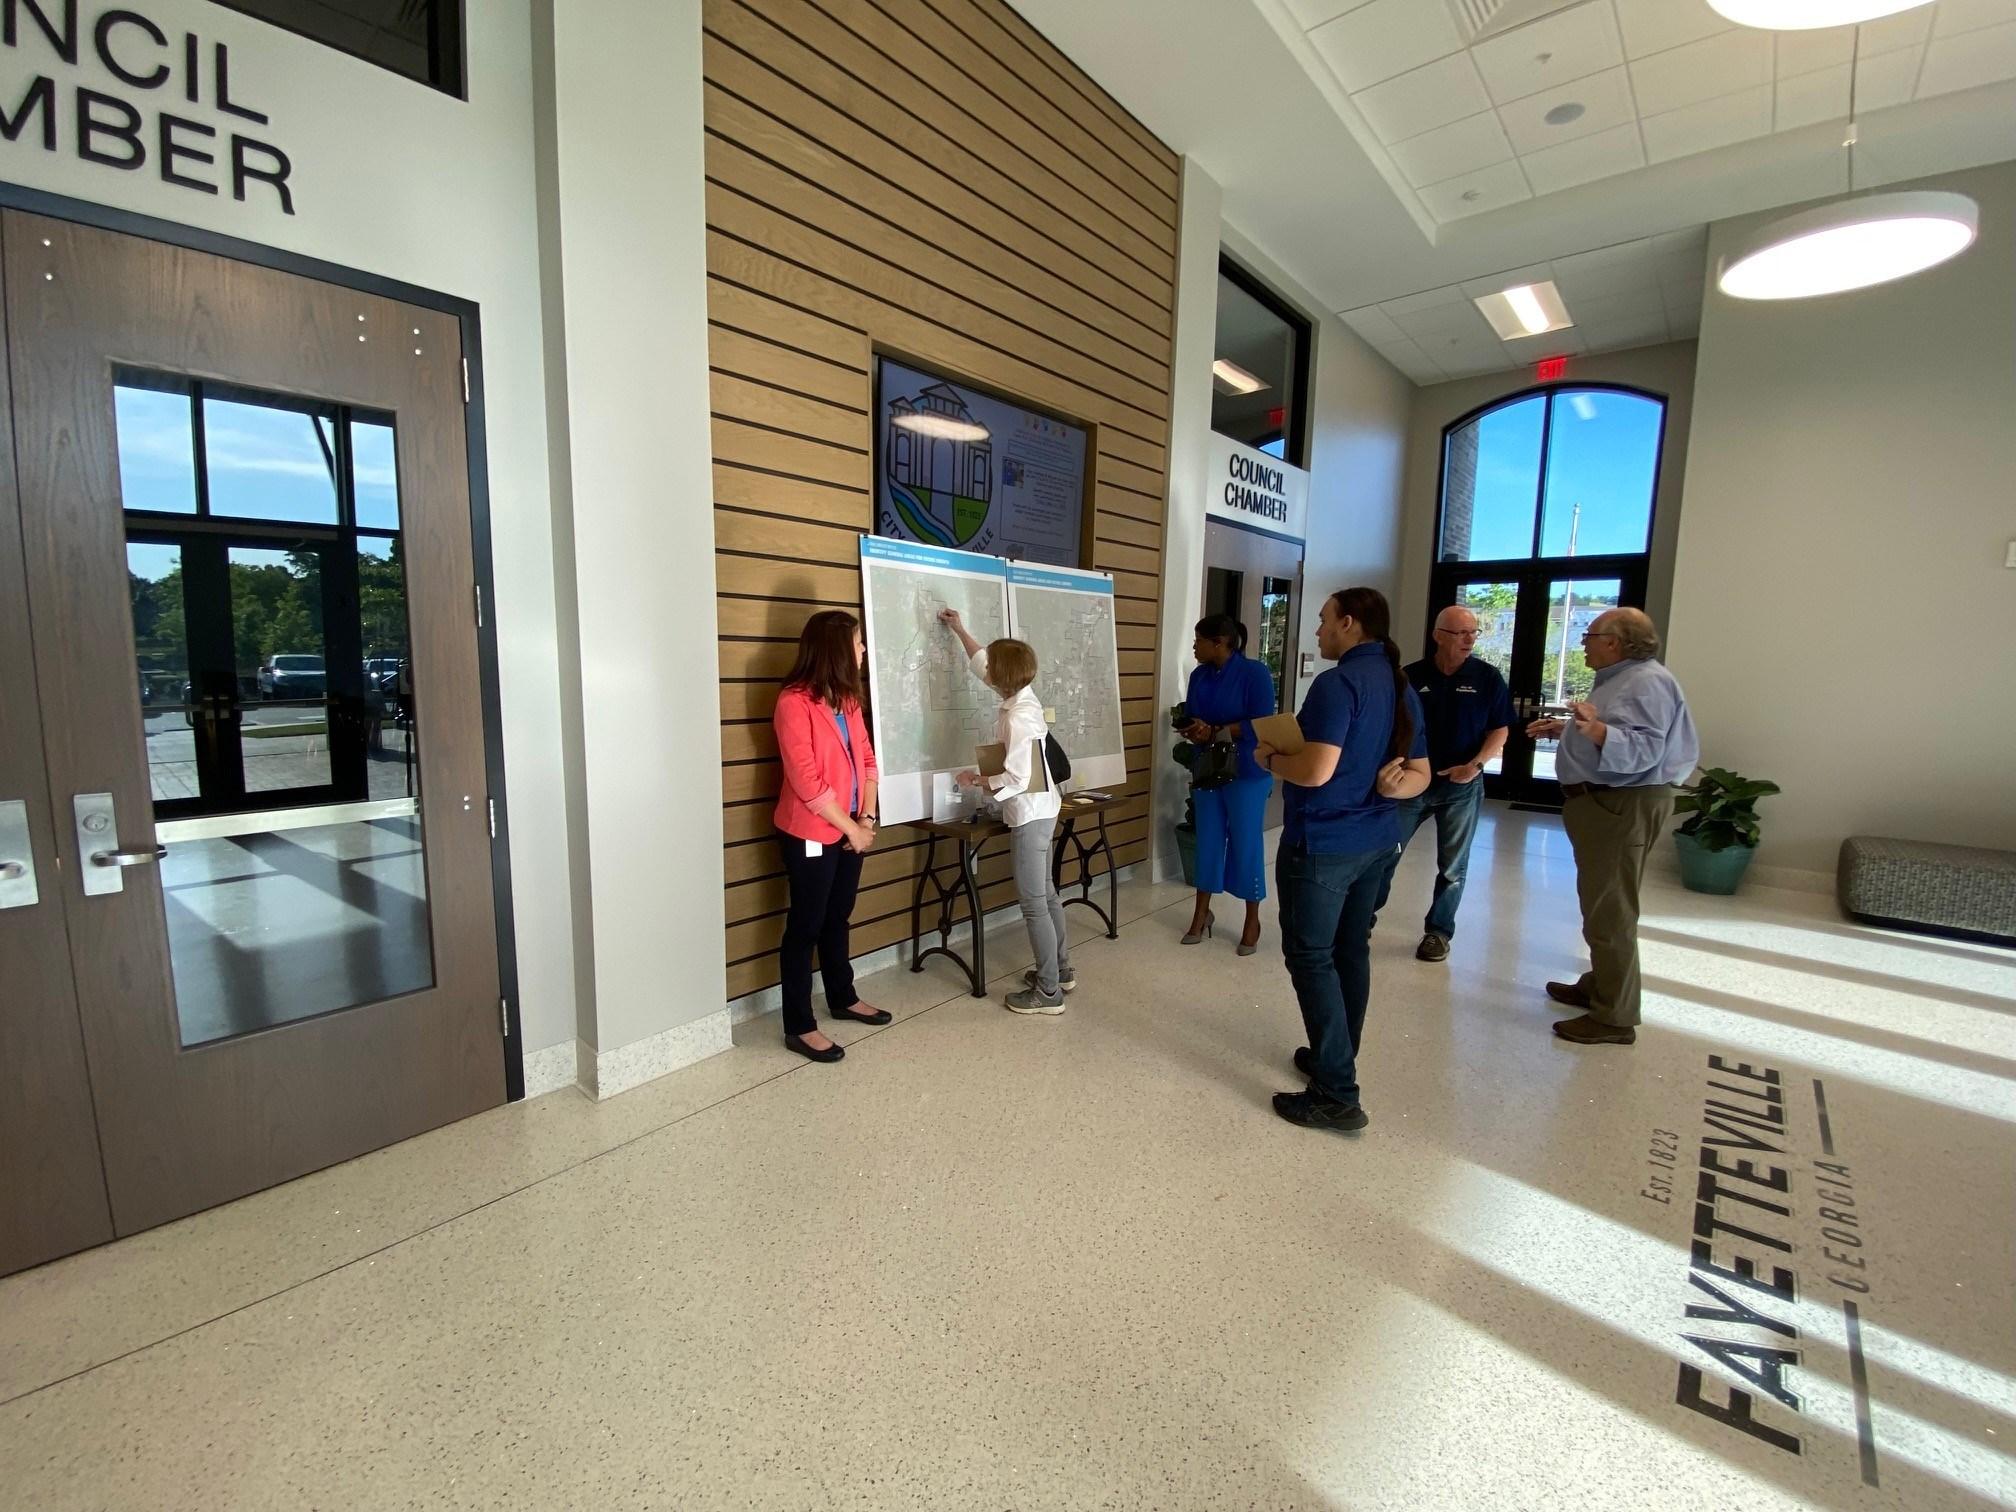
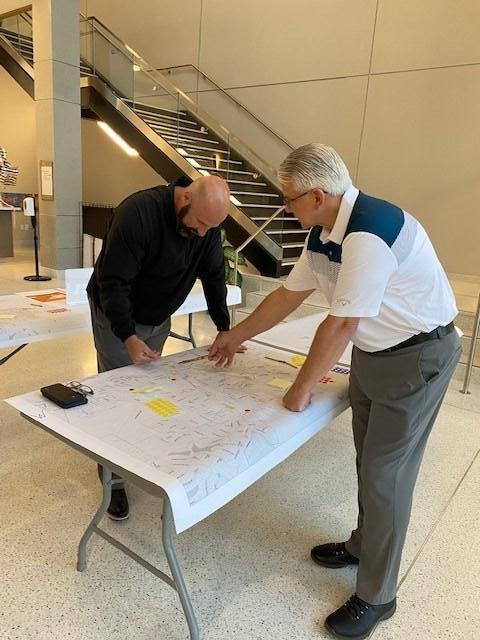
The Comprehensive Plan Advisory Committee (CPC) was comprised of community stakeholders including neighborhood and Homeowner Association representatives, non-profit and civic leaders, business owners and other community members as well as representation from the City Council, Planning and Zoning Commission and Downtown Development Authority. The purpose of the CPC was to engage the community and to work with City Staff as the 2022 Update was being prepared. The first action of the CPC was the analysis and review of current conditions, demographic changes and the community vision.
The 2022 Update was developed with a cohesive vision, along with achievable goals, objectives and implementation strategies based on feedback provided through the public input process and then confirmed by the CPC. The 2022 Update also includes amendments to the Future Land Use Map, special interest area plans and additional plan recommendations which were developed with input from city staff, the CPC and the public. The Draft Comprehensive Plan - 2022 Update was presented the CPC and the Planning and Zoning Commission prior to forwarding to City Council with a request to authorize Staff to transmit the plan to ARC for review. The 2022 Update was officially adopted on September 15, 2022.
The planning process is summarized below:
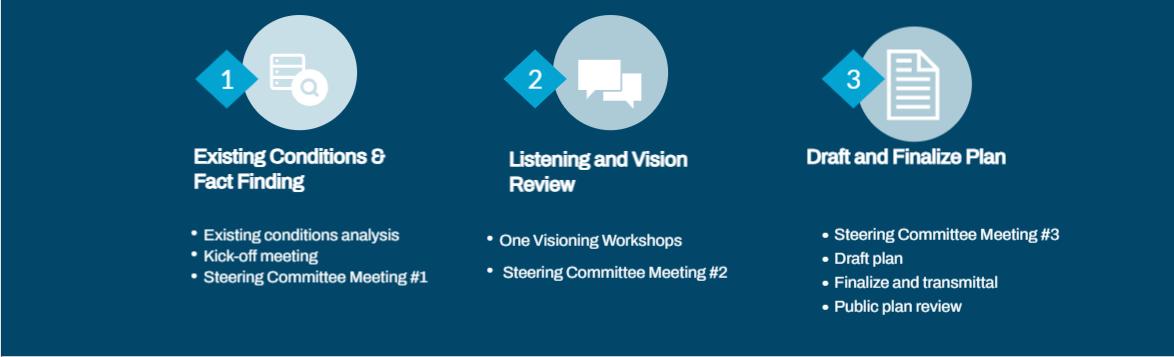
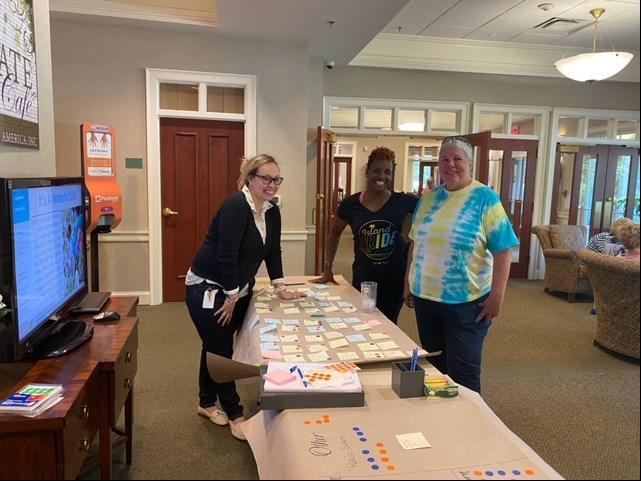
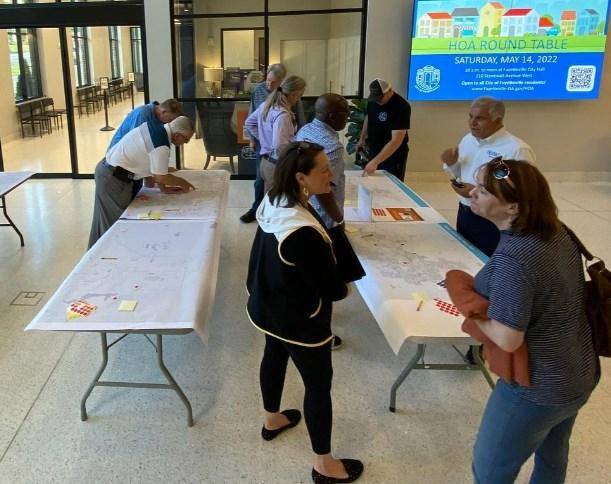
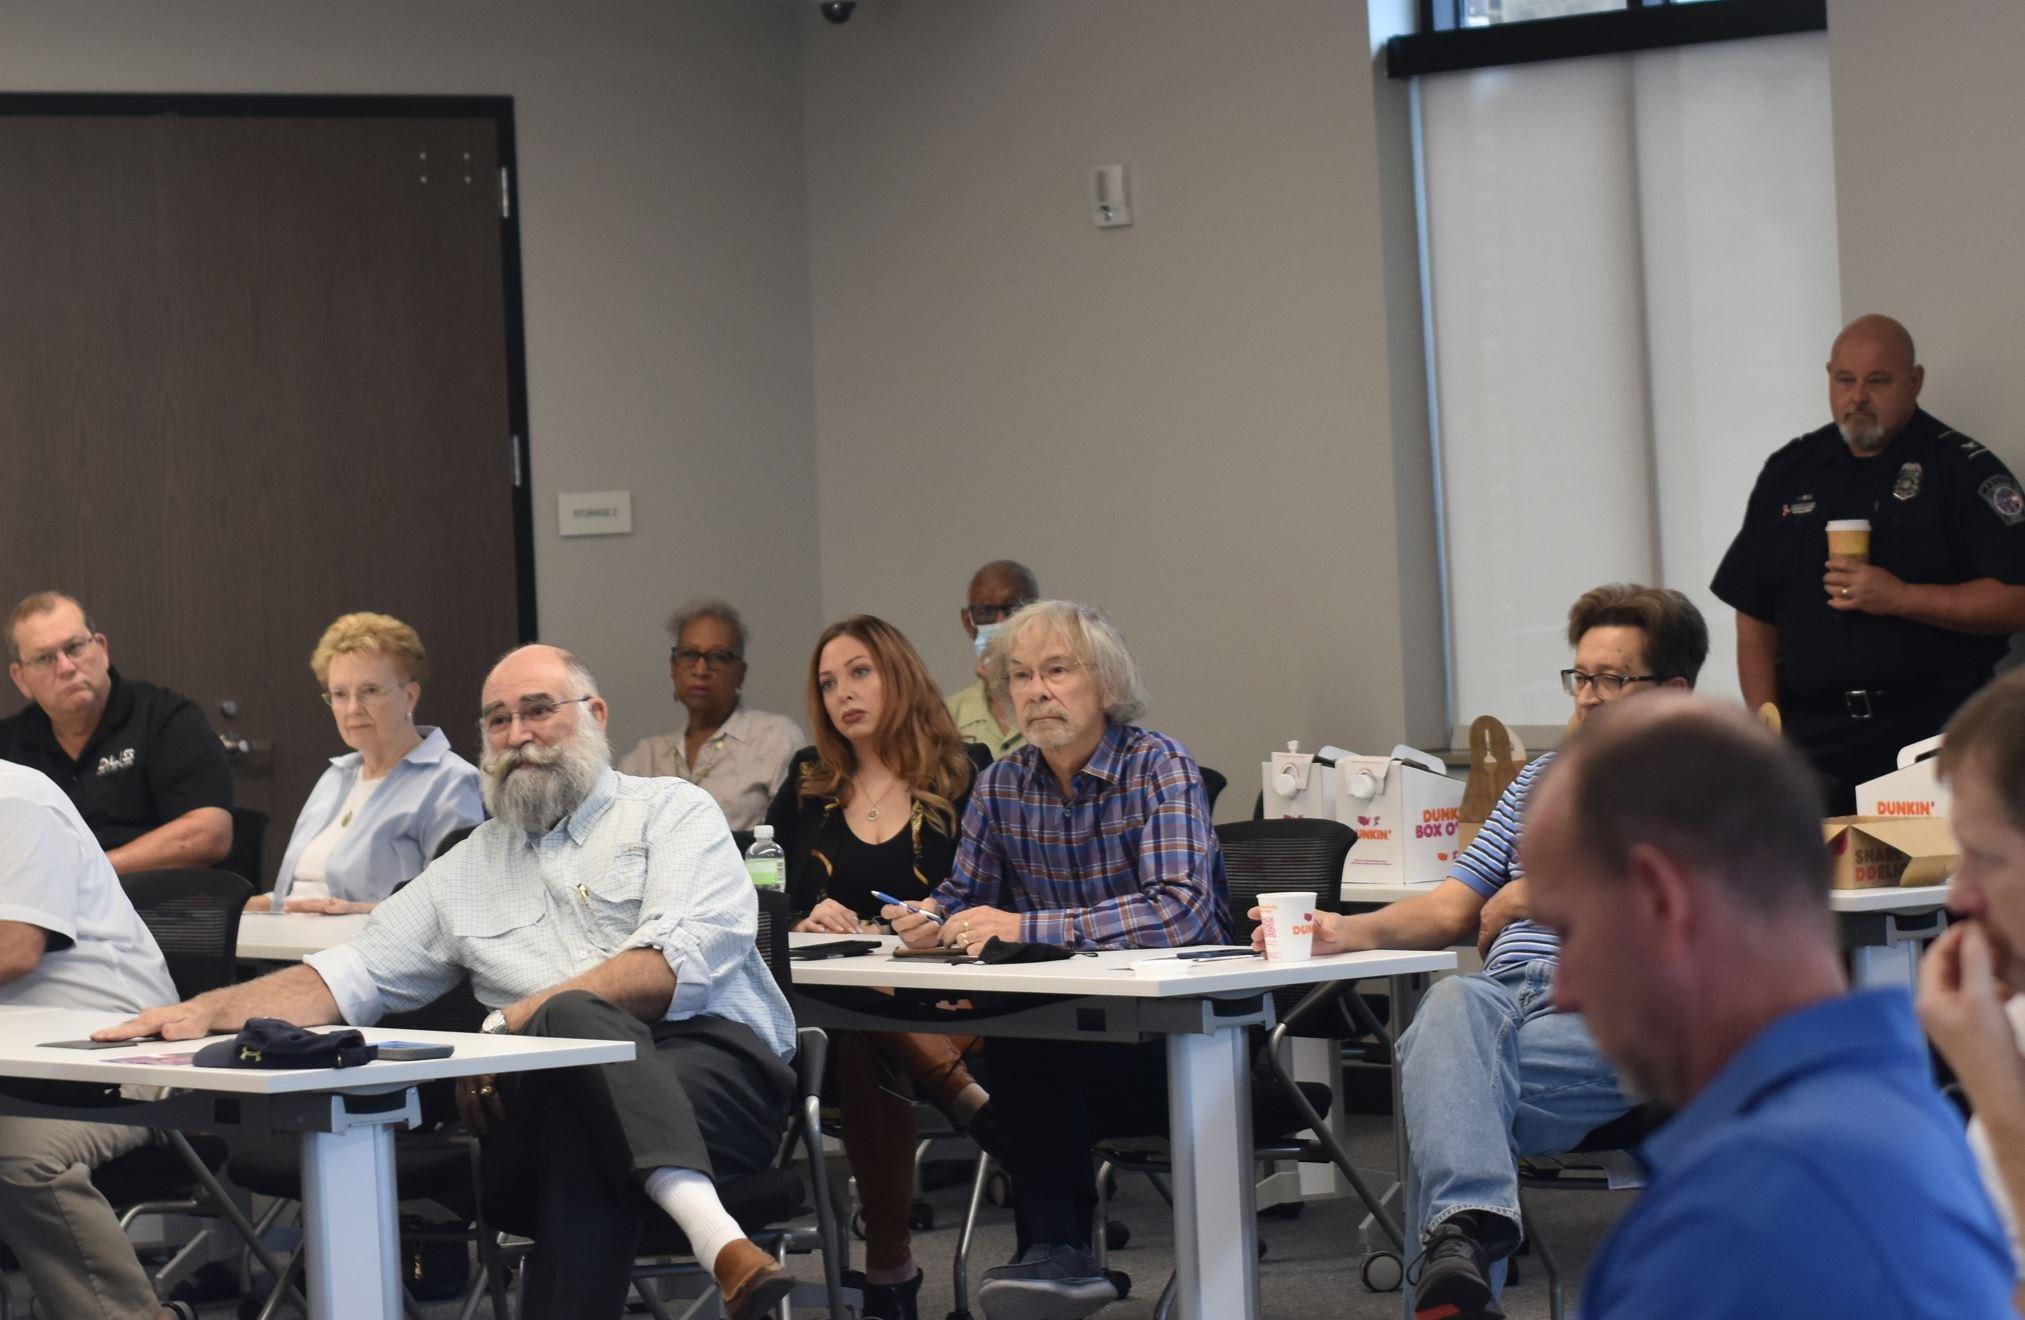
Community members provided input throughout the planning process, both in person and online. The engagement activities focused on identifying priority needs and opportunities and building consensus around a community vision and goals for the future.
The CPC was comprised of community stakeholders including neighborhood and Homeowner Association representatives, non-profit and civic leaders, business owners and other community members as well as representation from the City Council, Planning and Zoning Commission and Downtown Development Authority. The purpose of the CPC was to engage the community and to work with City Staff as the 2022 Update was being prepared.
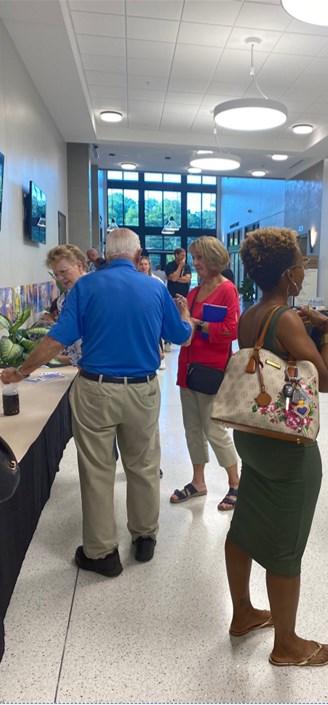
City Staff initiated the 2022 Update of the Comprehensive Plan by holding a public hearing in the Council Chambers on Tuesday, March 3, 2022 at 6:00 p.m. The public was invited to attend and participate in this public hearing. The purpose of the public hearing was to brief the community on the process and opportunities for public participation.
The first community workshop was held on April 18, 2022 at 6:00 p.m. in city hall. The workshop was designed to give attendees an opportunity to share input on the assessment completed by Noel Consulting related to housing and commercial development.
The second community workshop was held on May 10th at 6:00 p.m. in city hall. The workshop was
The last public workshop was held at a local community center to get direct input from senior citizens on the future. Attendees were asked to add to the list of "small victories" and big ideas for the future. Participants were also encouraged to rate community assets and map future growth areas. They also provided general feedback on any areas of concern.
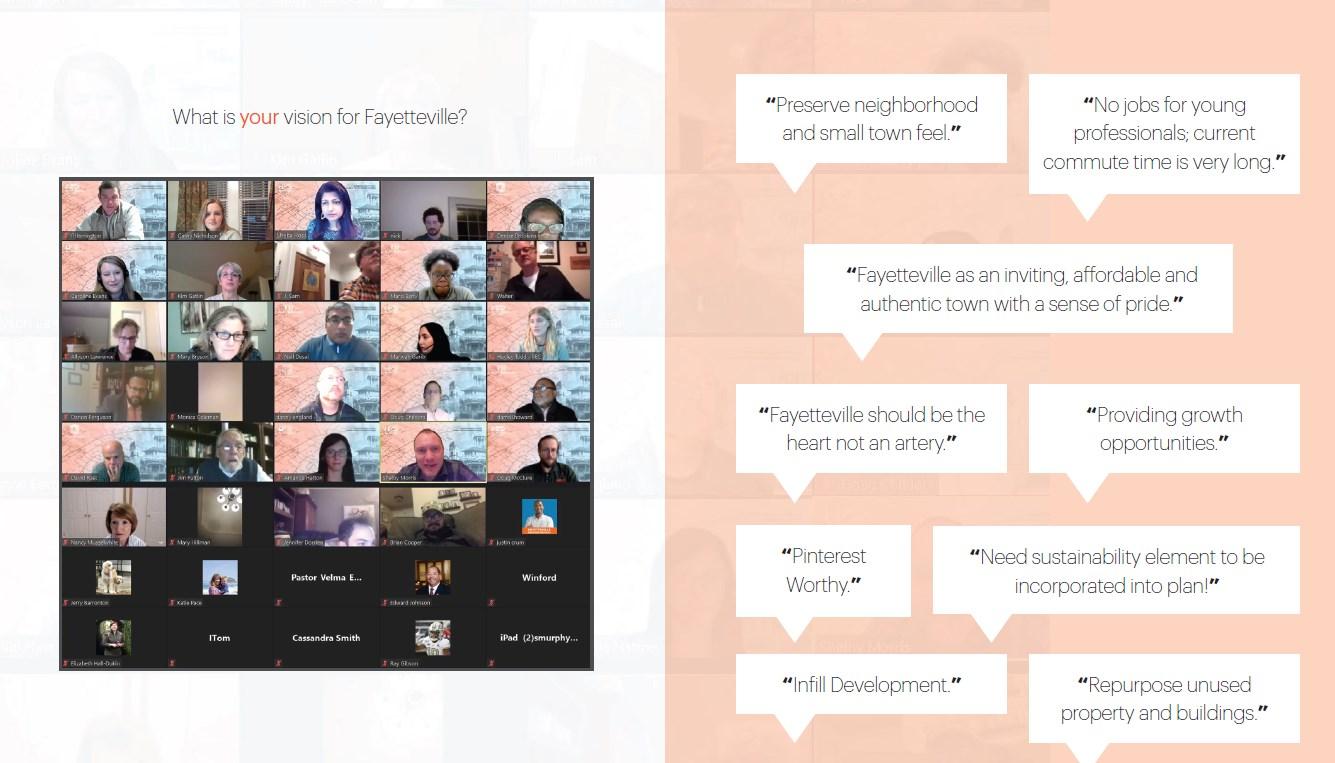
In 2021 as a part of the Livable Centers Initiative (CLI) Study, the city conducted a virtual community charrette on February 11-12 to develop a collective vision for the downtown core. A portion of the charrette was devoted to discussing the history of development patterns within the city and reviewing the recommendations from previous planning studies. Participants were then encouraged to re-imagine a future for the city and to share input on areas to preserve and/or change as well as perspectives on future land use, development patterns, accessibility and mobility, and parks and open space. Each of these sessions was conducted virtually and engaged 60-80 participants.
Following up on the work of the Fayetteville Forward LCI Study, a cross- disciplinary team conducted a design vision workshop with city officials in late April. The goal was to create inspiring visions for key streets and critical city parcels of downtown Fayetteville and to outline a strategy for

Opportunity to live and work in the city
Utilize empty buildings for new business
Use Trilith as a model
Redevelopment of the Fayette Pavilion
Refurbish empty or partially occupied strip centers
Younger population
Over-building apartment complexes will cause increase in traffic congestion
More businesses coming to town
Fiscally sustainable and profitable development
Pedestrian facilities that are safe, interconnected and separated from traffic
Do not build additional apartments until the ones under construction are fully occupied
Affordable senior housing income based
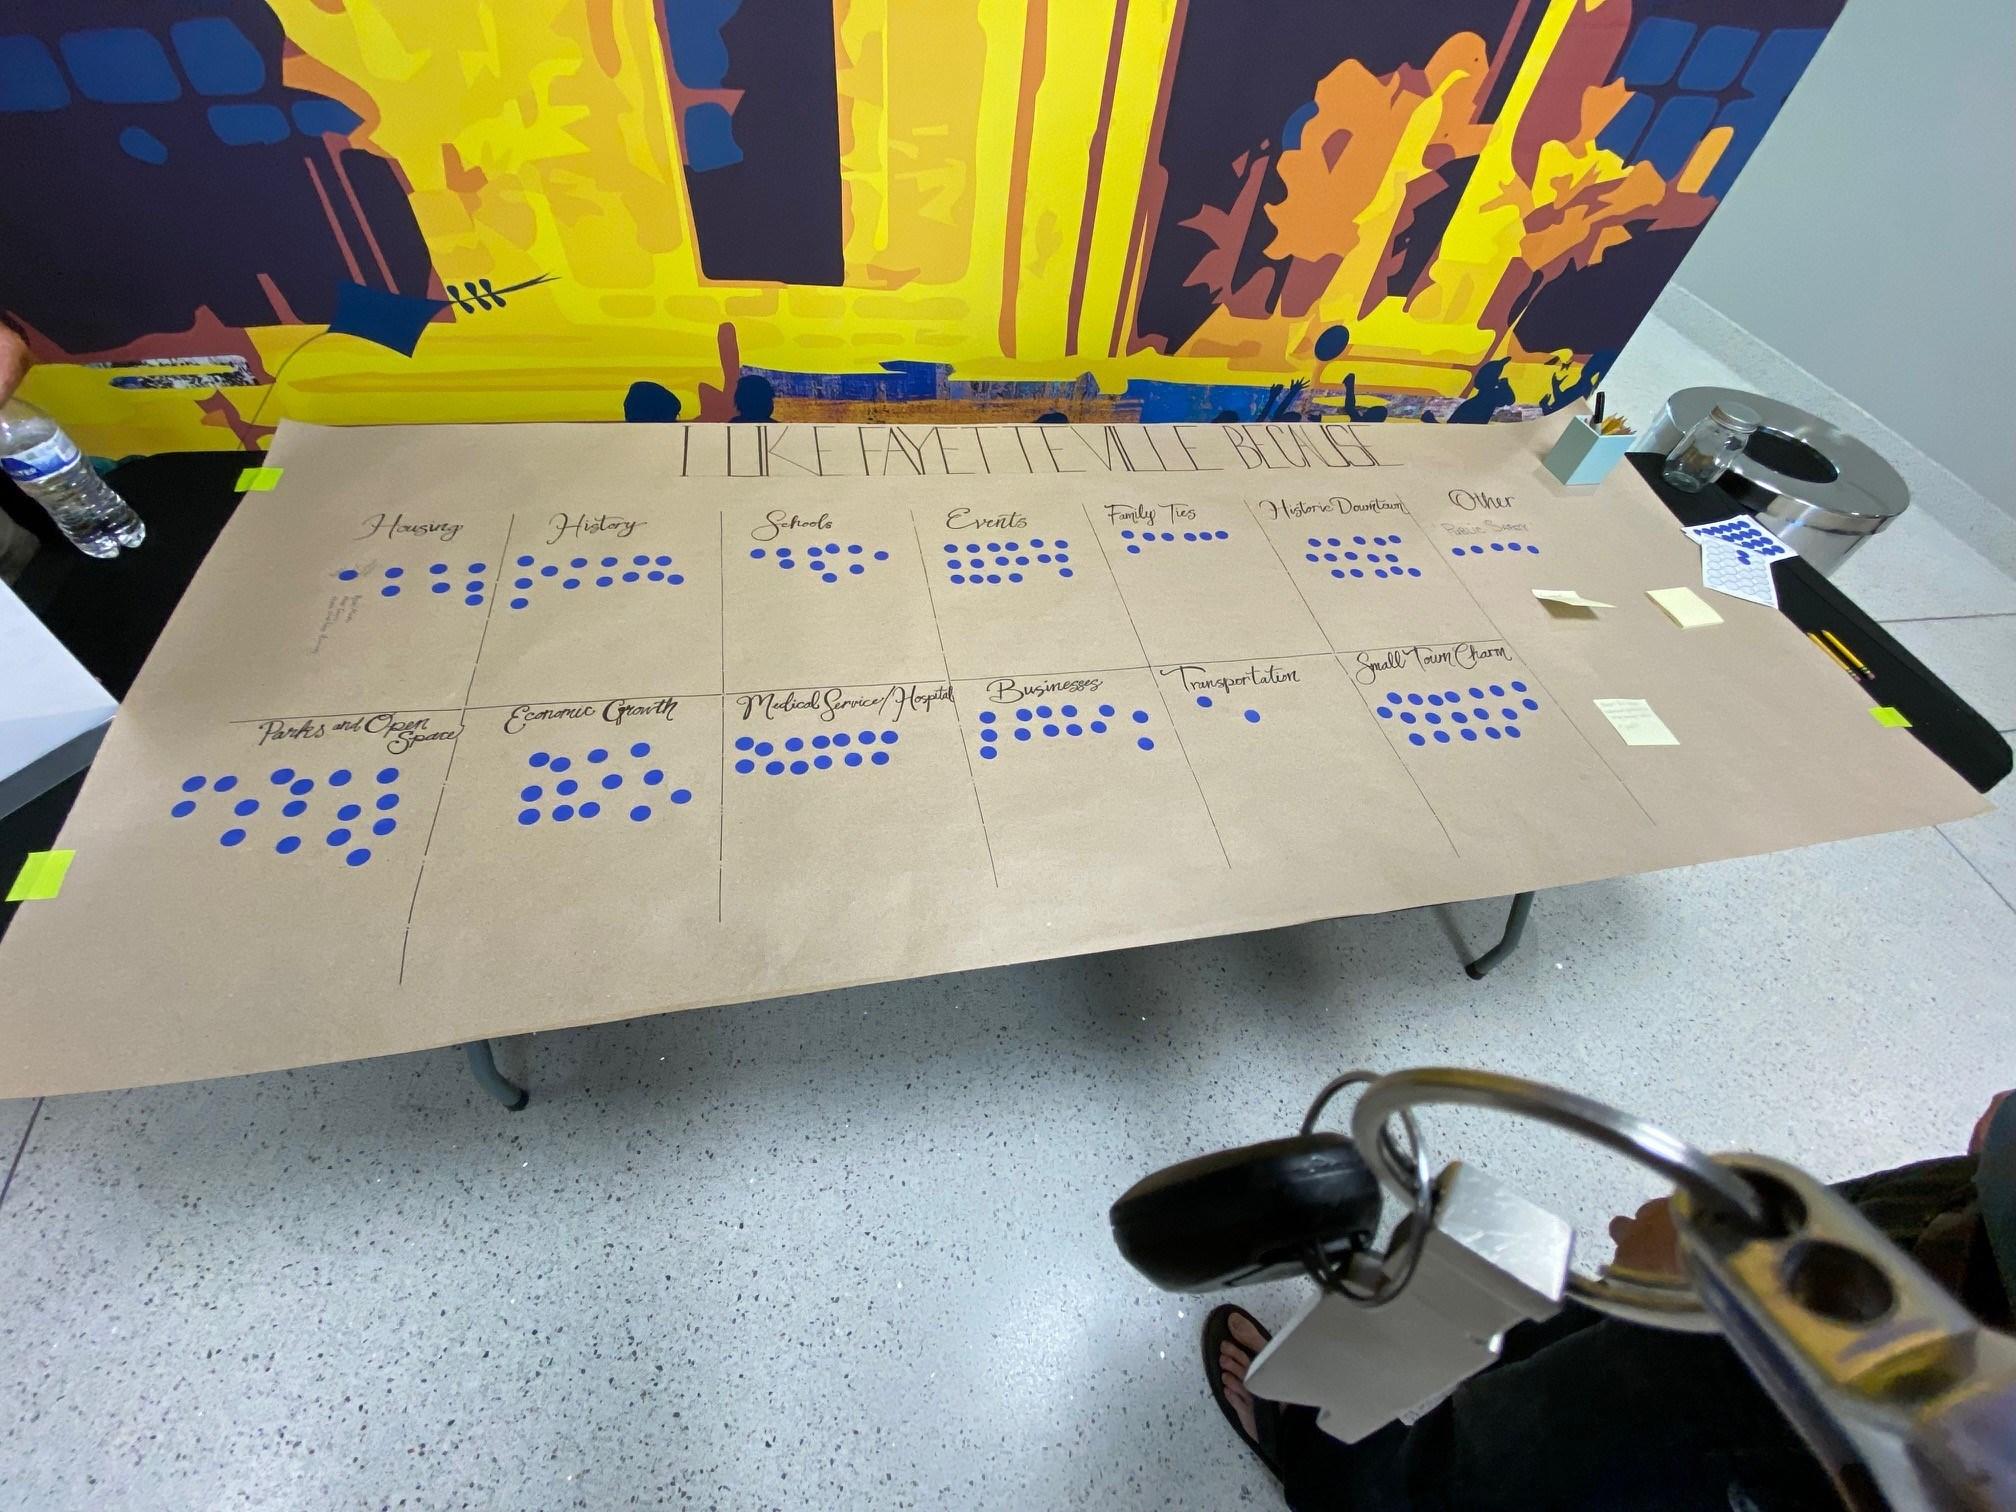
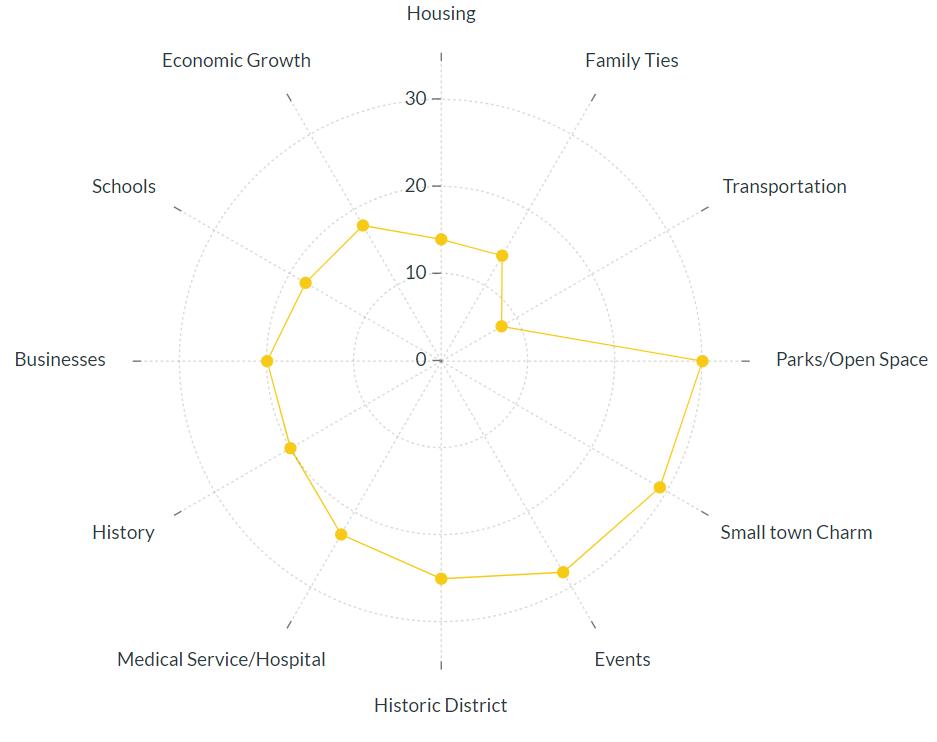
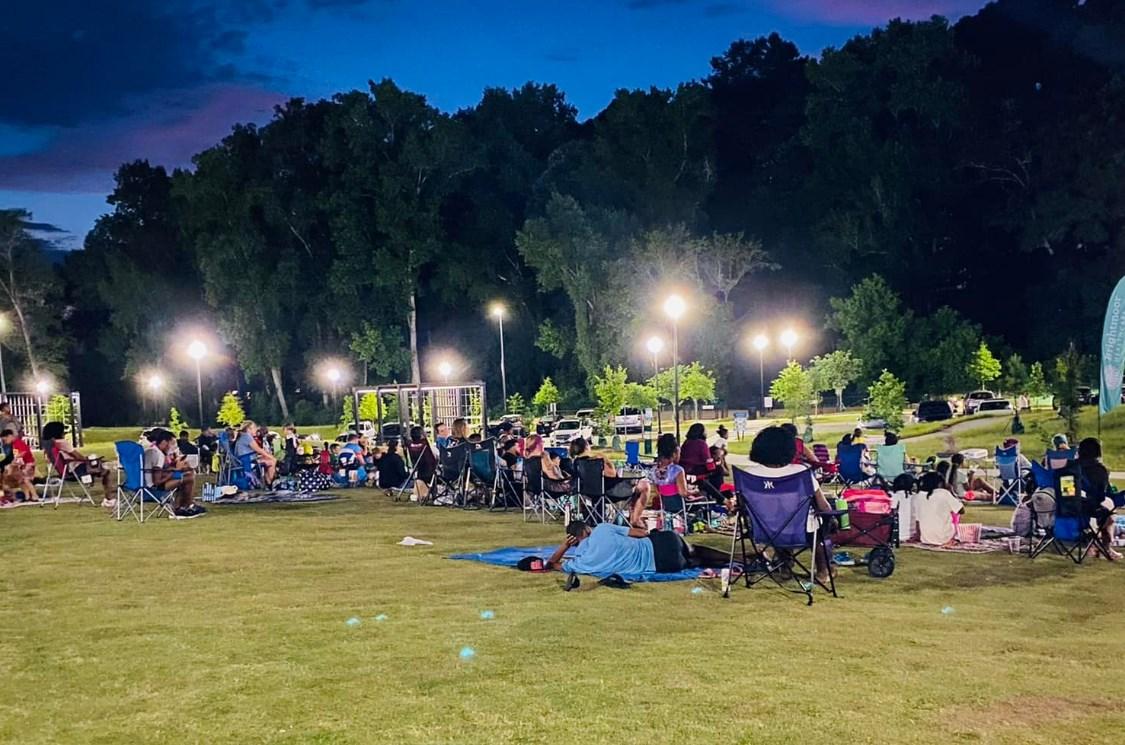
At each public workshop, attendees consistently ranked the city's small-town charm, parks, and community events with high marks. Public safety and the Senior Center (Fayette County) were additional areas that received high marks.
The lowest-ranked areas included traffic and transportation, housing options and family ties. Other concerns included the increase in multi-family development, aging shopping centers, making downtown more walkable, and ensuring balanced growth.
From the previous studies and community meeting, a number of specific priority issues emerged which ultimately guided the development of the updated core goals and recommended actions/projects. The following list of needs and opportunities were identified during a series of input meetings .
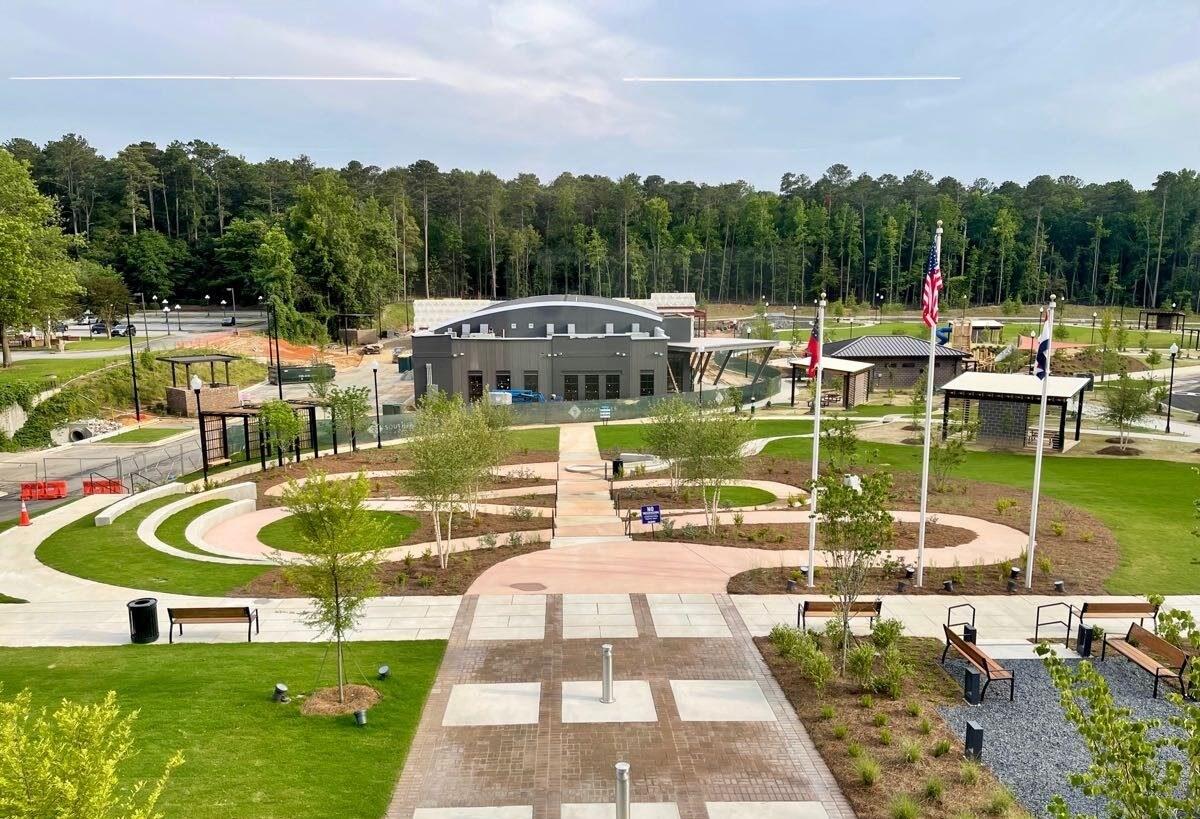
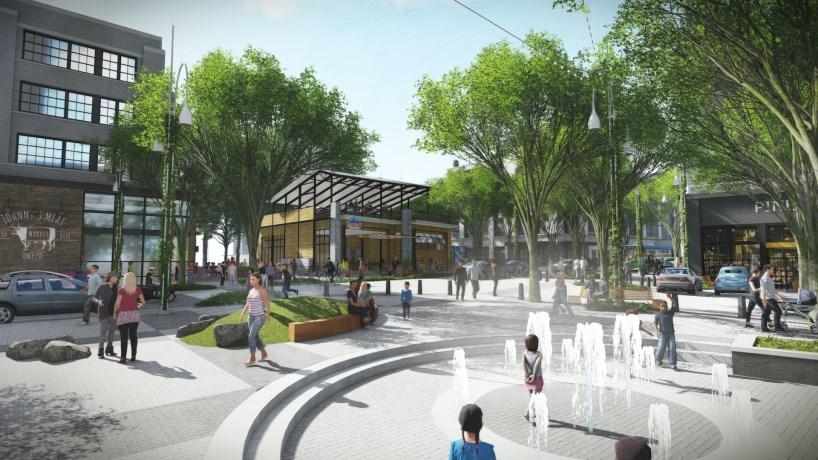
New City Center Park including the playground, walkways, a picnic pavilion, a splash pad and lawn space
Small town charm/Historic District
Existing street network is a great foundation to build upon in creating a vibrant walkable downtown
Historic buildings that contribute to the Southern/ small town charm
Community events are well attended and have created strong bonds
Piedmont hospital and other medical establishments provide vital services
Moderately affluent, established city with a quality school district and several local employment anchors
Presence of Georgia Military College and Georgia Film Academy
Proximity to Hartsfield-Jackson International Airport
Proximity to Atlanta
Trilith Studios and all the related businesses and workers that contribute to the Fayetteville economy
Infill development and undeveloped land
Excellent fire and emergency response
Established neighborhoods and housing stock
Refurbish empty or partially occupied strip centers, aging Shopping Centers
Parking downtown seems limited, need clear signage to make it less confusing.
Improve the existing parks and add more open spaces
More community artwork in the downtown and new programming for community events
Old houses are deteriorated, lack of maintenance
More community artwork in the downtown
More sidewalks, bicycle paths and multi-use trails.
Improve older parks and provide more green space
Lack of pedestrian facilities that safe, especially downtown
Planned/intentional businesses in square that drive walkability
Reduce the impact of conflicting land uses
Improve older parks and provide more green space
Better traffic management city wide
Major state and U.S. highways transect the downtown
Traffic congestion and high speeds in downtown
Separated bike lanes/temporary road diet on streets such as Jeff Davis or Beauregard
Aging infrastructure needs continuous follow-up and maintenance
More housing options for seniors and young professional
A unique place to call home, a community building from the past, working together creating a better future, while preserving our small town charm.
Guiding principles are the values city leaders should use to establish a framework for decisionmaking throughout the life of the Comprehensive Plan. These principles were conceived through robust and meaningful conversations with the CPC, city leaders, residents and the business community.


GOAL ONE: Improve Property Tax Base to diversify and strengthen the fiscal health of the
L-1.1: Update and pursue goals of the Economic Development Plan.
L-1.2: Investigate the development of more TAD districts
L-1.3: Pursue more Business Park development to accommodate our economic development targets.
GOAL TWO: Improve aesthetics
L-2.1: Encourage more parks, street trees, median landscaping and gateways.
L-2.2: Continue with high architectural and site design standards
L-2.3: Revisit the sign ordinance rules for temporary signs to ensure that the City maintains its
L-2.4: Encourage the growth of the arts and cultural community.
L-2.5: Minimize street frontages lined by parking lots and blank walls.
GOAL THREE: Make Downtown Fayetteville more vibrant and walkable.
L-3.1: Get more people living Downtown to support businesses
L-3.2: Recruit more businesses to Downtown
L-3.3: Study financial and engineering feasibility of regional stormwater detention in a water feature (such as a lake or enhanced creek/river/canal) Downtown
L-3.4: Improved/ additional wayfinding signage
L-3.5: Encourage pedestrian improvements within Downtown including but not limited to sidewalks, pathway systems, multi use trails connecting park areas, businesses, and neighborhoods to
GOAL FOUR: Ensure new development is complementary
L-4.1: Finalize and adopted the update zoning ordinance to reflect goals of the Comprehensive Plan
L-4.2: Ensure appropriate density transitions and buffering between incompatible uses.
L-4.3: Pursue more Business Park development to accommodate our economic development targets.
L-4.4: Preserve and protect the desired character and value of well-established neighborhoods and natural resources from encroachment by incompatible uses.
L-4.5: Support the redevelopment of underutilized parcels
L-4.7 As necessary, undertake detailed studies, plans for growth centers, and mixed-use centers to identify areas appropriate for density mixed-use development
L-4.8: Support residential infill development and redevelopment that responds to local preference and demand for innovative, high quality housing, that is sensitive to surrounding residential areas,
GOAL ONE: Get more people living Downtown to support businesses .
H-1.1: Examine opportunities for higher density development in the activity centers (Trilith, Downtown,
H-1.2: Actively recruit mixed use developers.
H-1.3: Encourage the development of townhouses that are externally oriented toward the street and
H-1.4: Encourage the development of smaller lot detached homes in walking distance of Downtown amenities.
GOAL TWO: Encourage development of housing for every step of the life cycle.
H-2.1: Investigate strategies to promote workforce housing, especially for government employees.
H-2.2: Address identified need for smaller single family detached housing with a higher architectural design standard located in walkable mixed use environments. This could be downtown or in a developer created mixed use environment. Care should be taken to limit the number of walkable mixed use developments outside of Downtown so as to not reduce the demand for living
H-2.3: Reconsider City standards for required open space set aside for all zoning districts.
H-2.4: Work with community partners to stabilize and improve neighborhoods adjacent to downtown.
H-2.5: Target rehabilitation in neighborhoods that need assistance to mend and enhance the existing housing stock.
H-2.6: Consider conducting an bi-annual market study to determine demand based housing and employment needs.
H-2.7: Revise regulations and administrative procedures to ensure new residential and mixed-use development provides sufficient public open space, green space, and pedestrian connectivity.
H-2.8: Ensure new housing density complies with market demand recommendations from the 2022 housing market study.
GOAL ONE: Continue to cultivate Fayetteville's distinct identity as a safe, welcoming city with attractive places to live; and high-quality city programs and services.
QL-1.1: Maintain property standards and enforcement to ensure that neighborhoods and buildings remain safe and livable
QL-1.2: Preserve Fayetteville unique character .
QL-1.3: Maintain public infrastructure, buildings, equipment and open space that meets the demand of future community needs.
QL-1.4: Support the vision of a community where everyone has access to the resources and opportunities needed to live healthy, active lives.
GOAL TWO: Protect open space, natural and sensitive areas..
QL-2.1 Identify open space and sensitive areas that should be preserved for natural recreation areas.
QL-2.2: Develop a plan to retain a variety of natural areas for use by Fayetteville citizens.
QL-2.3: Foster dynamic, accessible public spaces and parks.
QL-2.4: Provide a range of public spaces, programs, and facilities that meet community needs for recreation and leisure
GOAL ONE: Ensure coordination with state, regional and county partners.
T-1.1: Participate in the Fayette County Transportation Plan.
T-1.2: Develop a more cooperative relationship with the Georgia Department of Transportation to help meet local objectives for state controlled roads.
T-1.3: Participate in Fayette County Trails Plan in order to connect Fayetteville to larger countywide network.
T-1.4: Pursue state and federal funding for community identified transportation high priorities
T-1.5: Strategically locate and regularly maintain freight routes
GOAL TWO: Maintain or enhance the quality of new and existing infrastructure.
T-2.1 Prioritize projects that have the most impact to the most people.
T-2.2: Compile and prioritize safety improvements based on accident data.
T-2.3: Prioritize creating more of a grid street network and "complete streets" to ensure alternative routes.
T-2.4: Prioritize projects that support a more walkable Downtown.
T-2.5: Pedestrian improvements including crosswalks and signals.
T-2.6: Improved/additional wayfinding signage.
T-2.7: Promote connectivity of our road network to improve the quality of life in our residential neighborhoods.
T-2.8: Require inter-parcel access in new development .
T-2.9: Implements traffic calming schemes, such as narrow travel lanes, on-street parking, mid-block crossings, and street trees to slow traffic and increase safety for all modes of transportation.
T-2.10: Design all new facilities and upgrade existing facilities to comply with all federal, state, and local safety standards.
GOAL THREE: Provide viable and attractive pedestrian facilities
T-3.1: Review and refine the City of Fayetteville Trails Plan
T-3.2: Identify and fill gaps in the trail network. Find opportunities for future trails, complete connections to existing segments, implement projects, and pursue new trail connections to create a more functional trail network.
T-3.3:
Improve the network of pedestrian facilities (sidewalks) by creating a safe and accessible network throughout the City. Sidewalks of required widths, well-marked crosswalks and approved pedestrian-scaled lighting should be installed to create an inviting and well used pedestrian system.
GOAL FOUR: Continue progress of making Downtown more walkable.
T-4.1 Coordinate with Land Use Goals.
T-4.2: Connect streets to create more of a grid.
T-4.3: Utilize shorter blocks to increase walkability .
T-4.4: Update Downtown commercial and mixed use zoning districts to enhance the pedestrian experience by creating scenic vistas and promoting street facing retail with store windows and sidewalk cafes.
T-4.5: Develop a downtown streetscape plan.
T-4.6: Add more parks and fountains that will enhance the pedestrian experience.
T-4.7: Provide more downtown parking and signage for the parking.
T-4.8: Create a detailed parking management plan and signage.
GOAL ONE: Attract people to live here who appreciate the Fayetteville lifestyle which can best be described as active, outdoor amenities, family-oriented, sense of community and educated workforce
ED-1.1: Reconsider City standards for required open space set aside for all zoning districts.
ED-1.2: Create a green ribbon of parks and trails that connects the entire city.
ED-1.3: Support a healthy, diverse mix of businesses in Fayetteville .
GOAL TWO: Develop a Downtown Plan to create a unique destination in Downtown Fayetteville.
ED-2.1: Work with consultant on economically feasible development strategies .
ED-2.2: Create a comprehensive marketing plan for Downtown.
ED-2.3: Encourage buildings in walkable areas to be oriented to the street and have facades designed with abundant windows and human scale architectural features .
GOAL THREE: Business Retention and Expansion.
ED-3.1: Create synergy with local businesses by communicating with existing businesses.
ED-3.2: Working together with the Fayette County Development Authority and Chamber of Commerce on business retention, expansion, and attracting developing the workforce local businesses need.
ED-3.3: Encourage educational enhancements to make Fayetteville the place to live for all school attendance zones. (i.e. post secondary training and professional development opportunities).
ED-3.4: Enhance the branding campaign.
ED-3.5: Encourage the creation (entrepreneur), retention, and expansion of local businesses
ED-3.6: Encourage sustainable practices in locating, designing, constructing, and maintaining development in the city.
GOAL FOUR: Enhance Commercial Corridors.
ED-4.1: Encourage commercial redevelopment that offers amenities and atmosphere to attract top-tier commercial tenants.
ED-4.2: Identify underutilized properties (i.e., buildings assessed at considerably less than the total property value) and, encourage redevelopment.
ED-4.3: Encourage structured parking and minimize surface parking, particularly adjacent to public rights -of-way.
ED-4.4: Prepare individual Small Area Plans, for each of the Activity Centers that clearly demonstrate the desired mix of uses, residential density, building intensity, design aesthetic, specific street locations and multimodal connections, infrastructure improvements, parking, and open space.
GOAL FIVE: Encourage and facilitate broadband service throughout the city.
ED-5.1: Consider adopting the model Broadband Ordinance.
ED-5.2: Consider becoming a Broadband Ready Community.
ED-5.3: Promote broadband as an asset and strength of the community for businesses and residents.
This page intentionally left blank.
This page intentionally left blank.
first five-year time frame of the planning period. This can include any ordinances, administrative systems, community improvements or investments, financing arrangements, or other programs or initiatives to be put in place to realize the plan goals.
The Report of Accomplishments immediately follows the Community Work Program and provides an overview of the status of Short-Term Work Program Goals that were previously established for the period 2017-2022.


Hire Economic Development Director to pursue the Comprehensive Plan Economic Development Goals of business retention and expansion, business attraction and recruitment AND the Land Use Goal of Improving the City’s property tax base.
Host
to attract residents and tourists to the downtown area
Utilize existing infrastructure by encouraging infill and redevelopment as opposed to Greenfield development
Facilitate the implementation of the "Re-defining Downtown" LCI Plan (2002) recommendations where feasible.
This page intentionally left blank.
A number of key considerations contributed to the restructuring of the future land use designations adopted as a part of this update:
• Neighborhoods include a mix of housing types and choices at varying price ranges; with density and mixed-use at the center and lower density housing towards the edge.
• Neighborhood Centers are strategically located at intersections to maximize access, visibility and economic viability. These centers should include a range of commercial uses within walking distance of housing, serving the neighborhood primarily, but also serving existing, adjacent residential areas.
• A single, prominent employment center, or Activity Center, serves as the major employment and revenue-generating specialized uses. Activity Centers often have specialized uses and needs and may be dominated by a single user such as a campus.
In addition, a forthcoming zoning rewrite and small area plans will be the primary mechanism for implementing the Future Land Use Map.
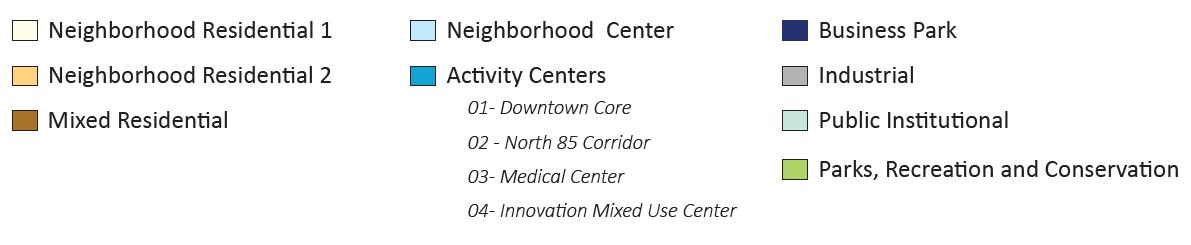
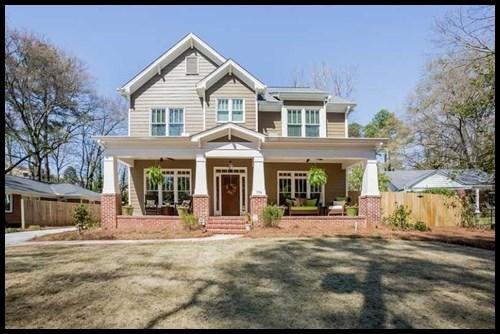
Neighborhoods are not all the same - some are established, some are changing, some are emerging, and some are not yet built. The 2022 Update establishes the Neighborhood land use designation which is intended to identify residential areas that require attention to physical details, careful planning and connectivity. This plan focuses on stabilizing, nurturing, and reinvesting in distinct areas where deterioration has negatively affected their vibrancy and livability.
Specific goals and objectives have been incorporated into this plan to assist the city with adapting to the impacts of future growth and changes in the real estate market.
Located throughout the city are neighborhoods with single-family detached homes on lots of varying sizes, with nearby uses such as retail centers, parks, recreational areas, places of worship and schools.
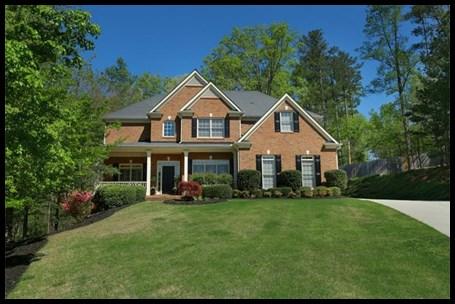
The Neighborhood future land use category is intended for single-family detached residential development and aims to recognize, maintain, support, and enhance the existing residential character of these areas. Future development within this land use category will primarily be singlefamily detached subdivisions that may include complementary uses such as public facilities and parks.
Intended for single-family detached homes of varying architectural style
Where infill opportunities exist, development density should be compatible with the adjacent neighborhoods scale and integrate character and neighborhood-defining features
Buildings designed with a pedestrian scale
Identify opportunities to increase walkability and connectivity with outdoor spaces, sidewalks and path system
Include sidewalks on both sides of all internal streets
Minimize the potential for incompatible land uses (e.g. high traffic generators, noisy users, etc.) within or next to single-family neighborhoods.
Encourage the use of landscape buffers and/or natural vegetation to mitigate the impacts that such land uses could have on residential neighborhoods.
Prohibit higher density residential (e.g. duplexes, apartments) or high-density non-residential land uses (e.g. commercial and industrial uses) in single-family residential areas.
Continue streetscape and infrastructure improvements in aging developments.
Land Use
Primary Uses
Primarily single-family detached (SF)
Small-scale civic/public uses
Places of worship
Parks/recreation/green space
Development Characteristics
Building Form
Mobility
Open Space
Low-rise residential buildings with similar setbacks and lot sizes
Well-connected local street network supports walking, bicycling, and driving.
Typically private yards and improved common areas
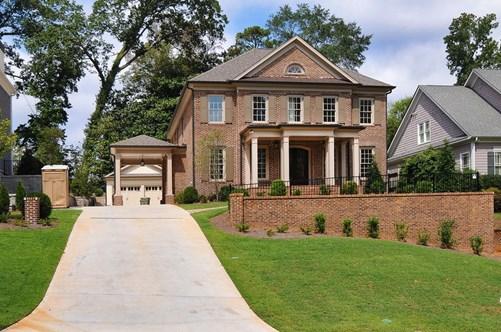
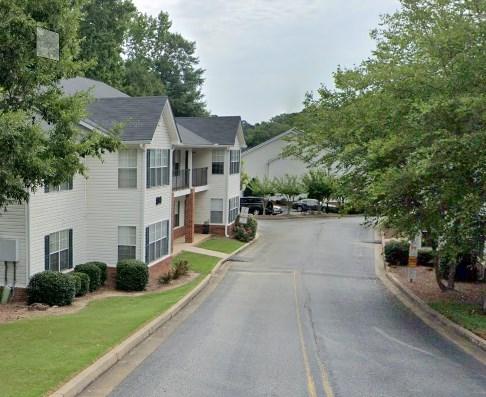
Located in three distinct areas: along or near Highway 85, North Jeff Davis Avenue and Jimmie Mayfield Boulevard, these moderate to high-density neighborhoods include a range of duplexes and/or attached units.
This land use designation is intended to allow for smaller single-family detached residences, duplexes, quadplexes, condominiums and townhouses, along with public and institutional uses such as parks, schools or churches. The scale and height of revitalization projects and future development should be compatible with the surrounding community's existing and planned character which could include a mix of smaller single-family lots and/or a mix of attached residential. Regardless of the type and density of housing, there is a high standard of product provided. Neighborhoods should be well lit, with attractive landscaping, amenities, and aesthetics.
Key implementation strategies
Encourage new housing designs that are attractive and emphasize the structure from the street, rather than the garage.
Where practical, new developments should be designed with vehicle access from a rear alley along with internal sidewalk connectivity throughout the development and to adjoining properties
Encourage the construction of narrow streets in new neighborhoods and require sidewalks on both sides of all streets
Minimize the potential for incompatible land uses (e.g. high traffic generators, noisy users, etc.) within or next to Two-Family/Townhouse Residential areas. Where such uses do occur in close proximity, encourage the use of landscape buffers to mitigate the impacts that such land uses could have on residential neighborhoods.
Plan for interconnected road and open space networks in new residential areas
Identify opportunities to increase walkability and connectivity with outdoor spaces
Discourage the use of cul-de-sacs in new neighborhoods whenever possible.
Promote property upkeep and maintenance through effective code compliance
Buildings designed with a pedestrian scale
Primary Uses
Primarily small lot single family residential and attached residential
Building Form
Mobility
Open Space
Single-family detached residential
Low- to mid-rise attached residential
Well-connected and dense street network and short blocks, encourage walking, bicycling and driving
Privately owned, common space and small parks, greenways and open space
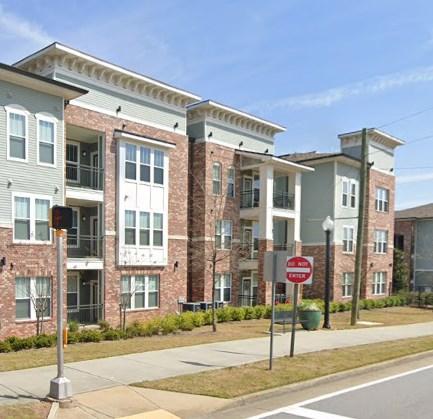
Primarily located along Lanier Avenue, the parcels with this land use designation are developed with a range of single-family detached and/or attached residential.
This land use designation is intended to provide a compatible variety of residential units as well as recreational and community facilities, with a focus on providing single-family detached as well as a variety of attached residential product (duplex, triplex, quadplex), multi-family residential, townhomes and condominiums along with public and institutional uses such as parks, schools and places of worship.
Require residential developments to provide on-site open space areas and amenities
Where practical, new developments should be designed with vehicle access from a rear alley along with internal sidewalk connectivity throughout the development and to adjoining properties
Encourage the construction of narrow streets in new neighborhoods and require sidewalks on both sides of all streets
Support the construction of "complete streets"
Plan for interconnected road and open space networks
Discourage the use of cul-de-sacs whenever possible.
Link parking lots to building entrances by pedestrian walkways that are physically separated from vehicular movement areas
Promote property upkeep and maintenance through effective code compliance
Encourage the use of balconies, porches, stoops, garden walls, varied building and facade setbacks, varied roof designs, bay windows, and similar design features in new mixed residential project designs. In general, multi-family dwelling units should be designed so that they appear to be a grouping of smaller residential units.
Promote architectural design that is compatible with the surrounding neighborhood including building and facade materials, building height, building bulk, setbacks, window and door styles and placements, roof designs and color scheme.
Primary Uses
Primarily small lot single family residential and attached residential
Building Form
Mobility
Open Space
Single-family detached residential
Low- to mid-rise attached residential
Well-connected and dense street network and short blocks, encourage walking, bicycling and driving
Privately owned, common space and small parks, greenways and open space
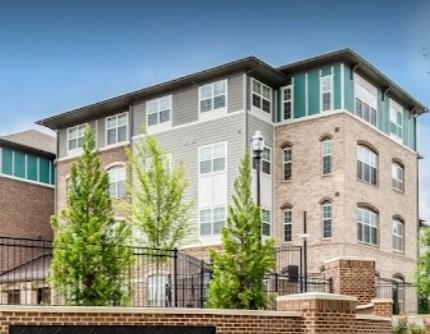
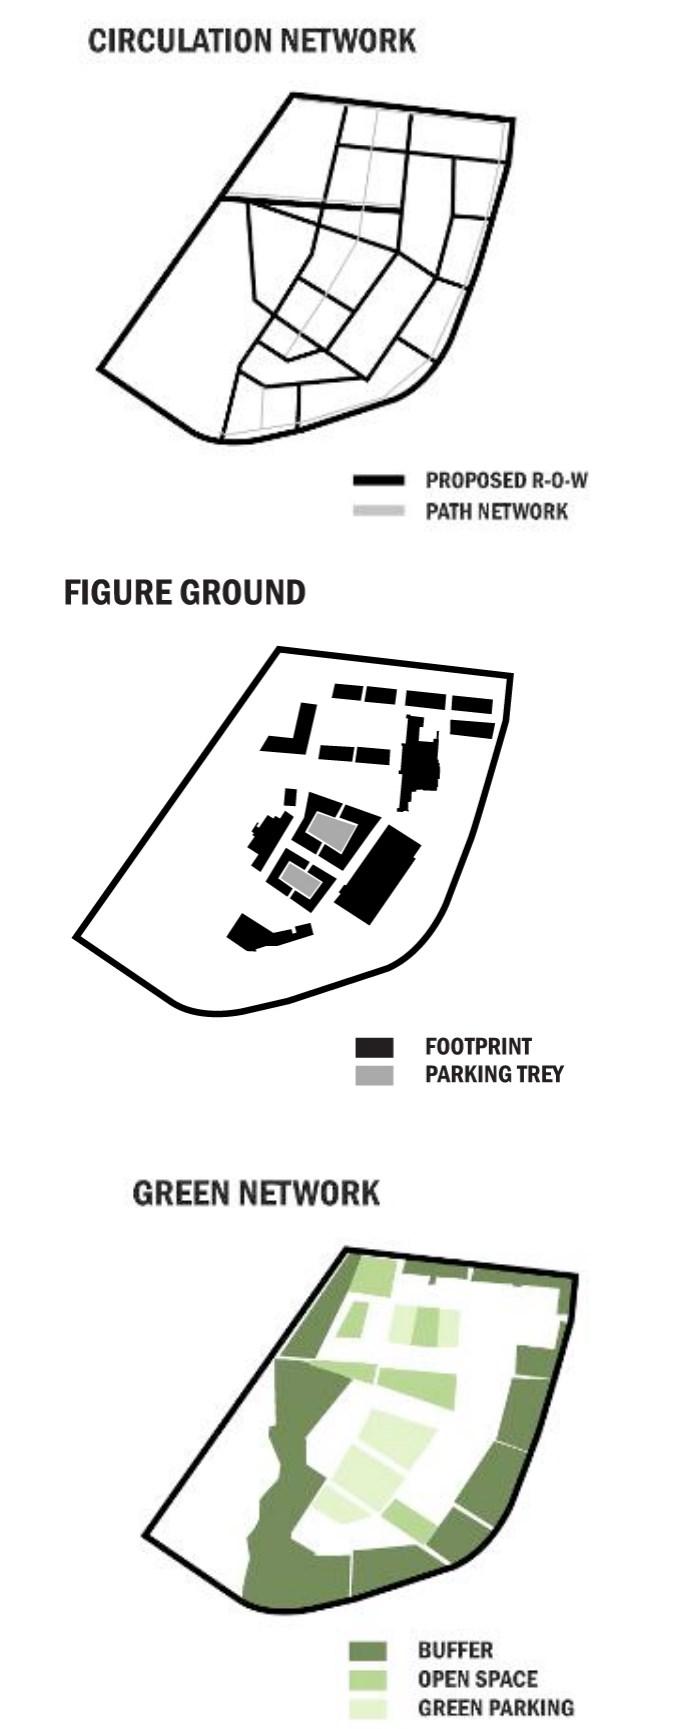
The most significant change in the 2022 Update is how the city classifies commercial development. Studies show that allowing and promoting varying levels of activity within a development can promote pedestrian activity and business vitality along corridors and create a rhythm of development, which helps to segment the linear corridor into distinct areas that will create a greater sense of place.
Neighborhood Centers encourage a mixture of small-scale commercial, low-intensity office, restaurants, specialty retail, medical and service uses that cater to the surrounding residential neighborhoods.
Activity Centers are often referred to as character areas and encourage a “holistic” approach to long-range planning by integrating the community’s vision and desires with actual land use patterns. The following areas have been established as Activity Centers:
Downtown Core = Downtown Mixed Use Center
North 85 Corridor - Fayette Pavilion
Medical Center = Piedmont Fayette Hospital Complex
Innovation Mixed Use Center - Trilith Studios/Town at Trilith
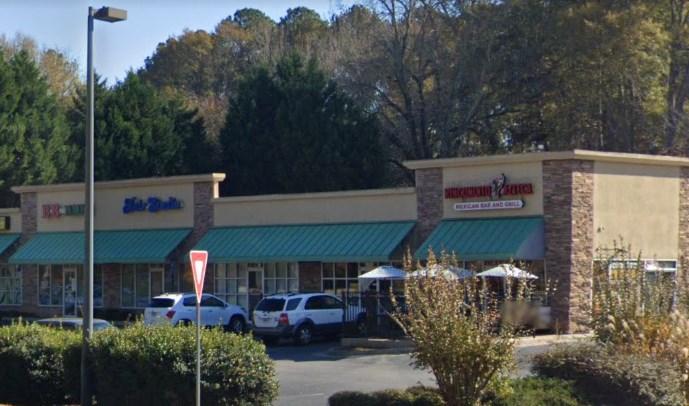
Neighborhood Centers are primarily located on major thoroughfares and near concentrations of existing or planned residential neighborhoods. Current developments and uses include smaller strip centers, shopping centers with grocery stores, storage facilities, offices, retail establishments, restaurants, and services.
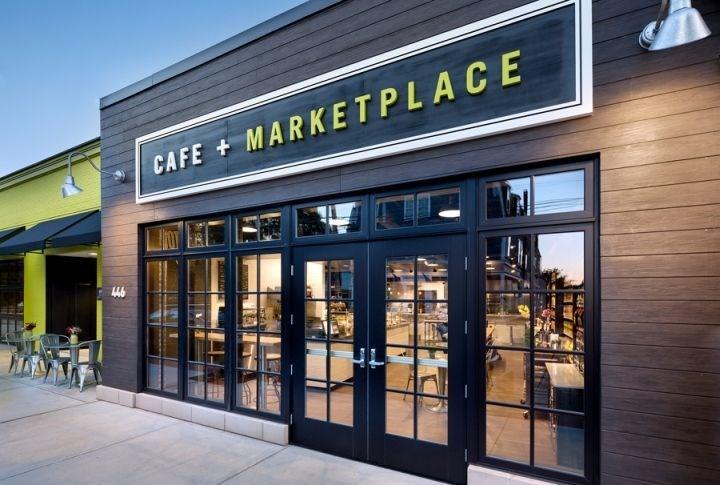
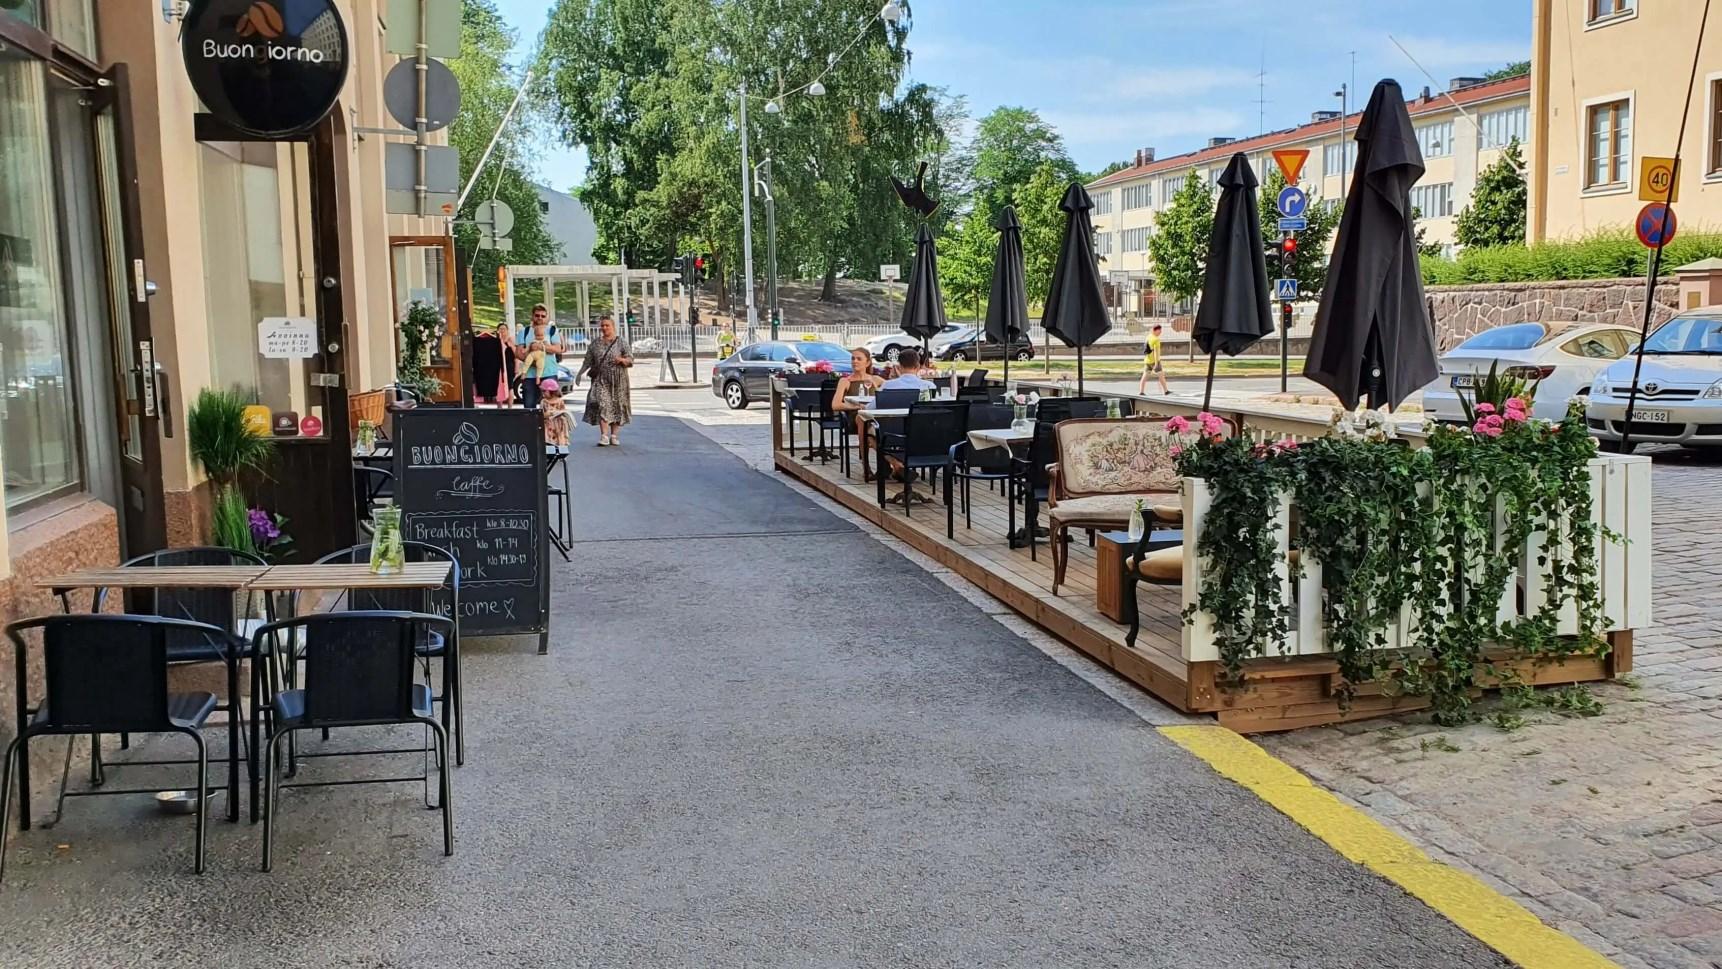
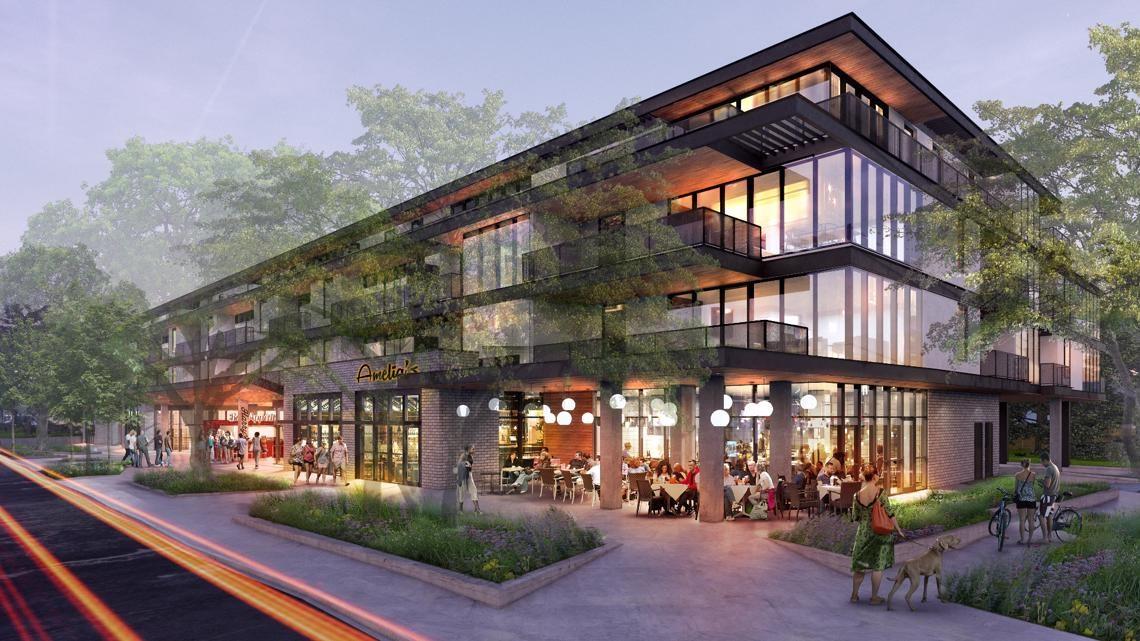
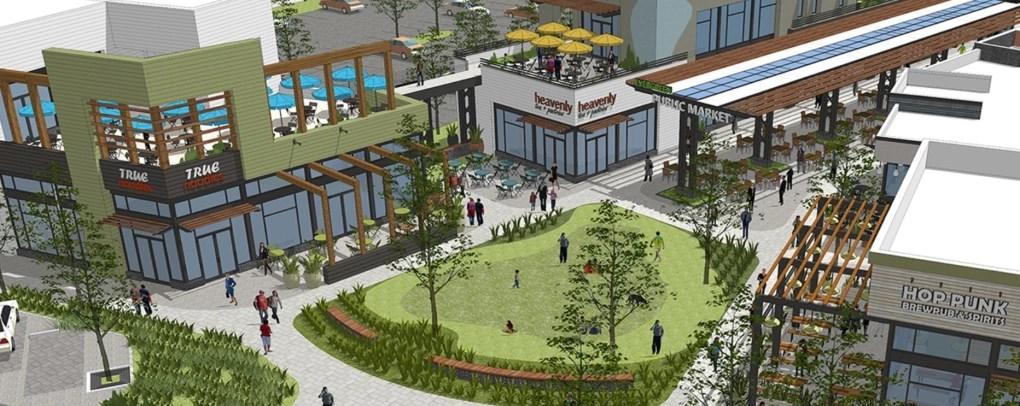
This future land use category includes small-scale neighborhood supporting retail, office and service uses which preserve the residential character through building scale, building appearance, landscaping and signage. With the proximity to the Downtown Core and adjacent residential developments, the neighborhood centers will include some infill. Mixed-use developments are envisioned to revitalize aging shopping centers and help buffer the quieter residential neighborhoods. New development and redevelopment in these areas should be compact in form, with free-standing commercial structures and/or some vertical mixed-use structures. These areas should include a network of pedestrian-friendly and well-designed streetscapes with a distinctive sense of place.
Actively promote redevelopment of aging retail centers
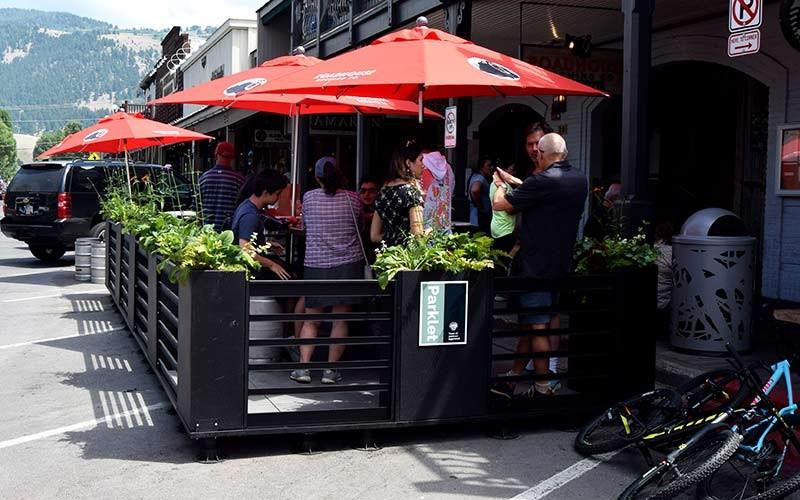
Transform parking lots into pedestrian-friendly parking plazas with buffered walkways, parklets and commercial pad sites
Create pedestrian connections to the main building entrances and the adjoining sidewalk networks
Encourage connected street grid network with small blocks and wide pedestrian walkways as properties are redeveloped
Improve mobility within the shopping center and to nearby shopping districts by establishing streetscape hierarchy
Strategically buffer conflicting land uses such as residential areas and/or roadways with open space
Create dedicated circulation for delivery vehicles to minimize conflict between pedestrians and service vehicles
Establish a consistent development pattern along the corridors by implementing design guidelines for building design and materials, sidewalks, landscaping and signage
Require inter-parcel access between developments
Encourage buildings to face the street and locate parking to the side and rear as retail centers redevelop
Provide bicycle and pedestrian amenities, including covered walkways, benches, lighting and bike racks
Reduce parking requirements and encourage adaptive reuse
Consider the use of “build-to” lines and street-oriented customer entrances to encourage walking and neighborhood connections.
Design buildings and sites for pedestrians not just automobiles.
Land Use
Primary Uses
Neighborhood-serving retail / commercial
Small-scale office
Green space
For properties identified as having strong revitalization potential, projects with smaller footprints should be considered with a mix of uses. There should be direct linkages between residential and commercial uses.
Building Form
Mobility
Open Space
Low-rise retail structures with a walkable, landscaped public realm
Encourage safe and comfortable access by all modes of travel
Plazas, patios, and courtyards; landscaping and natural open space is encouraged
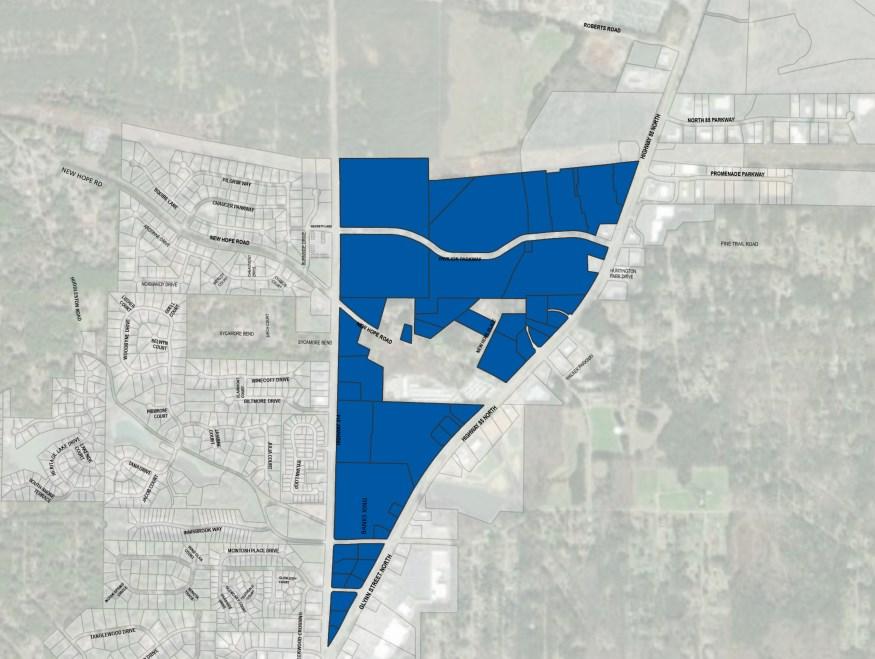
This master planned development includes Trilith Studios and the Town at Trilith, including a variety of detached and attached residential dwelling units, retail and commercial, office, restaurant and internal amenities.
This future land use category includes small-scale neighborhood supporting retail, office and service uses which preserve the residential character through building scale, building appearance, landscaping and signage. With the proximity to the Downtown Core and adjacent residential developments, the neighborhood centers will include some infill. Mixed-use developments are envisioned to revitalize aging shopping centers and help buffer the quieter residential neighborhoods. New development and redevelopment in these areas should be compact in form, with free-standing commercial structures and/or some vertical mixed-use structures. These areas should include a network of pedestrian-friendly and well-designed streetscapes with a distinctive sense of place.

Land Use
Primary Uses
Mixed-use
Retail/commercial/restaurant
Office
Lodging
Hotel
Single-family detached
Micro-homes
Parking garages
Indoor/outdoor event center
Development Characteristics
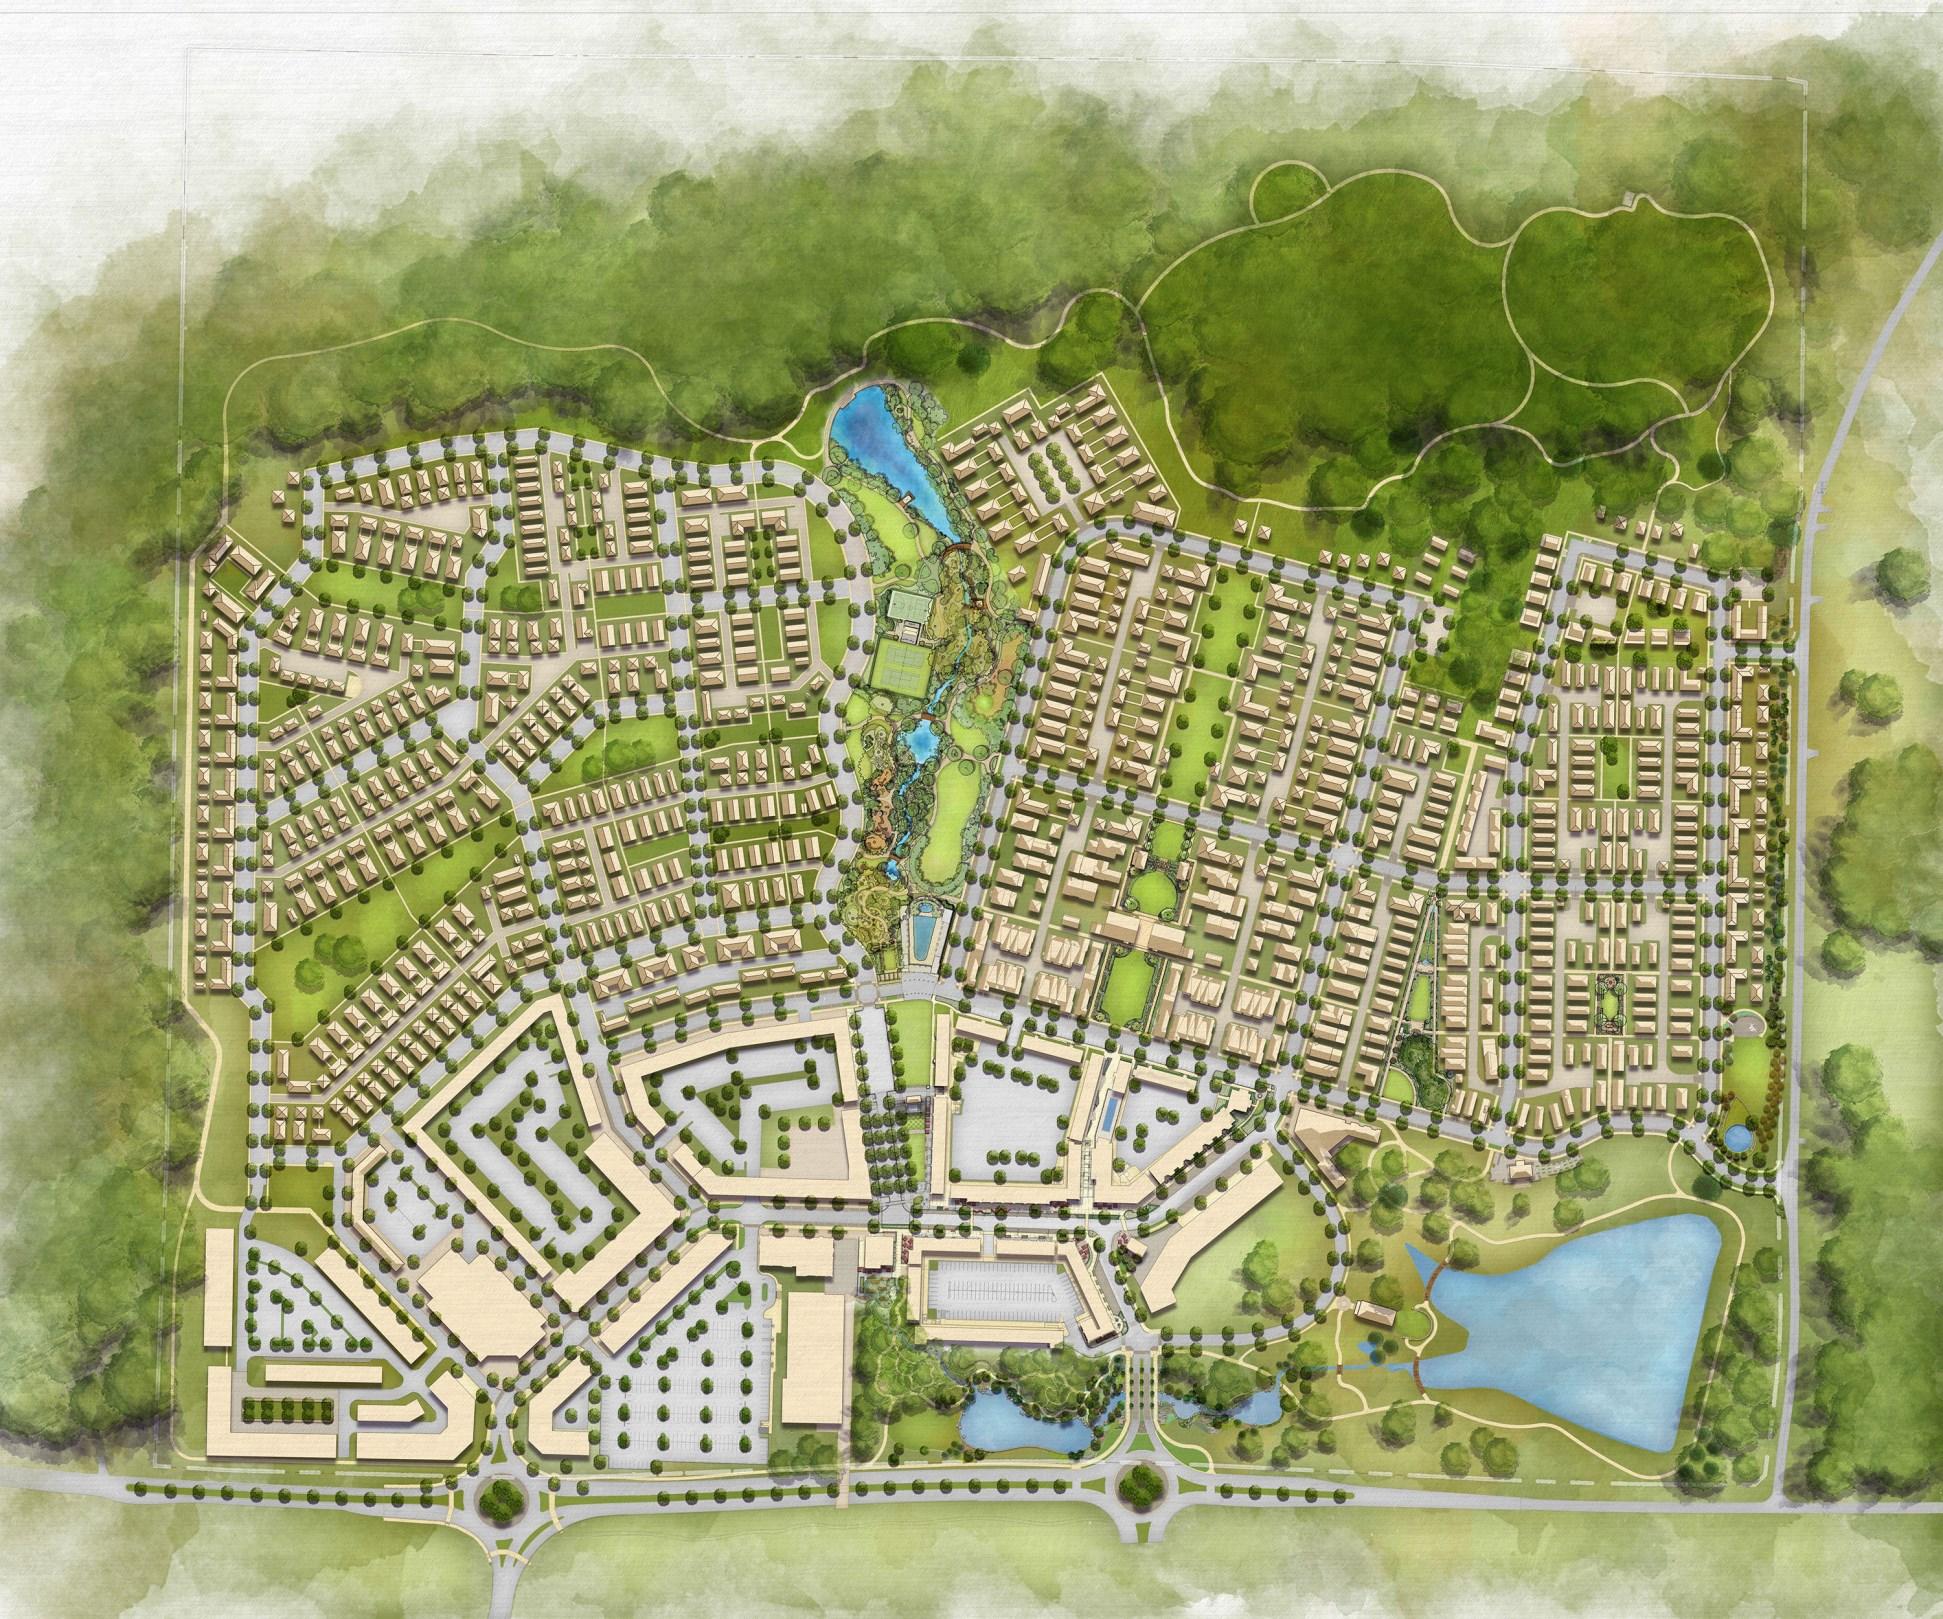
In accordance with New Urbanism principles, the master planned development will continue to adhere the following standards :
The neighborhood, the district, and the corridor are the essential elements of development and redevelopment in the metropolis. They form identifiable areas that encourage citizens to take responsibility for their maintenance and evolution.
Neighborhoods should be compact, pedestrian friendly, and mixed-use. Districts generally emphasize a special single use, and should follow the principles of neighborhood design when possible. Corridors are regional connectors of neighborhoods and districts; they range from boulevards and rail lines to rivers and parkways.
Many activities of daily living should occur within walking distance, allowing independence to those who do not drive, especially the elderly and the young. Interconnected networks of streets should be designed to encourage walking, reduce the number and length of automobile trips, and conserve energy.
Within neighborhoods, a broad range of housing types and price levels can bring people of diverse ages, races, and incomes into daily interaction, strengthening the personal and civic bonds essential to an authentic community.
Concentrations of civic, institutional, and commercial activity should be embedded in neighborhoods and districts, not isolated in remote, single-use complexes. Schools should be sized and located to enable children to walk or bicycle to them.
The economic health and harmonious evolution of neighborhoods, districts, and corridors can be improved through graphic urban design codes that serve as predictable guides for change.
A range of parks, from tot-lots and village greens to ballfields and community gardens, should be distributed within neighborhoods. Conservation areas and open lands should be used to define and connect different neighborhoods and districts.
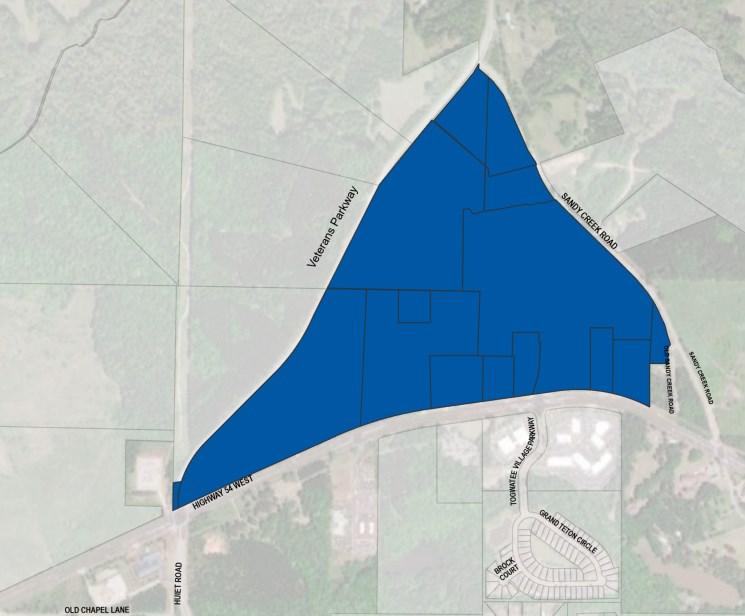
The Medical Center activity center includes the Piedmont Fayette Hospital and adjoining medical buildings. Piedmont is a leading community hospital and one of the largest employers in Fayetteville with nearly 2,700 doctors, nurses, and other professionals. The activity center offers 24hour emergency services, cancer care, health care, transplant center, women’s health, and more. This area encompasses a contiguous area of land generally located around the intersection of the Veterans Parkway, Sandy Creek Road and Highway 54 West.
The vision for the area is one of mutual compatibility and support among differing uses with people living and working in the community. It includes a neighborhood that encourages people to live and work within the area and promote development that is consistent with, and transitions to, the established neighborhood scale. Future development will create a center that is a walkable, multi-modal community with a variety of transportation options with enhanced connections and safe pedestrian routes.
Establish new zoning designation for areas within a specified activity node to permit a mix of land uses, similar to the Trilith development but at a smaller scale
Maintain existing hospital as an economic anchor for the community and support the future growth of healthcare and healthcare related businesses
Implement interconnected street grid network with small blocks and wide pedestrian walkways
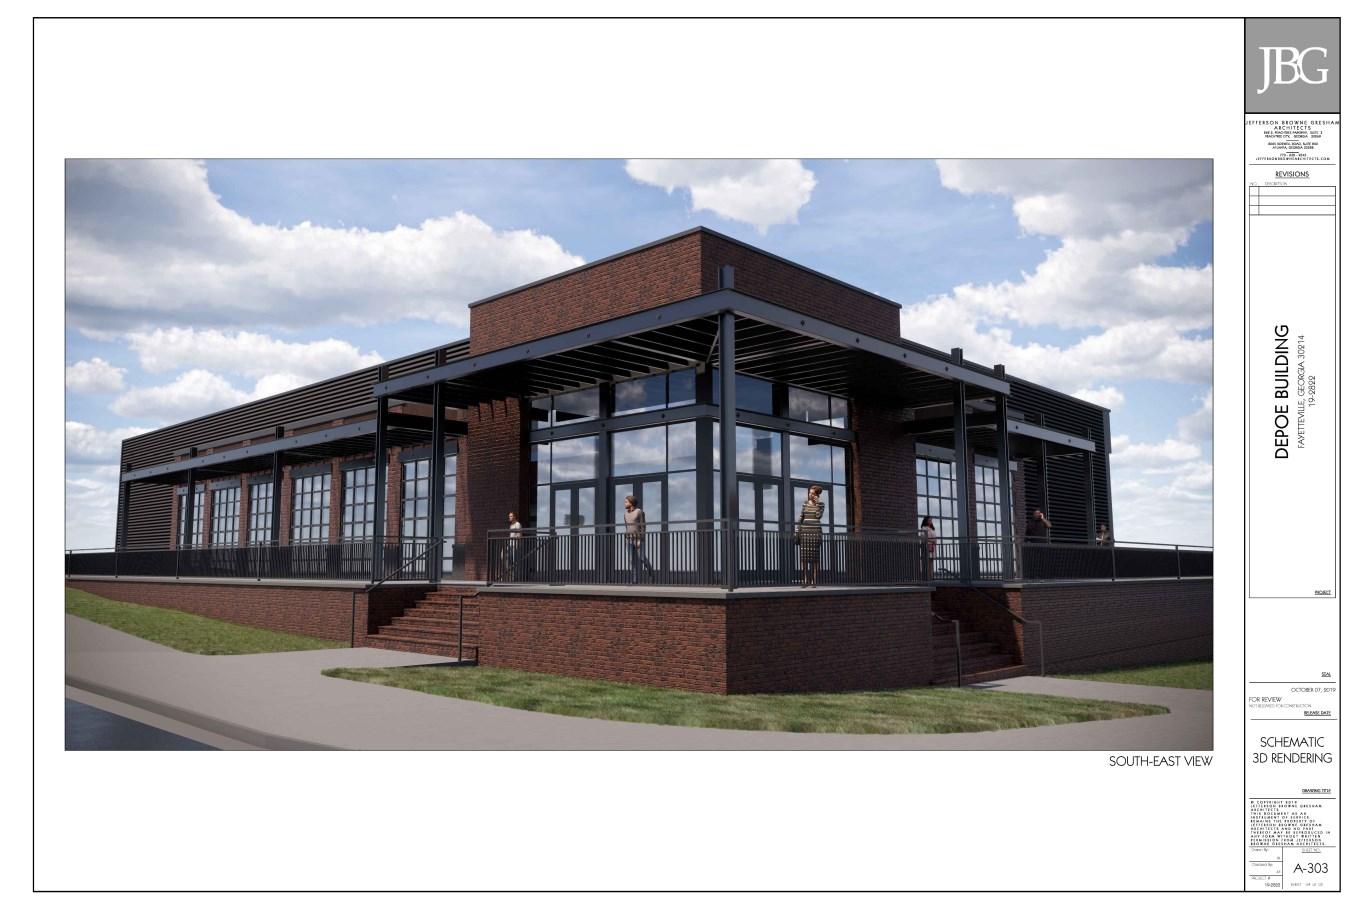
For new mixed-use developments, streets should include landscaping, pedestrian-scale lighting, and street furniture. Public gathering areas should be encouraged. Buildings should be limited to no more than three stories and should include facade variation and fenestration. Parking should be located to the rear or side of buildings.
Require inter-parcel access between developments and parallel access to the medical center
Support the growth, stability and diversity of the residential communities by ensuring a continued mix of housing types
Establish direct, pedestrian friendly circulation and crossing patterns that connect uses with trails and bicycle and pedestrian routes. Provide pedestrian friendly crossings.
Land Use
Primary Uses
Medical offices and other medical-related uses
Mixed Use Residential
Retail (stand-alone or ground-floor as part of mixed-use development) Hotel
Civic uses that support residential uses, such as schools and places of worship
Development Characteristics
Building Form Commercial, institutional, multi-family or mixed-use buildings
Mobility
Open Space
Encourage safe and comfortable access by all modes of travel
Improved open space is a key feature; many public and private spaces
This page intentionally left blank.
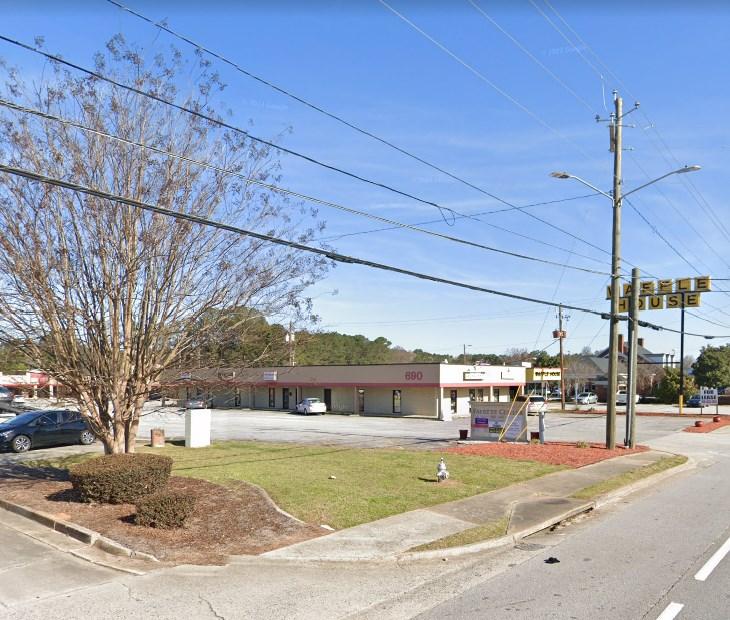
This Activity Center includes several existing commercial sites along North 85 and other areas with commercial land uses. The most prominent is the Fayette Pavilion with multiple big box retailers and supporting retail, commercial and restaurant uses. The corridor is easily accessible by car but not easily accessible to adjoining residential developments. Vacancy in the corridor is generally low but is burdened by infill retailers such as discounters, thrift stores and churches.
A vibrant commercial corridor with a mix of aesthetically pleasing and well-maintained mixed use developments that are interconnected with each other as well as the adjoining residential developments.
Actively promote redevelopment of the commercial areas and work with property owners to encourage higher occupancy rates and help maintain high occupancies rates through business retention and recruitment
Reduce parking requirements and encourage existing retail centers to redevelop into mixeduse centers
Reintroduce internal grid street networks along with pedestrian-friendly connections. Convert unused parking areas into pedestrian-friendly parking plazas with buffered walkways, parkettes, and commercial pad sites.
Create pedestrian connections to the main building entrances and the adjacent sidewalk network.
Improve mobility within the shopping center and to nearby shopping districts by focusing streetscape improvements
Strategically buffer from or connect to adjacent uses of conflicting land uses, and open space, protect residential neighborhoods, and the highway
Create dedicated circulation for large vehicles so that retail warehousing uses do not conflict with improvements geared towards creating a pedestrian-friendly environment
Establish a consistent development pattern along the corridor by implementing design guidelines for signage, sidewalks, and landscaping
Require inter-parcel access between developments
As shopping plazas redevelop, encourage buildings to face the street and locate parking to the side and rear
Provide bicycle and pedestrian amenities, including covered walkways, benches, lighting, and bike racks
Continue code compliance efforts to maintain an attractive appearance of shopping centers and buildings.
Land Use
Primary Uses
Shopping centers
Standalone retail uses
Personal services
Restaurants
Mixed use (including office and ground-floor retail/commercial)
Building Form
Mobility
Open Space
Mid-rise buildings with active ground floors and building step backs on upper floors
Very well-connected street network with small blocks and highly walkable connections
Improved open space is a key feature; many public and private spaces
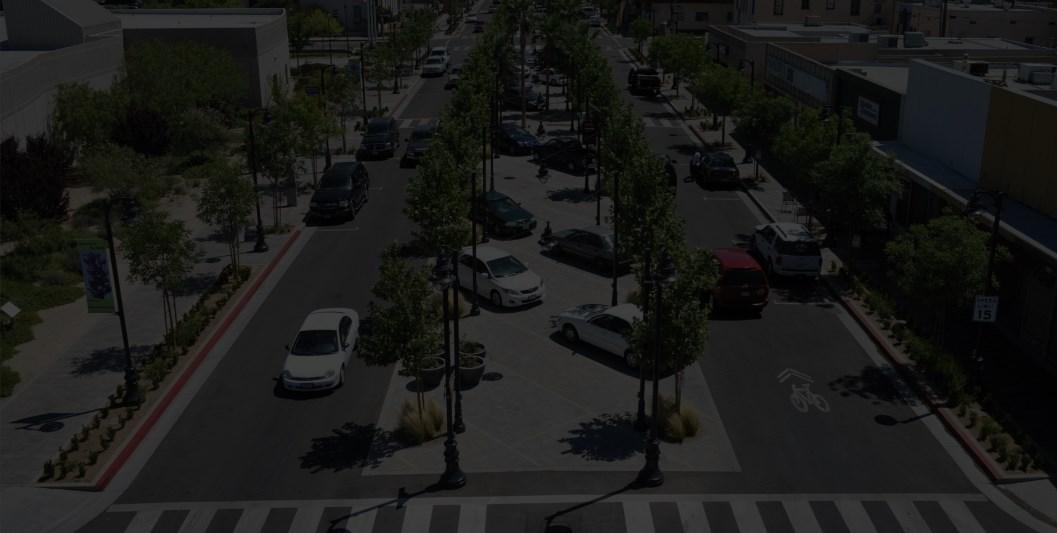
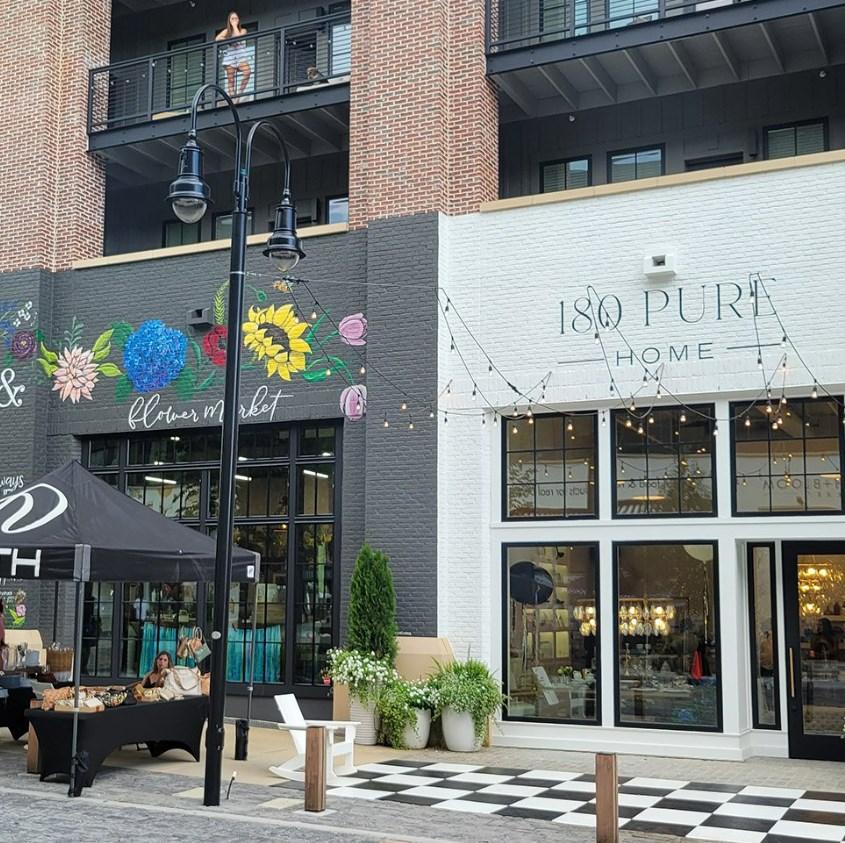
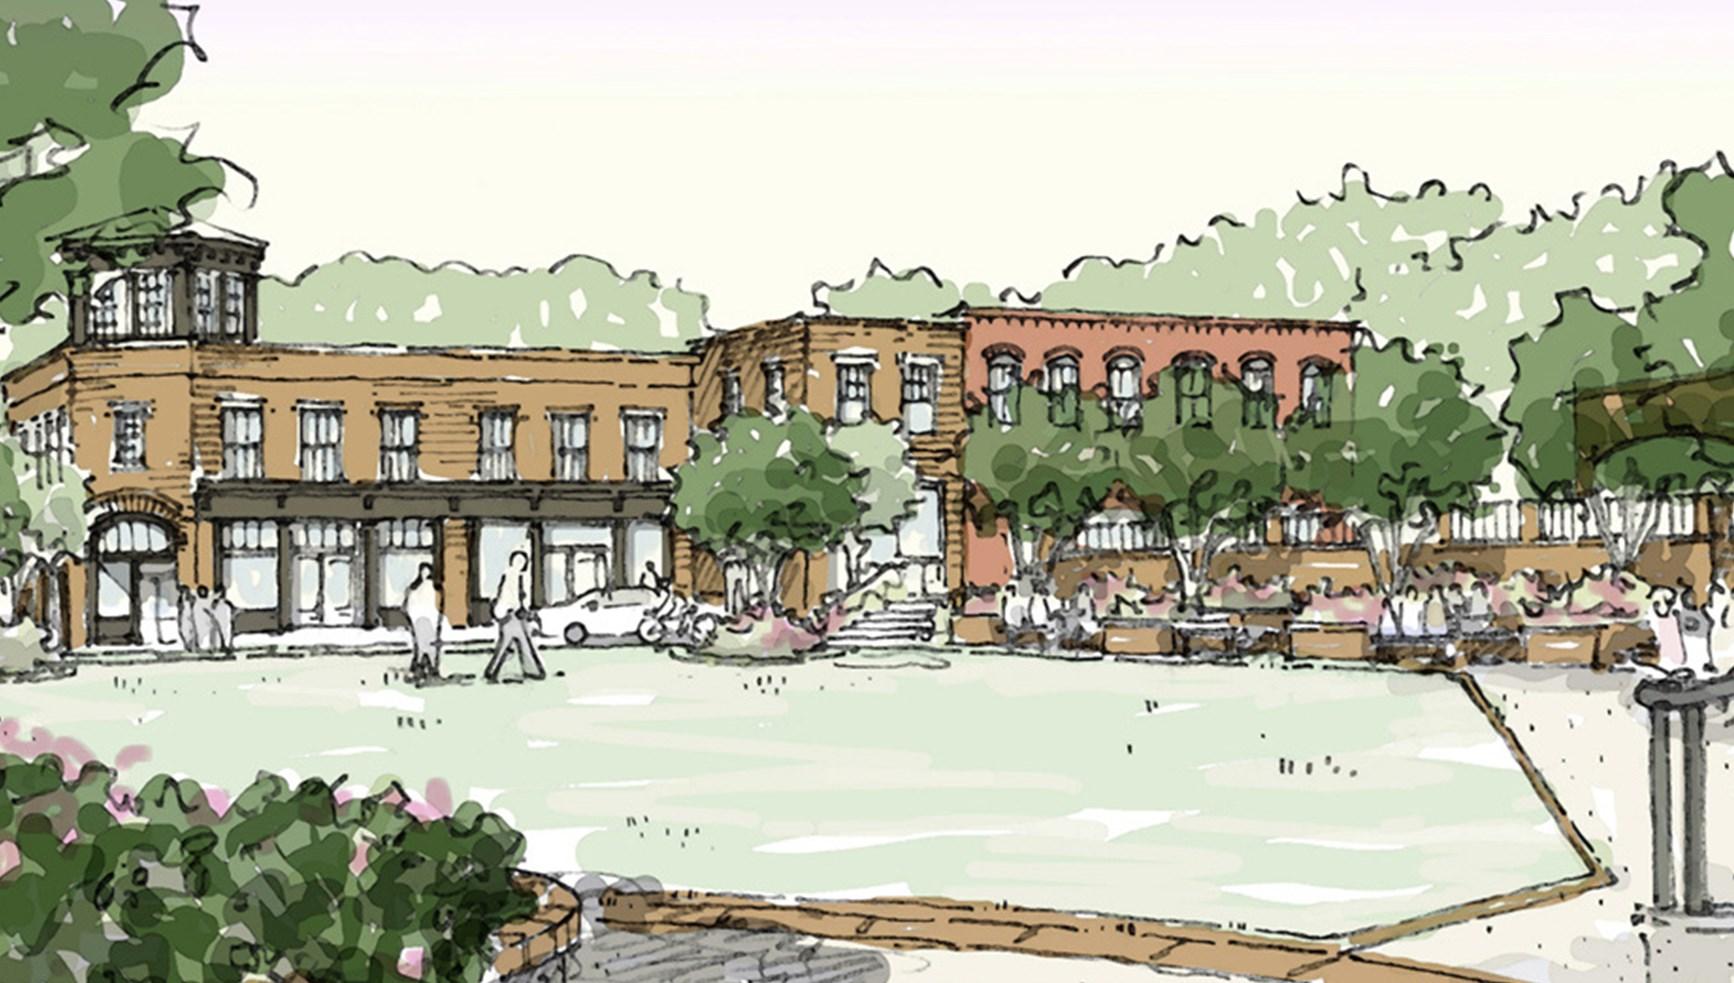
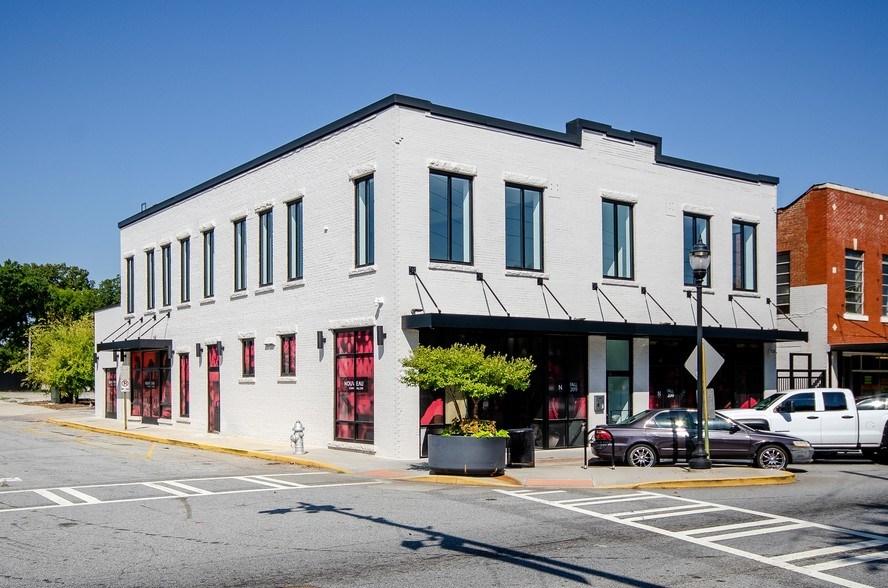
Land use within downtown are characterized by a predominance of institutional uses, single-family homes, and commercial/retail facilities. Records indicate that much of the downtown core was constructed between 1880 and 1920. Since then the downtown has grown more modestly and consistently resulting in the development of previously undeveloped or underdeveloped areas along major transportation routes and redevelopment within the historic downtown square. Recent developments like the city center park has brought new life to downtown, and the two state highways present a challenge to the vision of a walkable, safe and pedestrian-friendly downtown.
This land use designation is intended to encourage pedestrian-oriented retail, office, service, community facility and residential uses. The vision for the downtown core is centered on pedestrian-oriented and walkable development where people living, working and visiting should be able to park their car and easily walk from place to place. The vision for the recent LCI Study centered around moving downtown Fayetteville Forward through catalytic and equitable placemaking, enhanced legibility of the built environment, and creative guidelines for sustainable developments.
Prioritize walkability and connectivity
Require inter-parcel access between developments
Develop a comprehensive sidewalk network to enhance safety, emphasize walkability in the street grid and pedestrian scale.
Improve zoning ordinance to permit a mixture of uses
Use code to enhance pedestrian experience, and unified streetscaping (improving aesthetics)
Codify historic inspiration as a guide for new buildings
Emphasis on placemaking/Downtown as a destination
Add more parks, landscaping, and trees
Emphasis on historic character and Identify infill parcels and ownership for redevelopment opportunities
Create distinct character areas
Establish Street Frontage Typologies, Improve Public Space Domains
Adopt architectural design guidelines
Adopt a Complete Street policy
No new auto-oriented commercial developments
Historic buildings originally constructed for residential use must retain their residential architecture regardless of the use or mix of uses
All sites are designed for the convenience of pedestrians first and vehicles second
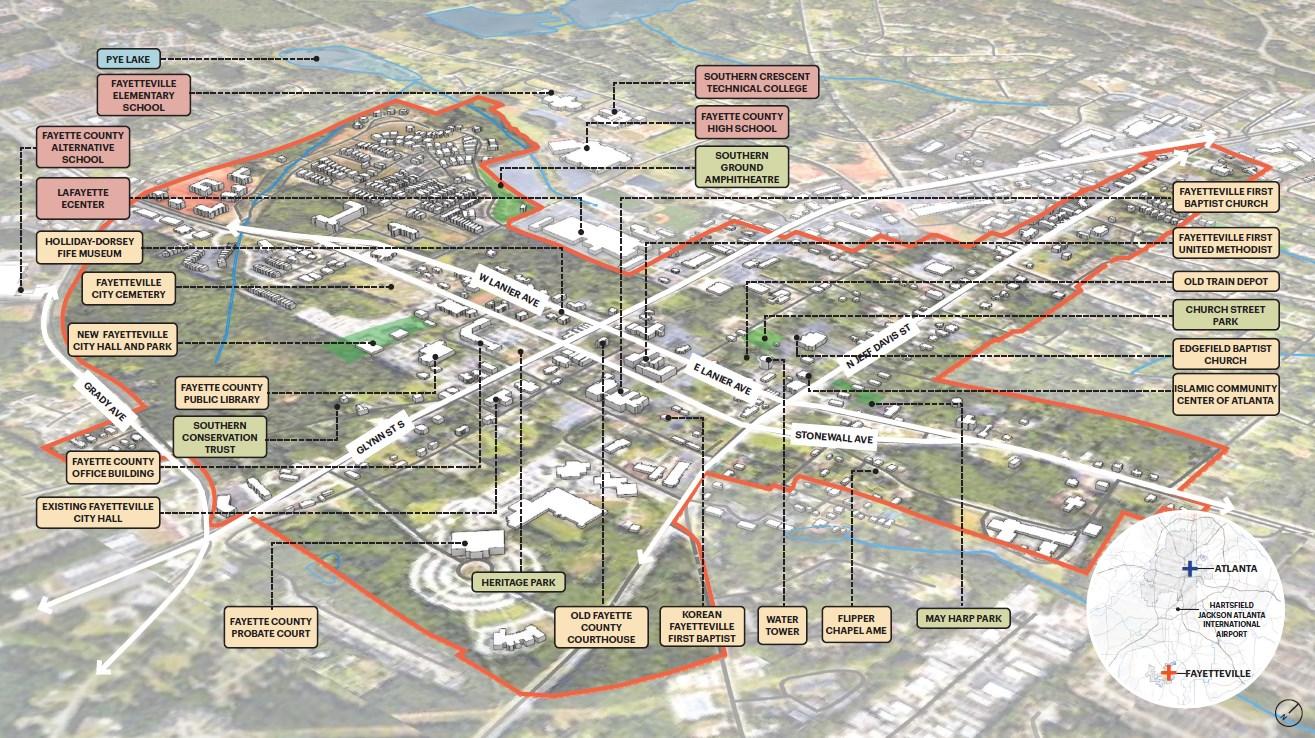
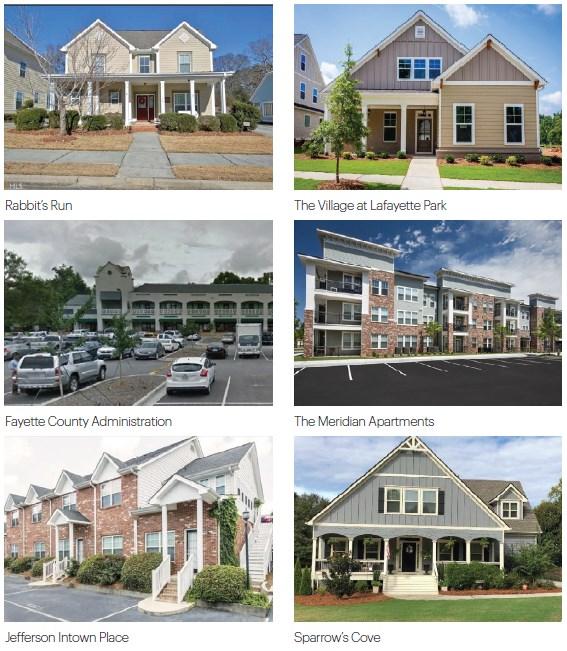
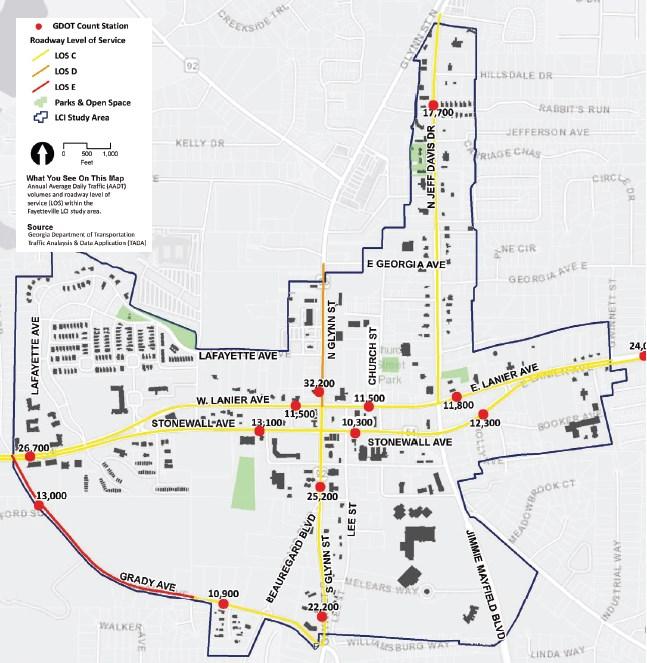
Land Use
Primary Uses
Shopping centers
Standalone retail uses
Personal services
Restaurants
Residential
Building Form
Mobility
Open Space
Buildings are also designed with the convenience of pedestrians in mind. All buildings have street entrances and the primary façade(s) and architectural treatments are street facing
Blocks are small and streets are interconnected in a grid fashion to the extent practicable. Streets are tree lined and sidewalks are wide.
Improved open space is a key feature; many public and private spaces
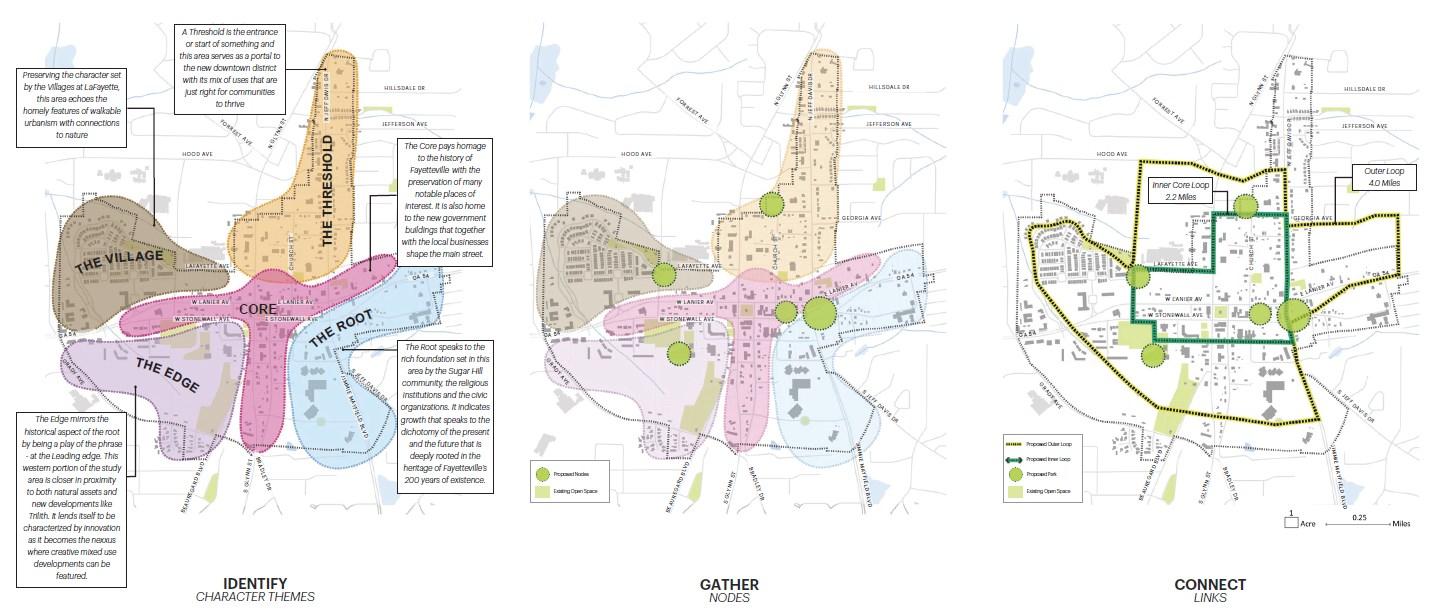
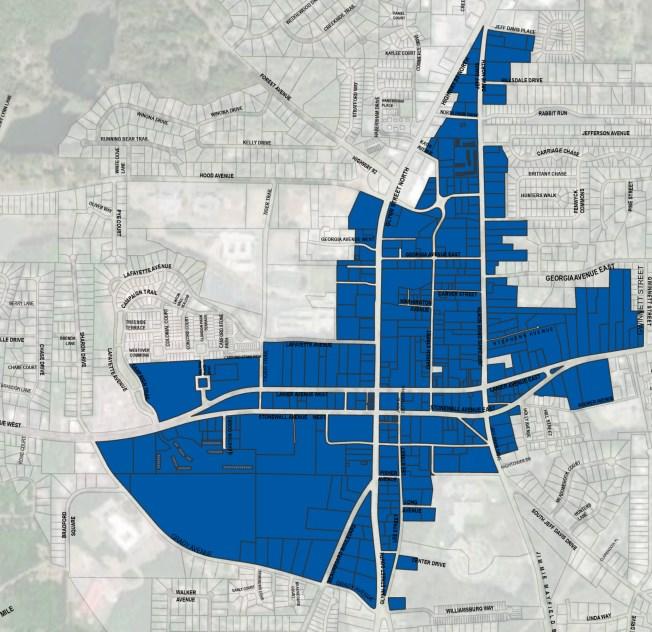
The use and enjoyment of outdoor spaces have long been a source of joy and quality of life for residents and visitors. There are currently six (6) public parks, and the city is committed to enhancing these spaces to benefit the general public.
This land use category is for land dedicated to active or passive recreational uses as well as green space and wildlife management. It is in this area that residents have an opportunity to connect with nature through activities that promote physical activity and healthy lifestyles. These areas may be either publicly or privately owned.
Preserve and protect environmental areas that protect wildlife and vegetative resources.
Work collectively with surrounding and overlapping governments and non-profit agencies on the preservation and enhancement of woodlands and open space areas.
Identify opportunities for future open space in neighborhoods that are undersupplied in public recreation and open space opportunities.
Enhance public access to parks and recreational facilities by making necessary infrastructure improvements.
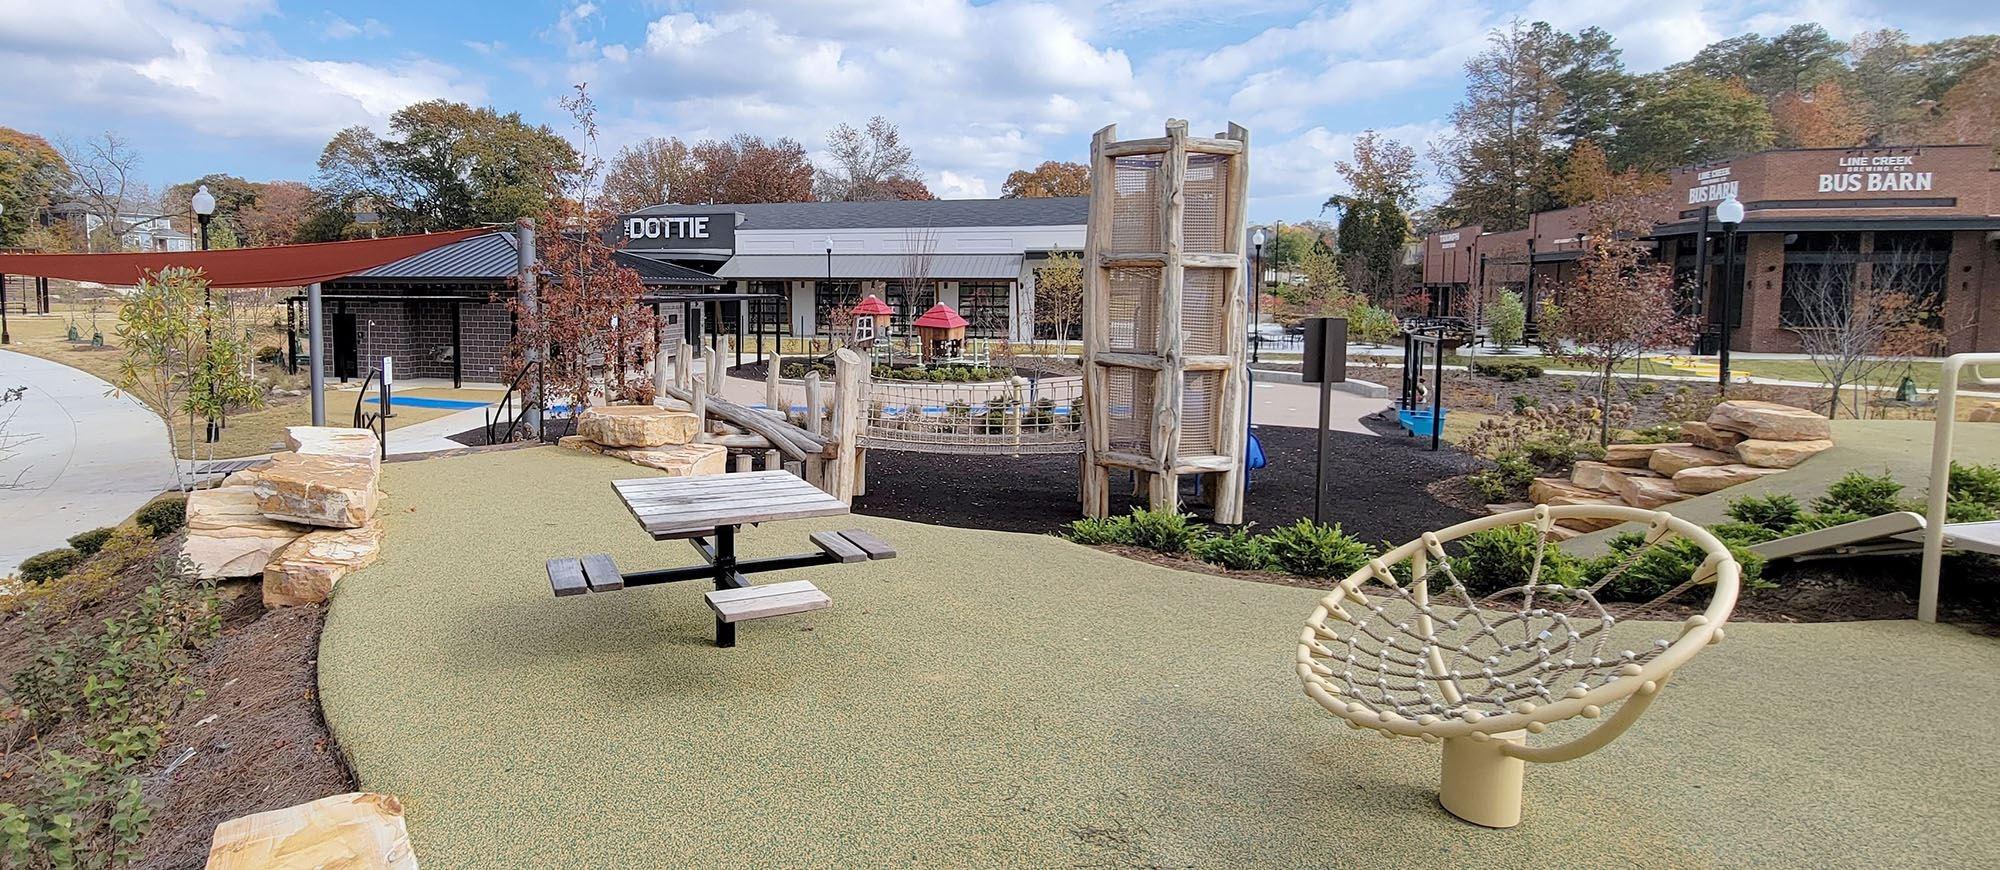
Land Use
Primary Uses
Playgrounds
Public parks
Nature preserves
Golf courses
Recreation centers
Pedestrian and/or bike trails
Dog parks
Pavilions
Amphitheaters and similar uses
Development Characteristics
Building Form Typically low rise recreation, maintenance and other support facilities
Mobility
Along all street types; Encourage safe and comfortable access by all modes of travel
Open Space Open space is the primary element
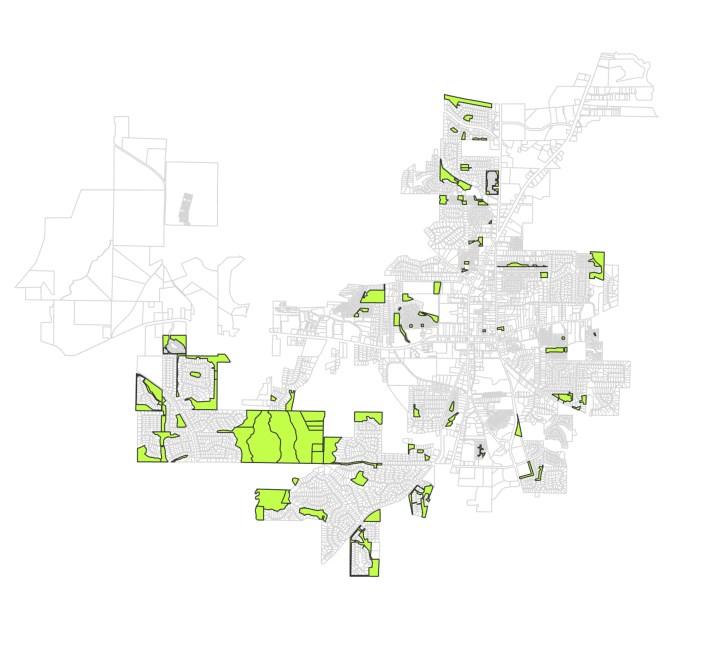
Business parks are located along or in close proximity to major corridors, the existing developments include offices, warehouse space, and light manufacturing . There are several acres of undeveloped land with this designation.
This category is for land dedicated to maximize the potential for job creation. This classification is for land dedicated to offices, research and development, healthcare and education. It will be supportive of other related uses such as hotels, restaurants, and small scale retail. Business park sites will typically be over five acres and master planned to have easy internal circulation in a planned campus atmosphere.
Business park sites will typically be over five acres and master planned to have easy internal circulation in a planned campus atmosphere.
Sites are clean, well landscaped, and heavily buffered.
In general, business park uses will not generate significant truck traffic.
New development should include appropriate landscaping and buffering elements including street trees, parking lot landscaping and perimeter screening.
Screening should be provided between incompatible land uses, especially residential uses.
Pedestrian connections should be established between developments and along roadways to improve the connectivity of the area.
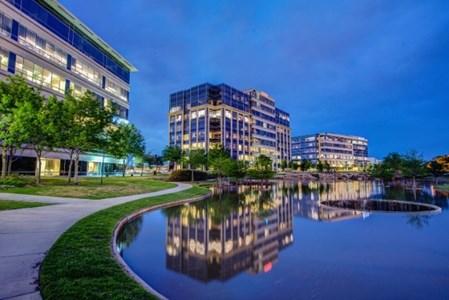
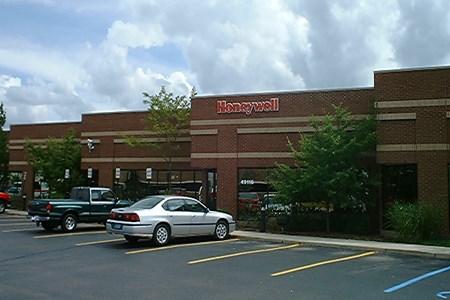
Land Use
Primary Uses
Development Characteristics
Building Form
Mobility
Architectural styles will vary, but site design will have a character similar to that of a college campus.
Encourage safe and comfortable access by all modes of travel and pleasant pedestrian connections between buildings
Open Space Significant greenspace is a key feature; many public and private spaces
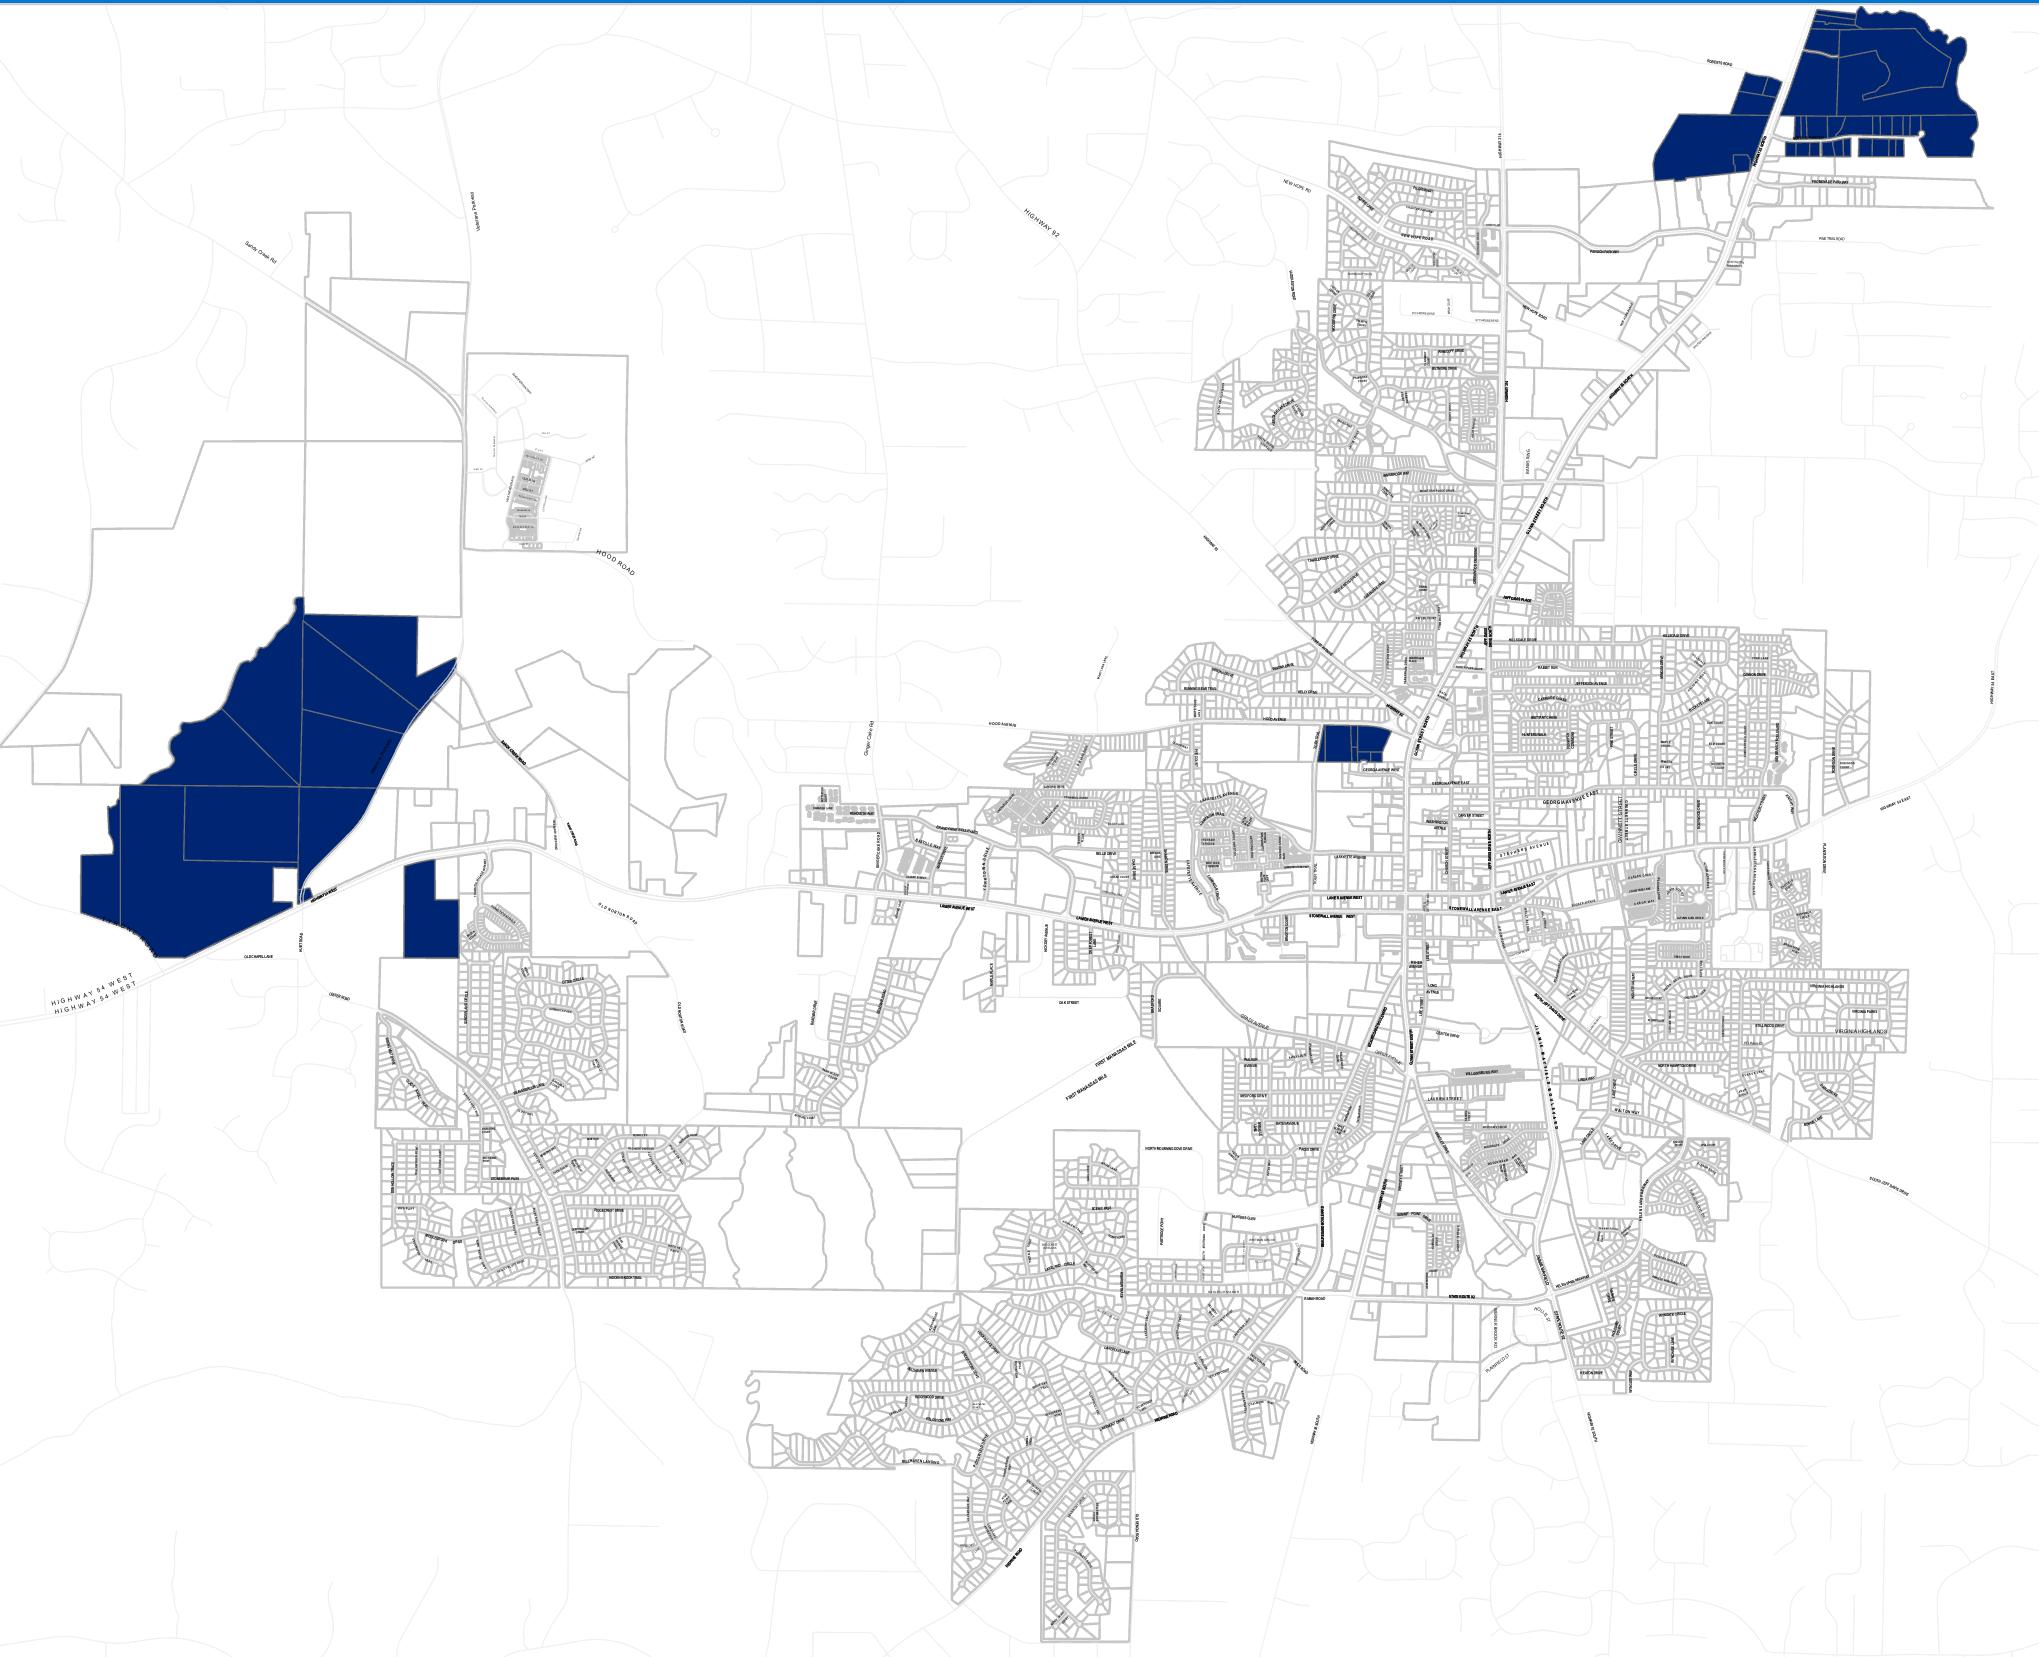
There are limited industrial areas within the city and most are fully occupied. The most recent development is located along Promenade Parkway.
Located to minimize impact on surrounding uses, the industrial classification is for land dedicated to manufacturing facilities, processing plants, factories, warehousing and wholesale trade facilities, and any other uses with significant truck traffic or any use that has detrimental visual (or other sensory) impact that cannot be concealed by its building and landscaping. Sites have a traditional industrial design and appearance.
Protect remaining industrial sites for signature opportunities.
New development should include appropriate landscaping and buffering elements including street trees, parking lot landscaping and perimeter screening
Land Use
Primary Uses
Primarily light manufacturing
Research & development
Warehousing
Distribution
Processing plants
Wholesale trade facilities
Recommended Zoning Light Industrial and Heavy Industrial
Development Characteristics
Building Form
Mobility
Open Space
Typical high-bay, single-story and large/ long manufacturing or warehousing buildings.
Encourage safe and comfortable access by all modes of travel
Improved open space is a key feature; many public and private spaces
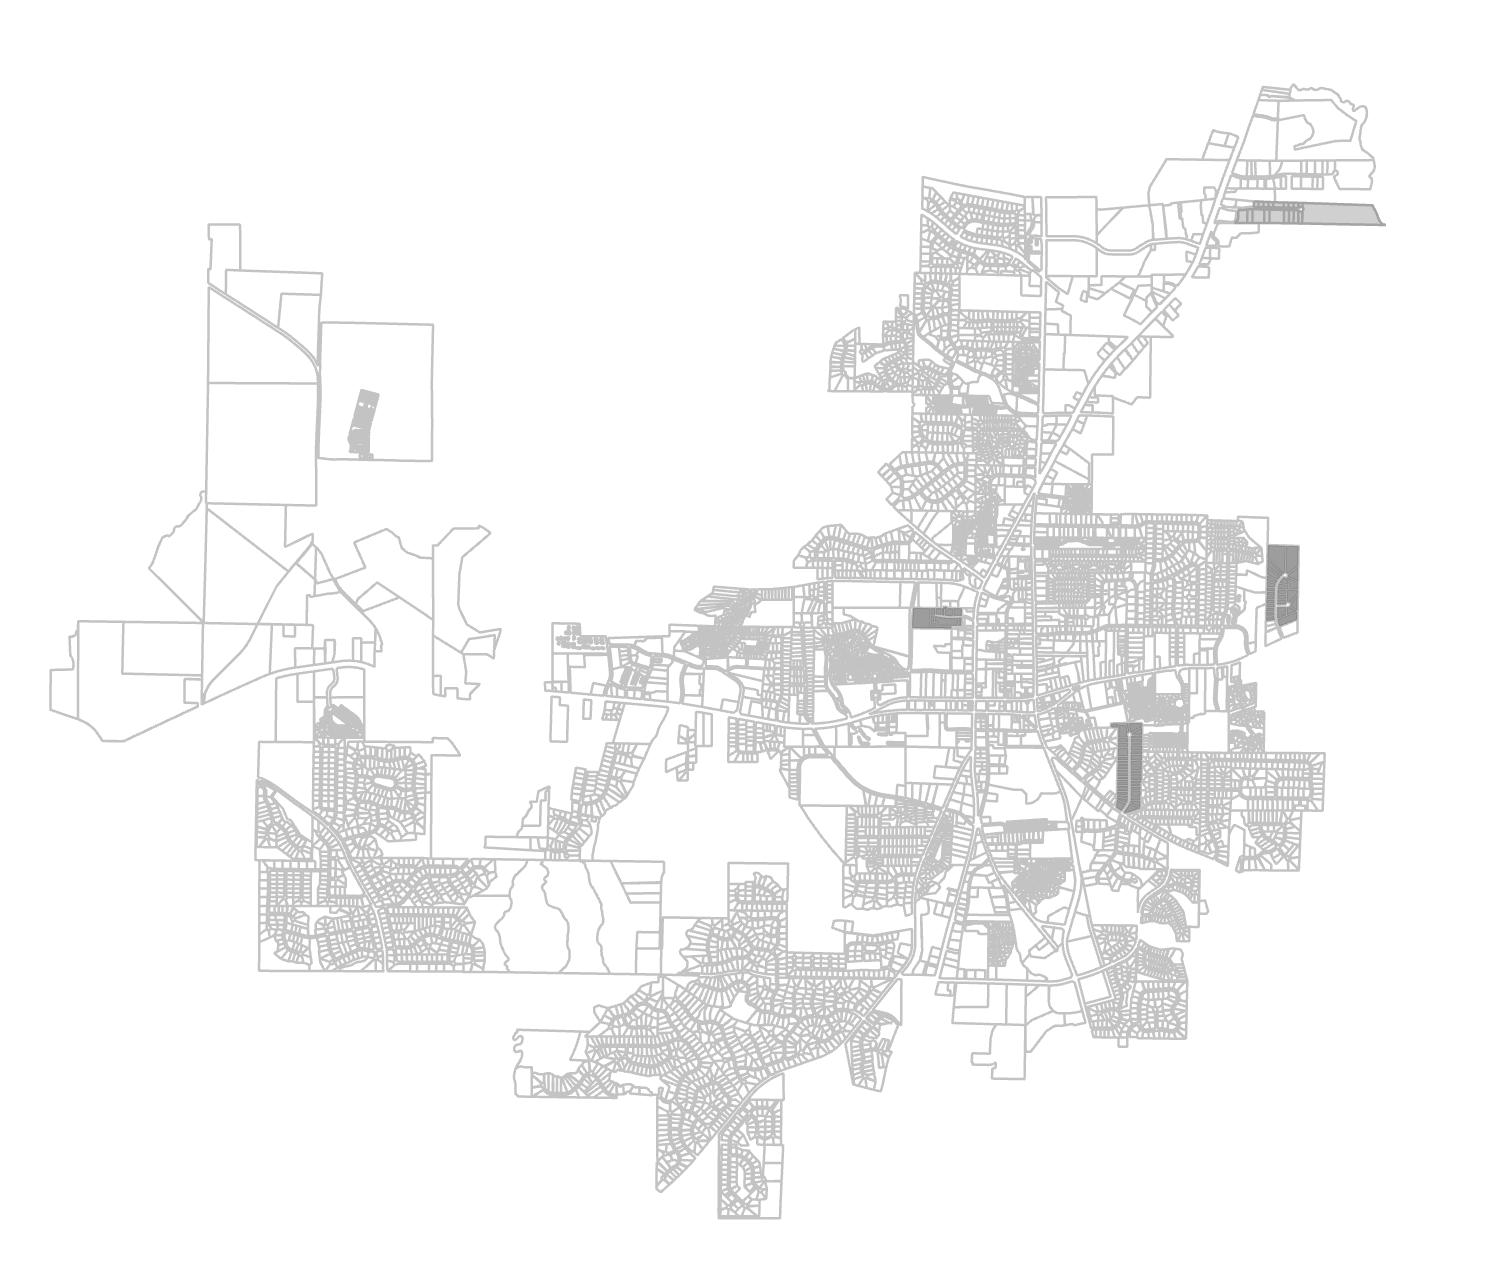
The Fayette County Public School System comprises 14 elementary, five middle, and five high schools, as well as an adult community school. Along with the administrative offices, there are three schools in the city limits.
This area allows for the location of public and non-profit institutions, and organizations that provide regular services to and for the general public. This includes certain state, federal, and/or local government and institutional land uses. These are ideally located in areas distributed throughout the city with emphasis being on proximity to residential areas and areas with intense population activity during the day. While most of these areas are generally envisioned solely for Public/Institutional use, there are times that these uses will be found in other appropriate character areas.
Key implementation strategies
Strategic open spaces should be provided throughout the district that provide both passive and active recreational opportunities which could include parks, common gathering spaces, and gardens.
New development within the district should include appropriate landscaping and buffering elements including street trees, parking lot landscaping and perimeter screening, and building perimeter landscaping.
Land Use
Primary Uses
Educational facilities
Churches
Cemeteries
Government uses such as city hall, government building complexes, public safety stations, libraries, post offices, community centers, senior centers, recycling collection centers, and recreation centers.
Recommended Zoning Create new zoning designation for areas.
Development Characteristics
Building Form
Mobility
Open Space
Primarily office and/or civic buildings
Encourage safe and comfortable access by all modes of travel
Improved open space is a key feature; many public and private spaces