BROWNSTONE
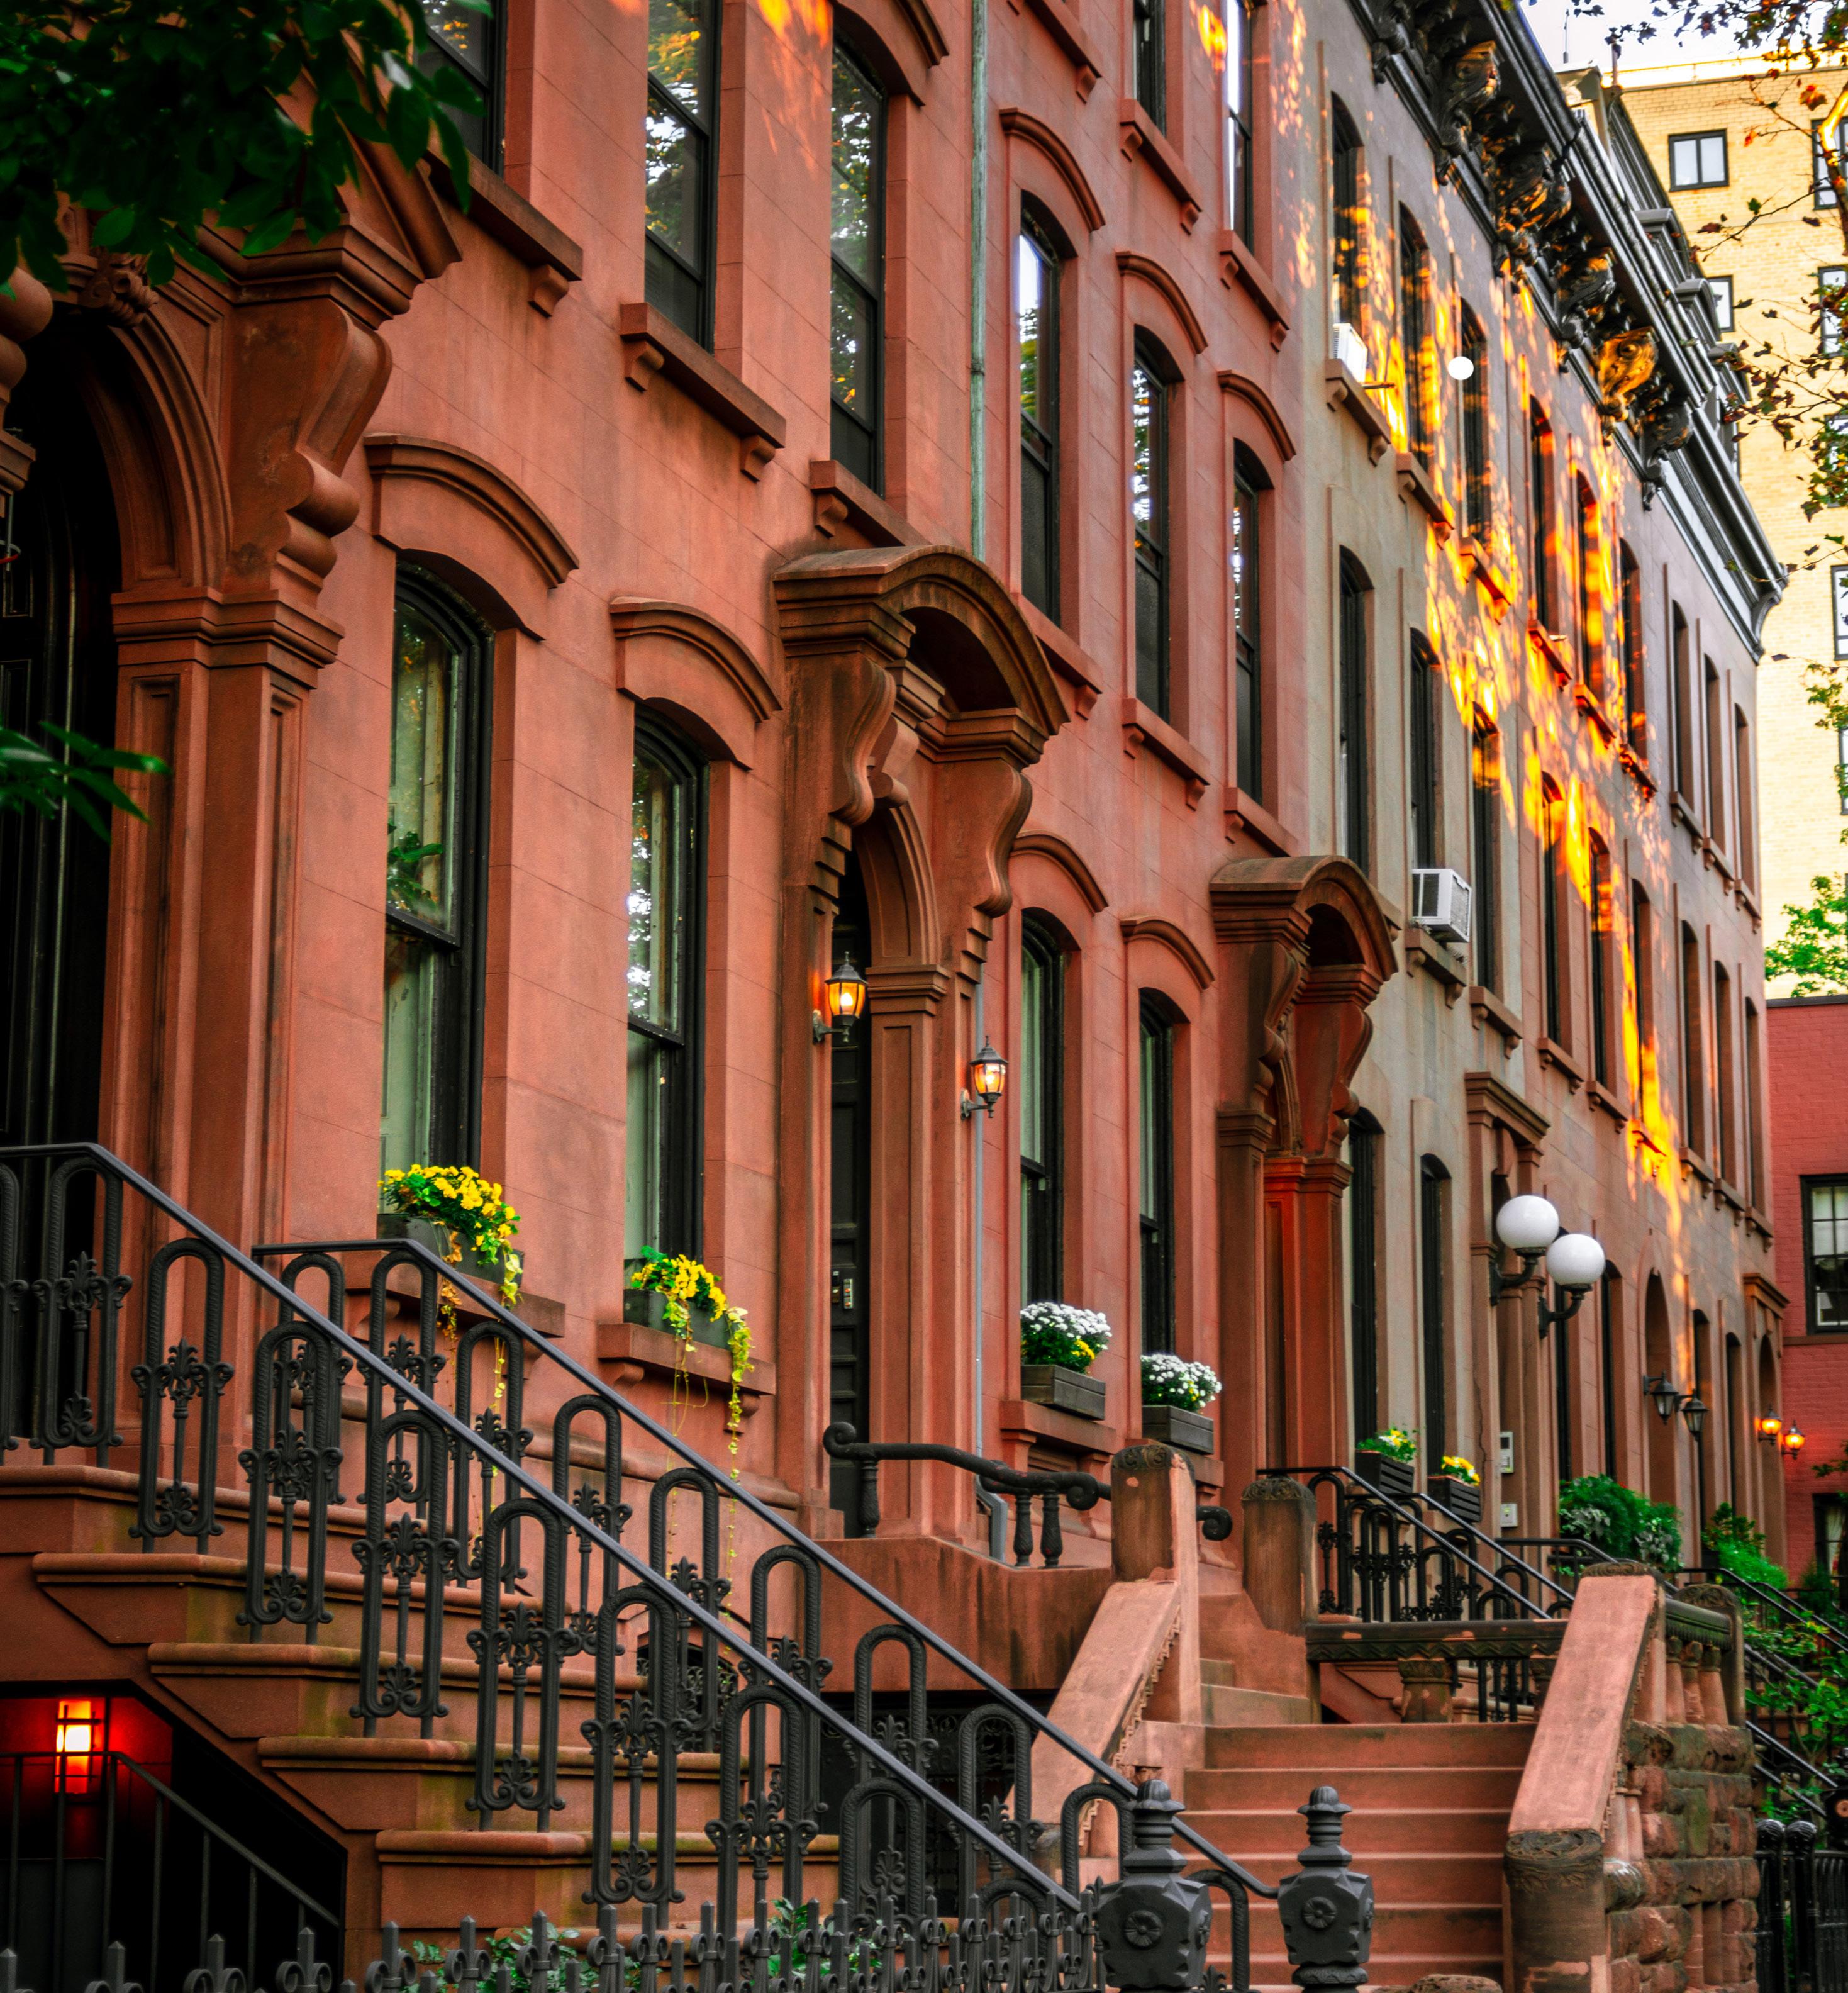



While townhouse transactions continued to rise in pricing and volume this quarter, condominiums started to show signs of cooling down. For townhouses, the average sales price broke $3MM and the average price per square foot passed $1,000 PSF, both record highs for Brownstone Brooklyn. For condominiums, pricing remained level with the prior quarter but far fewer deals were recorded this period.
Just over $753MM worth of 1- to 4-family townhouses traded hands in 3Q22, versus $790MM during 3Q21, a decrease of $37MM, or 4.6%. Over the same time frame, transaction volume, 237 sales, decreased by 18.6%, but experienced an increase from 213 in 2Q22. The average sales price moved up significantly, again, by 15.6% to $3.18MM, year-over-year, a new record. A market-wide overview and notable transactions appear on page 12 of this report.
Approximately $857MM worth of condominiums sold in 3Q22, versus $977MM during 3Q21, a significant decrease of $120MM, or 12.3%. Similarly, the number of transactions decreased, but to even a greater degree, 20.1%, year-over-year. The average sales price was -0.9% down from the record high in 2Q22, but still a 9.7% increase year-over-year. A market-wide overview and other notable condominium transactions appear on page 13 of this report.
In addition to this quarterly closed sales report, we track New to Market listings and In Contract deals on a weekly basis. Follow me on Instagram @donaldbrennan.trustedadvisor where I post this weekly report, along with other useful market observations and our exclusive listings. We also discuss these proprietary reports on our How’s The Market? video series, which is hosted on our Engel & Völkers Brownstone Brooklyn YouTube channel.
If you have a question about this report or if you need help understanding the value of your specific real estate holding, please don’t hesitate to contact me directly. My insights and advice are always complimentary.
P. Brennan, Jr.
License Partner | Real Estate
& Völkers Brownstone Brooklyn Brennan Realty Services, LLC 45 Main Street, Suite 824 Brooklyn, NY

(917)


Summary 4
Brooklyn Heights 5 Cobble Hill 6 Carroll Gardens 7 Columbia Street Waterfront District 8 Boerum Hill 9 Gowanus 10 Fort Greene 11 Clinton Hill 14 Prospect Heights 15 Park Slope 16 Bedford-Stuyvesant (West) 17 Bedford-Stuyvesant (East) 18 Downtown Brooklyn 19 Greenpoint 20 Williamsburg 21 DUMBO 22
The townhouse market saw 237 closed sales this period, an increase over 2Q22, but still off from 3Q21’s record high of 291 deals. For four straight quarters, the average Brooklyn townhouse has appreciated in price, where the average sales price is now over $3.1MM and the average PPSF over $1,000 PSF. The four-quarter trailing average is $965 PSF and over $2.7MM gross.
3Q22 %∆ (Qtr) 2Q22 %∆ (Yr) 3Q21
Average Sales Price $3,179,774 15.57% $2,751,354 17.12% $2,714,875
Average Price Per Sq Ft $1,062 7.72% $986 11.83% $950
Median Sales Price $2,695,000 13.55% $2,373,500 18.46% $2,275,000
Number of Sales 237 213 291
Millions)
$12.0
$6.0
$0.0
Transaction volume in the condominium market saw 526 recorded deals this quarter, which was lower levels from the prior quarter and this time last year but still a sign of a plentiful market. While average price metrics remained level on the quarter at $1.63MM and $1,386 PSF, both were up on the year by an average of 9%. The fourquarter trailing average is $1,360 PSF and under $1.6MM gross.
2020
3Q2022
$2000
$1500
$1000
$500
$2500 $2,500 $2,000 $1,500 $1,000 $500
$0
3Q22 %∆ (Qtr) 2Q22 %∆ (Yr) 3Q21
Average Sales Price $1,629,241 -0.88% $1,643,628 9.68% $1,485,429
Average Price Per Sq Ft $1,386 -1.99% $1,414 8.33% $1,279
Median Sales Price $1,400,000 2.41% $1,367,000 12.00% $1,250,000
Number of Sales 526
$1600
$2,000 $1,600
There were eight recorded townhouse sales this quarter, where half occurred over $12MM – a price echelon fit for their respective grandeur, views, and prime locations. As a result, average sales price was strongly positively skewed at just over $11MM, almost double from last quarter. Average PPSF was $2,324 PSF, which is also above typical levels in the neighborhood. The four-quarter trailing average is $1,852 PSF and over $7.67MM gross.
3Q22 %
(Qtr) 2Q22
(Yr) 3Q21
Average Sales Price $11,021,875 78.54% $6,173,333 55.95% $7,067,500
Average Price Per Sq Ft $2,324 27.92% $1,817 45.96% $1,592
Median Sales Price $10,500,000 62.79% $6,450,000 56.13% $6,725,000
Brooklyn Heights saw 24 condo deals close this period, predominantly split between the new development at One Clinton and resales at One Brooklyn Bridge Park, with sponsor units at Quay Tower coming in third. As these tended to be larger units like 3+ bedrooms, average sales price was higher this quarter at $2.87MM and average PPSF at $1,589 PSF. The four-quarter trailing average is $1,529 PSF and over $2.7MM gross.
Millions)
$3200
$2400
$0.0 $0
$4000$30.0 $24.0 $18.0 $12.0 $6.0 $0.0
$1600
$800
$4,000 $3,200 $2,400 $1,600 $800 $0
Number of Sales 8 9 10 3Q22 %∆ (Qtr) 2Q22 %
PPSF PRICE
(Yr) 3Q21
Average Sales Price $2,866,310 6.85% $2,682,585 17.01% $2,449,607
Average Price Per Sq Ft $1,589 5.43% $1,507 5.22% $1,510
Median Sales Price $2,475,000 5.32% $2,350,000 2.38% $2,417,500
Number of Sales 24 19 40
$2000
$1600
$1200
$2,000 $1,600 $1,200
$800
$400
$400
There were six townhouse transactions in Cobble Hill this quarter, all 1- to 2-family townhouses. Notably, two renovated 25’ wide single-family homes closed at $9.5MM and $9.36MM; and three other deals closed over $5.5MM. Unsurprisingly, average sales price was significantly up on the quarter to over $6.5MM. Average PPSF was also over 50% higher quarter-over-quarter. The fourquarter trailing average is $1,431 PSF and just over $5.02MM gross.
3Q22 %∆ (Qtr) 2Q22 %∆ (Yr) 3Q21
Average Sales Price $6,583,333 69.82% $3,876,667 34.28% $4,902,636
Average Price Per Sq Ft $1,798 54.90% $1,161 27.09% $1,415
Median Sales Price $5,980,000 99.33% $3,000,000 39.07% $4,300,000
Number of Sales 6
Millions)
Cobble Hill closed condo sales rose to 18 this third quarter. Apart from a $6.075MM floor-through duplex, the range of deals occurred between $455K and just under $4MM. Compared with the prior quarter and year, all pricing metrics were down. The four-quarter trailing average is $1,512 PSF and over $2.2MM gross.
3Q22 %
(Qtr) 2Q22 %
$2000
$1500
$1000
$500
$2500$9.0 $7.2 $5.4 $3.6 $1.8 $0.0
$0
$2,500 $2,000 $1,500 $1,000 $500 $0
(Yr) 3Q21
Average Sales Price $1,812,368 -6.98% $1,948,371 -1.84% $1,846,369
Average Price Per Sq Ft $1,356 -12.71% $1,553 -2.30% $1,388
Median Sales Price $1,482,500 -12.41% $1,692,500 15.15% $1,287,500
Number of Sales 18 14
$0.0.0
$1600
$1200
$2,000 $1,600 $1,200
$400
$400
$2000$8.0 $6.4 $4.8 $3.2 $1.6 $0.0
Carroll Gardens saw a huge period on the townhouse front at 18 recorded deals. Average sales price and PPSF continued its growth, now with average sales price over $4.2MM. Notably, a deal on Degraw Street closed at $9.635MM, while other transactions this quarter closed between $2.20MM and $6.25MM. The four-quarter trailing average is $1,218 PSF and just under $3.7MM gross.
3Q22 %∆ (Qtr) 2Q22 %∆ (Yr) 3Q21
Average Sales Price $4,267,333 17.24% $3,639,815 15.02% $3,710,033
Average Price Per Sq Ft $1,328 10.72% $1,200 -0.61% $1,336
Median Sales Price $3,912,500 6.83% $3,662,500 26.21% $3,100,000
Fourteen condo transactions closed in Carroll Gardens this quarter, almost twice as many as the prior quarter. Average sales price increased substantially from the prior quarter to $2.13MM, due to the volume of larger units like 3-bedrooms closing. Average PPSF also rose this quarter, and by a similar degree on the year at $1,458 PSF. The four-quarter trailing average is $1,325 PSF and just under $1.6MM gross.
$8.0
$6.0
$4.0
$2.0
$10.0 $0
$0.0
$2000
$1500
$1000
$500
$2500$10.0 $8.0 $6.0 $4.0 $2.0 $0.0
$2,500 $2,000 $1,500 $1,000 $500 $0
Number of Sales 18 12 15 3Q22 %∆ (Qtr) 2Q22 %∆ (Yr) 3Q21
Average Sales Price $2,132,286 82.98% $1,165,313 31.42% $1,622,462
Average Price Per Sq Ft $1,458 21.27% $1,202 23.62% $1,179
Median Sales Price $1,807,500 105.11% $881,250 39.04% $1,300,000
Number of Sales 14 8 13
$5.0
$4.0
$3.0
$2.0
$1.0
$0.0
$1600
$1200
$2,000 $1,600 $1,200
$800
$400
$400
$2000$5.0 $4.0 $3.0 $2.0 $1.0 $0.0
There were two townhouse transactions in CSWD this quarter. Average sales price was $2.90MM and average PPSF was $1,133 PSF. The four-quarter trailing average is $1,064 PSF and just under $2.6MM gross.
3Q22
(Qtr)
Average Sales Price $2,897,500 48.59% $1,950,000 8.83% $2,662,500
Average Price Per Sq Ft $1,133 22.35% $926 -21.15% $1,437
Median Sales Price $2,897,500 48.59% $1,950,000 8.83% $2,662,500
Number of Sales 2 1 2
Columbia Street Waterfront District saw almost twice as many condo transactions at 11 this quarter. Average sales price declined to $1.31MM, but average PPSF rose 1.28% on the quarter, pointing to smaller units trading. The four-quarter trailing average is $1,215 PSF and under $1.3MM gross.
$5.0
$4.0
$3.0
$2.0
$1.0
$5.0 $4.0 $3.0 $2.0 $1.0 $0.0
$0.0
3Q22 %
(Qtr) 2Q22 %
$2,000 $1,500 $1,000
(Yr) 3Q21
Average Sales Price $1,308,909 -6.67% $1,402,500 -12.70% $1,499,320
Average Price Per Sq Ft $1,255 1.28% $1,239 11.29% $1,128
Median Sales Price $1,400,000 -2.44% $1,435,000 -2.10% $1,430,000
Number of Sales
$3.75
$3.00
$2.25
$1.50
$0.75
$0.00
$3.75 $3.00 $2.25 $1.50 $0.75 $0.00
Boerum Hill continued to burgeon with activity this third quarter of 2022 with 10 recorded townhouse transactions. Average sales price was 40.52% above levels last quarter due to four deals around $5MM and one deal at $8.5MM. While average PPSF was significantly up on the quarter at $1,291 PSF, it was just under levels from this time last year. The four-quarter trailing average is $1,179 PSF and over $3.8MM gross.
3Q22 %∆ (Qtr) 2Q22 %∆ (Yr) 3Q21
Average Sales Price $4,586,521 40.52% $3,263,848 20.19% $3,816,077
Average Price Per Sq Ft $1,291 23.96% $1,042 -1.76% $1,314
Median Sales Price $4,400,000 32.61% $3,318,000 39.68% $3,150,000
Number of Sales 10 9 13
Millions)
Boerum Hill saw 19 condo transactions this third quarter, notably down from the prior quarter where the new development at 58 St Marks had volume pushing the project to 90% sold. Average sales price was down 10.58% on the quarter but was only marginally down on the year. The same was observed for average PPSF. The four-quarter trailing average is $1,453 PSF and just under $1.7MM gross.
$8.0
$6.0
$4.0
$2.0
$10.0 $0
$0.0
$10.0 $8.0 $6.0 $4.0 $2.0 $0.0
$2000
$1500
$1000
$500
$2500 $2,500 $2,000 $1,500 $1,000 $500 $0
3Q22 %∆ (Qtr) 2Q22 %∆ (Yr) 3Q21
Average Sales Price $1,560,398 -10.58% $1,744,982 -0.78% $1,572,714
Average Price Per Sq Ft $1,331 -11.92% $1,511 -1.41% $1,350
Median Sales Price $1,451,006 -6.39% $1,550,000 -6.08% $1,545,000
Number of Sales 19 111 31
$7.5
$4.5
$3.0
$1.5
$0.0
$1600
$1200
$2,000 $1,600 $1,200
$800
$400
$400
$2000$7.5 $6.0 $4.5 $3.0 $1.5 $0.0
Gowanus had only 5 townhouse transactions this quarter, versus 9 last quarter. Average sales price continued to decrease, now by 22.02% on the quarter, with average PPSF down by a larger degree. The slowdown was present on the year as well. The fourquarter trailing average is $1,079 PSF and under $2.2MM gross.
3Q22 %∆ (Qtr) 2Q22 %∆ (Yr) 3Q21
Average Sales Price $1,694,900 -22.02% $2,173,380 -35.66% $2,634,210
Average Price Per Sq Ft $798 -31.03% $1,157 -34.75% $1,223
Median Sales Price $1,300,000 -34.52% $1,985,300 -52.94% $2,762,500
Number of Sales 5 9 6
$5.0
(in Millions)
Gowanus saw only 9 condo transactions this quarter, coming down from last quarter’s influx of recorded new development condos. This quarter’s closed deals still had strong pricing, where average sales price was level on the quarter and average PPSF was up 11.41%. Both metrics rose significantly compared with levels from the prior year. The four-quarter trailing average is $1,289 PSF and over $1.4MM gross.
$4.0
$3.0
$2.0
$1.0
$0.0
$4.0 $3.0 $2.0 $1.0 $0.0
2020
$2,500 $2,000 $1,500 $1,000 $500
3Q
3Q22 %∆ (Qtr) 2Q22 %∆ (Yr) 3Q21
Average Sales Price $1,562,222 -0.92% $1,576,750 47.36% $1,060,126
Average Price Per Sq Ft $1,436 11.41% $1,289 27.98% $1,122
Median Sales Price $1,310,000 -5.00% $1,379,000 20.18% $1,090,000
Number of Sales 9 13
Millions)
$5.0
$4.0
$3.0
$2.0
$1.0
$0.0
$5.0 $4.0 $3.0 $2.0 $1.0 $0.0
$2,000 $1,600 $1,200
$400
Fort Greene had almost twice as many closed deals this quarter at 9 than the prior quarter. While the neighborhood saw a resurgence in activity and pricing this quarter compared with the prior quarter, it was still level, if not underperforming, from the prior year. Average PPSF was $1,124 PSF. The four-quarter trailing average is $1,028 PSF and just over $3.0MM gross.
3Q22 %∆ (Qtr) 2Q22 %∆ (Yr) 3Q21
Average Sales Price $3,652,153 34.82% $2,709,000 2.15% $3,575,208
Average Price Per Sq Ft $1,124 13.43% $991 -1.15% $1,137
Median Sales Price $3,250,000 13.04% $2,875,000 -7.47% $3,512,500
Number of Sales 9 5 12
$7.5
Fort Greene saw an impressive 17 condo transactions this quarter, a mark of continued activity. The two average price metrics rose on both periods, now to $1.25MM and $1,200 PSF. Notable sales include five transactions at the loft conversion at One Hanson Place, whose tax abatement is expiring in 2024. The four-quarter trailing average is $1,173 PSF and under $1.3MM gross.
$6.0
$4.5
$3.0
$1.5
$0.0
$6.0 $4.5 $3.0 $1.5 $0.0
$2000
$1500
$1000
$2,500$2500 $2,000 $1,500 $1,000 $500
$500
$0
3Q22 %∆ (Qtr) 2Q22 %∆ (Yr) 3Q21
Average Sales Price $1,251,441 8.35% $1,155,017 11.26% $1,124,808
Average Price Per Sq Ft $1,200 13.63% $1,056 11.09% $1,080
Median Sales Price $1,287,500 37.77% $934,500 31.38% $980,000
Number of Sales 17
$1600
$1200
$2000 $2,000 $1,600 $1,200
$800
Market*
Average Price Per Sq Ft Average Sales Price
of Total
Brooklyn Heights $2,324 $11,021,875 4,919 509 $88,175,000 8 3%
Cobble Hill $1,798 $6,583,333 3,742 987 $39,500,000 6 3%
Boerum Hill $1,291 $4,586,521 3,539 810 $45,865,210 10 4%
Prospect Heights $1,286 $4,294,171 3,358 925 $34,353,366 8 3%
Carroll Gardens $1,328 $4,267,333 3,234 1,461 $76,812,000 18 8%
Fort Greene $1,124 $3,652,153 3,222 1,260 $32,869,375 9 4%
Clinton Hill $1,213 $3,551,667 3,032 1,376 $42,620,000 12 5%
Park Slope $1,285 $3,386,194 2,781 5,588 $121,903,000 36 15%
Columbia Water District $1,133 $2,897,500 2,543 204 $5,795,000 2 1%
Williamsburg $1,137 $2,868,499 2,571 3,099 $57,369,986 20 8%
Greenpoint $1,052 $2,725,875 2,636 2,199 $32,710,500 12 5%
Bedford Stuyvesant (West) $742 $2,157,500 2,999 4,397 $79,827,495 37 16%
Gowanus $798 $1,694,900 2,118 984 $8,474,500 5 2%
Bedford Stuyvesant (East) $654 $1,617,239 2,514 6,863 $87,330,889 54 23%
Downtown Brooklyn - - - 75 - - 0%
DUMBO - - - 4 - - 0%
$1,062 $3,179,774
* Ranked by “Average Sales Price”
Price Square
$18,300,000
$17,000,000
$15,100,000
$12,250,000
Price Square
$17,000,000 5,024 $3,384
$15,100,000 4,576 $3,300
$9,500,000 3,253 $2,920
$3,775,000 1,325 $2,849
$18,300,000 8,282 $2,210
Market*
DUMBO $1,667 $2,205,914 1,306 1,266 $101,472,030 46 9%
Brooklyn Heights $1,589 $2,866,310 1,777 950 $68,791,431 24 5%
Downtown Brooklyn $1,586 $1,726,207 1,066 1,742 $103,572,420 60 11%
Carroll Gardens $1,458 $2,132,286 1,512 733 $29,852,000 14 3%
Gowanus $1,436 $1,562,222 1,085 610 $14,060,000 9 2%
Park Slope $1,428 $1,874,104 1,293 3,017 $123,690,878 66 13%
Williamsburg $1,422 $1,473,243 1,047 9,805 $154,690,500 105 20%
Cobble Hill $1,356 $1,812,368 1,276 669 $32,622,622 18 3%
Prospect Heights $1,352 $1,587,326 1,174 1,544 $36,508,500 23 4%
Boerum Hill $1,331 $1,560,398 1,160 907 $29,647,568 19 4%
Greenpoint $1,317 $1,271,235 969 1,313 $43,222,000 34 7%
Columbia Water District $1,255 $1,308,909 1,031 746 $14,398,000 11 2%
Fort Greene $1,200 $1,251,441 1,042 879 $21,274,500 17 3%
Clinton Hill $1,173 $1,294,510 1,102 1,064 $25,890,206 20 4%
Bedford Stuyvesant (West) $949 $967,698 1,065 2,675 $37,740,221 39 7%
Bedford Stuyvesant (East) $905 $841,343 954 450 $14,302,826 17 3%
ALL $1,386 $1,629,241 1,160 28,370 $856,980,702 526 100%
All materials presented herein are prepared by Brennan Realty Services LLC, and are intended for informational purposes only. While this information is believed to be correct, it is represented subject to errors, omissions, changes, or withdrawal without notice. Property information was gathered through StreetEasyTM, PropertySharkTM, NYC.gov, and other sources deemed reliable. Methodology subject to change.
Clinton Hill saw 12 townhouse transactions this quarter. Average sales price saw strong increases on both periods, but by over 50% on the year. Average PPSF was 20.87% up on the quarter, and even more so on the year. The four-quarter trailing average is $1,034 PSF and just under $3.0MM gross.
3Q22
Average Sales Price $3,551,667 20.56% $2,946,000 52.89% $2,323,077
Average Price Per Sq Ft $1,213 20.87% $1,003 39.38% $870
Median Sales Price $3,477,500 29.28% $2,690,000 41.94% $2,450,000
Number of Sales 12
(in Millions)
There were 20 condo transactions this quarter in Clinton Hill. Average sales price rose by 8.08% on the quarter and was up by a lesser degree on the year. Average PPSF decreased by less than 2% on the quarter but was still up on the year. The four-quarter trailing average is $1,165 PSF and just over $1.2MM gross.
$7.5
$6.0
$4.5
$3.0
$1.5
$0.0
$7.5 $6.0 $4.5 $3.0 $1.5 $0.0
%
(Qtr) 2Q22 %
$2000
$1500
$1000
$500
$0
$2500 $2,500 $2,000 $1,500 $1,000 $500 $0
(Yr) 3Q21
Average Sales Price $1,294,510 8.08% $1,197,767 4.59% $1,237,750
Average Price Per Sq Ft $1,173 -1.95% $1,196 7.30% $1,093
Median Sales Price $1,272,500 10.65% $1,150,000 6.04% $1,200,000
Number of Sales 20
$3.75
$3.00
$2.25
$1.50
$0.75
$0.00
$1600
$1200
$800
$400
$2000$3.75 $3.00 $2.25 $1.50 $0.75 $0.0
$0
$2,000 $1,600 $1,200 $ 800 $0
There were another 8 townhouse transactions this quarter in Prospect Heights. This set of homes was predominantly tastefully renovated two-families, so while transaction volume remained constant, average sales price rose to $4.29MM, a new record high for the neighborhood. Average PPSF increased to $1,286 PSF, another record high. The four-quarter trailing average is $1,172 PSF and just over $3.5MM gross.
3Q22 %∆ (Qtr) 2Q22 %∆ (Yr) 3Q21
Average Sales Price $4,294,171 22.30% $3,511,314 46.31% $2,935,000
Average Price Per Sq Ft $1,286 14.44% $1,123 4.75% $1,227
Median Sales Price $4,701,875 47.64% $3,184,750 56.73% $3,000,000
Number of Sales 8 8 8
Prospect Heights saw 23 condo transactions this quarter, still strong numbers for the neighborhood but less volume than what was seen earlier this year. Average sales price increased for another quarter, now to $1.59MM due to larger units (2- and 3-bedrooms) trading. Average PPSF rose to $1,352 PSF. The four-quarter trailing average is $1,302 PSF and over $1.5MM gross.
$7.5
$6.0
$4.5
$3.0
$1.5
$0.0
$7.5 $6.0 $4.5 $3.0 $1.5 $0.0
3Q
$2000
$1500
$1000
$500
$2500 $2,500 $2,000 $1,500 $1,000 $500 $0
3Q22 %∆ (Qtr) 2Q22 %∆ (Yr) 3Q21
Average Sales Price $1,587,326 12.57% $1,410,083 -0.01% $1,587,526
Average Price Per Sq Ft $1,352 6.06% $1,275 5.69% $1,280
Median Sales Price $1,475,000 12.81% $1,307,500 -4.53% $1,545,000
Number of Sales 23 30
$4.8
$3.6
$2.4
$1.2
$0.0
$6.0 $3.6 $0.0
$1600
$1200
$2000 $2,000 $1,600 $1,200
$800
$400
$400
Park Slope had a third straight 36 recorded townhouse deals this quarter. Average sales price was level on the last quarter, but slightly up on the year. With that said, average PPSF at $1,285 PSF was significantly up on both periods we measure. The fourquarter trailing average is $1,139 PSF and over $3.2MM gross.
3Q22 %∆ (Qtr) 2Q22 %∆ (Yr) 3Q21
Average Sales Price $3,386,194 0.93% $3,354,981 2.81% $3,293,672
Average Price Per Sq Ft $1,285 13.65% $1,130 15.22% $1,115
Median Sales Price $3,437,500 11.34% $3,087,500 14.58% $3,000,000
Park Slope saw 66 condo transactions this third quarter, a continued rise in volume over the last quarter; however, the bulk of the deals did not occur at the new development project at One Prospect Park West like last quarter. As such, average sales price dropped on the quarter but was still up on the year at $1.87MM. Average PPSF saw similar movements, now at $1,428 PSF. The four-quarter trailing average is $1,421 PSF and over $1.8MM gross.
$20.0
$16.0
$12.0
$8.0
$4.0
$0.0
$2000
$1500
$1000
$500
$0
$2500 $2,500 $2,000 $1,500 $1,000 $500 $0
Number of Sales 36 36 60 3Q22 %∆ (Qtr) 2Q22 %∆ (Yr) 3Q21
PPSF PRICE
Average Sales Price $1,874,104 -9.17% $2,063,378 24.74% $1,502,435
Average Price Per Sq Ft $1,428 -5.14% $1,506 9.96% $1,299
Median Sales Price $1,592,000 -6.90% $1,710,000 9.79% $1,450,000
Number of Sales 66 61
Millions)
$6.0 $7.5
$4.5
$3.0
$1.5
$0.0
$7.5 $4.5 $3.0 $1.5 $0.0
There were 37 townhouse transactions in Bedford-Stuyvesant West this third quarter of 2022, a strong increase over the prior period. Average sales price continued to increase, now by 21.85% on the year, to $2.16MM. Average PPSF was marginally down on the quarter but still up on the year at $742 PSF. The four-quarter trailing average is $729 PSF and just over $1.96MM gross.
3Q22 %∆ (Qtr) 2Q22 %∆ (Yr) 3Q21
Average Sales Price $2,157,500 15.57% $1,866,833 21.85% $1,770,585
Average Price Per Sq Ft $742 -0.76% $748 12.99% $657
Median Sales Price $2,100,000 21.92% $1,722,500 31.75% $1,593,969
Number of Sales 37 28 52
Millions)
Condo transaction volume in BedfordStuyvesant West increased this quarter to 39. While volume picked up, the homes on average were smaller in size, higher on PPSF, but lower on gross sales price measured against the last quarter and year. Average sales price came down slightly to $967K from last quarter. The four-quarter trailing average is $888 PSF and just over $967K gross.
$6.0
$4.5
$3.0
$1.5
$0.0
$7.5 $0
$7.5 $6.0 $4.5 $3.0 $1.5 $0.0
$2000
$1500
$1000
$500
$2500 $2,500 $2,000 $1,500 $1,000 $500 $0
3Q22 %∆ (Qtr) 2Q22 %∆ (Yr) 3Q21
Average Sales Price $967,698 -1.34% $980,880 -1.89% $986,369
Average Price Per Sq Ft $949 4.53% $908 13.86% $834
Median Sales Price $878,000 -3.38% $908,700 -1.35% $890,000
Number of Sales 39 31 59
$3.75 $3.00 $2.25 $1.50 $0.75 $0.0
$2000 $2,000 $1,600
$1600
$1200
Bedford-Stuyvesant East had a bustling quarter with 54 townhouses closing. Average sales price remained relatively level with the prior quarter, but average PPSF was up by almost 6%. The neighborhood saw price appreciation for both metrics over the past year. The four-quarter trailing average is $624 PSF and just under $1.6MM gross.
3Q22
(Qtr)
(Yr)
Average Sales Price $1,617,239 -0.87% $1,631,352 5.02% $1,539,910
Average Price Per Sq Ft $654 5.58% $620 9.22% $599
Median Sales Price $1,700,000 13.33% $1,500,000 14.29% $1,487,500
Number of Sales
$3.75 $3.0 $2.25 $1.50 $0.75 $0.0
Bedford-Stuyvesant East had 17 condo transactions this third quarter. Average sales price increased 8.75% quarter-over-quarter to reach $841K, a level unseen since 2Q18. Average PPSF broke the $900 PSF barrier for the first time, penciling in at $905K this quarter. The four-quarter trailing average is $885 PSF and just under $790K gross.
%
(Qtr) 2Q22 %
$1200
$900
$600
$300
$1,500 $1,200 $900 $600 $300
(Yr) 3Q21
Average Sales Price $841,343 8.75% $773,658 13.58% $740,755
Average Price Per Sq Ft $905 4.06% $870 5.47%
Median Sales Price $900,000
of Sales
$2.0
$2.0
$820,000 18.58% $759,000
$1.2
$1.2 $1.8 $0.4 $0.0
There were no townhouse transactions in Downtown Brooklyn this quarter. The fourquarter trailing average is $765 PSF and over $3.6MM gross.
3Q22
(Qtr) 2Q22
(Yr) 3Q21
Average Sales Price - - - - $2,700,000
Average Price Per Sq Ft $748
Median Sales Price - - - - $2,700,000
Downtown Brooklyn saw 60 closed deals recorded this quarter, a majority belonging, again, to the two new development condo buildings at 11 Hoyt and Brooklyn Point. As these skewed towards larger units, average sales price moved up 10.89% on the quarter to $1.73MM. Average PPSF moved up 6.05% to $1,586 PSF. The four-quarter trailing average is $1,495 PSF and just over $1.5MM gross.
(in Millions)
$8.0
$4.8
$3.2
$1.6
$6.4
$0.0
$8.0 $6.4 $4.8 $3.2 $1.6 $0.0
(Qtr) 2Q22 %
$2,500 $2,000 $1,500 $1,000 $500 $0
Number of Sales 0 0 1 3Q22 %
(Yr) 3Q21
Average Sales Price $1,726,207 10.89% $1,556,739 16.50% $1,481,679
Average Price Per Sq Ft $1,586 6.05% $1,496 7.70% $1,473
Median Sales Price $1,449,729 7.09% $1,353,727 9.41% $1,325,000
Number of Sales 60 98 123
Greenpoint saw a sharp decline in townhouse transactions this quarter to 12; however, the homes that did find buyers had pricing on par with the prior quarter, and more notably above levels from the prior year. The fourquarter trailing average is $982 PSF and just over $2.5MM gross.
3Q22 %
(Qtr) 2Q22 %
(Yr) 3Q21
Average Sales Price $2,725,875 -0.03% $2,726,629 48.75% $1,832,500
Average Price Per Sq Ft $1,052 -2.99% $1,085 38.29% $761
Median Sales Price $2,562,500 7.96% $2,373,500 37.03% $1,870,000
The third quarter in Greenpoint saw 34 condo transactions, the most recorded since 3Q19. While average sales price rose on the quarter by 10.99%, it was marginally down on the year. Average PPSF at $1,317 PSF was level with the prior quarter, but up 4.11% on the year. The four-quarter trailing average is $1,323 PSF and just over $1.2MM gross.
$7.5
$6.0
$4.5
$3.0
$1.5
$7.5 $6.0 $4.5 $3.0 $1.5 $0.0
$2000
$1500
Number of Sales 12 25 18 $0.0
Median Sales Price $1,325,000
Number of Sales
$1000
$500
$2500 $2,500 $2,000 $1,500 $1,000 $500 $0
PPSF PRICE 2022 1Q
$0
Average Sales Price $1,271,235 10.99% $1,145,394 -1.97% $1,296,789
Average Price Per Sq Ft $1,317 -0.01% $1,318 4.11% $1,265
$1600
$1200
$2000 $2,000 $1,600 $1,200
Williamsburg saw 20 townhouse transactions this quarter, a steady increase over the prior quarter. Notably, the homes that traded this quarter were smaller but pricier on average, which translates to a higher average sales price of $2.87MM, and a higher average PPSF of $1,137 PSF for the neighborhood. The four-quarter trailing average is $940 PSF and under $2.4MM gross.
3Q22 %∆ (Qtr) 2Q22 %∆ (Yr) 3Q21
Average Sales Price $2,868,499 25.02% $2,294,357 48.88% $1,926,704
Average Price Per Sq Ft $1,137 24.83% $911 37.63% $826
Median Sales Price $2,745,500 17.49% $2,336,750 48.41% $1,850,000
Number of Sales 20 18 24
Williamsburg saw 105 condo transactions this quarter, an uptick over the last quarter but still down from this time last year. Average sales price dropped 2.10% on the quarter but was 1.54% up on the year. Whereas average PPSF was up on both periods, notably on the year. The fourquarter trailing average is $1,370 PSF and just under $1.5MM gross.
$7.5
$6.0
$4.5
$3.0
$1.5
$0.0
$7.5 $6.0 $4.5 $3.0 $1.5 $0.0
$2000
$1500
$1000
$500
$0
$2500 $2,500 $2,000 $1,500 $1,000 $500 $0
3Q22 %∆ (Qtr) 2Q22 %∆ (Yr) 3Q21
Average Sales Price $1,473,243 -2.10% $1,504,864 1.54% $1,450,837
Average Price Per Sq Ft $1,422 3.32% $1,377 8.42% $1,312
Median Sales Price $1,350,000 2.35% $1,319,000 8.00% $1,250,000
Number of Sales 105
150
$7.5 $6.0 $4.5 $1.5
$3.0
$0.0
$1600
$1200
$2000 $2,000 $1,600 $1,200
$800
$400
There were half as many condo transactions this quarter at 46 in DUMBO. The slumping activity relates to the two new development buildings (98 Front St and Front & York) nearing the end of their sales effort, with fewer, and often larger, remaining units to sell. Average sales price rose to just over $2.2MM, and average PPSF rose to $1,667 PSF. The four-quarter trailing average is $1,590 PSF and just over $2.0MM gross.
3Q22
(Qtr)
Average Sales Price $2,205,914 12.55% $1,959,929 9.07% $2,022,402
Average Price Per Sq Ft $1,667 3.39% $1,613 24.45% $1,340
Median Sales Price $2,137,500 16.72% $1,831,250 28.77% $1,660,000
Number of Sales 46 98 22
$20.0 $16.0 $12.0
$1600
$1200
$2,000 $1,600 $1,200
$800
PPSF PRICE$400
$400
Engel & Völkers Brownstone Brooklyn agents are your local experts—attuned to the fluctuating Brooklyn and Manhattan real estate markets. Let us provide you with a comprehensive and up-to-date complimentary valuation of your property, or a property that you are interested in acquiring. Simply call or email Donald using the contact information noted below.
From representing residential buyers and sellers in re-sales and new development (townhouses, condos and co-ops), to landlords and renters of multi-family properties, Engel & Völkers Brownstone Brooklyn is a respected and trusted advisor. Advocacy is central to everything we do. No matter what your goals are, our team has decades of experience to help you reach them.
This report was created with contributions from Engel & Völkers Brownstone Brooklyn team members Kyle Gregory and Peyton Yen.
Donald P. Brennan, Jr.
License Partner | Real Estate Broker
Engel & Völkers Brownstone Brooklyn Brennan Realty Services, LLC 45 Main Street, Suite 824 Brooklyn, NY 11201
Email: donald.brennan@evrealestate.com Cell: (917) 568-6525 Web: brownstonebrooklyn.evrealestate.com
Gardens
Hill Park Slope
Stuyvesant
B R OO K LYN@EVBrownstoneBrooklyn Cover Photo by Harry Patsourakos