5 Minute Data Logging Activities
DO239 (2)
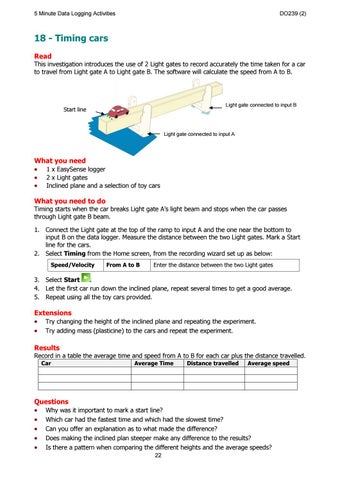
18 - Timing cars Read This investigation introduces the use of 2 Light gates to record accurately the time taken for a car to travel from Light gate A to Light gate B. The software will calculate the speed from A to B.
Light gate connected to input B
Start line
Light gate connected to input A
What you need 1 x EasySense logger 2 x Light gates Inclined plane and a selection of toy cars What you need to do
Timing starts when the car breaks Light gate A’s light beam and stops when the car passes through Light gate B beam. 1. Connect the Light gate at the top of the ramp to input A and the one near the bottom to input B on the data logger. Measure the distance between the two Light gates. Mark a Start line for the cars. 2. Select Timing from the Home screen, from the recording wizard set up as below: Speed/Velocity
From A to B
Enter the distance between the two Light gates
3. Select Start . 4. Let the first car run down the inclined plane, repeat several times to get a good average. 5. Repeat using all the toy cars provided.
Extensions Try changing the height of the inclined plane and repeating the experiment. Try adding mass (plasticine) to the cars and repeat the experiment. Results Record in a table the average time and speed from A to B for each car plus the distance travelled. Car
Average Time
Distance travelled
Average speed
Questions Why was it important to mark a start line? Which car had the fastest time and which had the slowest time? Can you offer an explanation as to what made the difference? Does making the inclined plan steeper make any difference to the results? Is there a pattern when comparing the different heights and the average speeds? 22