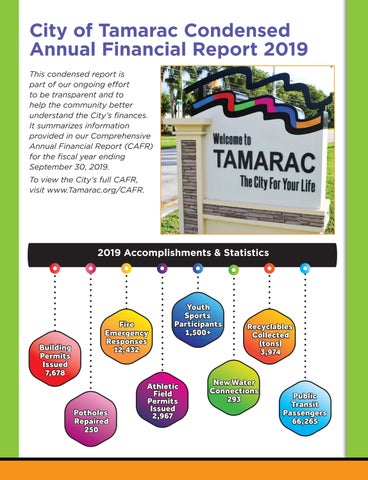
City of Tamarac Condensed Annual Financial Report 2019
This condensed report is part of our ongoing effort to be transparent and to help the community better understand the City’s finances. It summarizes information provided in our Comprehensive Annual Financial Report (CAFR) for the fiscal year ending September 30, 2019.
To view the City’s full CAFR, visit www.Tamarac.org/CAFR.

2019 Accomplishments & Statistics
Statement of Net Position (in millions)
This provides a picture of the City’s assets, liabilities and deferred inflows/outflows of resources, with the difference reported as “net” position. Over time, increases or decreases may serve as a useful indicator of whether the City’s financial position is improving or deteriorating. For fiscal year 2019, the City’s net position increased by $26.4 million to $317.6 million. The following is a Comparative Statement of Net Position at September 30, 2019 and 2018 (in millions).
Current and Other Assets - Includes cash, investments, receivables and inventory that can be converted to cash within one year.
Capital Assets - Long-term investments in land, buildings, equipment, infrastructure improvements and construction-in-progress.
Current Liabilities - Debts that can be paid off in one year or less, such as accounts payable, accrued payroll and compensated absences.
Long-term Liabilities - Represents mainly debt obligations of the City.
Deferred Outflows of Resources - A consumption of net position by the government that is applicable to a future reporting period.
Deferred Inflows of Resources - An acquisition of net position by the government that is applicable to a future reporting period.
Net Position - Difference between total assets and total liabilities.
Revenues - Income from charges for purchases, use or benefit from goods or services.
Expenses - Money spent or costs incurred through the City’s operations.
Condensed Statement of Activities (in millions)
The City’s revenues exceeded its expenses by $26.4 million in fiscal year 2019. Citywide revenues increased by $4 million; mostly due to an increase in tax revenues, charges for services, and grants. Total expenditures increased by $1.2 million from fiscal year 2019, mostly due to increases in public safety costs, transportation costs and economic environment.
(decrease) in net position
1 (as restated)

Governmental Funds
Funds typically used to account for tax-supported governmental activities. The City’s major Governmental Funds are the General Fund, Fire Rescue Fund and Capital Project Funds.
Where the money comes from: REVENUES
FY19 Total $91.5 million
Where the money goes: EXPENDITURES
FY19 Total $73.6 million
General Fund
The City’s primary operating fund. It is used to account for all financial resources except those required to be accounted for in another fund. These activities are funded principally by property taxes from individuals and businesses, and charges for services.
General Fund Revenues
General Fund revenues for fiscal year 2019 totaled $64.5 million (excluding transfers), a 5.2% increase from fiscal year 2018.
General Fund Expenditures
General Fund expenditures increased by $3.4 million (excluding transfers) from $43.2 million in fiscal year 2018 to $46.6 million in fiscal year 2019.
,807,871 14,398,457 19,458,490 1,569,157 5,040,528 4,561,415 584,583 357,425 635,119 14,913,977
General Fund expenditures are classified by the type of service provided:
General Government: Services provided for the benefit of the public and the governmental body.
Public Safety: Services that provide for the security of persons and property, mainly from the Police and Fire Rescue departments.
Physical Environment: Services to achieve a satisfactory living environment.
Capital Outlay: Expenditures for the acquisition of fixed assets.
Economic Environment: Cost of providing services which develop and improve the economic condition of the community and our neighbors. Transportation: Cost of services for the safe and adequate flow of vehicles, travelers and pedestrians.
Culture/Recreation: Cost of providing and maintaining cultural and recreational facilities and activities for the benefit of the community.

Enterprise Funds (Business-type activities)
Any activity that charges a fee to users for goods or services to recover the cost of the service provided.
The Enterprise Funds include: Utilities Fund, the Stormwater Fund and the Golf Course Fund. An Enterprise Fund is used to account for activities for which a fee is charged to external users for goods and/ or services.
13,342,183 18,409,073 1,355,600 4,616,497 4,443,033 494,978 315,750 229,523 15,601,234 58 ,8 07,871
Condensed Statement of Outstanding Debt (in millions)
,565 4, 541,003 1,711, 53 8 4,865,74 8 6, 831,085 11 ,465 , 559 4,941 ,245 5,73 4,069 1,103,792 17,527
At fiscal year-end, the City had $75.5 million in bonds and notes outstanding, a decrease of $4.1 million from fiscal year 2018. All $75.5 million are revenue bonds and notes backed by budget appropriations and fee revenues. In 2019, a Moody’s review upgraded the City’s General Obligation Bond credit rating of Aa2. These ratings reflect a strong financial position, a low debt burden and a moderate pension liability. Additional information about the City’s long-term debt can be found in Note 9 of the CAFR, available at www.Tamarac.org/CAFR.
The debt position of the City is summarized below:
(954) 597-3500 | www.Tamarac.org