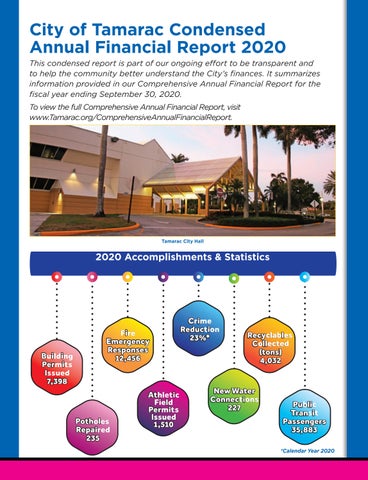
City of Tamarac Condensed Annual Financial Report 2020
This condensed report is part of our ongoing e˜ort to be transparent and to help the community better understand the City’s fnances. It summarizes information provided in our Comprehensive Annual Financial Report for the fscal year ending September 30, 2020.
To view the full Comprehensive Annual Financial Report, visit www.Tamarac.org/ComprehensiveAnnualFinancialReport.

General Fund
The City’s primary operating fund is referred to as the General Fund. It is used to account for all fnancial resources except those required to be accounted for in another fund. These activities are funded principally by property taxes from individuals and businesses, and charges for services.
General Fund Revenues
General Fund revenues for fscal year 2020 totaled $61.5 million (excluding transfers), a 4.7% decrease from fscal year 2019.
REVENUES
Proper ty Taxes
Other Taxes
Franchise Fe es
Charges for Services
Payment in Lieu of Taxes
Inte rgovernmental
Licenses an d Permit s
Fines an d Fo r feiture s
Investment Incom e
Other
Specia l Assessment s
Subtotal
General Fund expenditures are classifed by the type of service provided:
General Government: Services provided by the government for the beneft of the public and the governmental body.
202 0
Total 6 5,197,416 $ 28 ,767,984 8, 563, 13 9 5, 34 9, 15 5 1,732 ,8 95 2, 03 2 ,17 9 6,695,982 666 ,8 83 1, 493, 93 5 54 5, 097 5, 62 5, 07 8 61 ,474 ,2 50 1, 92 3
2019 64,497,283 $ 26,388 ,651 $ $ 8, 581, 91 8 5, 39 8, 373 2,75 8, 55 4 2, 01 5, 82 2 7, 278,805 72 2, 362 1, 73 3,74 8 1,01 8, 58 4 8, 59 6, 847 64,497,2 83
Transfers In 3, 72 3, 16 6 0 3 ,61 9
General Fund Expenditures
General Fund expenditures increased by $0.8 million (excluding transfers) from $46.6 million in fscal year 2019 to $47.4 million in fscal year 2020.
Genera l Gove rnment
Public Safety
Tra nsport ation
Culture an d Recreation
Physical Enviro nment
Economic Enviro nment
Human Se rvices
Ca pital Outlay
Transfers Out
Tota l 67,531,691 $ 15,107,968 19,988,486 1,445,931 4,381,723 4,308,303

Public Safety: Services that provide for the security of persons and property, mainly from the Police and Fire Rescue Departments.
Physical Environment: Services to achieve a satisfactory living environment.
Capital Outlay: Expenditures are for the acquisition of fxed assets
Economic Environment: Cost of providing services which develop and improve the economic condition of the community and our neighbors.
Transportation: Cost of services for the safe and adequate fow of vehicles, travelers and pedestrians.
Culture/Recreation: Cost of providing and maintaining cultural and recreational facilities and activities for the beneft of the community.

Statement of Net Position (in millions)
This provides a picture of the City’s assets, liabilities and deferred infows/outfows of resources, with the di˙erence reported as “net” position. Over time, increases or decreases may serve as a useful indicator of whether the City’s fnancial position is improving or deteriorating. For fscal year 2020, the City’s net position increased by $23.3 million to $340.9 million. Following is a Comparative Statement of Net Position at September 30, 2020 and 2019 (in millions).

Definitions
Current and Other Assets: Includes cash, investments, receivables and inventory that can be converted to cash within one year.
Capital Assets: Long-term investments in land, buildings, equipment, infrastructure improvements and construction-in-progress.
Deferred Outfows of Resource: A consumption of net position by the government that is applicable to a future reporting period.
Current Liabilities: Debts that can be paid o˙ in one year or less, such as accounts payable, accrued payroll and compensated absences.
Long-term Liabilities: Represents mainly debt obligations of the City.
Deferred Infows of Resources: An acquisition of net position by the government that is applicable to a future reporting period.
Net Position: The di˙erence between assets (including deferred outfows of resources) and liabilities (including deferred infows of resources).
Revenues: Income from charges for purchases, use or beneft from goods or services.
Expenses: Money spent or costs incurred through the City’s operations.
Condensed Statement of Activities (in millions)
The City’s revenues exceed its expenses by $23.3 million in fscal year 2020. City-wide revenues decreased by $6.6 million, this decrease was mainly due to decreased program activities in response to the COVID -19 pandemic. Total expenditures decreased by $3.5 million from fscal year 2019, mostly due to decreases in public safety costs, physical environment, and culture and recreation.

Tota l Revenues
Tota l Expenses
ecrease)
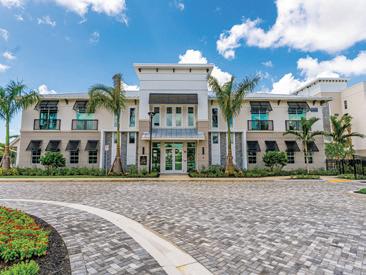
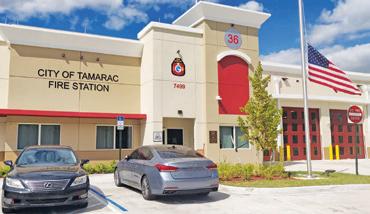
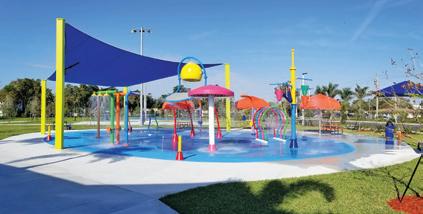
Recent Construction in Tamarac

Governmental Funds
Governmental funds are typically used to account for tax-supported governmental activities. The City’s major Governmental Funds are the General Fund, Fire Rescue Fund and Capital Project Funds.

Where the money comes from: REVENUES
FY20 Total $85.9 million
Other Incom e
O perating Grants
Ca pital Grants
Investment Incom e
Inte rgovernmental
Other Taxes
Proper ty Taxes
Charges for Services
Where the money goes: EXPENDITURES
FY20 Total $69.3 million
Human Se rvices
Economic Enviro nment
Inte rest on Long-term Debt
Tra nsport ation
Physical Enviro nment
Culture an d Recreation
Genera l Gove rnment
Public Safety


Enterprise Funds (Business-type Activities)
An enterprise fund is used to ˝ccount for ˝ctivities for which ˝ fee is ch˝rged to users to recover the cost of the goods/ services provided.
The Enterprise Funds include: the Utilities Fund, Stormwater Fund and Golf Course Fund.

Condensed Statement of Outstanding Debt (in millions)
At year-end, the City had $71.6 million in bonds and notes outstanding, a decrease of $3.9 million from fscal year 2019. All $71.6 million are revenue bonds and notes backed by budget appropriations and fee revenues. In 2020, Fitch’s review a°rmed the City’s Stormwater System Revenue Note credit rating of AA. Fitch’s review also a°rmed the City’s Water and Sewer Utility Revenue Bonds credit rating of AA+. These ratings refect a strong fnancial position, a low debt burden and low operating risk. Additional information about the City’s long-term debt can be found in Note 9 of the City’s Comprehensive Annual Financial Report.
The debt position of the City is summarized below:


7525 N.W. 88th Avenue Tamarac, Florida 33321-2401 (954) 597-3500 | www.Tamarac.org