Table IV-A Summary of Actuarial Methods and Assumptions IV-1
Table IV-B Changes in Actuarial Methods and Assumptions IV-3
Plan Provisions
Table V-A Summary of Plan Provisions V-1
Table V-B Summary of Plan Amendments V-7
May 10, 2022
Introduction
This report presents the results of the October 1, 2021 actuarial valuation of the City of Tamarac Firefighters' Pension Plan The report is based on the participant data and asset information provided by the pension plan administrator and , except for a cursory review for reasonableness including a comparison to the data provided for the previous valuation , we have not attempted to verify the accuracy of this information .
The primary purpose of this report is to provide a summary of the funded status of the plan as of October 1, 2021 and to determine the minimum required contribution under Chapter 112, Florida Statutes, for the 2021/22 plan year. In addition , this report provides a projection of the long-term funding requirements of the plan , statistical information concerning the assets held in the trust, statistical information concerning the participant population , and a summary of any recent plan changes.
The liabilities and cost presented in this report are based on numerous assumptions concerning the cost of benefits to be provided in the future, long-term investment returns , and the future demographic experience of the current participants Anyone referring to this report should remember that the cost developed herein is only an estimate of the true cost of providing post-employment pension benefits. No one can predict with certainty whether the true cost will be higher or lower than the cost presented in this report. The calculated cost is entirely dependent upon the assumptions that are described in Table IV-A. If any of the assumptions is changed , then the cost shown in this report will change accordingly. Likewise, if any of the assumptions is not completely realized, then the cost shown in this report will change in the future .
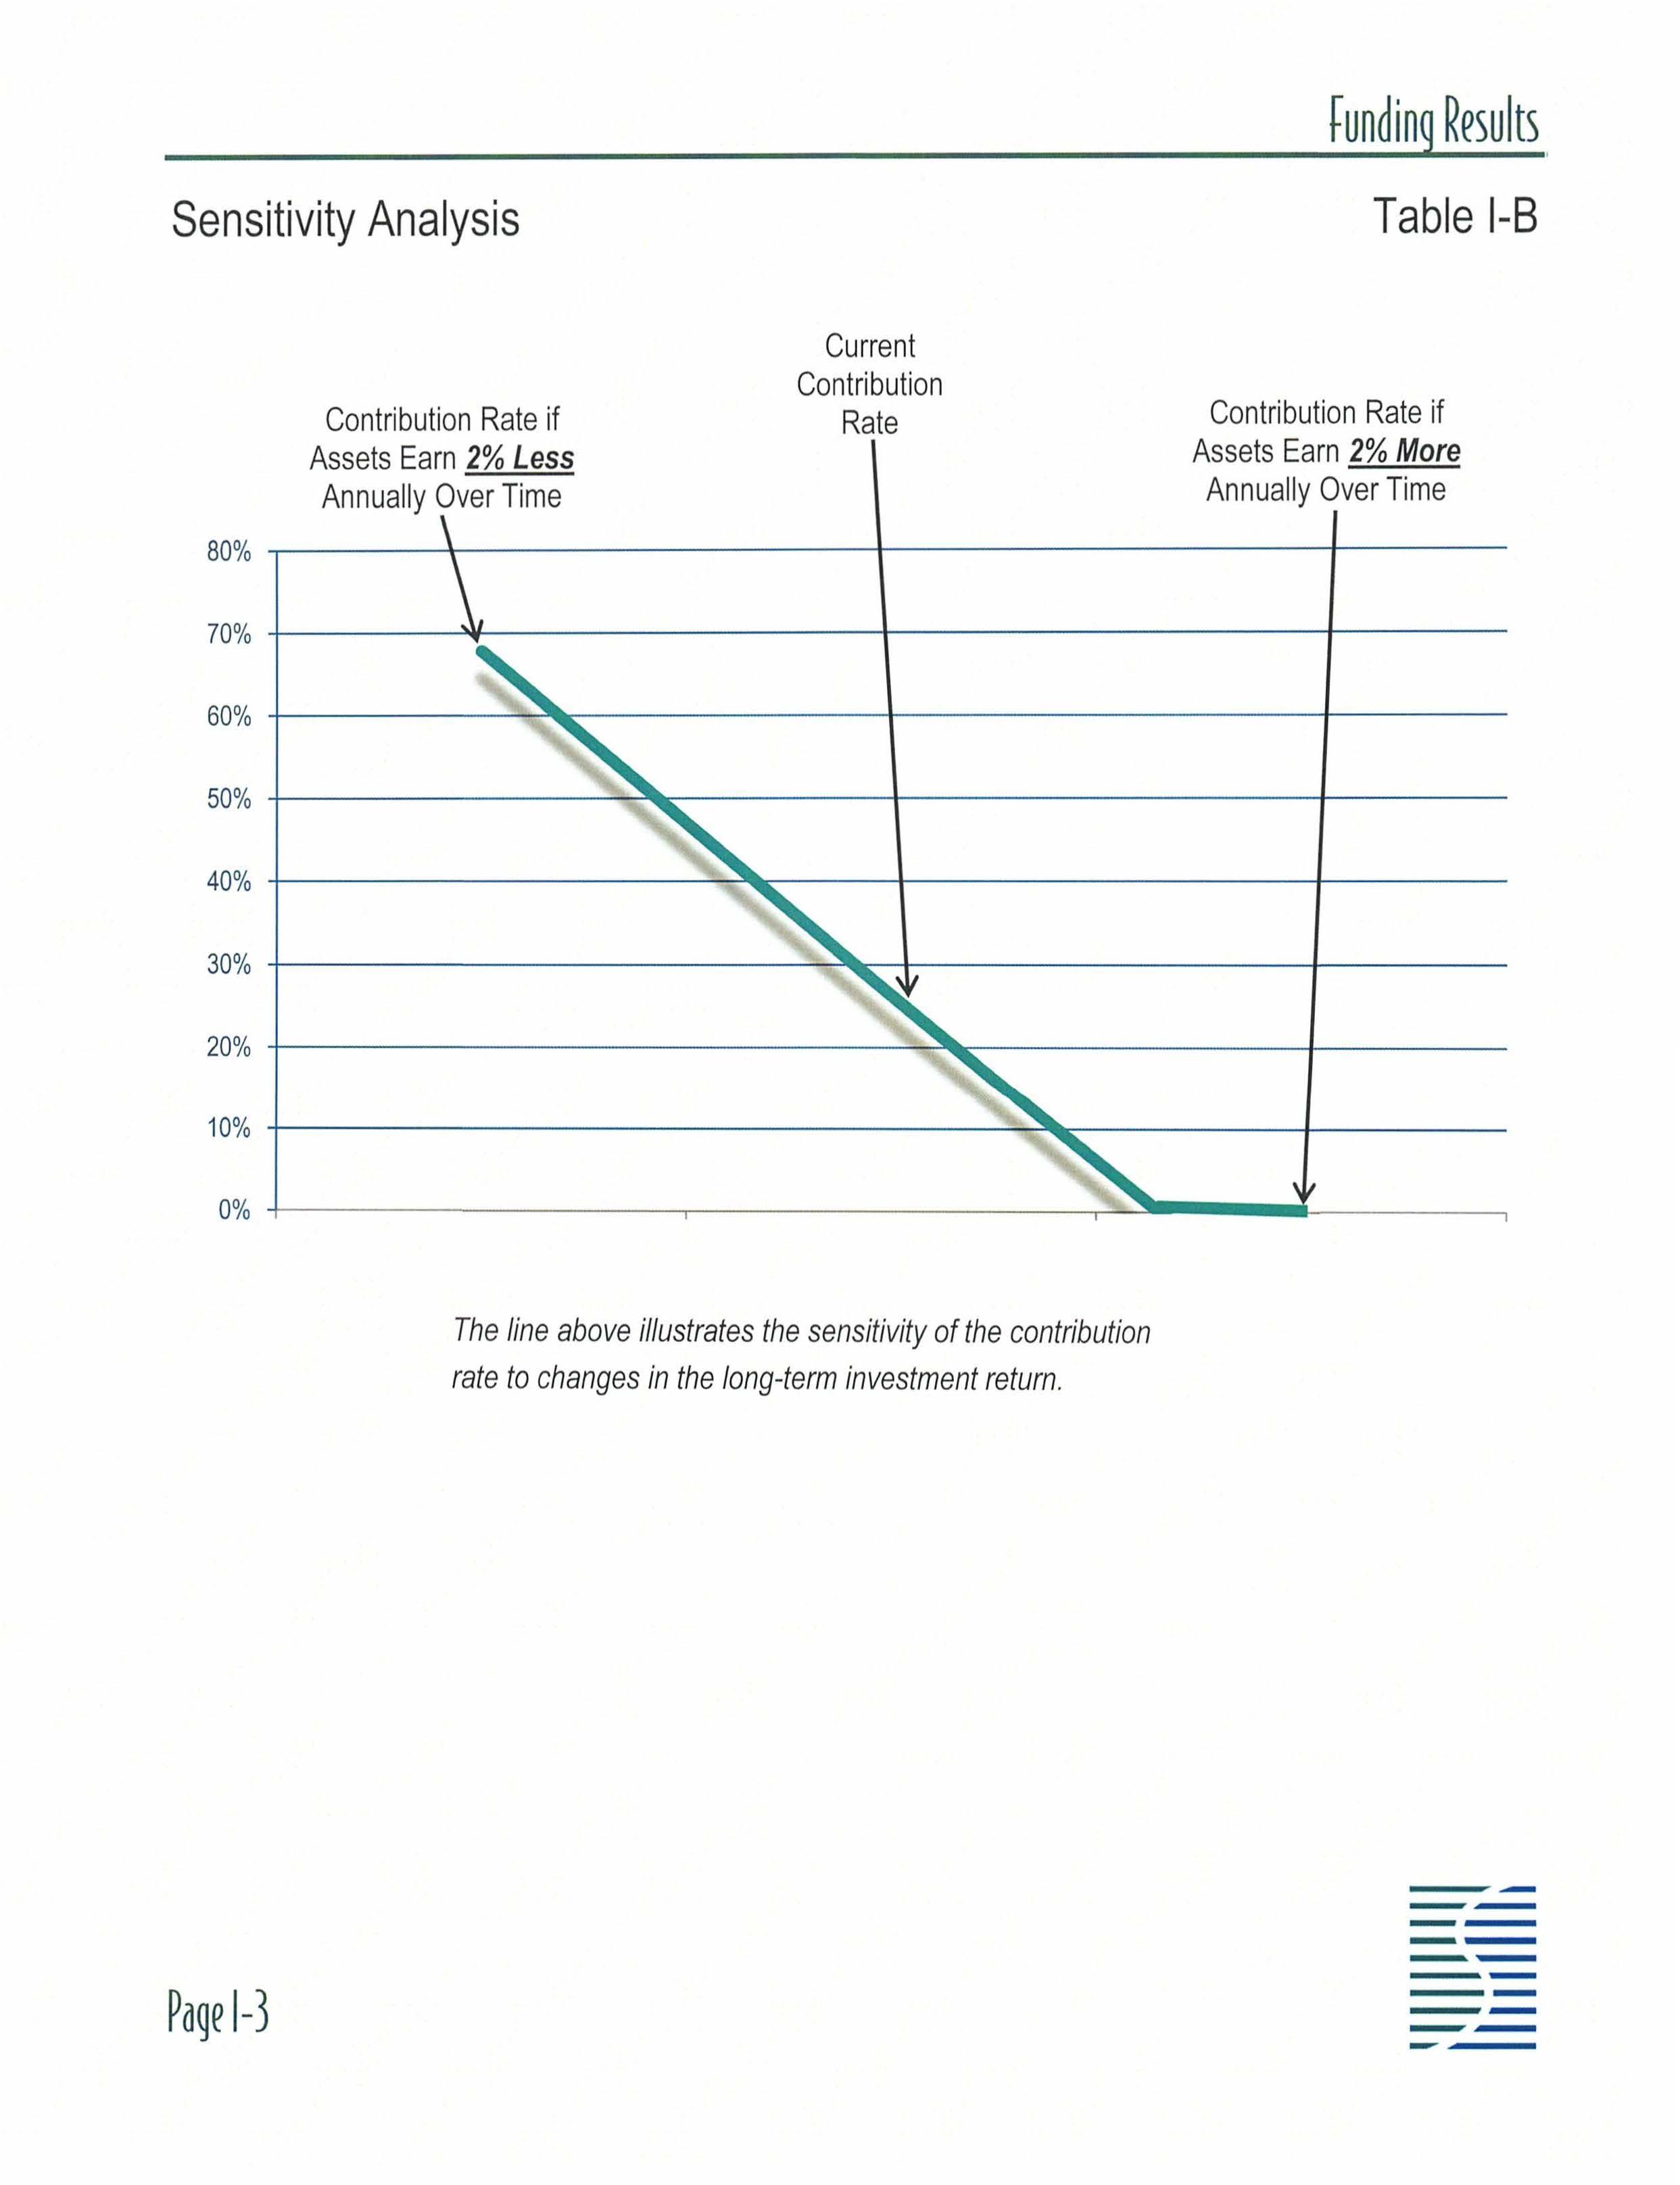
Certain assumptions play a bigger role than others in determining the cost of the post-employment pension benefits . In some cases, relatively small changes in a particular assumption can have a dramatic impact on the anticipated cost of benefits Although a thorough analysis of the impact of such changes is beyond the scope of this report, Table 1-B illustrates the impact that alternative long-term investment returns would have on the minimum required contribution rate.
Minimum Required Contribution
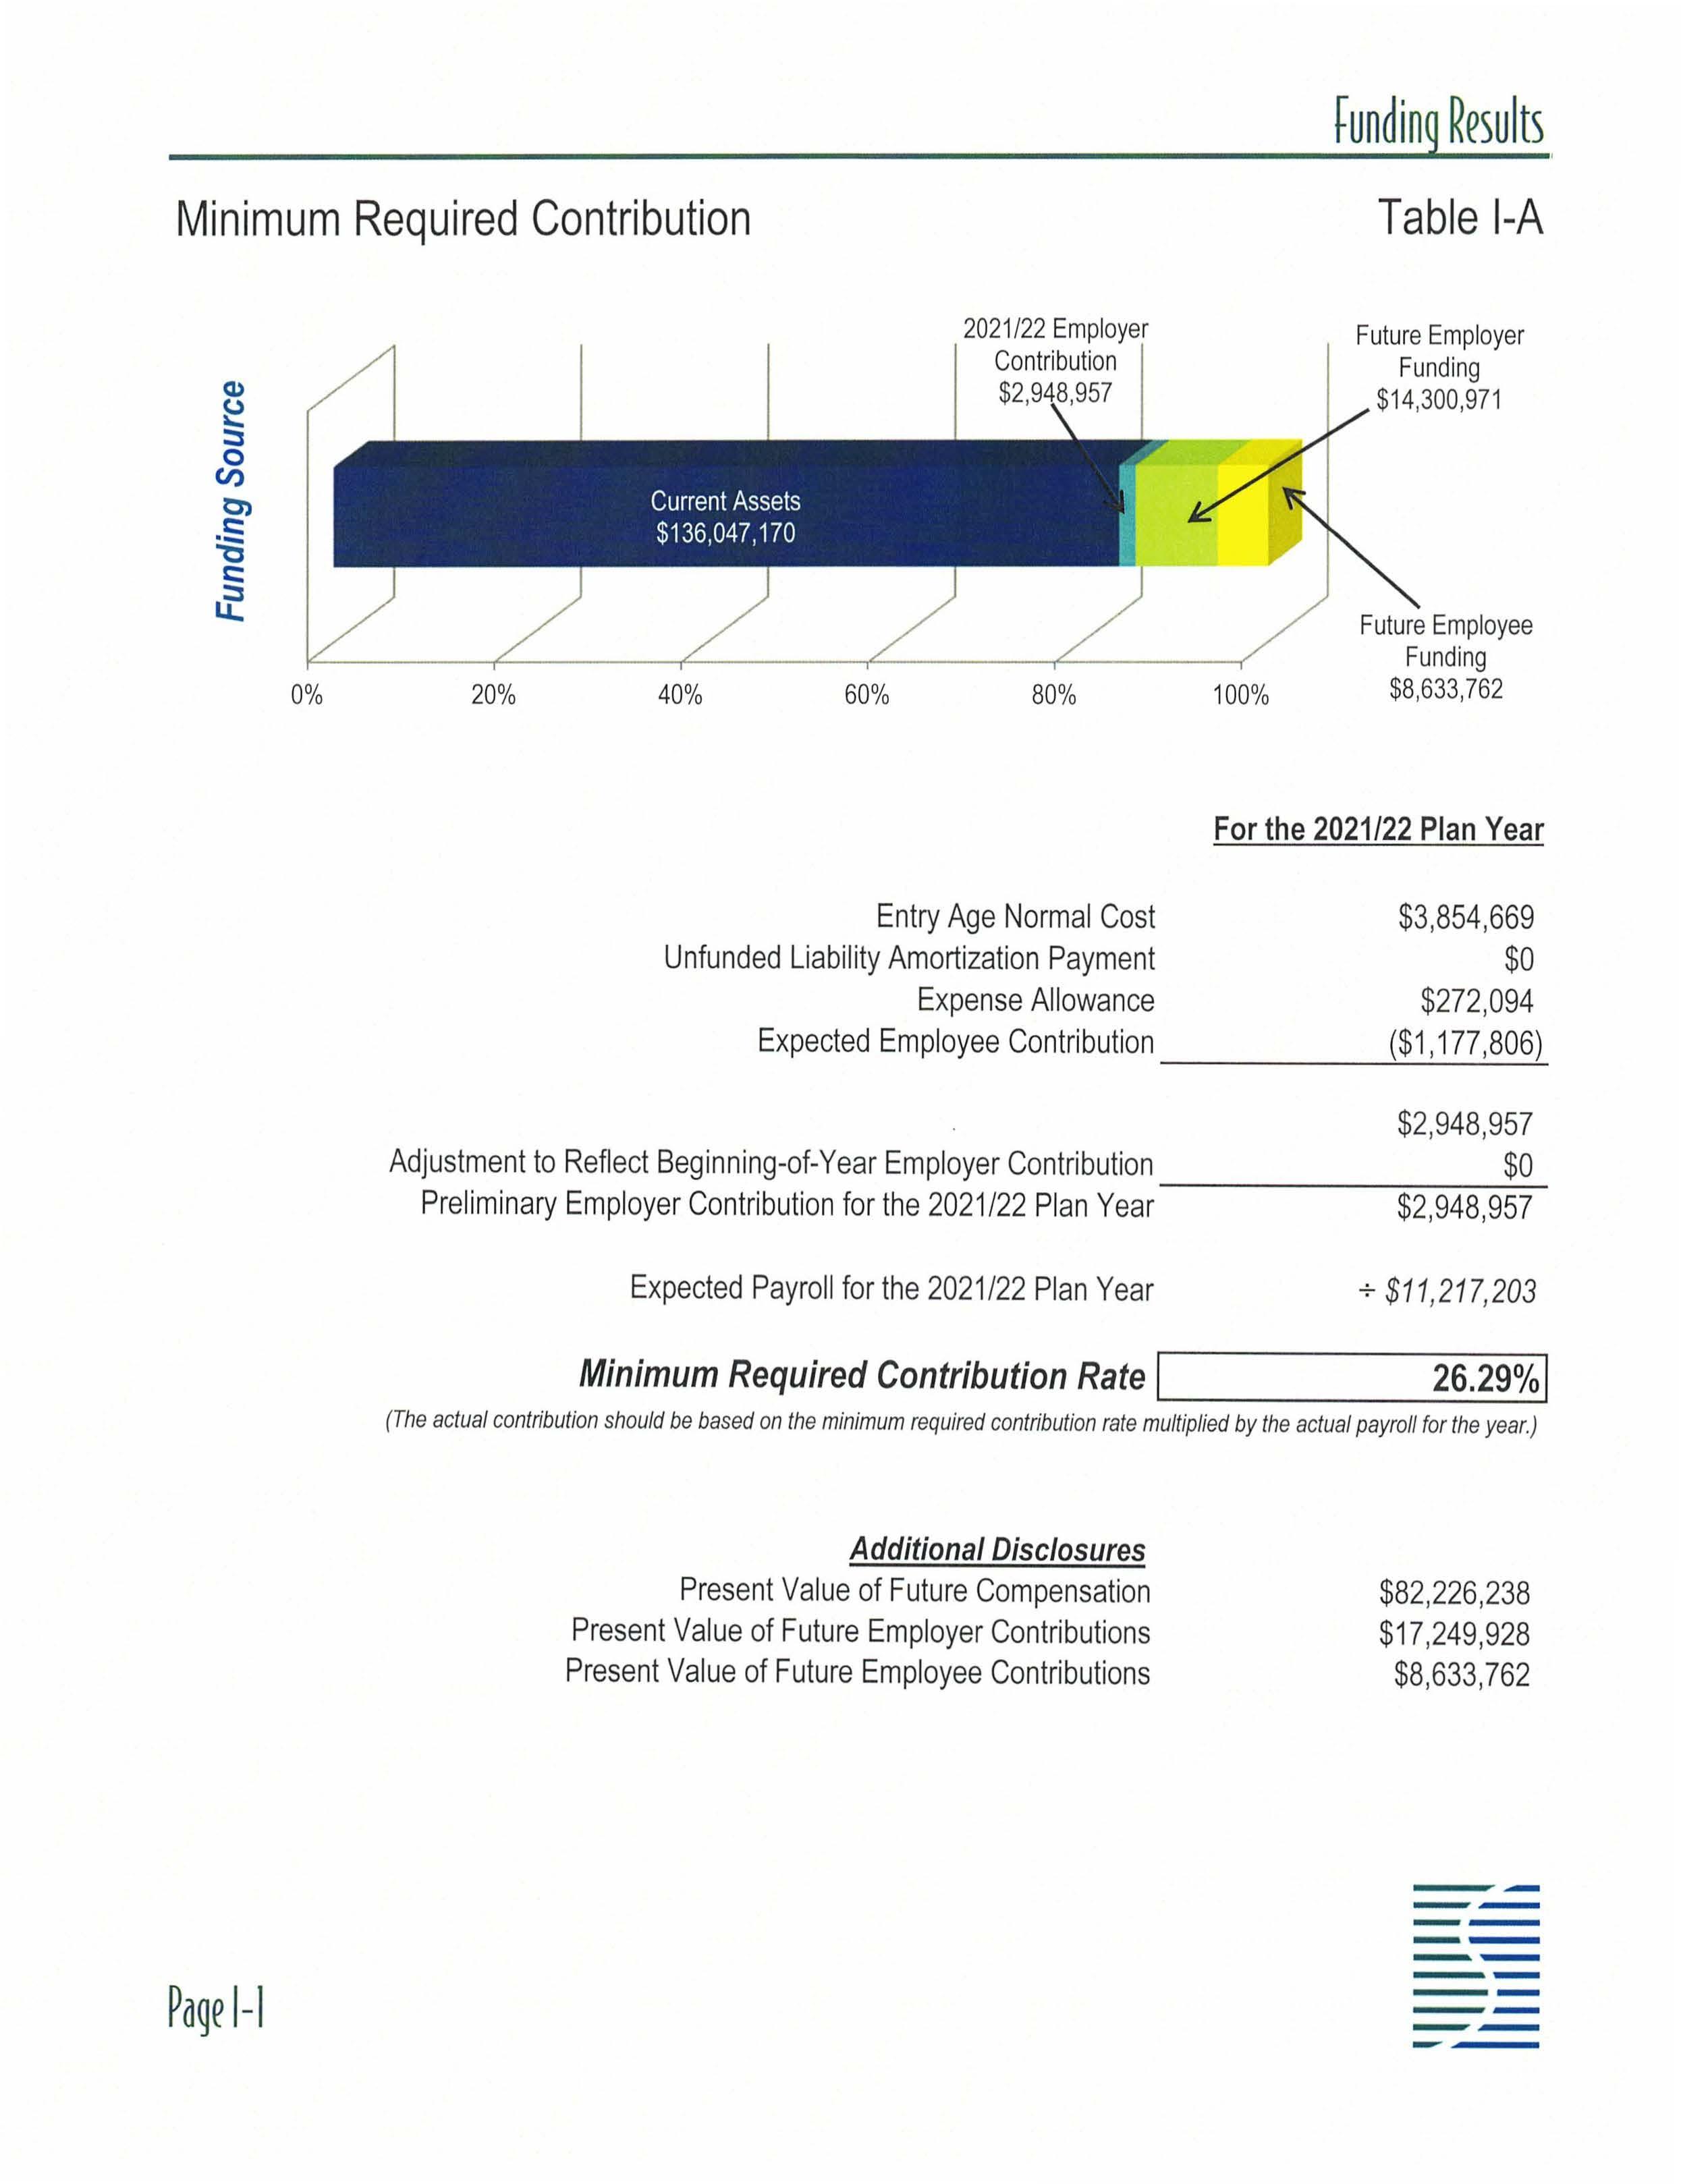
Table I-A shows the development of the minimum required contribution for the 2021 /22 plan year The minimum required contribution rate is 26 29%of covered payroll, which represents a decrease of 6 97%of payroll from the prior valuation
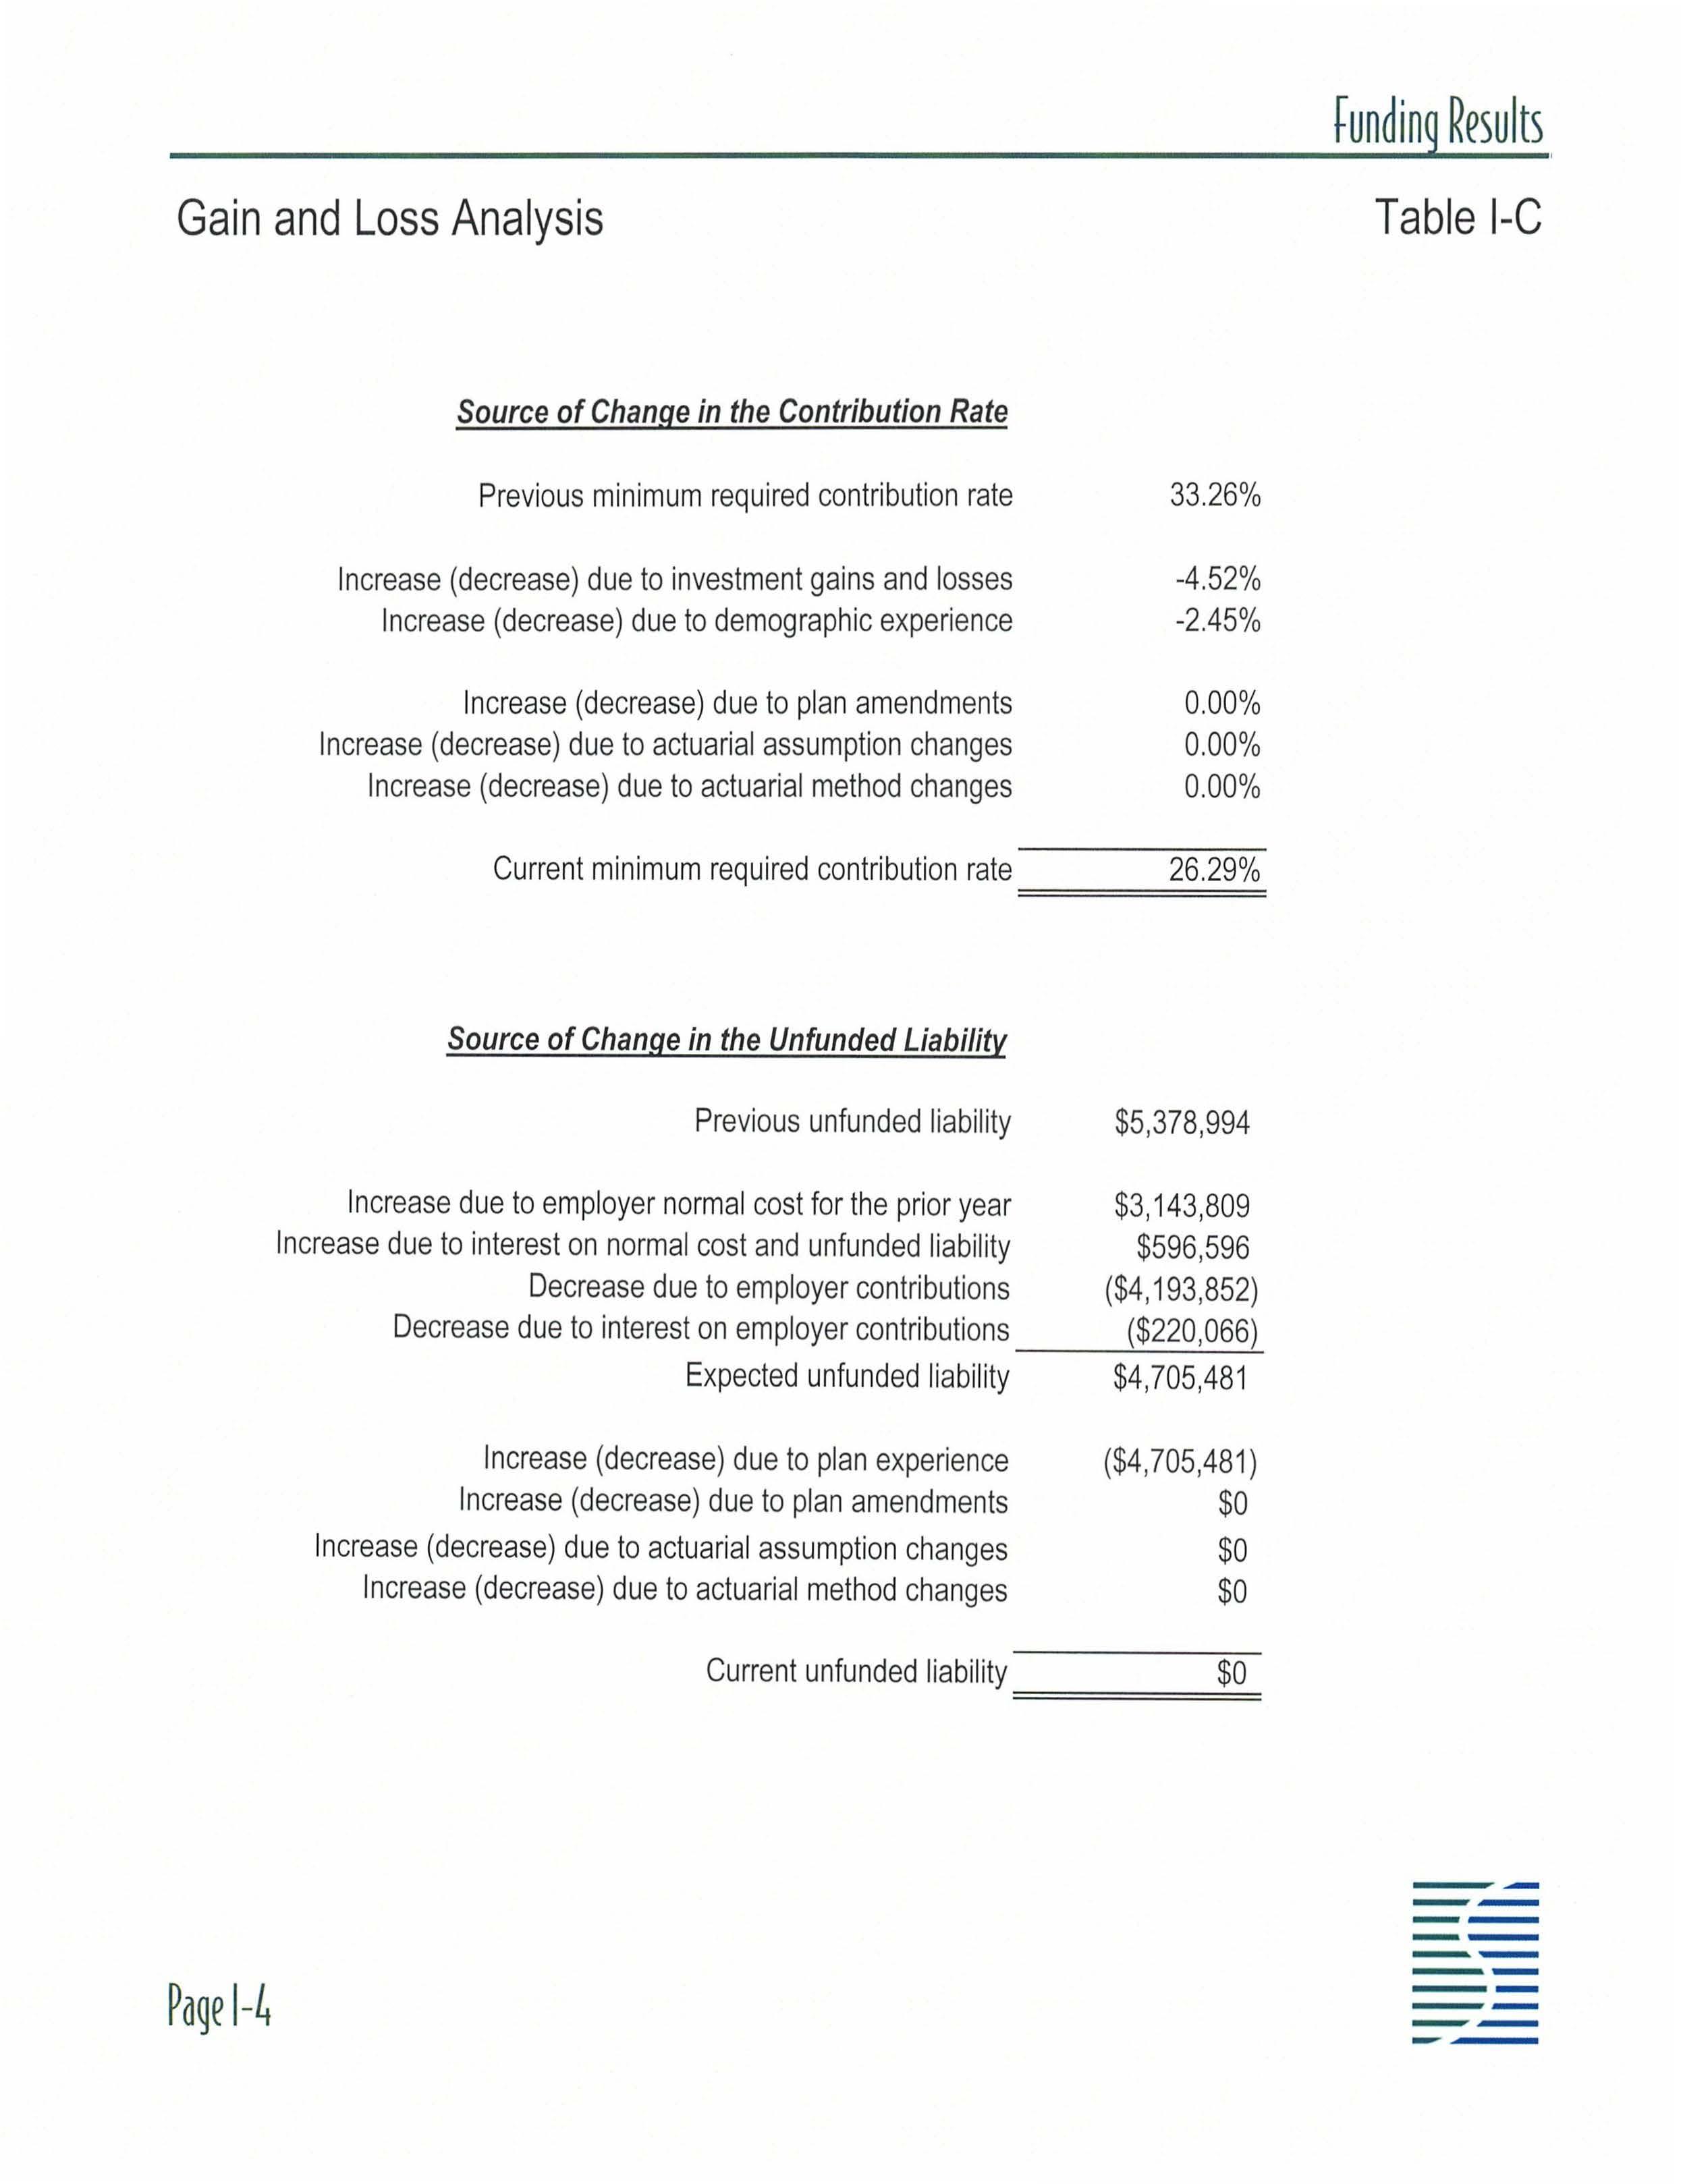
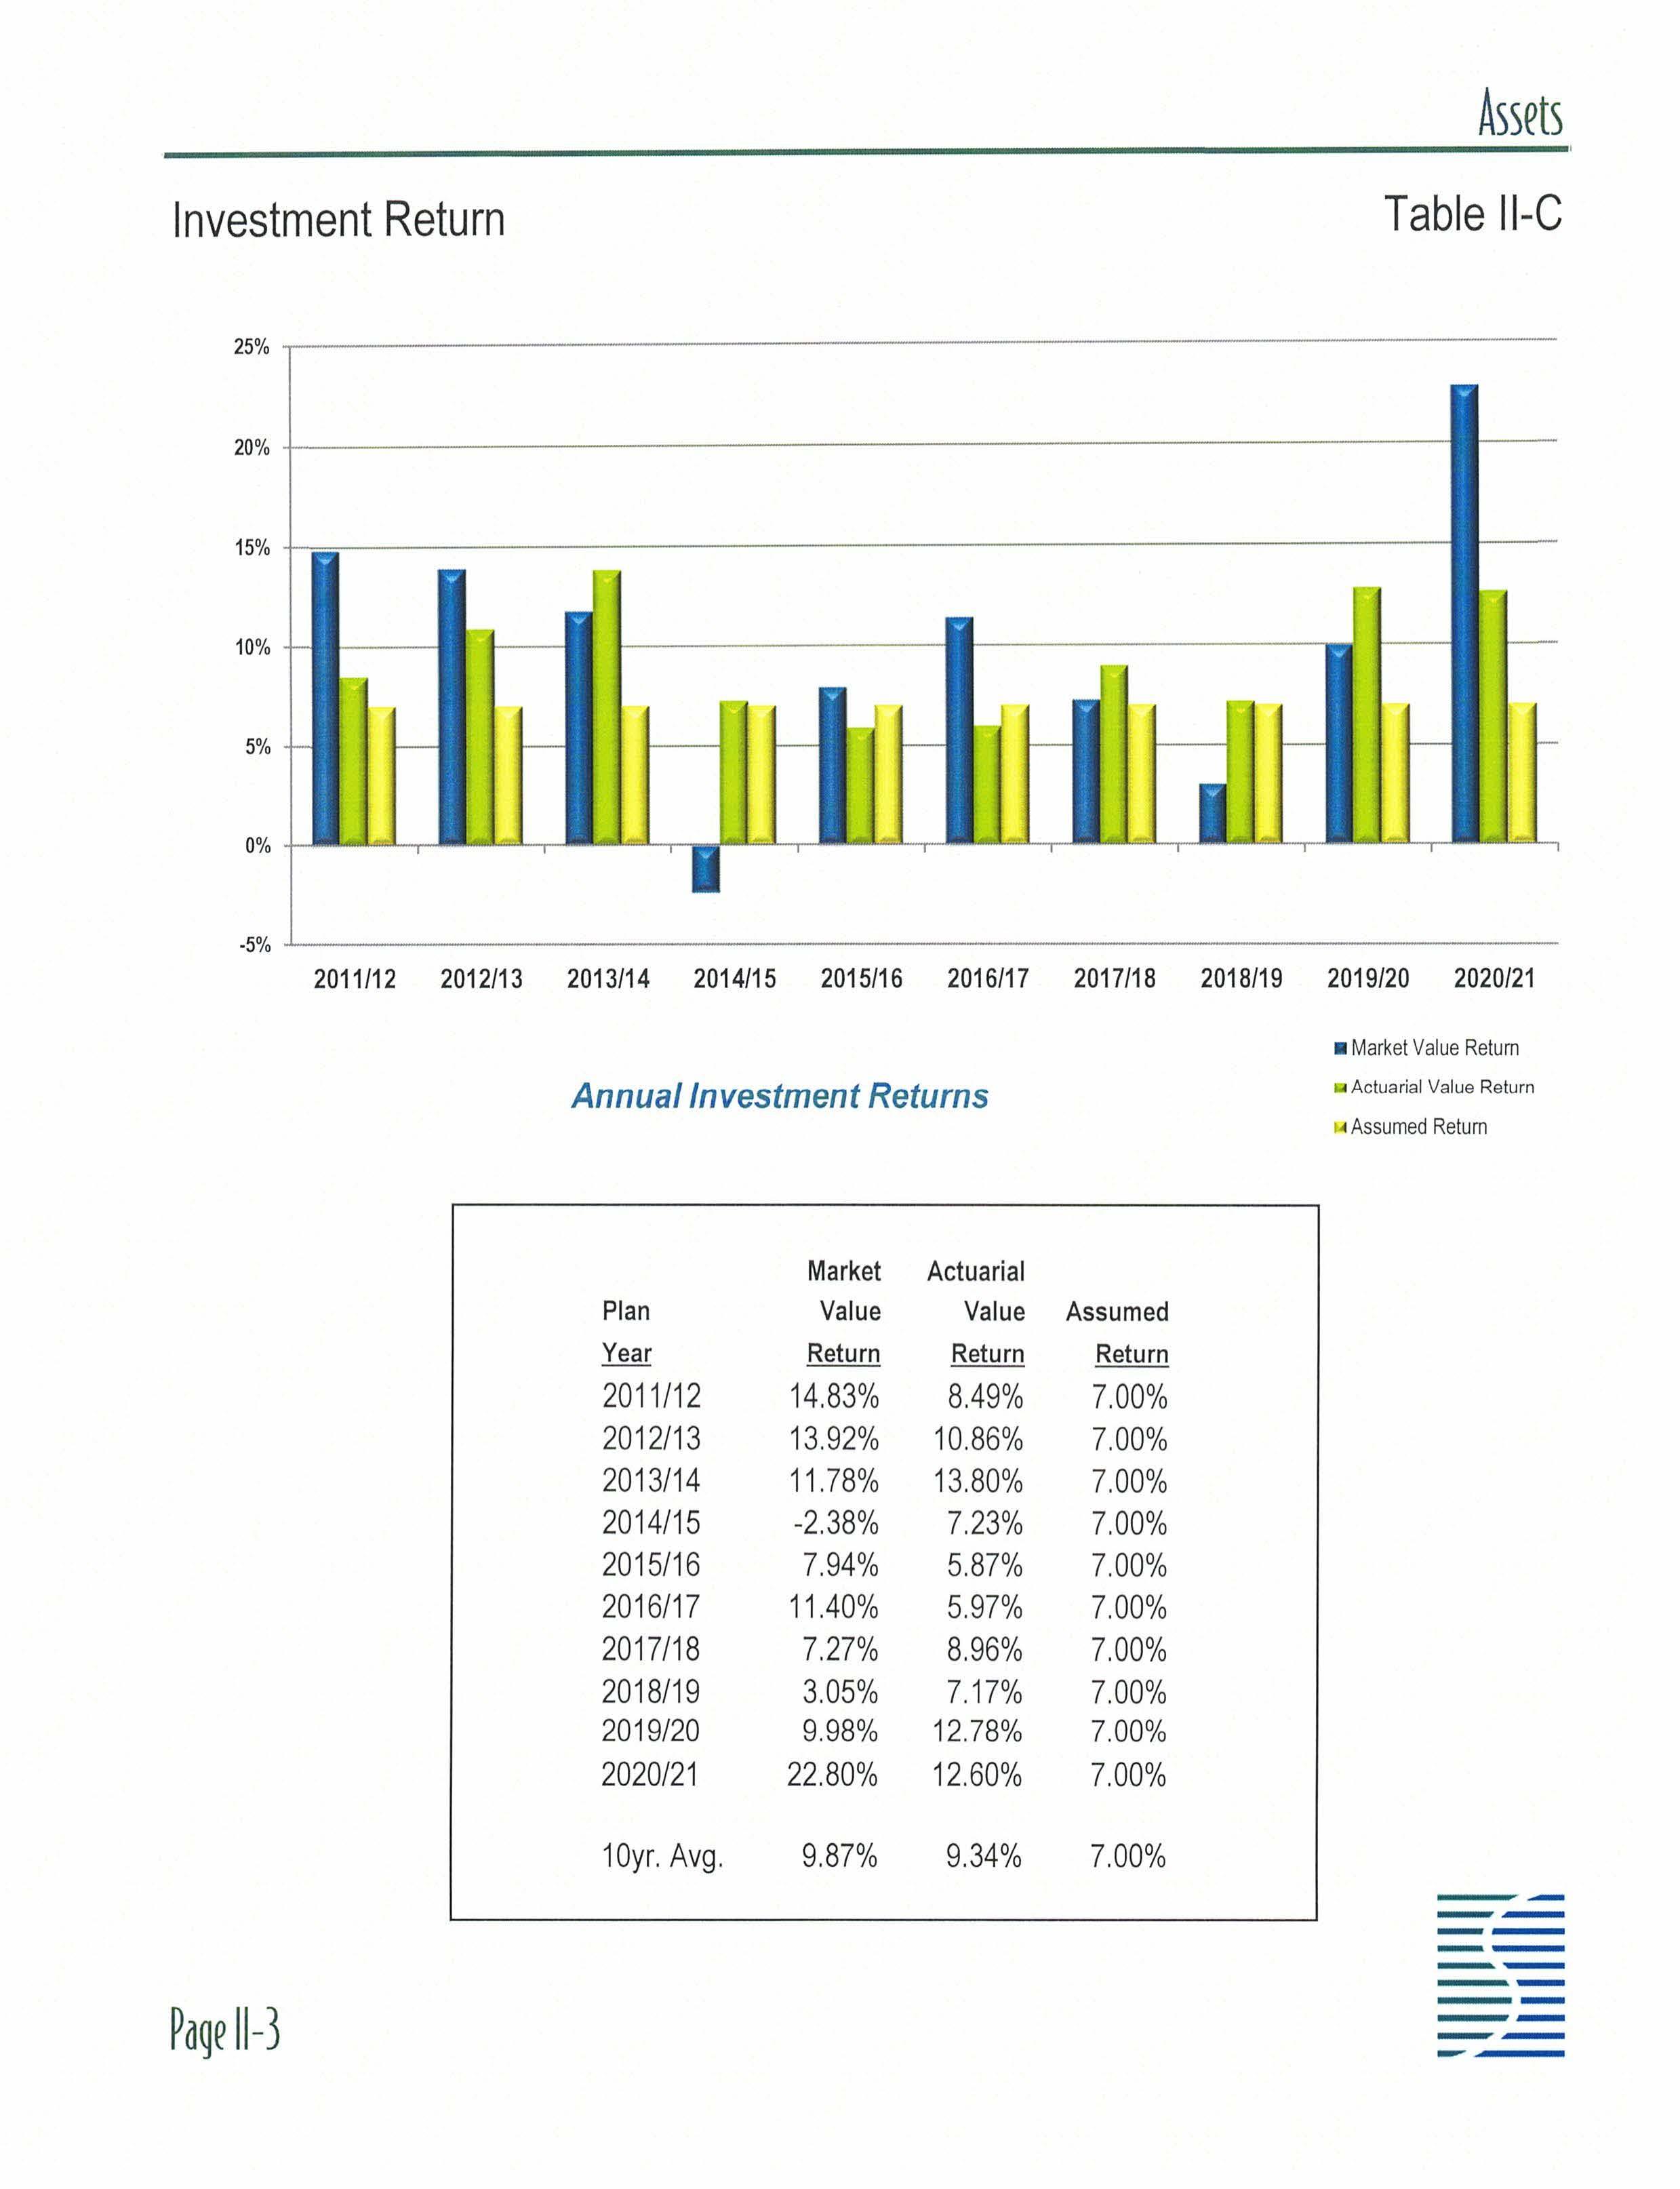
Table 1-C provides a breakdown of the sources of change in the contribution rate. Significantly, the rate decreased by 4. 52% of payroll due to investment gains and decreased by another 2.45% of payroll due to demographic experience. Although the market value of assets earned 22.80%during the 2020/21 plan year, the actuarial value of assets is based on a three-year phase-in of the unexpected investment appreciation . On th is basis, the actuarial value of assets earned 12.60% during the 2020/21 plan year, whereas a 7.00% annual investment return was required to maintain a stable contribution rate
Chapter 112, Florida Statutes, sets forth the rules concerning the minimum required contribution for public pension plans within the state. Essentially, the City must contribute an amount equal to the annual normal cost of the plan plus an amortization payment towards the unfunded liability, where the amortization period is no longer than 30 years and where both amounts are adjusted as necessary for administrative expenses and to reflect interest on any delayed payment of the contribution beyond the valuation date. On this basis, the City's 2021/22 minimum required contribution will be equal to 26.29% multiplied by the total pensionable earnings for the 2021 /22 fiscal year for the active employees who are covered by the plan and reduced by the portion of the Chapter 175/185 contribution that is allowed to be recognized during the 2021 /22 plan year. By mutual agreement between the bargaining parties, all of the Chapter 175 contribution may be used as an offset to the City's required contribution after September 30, 2015
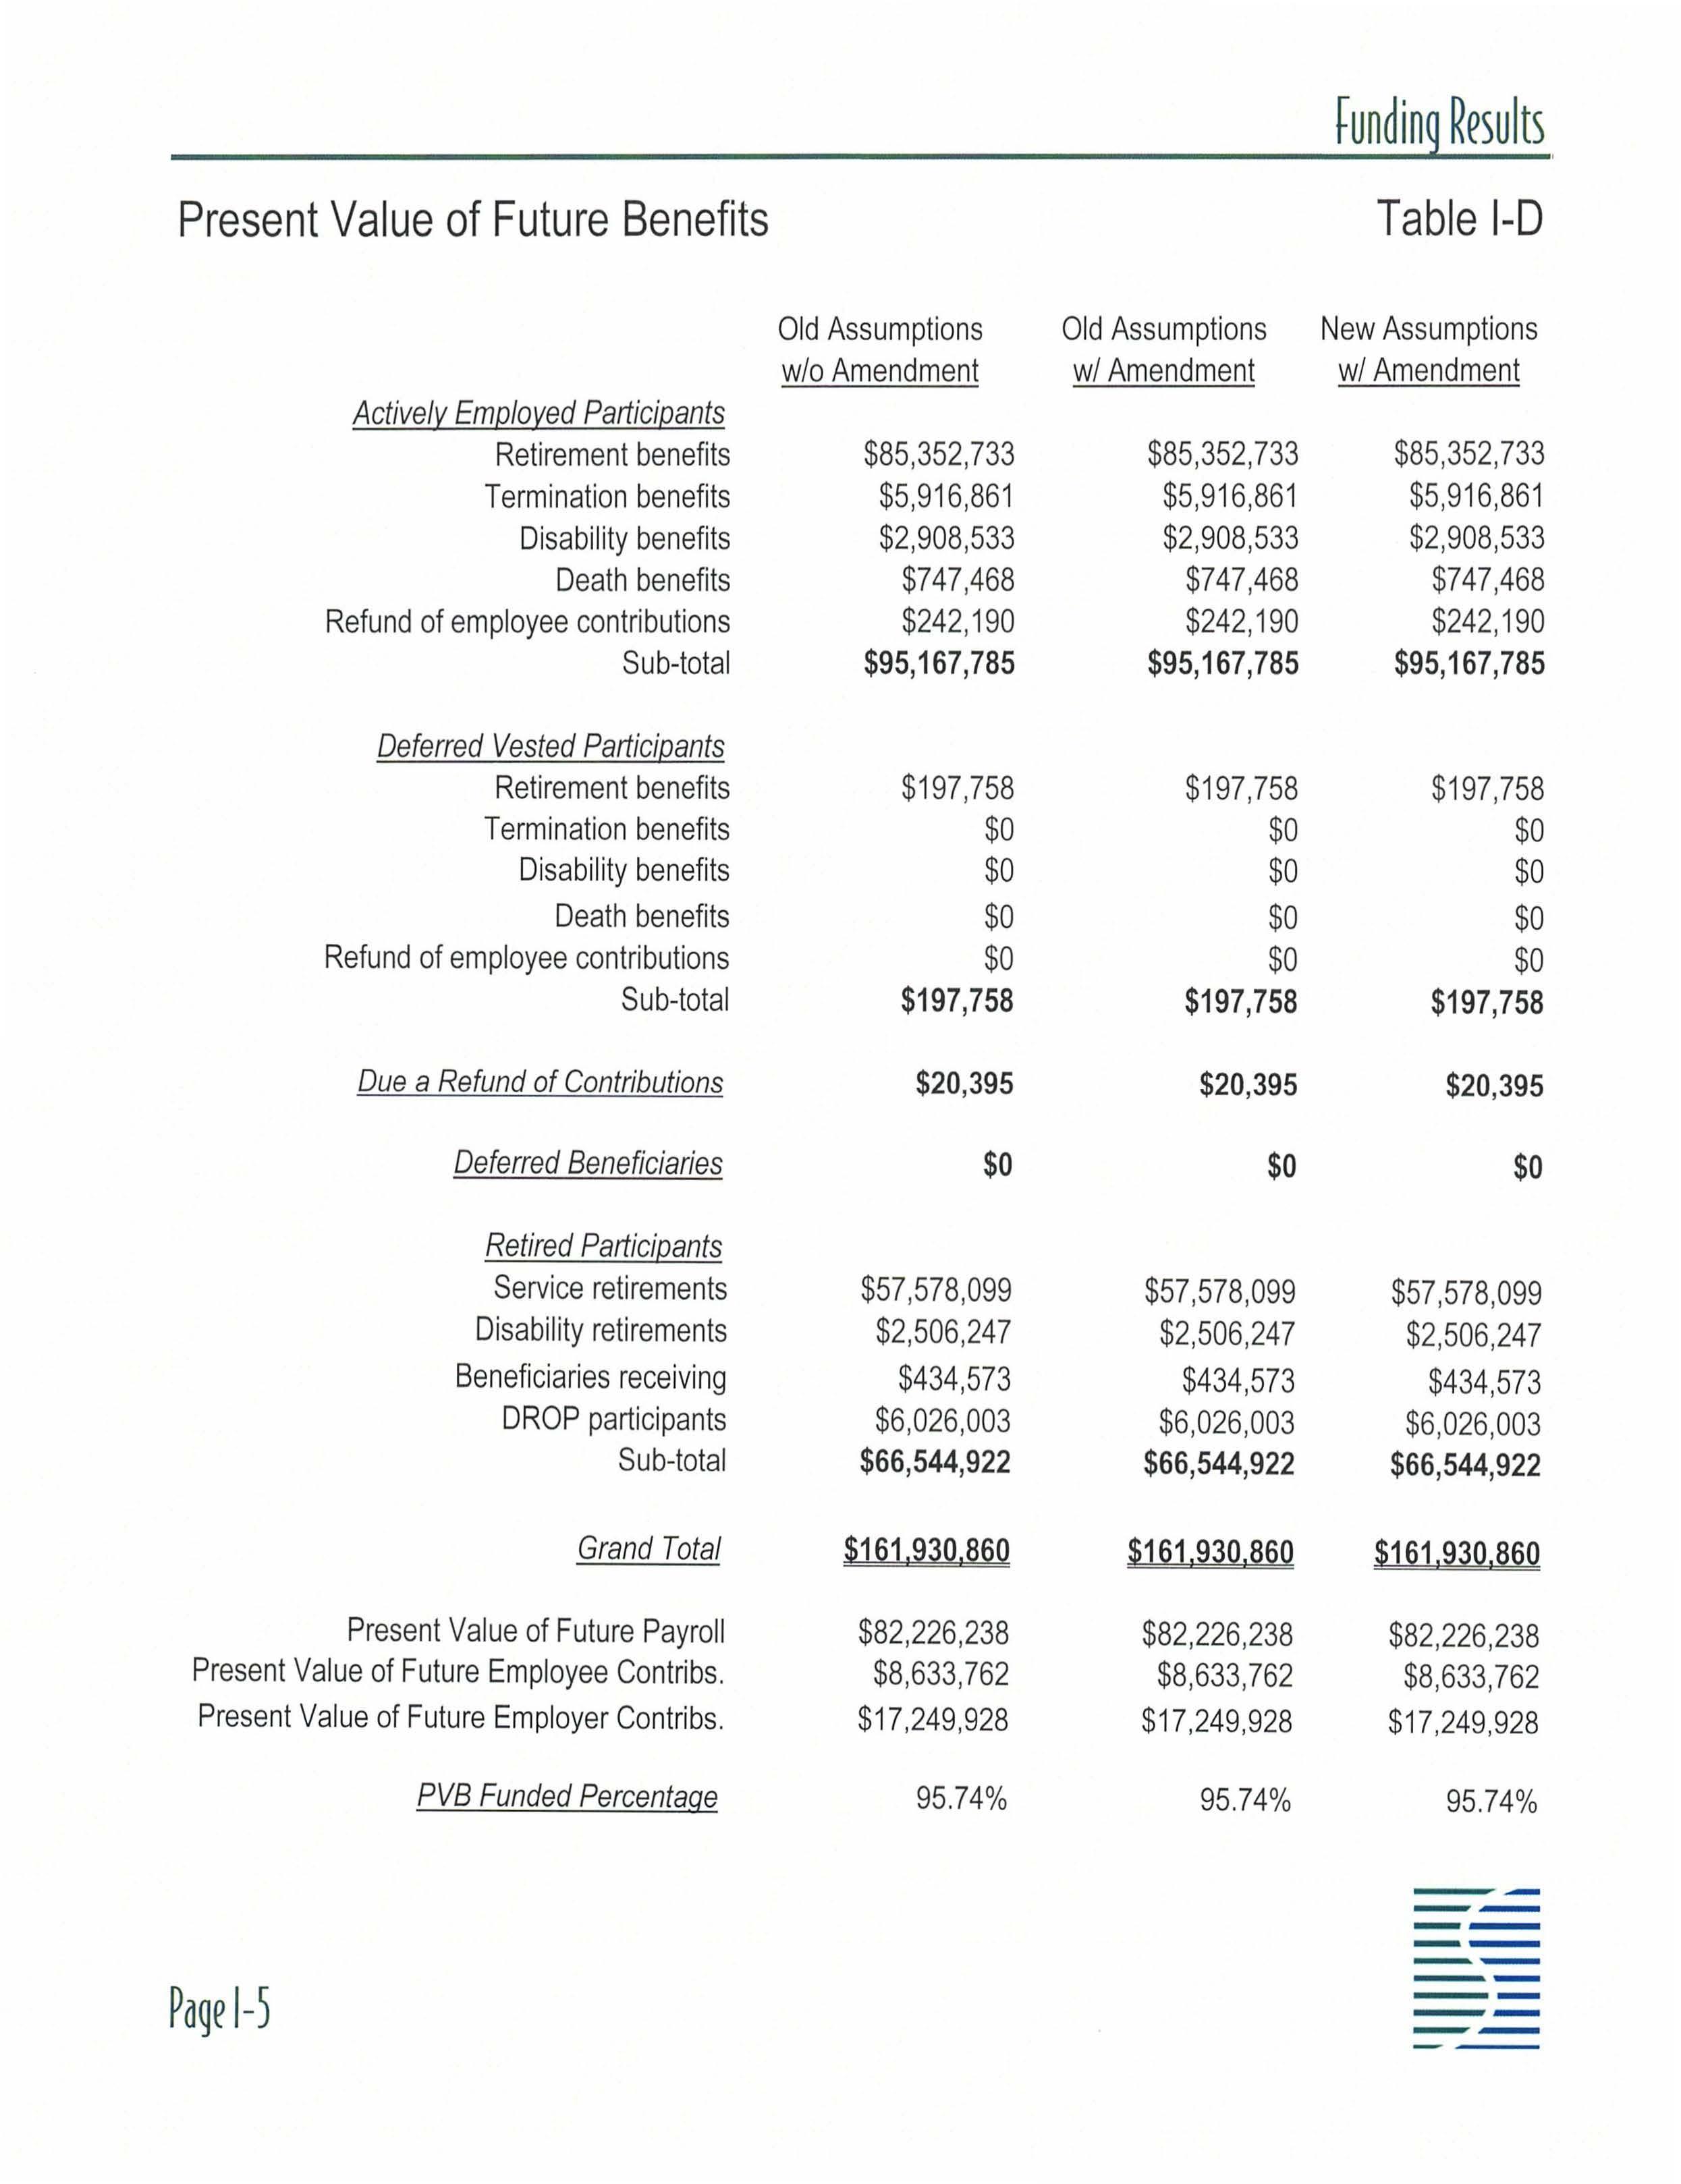
Based on the current assets, participant data, and actuarial assumptions and methods that are used to value the plan , the present-day value of the total long-term funding requirement is $161 ,930,860. As illustrated in Table I-A, current assets are sufficient to cover $136,047,170 of this amount, the employer's 2021/22 expected contribution will cover $2,948,957 of this amount, and future employee contributions are expected to cover $8,633,762 of this amount, leaving $14,300,971 to be covered by future employer funding beyond the 2021 /22 fiscal year. Again , demographic and investment experience that differs from that assumed will either increase or decrease the future employer funding requirement.
Advance Employer Contribution
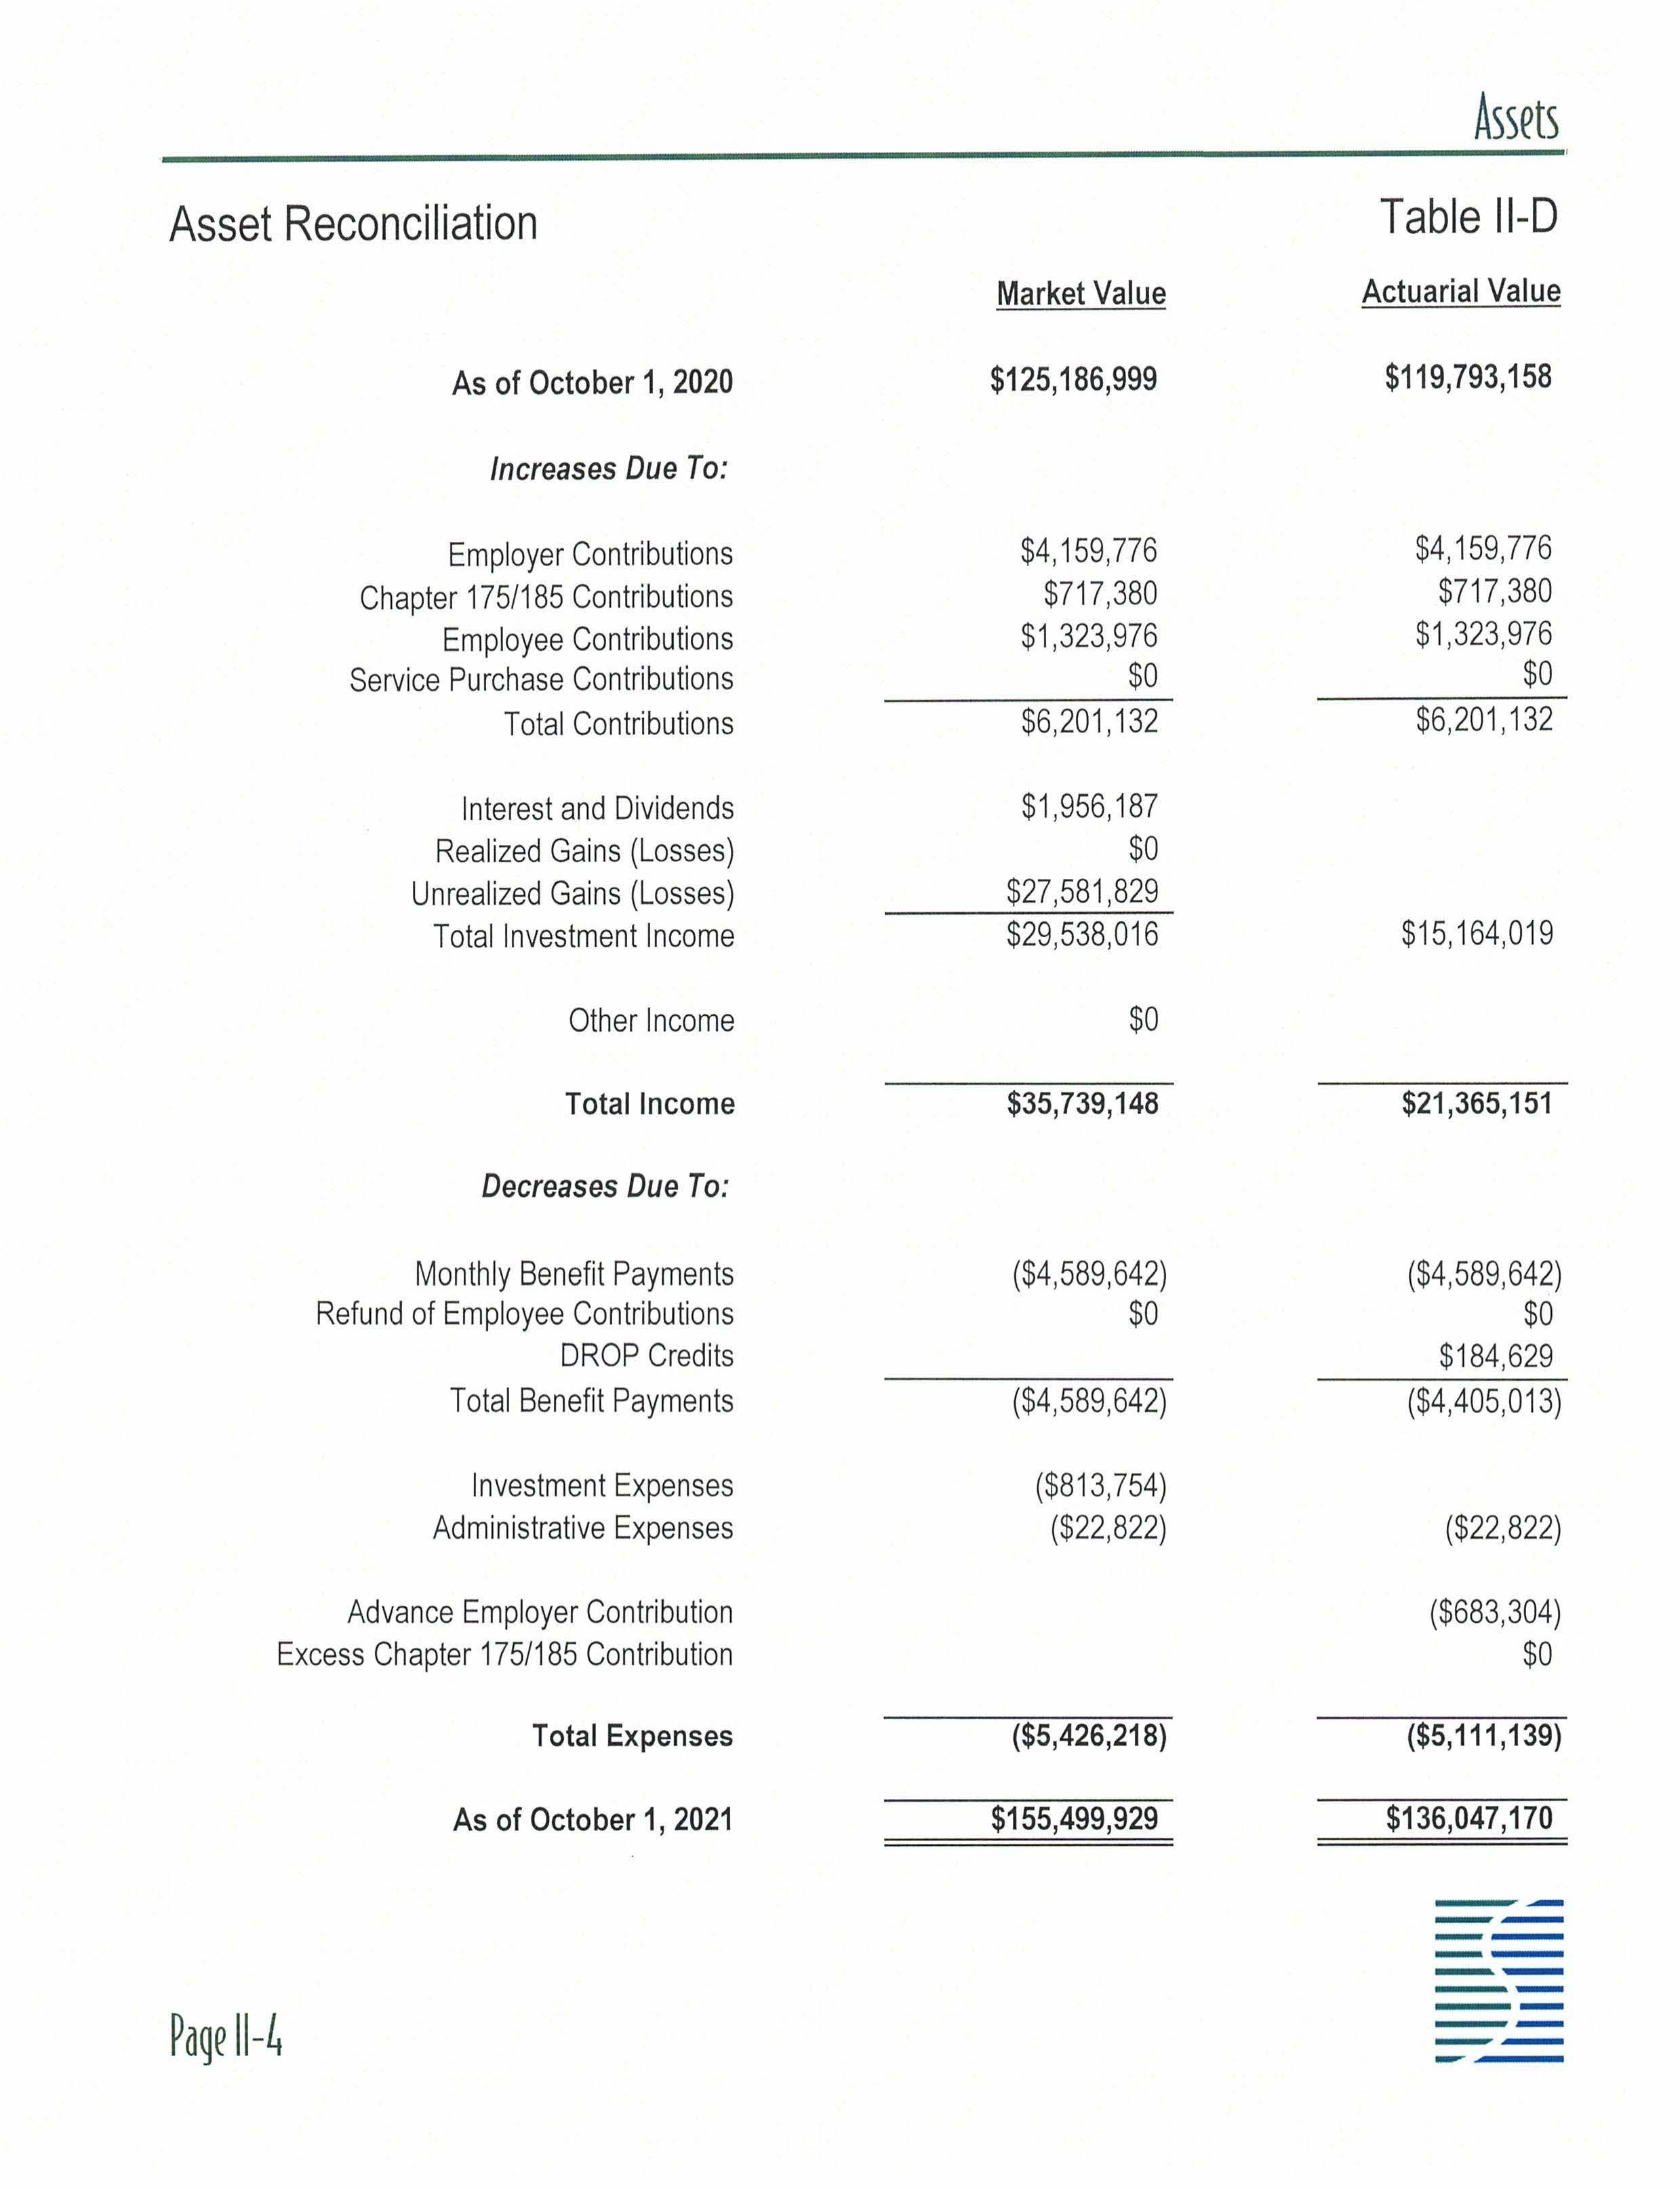
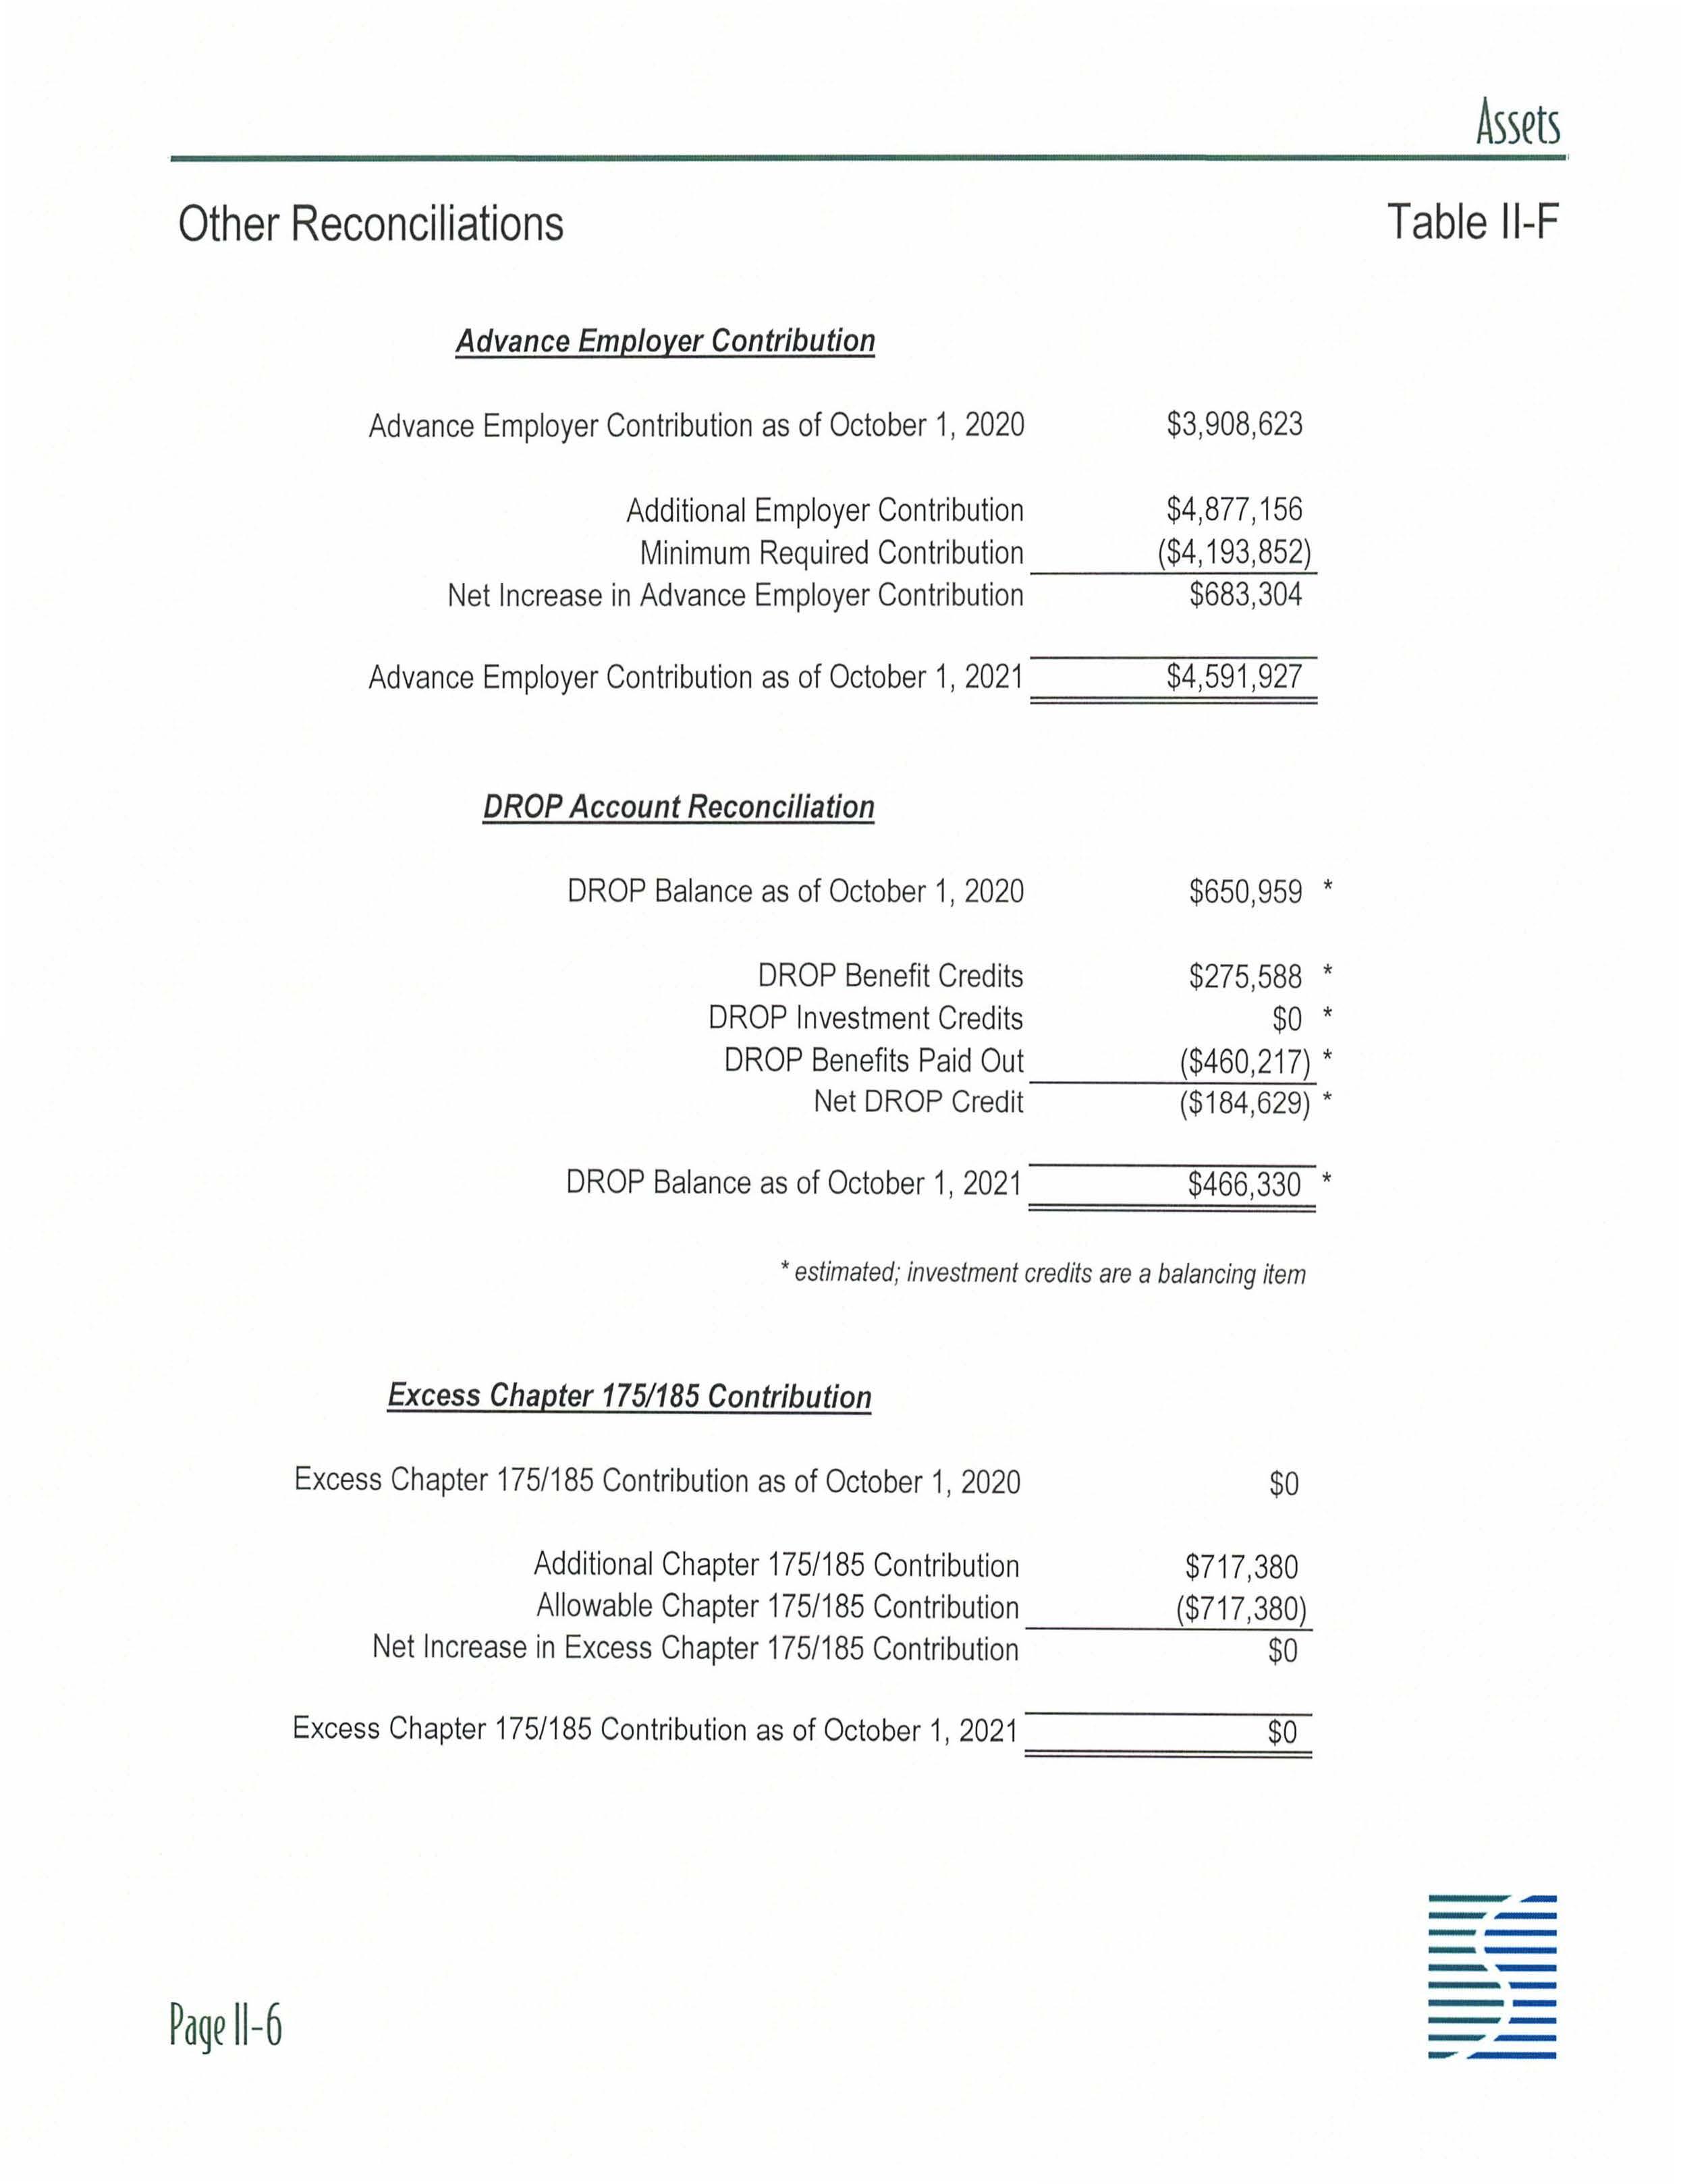
The City has made contributions to the plan in excess of the minimum amount that was required to be contributed pursuant to Chapter 112 In this report, the excess contributions are referred to as an "advance employer contribution." As of October 1, 2021 , the advance employer contribution is $4,591 ,927, which reflects the advance employer contribution as of October 1, 2020 plus $683,304 of actual employer contributions in excess of the minimum required contribution for the 2020/21 plan year as shown in Table 11-F.
The City may apply all or any portion of the advance employer contribution towards the minimum required contribution for the 2021 /22 plan year or for any later plan year. The minimum required contribution for that plan year will be reduced dollar-for-dollar by the amount of the advance employer contribution that is applied in this manner.
Alternatively, at any time, the City may apply all or any portion of the advance employer contribution as an extra contribution in excess of the minimum required contribution .
Excess Chapter 175 Contribution
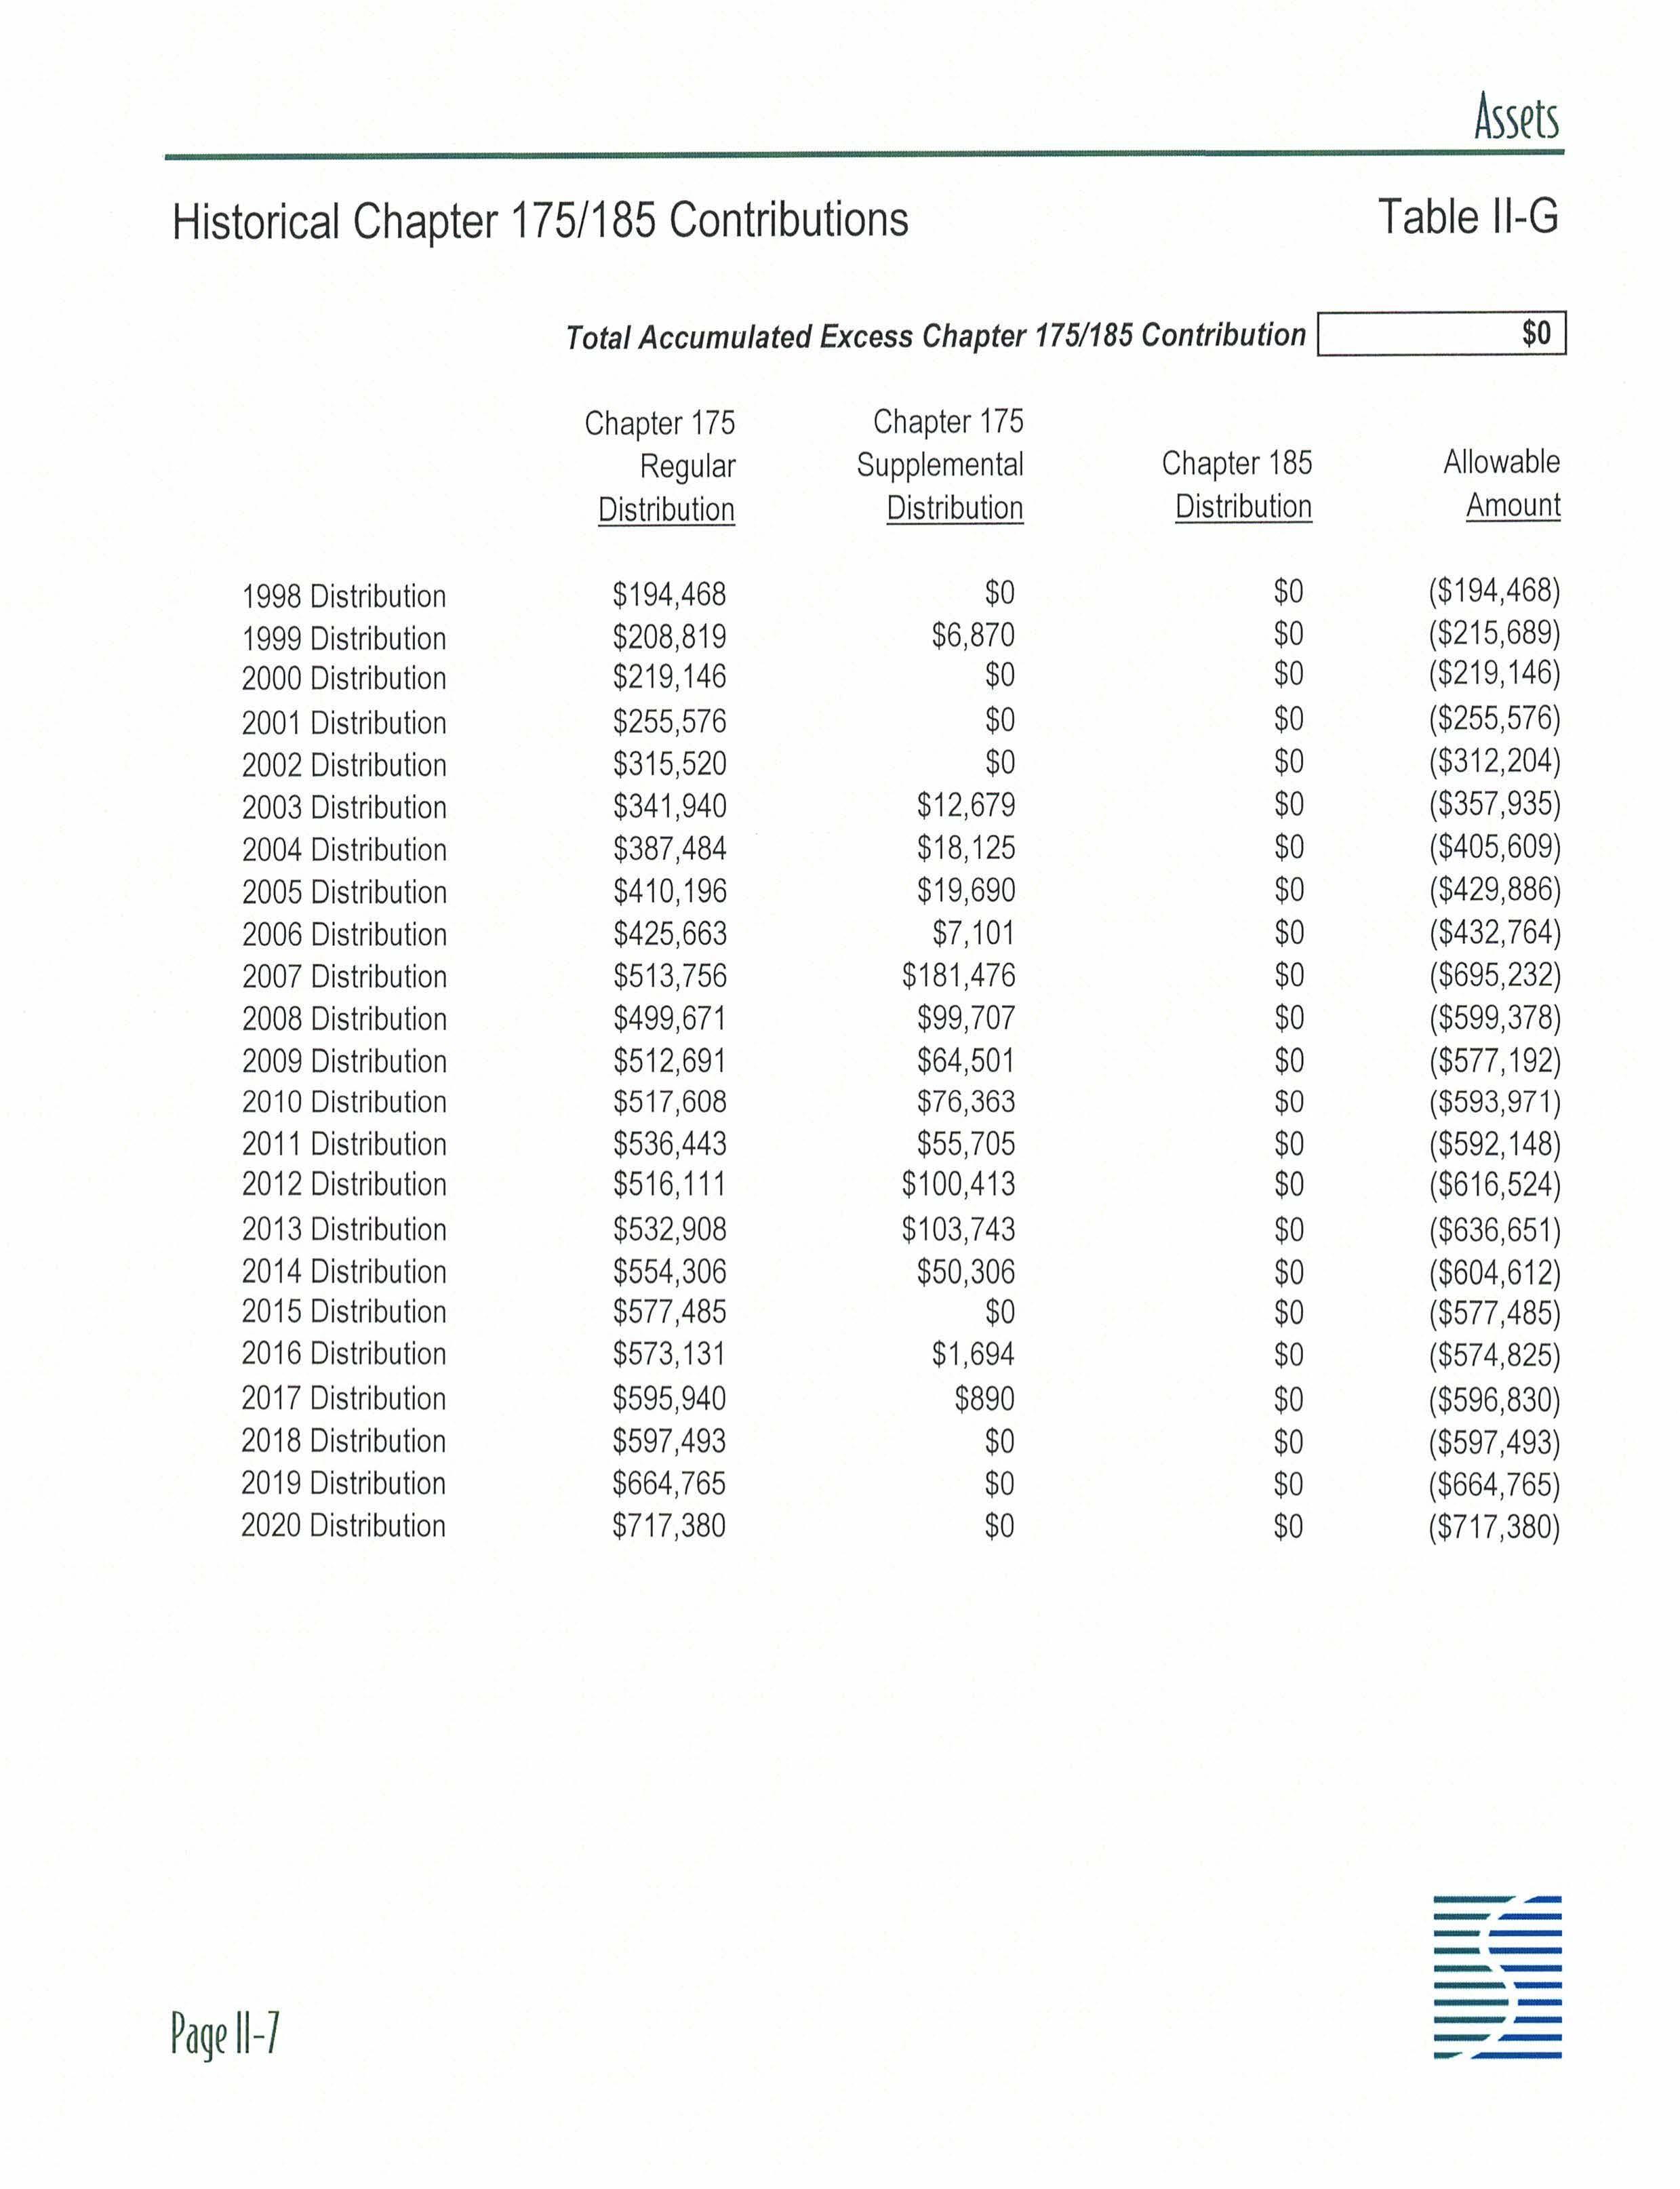
As of October 1, 2020, the plan has not accumulated any excess Chapter 175 contributions as shown in Table 11-F The total Chapter 175 distribution received for the 2020/21 plan year was $717,380 and all of this distribution was allowed to be applied as an offset to the City's required contribution for the 2020/21 plan year. Table 11-G provides a history of the Chapter 175 contributions and the portion that is allowed to be recognized
Identification and Assessment of Risk
The liabilities and cost presented in this report are based on numerous assumptions concerning the cost of benefits to be provided in the future, long-term investment returns, and the future demographic experience of the current participants Anyone referring to this report should remember that the cost developed herein is only an estimate of the true cost of providing post-employment pension benefits. No one can predict with certainty whether the true cost will be higher or lower than the cost presented in this report. The calculated cost is entirely dependent upon the assumptions that are described in Table IV-A. If any of the assumptions is changed , then the cost shown in this report will change accordingly Likewise, there is always a risk that, should these assumptions not be realized , the liabilities of the plan , the contributions required to fund the plan, and the funded status of the plan may be significantly different than the amounts shown in this report.
Although a thorough analysis of the risk of not meeting the assumptions is beyond the scope of this report, this discussion is intended to identify the significant risks faced by the plan . In some cases, a more detailed review of the risks, including numerical analysis, may be appropriate to help the plan sponsor and other interested parties assess the specific impact of not realizing certain assumptions. For example, Table 1-8 illustrates the impact that alternative long-term investment returns would have on the contribution rate. Note that this report is not intended to provide advice on the management or reduction of the identified risks nor is this report intended to provide investment advice.
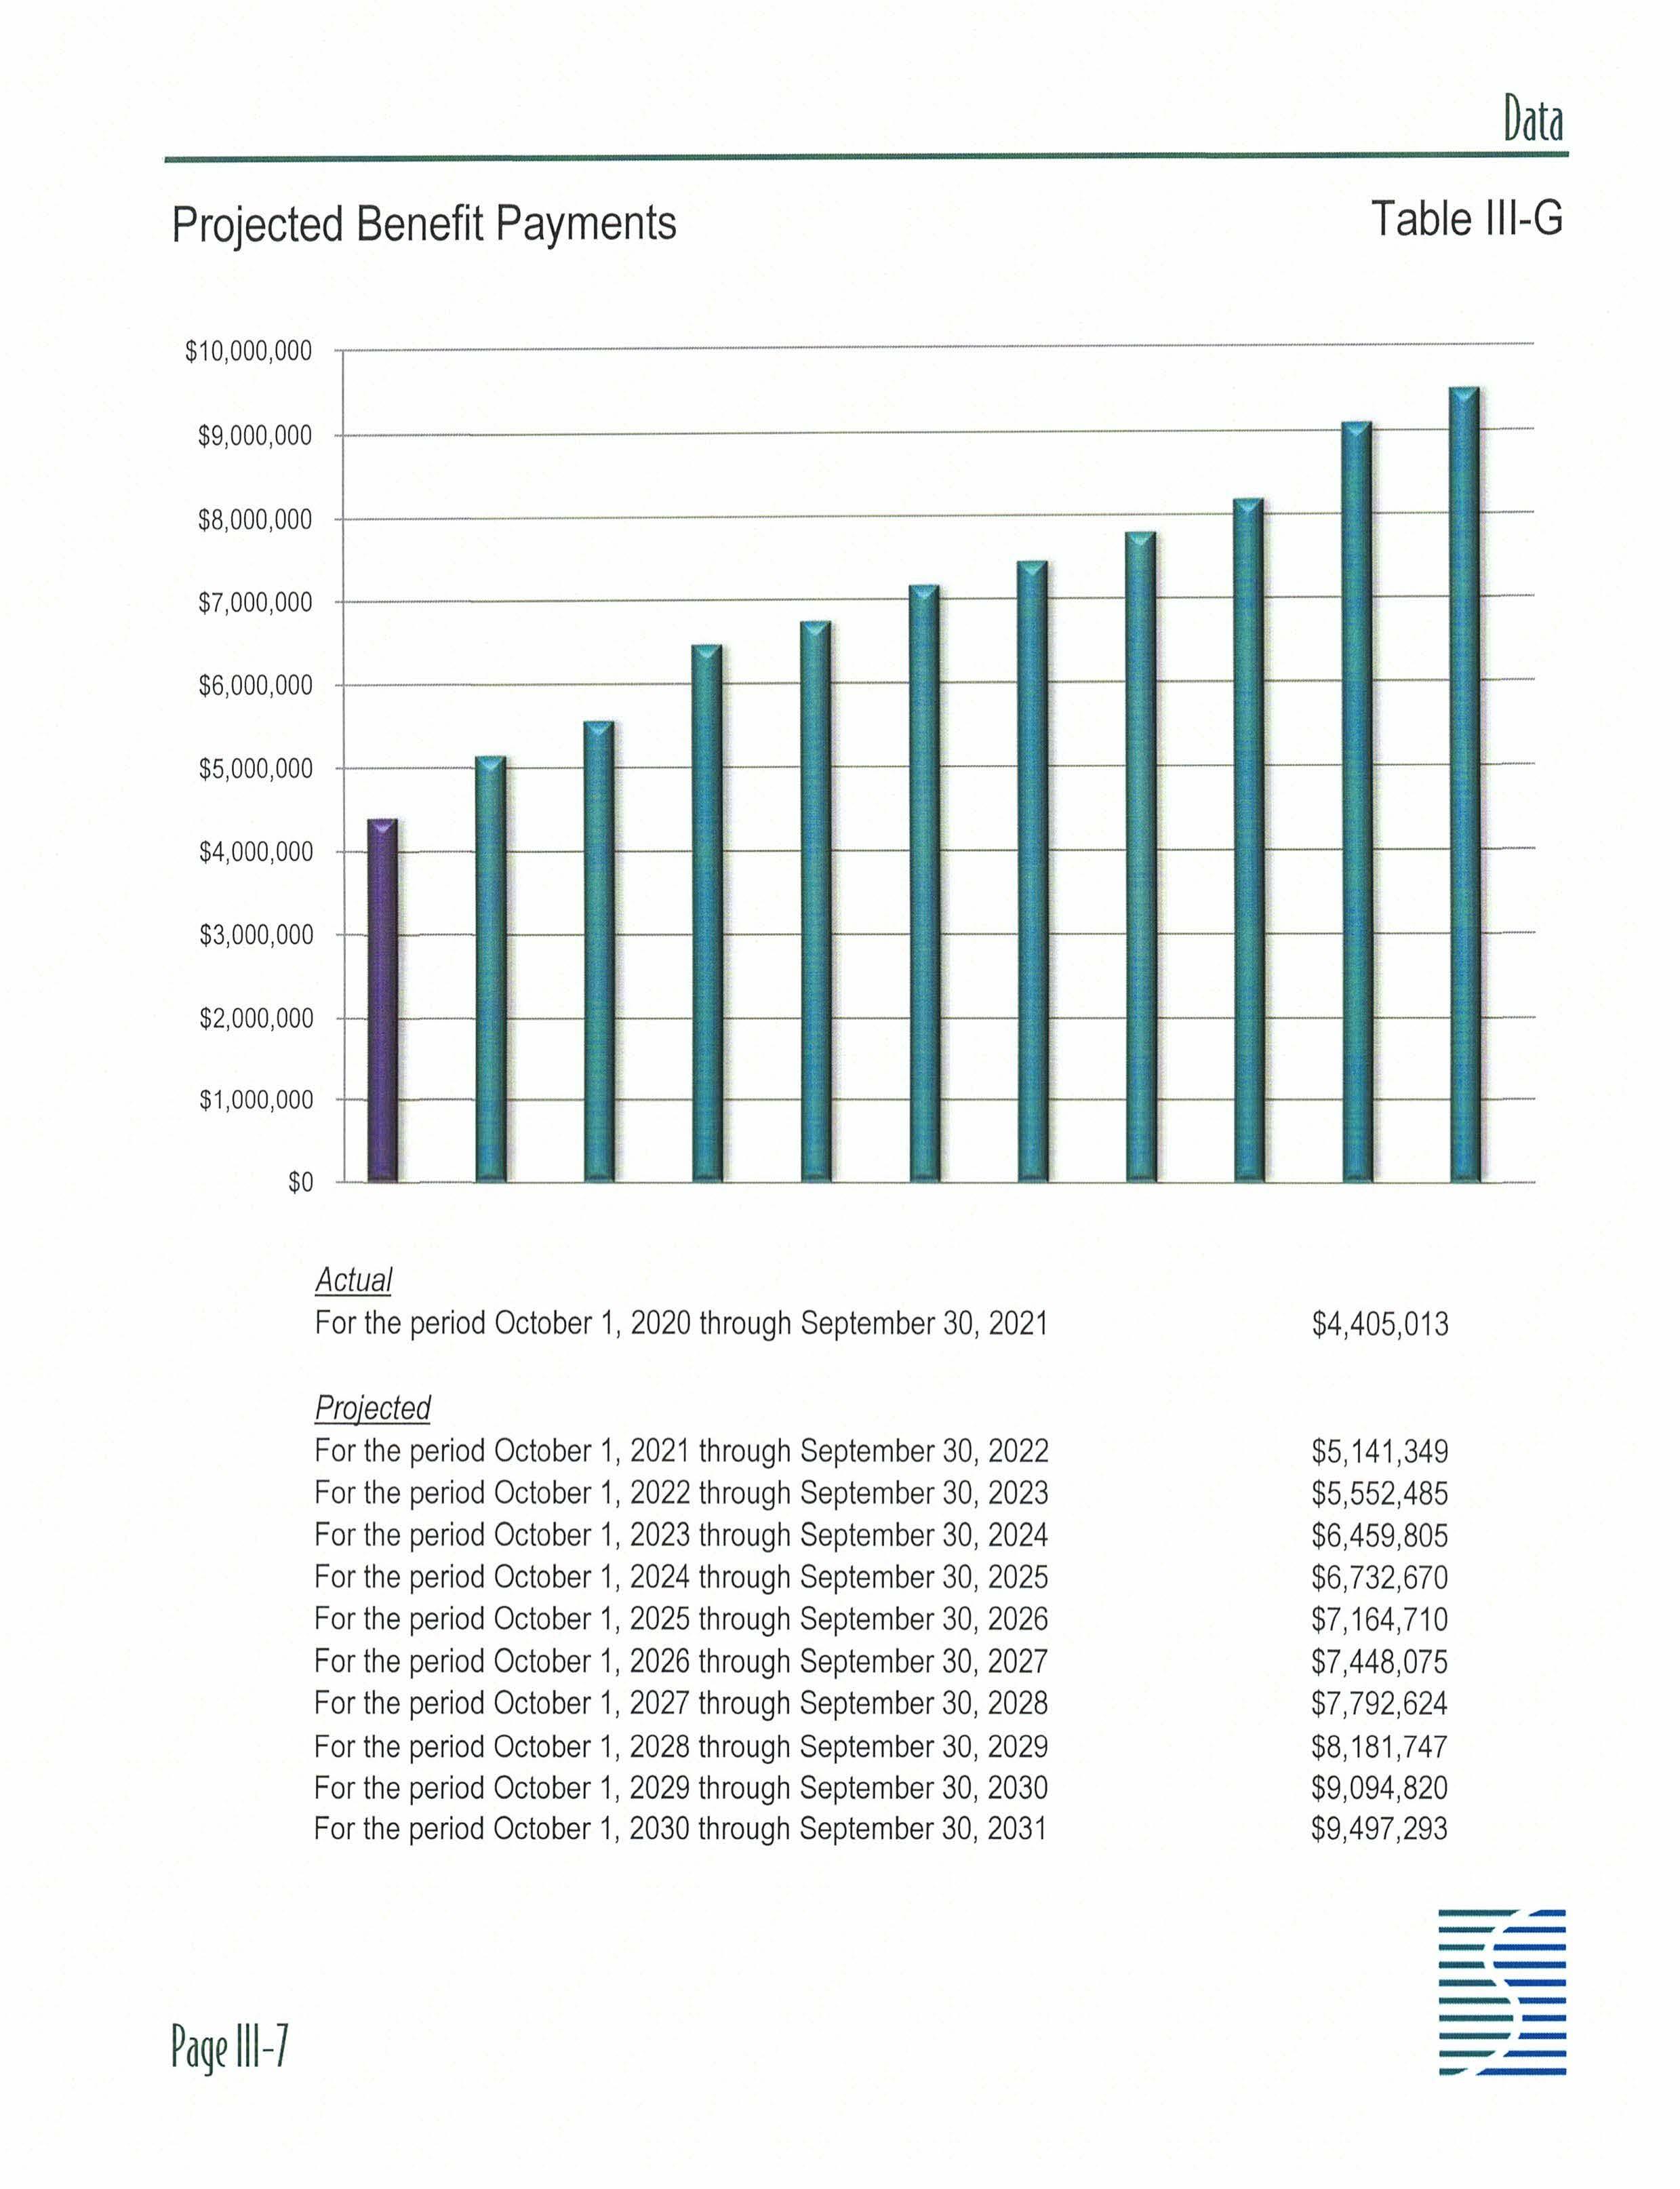
The most significant risk faced by most defined benefit pension plans is investment risk, i.e. the risk that long-term investment returns will be less than assumed. Other related risks include a risk that, if the investments of the plan decline dramatically over a short period of time (such as occurred with many pension plans in 2008) , the plan's assets may not have sufficient time to recover before benefits become due Even if the assets of the plan grow in accordance with the assumed investment return over time, if benefit payments are expected to be large in the short-term (for example, if the plan provides an actuarial equivalent lump sum payment option and a large number of participants are expected to become entitled to such a lump sum in the near future), the plan's assets may not be sufficient to support such a high level of benefit payments. We have provided a 10-year projection of the expected benefit payments in Table 111-G to help the Trustees in formulating an investment policy that is expected to provide an investment return that meets both the short- and long-term cash flow needs of the pension plan.
Another source of risk is demographic experience . This is the risk that participants will receive salary increases that are different than the amount assumed, that participants will retire , become disabled , or terminate their employment at a rate that is different than assumed , and that participants will live longer than assumed, just to cite a few examples of the demographic risk faced by the plan. Although for most pension plans, the demographic risk is not as significant as the investment risk, particularly in light of the fact that the mortality assumption includes a component for future life expectancy increases, the demographic risk can nevertheless be a significant contributing factor to liabilities and contribution rates that become higher than anticipated .
A third source of risk is the risk that the plan sponsor (or other contributing entities) will not make, or will not have the ability to make, the contributions that are required to keep the plan funded at a sufficient level. Material changes in the number of covered employees, covered payroll, and, in some cases, hours worked by active participants can also significantly impact the plan's liabilities and the level of contributions received by the plan.
Finally, an actuarial funding method has been used to allocate the gap between projected liablities and assets to each year in the future The contribution rate under some funding methods is higher during the early years of the plan and then is lower during the later years of the plan Other funding methods provide for lower contribution rates initially, with increasing contribution rates over time
The Trustees have adopted the individual entry age normal funding method for this plan with level-dollar payments towards the unfunded accrued liability, which is expected to result in a contribution rate that decreases over time as a percentage of payroll. A brief description of the actuarial funding method is provided in Table IV-A.
Contents of the Report
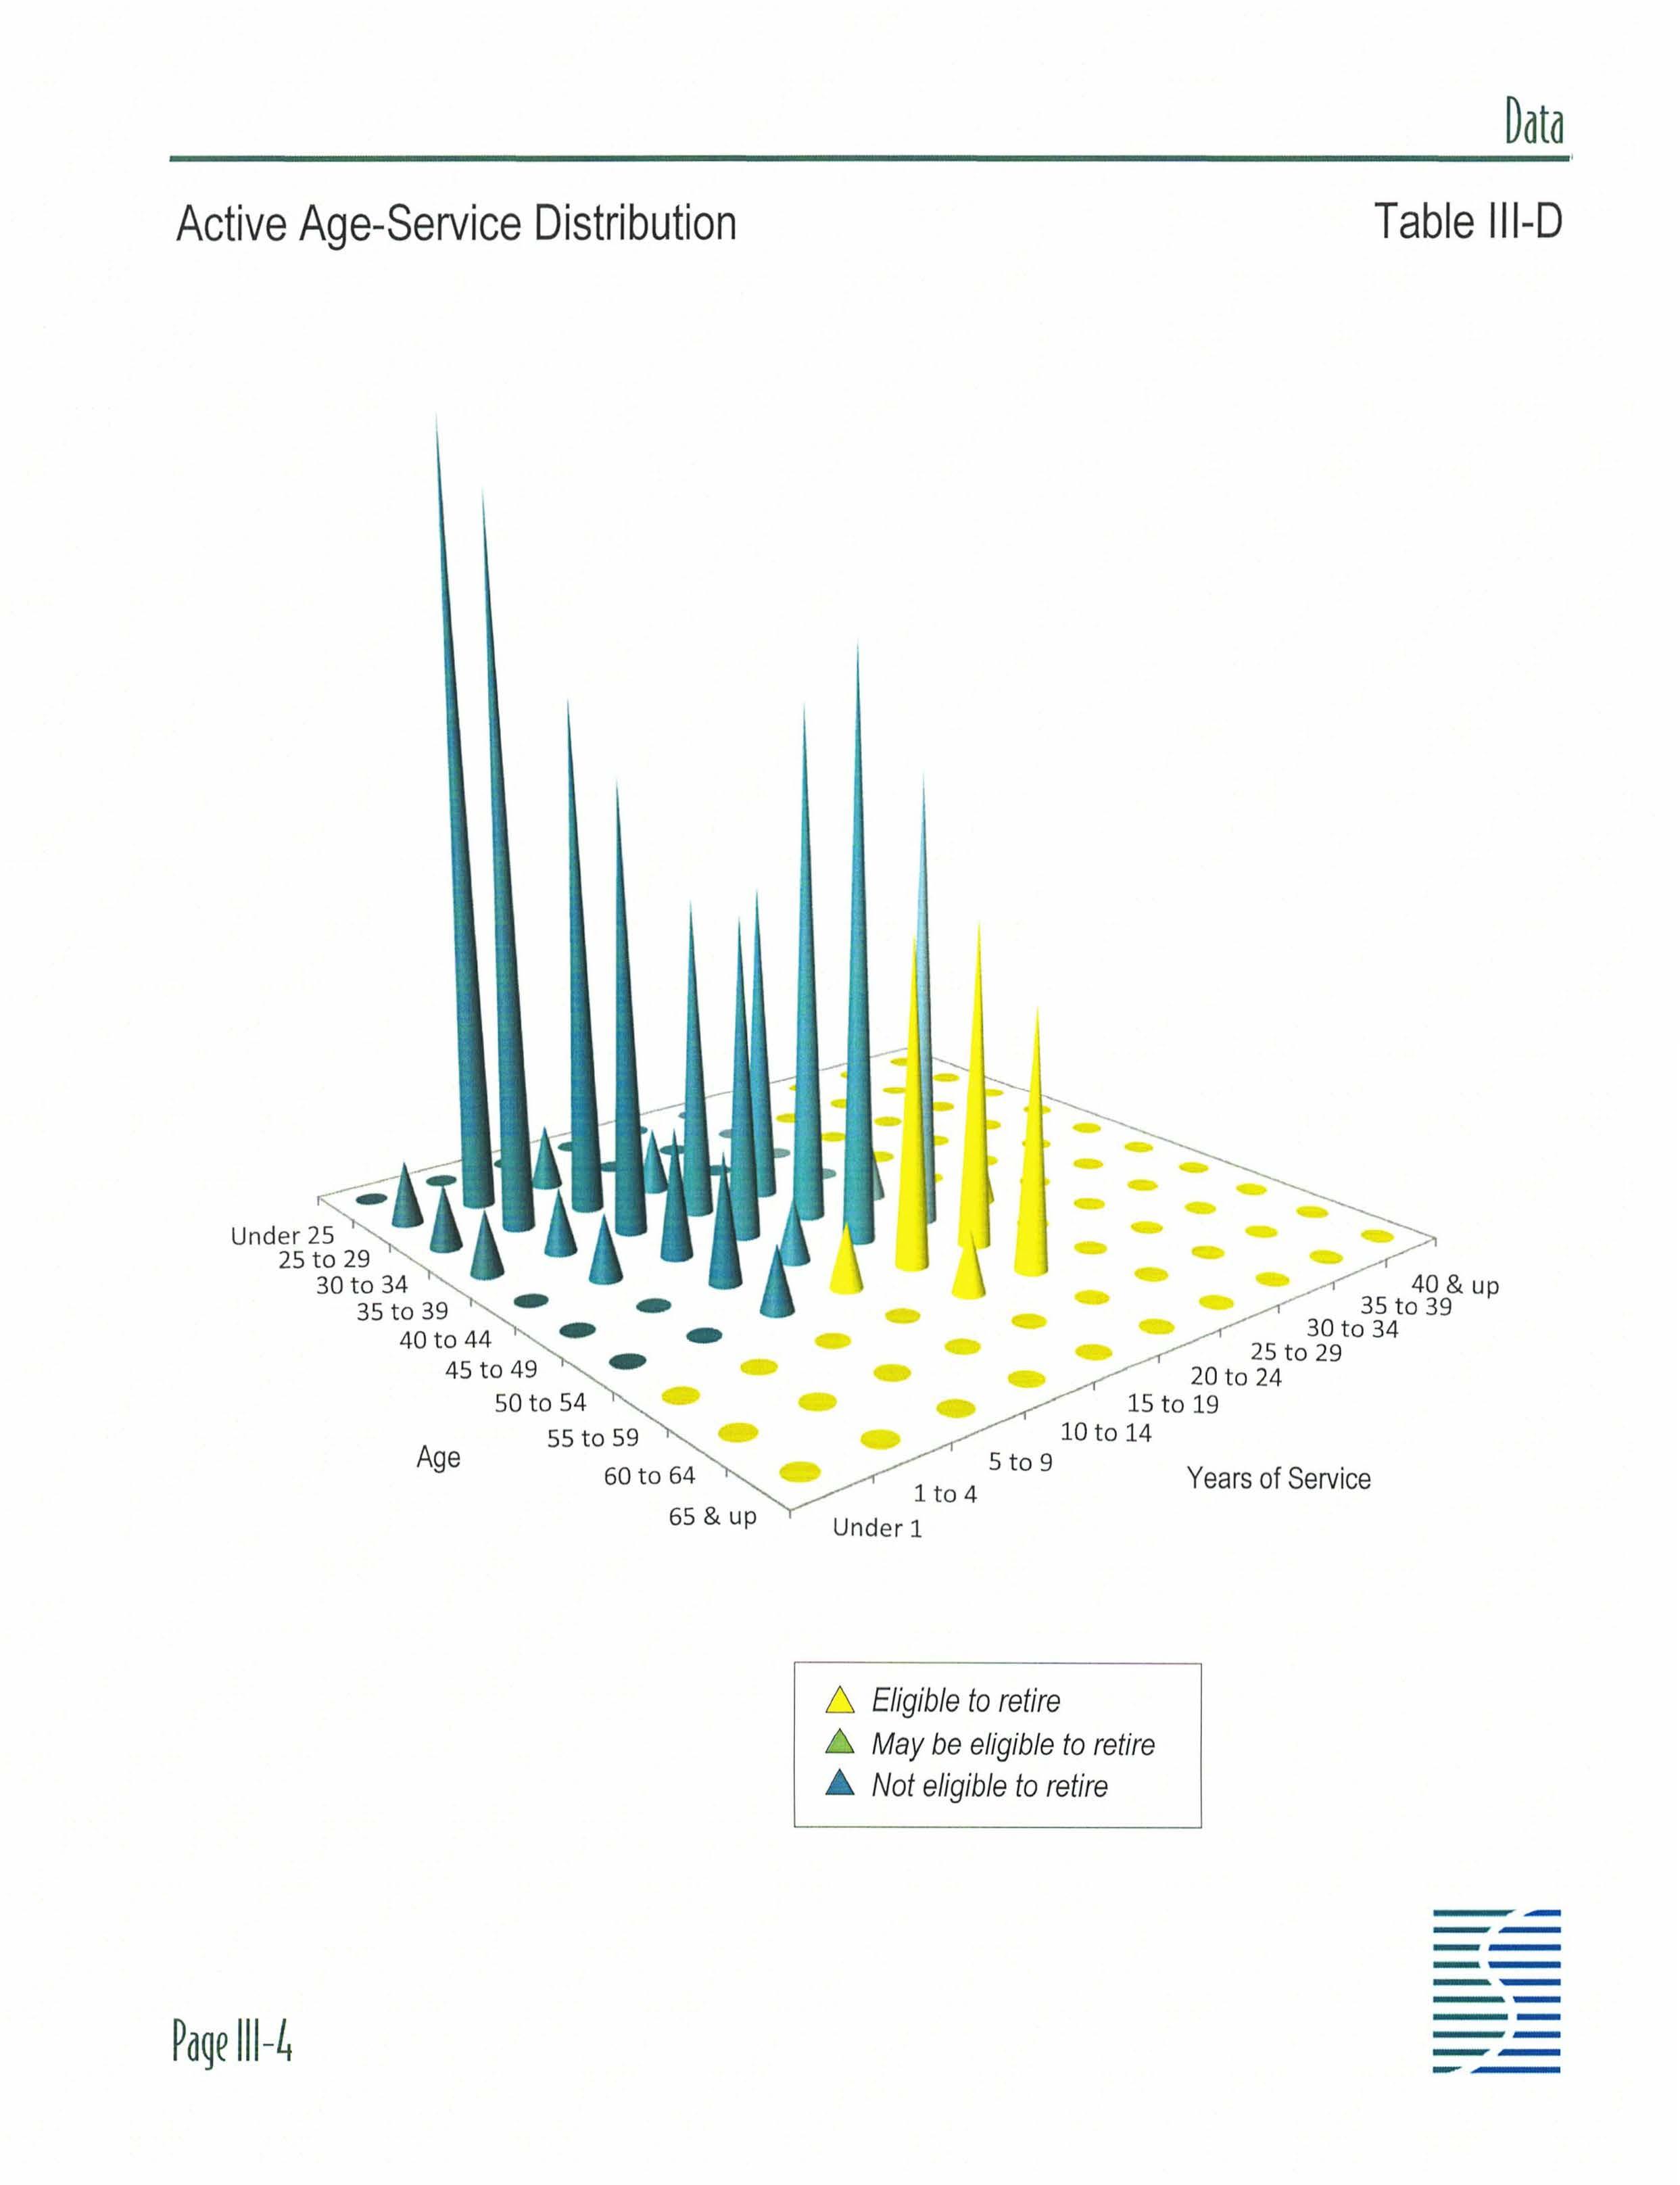
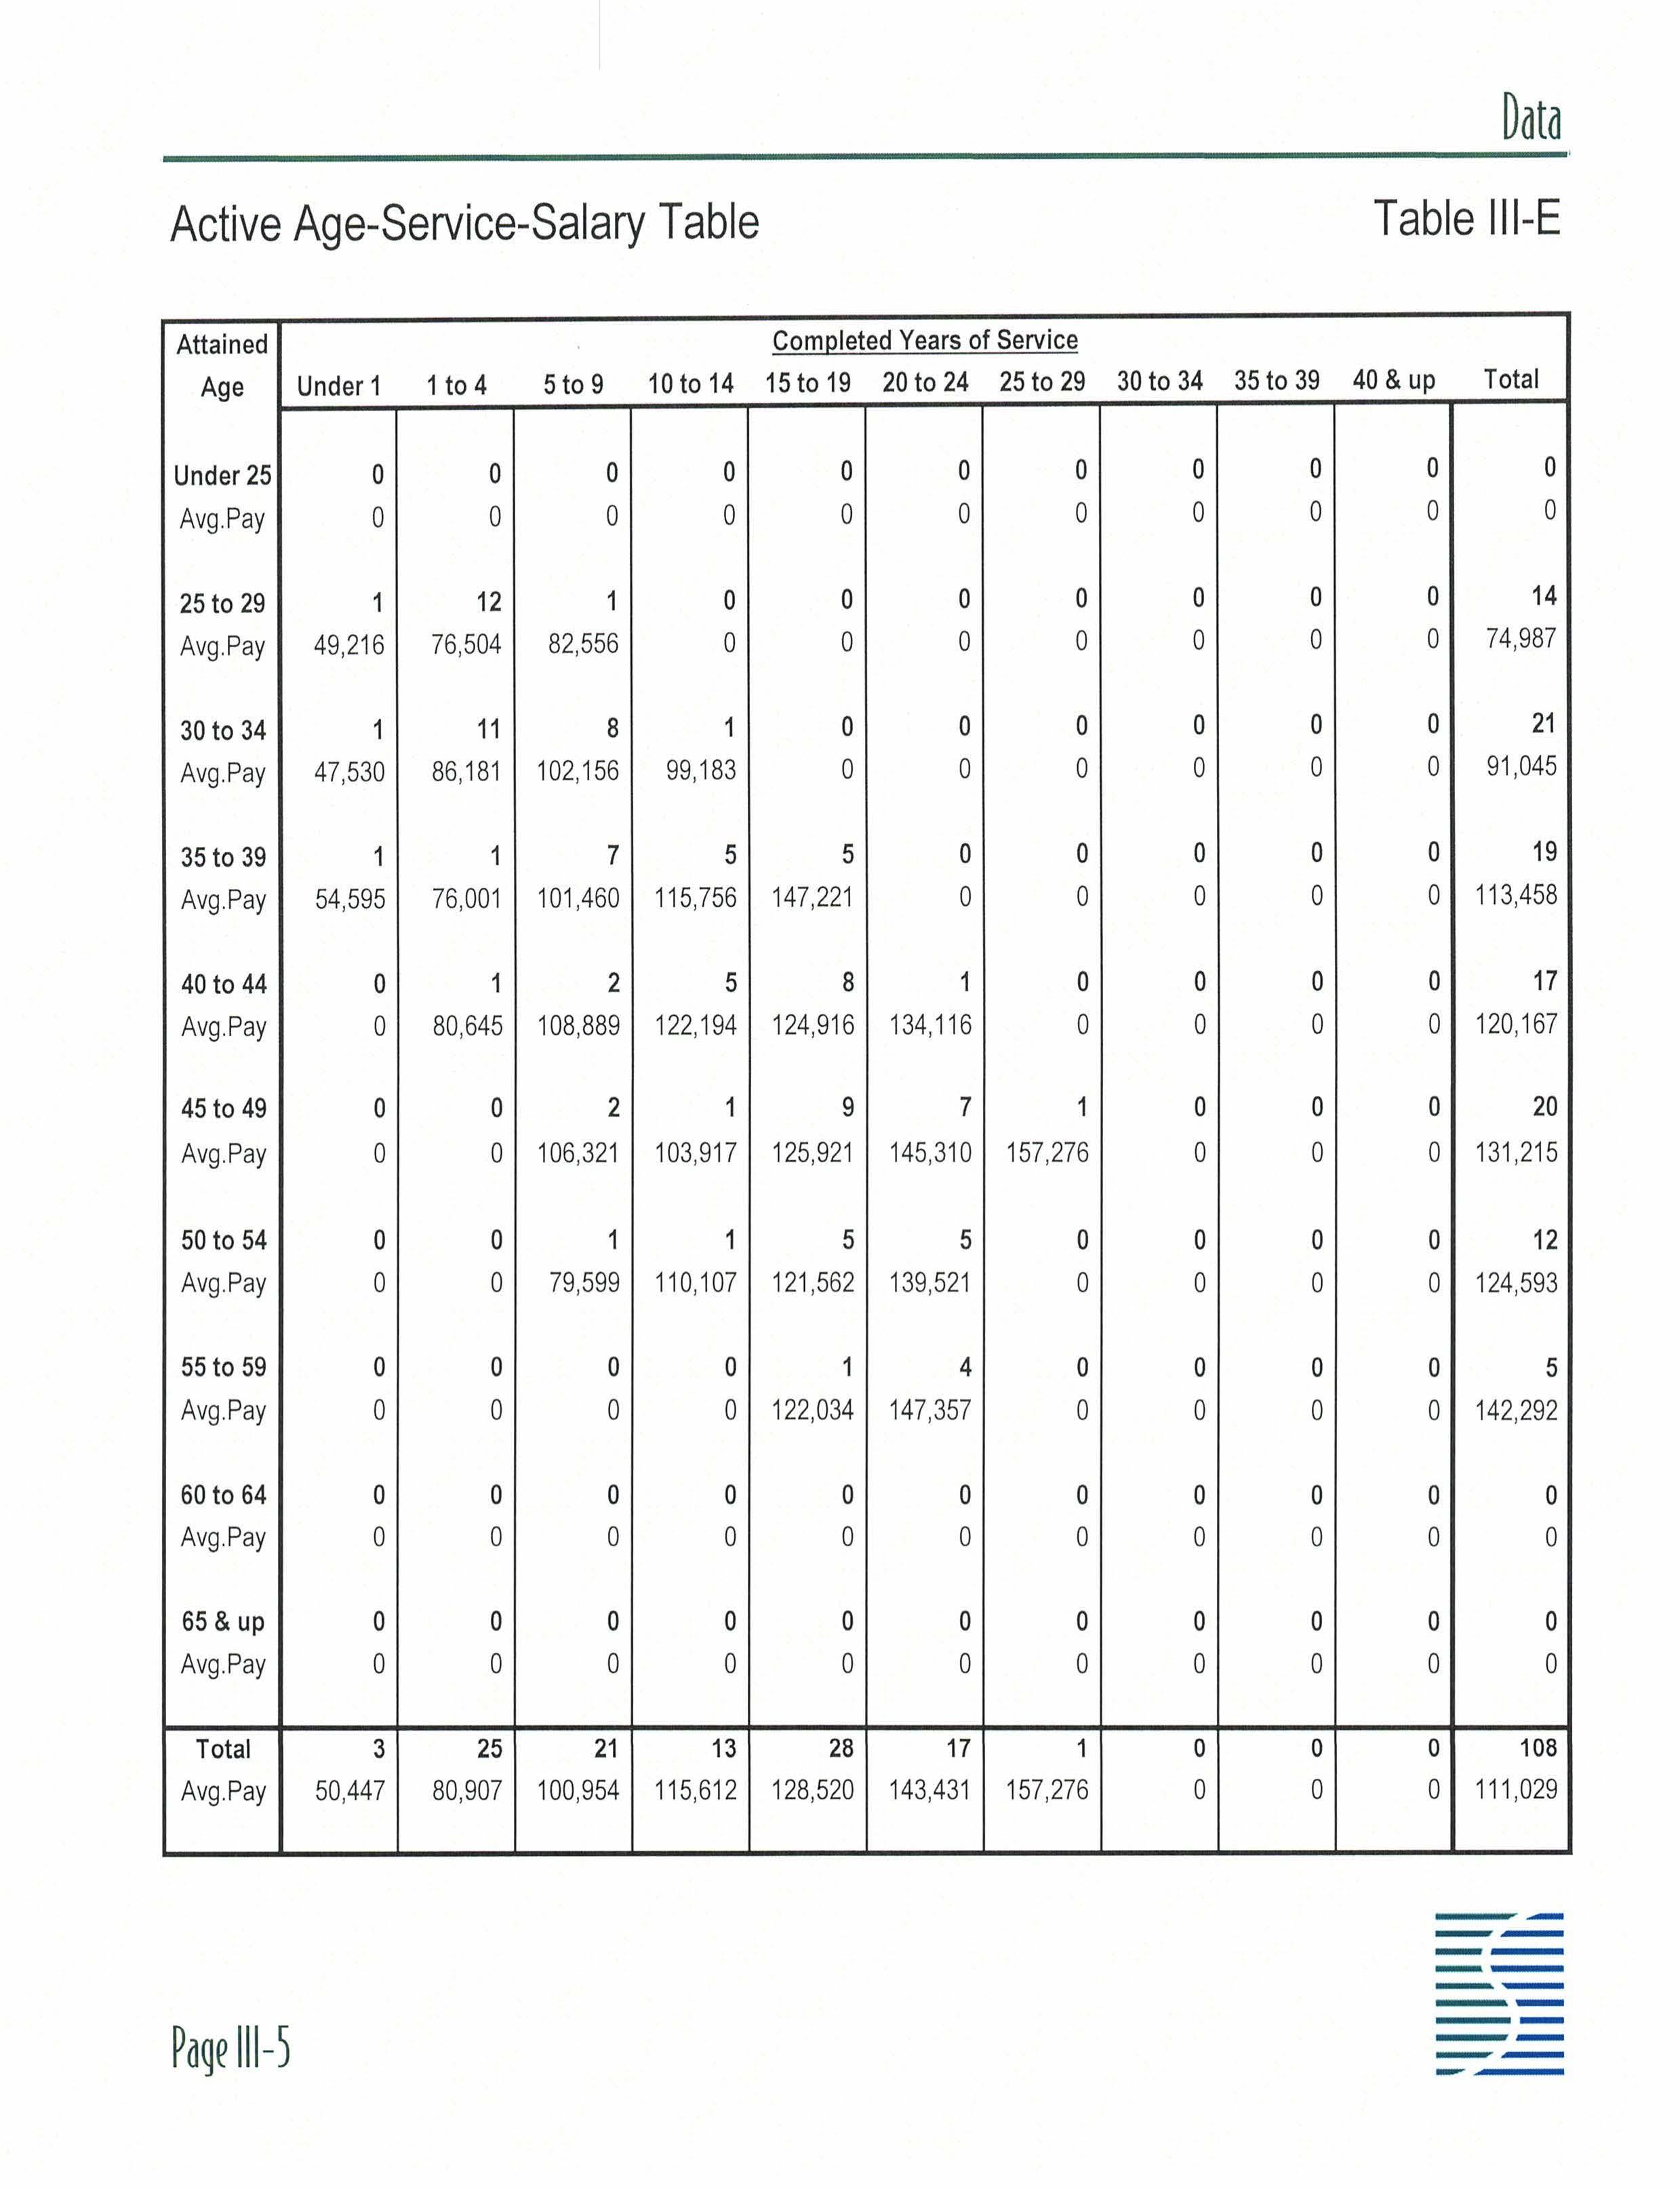
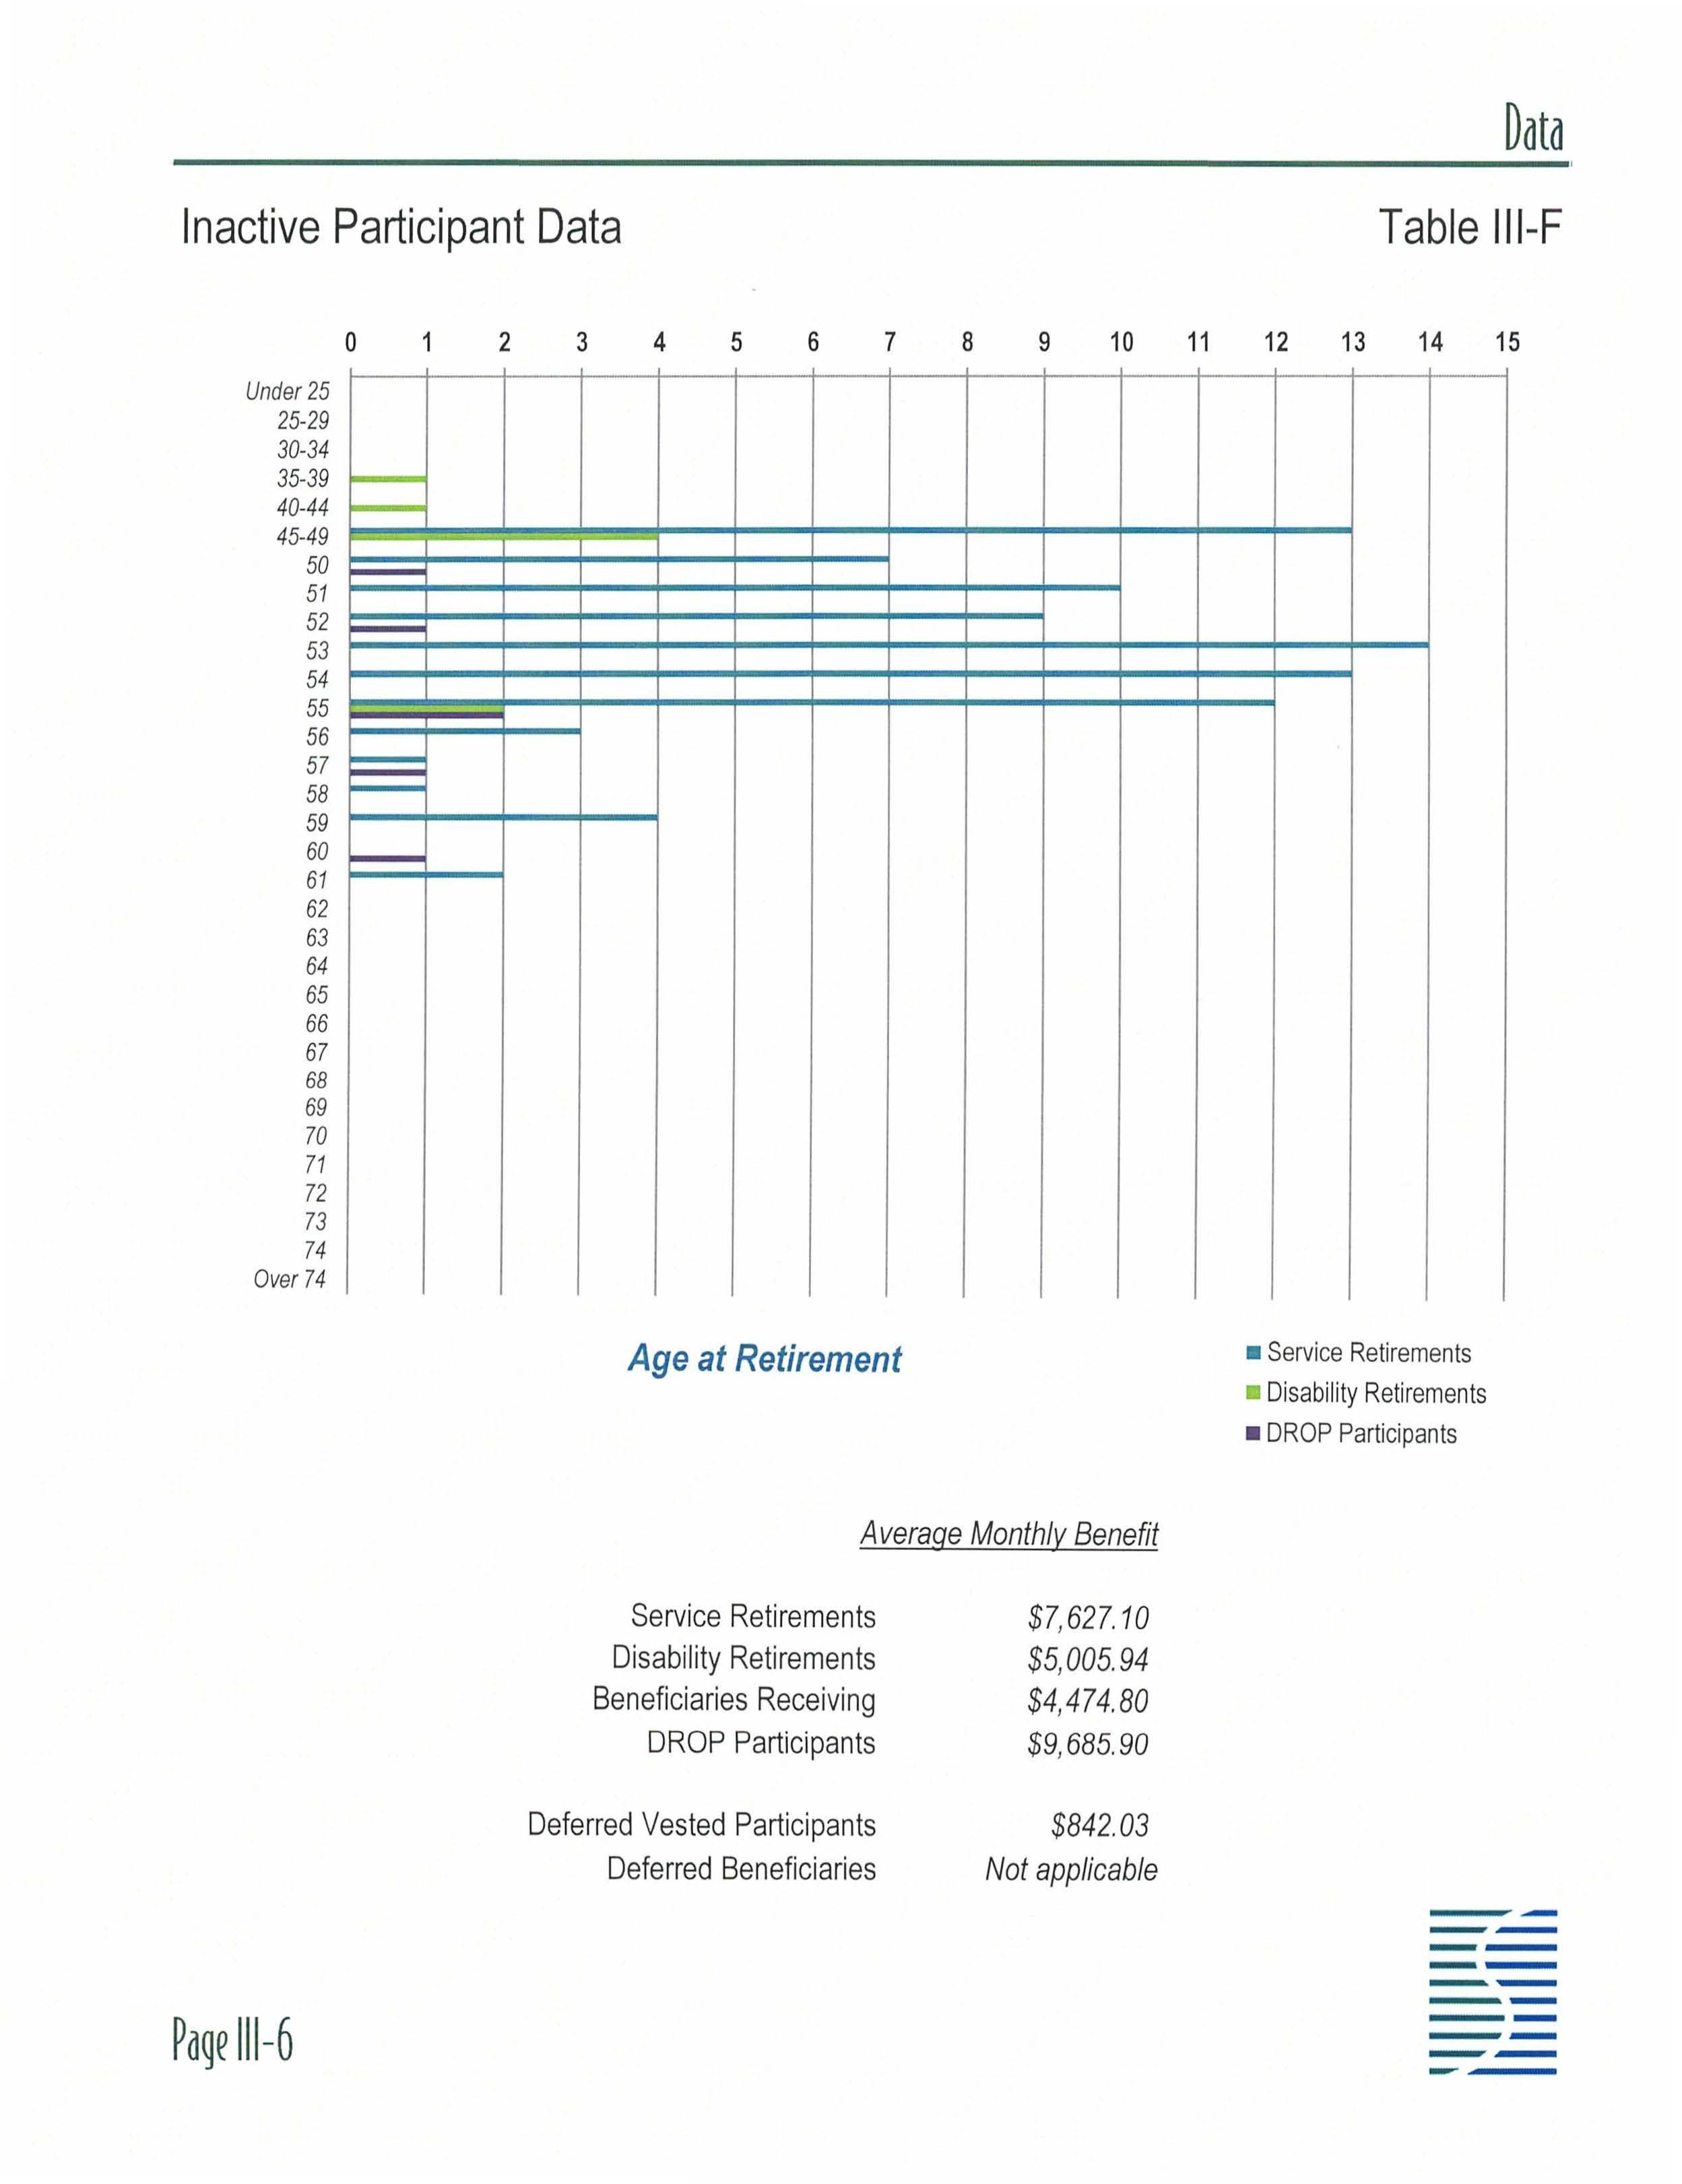
Tables 1-0 through 1-H provide a detailed breakdown of various liability amounts by type of benefit and by participant group. Tables 11-A through 11-F provide information concerning the assets of the trust fund . Specifically, Table 11-A shows the development of the actuarial value of assets, which is based on a three-year phase-in of the net investment appreciation in order to provide a more stable and predictable contribution rate for the employer. Tables Ill-A through 111-G provide statistical information concerning the plan 's participant population. In particular, Table 111-G gives a 10-year projection of the cash that is expected to be required from the trust fund in order to pay benefits to the current group of participants. Finally, Tables IV-A through V-B provide a summary of the actuarial assumptions and methods that are used to value the plan 's benefits and of the relevant plan provisions as of October 1, 2021 , as well as a summary of the changes that have occurred since the previous valuation report was prepared .
Certification
This actuarial valuation was prepared by me or under my direct supervision and I acknowledge responsibility for the results To the best of my knowledge, the results are complete and accurate and, in my opinion , the techniques and assumptions used are reasonable and meet the requirements and intent of Chapter 112, Florida Statutes. There is no benefit or expense to be provided by the plan and/or paid from the plan 's assets for which liabilities or current costs have not been established or otherwise taken into account in the valuation All known events or trends which may require a material change in plan costs or required contribution rates have been taken into account in the valuation .
For the firm ,
J. l~
Charles T Carr Consulting Actuary
Southern Actuarial Services Company, Inc.
Enrolled Actuary No. 20-04927
The individual above is a member of the American Academy of Actuaries and meets the Qualification Standards of the American Academy of Actuaries to render the actuarial opinion contained herein.
Minimum Required Contribution Table I-A (continued)
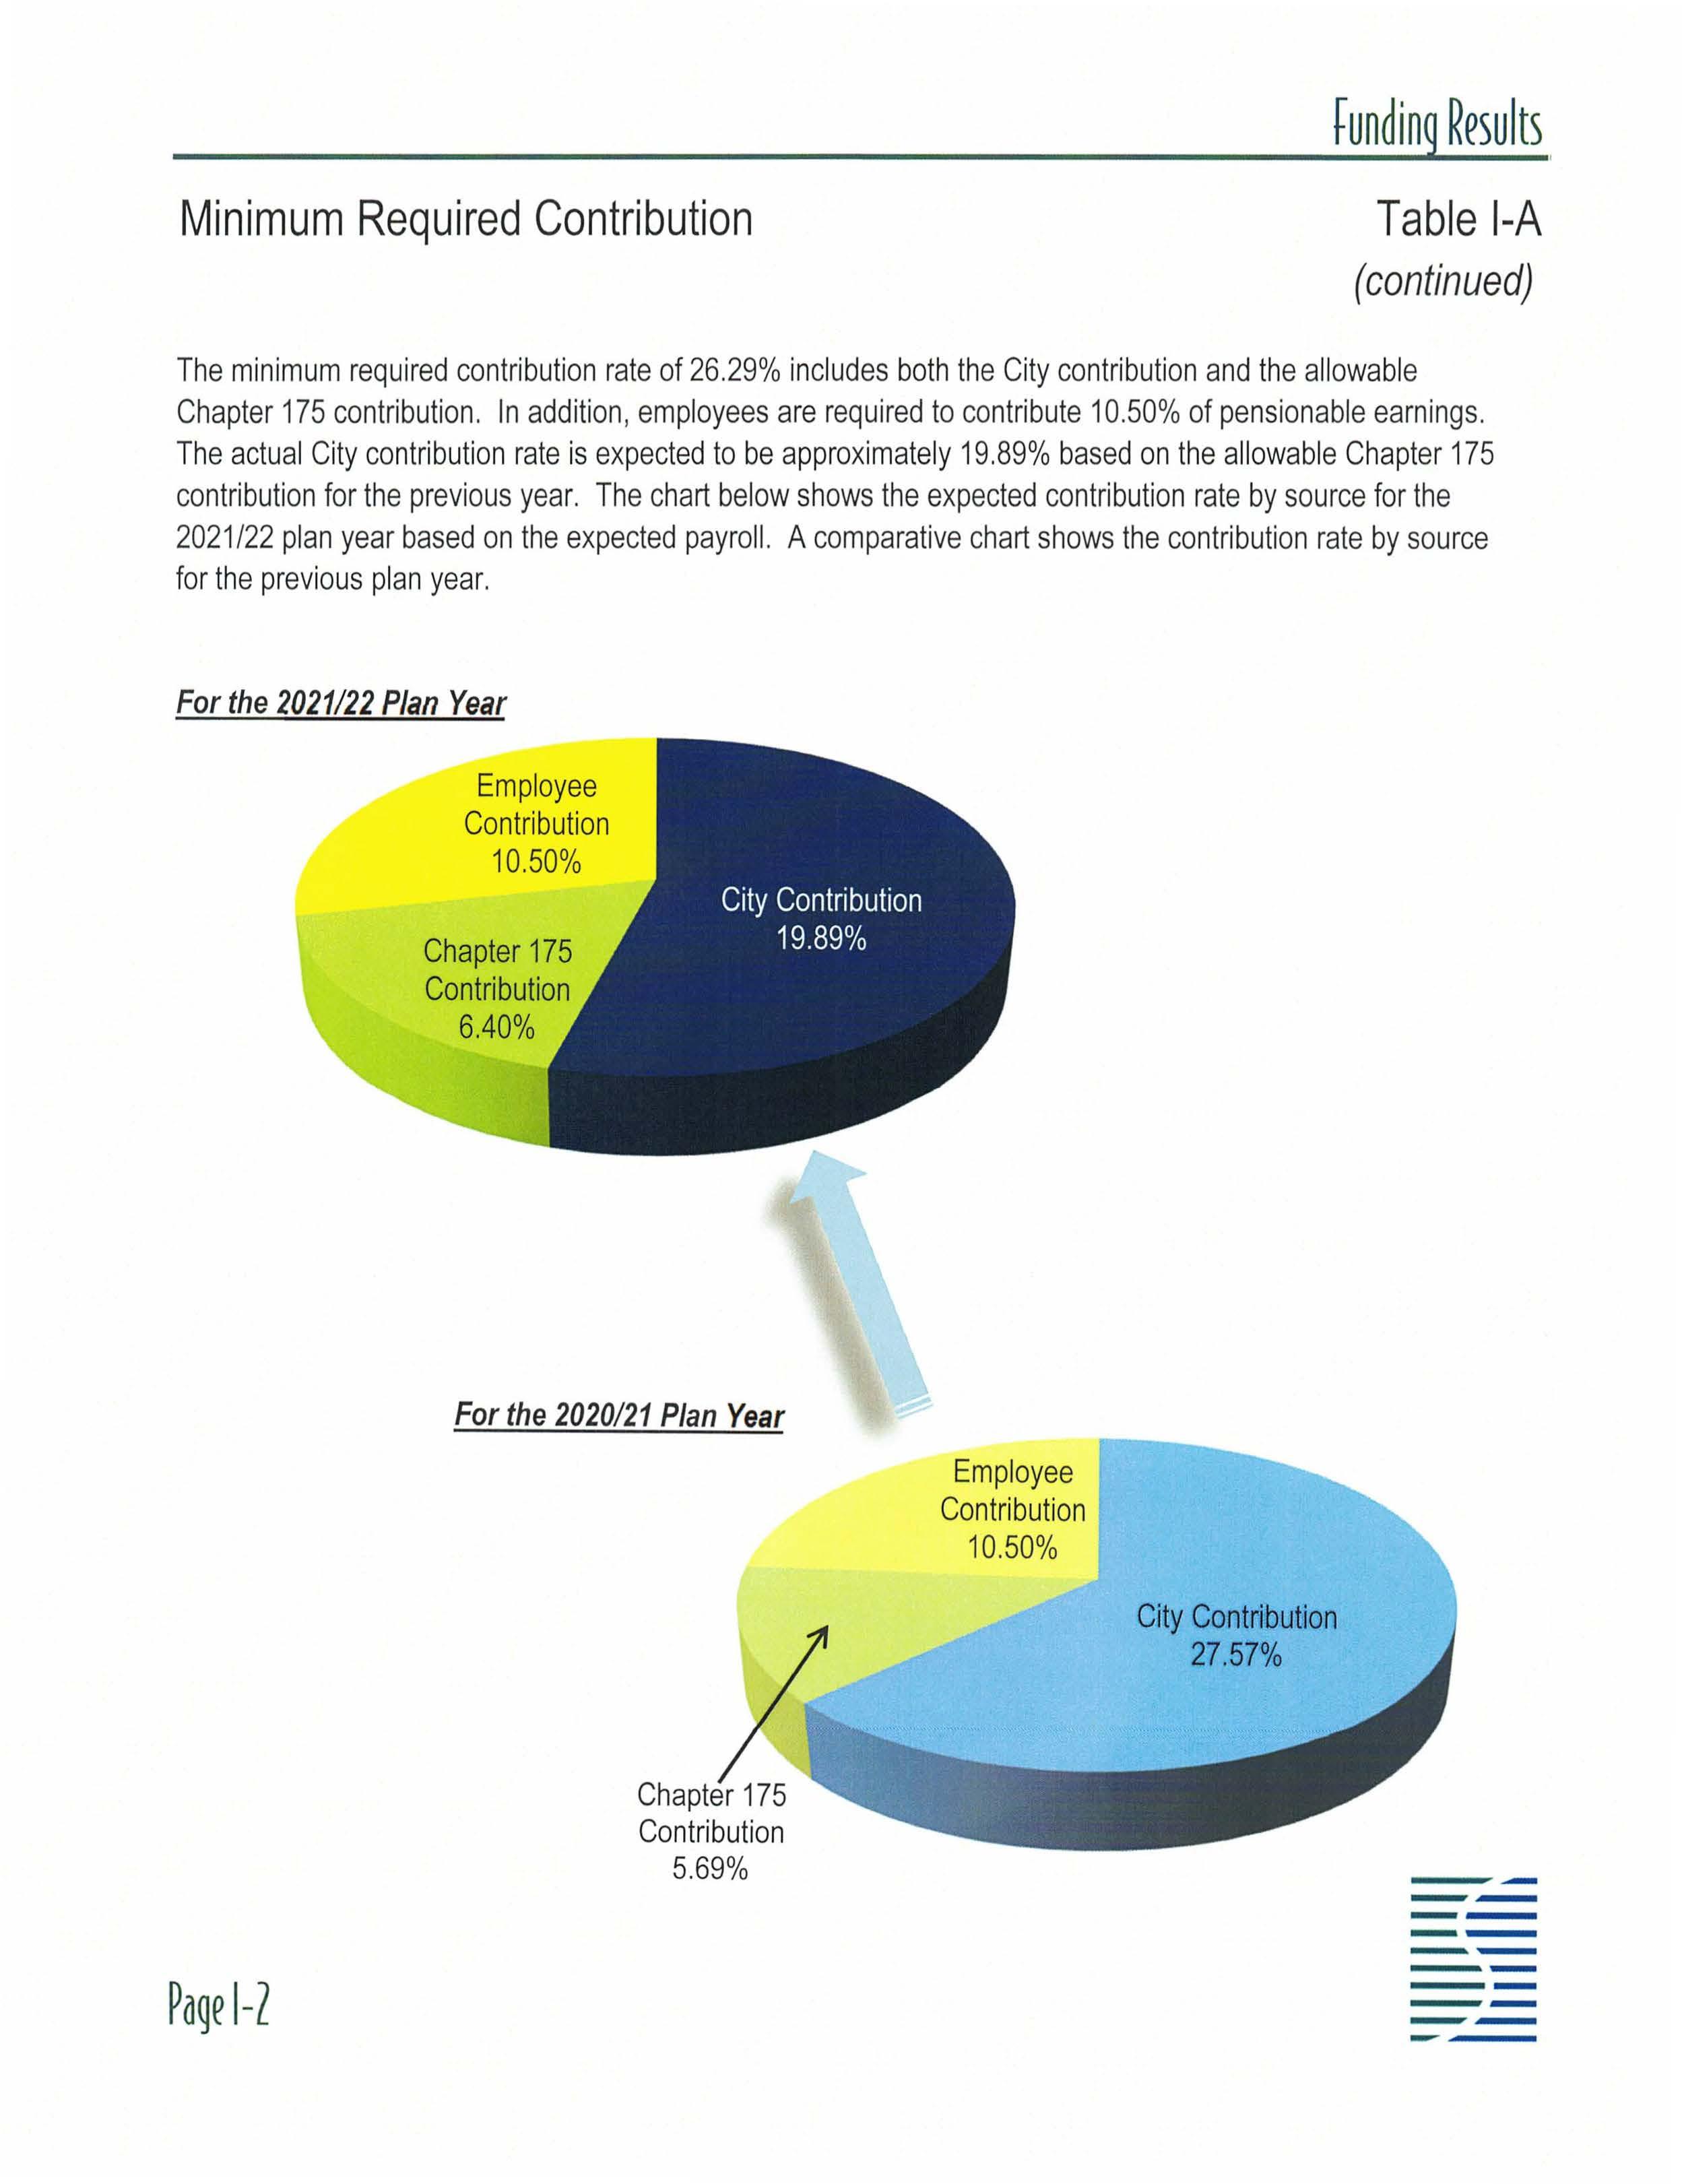
The minimum required contribution rate of 26 29% includes both the City contribution and the allowable Chapter 175 contribution . In addition , employees are required to contribute 10.50%of pensionable earnings. The actual City contribution rate is expected to be approximately 19.89% based on the allowable Chapter 175 contribution for the previous year. The chart below shows the expected contribution rate by source for the 2021 /22 plan year based on the expected payroll . A comparative chart shows the contribution rate by source for the previous plan year
For the 2021/22 Plan Year
For the 2020/21 Plan Year
Sensitivity Analysis Table 1-B
Current Contribution
Contribution Rate if Rate
Contribution Rate if
Earn 2% Less Annually Over Time Annually Over Time
Earn 2% More
The line above illustrates the sensitivity of the contribution rate to changes in the long-term investment return.
Gain and Loss Analysis
Source of Change in the Contribution Rate
Previous minimum required contribution rate
Increase (decrease) due to investment gains and losses
Increase (decrease) due to demographic experience
Increase (decrease) due to plan amendments
Increase (decrease) due to actuarial assumption changes
Increase (decrease) due to actuarial method changes
Current minimum required contribution rate
Source of Change in the Unfunded Liability
Previous unfunded liability
Increase due to employer normal cost for the prior year
Increase due to interest on normal cost and unfunded liability
Decrease due to employer contributions
Decrease due to interest on employer contributions
Expected unfunded liability
Increase (decrease) due to plan experience
Increase (decrease) due to plan amendments
Increase (decrease) due to actuarial assumption changes
Increase (decrease) due to actuarial method changes
Current unfunded liability
$5,378,994
$3,143,809
$596,596
($4,193,852) ($220,066) --~-----'--
$4,705,481
($4,705,481)
$0
$0
$0
$0
Present Value of Future Benefits Table 1-D
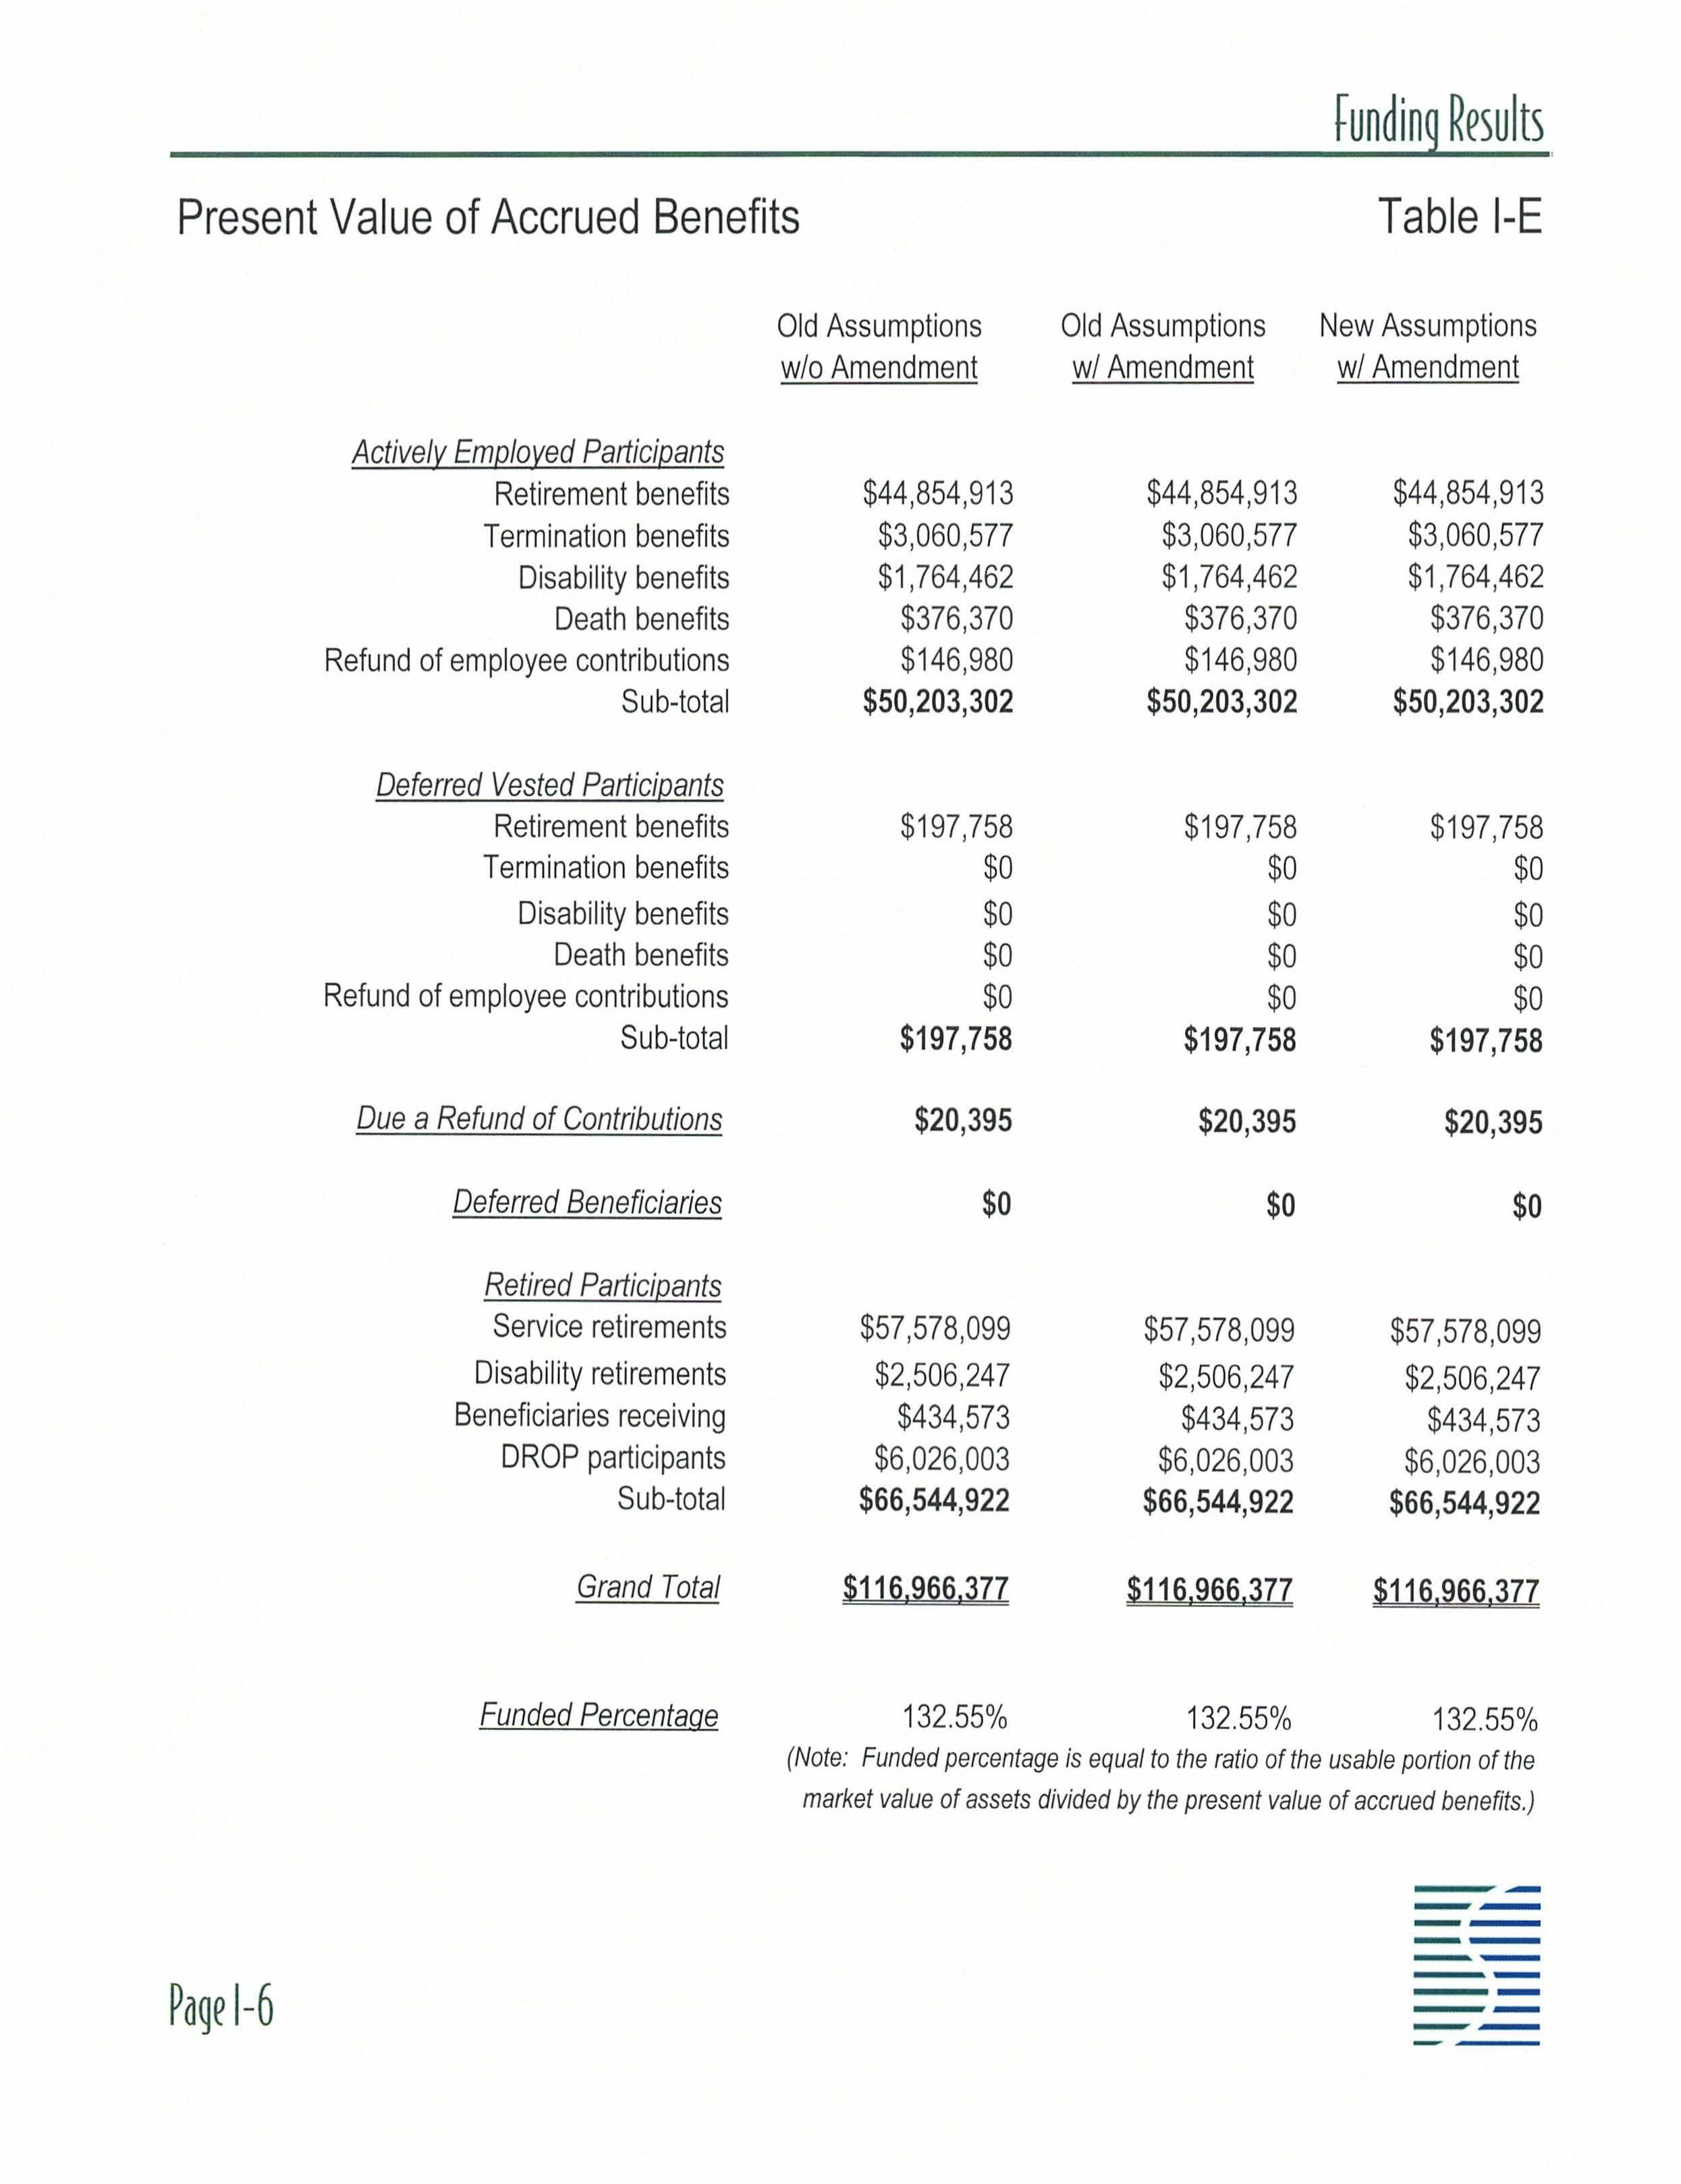
Present Value of Accrued Benefits Table 1-E
Vested Particieants
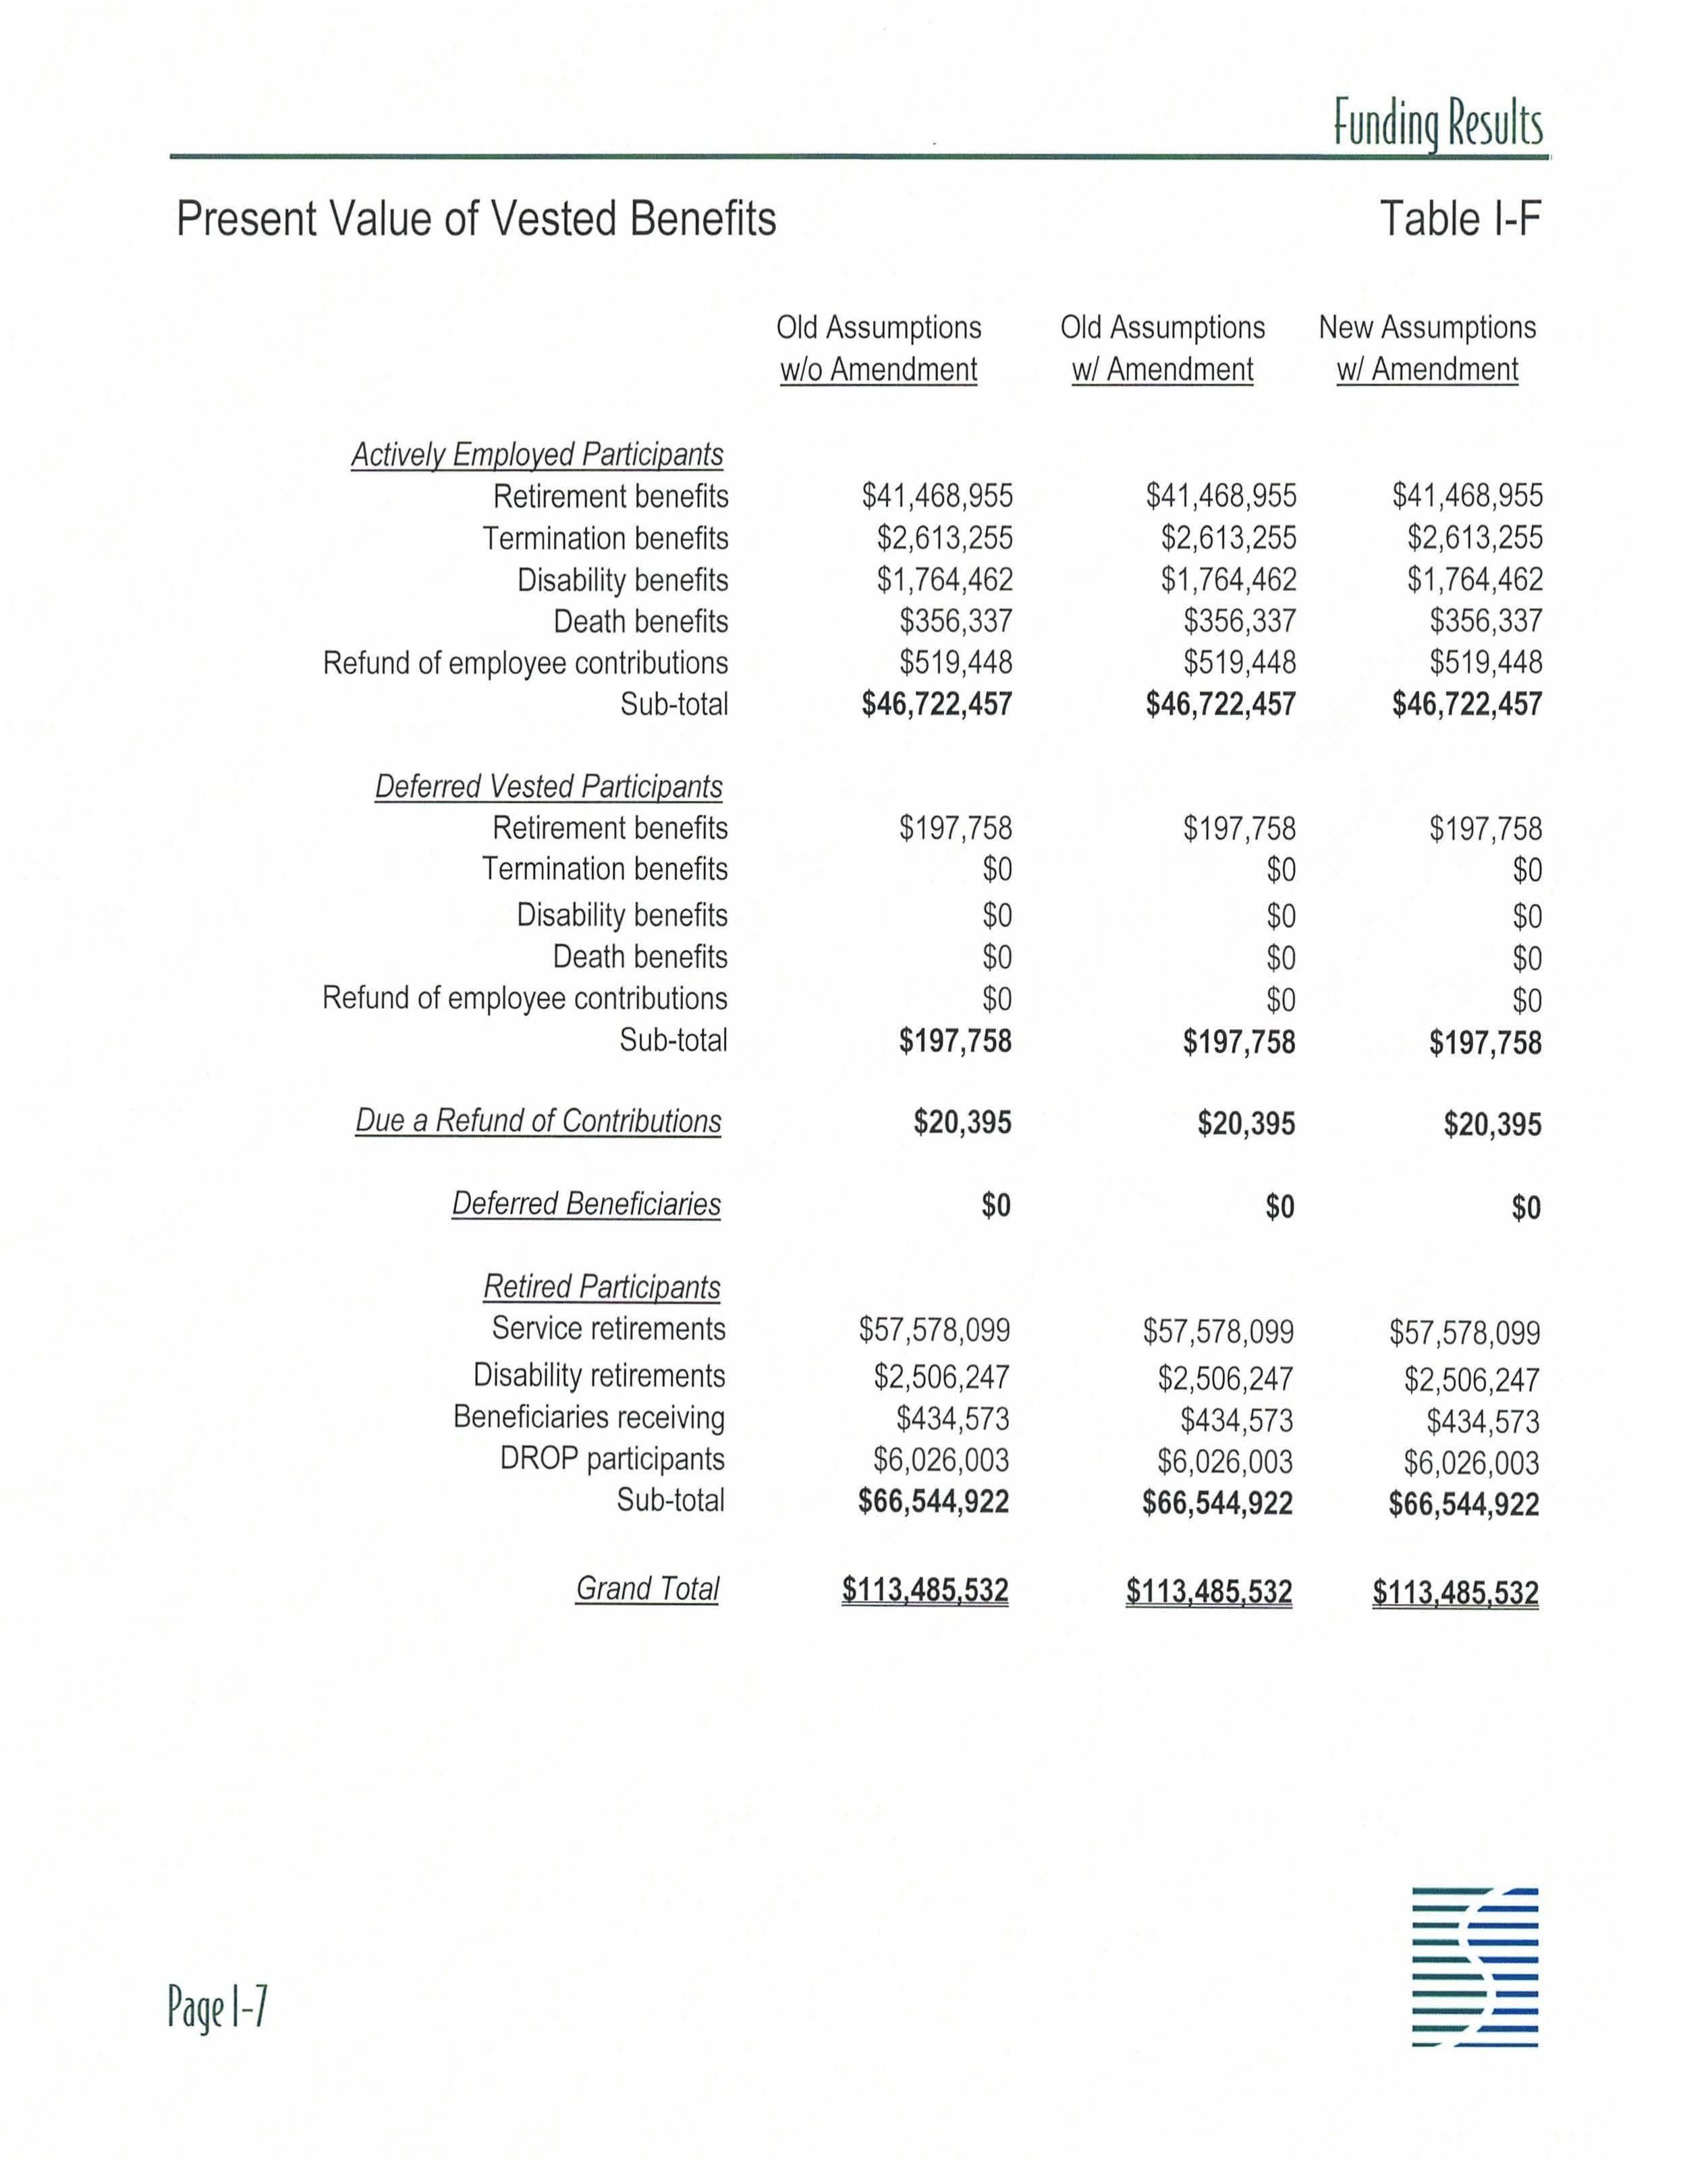
Present Value of Vested Benefits Table 1-F
EmQIO'lf.ed ParticiQants
Vested ParticiQants
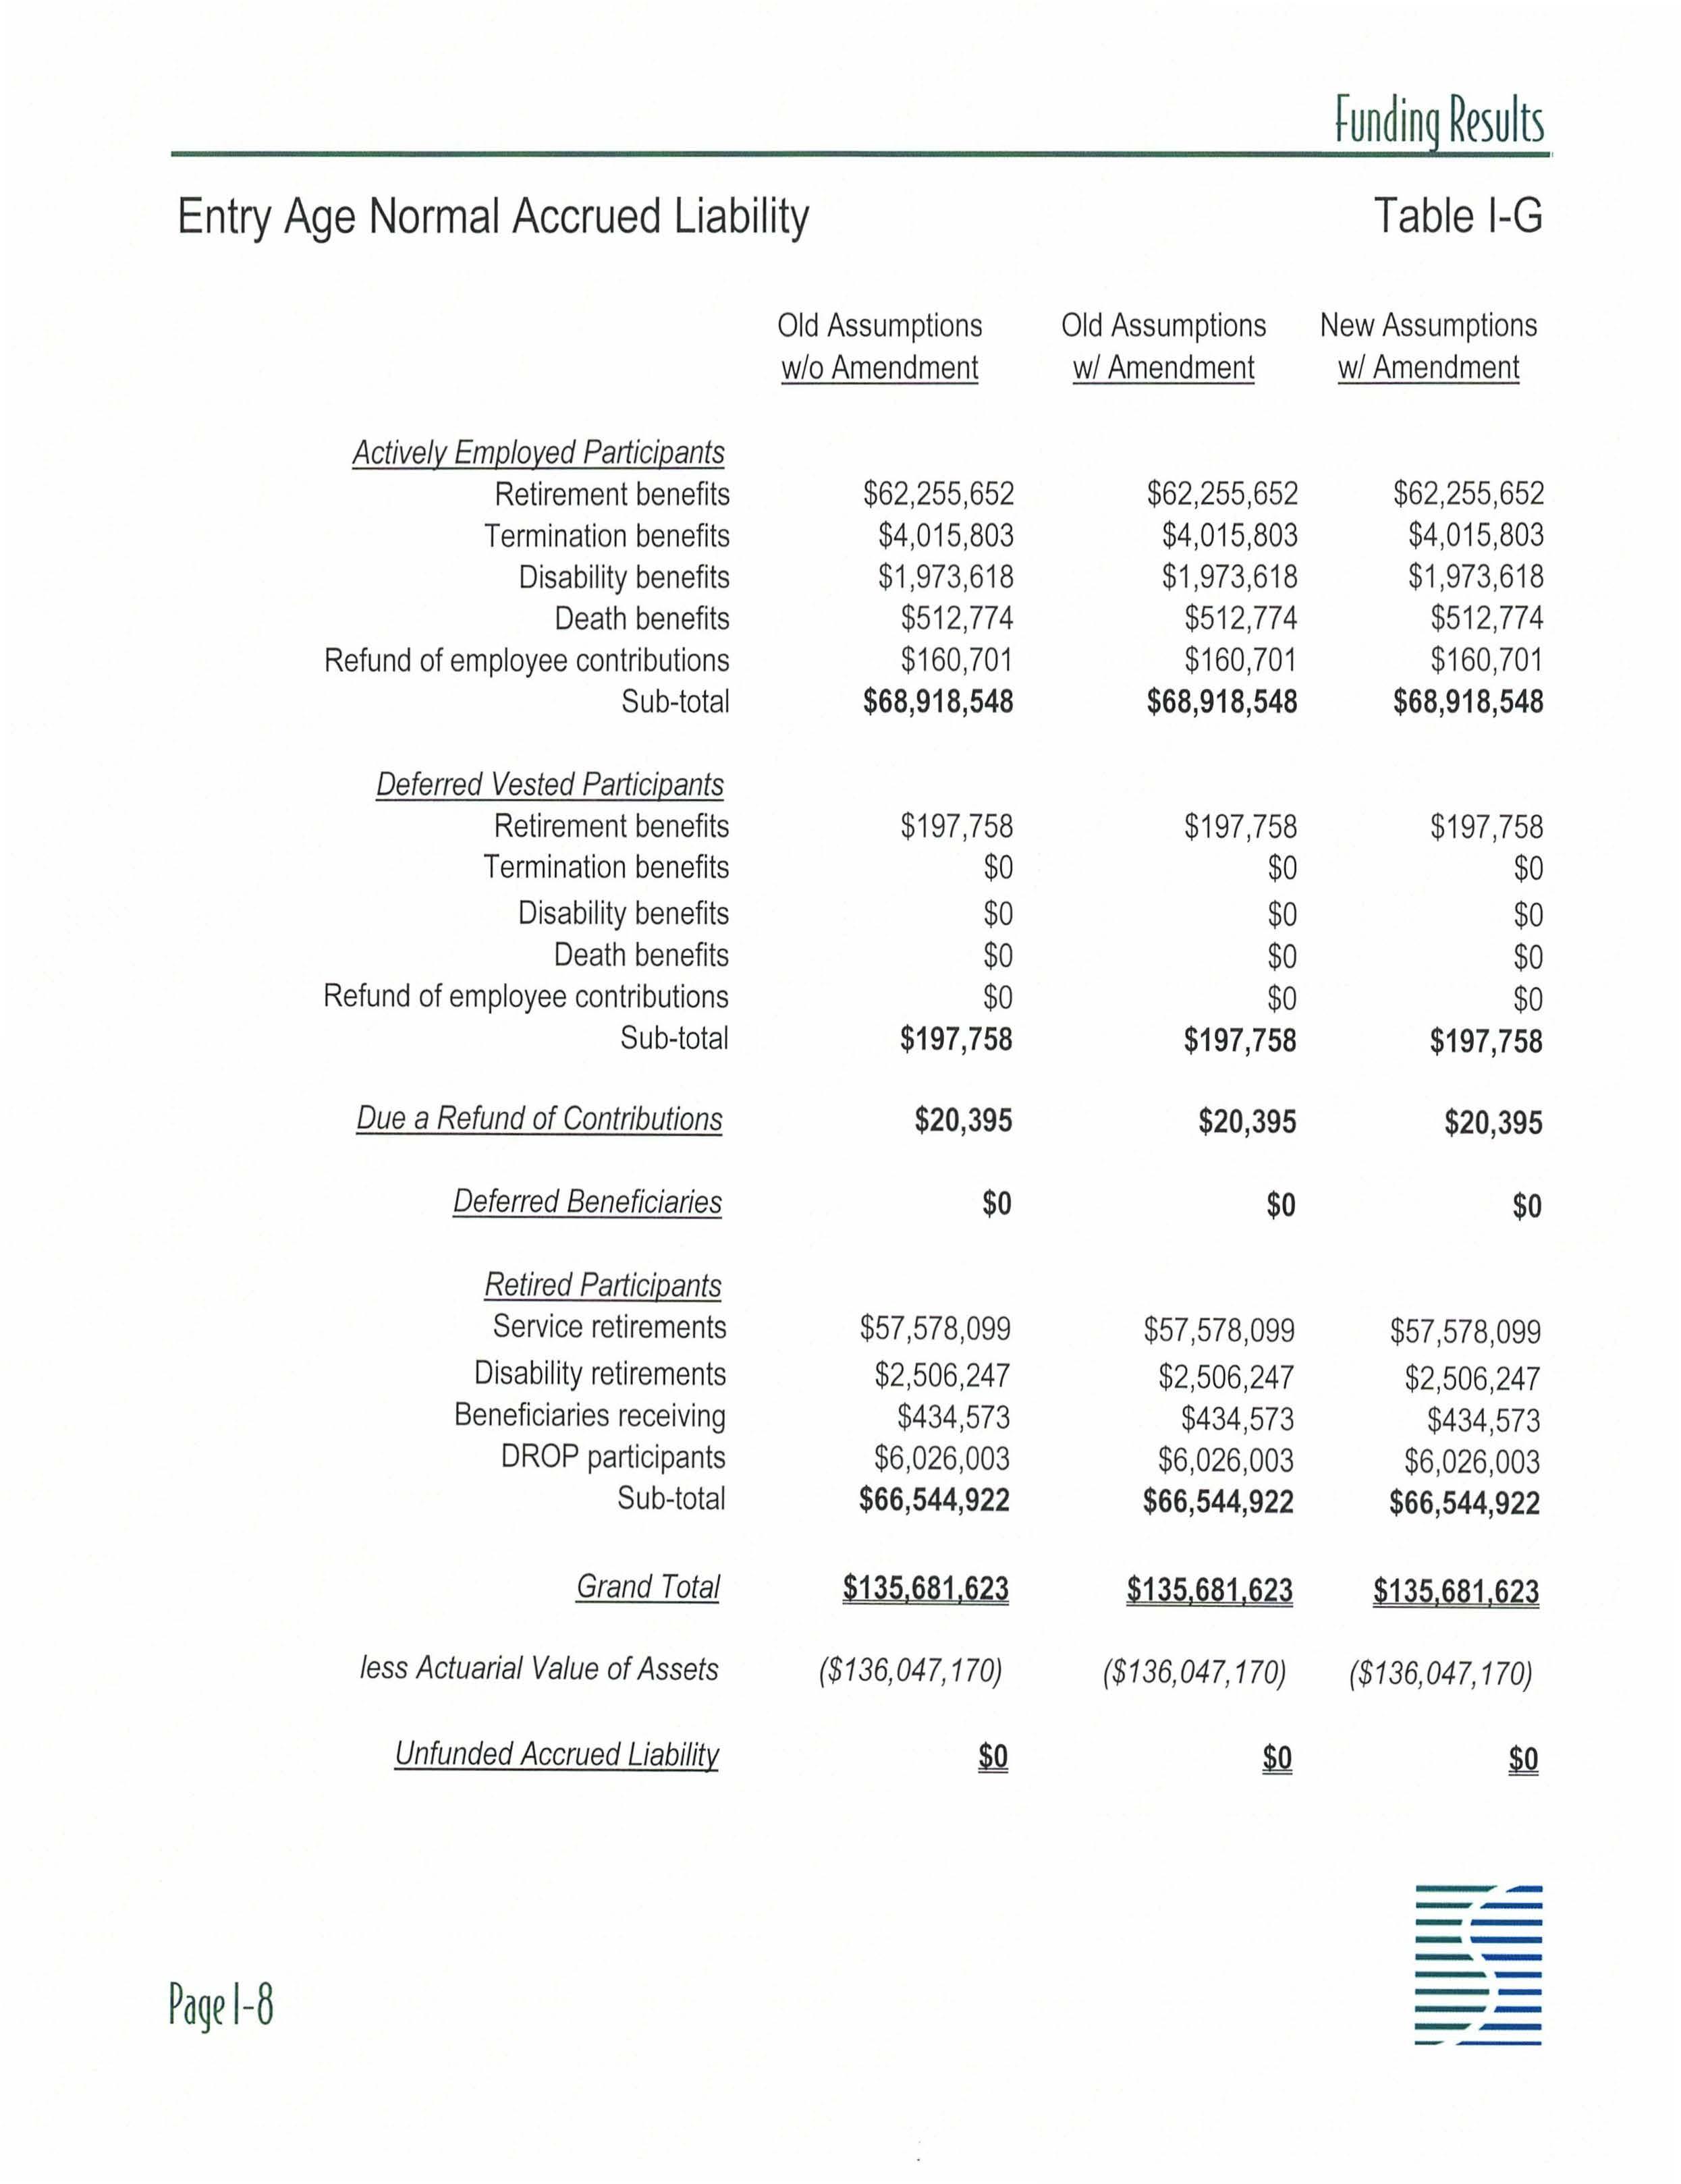
Entry Age Normal Accrued Liability Table 1-G
Active/~ Emelo~ed Particieants
Deferred Vested Particieants
Particieants
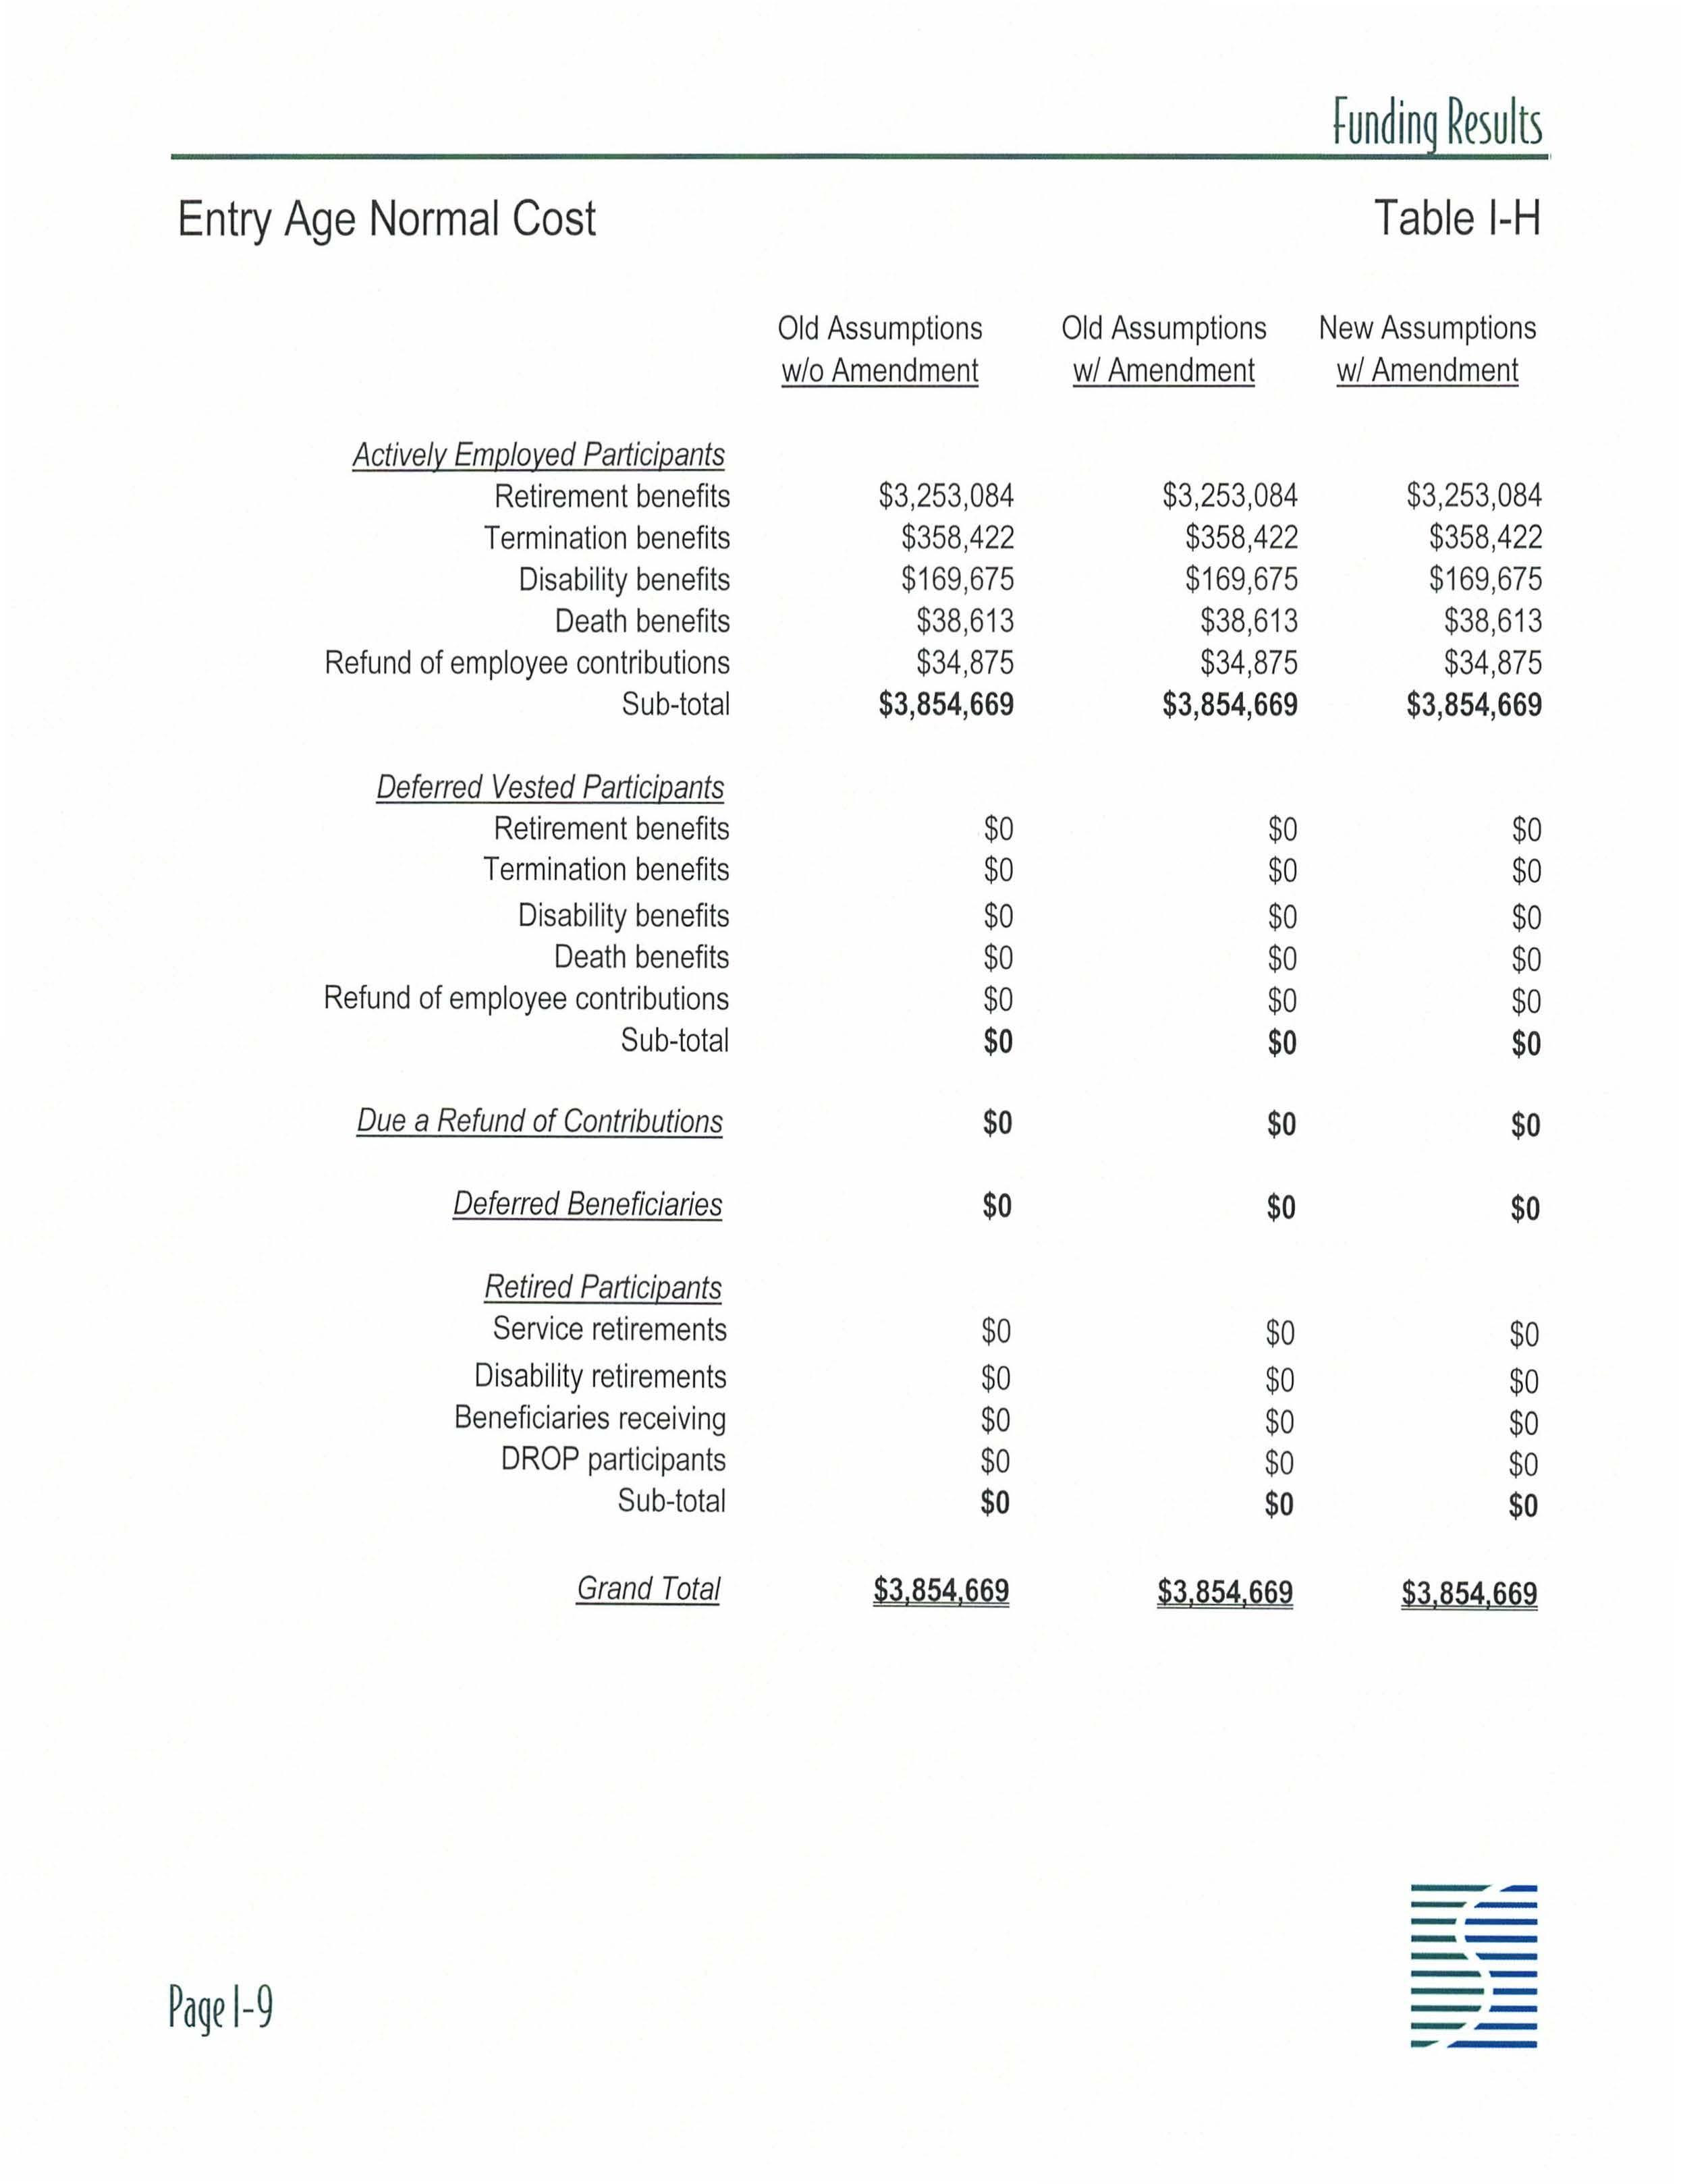
Entry Age Normal Cost Table 1-H
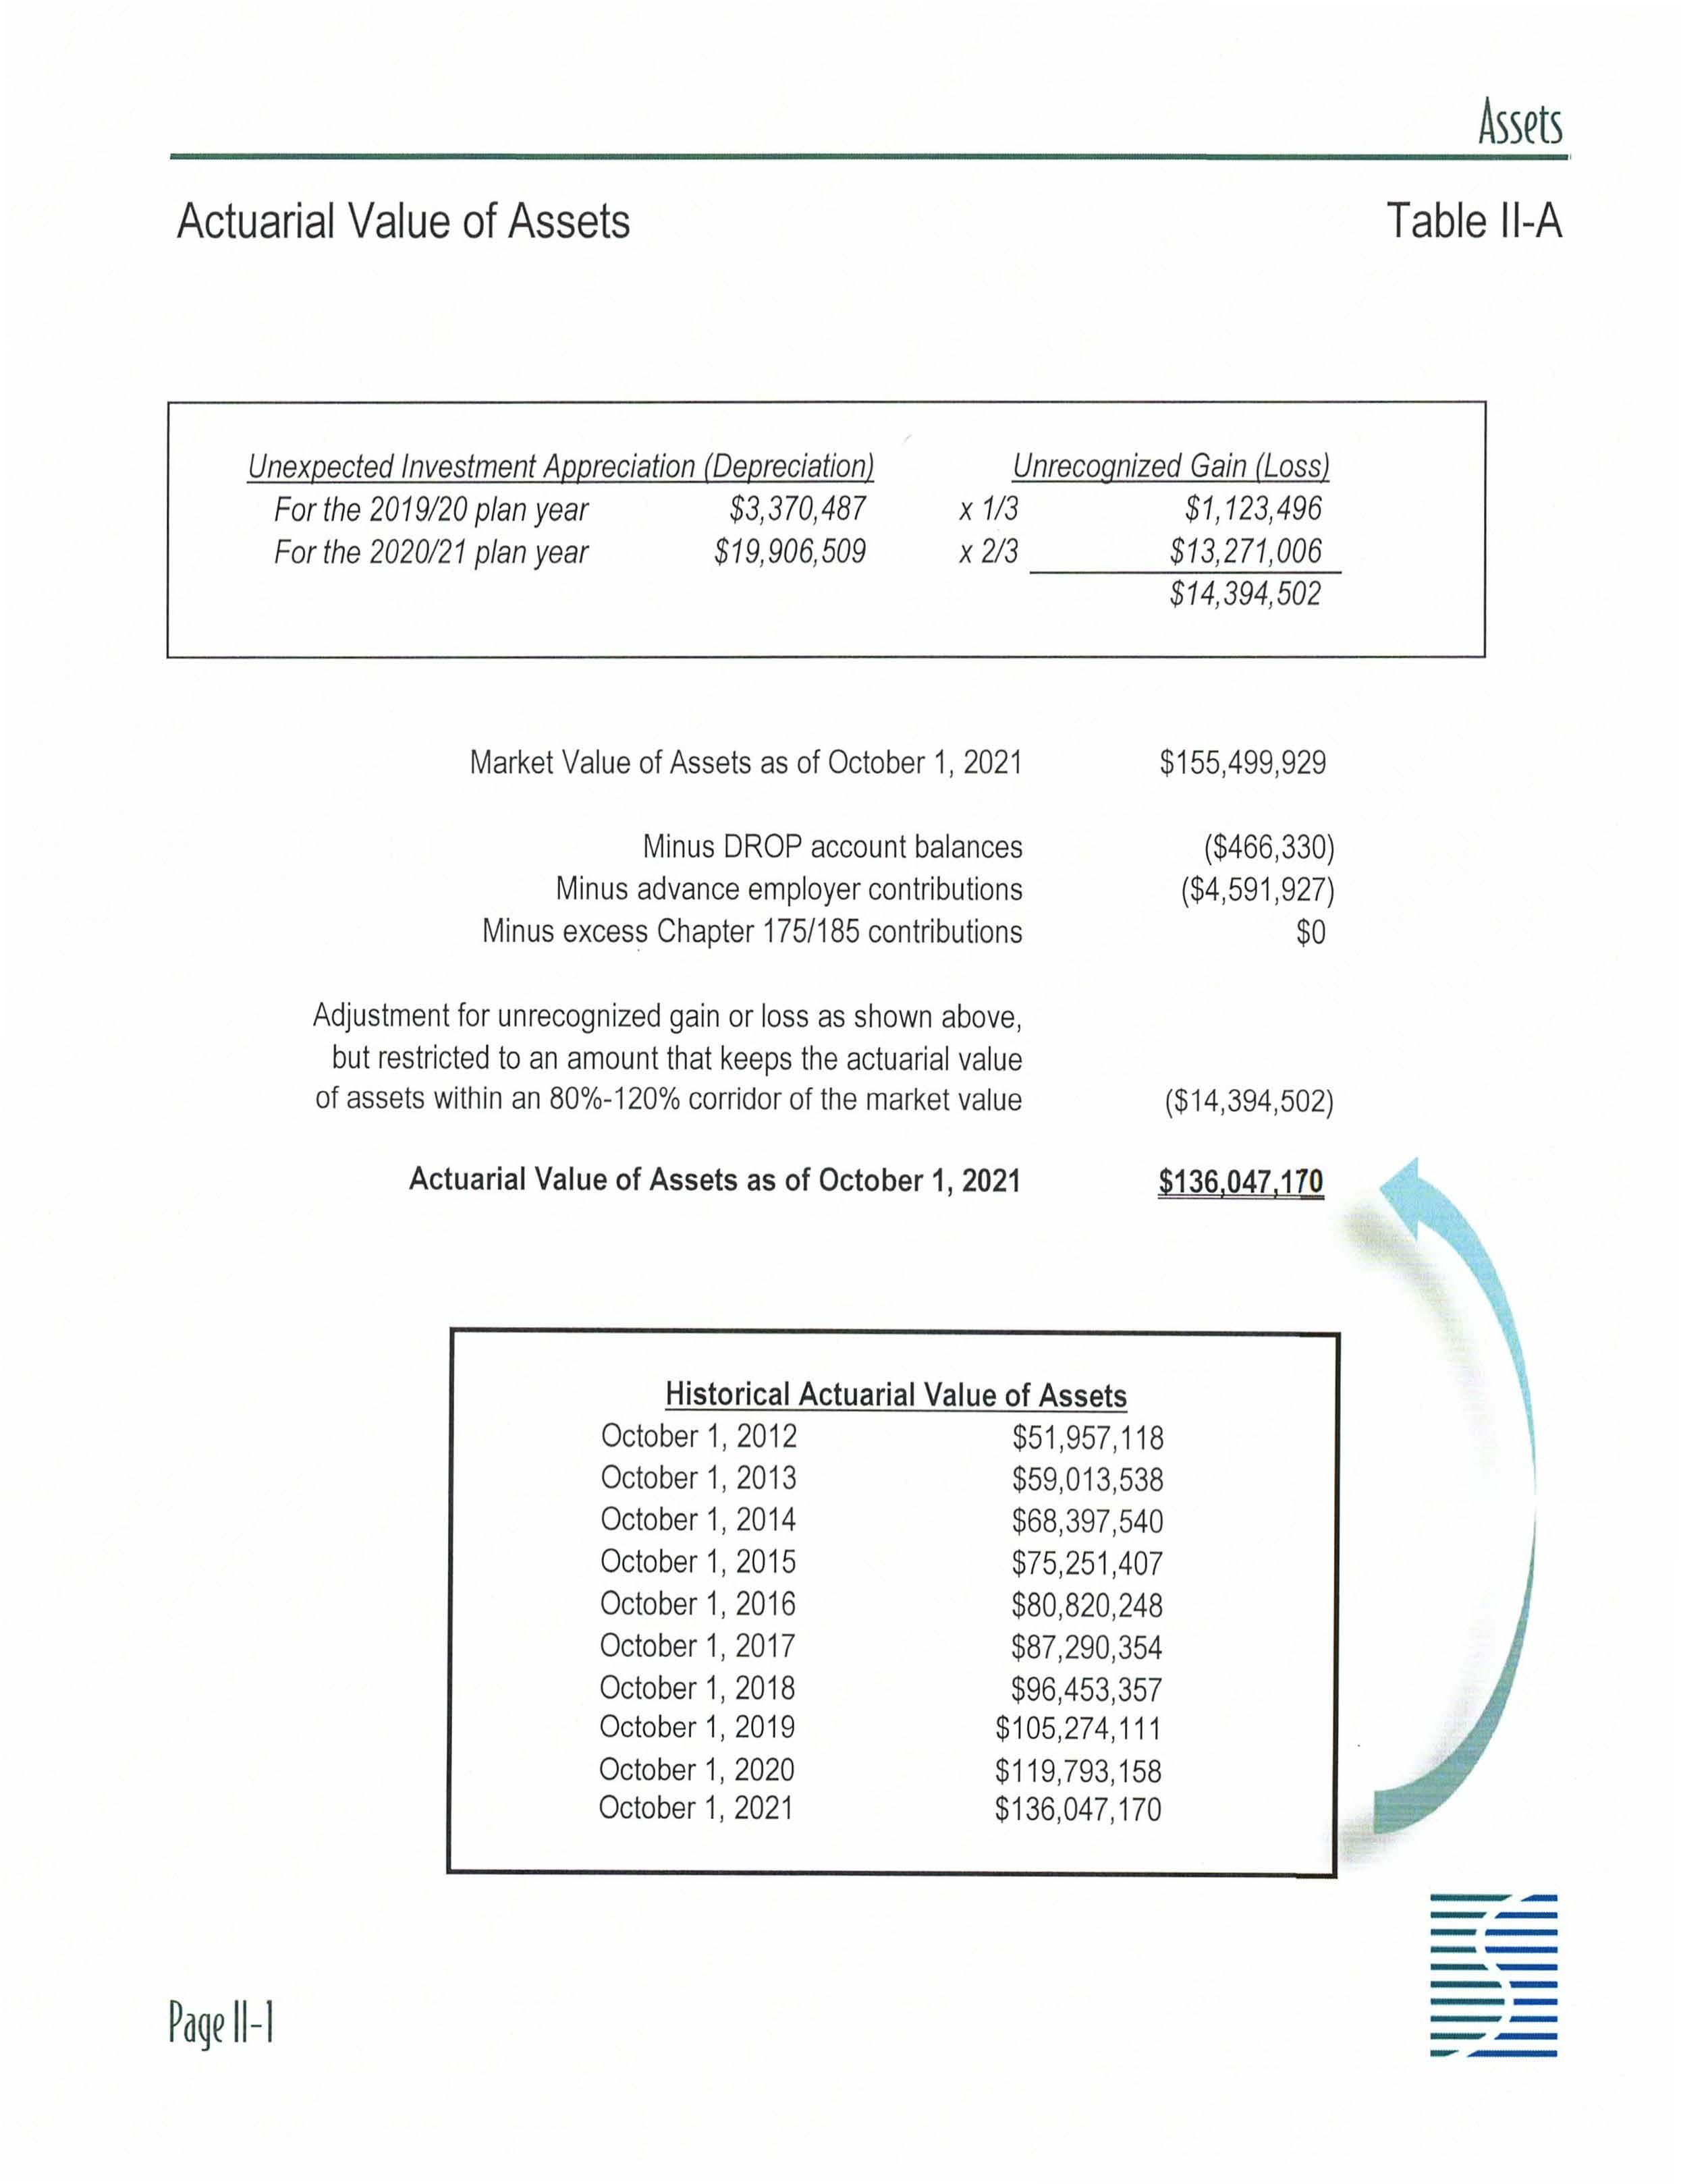
Actuarial Value of Assets Table
Unexpected Investment Appreciation (Depreciation) Unrecognized Gain (Loss)
For the 2019/20 plan year
$3 ,370 ,487 X 1/3
For the 2020121 plan year $19 ,906,509 X 2/ 3
$1 , 123,496
$13 ,271 ,006 $14 ,394 ,502
Market Value of Assets as of October 1, 2021 $155,499,929
Minus DROP account balances ($466,330)
Minus advance employer contributions ($4,591 ,927)
Minus excess Chapter 175/185 contributions $0
Adjustment for unrecognized gain or loss as shown above, but restricted to an amount that keeps the actuarial value of assets within an 80%-120% corridor of the market value ($14,394,502)
Actuarial Value of Assets as of October 1, 2021 $136.047.170
Historical Actuarial Value of Assets
October 1, 2012
October 1, 2013
October 1, 2014
October 1, 2015
October 1, 2016
October 1, 2017
October 1, 2018
October 1, 2019
October 1, 2020
October 1, 2021
$51 ,957, 118
$59,013,538
$68,397,540
$75,251,407
$80,820,248
$87,290,354
$96,453,357
$105,274,111
$119,793,158
$136,047,170
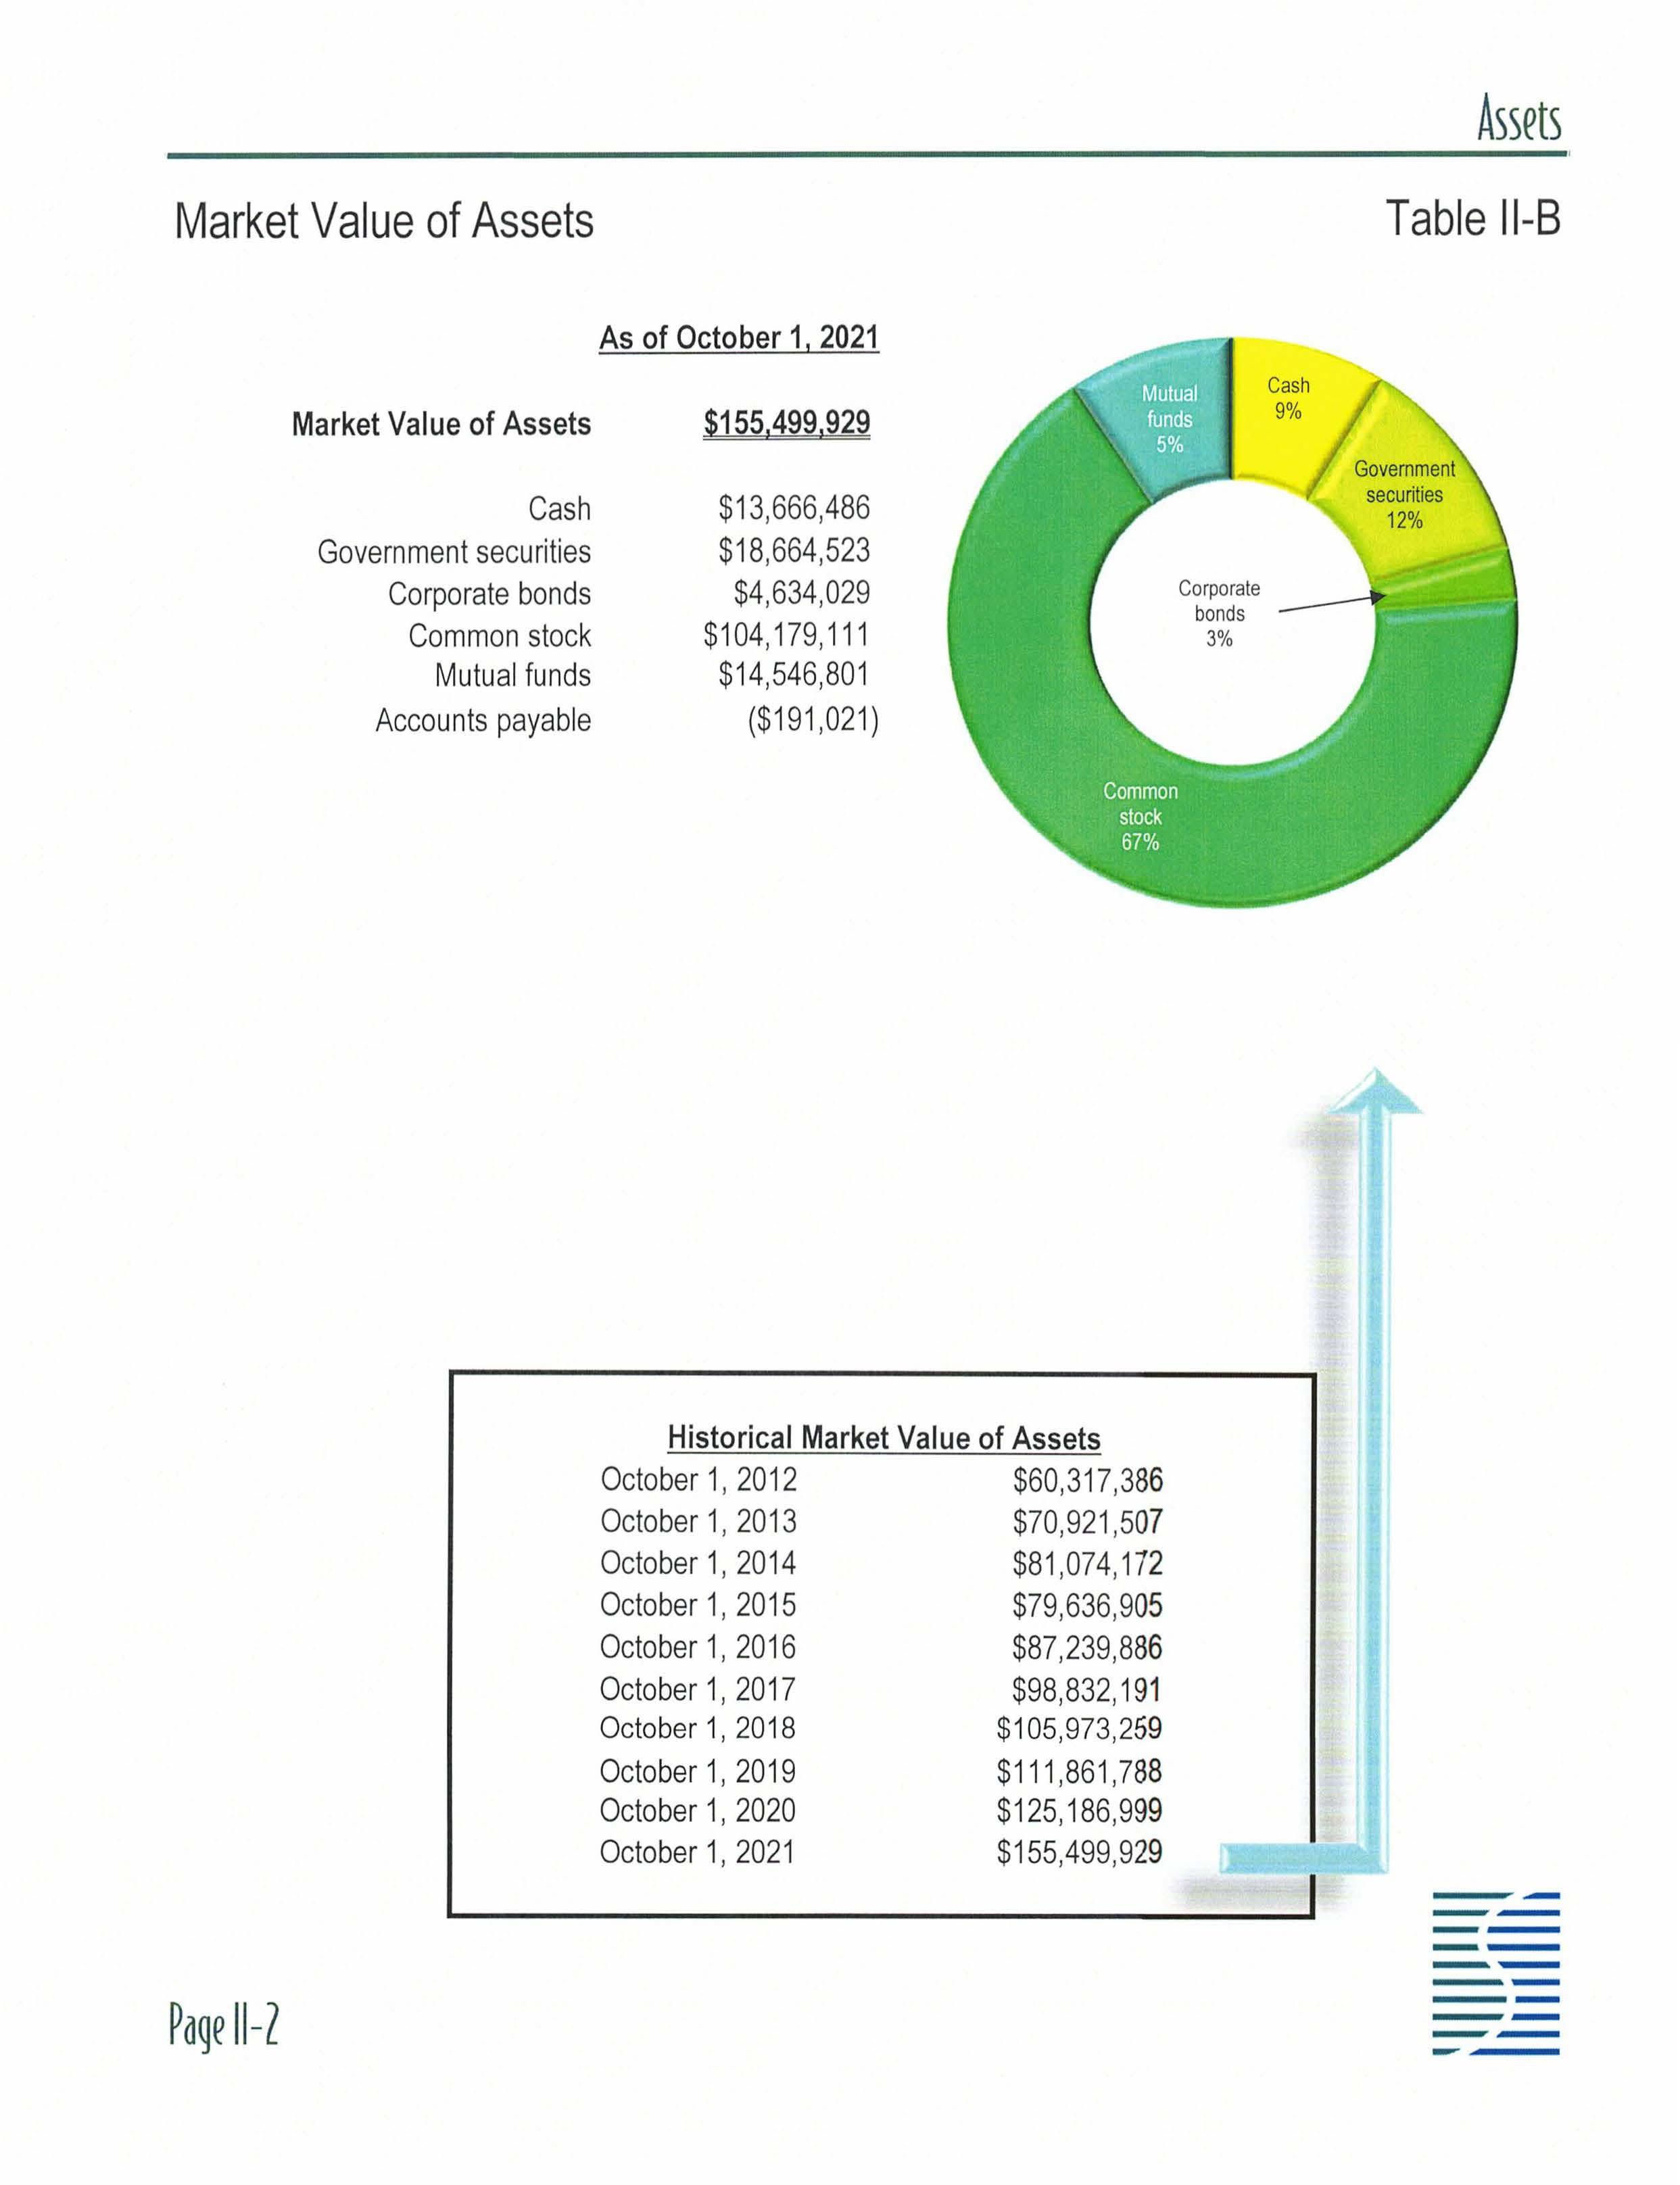
Market Value of Assets Table 11-B
As of October 1, 2021
Market Value of Assets
Cash
Government securities
Corporate bonds
Common stock
Mutual funds
Accounts payable
$155.499,929
$13,666,486
$18,664,523
$4,634,029
$104,179,111
$14,546,801
($191 ,021)
Historical Market Value of Assets
October 1, 2012
October 1, 2013
October 1, 2014
October 1, 2015
October 1, 2016
October 1, 2017
October 1, 2018
October 1, 2019
October 1, 2020
October 1, 2021
$60,317,386
$70,921 ,507
$81 ,074,172
$79,636,905
$87,239,886
$98,832,191
$105,973,259
$111 ,861 ,788
$125,186,999
$155,499,929
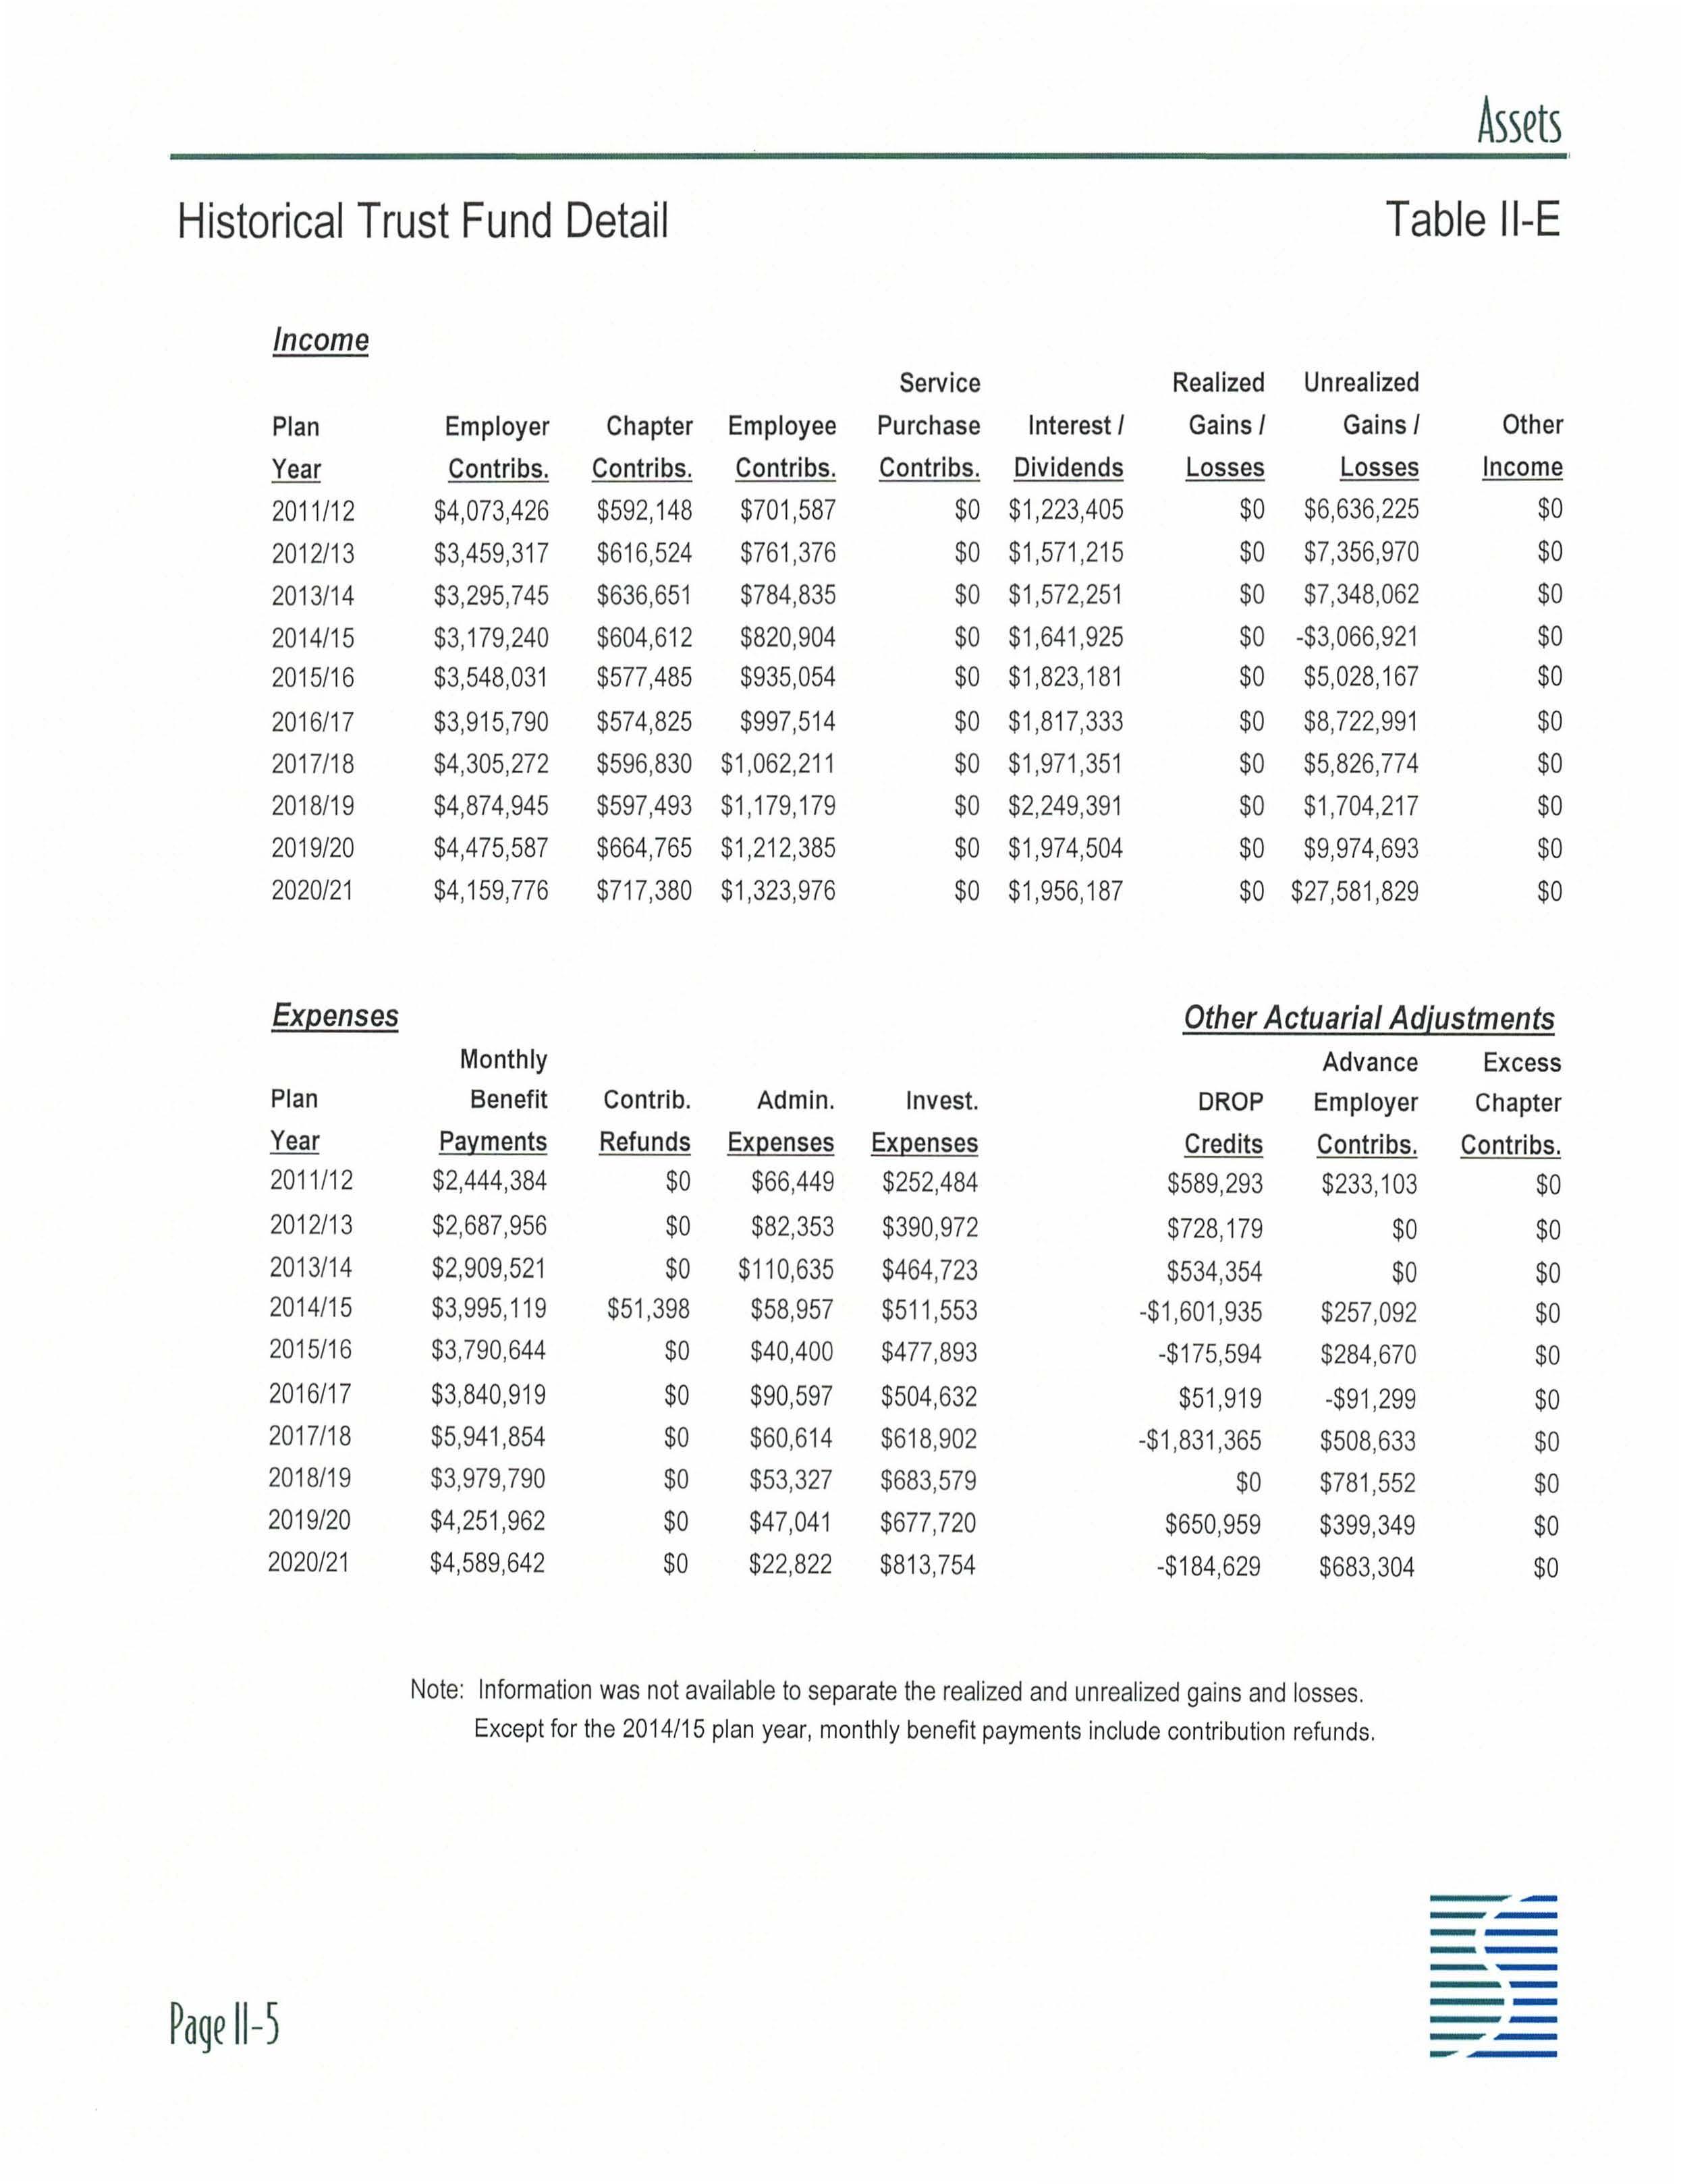
Historical Trust Fund Detail Table
Note: Information was not available to separate the realized and unrealized gains and losses Except for the 2014/15 plan year, monthly benefit payments include contribution refunds.
Advance Employer Contribution
Advance Employer Contribution as of October 1, 2020 $3,908,623
Summary of Actuarial Methods and Assumptions Table IV-A
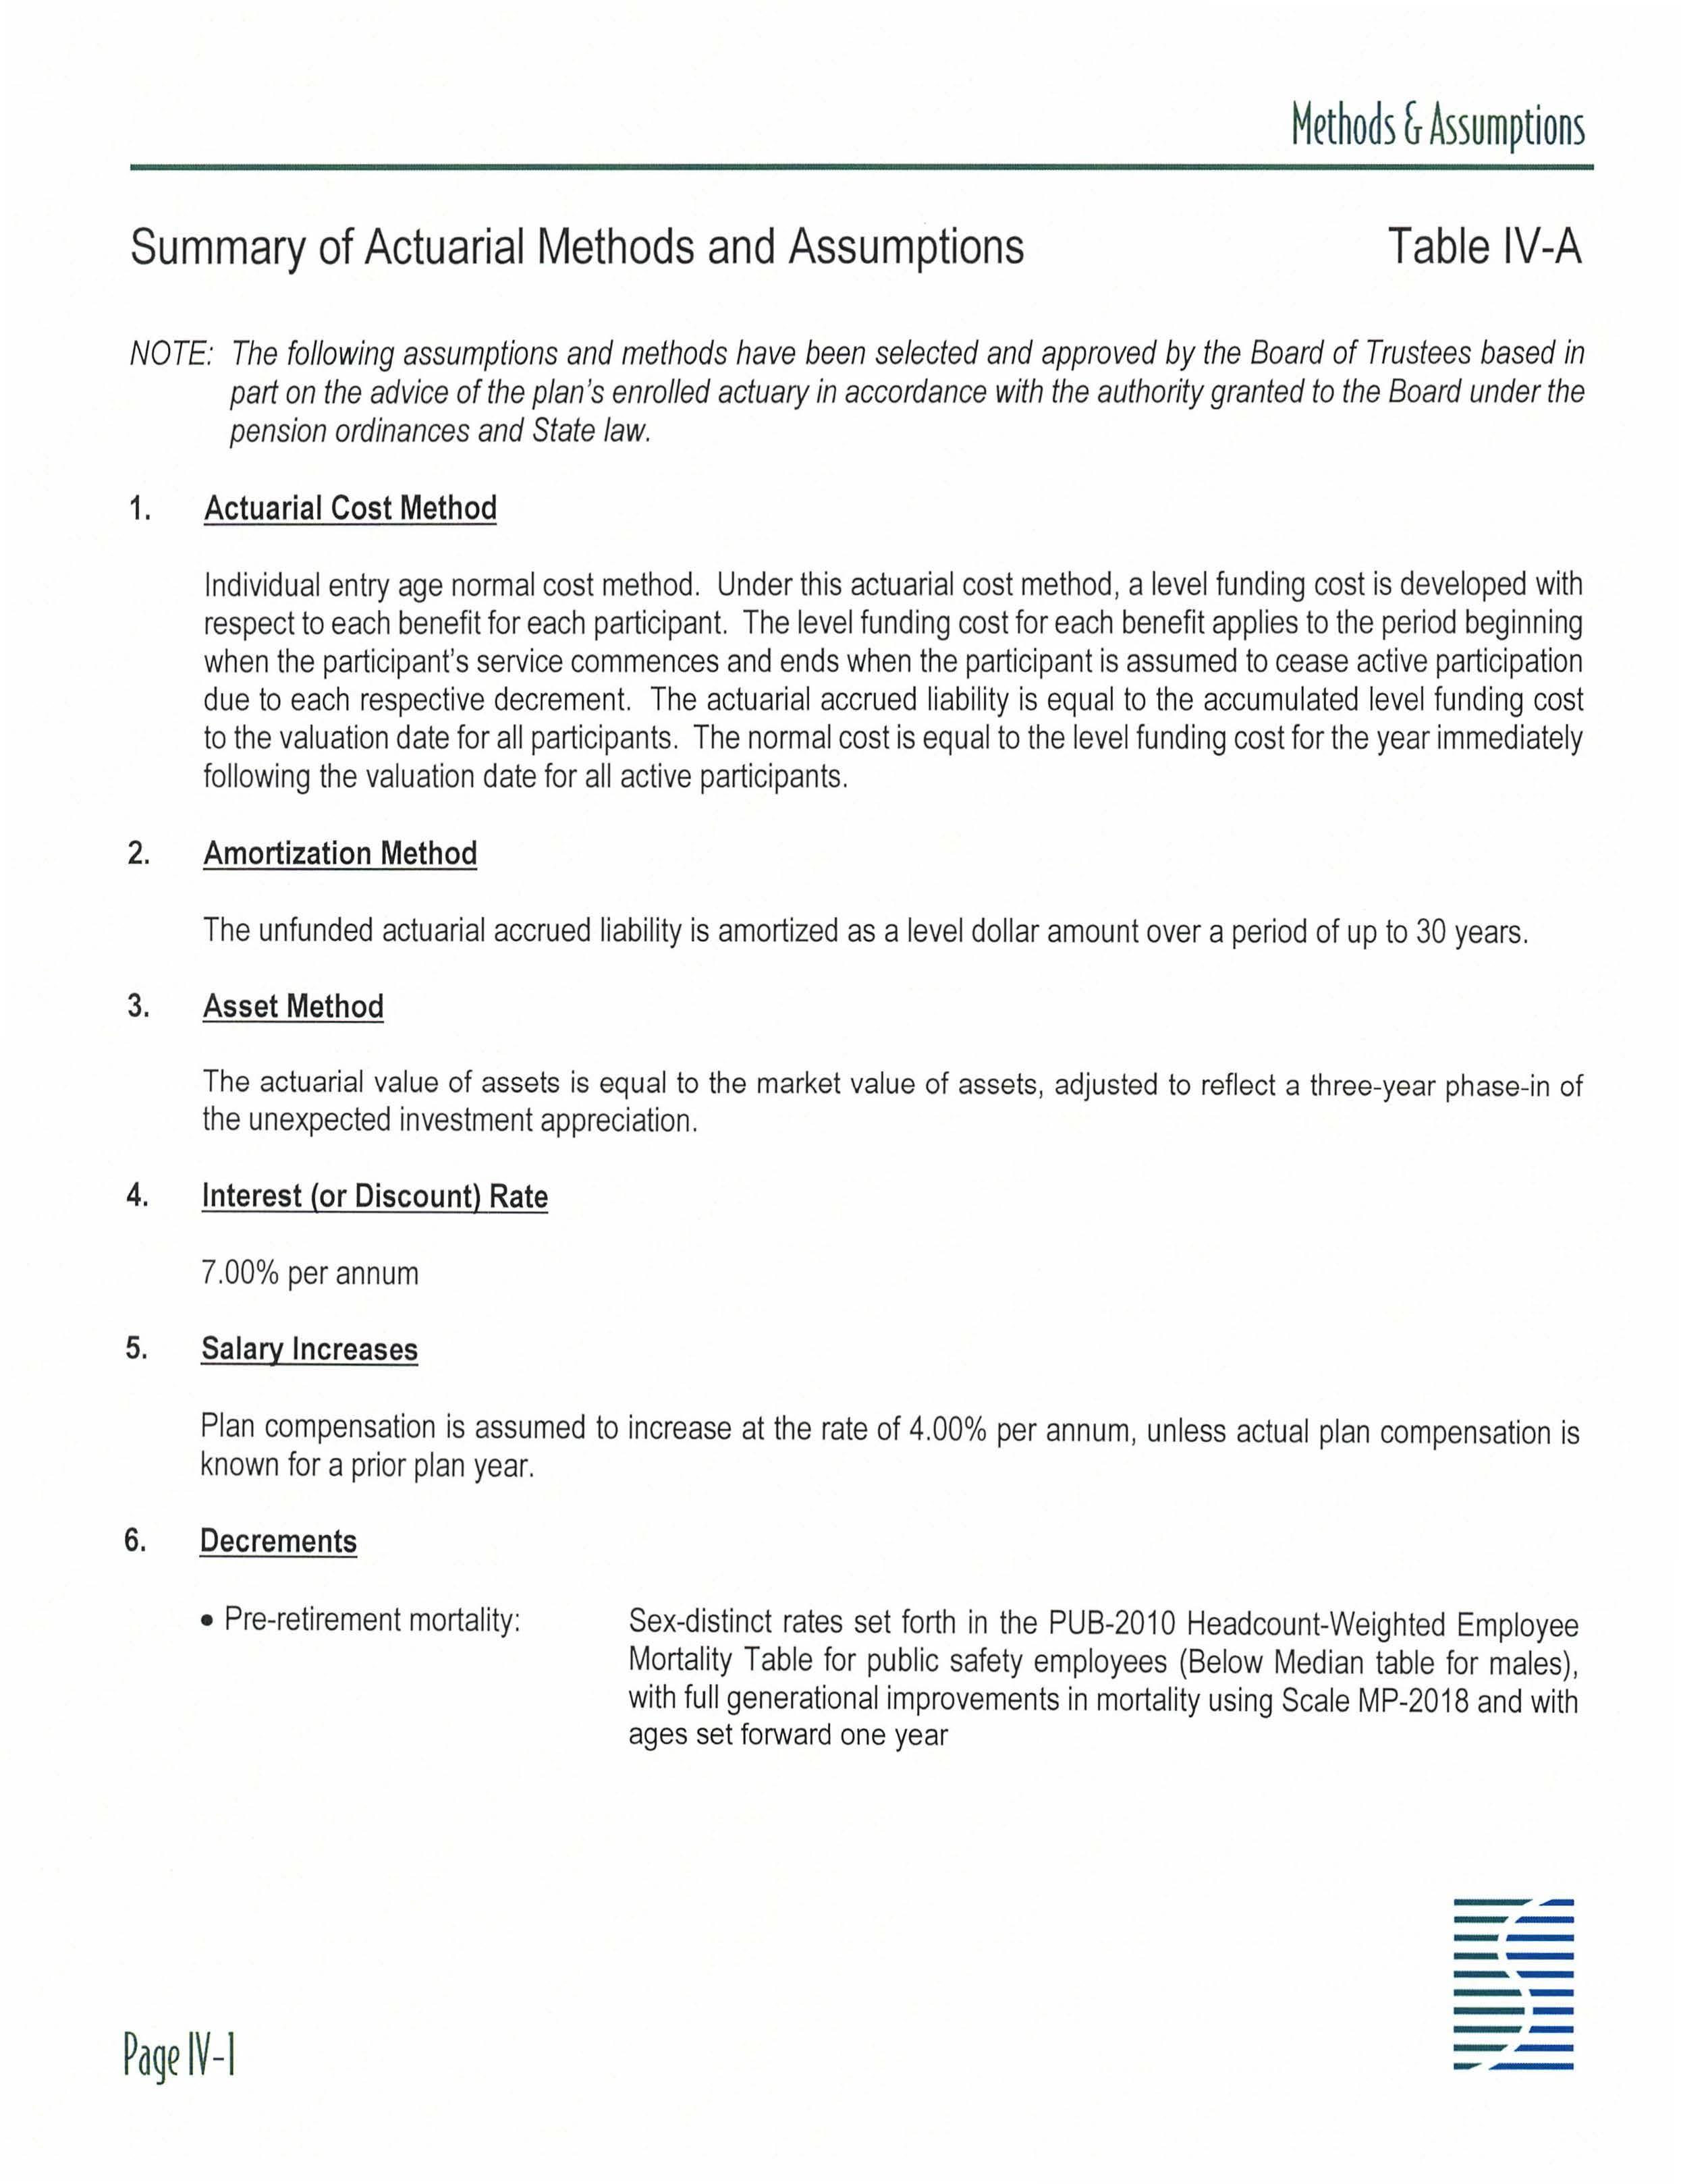
NOTE: The following assumptions and methods have been selected and approved by the Board of Trustees based in part on the advice of the plan 's enrolled actuary in accordance with the authority granted to the Board under the pension ordinances and State law
1. Actuarial Cost Method
Individual entry age normal cost method. Under this actuarial cost method , a level funding cost is developed with respect to each benefit for each participant. The level funding cost for each benefit applies to the period beginning when the participant's service commences and ends when the participant is assumed to cease active participation due to each respective decrement. The actuarial accrued liability is equal to the accumulated level funding cost to the valuation date for all participants. The normal cost is equal to the level funding cost for the year immediately following the valuation date for all active participants.
2. Amortization Method
The unfunded actuarial accrued liability is amortized as a level dollar amount over a period of up to 30 years.
3. Asset Method
The actuarial value of assets is equal to the market value of assets, adjusted to reflect a three-year phase-in of the unexpected investment appreciation .
4. Interest (or Discount) Rate
7.00% per annum
5. Salary Increases
Plan compensation is assumed to increase at the rate of 4 00% per annum , unless actual plan compensation is known for a prior plan year.
6. Decrements
• Pre-retirement mortality: Sex-distinct rates set forth in the PUB-2010 Headcount-Weighted Employee Mortality Table for public safety employees (Below Median table for males), with full generational improvements in mortality using Scale MP-2018 and with ages set forward one year
Summary of Actuarial Methods and Assumptions Table IV-A
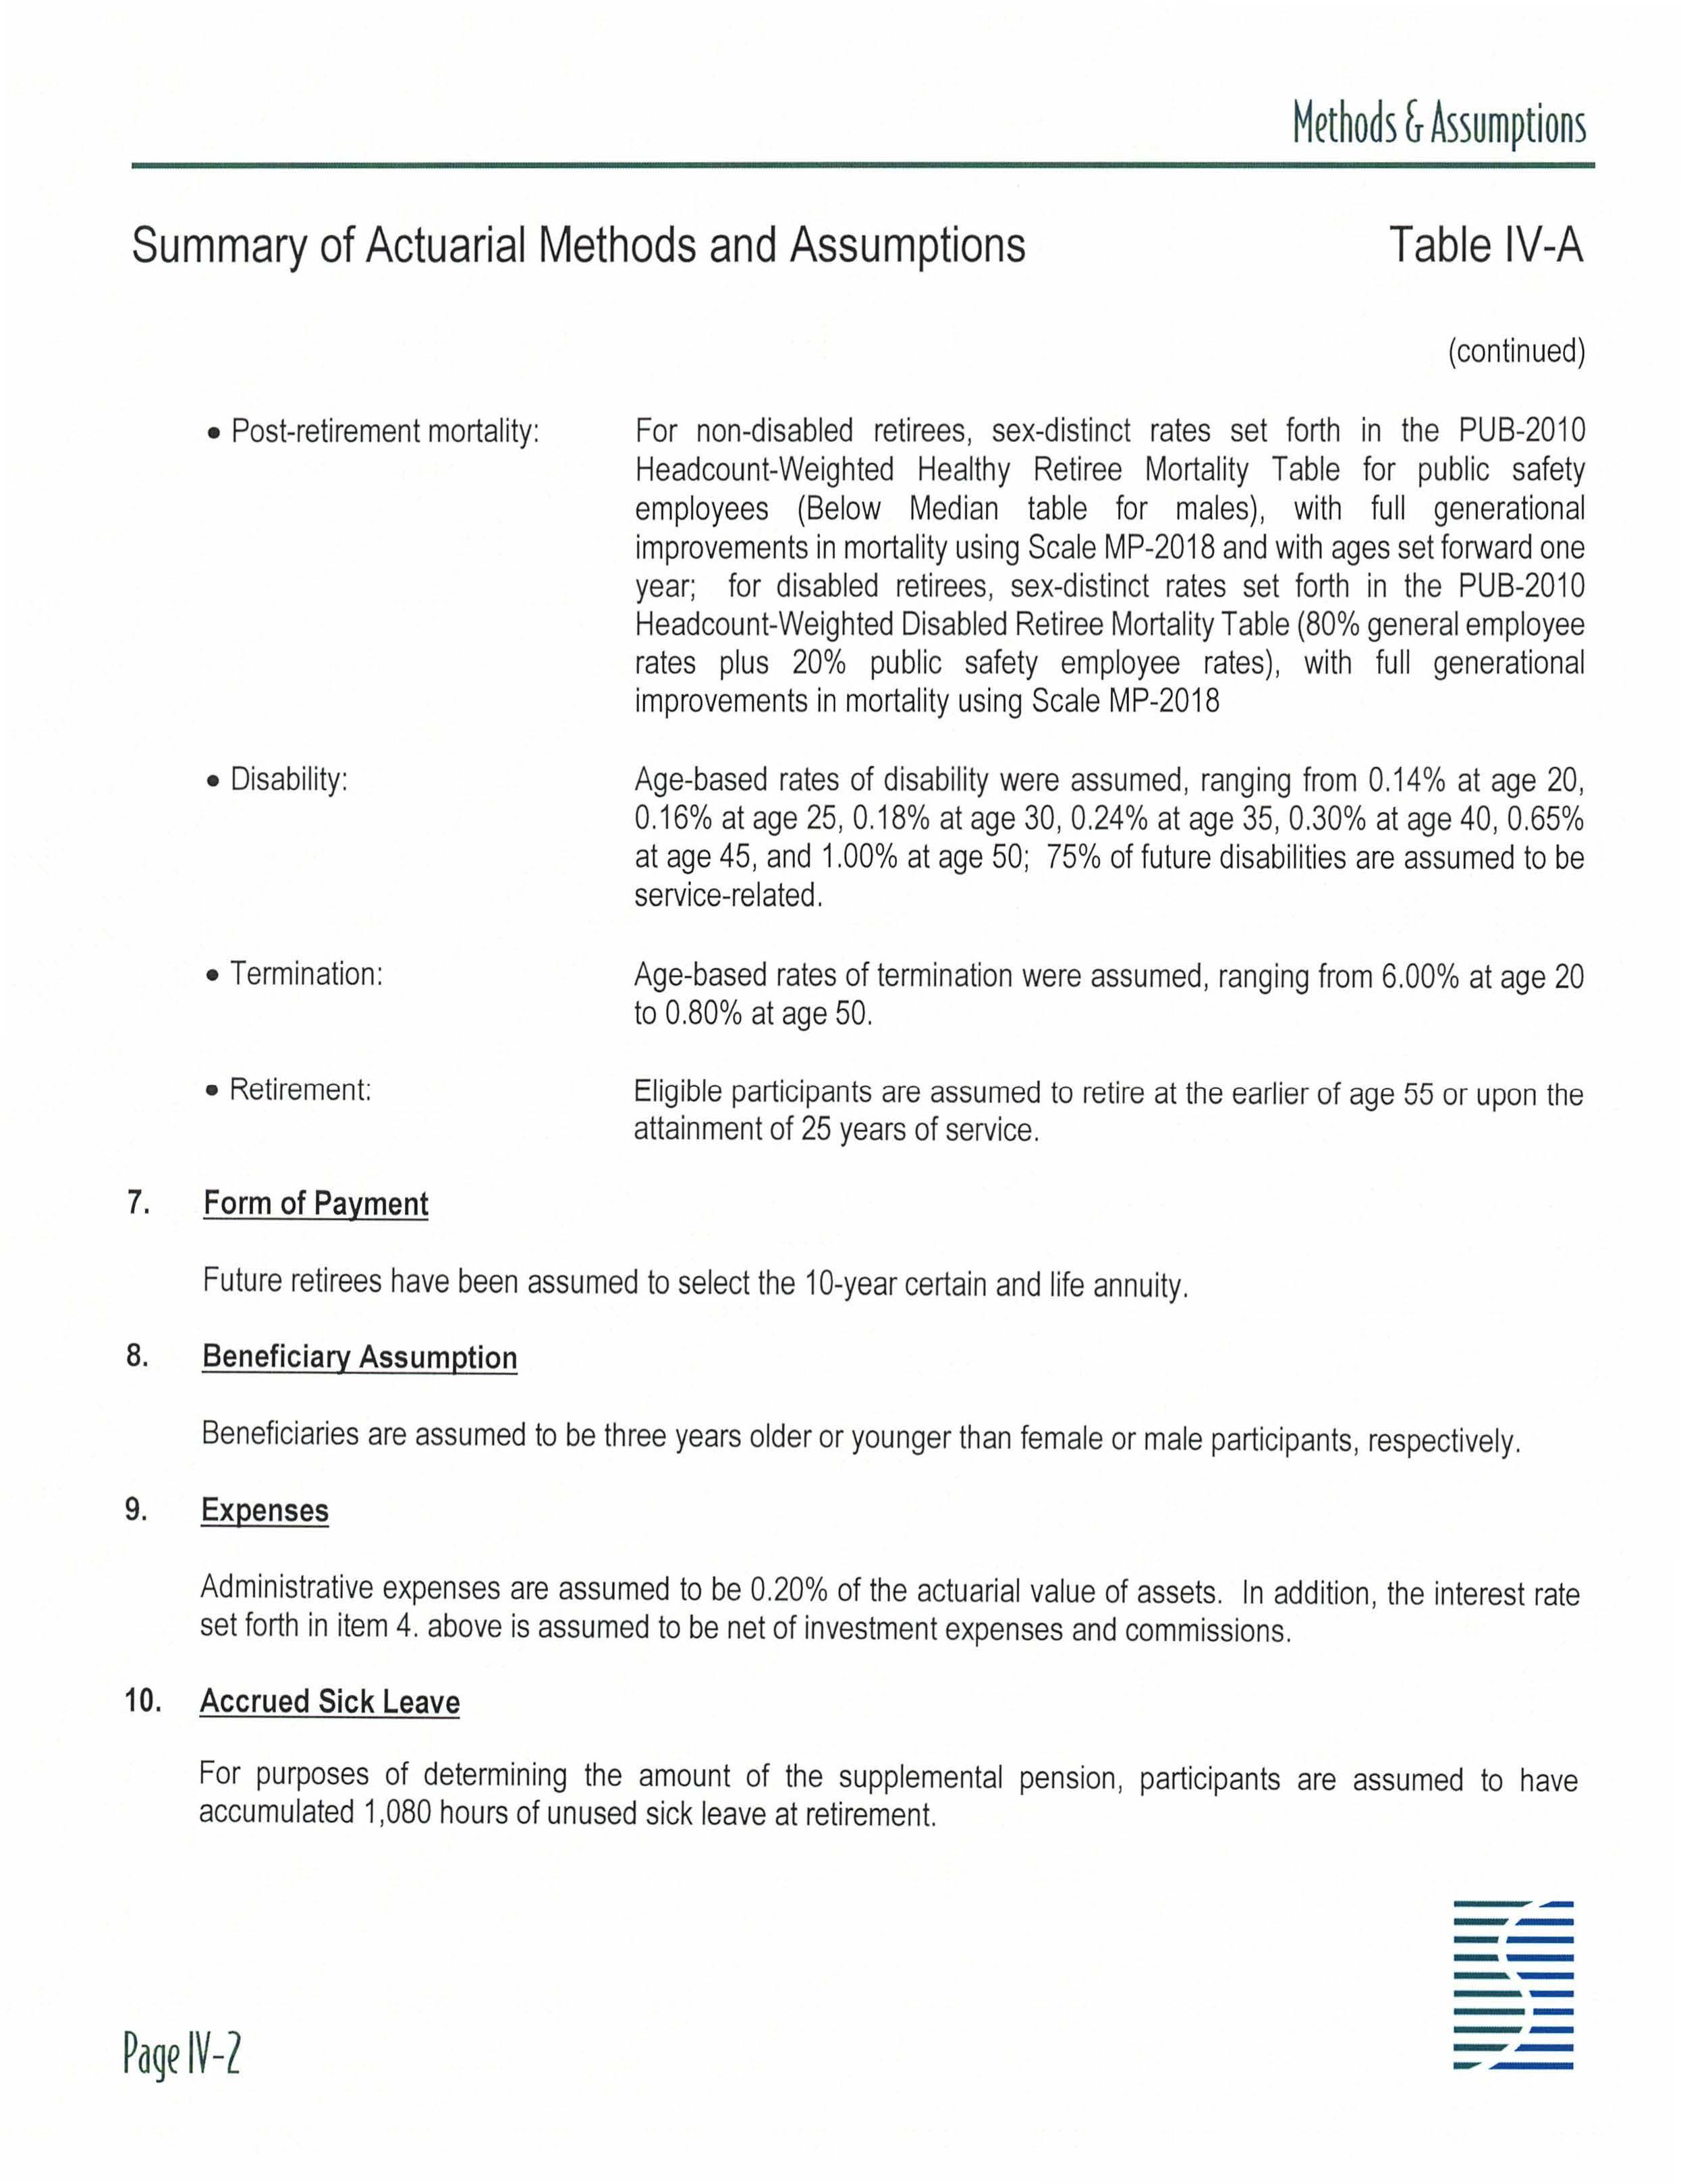
(continued)
• Post-retirement mortality: For non-disabled retirees, sex-distinct rates set forth in the PUB-2010 Headcount-Weighted Healthy Retiree Mortality Table for public safety employees (Below Median table for males) , with full generational improvements in mortality using Scale MP-2018 and with ages set forward one year; for disabled retirees , sex-distinct rates set forth in the PUB-2010 Headcount-Weighted Disabled Retiree Mortality Table (80%general employee rates plus 20% public safety employee rates) , with full generational improvements in mortality using Scale MP-2018
• Disability:
• Termination :
Age-based rates of disability were assumed, ranging from 0.14% at age 20, 0.16% at age 25, 0 18% at age 30, 0.24% at age 35, 0.30% at age 40, 0 65% at age 45, and 1.00% at age 50; 75% of future disabilities are assumed to be service-related
Age-based rates of termination were assumed, ranging from 6 00% at age 20 to 0.80% at age 50.
• Retirement: Eligible participants are assumed to retire at the earlier of age 55 or upon the attainment of 25 years of service .
7. Form of Payment
Future retirees have been assumed to select the 10-year certain and life annuity
8. Beneficiary Assumption
Beneficiaries are assumed to be three years older or younger than female or male participants, respectively.
9. Expenses
Administrative expenses are assumed to be 0.20% of the actuarial value of assets In addition , the interest rate set forth in item 4 above is assumed to be net of investment expenses and commissions
10. Accrued Sick Leave
For purposes of determining the amount of the supplemental pension , participants are assumed to have accumulated 1,080 hours of unused sick leave at retirement.
Changes in Actuarial Methods and Assumptions Table IV-B
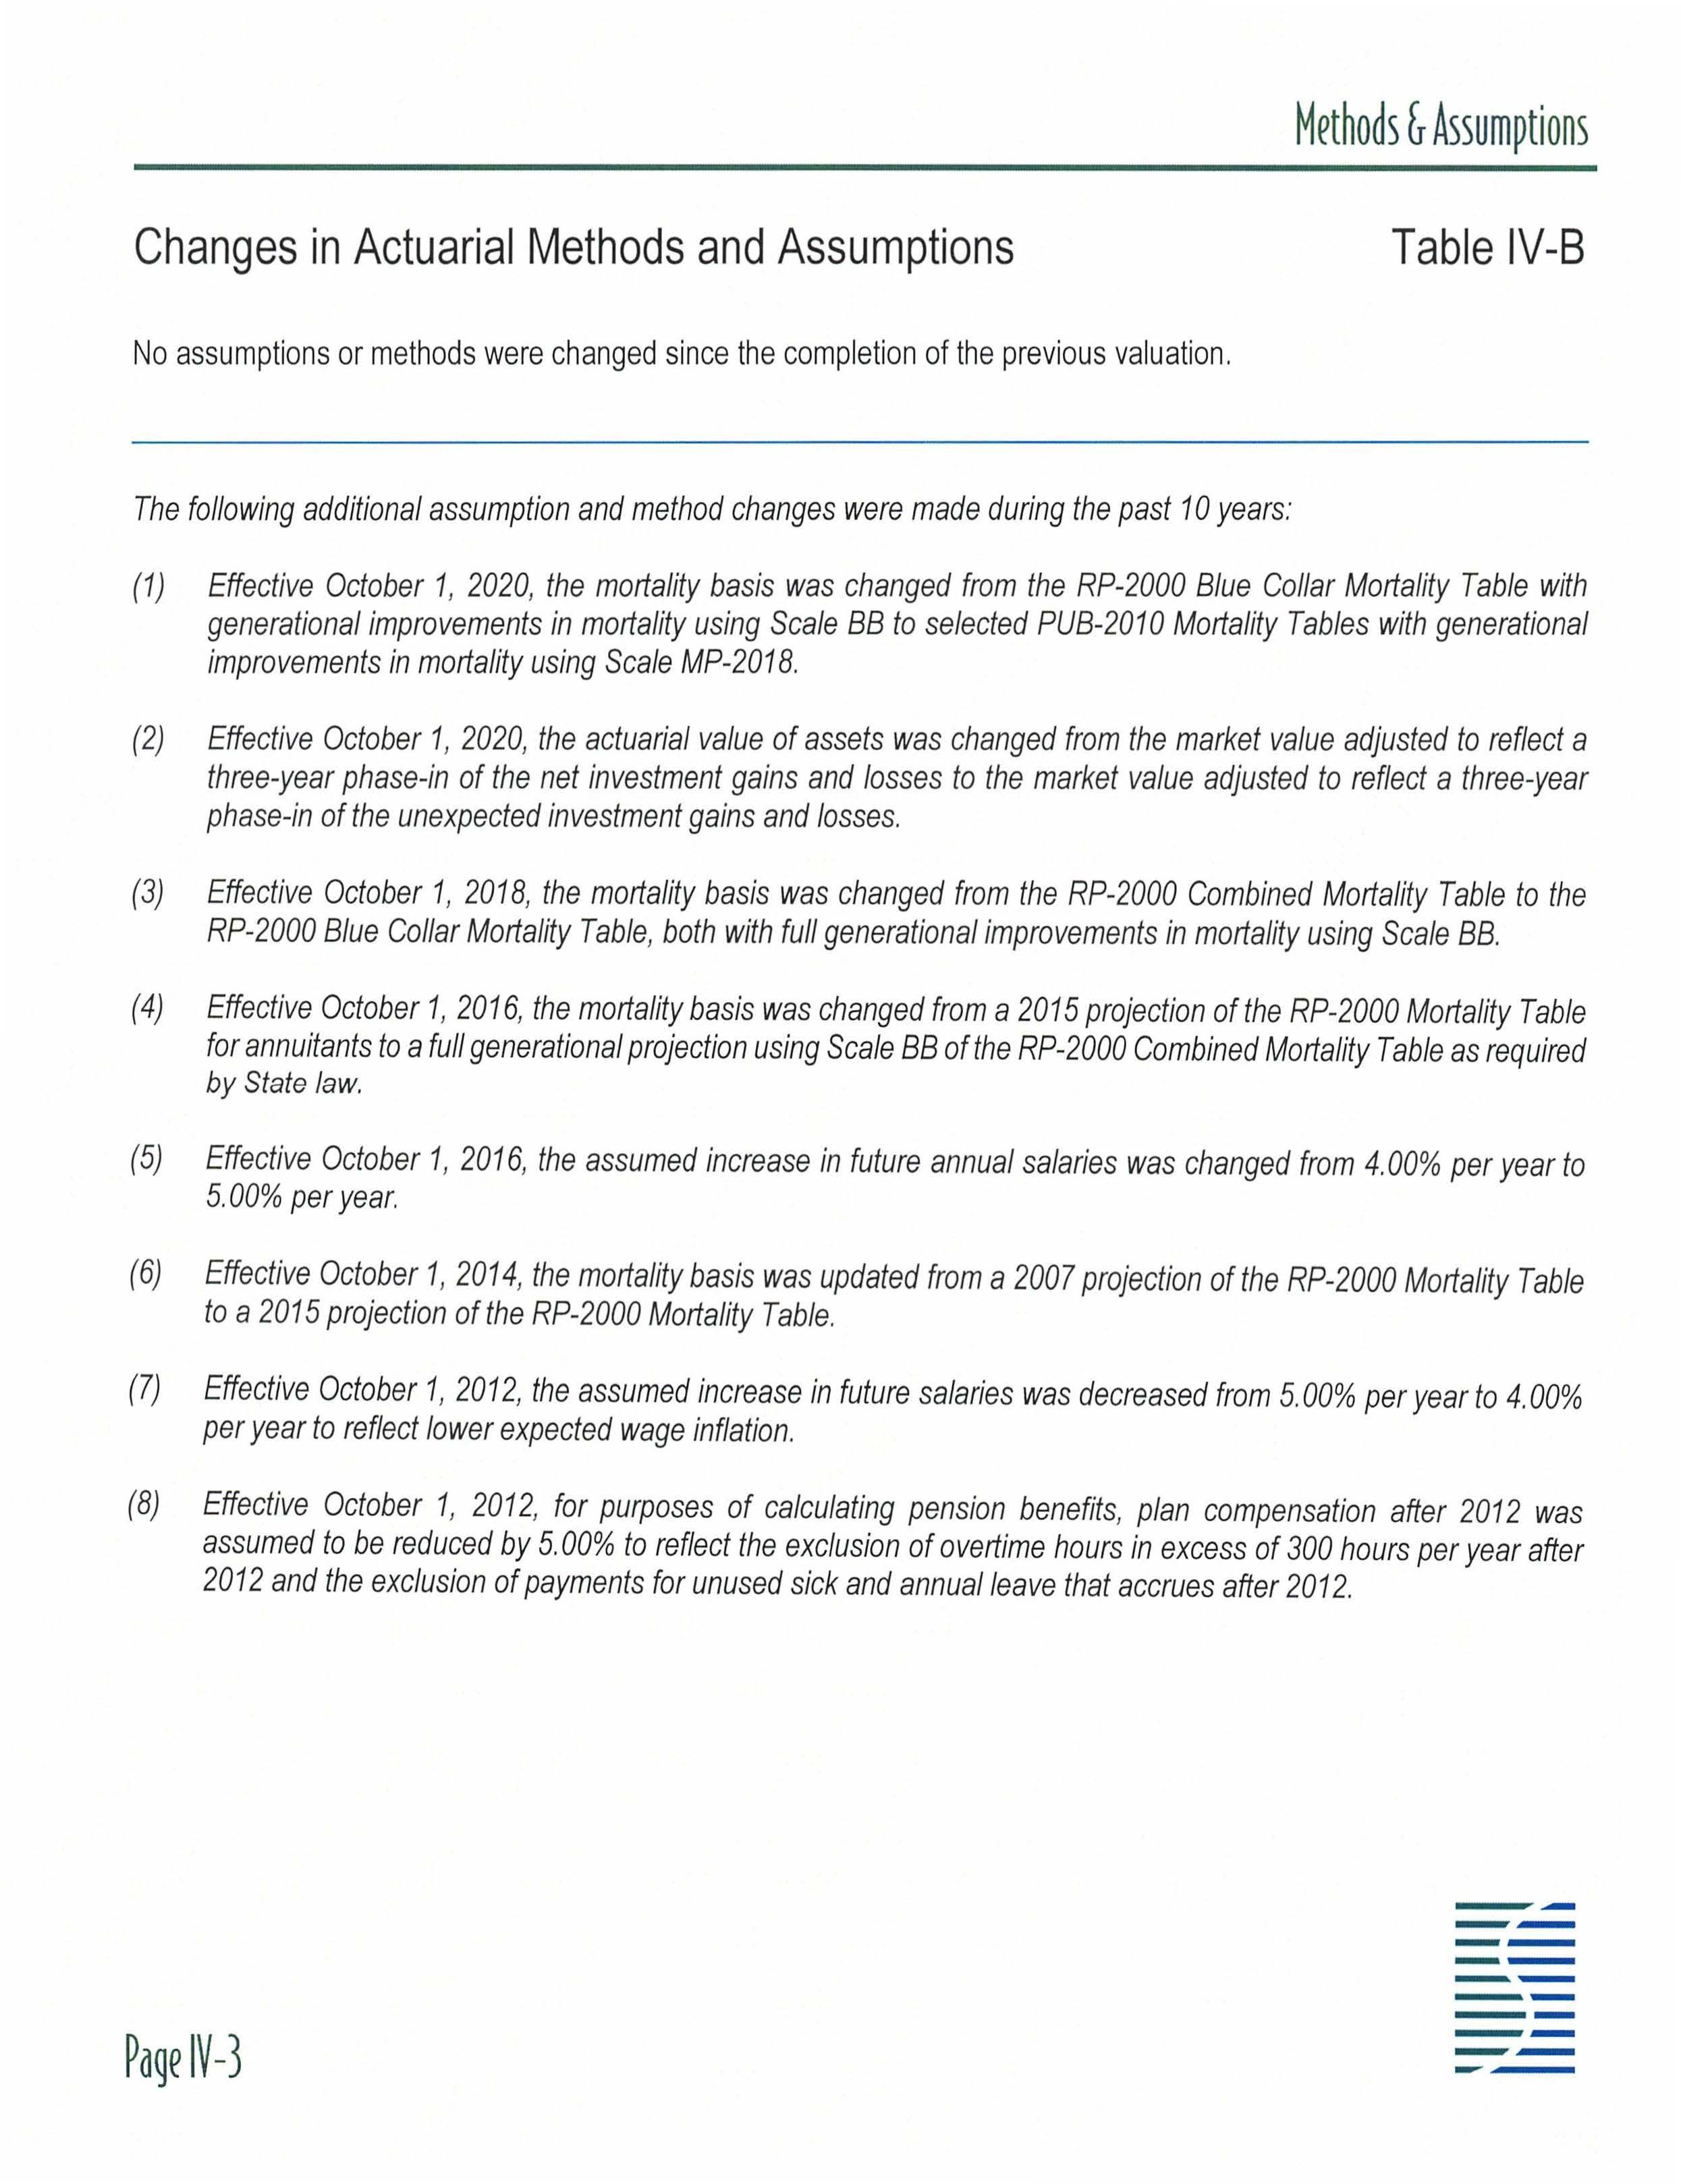
No assumptions or methods were changed since the completion of the previous valuation.
The following additional assumption and method changes were made during the past 10 years
(1) Effective October 1, 2020 , the mortality basis was changed from the RP-2000 Blue Collar Mortality Table with generational improvements in mortality using Scale BB to selected PUB-2010 Mortality Tables with generational improvements in mortality using Scale MP -2018
(2) Effective October 1, 2020 , the actuarial value of assets was changed from the market value adjusted to reflect a three -year phase -in of the net investment gains and losses to the market value adjusted to reflect a three-year phase-in of the une xpe cted investment gains and losses .
(3) Effective October 1, 2018 , the mortality basis was changed from the RP-2000 Combin ed Mortality Table to the RP-2000 Blue Collar Mortality Table , both with full generational improvements in mortality using Scale BB
(4) Effective October 1, 2016, the mortality basis was changed from a 2015 projection of the RP-2000 Mortality Table for annuitants to a full generational projection using Scale BB of the RP-2000 Combined Mortality Table as required by State law.
(5) Effective October 1, 2016, the assumed increase in future annual salaries was changed from 4 00 % per year to 5.00% per year.
(6) Effective October 1, 2014 , the mortality basis was updated from a 2007 projection of the RP-2000 Mortality Table to a 2015 projection of the RP-2000 Mortality Table
(7) Effective October 1, 2012 , the assumed increase in future salaries was decreased from 5.00% per year to 4.00 % per year to reflect lower expected wage inflation
(8) Effective October 1, 2012 , for purposes of calculating pension benefits, plan compensation after 2012 was assumed to be reduced by 5 00% to reflect the exclusion of overtime hours in excess of 300 hours per year after 2012 and the exclusion of payments for unused sick and annual leave that accrues after 2012.
Summary of Plan Provisions Table V-A
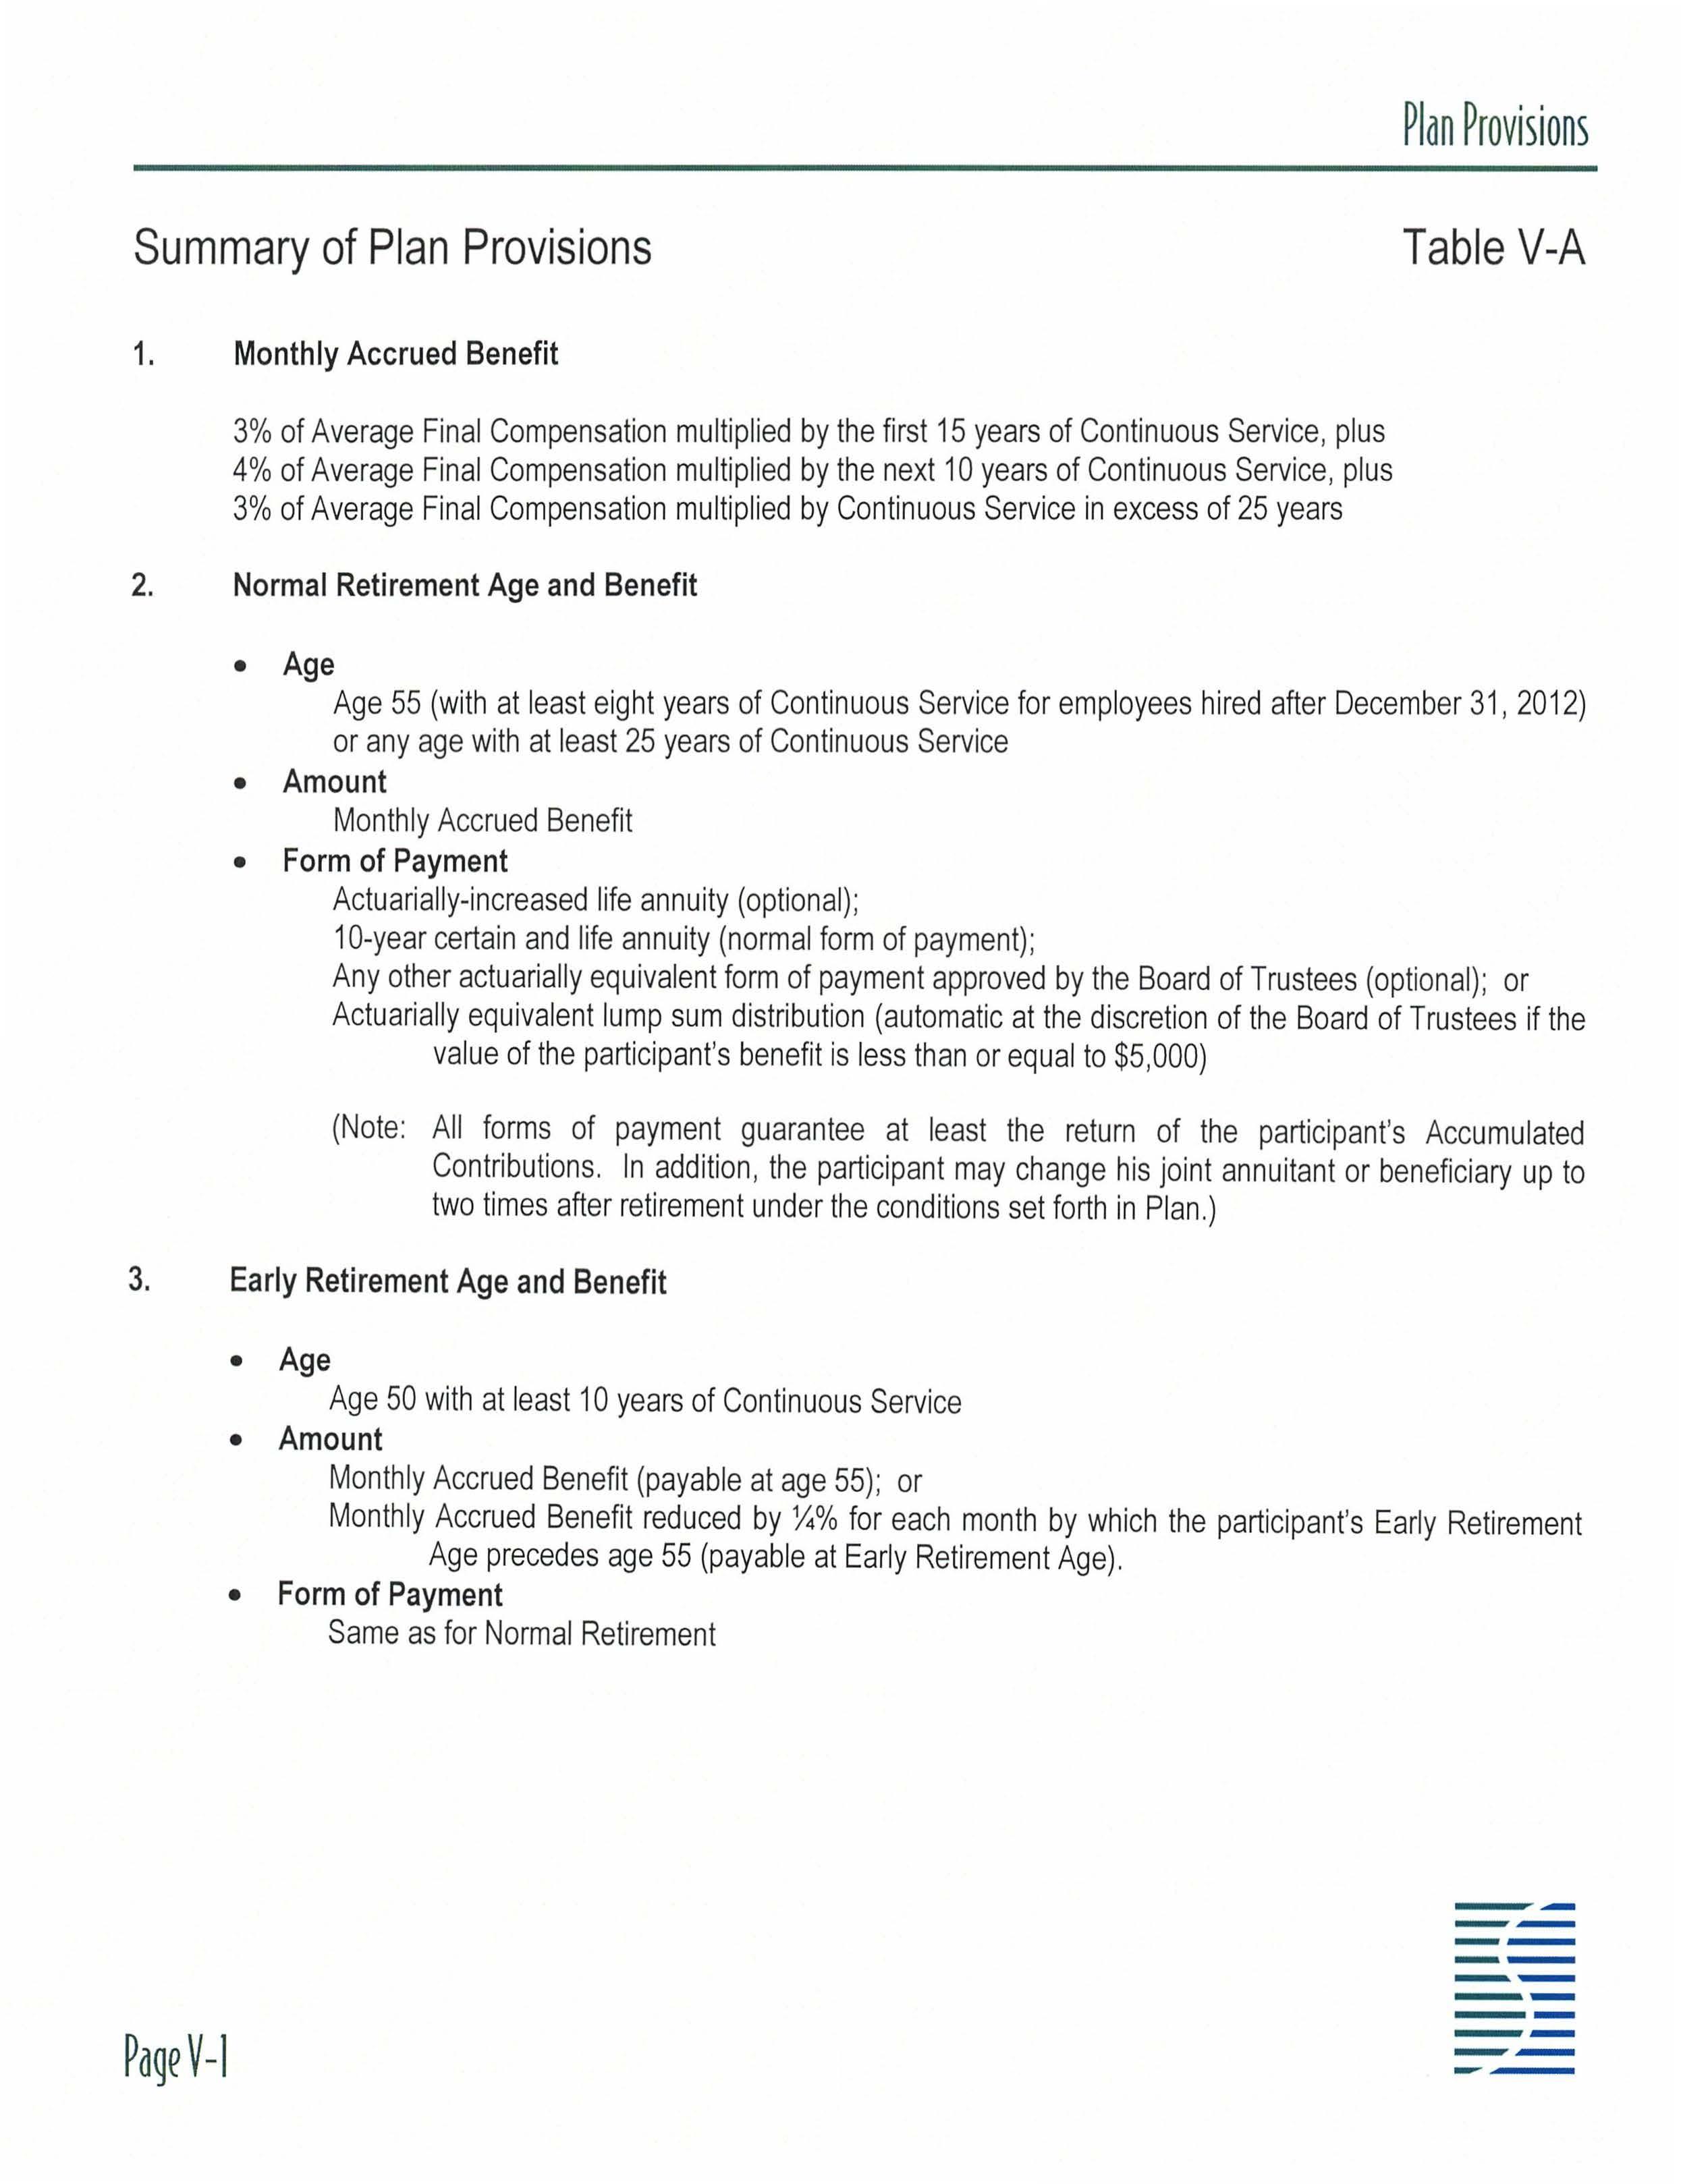
1. Monthly Accrued Benefit
3%of Average Final Compensation multiplied by the first 15 years of Continuous Service, plus 4% of Average Final Compensation multiplied by the next 10 years of Continuous Service, plus 3% of Average Final Compensation multiplied by Continuous Service in excess of 25 years
2. Normal Retirement Age and Benefit
• Age
Age 55 (with at least eight years of Continuous Service for employees hired after December 31 , 2012) or any age with at least 25 years of Continuous Service
• Amount
Monthly Accrued Benefit
• Form of Payment
Actuarially-increased life annuity (optional) ; 10-year certain and life annuity (normal form of payment) ; Any other actuarially equivalent form of payment approved by the Board of Trustees (optional); or Actuarially equivalent lump sum distribution (automatic at the discretion of the Board of Trustees if the value of the participant's benefit is less than or equal to $5,000)
(Note: All forms of payment guarantee at least the return of the participant's Accumulated Contributions . In addition , the participant may change his joint annuitant or beneficiary up to two times after retirement under the conditions set forth in Plan.)
3. Early Retirement Age and Benefit
• Age Age 50 with at least 10 years of Continuous Service
• Amount
Monthly Accrued Benefit (payable at age 55); or
Monthly Accrued Benefit reduced by ¼% for each month by which the participant's Early Retirement Age precedes age 55 (payable at Early Retirement Age) .
• Form of Payment
Same as for Normal Retirement
Summary of Plan Provisions Table
4. Delayed Retirement Age and Benefit
• Age After Normal Retirement Age
• Amount Monthly Accrued Benefit
• Form of Payment
Same as for Normal Retirement
5. Service Incurred Disability Eligibility and Benefit
• Eligibility
All participants are eligible .
• Condition
The participant must have sustained a service-connected illness, injury, disease, or disability which permanently and wholly prevents him from rendering useful and efficient service to the City as a firefighter. Any permanent disability caused by tuberculosis, hepatitis, meningococcal meningitis, hypertension, cancer, hardening of the arteries, or heart disease is presumed to be service-connected unless a physical examination conducted upon employment revealed such a condition at that time.
• Amount Payable Until Normal Retirement Age
A monthly benefit equal to the larger of (a) or (b) , as follows , and payable as a 10-year certain and life annuity:
(a) Monthly Accrued Benefit;
(b) Average monthly compensation paid by the City for the participant's last position and pay step at the time of disability minus any worker's compensation and long-term disability benefits wh ich are payable, limited to 42% of the participant's Average Final Compensation
• Amount Payable Upon Attainment of Normal Retirement Age
A monthly benefit equal to the larger of (a) or (b), as follows , and payable under any of the optional forms of payment otherwise available upon Normal Retirement:
(a) The monthly disability benefit payable prior to Normal Retirement Age; or
(b) Monthly Accrued Benefit reflecting compensation and Continuous Service both before and during the participant's period of disability. For purposes of determining compensation during the participant's period of disability, compensation is based on the base wage rates paid by the City for the participant's last position and step.
Summary of Plan Provisions Table
6.
Non-Service Incurred Disability Eligibility and Benefit
• Eligibility
Eight years of Continuous Service
• Condition
The participant must have sustained an illness, injury, disease, or disability which permanently incapacitates him physically or mentally from his regular and continuous duty for the City and from any other gainful full-time employment. In addition , the participant must have filed a claim for social security and long-term disability benefits, as applicable.
• Amount Payable Until Normal Retirement Age
A monthly benefit equal to the larger of (a) or (b) , as follows , and payable as a 10-year certain and life annuity:
(a) Monthly Accrued Benefit;
(b) Average monthly compensation paid by the City for the participant's last position and pay step at the time of disability minus any long-term disability benefits which are payable, limited to 25% of the participant's Average Final Compensation.
• Amount Payable Upon Attainment of Normal Retirement Age
A monthly benefit equal to the larger of (a) or (b), as follows, and payable under any of the optional forms of payment otherwise available upon Normal Retirement:
(a) The monthly disability benefit payable prior to Normal Retirement Age; or
(b) Monthly Accrued Benefit.
7. Deferred Vested Benefit
• Age
Any age with at least five years of Continuous Service (eight years for employees hired after December 31 , 2012)
• Amount Monthly Accrued Benefit (payable at age 55) ;
Monthly Accrued Benefit reduced by ¼% for each month by which the participant's Early Retirement Age precedes age 55 (payable at Early Retirement Age)
• Form of Payment
Same as for Normal Retirement
Summary of Plan Provisions Table V-A
8. Pre-Retirement Death Benefits
• Vested Participant (continued)
Upon the death prior to retirement of a fully vested participant, the participant's beneficiary receives a Pre-Retirement Survivor Annuity equal to the greater of the participant's Monthly Accrued Benefit payable at the participant's earliest retirement age or the amount that would have been payable had the participant retired on his date of death and elected the 100% joint and contingent form of payment. At the beneficiary's election and upon approval by the Trustees, an actuarially equivalent annuity is payable at any time following the participant's death. Notwithstanding the above, if the actuarially equivalent value of the Pre-Retirement Survivor Annuity is less than $5,000, the beneficiary will automatically receive a lump sum payment in lieu of a monthly annuity In any event, the Pre-Retirement Survivor Annuity guarantees at least the return of the participant's Accumulated Contributions.
• Non-Vested Participant
In the case of the death of a non-vested participant prior to retirement, his beneficiary will receive the participant's Accumulated Contributions
9. Average Final Compensation
Average compensation for the highest five years of service prior to the determination, where compensation includes total cash remuneration paid for services rendered to the City; overtime in excess of 300 hours per year earned after December 31 , 2012 and payments for unused sick and annual leave that accrue after that date are excluded from plan compensation for purposes of calculating pension benefits
10. Continuous Service
The uninterrupted service, expressed in years and completed months, from the participant's date of hire until his date of termination , retirement, or death. Participants may purchase up to two years of credit for military or fulltime firefighter service by paying the full actuarial cost thereof into the pension fund.
11. Participation Requirement
All full-time firefighters of the City of Tamarac, Florida automatically become a participant in the Plan on their date of hire.
Summary of Plan Provisions Table V-A
(continued)
12. Accumulated Contributions
The participant's Contributions accumulated with 5.00% interest per annum for the period prior to January 1, 2013 or 2 50% interest per annum for the period after December 31 , 2012
13. Participant Contributions
10.50%of compensation per year (9.00% prior to January 1, 2013) ; participant Contributions are deemed to be "picked-up" by the City pursuant to Internal Revenue Code (IRC) §414(h)(2).
14. Definition of Actuarially Equivalent
• Interest Rate
7 00%per annum
• Mortality Table
Unisex mortality table promulgated by the Secretary of the Treasury for purposes of determining lump sum distributions pursuant to Internal Revenue Code (IRC) section 417(e)(3)
15. Plan Effective Date
The initial plan effective date is June 1, 1975; on October 1, 1999, the Plan was "spun-off' from the City of Tamarac Employees' Pension Plan .
16. Retirement Subsidy
Effective for those individuals who are active employees on or after March 1, 2001 , amonthly Retirement Subsidy is payable beginning at Early or Normal Retirement until age 65. The Retirement Subsidy is equal to $10.00 for each year of Continuous Service to a maximum benefit of $300.00 per month. In addition , the Retirement Subsidy is automatically increased by 2½%per annum to reflect increases in the cost-of-living . The Retirement Subsidy is not available to deferred vested participants.
17. Supplemental Pension
Effective for those individuals who retire on or after March 1, 2007, the plan provides a supplemental pension benefit equal to 3%of Average Final Compensation , proportionally reduced for less than 2,496 hours of accrued sick leave, provided that the participant has accumulated at least 200 hours of unused sick leave upon separation from service
Summary of Plan Provisions Table V-A
(continued)
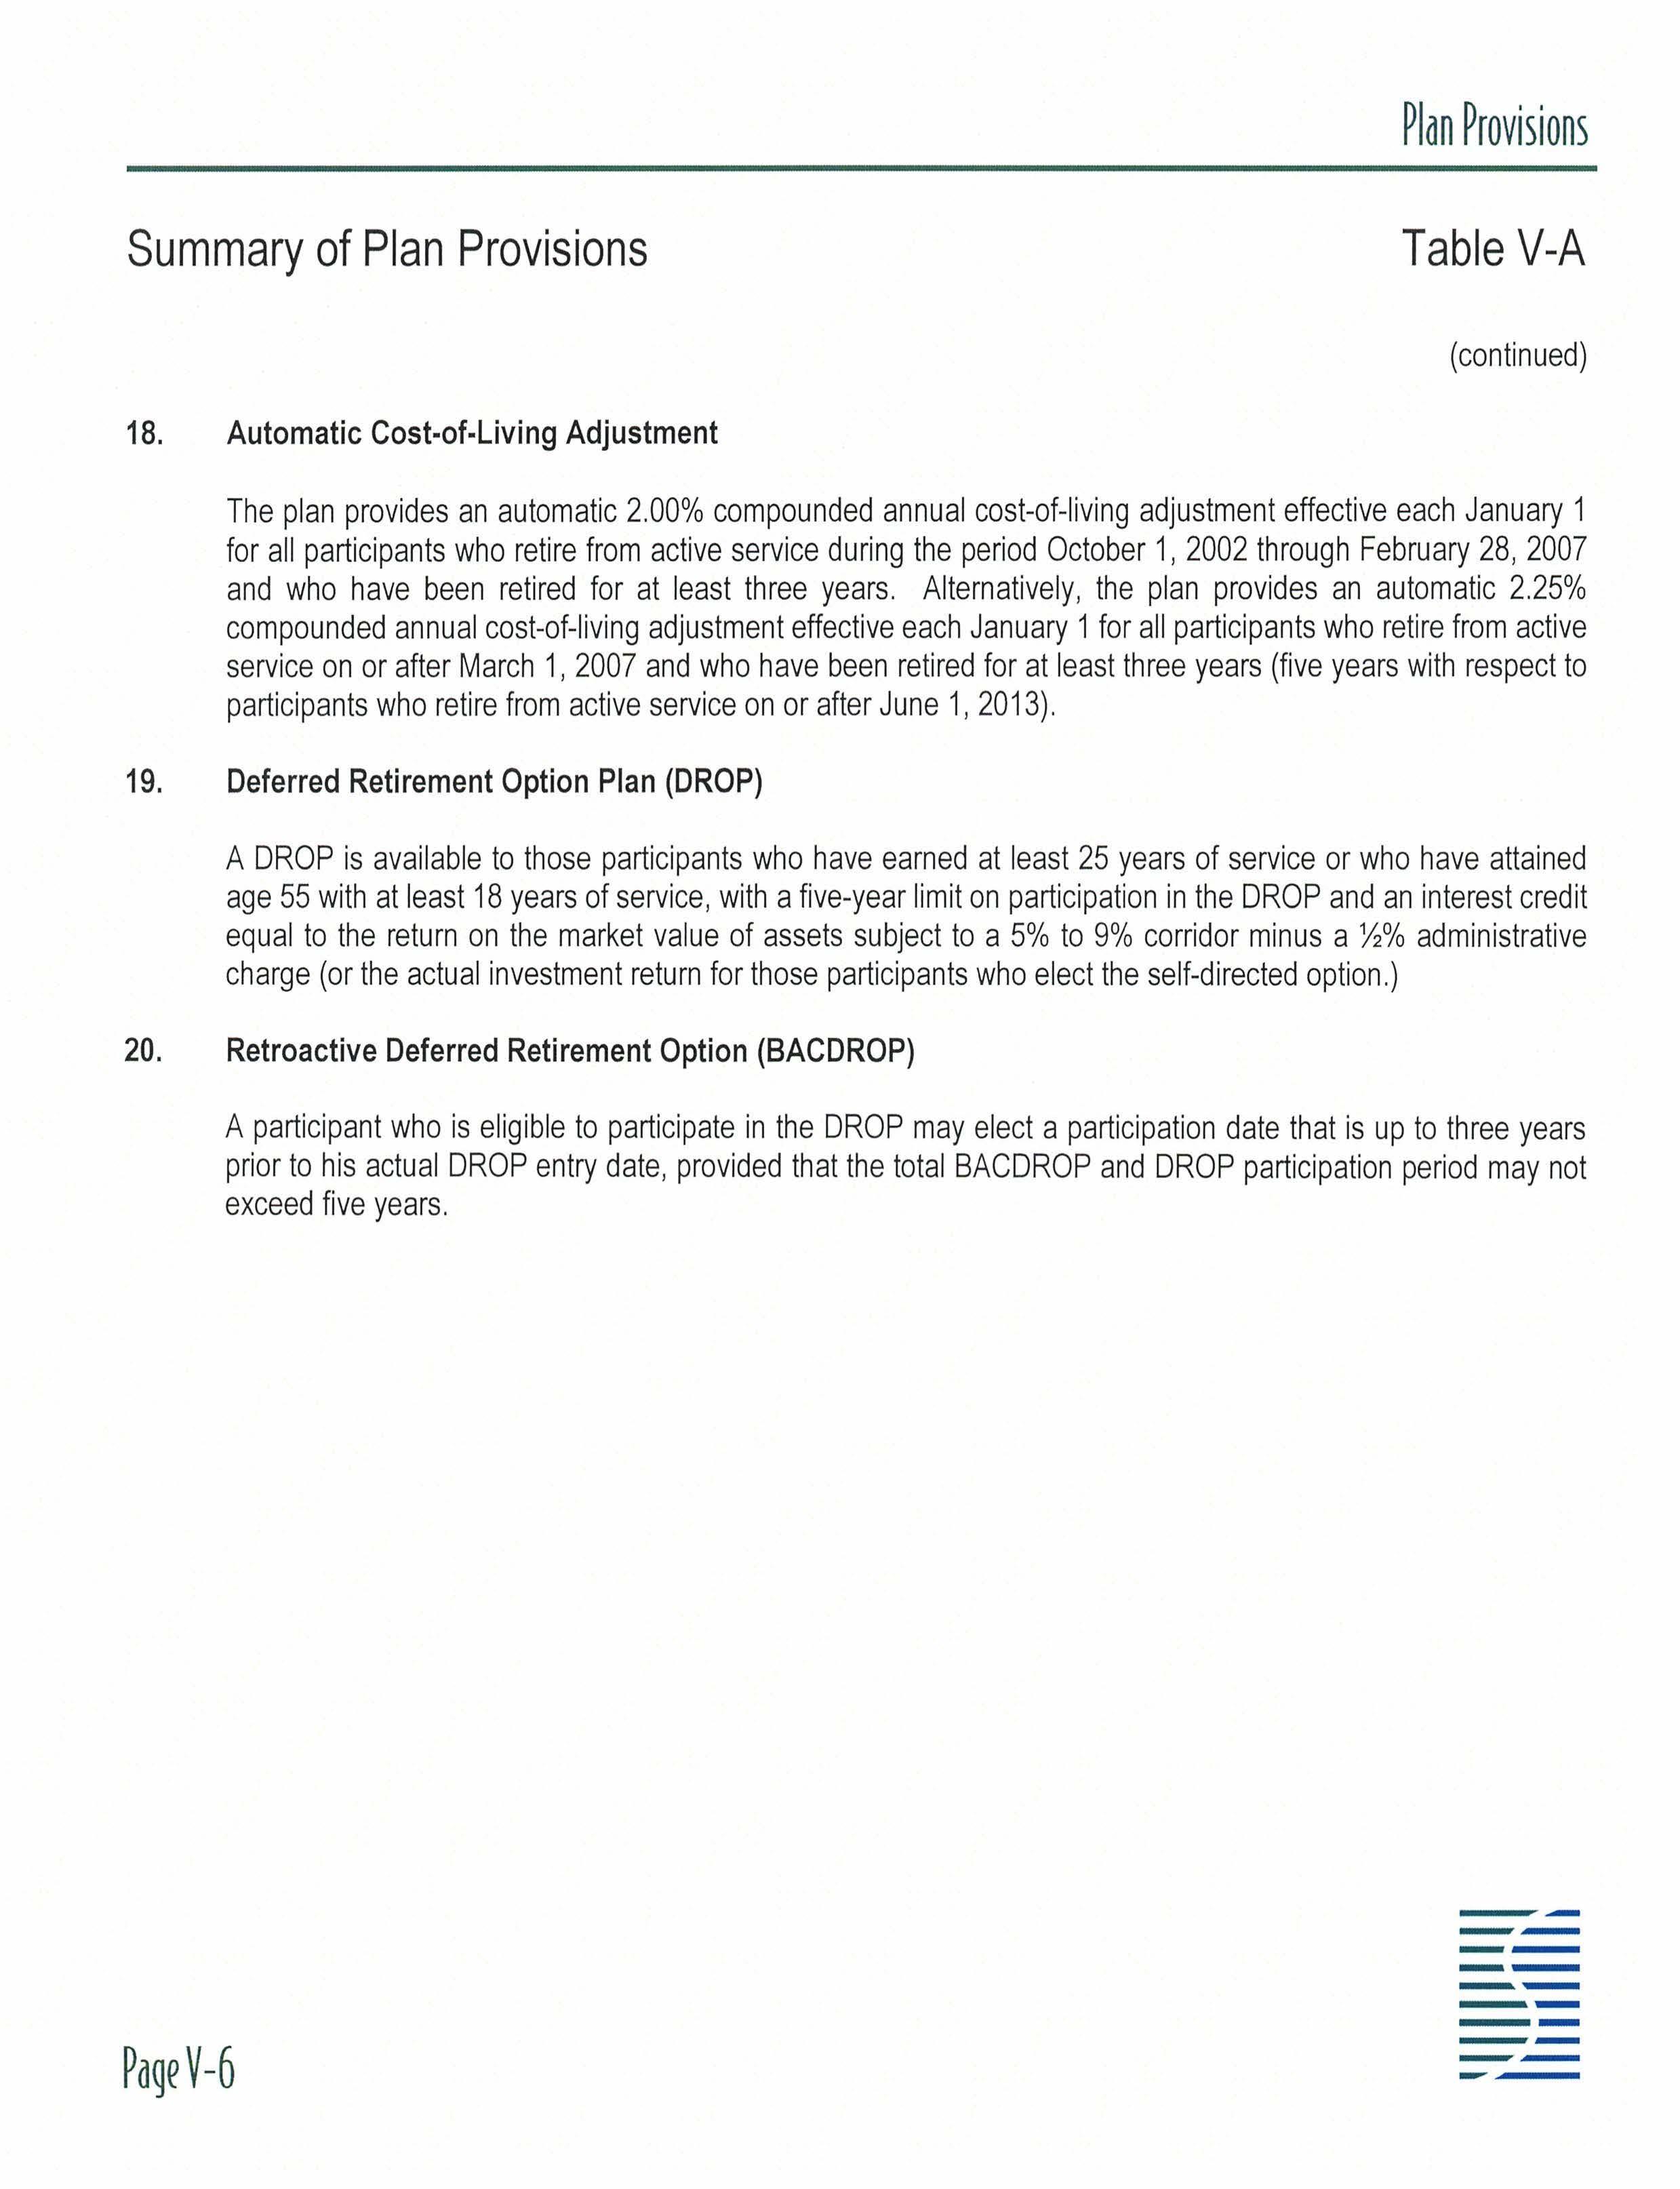
18. Automatic Cost-of-Living Adjustment
The plan provides an automatic 2.00% compounded annual cost-of-living adjustment effective each January 1 for all participants who retire from active service during the period October 1, 2002 through February 28, 2007 and who have been retired for at least three years Alternatively, the plan provides an automatic 2 25% compounded annual cost-of-living adjustment effective each January 1for all participants who retire from active service on or after March 1, 2007 and who have been retired for at least th ree years (five years with respect to participants who retire from active service on or after June 1, 2013)
19. Deferred Retirement Option Plan (DROP)
A DROP is available to those participants who have earned at least 25 years of service or who have attained age 55 with at least 18 years of service, with a five-year limit on participation in the DROP and an interest credit equal to the return on the market value of assets subject to a 5% to 9% corridor minus a ½% administrative charge (or the actual investment return for those participants who elect the self-directed option )
A participant who is eligible to participate in the DROP may elect a participation date that is up to three years prior to his actual DROP entry date, provided that the total BACDROP and DROP participation period may not exceed five years.
Summary of Plan Amendments Table V-8
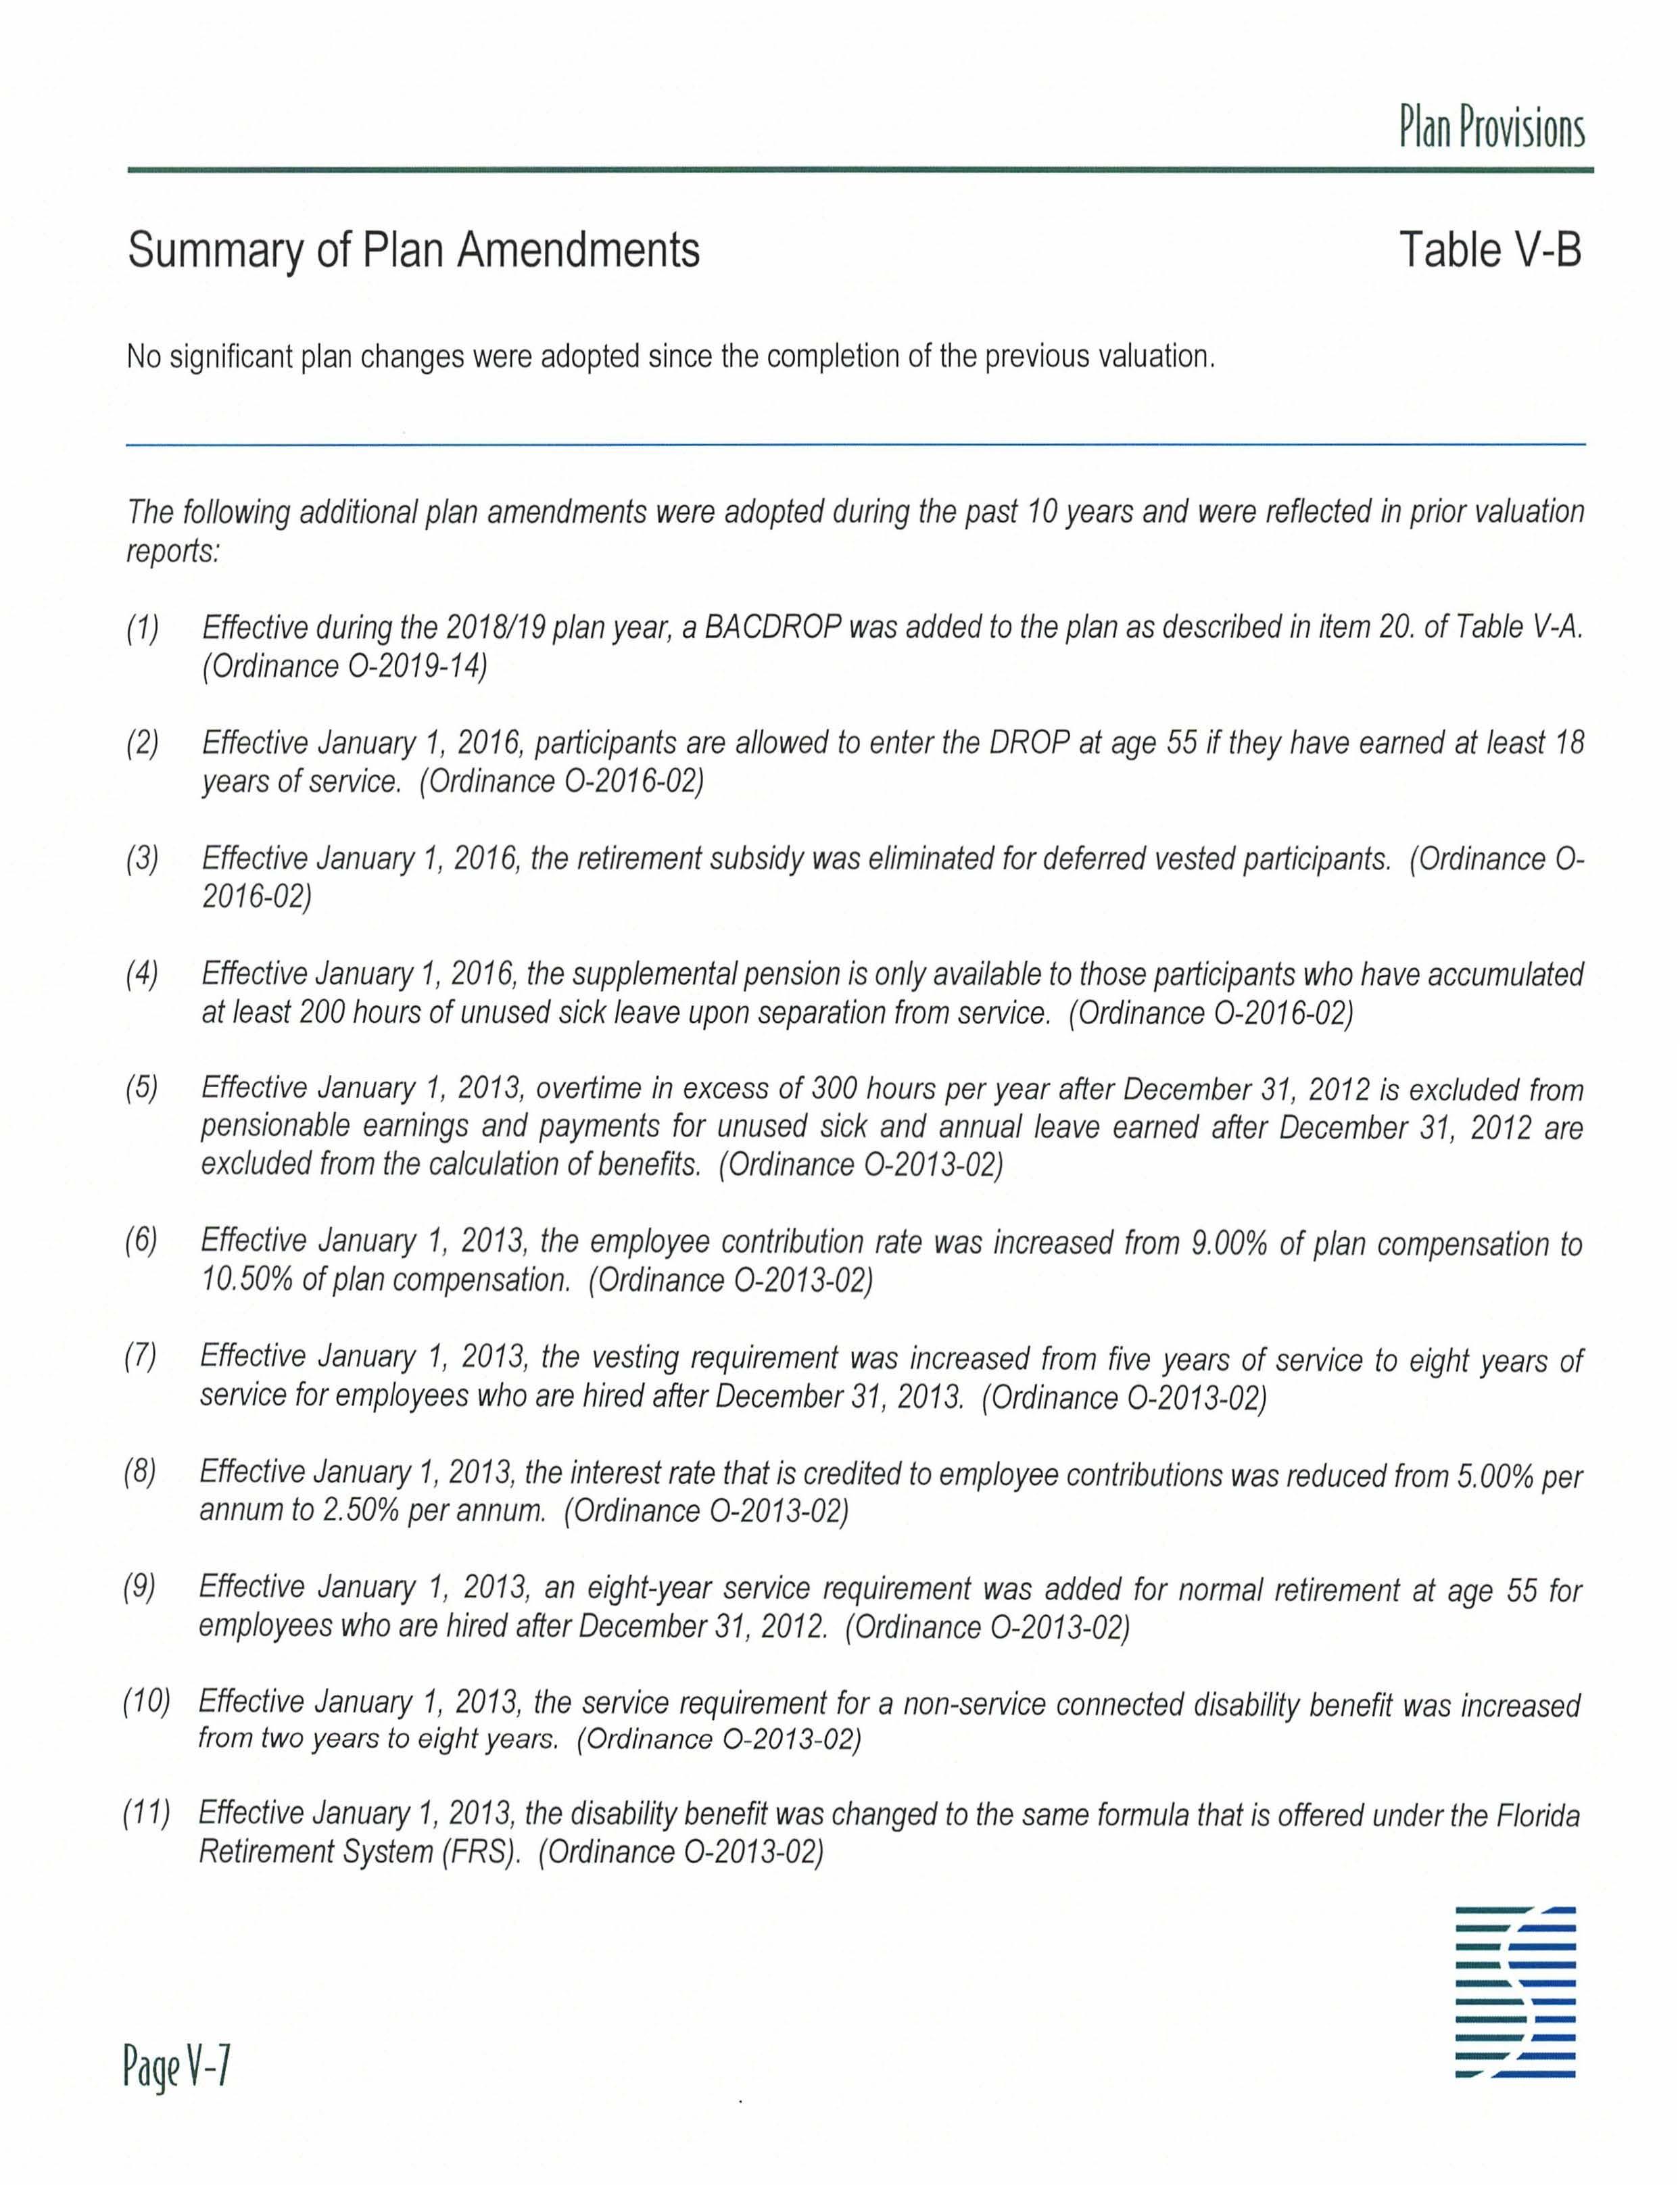
No significant plan changes were adopted since the completion of the previous valuation.
The following additional plan amendments were adopted during the past 10 years and were reflected in prior valuation reports:
(1) Effective during the 2018/19 plan year, a BACDROP was added to the plan as described in item 20. of Table V-A. (Ordinance 0-2019-14)
(2) Effective January 1, 2016 , participants are allowed to enter the DROP at age 55 if they have earned at lea st 18 years of service. (Ordinance 0-2016-02)
(3) Effective January 1, 2016 , the retirement subsidy was eliminated for deferred vested participants. (Ordinance 02016-02)
(4) Effective January 1, 2016 , the supplemental pension is only available to those participants who have accumulated at least 200 hours of unused sick leave upon separation from service. (Ordinance 0-2016-02)
(5) Effective January 1, 2013 , overtime in excess of 300 hours per year after December 31 , 2012 is excluded from pensionable earnings and payments for unused sick and annual leave earned after December 31 , 2012 are excluded from the calculation of benefits. (Ordinance 0-2013-02)
(6) Effective January 1, 2013 , the employee contribution rate was increased from 9.00% of plan compensation to 10 50% of plan compensation. (Ordinance 0-2013-02)
(7) Effective January 1, 2013 , the vesting requirement was increased from five years of service to eight years of service for employees who are hired after December 31 , 2013. (Ordinance 0 -20 13-02)
(8) Effective January 1, 2013 , the interest rate that is credited to employee contributions was reduced from 5.00% per annum to 2 50% per annum. (Ordinance 0-2013-02)
(9) Effective January 1, 2013 , an eight-year service requirement was added for normal retirement at age 55 for employees who are hired after December 31 , 2012. (Ordinance 0-2013-02)
(10) Effective January 1, 2013 , the service requirement for a non-service connected disability benefit was increased from two years to eight years. (Ordinance 0-2013-02)
(11) Effective January 1, 2013 , the disability benefit was changed to the same formula that is offered under the Florida Retirement System (FRS). (Ordinance 0-2013 -02)
Summary of Plan Amendments Table V-8
(continued)
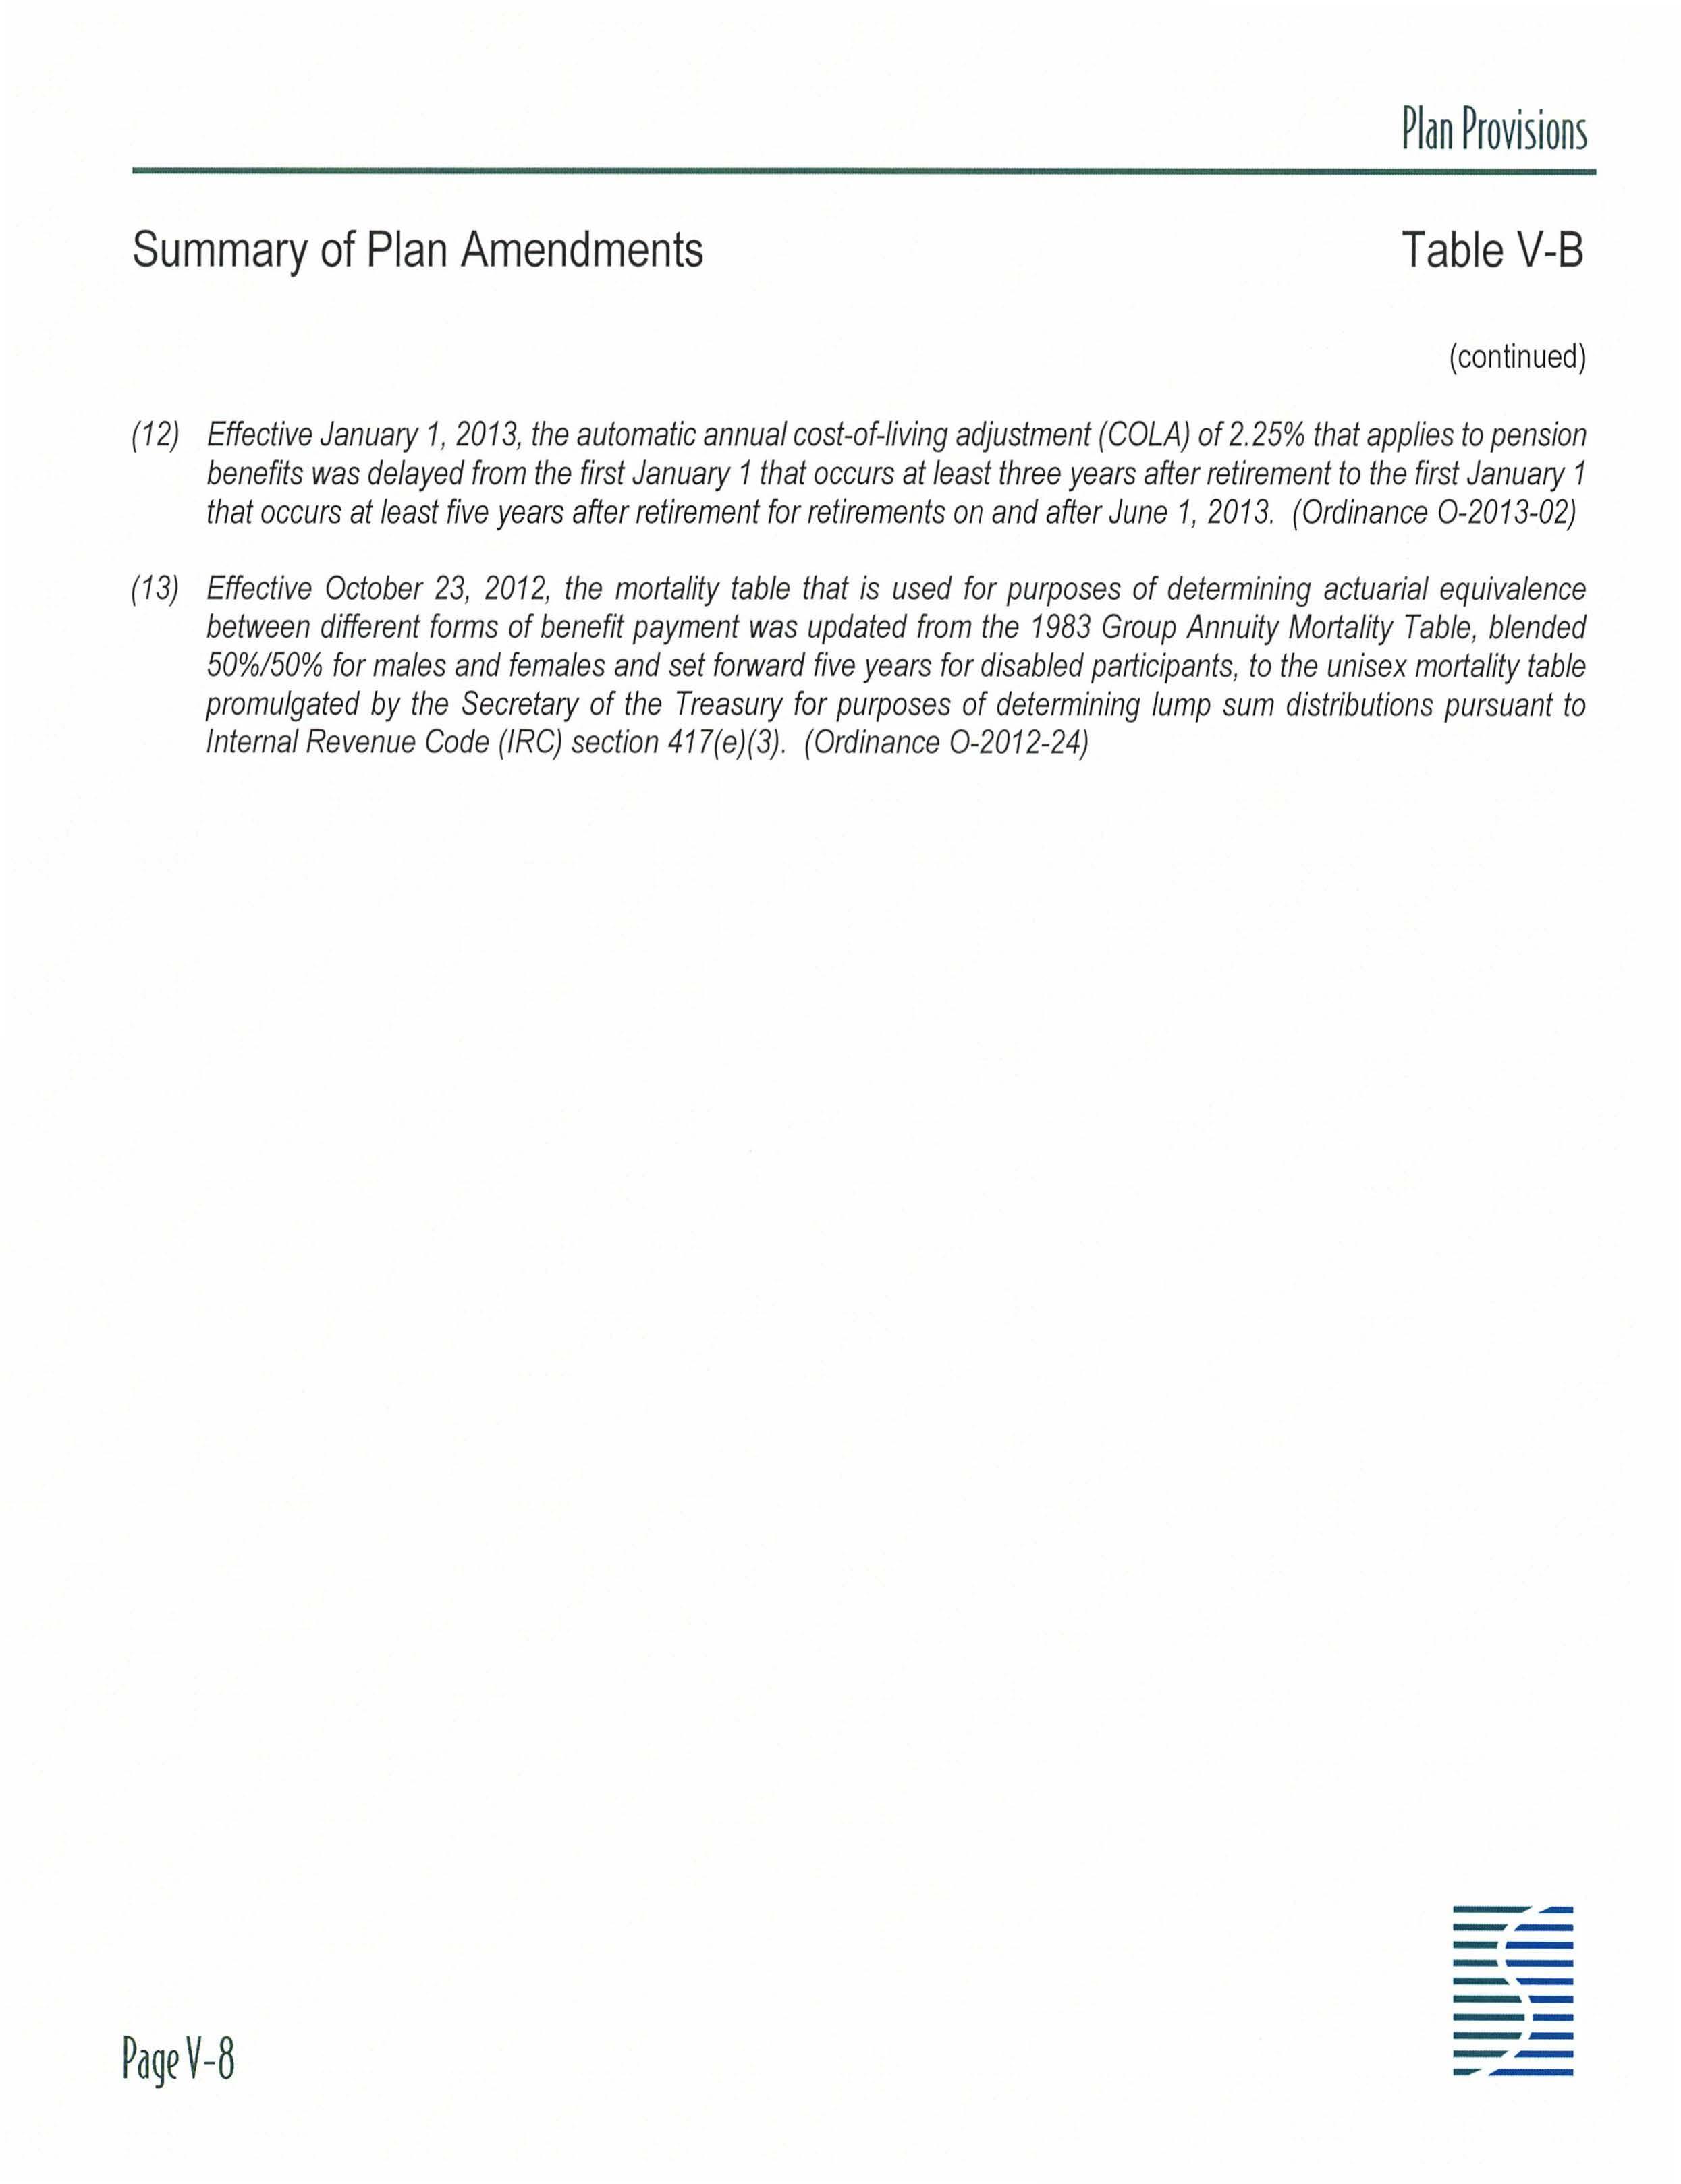
(12) Effective January 1, 2013 , the automatic annual cost-of-living adjustment (COLA) of 2.25% that applies to pension benefits was delayed from the first January 1 that occurs at least three years after retirement to the first January 1 that occurs at least five years after retirement for retirements on and after June 1, 2013 (Ordinance 0-2013-02)
(13) Effective October 23 , 2012 , the mortality table that is used for purposes of determining actuarial equivalence between different forms of benefit payment was updated from the 1983 Group Annuity Mortality Table , blended 50 %150% for males and females and set forward five years for disabled participants , to the unisex mortality table promulgated by the Secretary of the Treasury for purposes of determining lump sum distributions pursuant to Internal Revenue Code (/RC) section 417(e)(3) (Ordinance 0 -2012-24)