W. Zhang/M. Wu/J. Zhu · Evaluation of vehicular dynamic effects for the life cycle fatigue design of short-span bridges
ranges represented by vehicle speeds from 10 m/s (22.4 mph) to 60 m/s (134.4 mph).
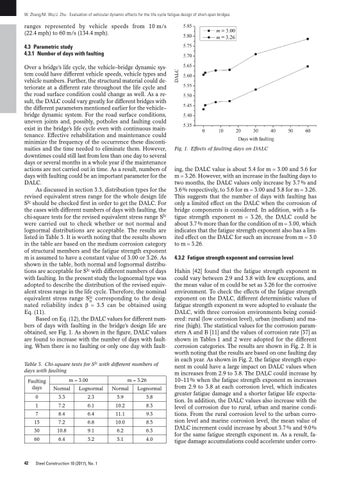
4.3 Parametric study 4.3.1 Number of days with faulting Over a bridge’s life cycle, the vehicle–bridge dynamic system could have different vehicle speeds, vehicle types and vehicle numbers. Further, the structural material could deteriorate at a different rate throughout the life cycle and the road surface condition could change as well. As a result, the DALC could vary greatly for different bridges with the different parameters mentioned earlier for the vehicle– bridge dynamic system. For the road surface conditions, uneven joints and, possibly, potholes and faulting could exist in the bridge’s life cycle even with continuous maintenance. Effective rehabilitation and maintenance could minimize the frequency of the occurrence these discontinuities and the time needed to eliminate them. However, downtimes could still last from less than one day to several days or several months in a whole year if the maintenance actions are not carried out in time. As a result, numbers of days with faulting could be an important parameter for the DALC. As discussed in section 3.3, distribution types for the revised equivalent stress range for the whole design life Slc should be checked first in order to get the DALC. For the cases with different numbers of days with faulting, the chi-square tests for the revised equivalent stress range Slc were carried out to check whether or not normal and lognormal distributions are acceptable. The results are listed in Table 3. It is worth noting that the results shown in the table are based on the medium corrosion category of structural members and the fatigue strength exponent m is assumed to have a constant value of 3.00 or 3.26. As shown in the table, both normal and lognormal distributions are acceptable for Slc with different numbers of days with faulting. In the present study the lognormal type was adopted to describe the distribution of the revised equivalent stress range in the life cycle. Therefore, the nominal equivalent stress range Slc n corresponding to the designated reliability index G " 3.5 can be obtained using Eq. (11). Based on Eq. (12), the DALC values for different numbers of days with faulting in the bridge’s design life are obtained, see Fig. 1. As shown in the figure, DALC values are found to increase with the number of days with faulting. When there is no faulting or only one day with faultTable 3. Chi-square tests for Slc with different numbers of days with faulting m " 3.00
Faulting days
Normal
Lognormal
0
3.3
1
7.2
7
42
m " 3.26 Normal
Lognormal
2.3
5.9
5.8
6.1
10.2
8.3
8.4
6.4
11.1
9.3
15
7.2
6.8
10.0
8.5
30
10.8
9.1
6.2
6.3
60
6.4
5.2
5.1
4.0
Steel Construction 10 (2017), No. 1
Fig. 1. Effects of faulting days on DALC
ing, the DALC value is about 5.4 for m " 3.00 and 5.6 for m " 3.26. However, with an increase in the faulting days to two months, the DALC values only increase by 3.7 % and 3.6 % respectively, to 5.6 for m " 3.00 and 5.8 for m " 3.26. This suggests that the number of days with faulting has only a limited effect on the DALC when the corrosion of bridge components is considered. In addition, with a fatigue strength exponent m " 3.26, the DALC could be about 3.7 % more than for the condition of m " 3.00, which indicates that the fatigue strength exponent also has a limited effect on the DALC for such an increase from m " 3.0 to m " 3.26.
4.3.2 Fatigue strength exponent and corrosion level Hahin [42] found that the fatigue strength exponent m could vary between 2.9 and 3.8 with few exceptions, and the mean value of m could be set as 3.26 for the corrosive environment. To check the effects of the fatigue strength exponent on the DALC, different deterministic values of fatigue strength exponent m were adopted to evaluate the DALC, with three corrosion environments being considered: rural (low corrosion level), urban (medium) and marine (high). The statistical values for the corrosion parameters A and B [11] and the values of corrosion rate [37] as shown in Tables 1 and 2 were adopted for the different corrosion categories. The results are shown in Fig. 2. It is worth noting that the results are based on one faulting day in each year. As shown in Fig. 2, the fatigue strength exponent m could have a large impact on DALC values when m increases from 2.9 to 3.8. The DALC could increase by 10–11 % when the fatigue strength exponent m increases from 2.9 to 3.8 at each corrosion level, which indicates greater fatigue damage and a shorter fatigue life expectation. In addition, the DALC values also increase with the level of corrosion due to rural, urban and marine conditions. From the rural corrosion level to the urban corrosion level and marine corrosion level, the mean value of DALC increment could increase by about 3.7 % and 9.0 % for the same fatigue strength exponent m. As a result, fatigue damage accumulations could accelerate under corro-