Ohne Vortrocknung
Karbonatisierungstiefe [ mm ]
Karb.koeffizient (umgerechnet) [ mm/Jahr1/2 ]
6
y = 1,0954x R² = 0,8945
0.032% CO2 10% CO2
4
100% CO2 Theoretisch (1 : 1)
y = 0,5512x R² = 0,6063
2 y = 0,2902x R² = 0,3926
CEM II/A-LL; w/z-Wert 0.50
20
y = 1,20x + 2,38 R² = 0,97
AGB24 A-A 4%
15
AGB24 A-A 1%
y = 0,83x + 1,77 R² = 0,99
AGB24 A-A Lab
10
5 y = 0,18x + 1,10 R² = 0,98
0
0 0
2
4
6
0
5
10
Karbonatisierungskoeff. 1% CO2 (umgerechnet) [ mm/Jahr 1/2 ]
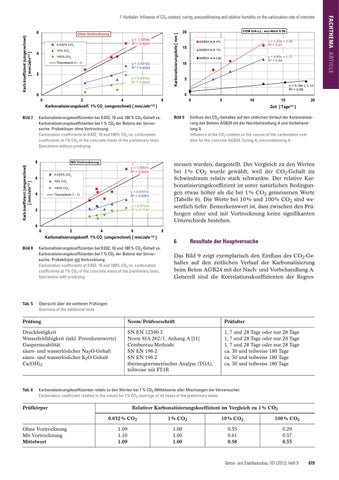
Bild 7
Karb.koeffizient (umgerechnet) [ mm/Jahr1/2 ]
Bild 9
Karbonatisierungskoeffizienten bei 0.032, 10 und 100 % CO2-Gehalt vs. Karbonatisierungskoeffizienten bei 1 % CO2 der Betone der Vorversuche. Probekörper ohne Vortrocknung Carbonation coefficients at 0.032, 10 and 100% CO2 vs. carbonation coefficients at 1% CO2 of the concrete mixes of the preliminary tests. Specimens without predrying
8
Mit Vortrocknung
10% CO2 100% CO2
4
y = 0,6101x R² = 0,5363
Theoretisch (1 : 1)
y = 0,3724x R² = 0,7748
2
20
Einfluss des CO2-Gehaltes auf den zeitlichen Verlauf der Karbonatisierung des Betons AGB24 mit der Nachbehandlung A und Vorbehandlung A Influence of the CO2 content on the course of the carbonation over time for the concrete AGB24. Curing A, preconditioning A
messen wurden, dargestellt. Der Vergleich zu den Werten bei 1 % CO2 wurde gewählt, weil der CO2-Gehalt im Schwindraum relativ stark schwankte. Der relative Karbonatisierungskoeffizient ist unter natürlichen Bedingungen etwas höher als die bei 1 % CO2 gemessenen Werte (Tabelle 6). Die Werte bei 10 % und 100 % CO2 sind wesentlich tiefer. Bemerkenswert ist, dass zwischen den Prüfungen ohne und mit Vortrocknung keine signifikanten Unterschiede bestehen.
y = 1,0901x R² = 0,6424
0.032% CO2
6
15 Zeit [ Tage1/2 ]
0 0
2
4
6
Karbonatisierungskoeff. 1% CO2 (umgerechnet) [ mm/Jahr 1/2 ]
Bild 8
Tab. 5
Karbonatisierungskoeffizienten bei 0.032, 10 und 100 % CO2-Gehalt vs. Karbonatisierungskoeffizienten bei 1 % CO2 der Betone der Vorversuche. Probekörper mit Vortrocknung Carbonation coefficients at 0.032, 10 and 100% CO2 vs. carbonation coefficients at 1% CO2 of the concrete mixes of the preliminary tests. Specimens with predrying
8
6
Resultate der Hauptversuche
Das Bild 9 zeigt exemplarisch den Einfluss des CO2-Gehaltes auf den zeitlichen Verlauf der Karbonatisierung beim Beton AGB24 mit der Nach- und Vorbehandlung A. Generell sind die Korrelationskoeffizienten der Regres-
Übersicht über die weiteren Prüfungen Overview of the additional tests
Prüfung
Norm/Prüfvorschrift
Prüfalter
Druckfestigkeit Wasserleitfähigkeit (inkl. Porenkennwerte) Gaspermeabilität säure- und wasserlöslicher Na2O-Gehalt säure- und wasserlöslicher K2O-Gehalt Ca(OH)2
SN EN 12390-3 Norm SIA 262/1, Anhang A [11] Cembureau-Methode SN EN 196-2 SN EN 196-2 thermogravimetrischer Analyse (TGA), teilweise mit FT-IR
1, 7 und 28 Tage oder nur 28 Tage 1, 7 und 28 Tage oder nur 28 Tage 1, 7 und 28 Tage oder nur 28 Tage ca. 30 und teilweise 180 Tage ca. 30 und teilweise 180 Tage ca. 30 und teilweise 180 Tage
Tab. 6
Karbonatisierungskoeffizienten relativ zu den Werten bei 1 % CO2 (Mittelwerte aller Mischungen der Vorversuche) Carbonation coefficient relative to the values for 1% CO2 (average of all mixes of the preliminary tests)
Prüfkörper
Ohne Vortrocknung Mit Vortrocknung Mittelwert
Relativer Karbonatisierungskoeffizient im Vergleich zu 1 % CO2 0.032 % CO2
1 % CO2
10 % CO2
100 % CO2
1.09 1.10 1.09
1.00 1.00 1.00
0.55 0.61 0.58
0.29 0.37 0.33
Beton- und Stahlbetonbau 107 (2012), Heft 9
619
FACHTHEMA ARTICLE
F. Hunkeler: Influence of CO2-content, curing, preconditioning and relative humidity on the carbonation rate of concrete