29 minute read
Comparison of high-performance and conventional internal insulation materials based on hygrothermal analysis using in situ measurements and simulation

from Bauphysik 1/2022
Following the European directive to reduce CO2 emissions of existing buildings by improving energy efficiency, internal insulation systems play a central role in the renovation of historically valuable buildings which cannot be insulated from the outside for reasons of monumental protection, or in cases where no additional exterior space is available. However, besides the thermal property of insulation systems, there are other relevant properties to be considered before choosing an internal insulation system, such as the hygrothermal behavior which plays a particularly important role in diffusion-open interior insulation systems. As the internal insulation layer reduces the temperature of the existing wall during the heating season, its drying potential after rain events is considerably reduced. In addition to the effects of moisture from the outside (mainly wind driven rain), the entry of humidity from the inside through diffusion plays an important role. In the presented study, high performance insulation materials with nanostructure based on silicon dioxide and polyurethane are compared to conventional material based on wood fiber from a hygrothermal point of view by analyzing in situ measurements and simulations.
Vergleich von Hochleistungsdämmstoffen mit einem konventionellen Innendämmstoff auf der Grundlage einer hygrothermischen Analyse mit In-situ-Messungen und Simulation
Im Zuge der europäischen Richtlinien zur Senkung der CO2Emissionen bestehender Gebäude durch Verbesserung der Energieeffizienz spielen Innendämmsysteme eine zentrale Rolle bei der Sanierung historisch wertvoller Gebäude, die aus Gründen des Denkmalschutzes nicht von außen gedämmt werden können, oder in Fällen, in denen keine zusätzlichen Außenflächen zur Verfügung stehen. Neben der wärmetechnischen Eigenschaft von Dämmsystemen gibt es jedoch noch weitere relevante Eigenschaften, die bei der Auswahl eines Innendämmsystems zu berücksichtigen sind, wie z. B. das hygrothermische Verhalten, das insbesondere bei diffusionsoffenen Innendämmsystemen eine wichtige Rolle spielt. Da die Innendämmschicht die Temperatur der bestehenden Wand während der Heizperiode absenkt, wird ihr Trocknungspotenzial nach Regenereignissen erheblich reduziert. Neben den Feuchteeinflüssen von außen (vor allem durch Schlagregen) spielt auch der Feuchteeintrag von innen durch Diffusion eine wichtige Rolle. In der vorgestellten Untersuchung wurden Hochleistungsdämmstoffe mit Nanostruktur auf Basis von Siliziumdioxid und Polyurethan mit einem konventionellen Dämmmaterial auf Basis von Holzfasern aus hygrothermischer Sicht verglichen, indem In-situ-Messungen und Simulationen analysiert wurden.
Keywords internal insulation; hygrothermal in situ measurements; hygrothermal simulation; high performance insulation Stichworte Innendämmung; hygrothermische In-situ-Messungen, hygrothermische Simulation; Hochleistungsdämmstoffe
1 Introduction
In the context of climate change, society is looking for ways to reduce its CO2 emissions. Although very strict EU energy efficiency directives for new buildings have been put in place for about two decades, the building sector is still responsible for a major part of around 40% of the total energy consumption [1]. In Luxembourg, more than 80% of final energy consumption per dwelling was used for space heating in 2016 [2]. Nevertheless, the energy consumption of existing buildings can be considerably reduced by retrofitting, e.g., with insulation systems. In order to achieve the EU’s 2050 emission reduction targets in the building sector, it is urgently necessary to renovate existing buildings to make them more energy efficient. For this reason, the Luxembourg Public Buildings Administration in cooperation with the University of Luxembourg launched a field test. The aim is to evaluate the potential of the insulation materials technically and to find a well-suited product for the renovation of Luxembourg’s historic public buildings. Since it is not always possible or desired to insulate the façade from outside, interior insulation plays an important role.
In addition to the thermal property of internal insulation systems, there are other relevant properties to be considered before choosing an internal insulation system, such as the hygrothermal behaviour. Because internal insulation of the external walls increases moisture performance challenges with risk of condensation on the cold side [3], frost damage, interstitial condensation and others [4]. The temperature drop in the insulation causes the masonry to cool down considerably during the heating period, resulting in a diffusion flow from the humid indoor air into the masonry. There are two approaches to control this problem: a diffusion-open insulation versus a diffusion-tight
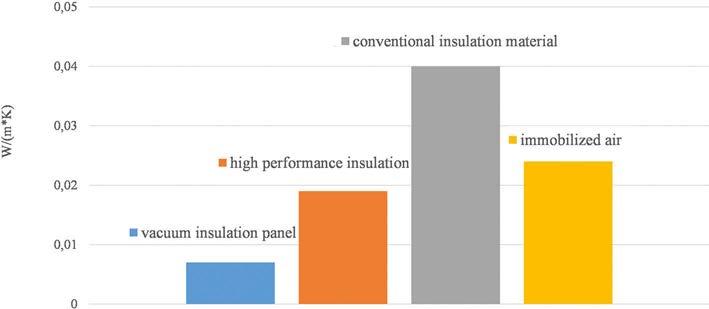
Fig. 1 Comparison of thermal conductivity of insulation materials and immobilized air Vergleich der Wärmeleitfähigkeiten von Dämmstoffen und immobilisierter Luft
insulation method, which can cope with higher indoor air humidity but allows very limited drying towards the room side and is more susceptible to practical issues from site as e.g., penetrations by cables, tubes and imperfect joints. Modern numerical simulation tools can be used for assessment and definitions of functional limits.
Another important characteristic of an internal insulation system is its thickness because it reduces considerably building useful areas. Thermal resistance is one of the criteria for performance assessment of insulating material and it depends on the thermal conductivity of the insulating material and its thickness. The thermal resistance (m2·K/W) is given by R = d/λ (d is the thickness and λ the thermal conductivity of the material). Thus, in order to have a low heat transmittance value (U = 1/R; in W/m2·K), the thermal resistance should be as high as possible. This can be achieved by materials with a low value of thermal conductivity or by important thickness.
Luxembourg’s regulation requires a minimum U-value of 0.4 W/m2·K for renovations with internal insulation in order to guarantee significant energy saving by renovation. With conventional insulation materials of thermal conductivity group 040, therefore approximately 6 to 8 cm of insulation material is required assuming a typical U-value of 1 W/m2·K of the existing wall. Hence, every improvement of the thermal conductivity of the insulation material itself is highly welcome to safe indoor space.
High performance insulations exist for many years and were originally developed for space applications in form of aerogel. The first use was dust collection in orbit (due to their large surface) and thermal insulation of space suits. The particularly good insulating effect is achieved by keeping the air molecules in the insulating material so tight in their particularly small chambers defined by the structure that their heat conduction is largely reduced by restricted Brownian motion of the molecules. High performance insulating materials as a consequence of their innovative technology of production present low heat conductivity values with increased lifetime and reduced thickness, which are distinct advantages in comparison to conventional insulating materials [5]. In this study, two insulation materials with aerogel structure based on silicon dioxide and polyurethane are compared with a insulation material of amorphous silicon and a conventional insulation material based on wood fibres. Concerning their thermal conductivity values, a comparison is presented in Figure 1, where vacuum panels were also added to the analysis as they represent the best-in-class case. However, vacuum insulation panels must not be cut or machined on site, which makes them difficult to use. Furthermore, any unwanted penetration by screws and nails leads to failure of the panel though the price is very high. Finally, aging properties are still unknown with a high probability of degradation. Hence, high performance materials based on nano-structured materials are currently an interesting option for internal insulation due to their high potential.
The comparison of the λ values shows that the use of nano-structured insulating materials can result in approx. 50% lower insulation material thicknesses and thus also greatly reduces the loss of space in the room. This plays a major role, especially against the backdrop of sharply rising housing prices in Luxembourg.
2 Method
2.1 Measuring environment
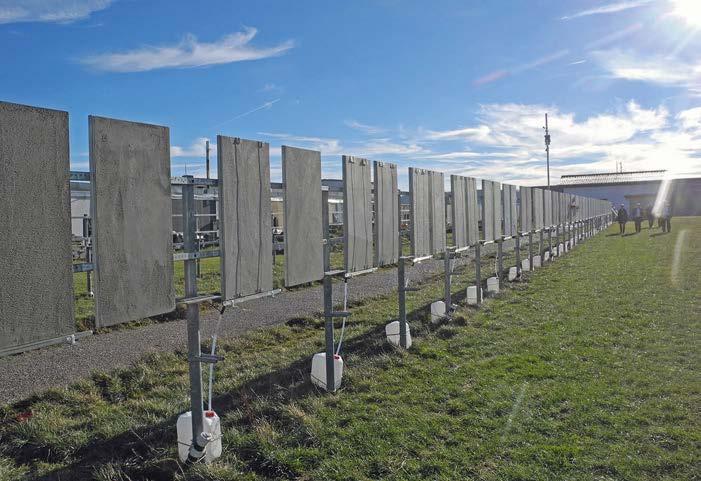
The present study is part of a long-term investigation of four interior insulation systems installed on test surfaces in a meeting room of an old administration building in Luxembourg City. Monitoring results of the indoor and outdoor climate and masonry moisture at different depths together with heat flow metering are compared to one dimensional hygrothermal simulation results. For this purpose, the software WUFI Pro 6.5 of the Fraunhofer IBP [6] is used. The software uses a method for one- and two-dimensional calculation of the coupled heat and moisture transport in building components with simple characteristic values invented by Künzel [7].
The building where the field test takes place is located in the historic centre of Luxembourg and is used as an office

Fig. 2 The meeting room is strongly exposed to weather Der Sitzungssaal ist der Witterung stark ausgesetzt
Fig. 3 The inhomogeneous masonry with air inclusions is partly up to 400 years old Das inhomogene Mauerwerk mit Lufteinschlüssen ist teilweise bis zu 400 Jahre alt Fig. 4 Floor plan of the meeting room with the various test surfaces (schematically) Grundriss des Besprechungssaals mit verschiedenen Testflächen (schematisch)
building by the Administration of Public Buildings. The house was built in the 16th century and has been repeatedly converted and rebuilt over the past centuries. The façade of the building was last renovated in 2013. The meeting room is marked in red on the following google image on Figure 2.
Due to the age of the building and the many alterations and repairs, the masonry structure is very inhomogeneous and building materials from various periods can be found.
Originally, the building was constructed with Luxembourgian sandstone from a local quarry. The base walls have a thickness of about 1.5 m and streamline upwards. During the removal of the interior plaster, besides natural stone, brick and sand-lime brick were discovered, which were used for repairs in the past. The following picture gives an idea of the inhomogeneous structure of the masonry.

2.2 Insulation systems
The four selected insulation systems were installed in the same small conference room on different parts of the exterior wall during summer 2019. The following table gives an overview of the four test surfaces and their thermal properties.
Because the results of the preliminary tests were only available after the insulation thicknesses for the field test had already been determined, different U-values for the individual test surfaces are achieved, why some of them are significantly below the required minimum U-value 0.4 W/m2·K. Since the pyrogenic silicon (system 2) is highly hydrophobic, the manufacturer added a 1 cm thick layer of mineral wool serving as a carrier to the interior plaster. Without this layer, the insulating material could not be plastered with conventional lime plaster.
Figure 4 shows a part of the building plan with the different test areas.
2.3 Preliminary measurements
Extensive preliminary measurements were done beforehand in order to predict the moisture characteristics by means of numerical simulation. These a priori-measurements included heat flow measurements to determine the U-value of the existing walls, measurements of the indoor temperature & humidity over a longer period of time to classify the room air humidity according to EN 15026

System I
Insulation material BASF Slentite Polyurethane aerogel Two boards each 15 mm per layer = 30 mm λSlentite = 0.018 W/mK EVONIK Calostat Pyrogenic silica Sandwich panel with 30 mm Calostat and 10 mm mineral wool λCalostat = 0.019 W/mK;
Complete system Glue mortar, 2–4 mm 1st layer of Slentite, 15 mm Glue mortar, 2 mm 2nd layer of Slentite, 15 mm Lime finish with reinforcement, 10 mm Diffusion open painting System II
λmineral wool = 0.040 W/mK Glue mortar, 4–6 mm Calostat board, 30 mm Mineral wool, 10 mm 1 dowel per board for fixation Lime finish with reinforcement, 10 mm Diffusion open painting
Façade orientation East Measured U-value existing wall [W/m2K] 0,97
Calculated U-value retrofitted wall [W/m2K] 0,37
Theoretical U-value reduction [%] 62
DR [m2*K/W] 1,7 sd value of the system [m] Total system thickness [mm] 0,22
48 East
0,97
0,35
64
1,8
0,17
55 System III
UDI Reco IN Wooden fiber board Combination of a flexible and a hard layer of wood fiber, 80 mm λUdiIn = 0.038 W/mK
Flexible layer of wood fiber, 20 mm Hard board of wood fiber, 60 mm 3 dowels per board for fixation Multigrund diffusion braking plaster, 10 mm Lime finish with reinforcement, 10 mm Diffusion open painting South
0,54 System IV
Cerabran Aerobran Aerogel plaster Lime plaster with aerogel components, 30 mm λAerobran = 0.028 W/mK
Aerogel plaster, 30–35 mm Water glass for stabilisation (sprayed), 1 mm Lime finish with reinforcement, 10 mm Diffusion open painting
South
0,73
0,26
52
2,0
1,56
100 0,38
48
1,3
0,21
45
and measurement of the interior masonry humidity to determine correct starting values for the simulation. To assess the exterior plaster, the water absorption coefficient was measured by the use of Pleyer tubes and the new WAM100B measuring device by Stelzmann [8].
These measurements and their results were deployed in detail at the Building Physics Days in Weimar in September 2019 [9]. The following important basic statements can be summarized and are important for the simulation:
– According to EN 15026, the indoor humidity is at a low/dry level during the measuring period in this investigated room. – The exterior plaster is waterproof, the wa coefficient was < 0.2 kg/(m2·h0,5) – The heat flow measurements resulted in the following
U-values for the existing test areas: 1 – PU aerogel area: 0.97 W/(m2·K) 2 – Pyrogenic silica area: 0.97 W/(m2·K) 3 – Wood fibre area: 0.54 W/(m2·K) 4 – Aerogel plaster area: 0.73 W/(m2·K)
The value of the test area of the wooden fibre insulation seems to be very low for a non-insulated wall. However, the measurement was repeated twice with the same result. The reason for the low U-value is the masonry, with 90 cm thickness containing numerous air inclusions with high inhomogeneity. Figure 3 shows the masonry without internal plaster.
The equilibrium moisture content values laid in a range between 50% to 60% for all test areas.
2.4 Hygrothermal measurements
For the measurements of the equilibrium moisture content between the insulation and the masonry, calibrated sensors of the ALMEMO system from Ahlborn were

Fig. 5 Installed sensors (RH and T) in the pipes Installierte Sensoren (relative Luftfeuchte und Temperatur) in den Rohren
Fig. 6 Installed pipes for sensors for relative humidity (RH) and temperature (T) in masonry and under insulation Installierte Rohre für Sensoren (relative Luftfeuchte und Temperatur) im Mauerwerk und unter der Isolierung

used. The indoor climate was measured with Wöhler devices type CDL 210 which can log temperature, relative humidity and the CO2 level in the room, to indicate the real occupation of the meeting room. The data of the outdoor climate was measured at the agricultural weather station in Merl [10] (approx. 2 km distance from the building). The sensor and measurement positions are shown in Figure 4.
The humidity and temperature sensors in the walls are protected by open 25 mm PVC tubes, allowing later removal. 3D printed plastic plugs with two greased gaskets were used to separate the measurement chamber with masonry affront from the indoor air (Figure 5). In the remaining small chamber with the sensor head at the front, the relative pore equilibrium moisture is imposed by the wall moisture at this depth. Figure 5 shows a sketch of the sensor in the pipe.
Figure 6 shows three installed measuring tubes at pyrogenic silicon test area (system 2). The figure also shows the low material thickness of the insulation compared to the existing construction.
The method of installation (parallel as possible to the lines of equal temperature) was chosen deliberately to reduce the influence of thermal bridges on the measurement results to a minimum. To minimize the influence of the thermal bridges of the window recess compared to the undisturbed wall, pipes with a length between 50 and 80 cm were selected.
In the masonry, measurements of the temperature and the relative humidity are taken at three depths under the test surfaces indicated in by red dots in Figure 4:
– Directly beneath the insulation layer – In the core of the existing brickwork – Close to the exterior plaster (around 5—8 cm beneath the external surface)
Thus, the influences of absorbed rain from the external conditions as well as the moisture diffusion into the wall from the inside can be assessed.
2.5 Hygrothermal simulations
The WUFI software family of Fraunhofer IBP is used for one- and multi-dimensional simulations of moisture con-
ditions at different depths in the masonry as well as under the installed interior insulation. These allow estimations of the expected moisture levels at critical points of the construction and hence the functional assessment. Two limit values, among others, are decisive for the evaluation of the construction:
– There must not be increasing accumulation of moisture in the construction i.e. more wetting than drying during the simulation period. – The degree of moisture penetration must not exceed 30% in relation to the pore volume. For materials sensitive to frost or containing gypsum, the maximum relative pore humidity must not exceed 95%, otherwise the risk of mould growth and frost damage is too great.
The results of the simulations were analysed according to the guidelines for evaluation and assessment of hygrothermal calculations by Fraunhofer. [11]
In the following, the results of the one-dimensional simulations with WUFI Pro 6.5 are described. For the predictions, the indoor climate of the “low humidity” level according to WTA 6-2 [12] and EN 15026 is used. For the outdoor climate, historical weather data of the weather station in Merl are used.
For validation, the measured values of the first 5 months (September 2019 to January 2020) were compared to the simulated data based on real climate measurements.
The following material parameters were used from the database of WUFI 6.5 and slightly adapted based on the in situ preliminary measurements:
3 Results and discussion
3.1 Measurement results
All data were registered as hourly values with calibrated Ahlborn Almemo and Wöhler CDL 210 data loggers and further processed in Excel. Due to short-term power supply problems and interruption of power grid caused by users in the room, there were interruptions in the recordings from time to time.
3.1.1 Climate conditions
A part of the indoor climate data is shown in Figure 7 for a period of about nearly two years. The strongly fluctuating indoor air temperature is particularly striking and shows a variance of ± 4 K around 21 °C. Especially in summer, the indoor air temperature rises with the outdoor air temperature. This is related to the room’s relatively leaky windows or due to extensive manual ventilation by window opening. Analyses of the air exchange rate using a blower door test and CO2 as a tracer gas showed air exchange rates between 0.4 and 0.7 per hour. In addition, the windows of the room do not have external blinds, which accelerates the heating of the room.
Since the outbreak of the Corona pandemic in Europe in March 2020, the use of the conference room has been reduced. While several meetings with up to 12 participants were held daily in the 35 m2 space before the pandemic, the usage has been reduced since then. In particular, the limitation of the maximum number of persons to six and increased window ventilation have led to a significantly reduction of the CO2 level in the room. The requirement to strongly ventilate all rooms in the building to limit the infection risk leads to very low relative humidity values of around 30 % in the winter 2020/21.
If the measured data is classified according to EN 15026 indoor climate humidity, it can be concluded that the room has a dry climate despite the high occupancy rate of a meeting room during the beginning of the field test. The high air exchange rate due to the window age (approx. 25 years) and the high proportion of manual window ventilation explain it.
Tab. 2 Material parameters for simulation Materialparameter für die Simulation
Dry density [kg/m3] Thermal conductivity [W/mK] Water uptake coefficient [kg/(m2h0,5 )] Diffusion resistance [–] Thickness [m]
External plaster – lime-cement 1900 0,8 0,1 25 Existing wall – quarry sandstone 2000 0.54/1.04 1,3 33 Adhesive mortar 833 0,155 0,18 15 0,02 0,90 0,01
Pyrogenic silica Mineral wool 171 0,019 0 60 0,04 0 3
0,03 1,3 0,01
PU aerogel Aerogel plaster Wood fibre board 117 0,018 0,2 5 210 0,028 0,96 4 140 0,04 0,45 3 0,032 0,035 0,08
Internal plaster wood fibre 1900 0,8 2 Internal plaster for aerogel plaster 1600 1 3 125 0,01 7 0,01
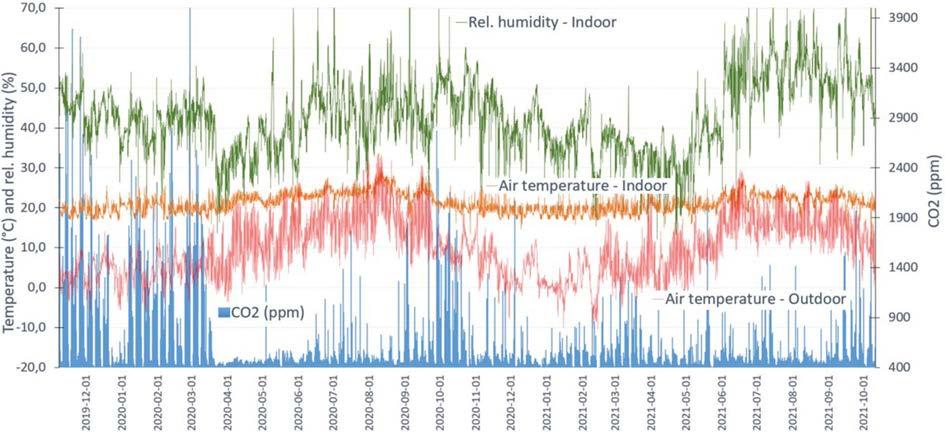
Fig. 7 Indoor climate (CO2, RH and T) versus outdoor temperature (red) of approximately two years Innenraumklima (CO2, rel. LF und Temperatur) im Vergleich zur Außentemperatur (rot) von etwa zwei Jahren
Fig. 8 Measured values of indoor air humidity versus temperature and humidity classes according to EN 15026 Messwerte der Raumluftfeuchte in Abhängigkeit von der Temperatur und den Feuchteklassen gemäß EN 15026
Fig. 9 Rain and irradiation during the field test, weather station Merl/Luxembourg Regen und Sonneneinstrahlung während des Feldversuchs, Wetterstation Merl/Luxemburg


The following graph shows the solar irradiation and rainfall events during the field test. Two differences stand out:
– In the first summer (2020), solar irradiation was significantly more frequent than in the following year. – In 2021, precipitation events were more frequent and more extended in the summer months leading to a higher relative humidity in the room.

Fig. 10 Measured values of temperature (T) under the four insulation systems and inside/outside Temperaturmesswerte (T) jeweils unter den vier Dämmsystemen sowie Raum- und Außentemperatur
Fig. 11 Measured values of relative humidity (RH) between internal insulation and existing wall for the four insulation systems and inside/outside relative humidity Messwerte der relativen Luftfeuchtigkeit (RH) jeweils zwischen Innendämmung und Bestandsmauerwerk für die vier Dämmsysteme sowie relative Luftfeuchte der Raum- und der Außenluft

3.1.2 Conditions beneath the insulation layers
The evaluation of the temperature and moisture values beneath the interior insulation systems confirmed the expected increase in pore air moisture during the cold winter months (see Figures 10 and 11).
It can be seen that the lower the diffusion resistance of the system, the faster the measured value reacts to changes in room air humidity (cf. Table 1: sd values).
Since the room air is quite dry, only a humidity of 84% was reached beneath the insulation surfaces during the observation period. This is clearly below the critical limit value of 95%. Since the wooden fibre insulation system is provided with a diffusion-braking plaster, it can be seen that the system reacts more slowly than the three other more diffusion-open systems, despite falling room air humidity. But increased diffusion resistance does not seem to have a positive effect on the peak moisture. On the other side, the increased resistance leads to lower drying, which causes the moisture to start at a higher level at the beginning of the second winter period.
In general, it can be said that all systems function without problems and the measured values move within a narrow spectrum in which the absolute material moisture changes only slightly. The following moisture storage function shows qualitatively the water content of porous materials versus the relative humidity.
The red-circled area in Figure 12 contains the measurement values shown above. In this area, diffusion processes still play the main role in the moisture transport effects. Effusion and capillary conduction increase from a value of 60% relative humidity, but generally only reach the

Fig. 12 Moisture storage function of porous materials [13] Feuchtespeicherfunktion von porösen Materialien [13]
Fig. 13 Temperature curves of the sensors in the cross-section beneath the wood fibre insulation, system 3 Temperaturkurven der Sensoren im Querschnitt unter der Holzfaserdämmung, System 3
Fig. 14 Temperature curves of the sensors in the cross-section beneath the wood fiber insulation Temperaturkurven der Sensoren im Querschnitt unter der Holzfaserdämmung
transport capacity of diffusion processes at a level of around 95%, where free water droplets form in the pores. Conversely, the causes for the measured differences lie in the sorption properties of the insulation materials, measurement inaccuracies and the different thermal qualities (thermal transmittance and thermal bridges) of the existing walls under the test surfaces. In addition to the moisture caused by diffusion from the room side air, the use of interior insulation can lead to moisture accumulation in the existing structure due to rain absorption from the outside.
The temperature curves clearly show that there is a strong cooling during the winter period despite the thick walls. Temperatures between 6 to 10°C prevail in the cross-section in winter. While the sensors in the core and under the insulation layer show relatively constant values, the temperature beneath the exterior plaster fluctuates strongly. In winter, it follows the outside air temperature with little delay. In summer, it fluctuates enormously due to solar radiation during the course of the day. Night-time radiation into the sky also has a clearly discernible effect on the façade temperature.
The humidity curves in Figure 14 show that the indoor and outdoor air humidifies the masonry. In the core, the moisture level only rises late and does not reach the level of the two “outer” layers. The low relative values around 80% are an indicator that it is exclusively moisture from diffusion and that the outer façade does absorb important rain quantities in this area.


Fig. 15 Comparison of simulated and measured values (RH & T for PU aerogel) Vergleich der simulierten und gemessenen Werte der relativen Feuchte (RH) und der Temperatur (T) für PU-Aerogel
Fig. 16 Simulation results for the humidity beneath the four insulation layers Simulationsergebnisse für die Feuchtigkeit jeweils unter den vier Dämmschichten

All humidity curves return to their initial values beneath 60 % RH in the summer phase, hence there is no accumulation of humidity in the construction from year to year.
3.2 Simulation results
The simulations with WUFI confirm the measured values with a good accuracy. Figure 15 shows a comparison between simulation and real humidity at the defined location in Figure 4.
Deviations can be explained, for example, by the location of the room temperature measurement and its distance from the test surface; the height and distance of the measurement of the indoor air parameters from the test surface play a decisive role. It was observed that in the room itself were large inhomogeneities depending on the operating time of radiators and manual ventilation by window opening.
Prior to the field test simulations have been done to predict humidity levels beneath the insulation layers. For this reason the hygrothermal reference year of Trier (available in the software and is closest to Luxembourg) was used, as complete climate data set (with wind and rain).
The simulations carried out in advance show clear differences for the insulation materials that should be achieved due to their different technical properties. In particular, the good capillary conduction properties according to the WUFI database give the PU aerogel (system 4) insulation material theoretical advantages over the pyrogenic silicon (system 2) that is hydrophobic in the core. The hydrophobisation means that capillary conduction is not possible. The manufacturer justifies the hydrophobisation of the material with the technical necessity due to the small
pore size in the nano range. If these pores were filled by capillary water in combination with the risk of frost in the winter period, the pore pressure would increase, and the material would self-destruct after a while. This effect should apply to all materials with pore sizes in the nano range.
In practice, the measurement results have shown that the performances of all insulation systems are much closer to each other than the preliminary simulations suggested which can be explained by relative dry conditions during the field test.
4 Conclusion
The results presented from the two previous years of measuring are part of a long-term study on four interior insulation systems in a conference room that deals with hygrothermal analysis. Three high-performance insulation materials with a nanostructure are compared to a wood fibre insulation system, which is state of the art and has been used as an interior insulation material for more than 30 years.
The in situ measurement results were compared with the simulation results. The measured values showed acceptable humidity levels over the entire measurement period reaching maximal values of 84% beneath the insulation layer and in all cases the insulation systems seem to work well under the given conditions. In particular, the fact that the entire masonry dried completely again during the summer period (humidity levels below 60% in the crosssection) shows that the insulation systems have large reserves under the given boundary conditions.
It must be taken into account that the Corona pandemic in particular led to a reduced use of the room and to more intensive ventilation behaviour, both parameters have an inhibiting effect on the moisture development under the insulation.
The comparison of the simulated moisture values with the measured values (using the real internal and external climate data) shows good agreement for the most critical measuring point directly beneath the respective interior insulation, proving a high reliability of the simulation. However, it should be noted that all critical parameters such as material properties, indoor and outdoor climate with driving rain, etc. must be evaluated accurately. Even small errors in the assessment of individual parameters can lead to large deviations in the simulation results. In order to achieve reliable results with hygrothermal simulation software, precise inputs are necessary, ideally validated as shown by measurement of humidity in different depths.
Furthermore, the simulations have shown that the functional verification of insulation materials without capillary properties is more successful if the interior plaster is diffusion braking i.e. with medium diffusion resistance. This can be achieved by using a lime-cement plaster, which increases the diffusion resistance and corresponds to common practice and is also recommended by the WTA in its Guide 6-4 [14]. The diffusion resistance of the insulation itself remains so low (sd value approx. 1 m) that the masonry can still dry out during the summer months.
5 Acknowledgements
The University of Luxembourg would like to thank the Administration des bâtiments publics Luxembourg for their indispensable support of the project.
References
[1] Hansen, T. K.; Bjarløv, S. P.; Peuhkuri, R. (2019) The effects of wind-driven rain on the hygrothermal conditions behind wooden beam ends and at the interfaces between internal insulation and existing solid masonry. Energy Build., vol. 196, pp. 255–268, https://doi.org/10.1016/j.enbuild.2019. 05.020. [2] European Environment Academy EEA (2016) Progress on energy efficiency in Europe. https://www.eea.europa.eu/ data-and-maps/indicators/progress-on-energy-efficiency-ineurope-3/assessment [accessed Aug. 19, 2021]. European
Environment Academy [3] Reza, G.; Peter, S.; Hannele, R. (2016) General rights Effect of façade impregnation on feasibility of capillary active thermal internal insulation for a historic dormitory-A hygrothermal simulation study. Downloaded from orbit.dtu.dk
Okt, vol. 13, p. 2021, https://doi.org/10.1016/j.conbuild mat.2016.03.019. [4] Vereecken, E.; Roels, S. (2016) Capillary Active Interior Insulation Systems for Wall Retrofitting: A More Nuanced
Story. Int. J. Archit. Herit., vol. 10, no. 5, pp. 558–569, Jul. 2016, https://doi.org/10.1080/15583058.2015.1009575. [5] Saez De Guinoa, A.; Zambrana-Vasquez, D.; Alcalde, A.;
Corradini, M.; Zabalza-Bribián, I. (2017) Environmental assessment of a nano-technological aerogel-based panel for building insulation. Journal of cleaner production, vol. 161, pp. 1404–1415. [6] WUFI® Pro WUFI (en). https://wufi.de/en/software/wufipro/ [accessed Oct. 13, 2021]. [7] Künzel, H. M. (1994) Verfahren zur ein- und zweidimesionalen Berechnung des dekoppelten Warme und Feuchtetransports in Bauteilen mit einfachen Kennwerten [Dissertation]. Universität Stuttgart, Fakultät Bauingenieur- und
Vermessungswesen. [8] Stelzmann, M. (2020) Entwicklung und Validierung eines
Verfahrens zur Untersuchung des Schlagregenschutzes von
Fassaden denkmalgeschützter Bestandsgebäude. Dissertation, TU Dresden. Stuttgart: Fraunhofer IRB Verlag.
[9] Latz, S.; Thewes, A.; Scholzen, F.; Maas, S. (2019) Evaluation von bauphysikalischen Vormessungen im Rahmen von komplexen Innendämmprojekten. In Bauphysiktage 2019 in Weimar 25.–26. September. Bauphysik in Forschung und
Praxis; Schriftenreihe der Professur Bauphysik, Bauhaus-
Universtät Weimar, 2019, S. 17–19. [10] Agrimeteo Luxembourg – Wetterstation Merl (2021) https://www.agrimeteo.lu/Internet/AM/NotesLUAM.nsf/ (XP_StationABC)/ff33d23c0a7aa88dc125775100320141?
OpenDocument&TableRow=3.1&Click= [accessed Oct. 25, 2021] [11] Fraunhofer IBP [Hrsg.] (2017) WUFI® Leitfaden zur Auswertung und Beurteilung hygrothermischer Rechenergebnisse. [12] WTA [Hrsg.] (2002) Merkblatt 6-2 Simulation wärme- und feuchtetechnischer Prozesse. Wissenschaftlich-Technische
Arbeitsgemeinschaft für Bauwerkserhaltung und Denkmalpflege (WTA) e. V. [13] Künzel, H. M.; Holm, A.; Krus, M. (2008) Figure: Moisture storage function by WUFI. https://www.wufi-wiki.com/ mediawiki/images/e/e7/E_fspfkt_k.gif [accessed Nov. 02, 2021] [14] WTA [Hrsg.] (2016) Merkblatt 6-4 Innendämmung nach
WTA I: Planungsleitfaden. Wissenschaftlich-Technische
Arbeitsgemeinschaft für Bauwerkserhaltung und Denkmalpflege (WTA) e. V.
Authors
Sebastian Latz (corresponding author) sebastian.latz@uni.lu Department of Engineering Faculty of Science, Technology and Medicine University of Luxembourg 6, Rue Richard Coudenhove-Kalergi 1359 Luxembourg
Prof. Dr.-Ing. Frank Scholzen frank.scholzen@uni.lu Department of Engineering Faculty of Science, Technology and Medicine University of Luxembourg 6, Rue Richard Coudenhove-Kalergi 1359 Luxembourg
Prof. Dr.-Ing. Andreas Thewes a.thewes@hochschule-trier.de Fachbereich BLV Hochschule Trier Campus Schneidershof 54293 Trier Prof. Dr.-Ing. Stefan Maas stefan.maas@uni.lu Department of Engineering Faculty of Science, Technology and Medicine University of Luxembourg 6, Rue Richard Coudenhove-Kalergi 1359 Luxembourg
How to Cite this Paper
Latz, S.; Scholzen, F.; Thewes, A.; Maas, S. (2022) Comparison of high-performance and conventional internal insulation materials based on hygrothermal analysis using in situ measurements and simulation. Bauphysik 44, H. 1, S. 9–20. https://doi.org/10.1002/bapi.202100039
AKTUELL
vdd vereint nun Bitumenbahnen- und Kunststoffbahnenhersteller
Seit dem 01. Januar 2022 erweiterte der vdd Bitumen-Dach- und Dichtungsbahnen e. V. seinen Mitgliederkreis und öffnete sich für das Abdichtungsmaterial Kunststoffbahnen. Damit vereint der Verband künftig die zwei wichtigsten Abdichtungsmaterialien für Flachdächer und Bauwerksabdichtung unter einem Dach. Im Zuge dieser grundlegenden Neuausrichtung des Verbandes wurde die Umfirmierung zu vdd Industrieverband Dach- und Dichtungsbahnen e. V. beschlossen. Ein wichtiger Grund für die Erweiterung ist die Marktentwicklung der vergangenen Jahre. Doch vor allem der Wunsch der Mitglieder nach einem zentralen Ansprechpartner für sämtliche bahnenförmigen Abdichtungsstoffe war ausschlaggebend für die Entscheidung, den Verband für beide Werkstoffgruppen zu öffnen. Bedingt durch die Auflösung des Industrieverbandes der Produzenten von Kunststoff-Dach- und Dichtungsbahnen DUD e. V. zum 01.01.2022 haben bereits mehrere Kunststoffbahnen-Hersteller ihre Mitgliedschaft im vdd unterzeichnet.
Mit der Erweiterung und der Repräsentanz von Bitumen- und Kunststoffbahnen vergrößert sich der Aufgabenbereich des vdd auf nationaler, aber auch internationaler Ebene. Der Ausbau des Verbandes befähigt den vdd – unabhängig vom Werkstoff – als der erste Ansprechpartner für Fragen und Anliegen rund um die führenden Materialien der Flachdach- und Bauwerksabdichtung zu agieren. Dadurch erhalten Architekten, Planer und Verarbeiter zukünftig alle Informationen zu Abdichtungsthemen aus einer Hand. Auch in der Normungs- und Lobbyarbeit wird der Verband für beide Werkstoffe sprechen. Gleichzeitig verleiht diese Entwicklung dem vdd mehr Gewicht im Austausch mit anderen Verbänden der Baubranche. Die nun durch den vdd vertretenen Hersteller stehen für 95% der Produkte, die in den Bereich Flachdach- und Bauwerksabdichtung in Deutschland geliefert werden. Planer, Architekten, Dachdecker, Bauherren und Interessierte finden alle Informationen unter.
Weitere Informationen: www.derdichtebau.de