The State Apartments
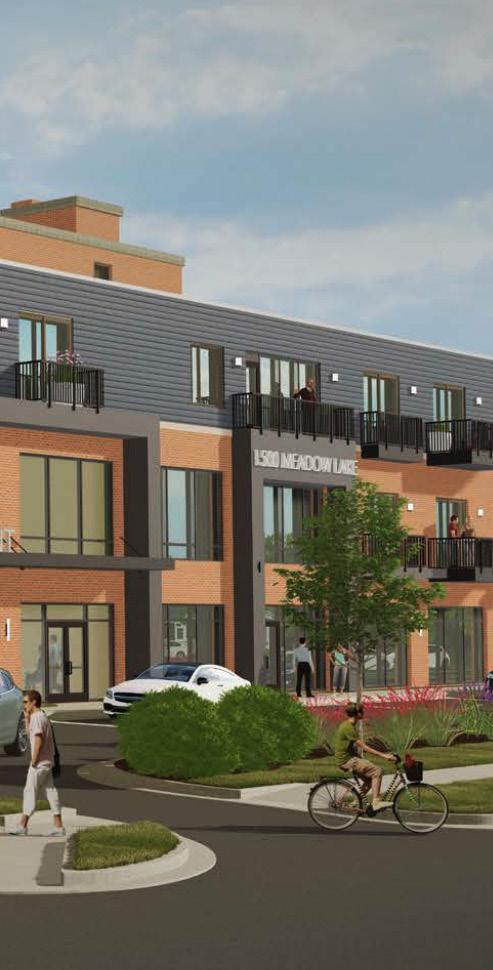
1500 MEADOW LAKE


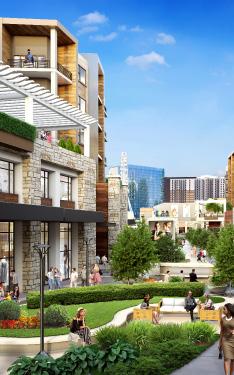

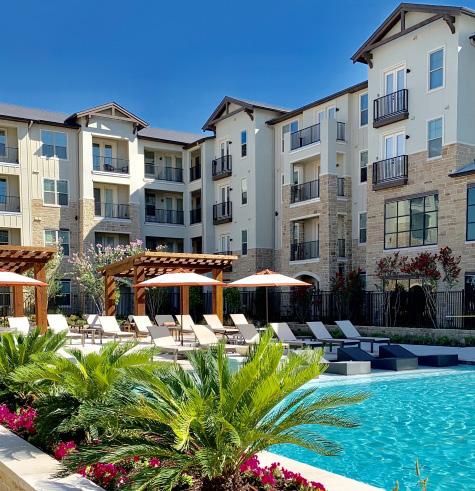


Table of Contents
Section 1
BIG PICTURE 7
PROJECT SNAPSHOT
Section 2
DESIGNING FOR THE MARKET 11
LOCATION
DESIGN CONCEPT AMENITIES / FINISHES RENTER PROFILE
Section 3
PROJECT ECONOMIC ANALYSIS 31
DEVELOPMENT BUDGET
COSTS & ECONOMIC RETURNS
SALE EOY 4 AT STABILIZATION
CASH FLOW PROJECTIONS YRS 1-10
Section 4
MARKET DEMAND FACTORS 41
KANSAS CITY MARKET

Section 1

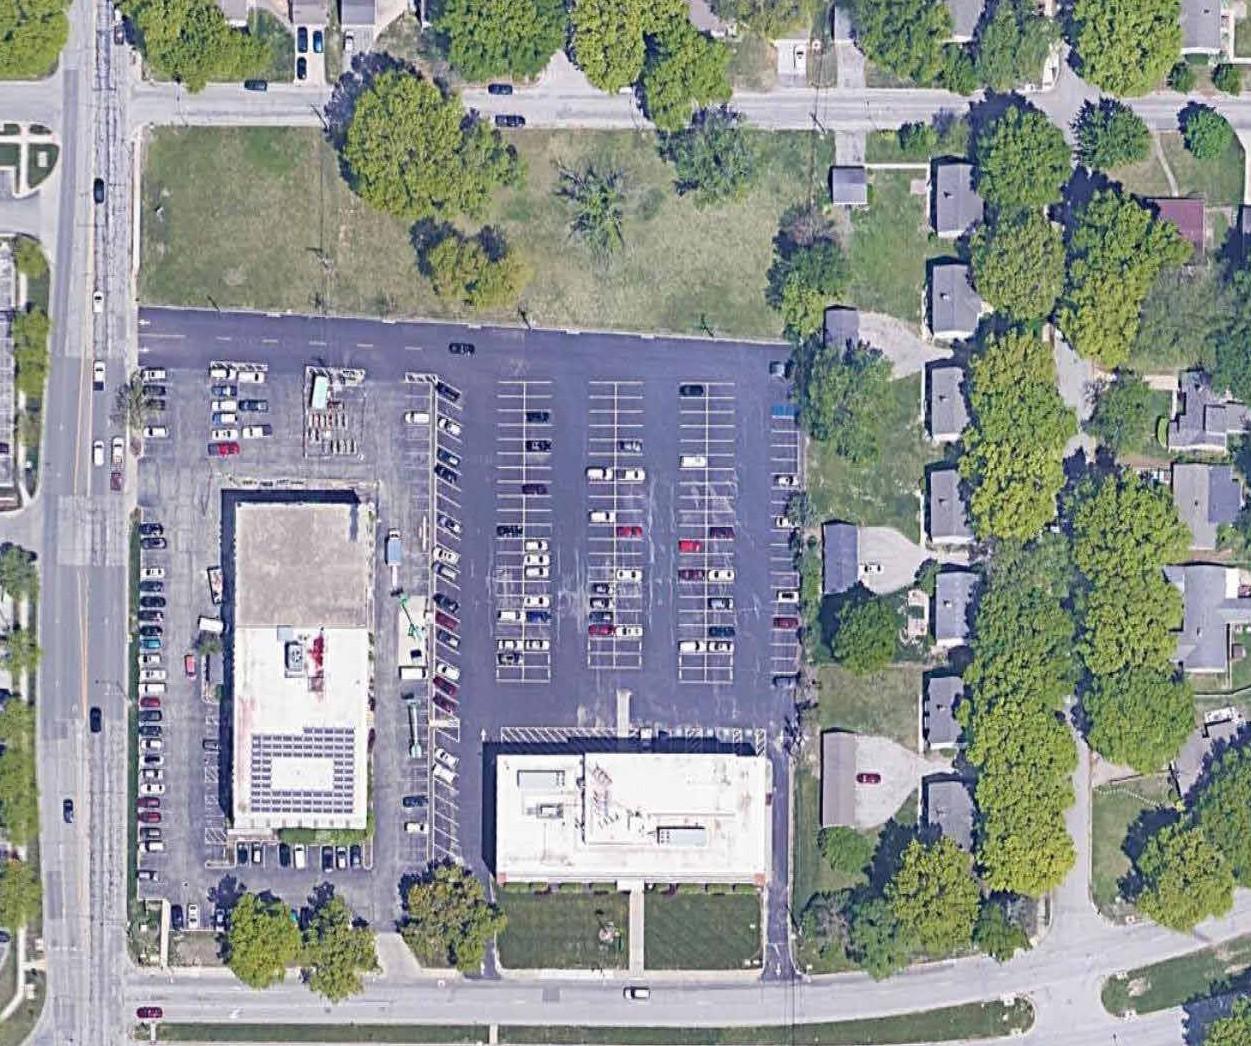

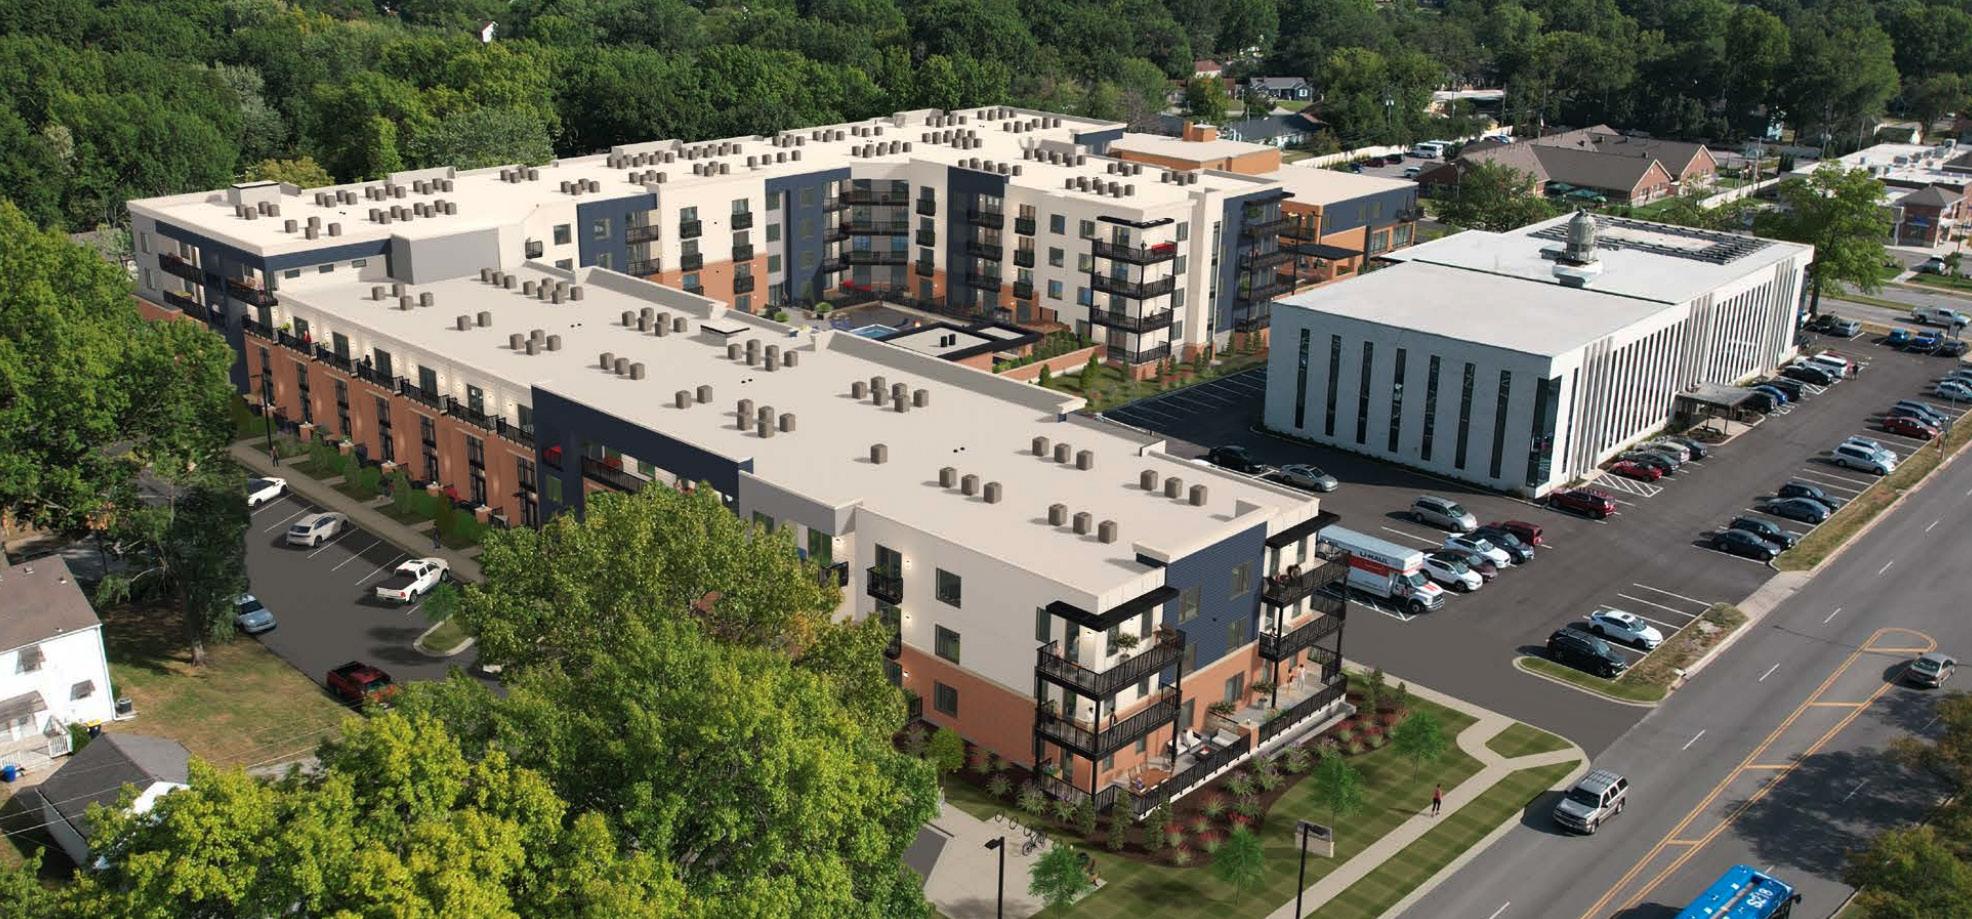
EXISTING ZONING: BP3-2 SITE ACREAGE: 3.63 AC
PROPOSED MXD BUILDING, 1 STORY PODIUM W/ 4 LEVELS OF RESIDENTIAL ABOVE.
EXISTING OFFICE BUILDING TO REMAIN AND BE RE-UTILIZED FOR PARTIAL GROUND FLOOR COMMERCIAL AND APARTMENT AMENITIES.
APARTMENT UNITS:
213 UNITS TOTAL MICRO-STUDIOS 38 UNITS
STUDIOS: 52 UNITS
ONE BEDS: 80 UNITS
ONE BED DENS: 6 UNITS
TWO BEDS: 37 UNITS
PARKING:
6 SURFACE STALLS
27 ANGLED STALLS
237 COVERED STALLS
270 TOTAL STALLS PROVIDED
213 DEDICATED APARTMENT STALLS CROSS PARKING AVAILABLE FOR COMMERCIAL USE.
NEED: There is high demand from a broad demographic to live in “fringe” locations around the central core in Kansas City, Mo. These site an infill site currently developed for office or retail and are functionally obsolete. EPC has a keen intuition for finding sites that meet the needs / demands of the modern renter.
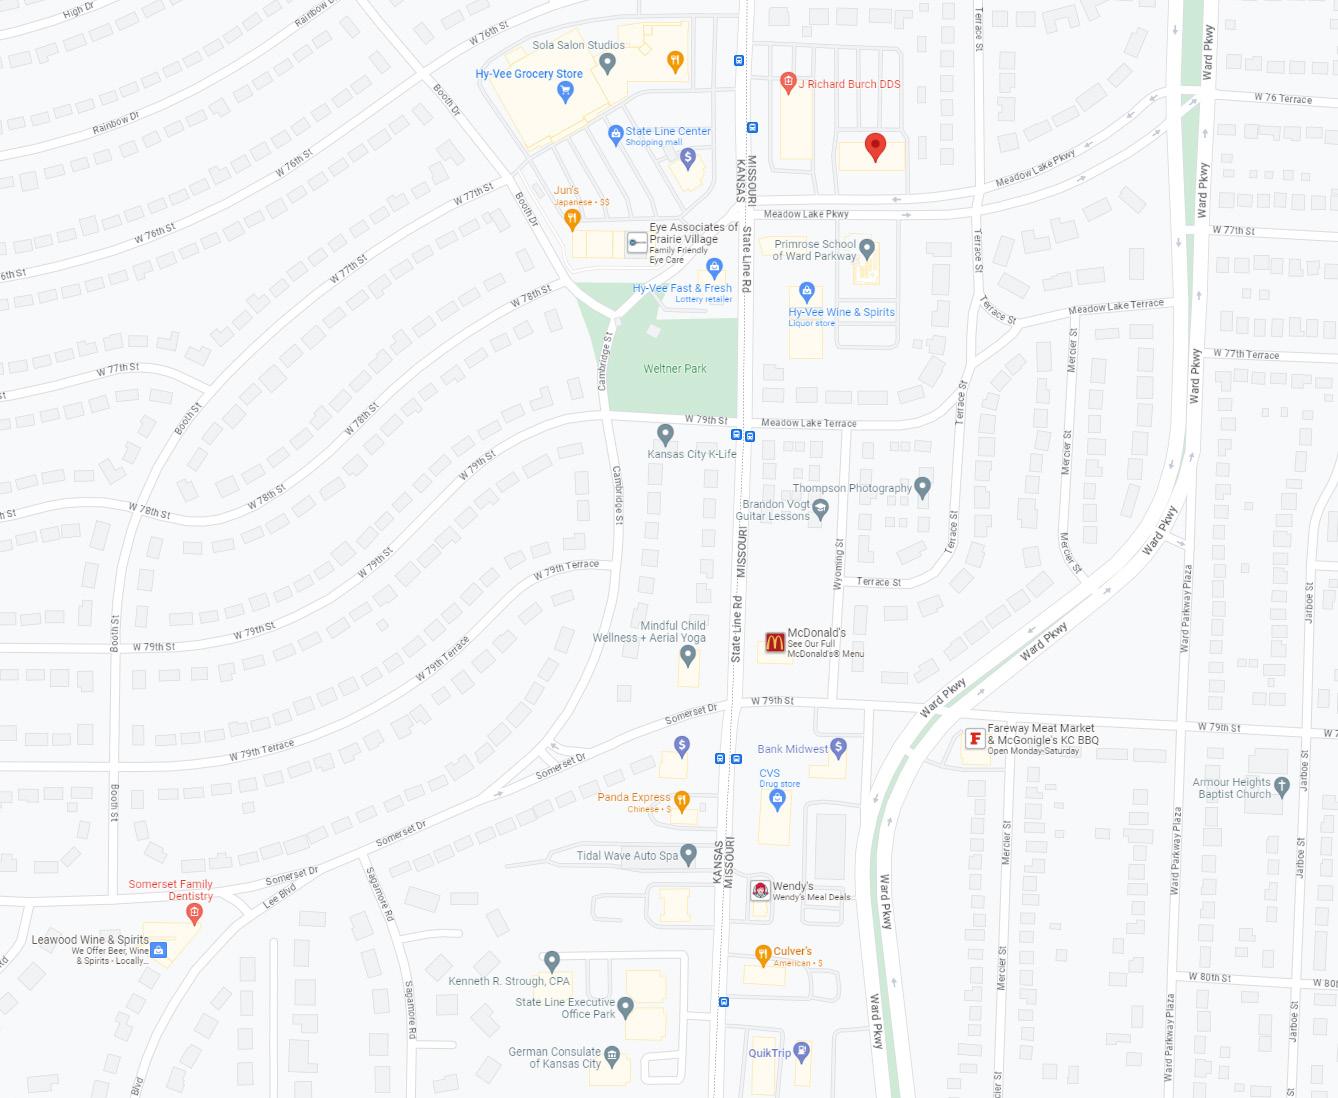
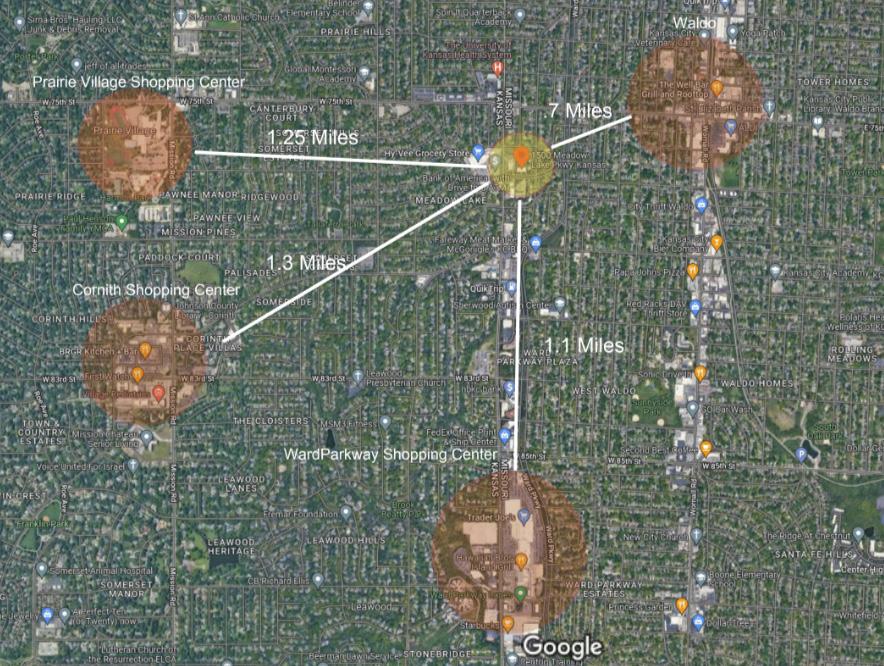
LOCATION: 1500 Meadow Lake is unique in that it is a small commercial node in the middle of a residential neighborhood. Located across the street from a new Hyvee Grocery, several local shops, gasoline, liquor and food options, it offers the neighborhood and it needs for basic service. Additional fast food, a CVS, and a car wash is just two blocks away. It is central to and approximately 1 mile from several popular retail and restaurant centers.
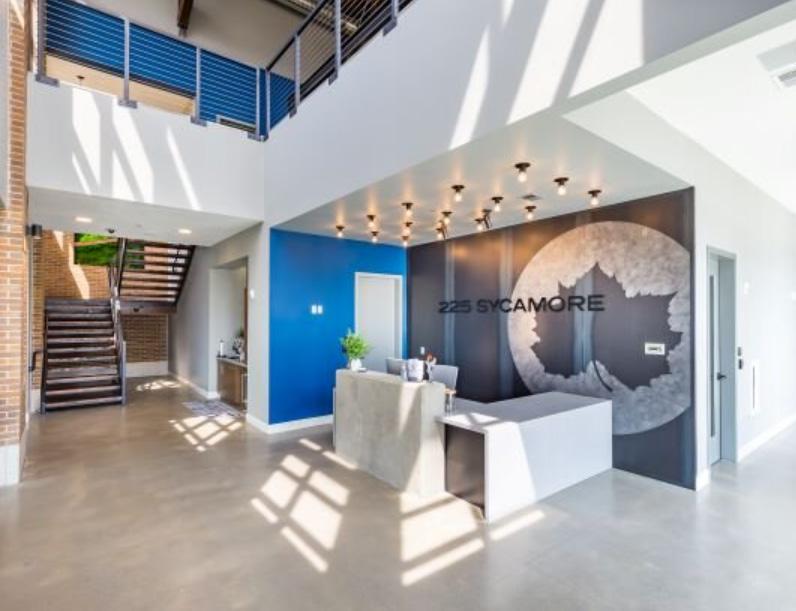
ARCHITECTURE: The building exterior will offer the neighborhood a refresh of the existing office building and incorporate modern residential and industrial design. Two-story walk-up townhomes will be incorporated into the north side on 76th Street. The building colors intend to add some “pop” to the area.
TARGET USER: Our market area extends to the entire metro but is focused within 5 miles of the site. The target renter is looking to move in the area between and Plaza on the north and I-435 on the south. Many renters are looking to stay close the Kansas State Line but stay in Missouri. This area on both the Missouri and Kansas side is one of the hardest to find a home to buy in the KC Metro area. The target renter frequents the Plaza, Waldo, Ward Parkway Shopping Center, Corinth Shopping Center and Prairie Village Shopping Center. In addition, many friends and family reside in the area. Many large employers also office along the Ward Parkway and State Line corridors.

Offsite / Adjacent Amenities
• Hyvee Grocery, Trader Joe’s
• Local and National Restaurants
• Locally owned small businesses
Design
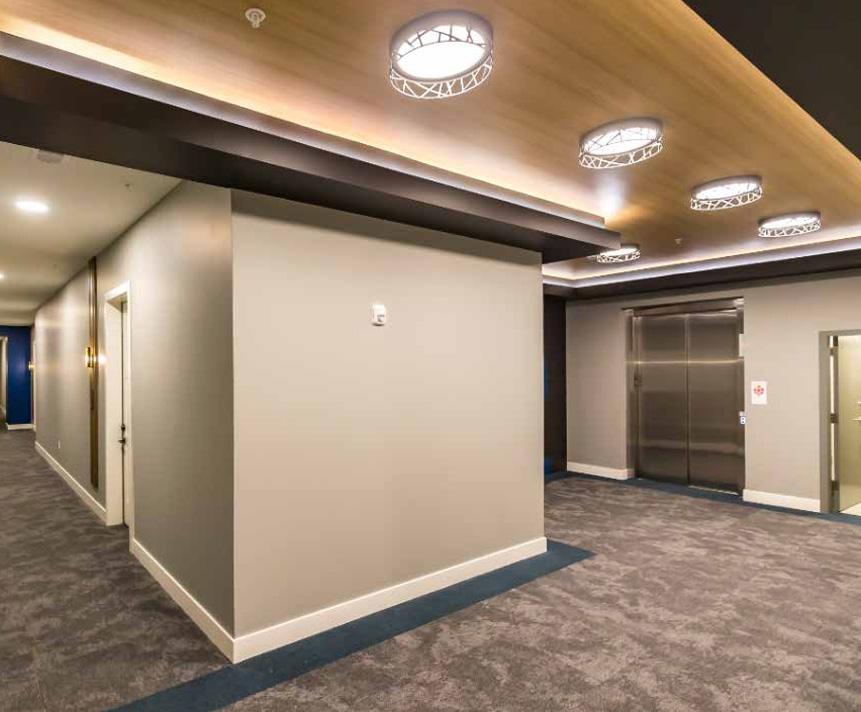
• Four story elevator service
• Controlled access facility
• Floor plans to fit demographic needs
• Top of the market finishes and materials
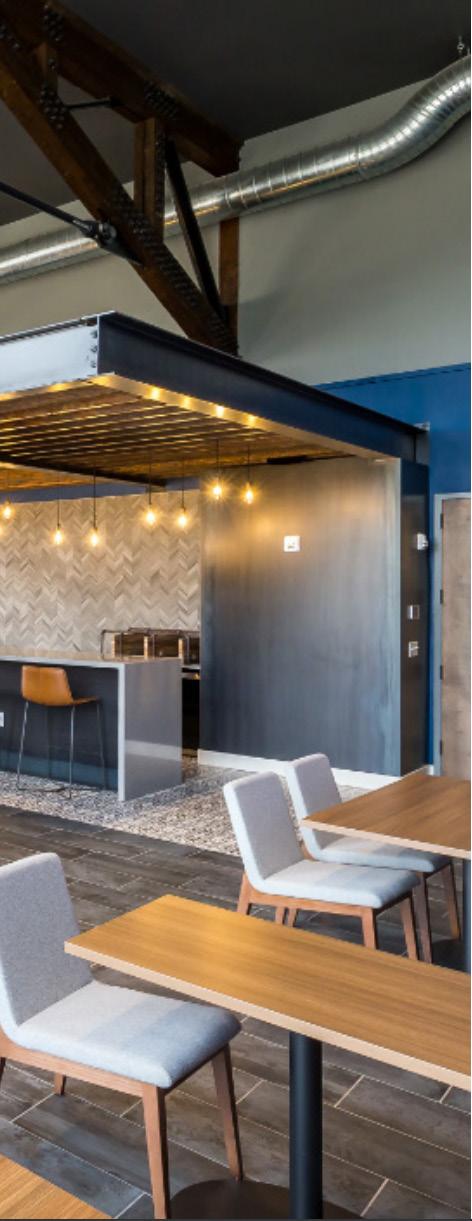
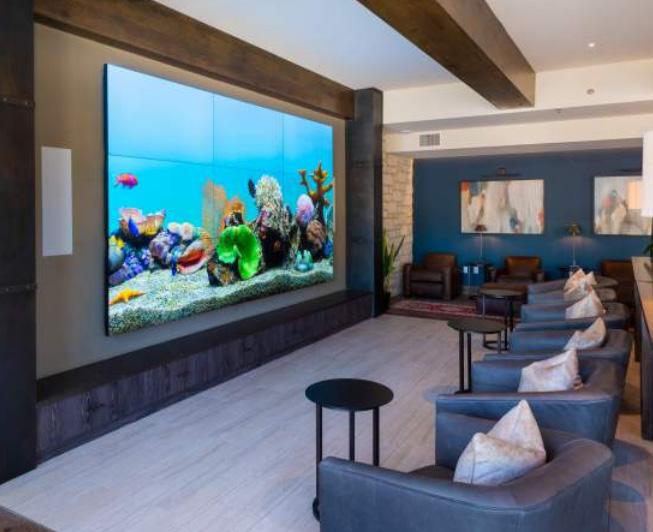
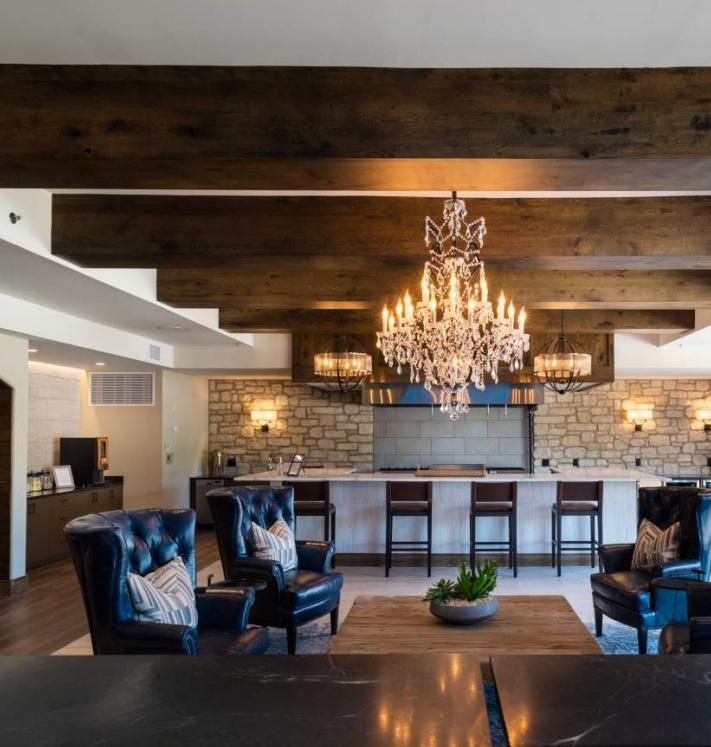
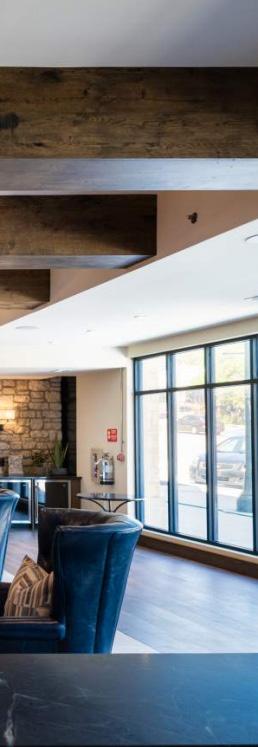
Resident Clubhouse
• Clubroom for resident events
• Bourbon lounge
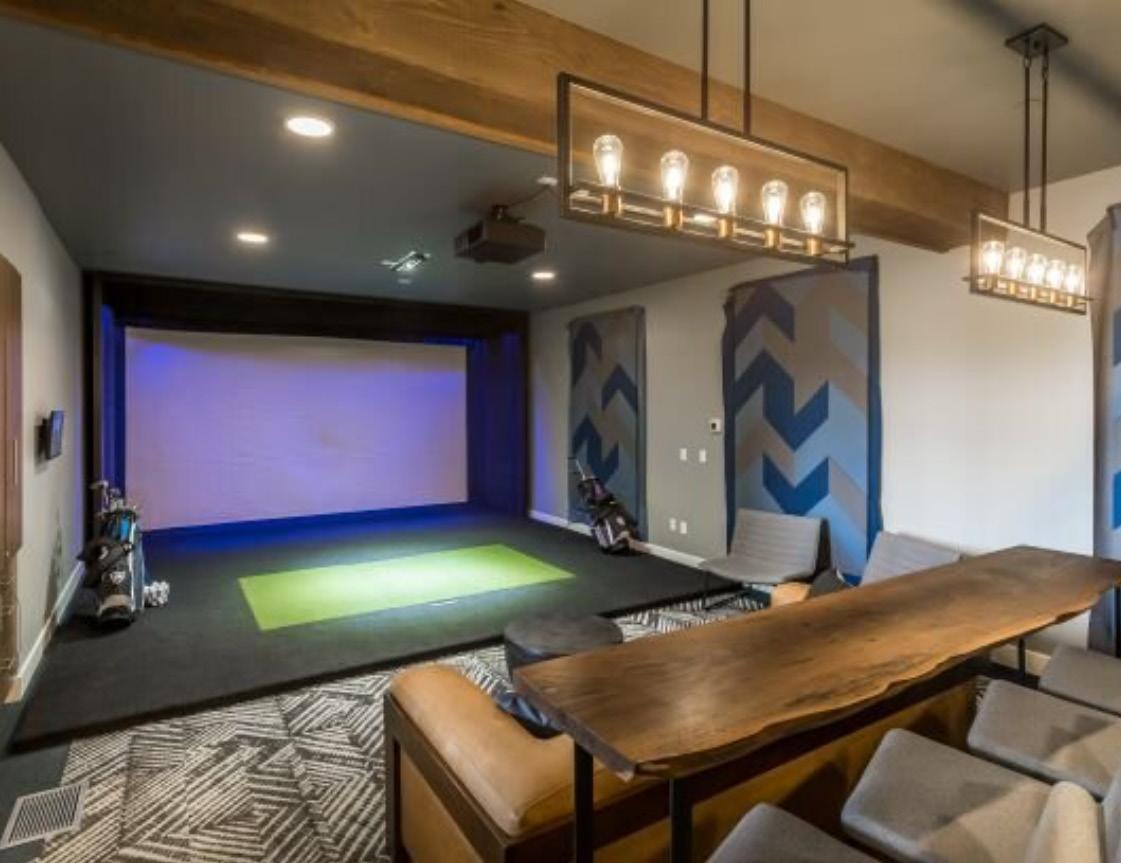
• Game room with golf simulator
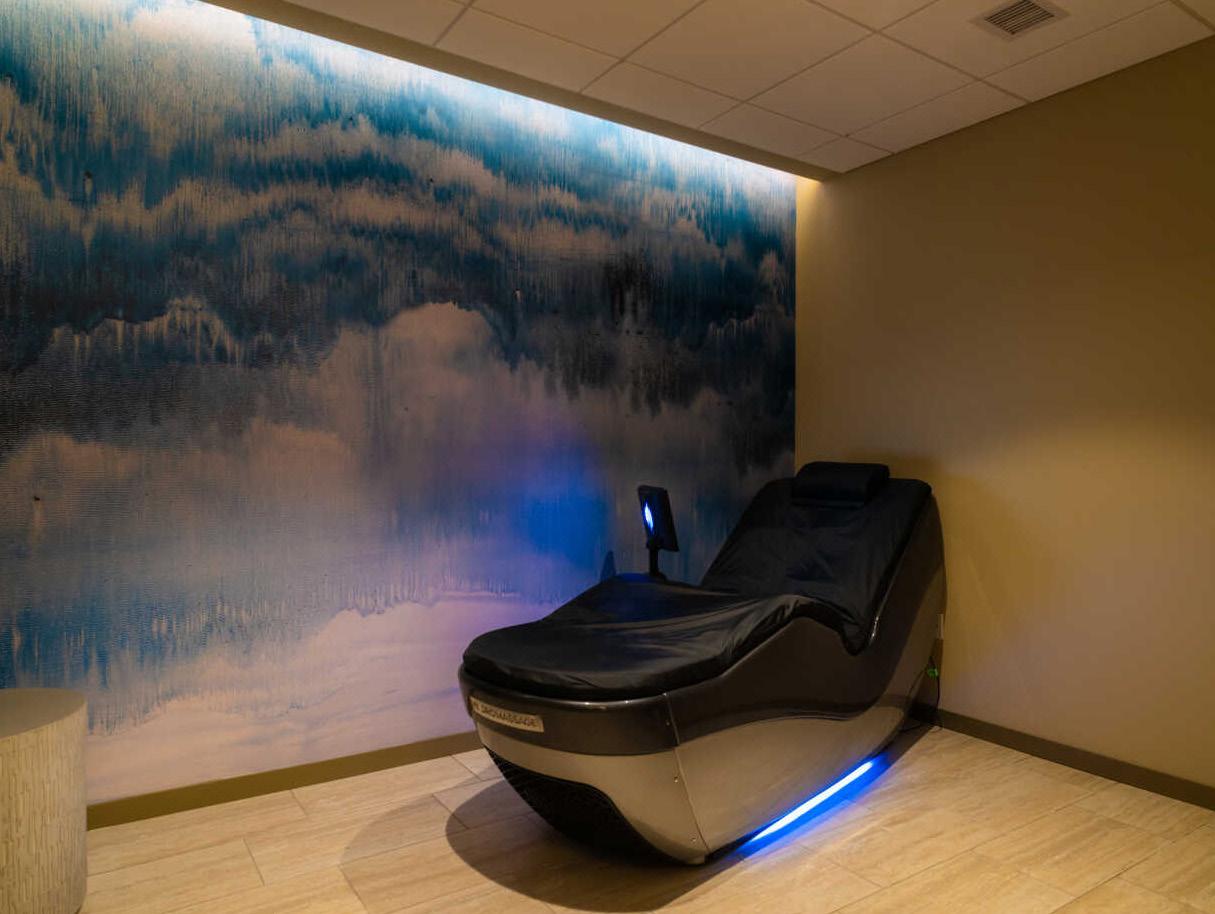
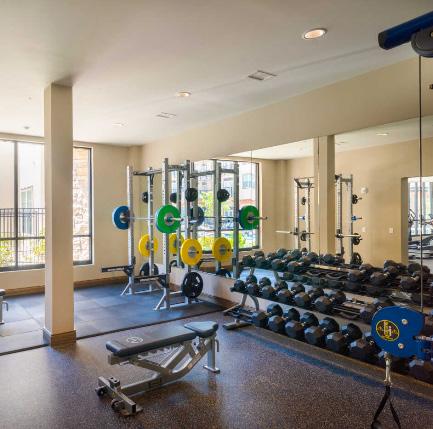
• 24 hour fitness center including yoga and crossfit
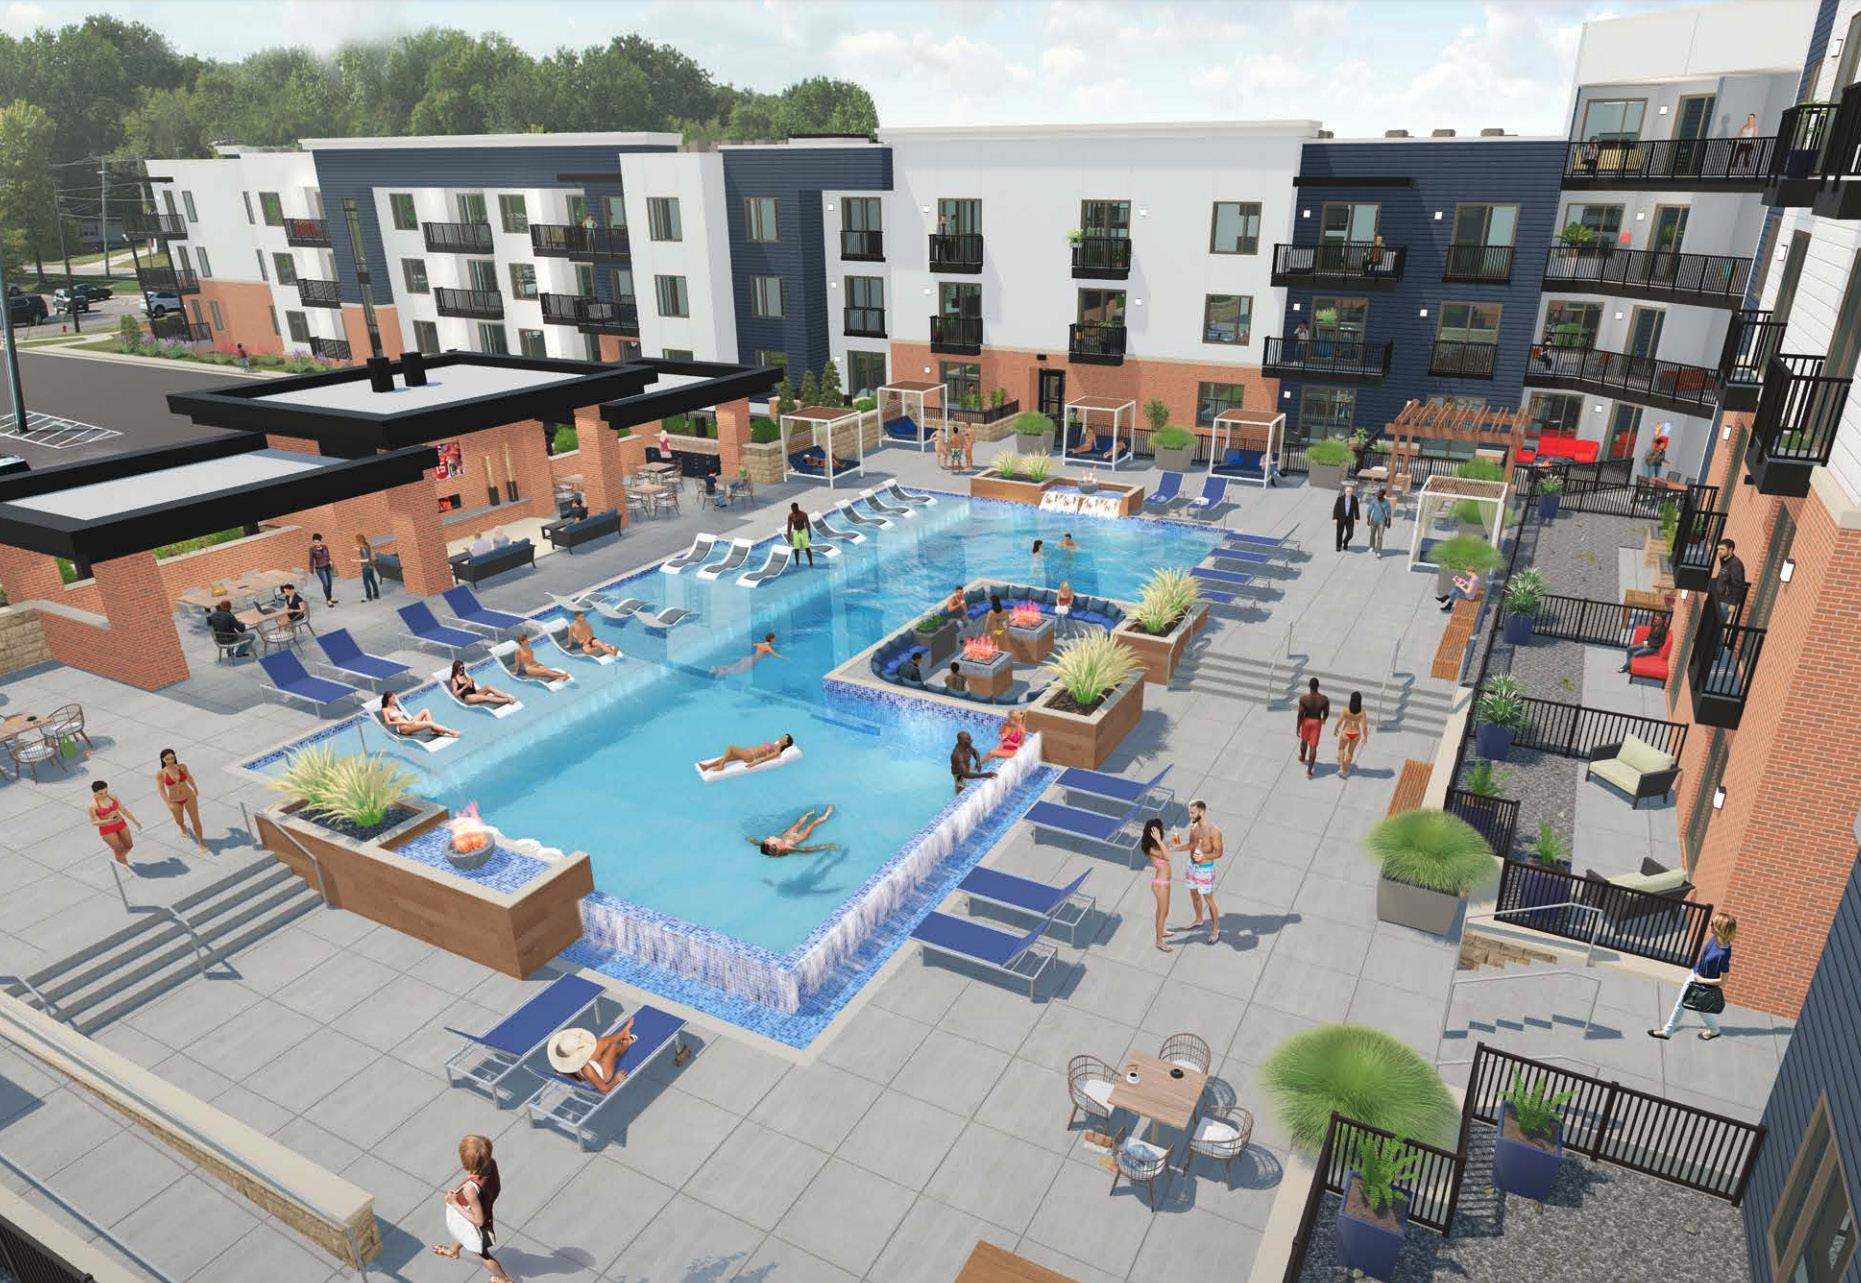
Courtyard
• Resort lagoon style pool with lounge chair wading area
• Pool cabanas
• Gourmet BBQ grill with outdoor seating
• Fire pit with flat screen TV
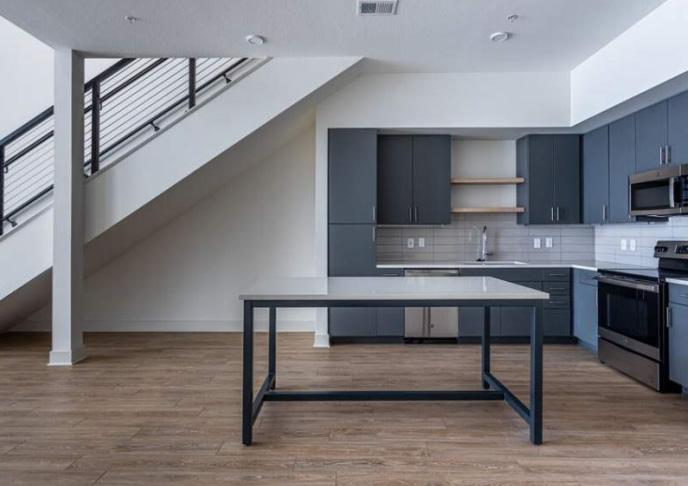
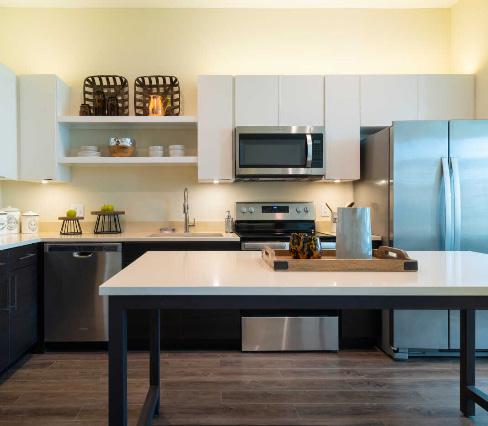
• v with quartz countertops
• Kitchen islands avaliable
• Gooseneck pull down faucet
• Stainless steel appliances
• Separate laundry rooms with full size washer and dryer
• Two tone paint with accent wall in master and living areas
• Multiple flat screen TV hookup locations
• Large balconies
• Simulated wood plank floors
• Carpeted bedrooms
• Tiled bathroom and stand up showers
Concierge Services
• Trash valet
• Dogwash
• Dry cleaning valet

Our team has a high standard for our facility’s interiors. We want to deliver the best to our tenants and have a record of top quality units and common areas.
FLOORING: Each project varies slightly as new products hit the market. We make our selections with durability and appearance top of mind. Primarily, the flooring has been wood-like vinyl plank flooring in the kitchen and family room, carpet in the bedrooms, and tile in the restrooms and laundry room
COUNTERTOPS: As a high quality developer we only use granite or quartz. Primarily, we are currently sourcing quartz, but this is constantly threatened by tariffs. We have partners we work closely with to fabricate counter tops overseas in controlled facilities where we can change 1% of the aggregate mix to avoid certain tariffs. Timing of purchase will guide this selection
HARDWARE, SINKS, ETC: Similar to above, we have proprietary sources and also work closely with sub trades to get the most current looks and best value. Since these are showpieces of a unit, we are always top of the market and due to bulk purchasing for all of our properties we get preferred pricing.
Our interior designer will collaborate with Klover to ensure the best applications are selected at the right price point for our target demographic. Below and on the following page are examples of recent projects that are representative of typical unit and common area finishes.


Emerald City’s denizens live in lower-density neighborhoods of urbanareas throughout the country. Young and mobile, they are more likely to rent. Half have a college degree and a professional occupation. Incomes close to the US median come primarily from wages, investments, and self-employment. This group is highly connected, using the Internet for entertainment and making environmentally friendly purchases. Long hours on the Internet are balanced with time at the gym. Many embrace the “foodie” culture and enjoy cooking adventurous meals using local and organic foods. Music and art are major sources of enjoyment. They travel frequently, both abroad and domestically.
OUR NEIGHBORHOOD
• There are mostly older, established neigh-borhoods with homes built before 1960; around 30% built before 1940.
• Just over half of all homes are renter occupied.
• Single-person and nonfamily types make up over half of all households.
• Median home value and average rent are slightly above the US levels; around half of owned homes are worth $150,000–$300,000
• Consumers research products carefully before making purchases
• They buy natural, green, and environmentally-friendly products
• Very concious of nutrition, regularly buying and eating organic foods from Trader Joe’s and Whole Foods
• Cell phones and text messagzing are a huge part of everyday life
• They place importance on learning new things to keep life fresh and variable
• They are interested in the fine arts and especially enjoy listening to music


Section 3
Land Costs
Closing Costs
Preliminary Assessments
Site Work
Construction Costs
Hard Cost Contingency (3%)
$5,360,000
$30,000
$0
Total Acquisition Costs: $5,390,000
$2,688,088
$42,011,445
$1,260,343
Total Hard Costs: $44,346,359
Architectural / Engineering / Design
FFE, Gov Fees, Market Study, Startup
Legal
Marketing
Taxes
Insurance
Construction Financing Costs
Soft Cost Contingency (3%)
Development & Construction Management
Commercial TI Allowance
TOTAL PROJECT COSTS
$1,555,686
$1,565,830
$200,000
$81,000
$200,000
$600,000
$4,940,513
$308,960
$2,204,600
$485,756
$62,988,584
Typical First to Market EPC Profile or Leasehold Interest
Yield on Cost (NOI/Cost) 6.5% - 7.0%
Typical Exit Cap 5% - 6%
5 YR Asset IRR Target 20%
10 YR Asset IRR Target 15%
5 YR LP Equity Multiple 2x
10 YR LP Equity Multiple 3x
EPC has adopted a set of metrics specific to the risk profile of the areas in which we develop. Below is a summary of the drivers which allow us and our capital partners to move forward at the outlined metrics for our projects:
1. Market driven lower cap rates at exit
2. Increased interest from capital sources (lower cost of capital due to reduced risk profile)
3. Directly in the growth path
4. Demographic Profile
5. Barrier to entry
6. Unique amenity profile in the community
Ownership Entity: Meadow Lake Apartments, LLC
Project Cost: $ 63,000,000
Land Aquired: September 2022
Distributions from Sale: 70% Common Investor / 30% Developer after 10% hurdle rate
Holding Period: All EPC projects are underwritten to maximize profits to our investors. At the time of stablization, the project will be valued for immediate sale compared to refinancing and holding for up to 10 years. EPC will crystallize its promote interest when the property is refinanced.


Our Team is ready to deliver on our vision for The State Apartments to "Create the Next Experience" in the Kansas City market. Our expertise will make this development a smooth and straight forward process.
In the past nine years EPC has successfully developed, financed, constructed and leased close to 4,000 multifamily units at a cost of approximately $1 Billion. EPC is in the development phase of more than $300 million in proposed developments. These deals are controlled by EPC, or are approaching the construction phase.
PRODUCT TYPES
APARTMENTS
OFFICE RETAIL
MIXED USE MEDICAL SENIOR/ ADULT
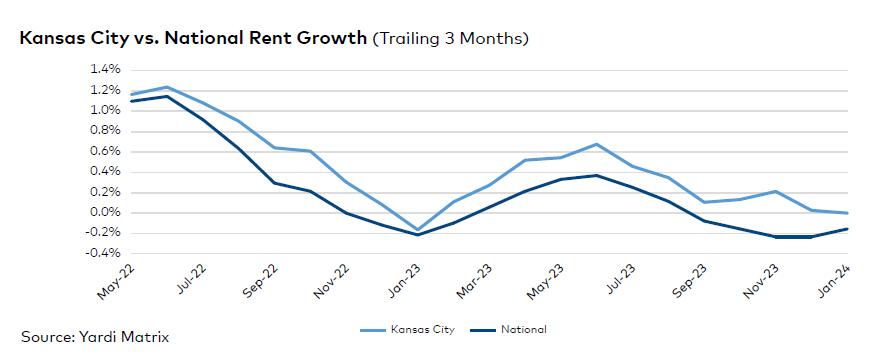
Taking all economic factors into account, Kansas City multifamily fared well in 2023. The metro recorded moderate rent growth but managed to outperform most of the country last year. On a trailing three-month basis through January, rents were flat, at $1,253, while the U.S. rate was down 0.2%. The metro’s average occupancy in stabilized assets, however, fell 80 basis points yearover-year, to 94.5%, as of January. Both working-class Renter-byNecessity and Lifestyle rates declined.
Kansas City employment expanded 2.4%, or 14,400 net jobs, in the 12 months ending in November, 20 basis points above the U.S. rate. The government sector led growth, with 10,400 positions added, for a 6.3% increase. The area’s unemployment rate stood at 2.5% as of December, 120 basis points lower than the U.S. average, according to preliminary data from the Bureau of Labor Statistics. A longer-term boost could come from the development of a $2 billion new ballpark, announced by the Kansas City Royals.
Developers had 8,236 units underway as of January across metro Kansas City, with an additional 53,000 units in the planning and permitting stages. The number of construction starts doubled in 2023, with 5,119 units breaking ground, up from 2,505 in 2022. The sales slowdown continued, with multifamily deals totaling just $414 million in 2023.
➤ Kansas City rents plateaued on a trailing three- month (T3) basis through January, at $1,253, while the U.S. rate was down 0.2% during the same time frame. Year-over-year, rates were up 3.4% as of January, placing the metro fourth among major U.S. metros. Meanwhile, the na- tional figure improved just 0.5%, to $1,710.
➤ The average rent in the working-class Renter- by-Necessity segment recorded a small uptick on a T3 basis, up 0.1% in January, to $1,047. Meanwhile, the Lifestyle figure plateaued, at $1,509. RBN asking rents have been on a steady rise over the 12 months ending in Janu- ary. Meanwhile, Lifestyle numbers were in neg- ative territory in January (-0.5%) and February (-0.2%) of last year, on the tail end of a harsher seasonal slowdown.
➤ The metro’s average overall occupancy rate in stabilized properties stood at 94.5% as of Janu- ary, an 80-basis-point decrease in 12 months.
The Lifestyle rate recorded a 50-basis-point decline, to 94.7%. Meanwhile, occupancy in the RBN segment fell to 94.2%, down 100 basis points in the 12 months ending in January.
➤ Growth was clear across the map as of Janu- ary. Of the 42 submarkets tracked by Yardi Matrix, all but one recorded year-over-year rent improvements. The exception was Blue Springs, where the average was down 0.4%. Some of the metro’s most expensive submarkets saw consis- tent yearly gains, including Downtown Kansas City (2.9% to $1,596), Lenexa (5.2% to $1,469) and large swaths of Overland Park.
By Anca Gagiuc
Before the health crisis, metros located farther from gateway cities offered more attainable rents. Then the work-from-home trend morphed into a new way of living. Eliminating daily commutes enabled people to redesign their lives and suddenly, housing affordability improved, as long as relocation was considered.
Kansas City was the most affordable major multifamily rental market, with the average RBN rent at $1,031 as of March, up 1.5% on a T3 basis and 8.0% above the rate posted in March last year. Here, RBN rent payment accounted for 23% of the area median income, the lowest rate in this group, on par with Cincinnati and Pittsburgh. In 2023 through April, deliveries represented 0.6% of total stock, on par with Cincinnati. Last year, the metro’s stock expanded by 0.9%.
