
EPC Real Estate GroupAugust 16, 2022
Meadow1500 Lake
VISION
CREATING A FOR 1500 MEADOW LAKE


RENTERAMENITIESDESIGNLOCATIONCONCEPT/FINISHESPROFILE
Table of Contents
DEVELOPMENT BUDGET COSTS & ECONOMIC RETURNS SALE EOY 4 AT STABILIZATION DISTRIBUTION PROJECTIONS YEARS 1-4
Section 4 APPENDIX 41
Section 1 BIG PICTURE 7
PROJECT SNAPSHOT
Section 2 DESIGNING FOR THE MARKET 11
Section 3
PROJECT ECONOMIC ANALYSIS 31
PROJECT SCHEDULE UNIT MARKETMATRIXRENTAL COMPS MARKET DEMAND FACTORS


Section 1 7
BIG PICTURE

Total GSF 209,545
Surface Stalls 34
Micro 29 13.2%
Average Unit Size 742 SF
1 BR 103 46.85%
Average Rent/SF $2.41
8
Garage Stalls 220
1 BR + DEN 3 1.4%
Total Units 220
Total Costs $52,928,093 $240,582 /Unit
Total NRSF 169,518 81% efficiency
Average Rent/Unit $1,793
2 BR 46 20.9 %
Project Snapshot
Studio 39 17.7%

DESIGNING FOR THE MARKET
Section 2 11
Location ROADLINESTATE MEADOW LAKE PARKWAY 12

13
Pedestrian Context

225
EXISTING OFFICE BUILDING TO REMAIN AND RE-UTILIZED GROUND FLOOR COMMERCIAL
FOR PARTIAL
6PARKING:SURFACE STALLS ANGLED STALLS COVERED STALLS TOTAL STALLS DEDICATED APARTMENT STALLS PARKING AVAILABLE FOR COMMERCIAL
259
1 STORY
W/ 4 LEVELS
PROVIDED 220
APARTMENTAMENITIES.
CROSS
28
Site Plan 8' SIDE SETBACKSETBACK,TOMATCH ABUTTING RES R2.5 SIDE SETBACK:8' R2.5 REAR SETBACK:25' (WE ABUT R2.5 REAR) 50% AMENITIES STRIPGREEN 225 STALLS 6 SURFACE STALLS MEADOW LAKE PARKWAY 76TH STREET STATELINE UTILITY UTILITYACCESS APARTMENTACCESS 50% COMMERCIAL ph: 913.649.8181 • fx: 913.649.1275 • www.klover.net SCALE: 8813 PENROSE LANE, SUITE 400 • LENEXA, KS 66219 75TH AND STATELINE STATELINEAND75TH EPC REALESTATE REALESTATEEPC SITE PLAN SD 1"=60'-0" 22042.001 04.29.22 N 6'-0" STORM EASEMENT 10'-0" UTILITY EASEMENT STORM & POWER TO BE RELOCATED 20' ACCESS/UTILITY EASEMENT 5' EASEMENTUTILITY 35' BUILDING SETBACK 35'-5" 25'-4" 23'-9" 19'-7" 41'-5" 35'-2" 959'-0" 969'-0"(GRADE959'-0" ABOVE) 965'-0"
ONE BED DENS: 3 UNITS
TWO BEDS: 46 UNITS
AND APARTMENT
STUDIOS: 39 UNITS
SITE DATA TABLE
PROPOSED MXD BUILDING, PODIUM OF ABOVE.
USE. 14
UNITS: 220 UNITS MICRO-STUDIOSTOTAL 29 UNITS
RESIDENTIAL
BE
EXISTING ZONING: BP3-2 SITE ACREAGE: 3.63 AC
ONE BEDS: 103 UNITS
15
Design Concept
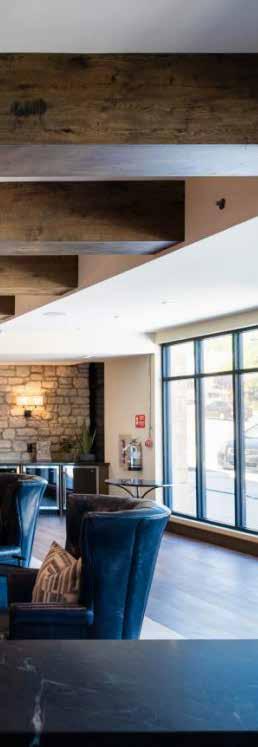
ARCHITECTURE: The building exterior will offer the neighborhood a refresh of the existing office building and incorporate modern residential and industrial design. Two-story walk-up townhomes will be incorporated into the north side on 76th Street. The building colors intend to add some “pop” to the area.
TARGET USER: Our market area extends to the entire metro but is focused within 5 miles of the site. The target renter is looking to move in the area between and Plaza on the north and I-435 on the south. Many renters are looking to stay close the Kansas State Line but stay in Missouri. This area on both the Missouri and Kansas side is one of the hardest to find a home to buy in the KC Metro area. The target renter frequents the Plaza, Waldo, Ward Parkway Shopping Center, Corinth Shopping Center and Prairie Village Shopping Center. In addition, many friends and family reside in the area. Many large employers also office along the Ward Parkway and State Line corridors.
NEED: There is high demand from a broad demographic to live in “fringe” locations around the central core in Kansas City, Mo. These site an infill site currently developed for office or retail and are functionally obsolete. EPC has a keen intuition for finding sites that meet the needs / demands of the modern renter.
LOCATION: 1500 Meadow Lake is unique in that it is a small commercial node in the middle of a residential neighborhood. Located across the street from a new Hyvee Grocery, several local shops, gasoline, liquor and food options, it offers the neighborhood and it needs for basic service. Additional fast food, a CVS, and a car wash is just two blocks away. It is central to and approximately 1 mile from several popular retail and restaurant centers.
16
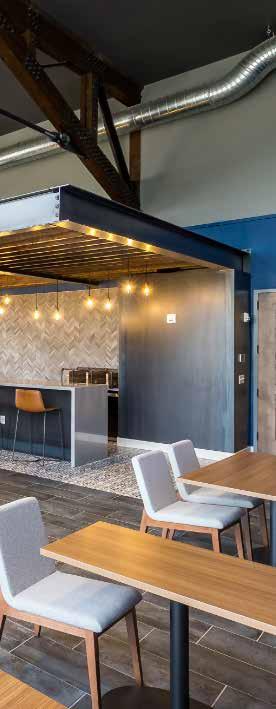
Project Rendering


First and Second Level
18

19
Upper Levels

• Hyvee Grocery, Trader Joe’s
• Multiple flat screen TV hookup locations
• Tiled bathroom and stand up showers
• Game room with golf simulator
Offsite / Adjacent Amenities
• Floor plans to fit demographic needs
Concierge Services
• Stainless steel appliances
• Two tone paint with accent wall in master and living areas
• 24 hour fitness center including yoga and crossfit Courtyard
• Gooseneck pull down faucet
• Top of the market finishes and materials
• Kitchen islands avaliable
• Large balconies
Resident•ClubhouseClubroom for resident events
• Separate laundry rooms with full size washer and dryer
• Fire pit with flat screen TV Floor Plan Features
• Carpeted bedrooms
• Four story elevator service
Amenities
• Dry cleaning valet
• Resort lagoon style pool with lounge chair wading area
• Locally owned small businesses
Design
• Simulated wood plank floors
20
• Pool cabanas
• Local and National Restaurants
• Bourbon lounge
• Dogwash
• Controlled access facility
• Upgraded kitchens with quartz countertops
• Trash valet
• Gourmet BBQ grill with outdoor seating


22 ROADLINESTATE MEADOW LAKE PARKWAY

1500 Meadow Lake 220 Units 23
Courtyard Amenities

FLOORING: Each project varies slightly as new products hit the market. We make our selections with durability and appearance top of mind. Primarily, the flooring has been wood-like vinyl plank flooring in the kitchen and family room, carpet in the bedrooms, and tile in the restrooms and laundry room
24
Our team has a high standard for our facility’s interiors. We want to deliver the best to our tenants and have a record of top quality units and common areas.
Our interior designer will collaborate with Klover to ensure the best applications are selected at the right price point for our target demographic. Below and on the following page are examples of recent projects that are representative of typical unit and common area finishes.
HARDWARE, SINKS, ETC: Similar to above, we have proprietary sources and also work closely with sub trades to get the most current looks and best value. Since these are showpieces of a unit, we are always top of the market and due to bulk purchasing for all of our properties we get preferred pricing.
Finishes
COUNTERTOPS: As a high quality developer we only use granite or quartz. Primarily, we are currently sourcing quartz, but this is constantly threatened by tariffs. We have partners we work closely with to fabricate counter tops overseas in controlled facilities where we can change 1% of the aggregate mix to avoid certain tariffs. Timing of purchase will guide this selection


Renter Profile
• Median home value and average rent are slightly above the US levels; around half of owned homes are worth $150,000–$300,000
Emerald City’s denizens live in lower-density neighborhoods of urbanareas throughout the country. Young and mobile, they are more likely to rent. Half have a college degree and a professional occupation. Incomes close to the US median come primarily from wages, investments, and self-employment. This group is highly connected, using the Internet for entertainment and making environmentally friendly purchases. Long hours on the Internet are balanced with time at the gym. Many embrace the “foodie” culture and enjoy cooking adventurous meals using local and organic foods. Music and art are major sources of enjoyment. They travel frequently, both abroad and domestically.
OUR NEIGHBORHOOD
WHO ARE WE?
26
• There are mostly older, established neigh-borhoods with homes built before 1960; around 30% built before 1940.
• Just over half of all homes are renter occupied.
• Single-person and nonfamily types make up over half of all households.
• Consumers research products carefully before making purchases
• They buy natural, green, and environmentally-friendly products
• Very concious of nutrition, regularly buying and eating organic foods from Trader Joe’s and Whole Foods
SOCIOECONOMIC TRAITS OF TARGET USER
• They are interested in the fine arts and especially enjoy listening to music
• Cell phones and text messaging are a huge part of everyday life
• They place importance on learning new things to keep life fresh and variable
27
Target Market - Brookside / Waldo Prairie Village / Corinth
28


Section 3 31
ANALYSISECONOMICPROJECT

Land Costs
Development Budget
Commercial TI $180,000
Construction Financing Costs $4,282,435
FFE, Gov Fees, Market Study, Startup $1,636,200
Total Acquisition Costs: $5,390,000
TOTAL PROJECT COSTS
Development OHP $1,005,634
Soft Cost Contingency $243,663
Construction Management OHP $1,005,634 $52,928,093
3229
ACQUISITION COSTS
Site Work $990,614
Construction Costs $36,306,750
Preliminary Assessments $0
Hard Cost Contingency $907,669
Total Hard Costs: $38,205,033
$5,360,000
HARD COSTS
Architectural / Engineering / Design $1,343,200
Closing Costs $30,000
SOFT COSTS
Legal $100,000
Marketing $128,000
Taxes $250,000
Insurance $400,000
$5,360,000 Land Costs $24,364 per unit
33
$80,196,414 10 YR Hold Value 4,75% cap rate exit 10.26%
$52,963,352 Total Costs $240,743 per unit
Costs & Economic Returns
$66,156,223 Asset Value EOY 4 projected at stabilization
22.1% Asset Level IXRR EOY 4 sale at stabilization
1.78 DSCR @ Stabilization Assumes 70% Debt 14.89% 10 YR XIRR 6.11% Yield on Cost 3.00x 10 Yr. Equity Multiple
Stabilized Yield on Cash Years 5-10
19.7% LP IXRR EOY 4 return to cash investors
Typical Exit Cap 4% - 5% Typical Exit Cap 3.5% - 4.25%
5 YR LP Equity Multiple 1.75x
Yield on Cost (NOI/Cost) 6% - 7% Yield on Cost (NOI/Cost) 5.50% - 6%
34
10 YR Asset IRR Target 15%
3. Directly in the growth path
10 YR Asset IRR Target 13%
1. Market driven lower cap rates at exit
2. Increased interest from capital sources (lower cost of capital due to reduced risk profile)
EPC FINANCIAL UNDERWRITING METRICS - GO OR NO-GO DECISION
Typical First to Market EPC Profile or Leasehold Interest
5 YR LP Equity Multiple 2x
5 YR Asset IRR Target 20%
Allowable Profile for unique growth markets (Salt Lake City, Select sites in Dallas, Austin)
5 YR Asset IRR Target 15%
6. Unique amenity profile in the community
Underwriting Approach
10 YR LP Equity Multiple 2.25x
4. Demographic Profile
EPC has adopted a set of metrics specific to the risk profile of the areas in which we develop. Below is a summary of the drivers which allow us and our capital partners to move forward at the outlined metrics for our projects:
5. Barrier to entry
10 YR LP Equity Multiple 3x
Project Cost: $52,932,610
Total $15,879,782
Debt 70% (EPC Guaranty) $37,052,828
Preferred Return: Common Investor 10% Land Contribution 12% (convertible to common equity w/ Developer Promote Share)
Distributions from Sale: 70% Common Investor / 30% Developer after 10% hurdle rate
Holding Period: All EPC projects are underwritten to maximize profits to our investors. At the time of stablization the project will be valued for immediate sale compared to refinancing and holding for up to 10 years.
Ownership Entity: Meadow Lake Apartments, LLC
If it is determined it is in the best interest of the investors to hold the project it is likely some investors could be cashed out.
EPC will crystallize its promote interest when the property is refinanced.
35
Ownership Structure
Equity 30% Cash Investor (Common Equity) $12,931,804 81% Developer (EPC) $ 1,587,978 10% Land Contribution (Preferred Equity) $ 1,360,000 9% Cash or Contributed Asset
EPC is in the development phase of more than $300 million in proposed developments. These deals are controlled by EPC, or are actively approaching finalization.
Why EPC as Partners?

In the past nine years EPC has successfully developed, financed, constructed and leased close to 4,000 multifamily units at a cost of approximately $1 Billion.
PRODUCT SENIOR/MEDICALMIXEDOFFICEAPARTMENTSTYPESRETAILUSEADULT KANSAS CITY 1033 APARTMENTS OWNED & MANAGED BY EPC OTHER AREAS 635 APARTMENTS OWNED & MANAGED BY EPC 36
Our Team is ready to deliver on 1500 Meadow Lake a vision of the highest quality residential experience in the Kansas City market. Our expertise will make this development a smooth and straight forward process.

preferred equity payoff cash from project 0 0 0 30,892,737
common investor level irr 19.7%
common equity payoff beginning investment balance0 14,518,42815,970,27117,567,29819,324,028
net operating income 0 0 (390,337)2,196,6513,253,917
PROJECT BUDGET AND FINANCING
+loan payoff 0 0 0 (37,049,665) total free cash flow out of project 0 0 0 30,892,737
+total invested equity (15,878,428)0 0 0 0 net cash flow to equity (15,878,428)0 0 0 30,892,737
+accrued interest 0 1,451,8431,597,0271,756,7301,932,403
+estimated sale proceeds 0 0 0 67,474,661
PROJECT FORECAST year 0year 1year 2year 3year 4year 5
37
+additional investment 14,518,4280 0 0 0
+payment 0 0 0 0 (21,256,430) ending investment balance14,518,42815,970,27117,567,29819,324,0280
promote / excess excess cash flow 0 0 0 7,621,307 +promote 0 0 0 (2,286,392) post promote excess 0 0 0 5,334,915
common summary net cash flow to common investor(s)(14,518,428)0 0 0 26,591,345
+preferred equity payoff 0 0 0 (2,015,000) remaining cash 0 0 0 28,877,737
project level irr 22.1%
WATERFALL year 0year 1year 2year 3year 4year 5
+construction loan interest 0 0 0 (1,712,313) free cash flow from operations 0 0 0 467,742
+capital costs 0 0 (191,875)(16,596)
$ total % of capital % of equity total project cost 52,928,093100%-construction loan 37,049,66570%total equity 15,878,42830%100% -preferred equity 1,360,000- 9% common equity 14,518,428- 91%
+$ operations accounted for in budget 0 0 582,2120
Sale EOY 4 at Stabilization
net cash flow (1,360,000) 0 0 0 0 0 0 0 0 0 0 0 0 27,921
+ add'l investment 1,360,000 0 0 0 0 0 0 0 0 0 0 0 0 0 + interest (12.0%) 39,083 40,206 41,361 42,550 43,773 45,031 46,325 47,656 49,025 50,434 51,884 53,375 54,909 56,486 + payment 0 0 0 0 0 0 0 0 0 0 0 0 0 (27,921)
+ add'l investment 4,091,948 82,987 1,489,030 4,611,087 4,244,731 0 0 0 0 0 0 0 0 0
year 1 year 1 year year 2 project level summary
preferred investor irr 12.0%
irr payment 0 0 0 0 0 0 0 0 0 0 0 0 0 0
beginning balance 0 4,190,082 4,375,400 5,982,611 10,809,412 15,394,348 15,765,562 16,145,728 16,535,061 16,933,782 17,342,118 17,760,301 18,188,567 18,627,160
preferred equity
year 2 year 2 year 2 year 3 year 3 year 3 year 3 year 4 year 4 quarter 1 quarter 2 quarter 3 quarter 4 quarter 5 quarter 6 quarter 7 quarter 8 quarter 9 quarter 10 quarter 11 quarter 12 quarter 13 quarter 14
ending balance 4,190,082 4,375,400 5,982,611 10,809,412 15,394,348 15,765,562 16,145,728 16,535,061 16,933,782 17,342,118 17,760,301 18,188,567 18,627,160 19,076,330
+ interest (10.0%) 98,134 102,331 118,181 215,714 340,204 371,215 380,166 389,333 398,721 408,336 418,182 428,266 438,593 449,170
+ payment 0 0 0 0 0 0 0 0 0 0 0 0 0 0
+ post-promote excess 0 0 0 0 0 0 0 0 0 0 0 0 0 0 + investment (4,091,948) (82,987) (1,489,030) (4,611,087) (4,244,731) 0 0 0 0 0 0 0 0 0 net cash flow (4,091,948) (82,987) (1,489,030) (4,611,087) (4,244,731) 0 0 0 0 0 0 0 0 0
1 4 7 10 13 16 19 22 25 28 31 34 37 40 3 6 9 12 15 18 21 24 27 30 33 36 39 42
38
1 year 1
excess cash flow 0 0 0 0 0 0 0 0 0 0 0 0 0 0 + promote (30%) 0 0 0 0 0 0 0 0 0 0 0 0 0 0 post-promote excess 0 0 0 0 0 0 0 0 0 0 0 0 0 0 common investor summary
distribution 0 0 0 0 0 0 0 0 0 0 (0) 0 0 27,921 pref investment 1,360,000 0 0 0 0 0 0 0 0 0 0 0 0 0 common investment 4,091,948 82,987 1,489,030 4,611,087 4,244,731 0 0 0 0 0 0 0 0 project net cash flow (5,451,948) (82,987) (1,489,030) (4,611,087) (4,244,731) 0 0 0 0 0 (0) 0 0 27,921
ending balance 1,399,083 1,439,289 1,480,650 1,523,200 1,566,973 1,612,003 1,658,328 1,705,984 1,755,009 1,805,444 1,857,327 1,910,702 1,965,611 1,994,176
Distribution Projection Years 1-4
common equity
excess funds
beginning balance 0 1,399,083 1,439,289 1,480,650 1,523,200 1,566,973 1,612,003 1,658,328 1,705,984 1,755,009 1,805,444 1,857,327 1,910,702 1,965,611
project irr 22.1%
0
common investor irr 19.7%

Section 4 41
APPENDIX
April 2023
September 2022
PERMIT
September 2022 - November 2022
APPROVALS
CONSTRUCTION DOCUMENTS
PRICING
January 2023 - March 2023
CONCEPT & SCHEMATIC DESIGN
CITY
DESIGN DEVELOPMENT
August 2022
CONSTRUCTION
May 2023 - February
COMPLETE
2025
STABILIZED
Project Schedule
December 2022 - February 2023
PROJECT
July 2026
42
CONTRACTOR SELECTION
43
Unit Matrix

$
Market Rental Comps
SF 995 1,166 980 1,033
$
$
SF 762 745 795 865
Rent 2,195$ 1,790$ 2,229$ 2,744$ 2,305$ 2,462$ 2,043$ Rent/sf $2.26 1.81$ 2.59$ 2.92$ 2.27$ 2.53$ 2.23$
3%
Rent 2,295$ 2,073$ 2,473$ 2,035$ Rent/sf $2.31 1.78$ 2.52$ 1.97$ #REF!
Rent 1,895 1,637 1,654 1,904 1,995 1,864 1,755$ 1,741$
$
SF 1,112 1,198 1,180 1,125 1,156 1,143 1,112 1,112 Rent 2,495$ 2,607$ 2,832$ 2,281$ 2,532$ 2,376$ 2,292$ 2,323$ Rent/sf $2.24 2.18$ 2.40$ 2.03$ 2.19$ 2.08$ 2.06$ 2.09$
Rent 1,995$ 2,081$ 1,967$ 2,193$ Rent/sf $2.31 2.79$ 2.47$ 2.54$
$
Rent 2,295$ 2,547$ 3,285$ 2,164$ 2,657$ 2,349$
$
44
$
Annual Escalation from 3 years from 2023 Start 2 One12StarterBR2BRLargeBRTH2StoryBRTH2StoryMicroStudioBedStarter1BRLargew/Pwdr1BR+Den
$
SF 972 991 860 941 1,015 972 915
1500 Meadow Lake Property Comps | Apartments 1500 51 Main 46 Penn44 WashingtonBrookside 51Woodside VillageLoCale The VueThree LightConverge KCArterraWest Bottoms Flats 2.42 Plaza Plaza Plaza Westport Westwood Mission Overland Park Micro Comp Micro Comp Micro Comp Micro Comp SF 381 - 446 448 374-469 464 420 380 Rent 995 - 1,295 1,297$ 1592-1775 1,194$ 1,199$ 1,228$ Rent/sf $2.61 - $2.68 2.90$ 3.91 - 3.47 2.57$ 2.85$ 3.23$ SF 448 -565 619 552 562 593 565 490 500 Rent 1,495 - 1,595 1,405$ 1,670$ 1,780$ 1,488$ 1,472$ $ 1,275$ 1,244$ Rent/sf $2.45 - $2.65 $2.27 $3.03 3.17$ 2.51$ 2.60$ 2.60$ 2.49$
SF 762 846 657 716 782 753 760 803
Rent/sf $2.49 1.94 2.52 2.66 2.55 2.48 2.31$ 2.17$
SF 980 1,038 1,087 952 980 1,062
$
$
$
SF 1,310 1,389 1,317 1,207 1,331 1,333 1,321 Rent 2,895$ 2,989$ 2,690$ 2,898$ 2,915$ 3,041$ 2,674$ Rent/sf $2.21 2.15$ 2.04$ 2.40$ 2.19$ 2.28$ 2.02$
Rent/sf $2.34 2.45$ 3.02$ 2.27$ 2.71$ 2.21$
The Great Misperception
Tailwinds in
Historical US Multifamily Occupancy 2 97% 2009 2014 2019 Q2'22 92% Average US Housing Completions as Percentage of Population 4 1994-20070.55% 2008-20210.30% 45% decline
US Rental Housing in an Inflationary Environment
For historical context, from 1978-1982, the last period the US experienced high inflation, CPI averaged 9% and so did
45 US RENTAL HOUSING IN AN INFLATIONARY ENVIRONMENT Blackstone | 1

Short Supply Housing has been undersupplied since the 2008-2009 financial crisis when homebuilders dramatically scaled back production. Supply has never caught back up to demand. Since 2010, production of US homes has been at half the rate of the long-term average, creating a 4 million home deficit. New supply has begun to decline again in 2022 as a result of supply chain challenges, cost pressures and the sharp upward movement in mortgage rates.
Not surprisingly, apartment occupancy has risen 500 bps above 2009 levels to 97%. 2
Market Demand Factors
Strong Demand Simply put, renting a home or apartment is more compelling today because it is more affordable than owning and that differential is the widest it has been in 20+ years. 3 As the chart on the next page illustrates, US mortgage payments have widened to 1.5x market rents, up from 1.2x less than three years ago.
Rental Housing
Pricing Power The combination of short supply and rising demand has resulted in exceptional rent growth. The average multifamily market rent in Blackstone Real Estate Income Trust (BREIT)’s top markets is up 19% year-overyear in June. 5

The question of the day is, “Should we be worried about US housing in an inflationary environment, with rates rising and owning a home becoming increasingly less affordable for more individuals?” If you are buying a home today, then yes, you should be thinking about the impact of rising rates. However, if you own existing apartments and homes to rent the fundamentals have never been stronger. Rental housing has been a high conviction theme for Blackstone for years – our conviction is even stronger today.
Additionally, BREIT has focused on markets in the South and West US regions which benefit from the additional tailwinds of higher population growth vs. the rest of the country, and even stronger multifamily rent growth.6
We refer to rental housing as a short-duration asset because leases are typically one year and can quickly reflect changes in market rents. BREIT's portfolio is deliberately oriented towards shorter-duration real estate to be more defensive against inflationary pressure in the economy.