
VISION CREATING
A FOR MISSION FARMS

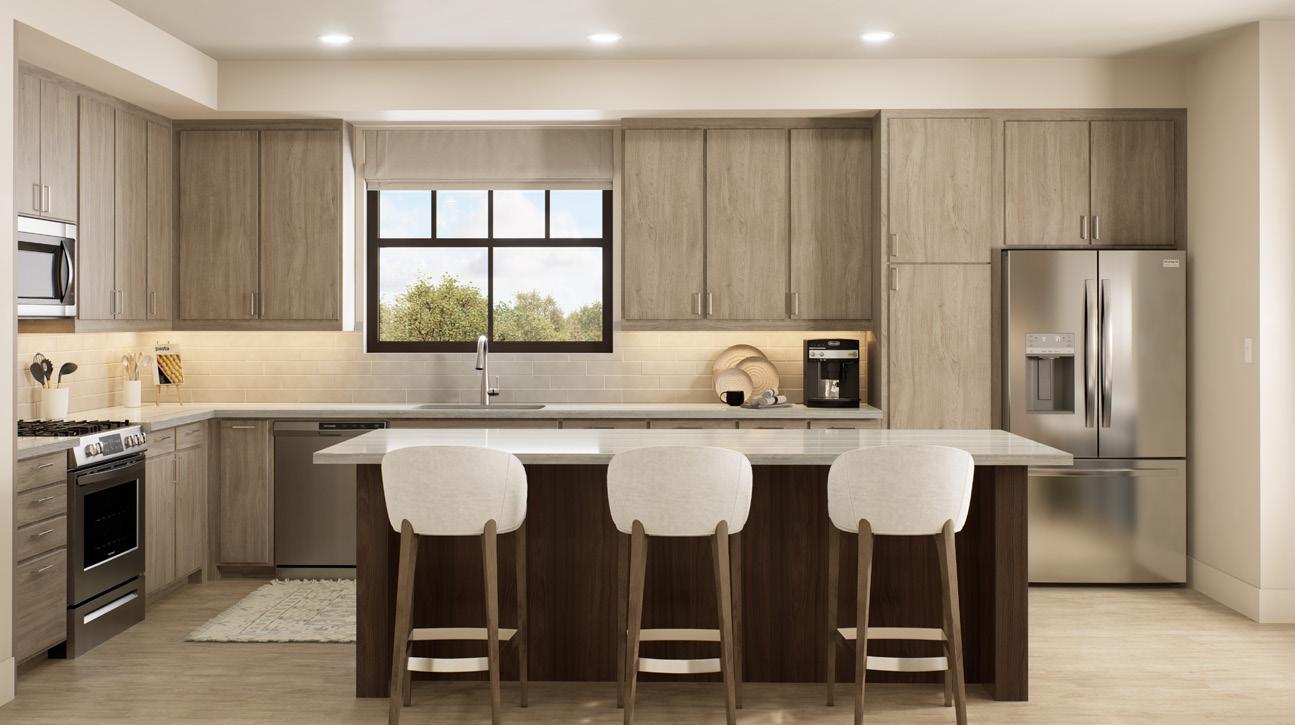
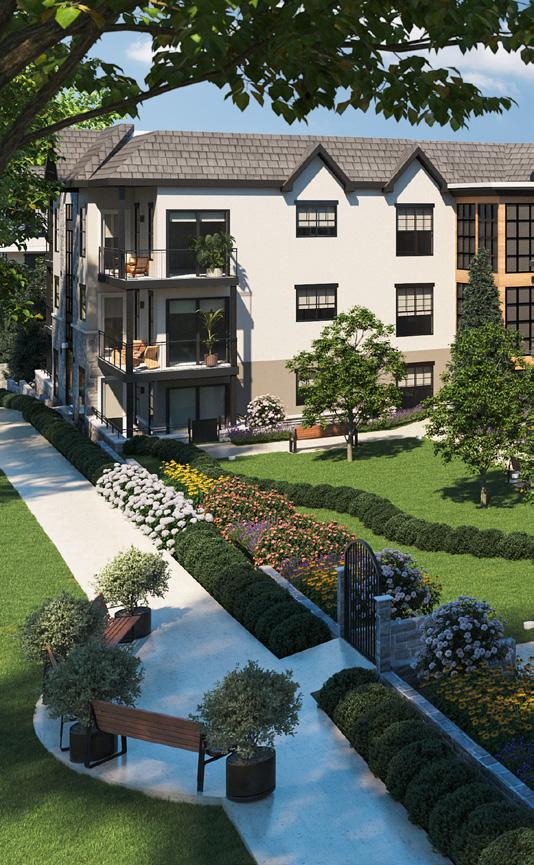
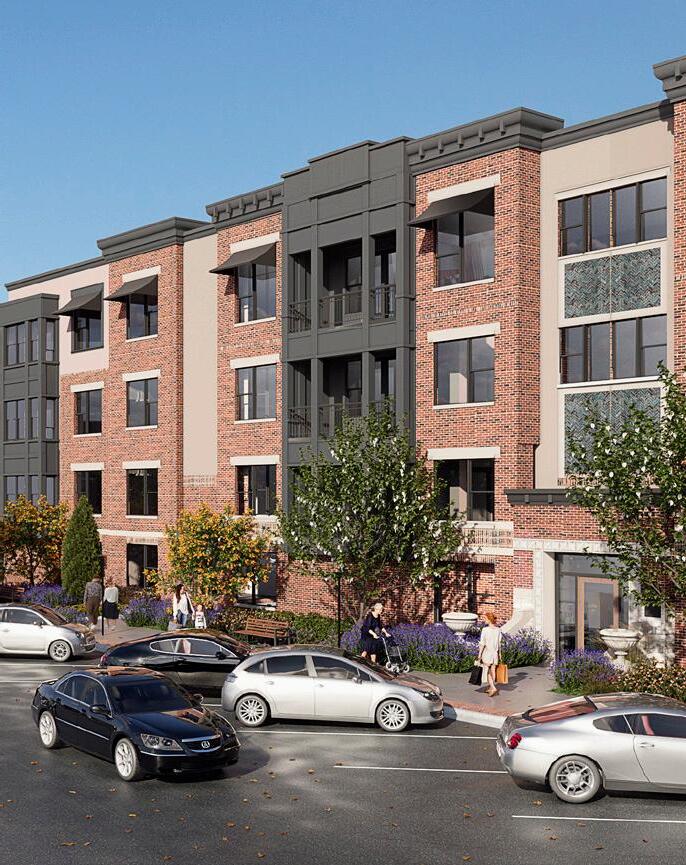


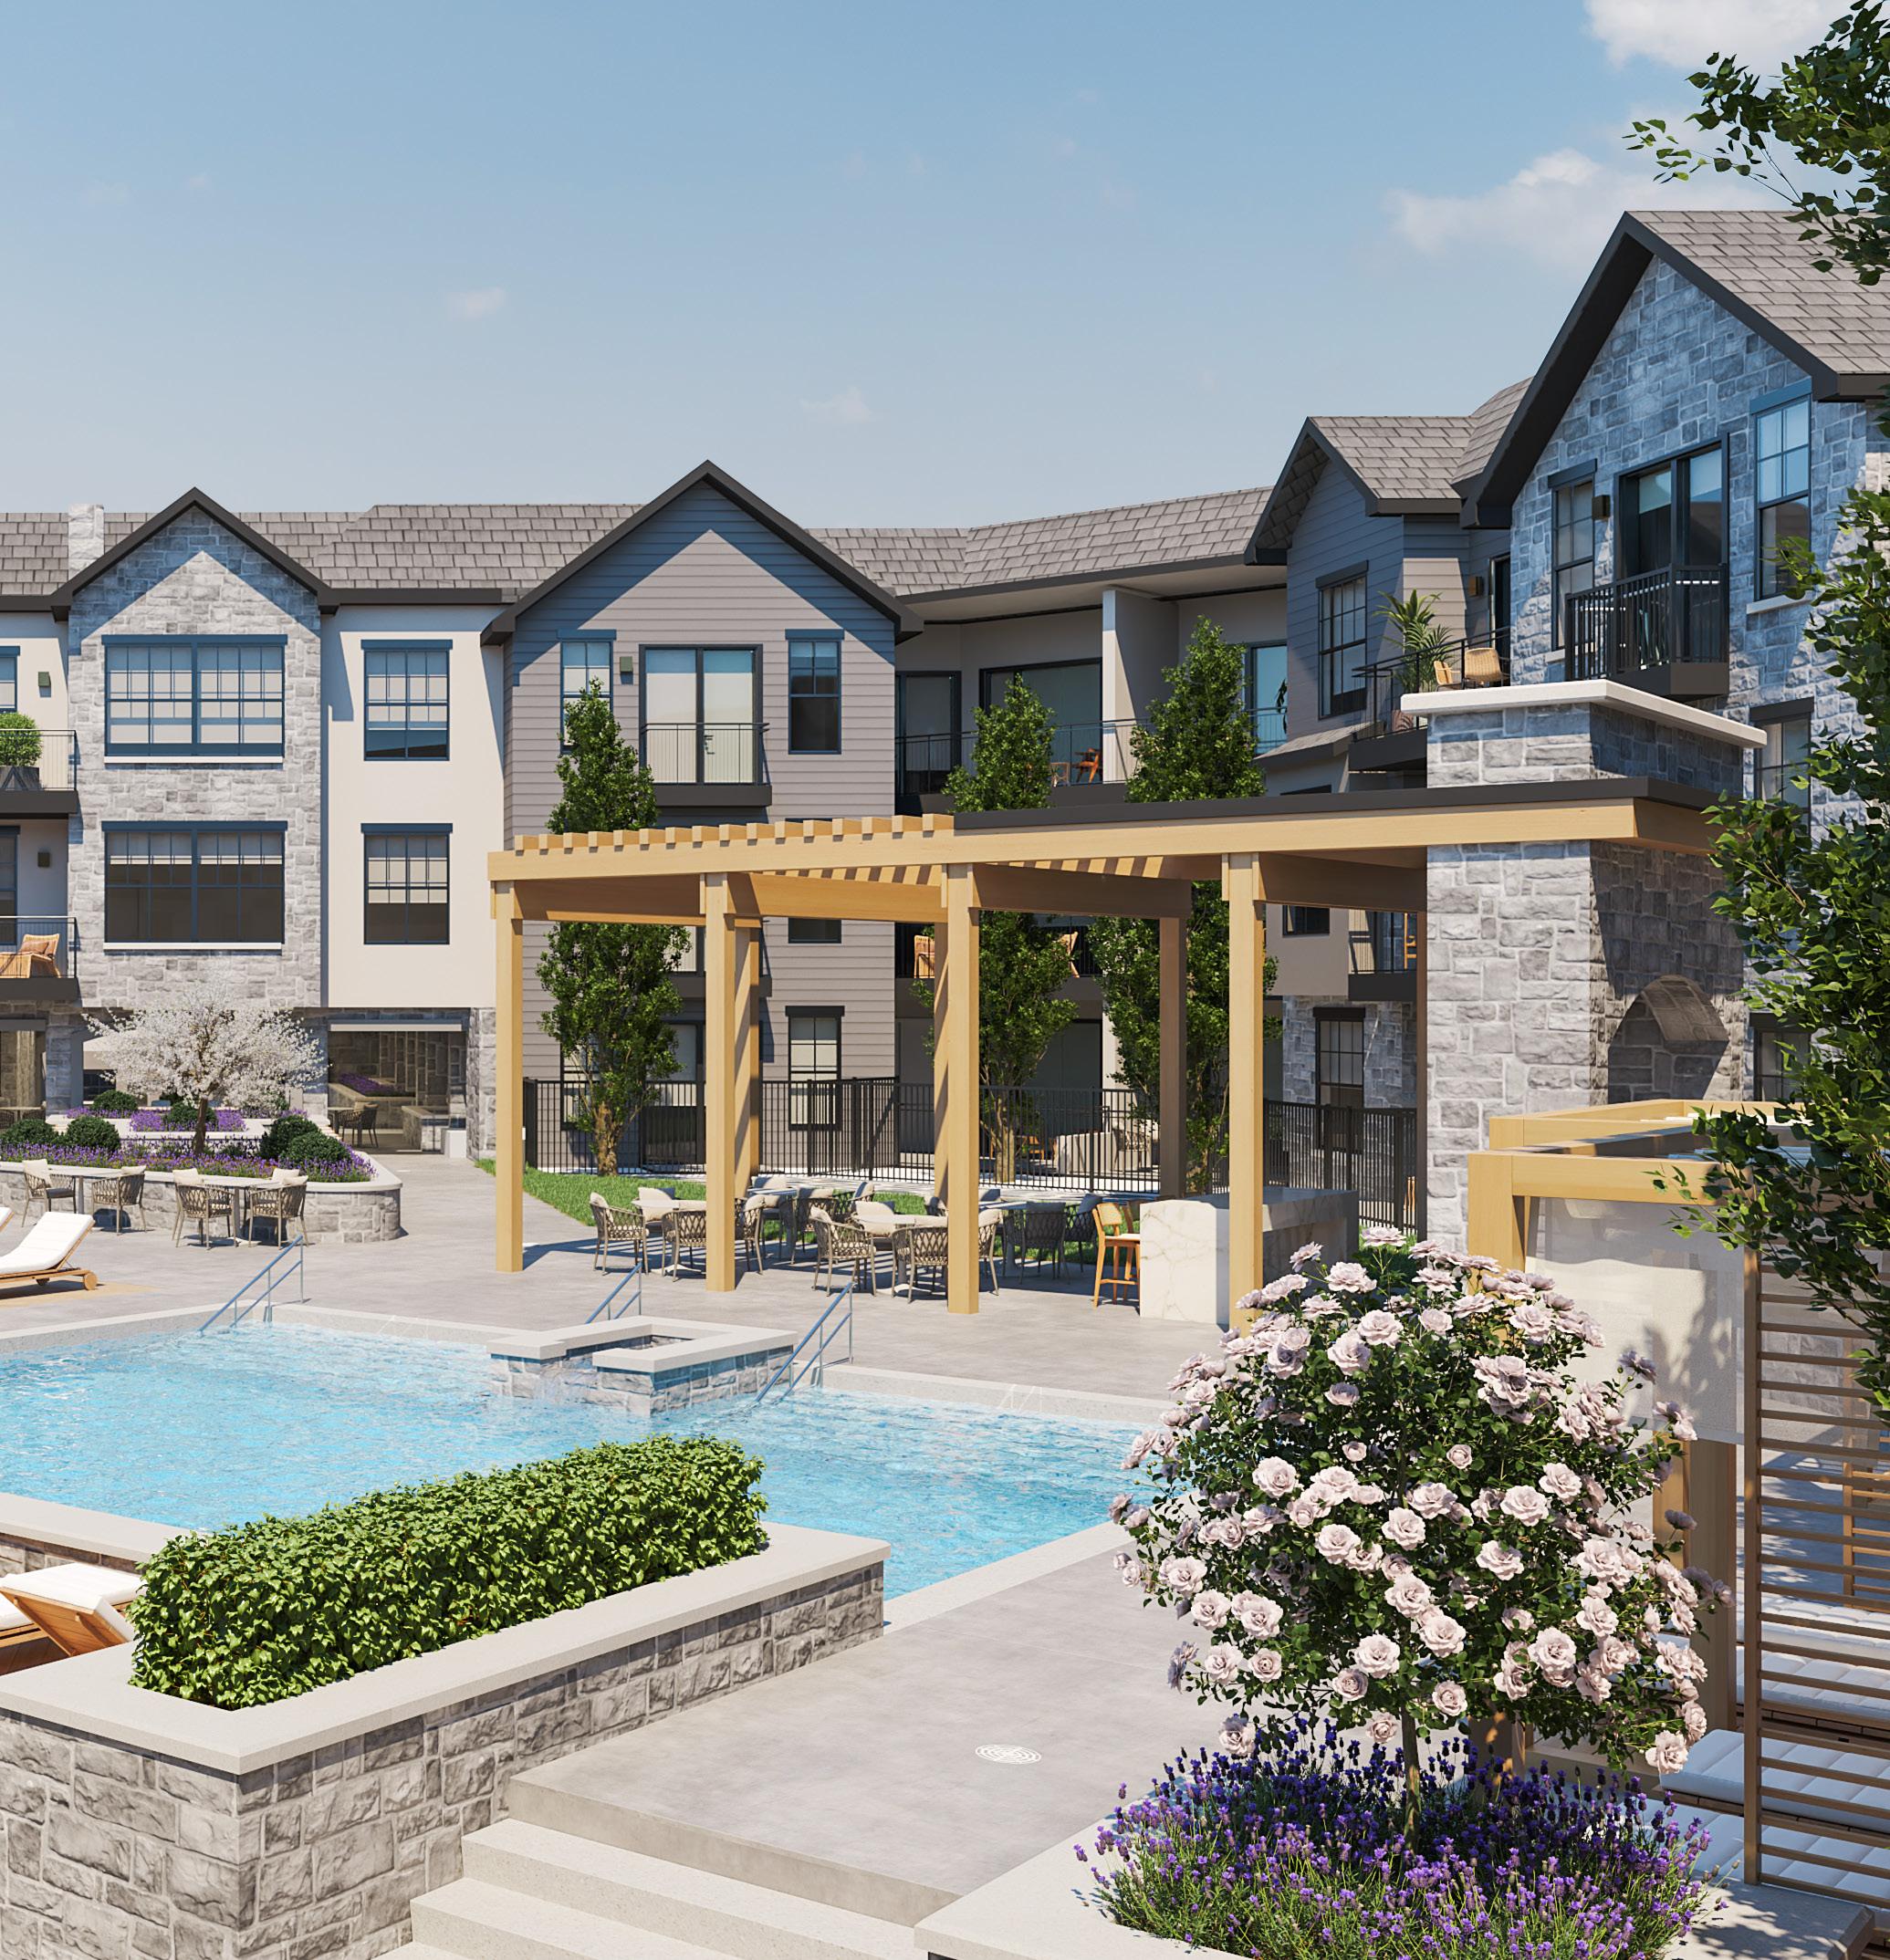


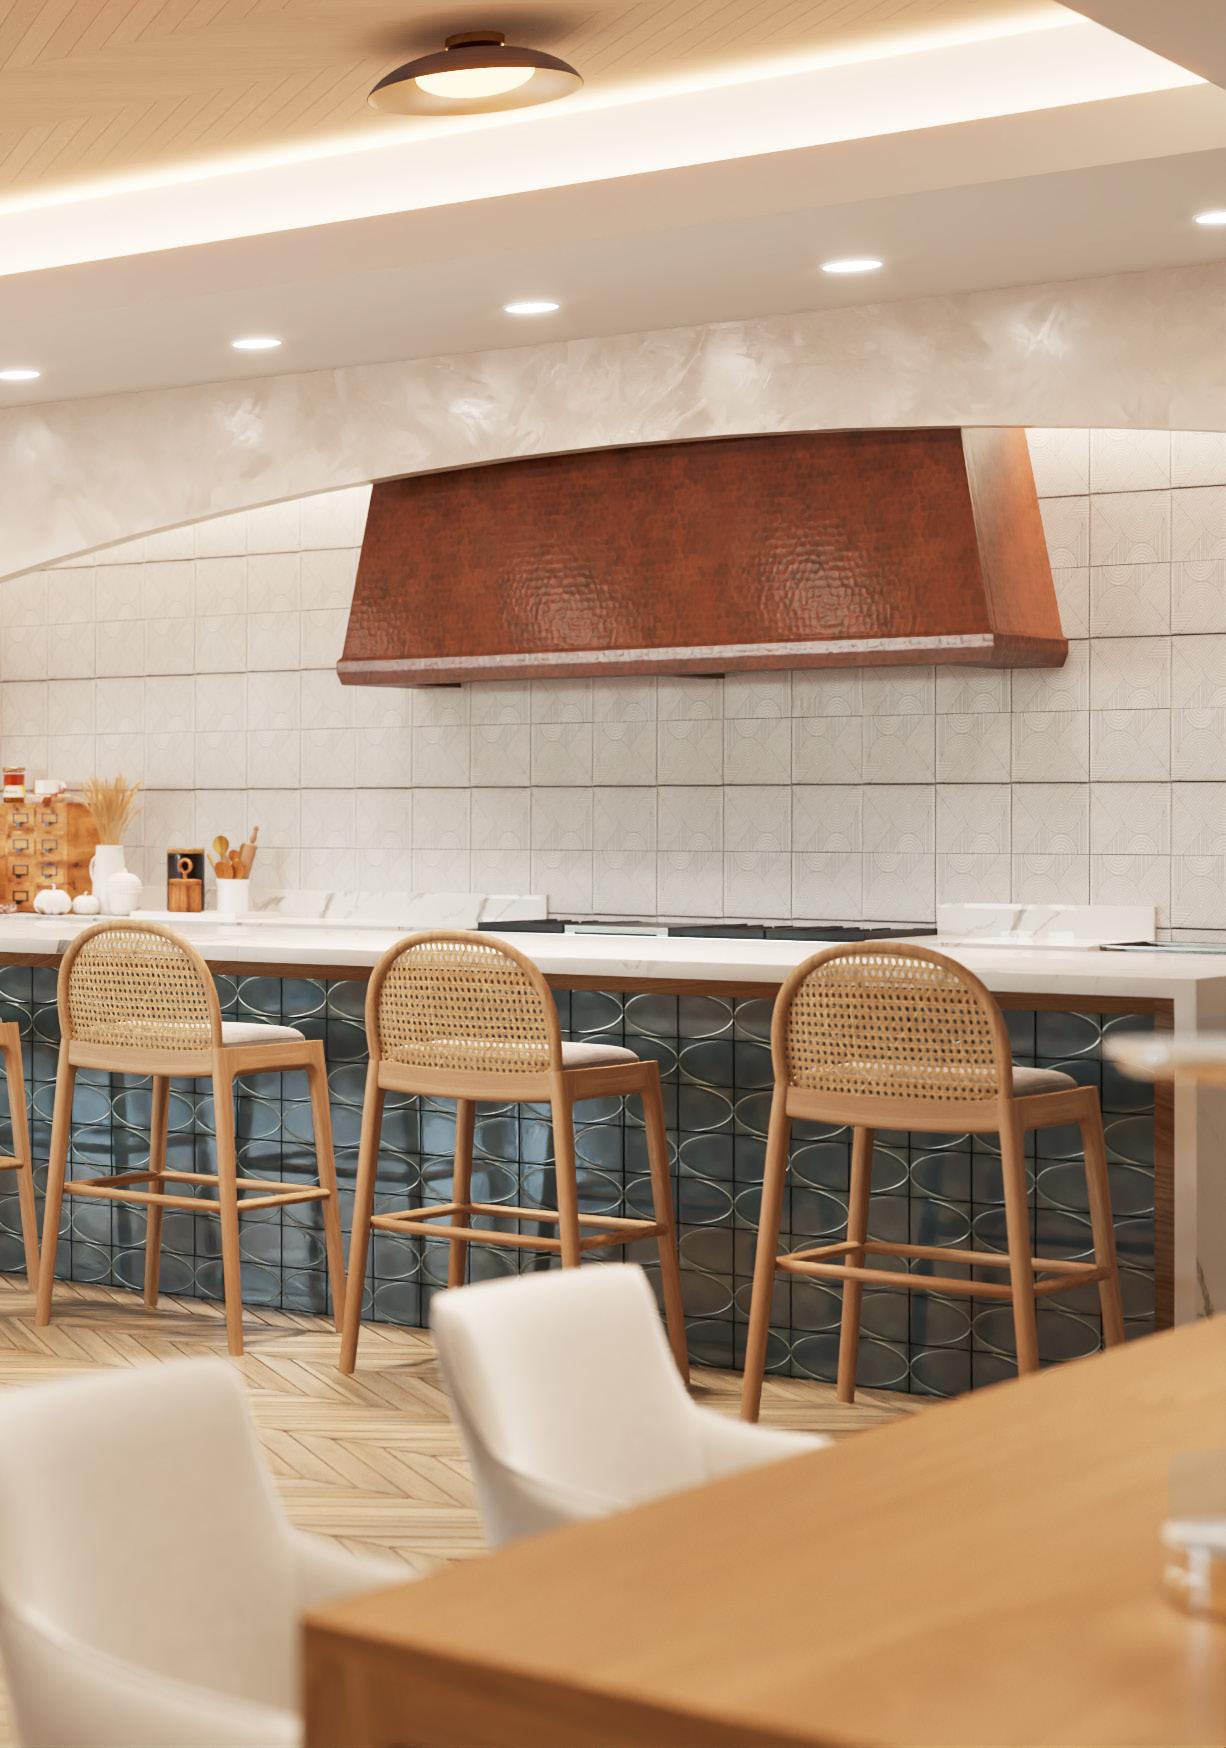
Table of Contents
Section 1 BIG PICTURE 7
PROJECT SNAPSHOT UNDERWRITING APPROACH OWNERSHIP STRUCTURE PARTNERSHIP
Section 2 DESIGNING FOR THE MARKET 15
SITE PLAN DESIGN CONCEPT PROJECT TIMELINE AMENITIES / FINISHES RENTER PROFILE
Section 3
PROJECT ECONOMIC ANALYSIS 33
PROJECT BUDGET COSTS & ECONOMIC RETURNS
Section 4 KANSAS CITY MARKET 39
MARKET RENTAL COMPS MARKET DEMAND FACTORS
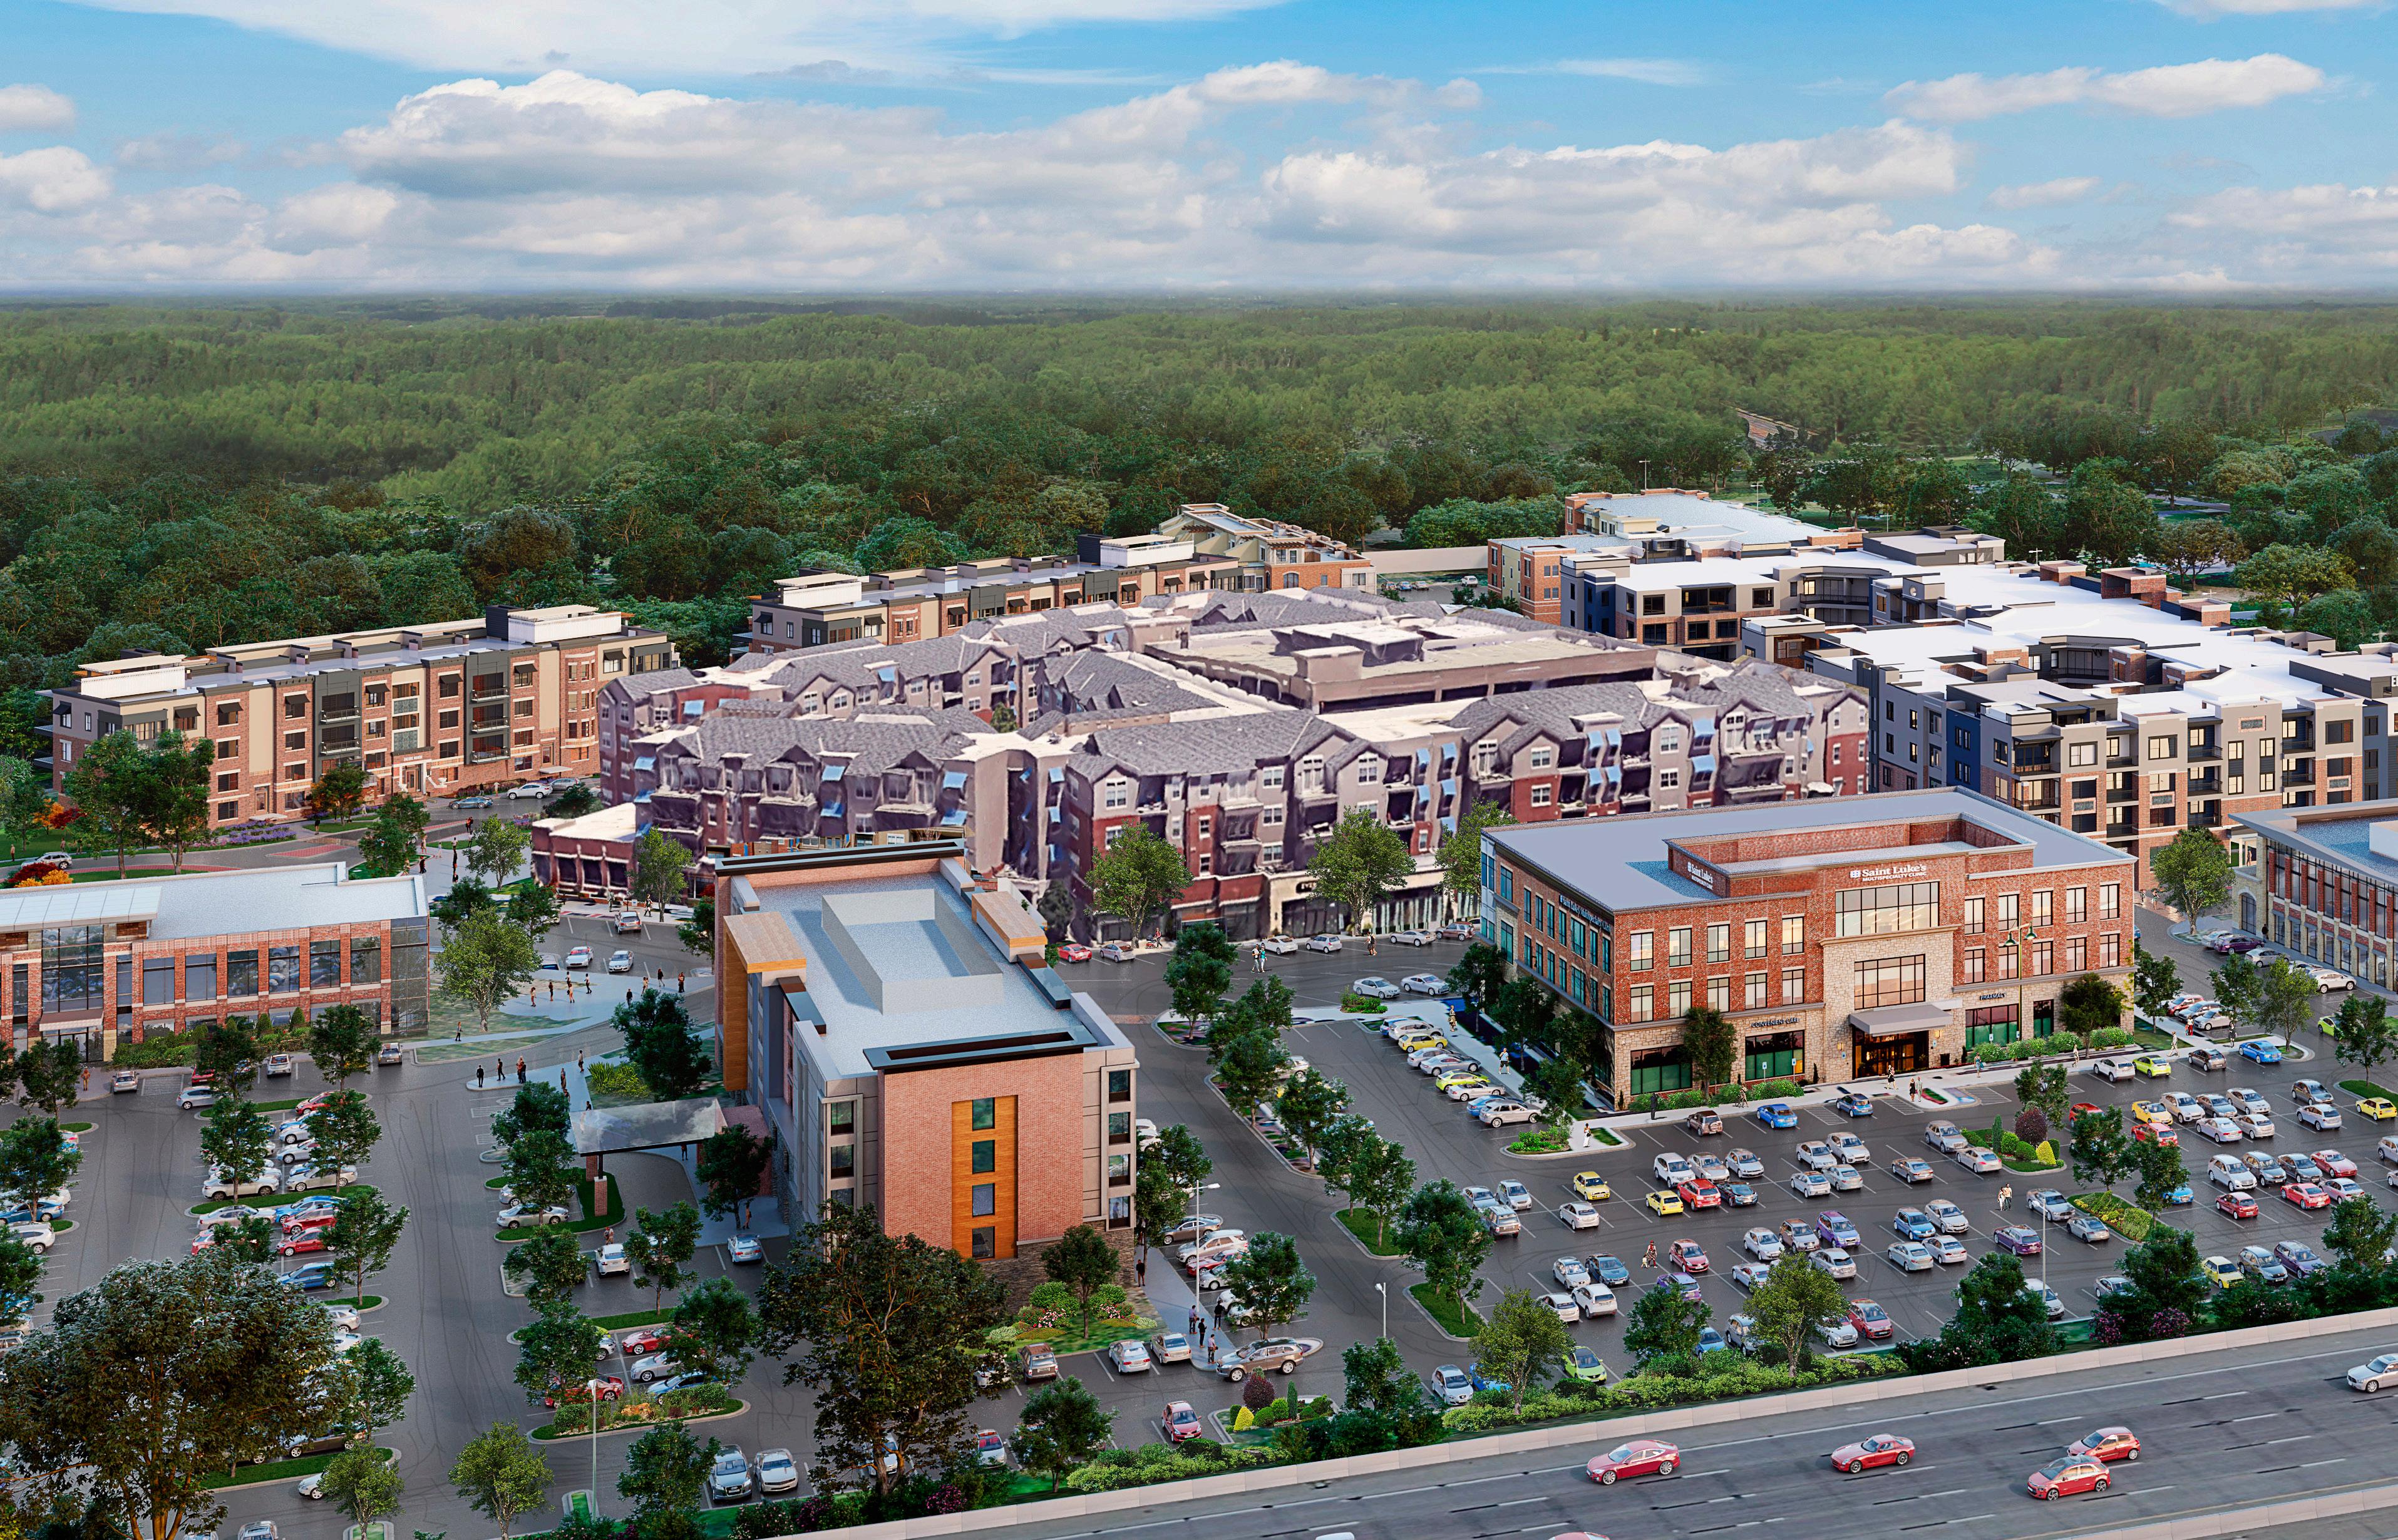
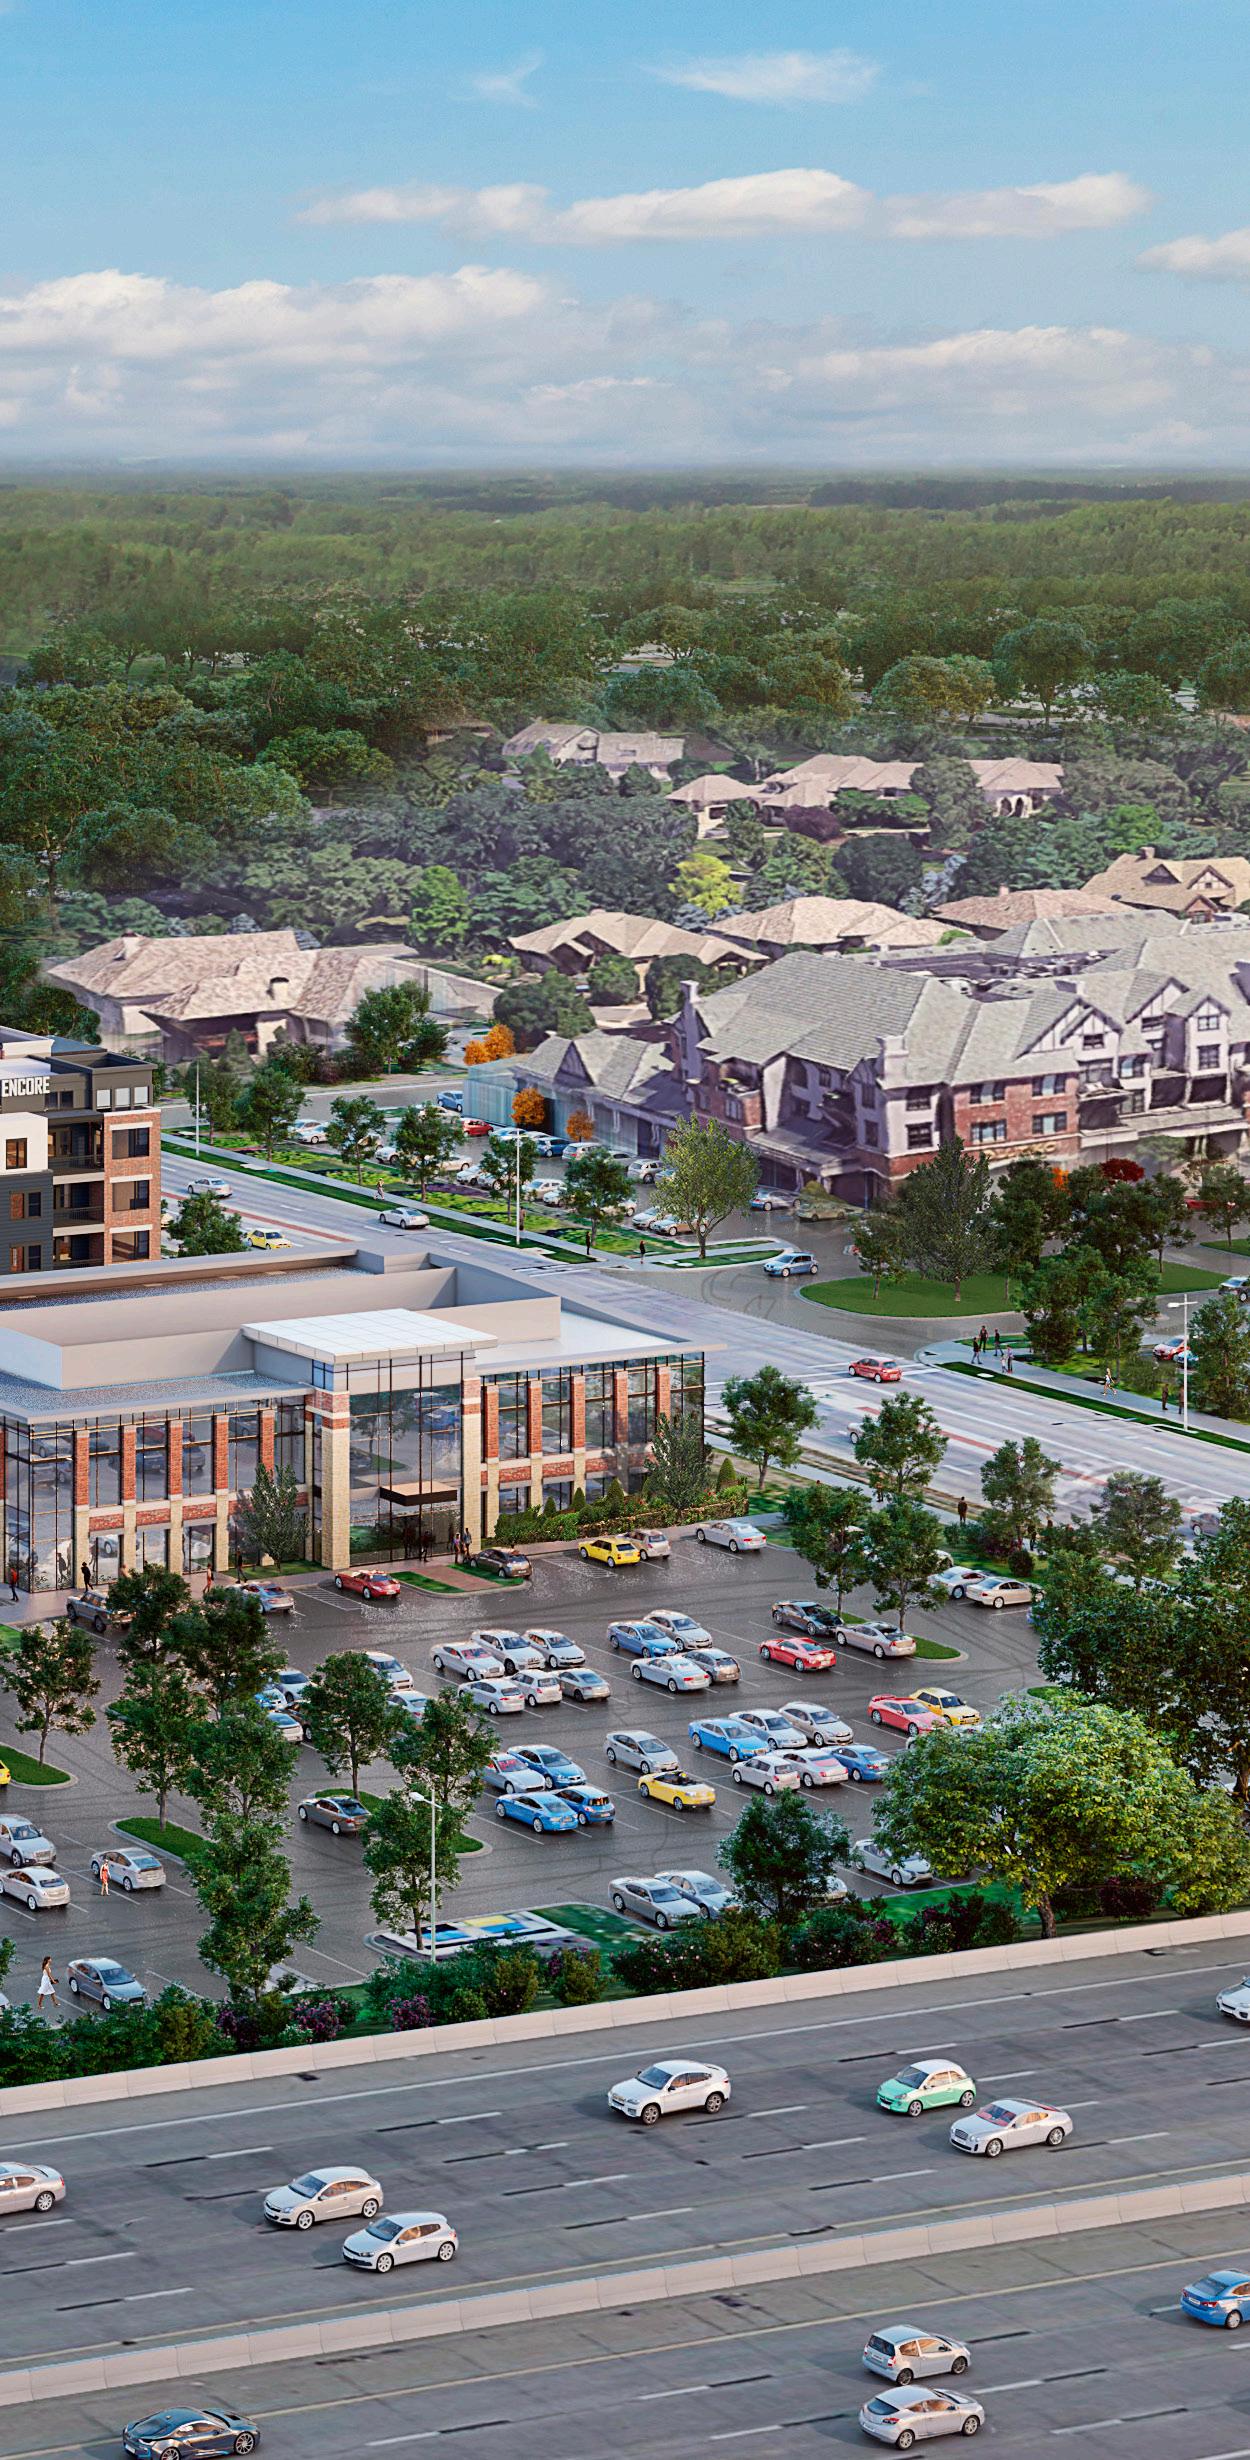
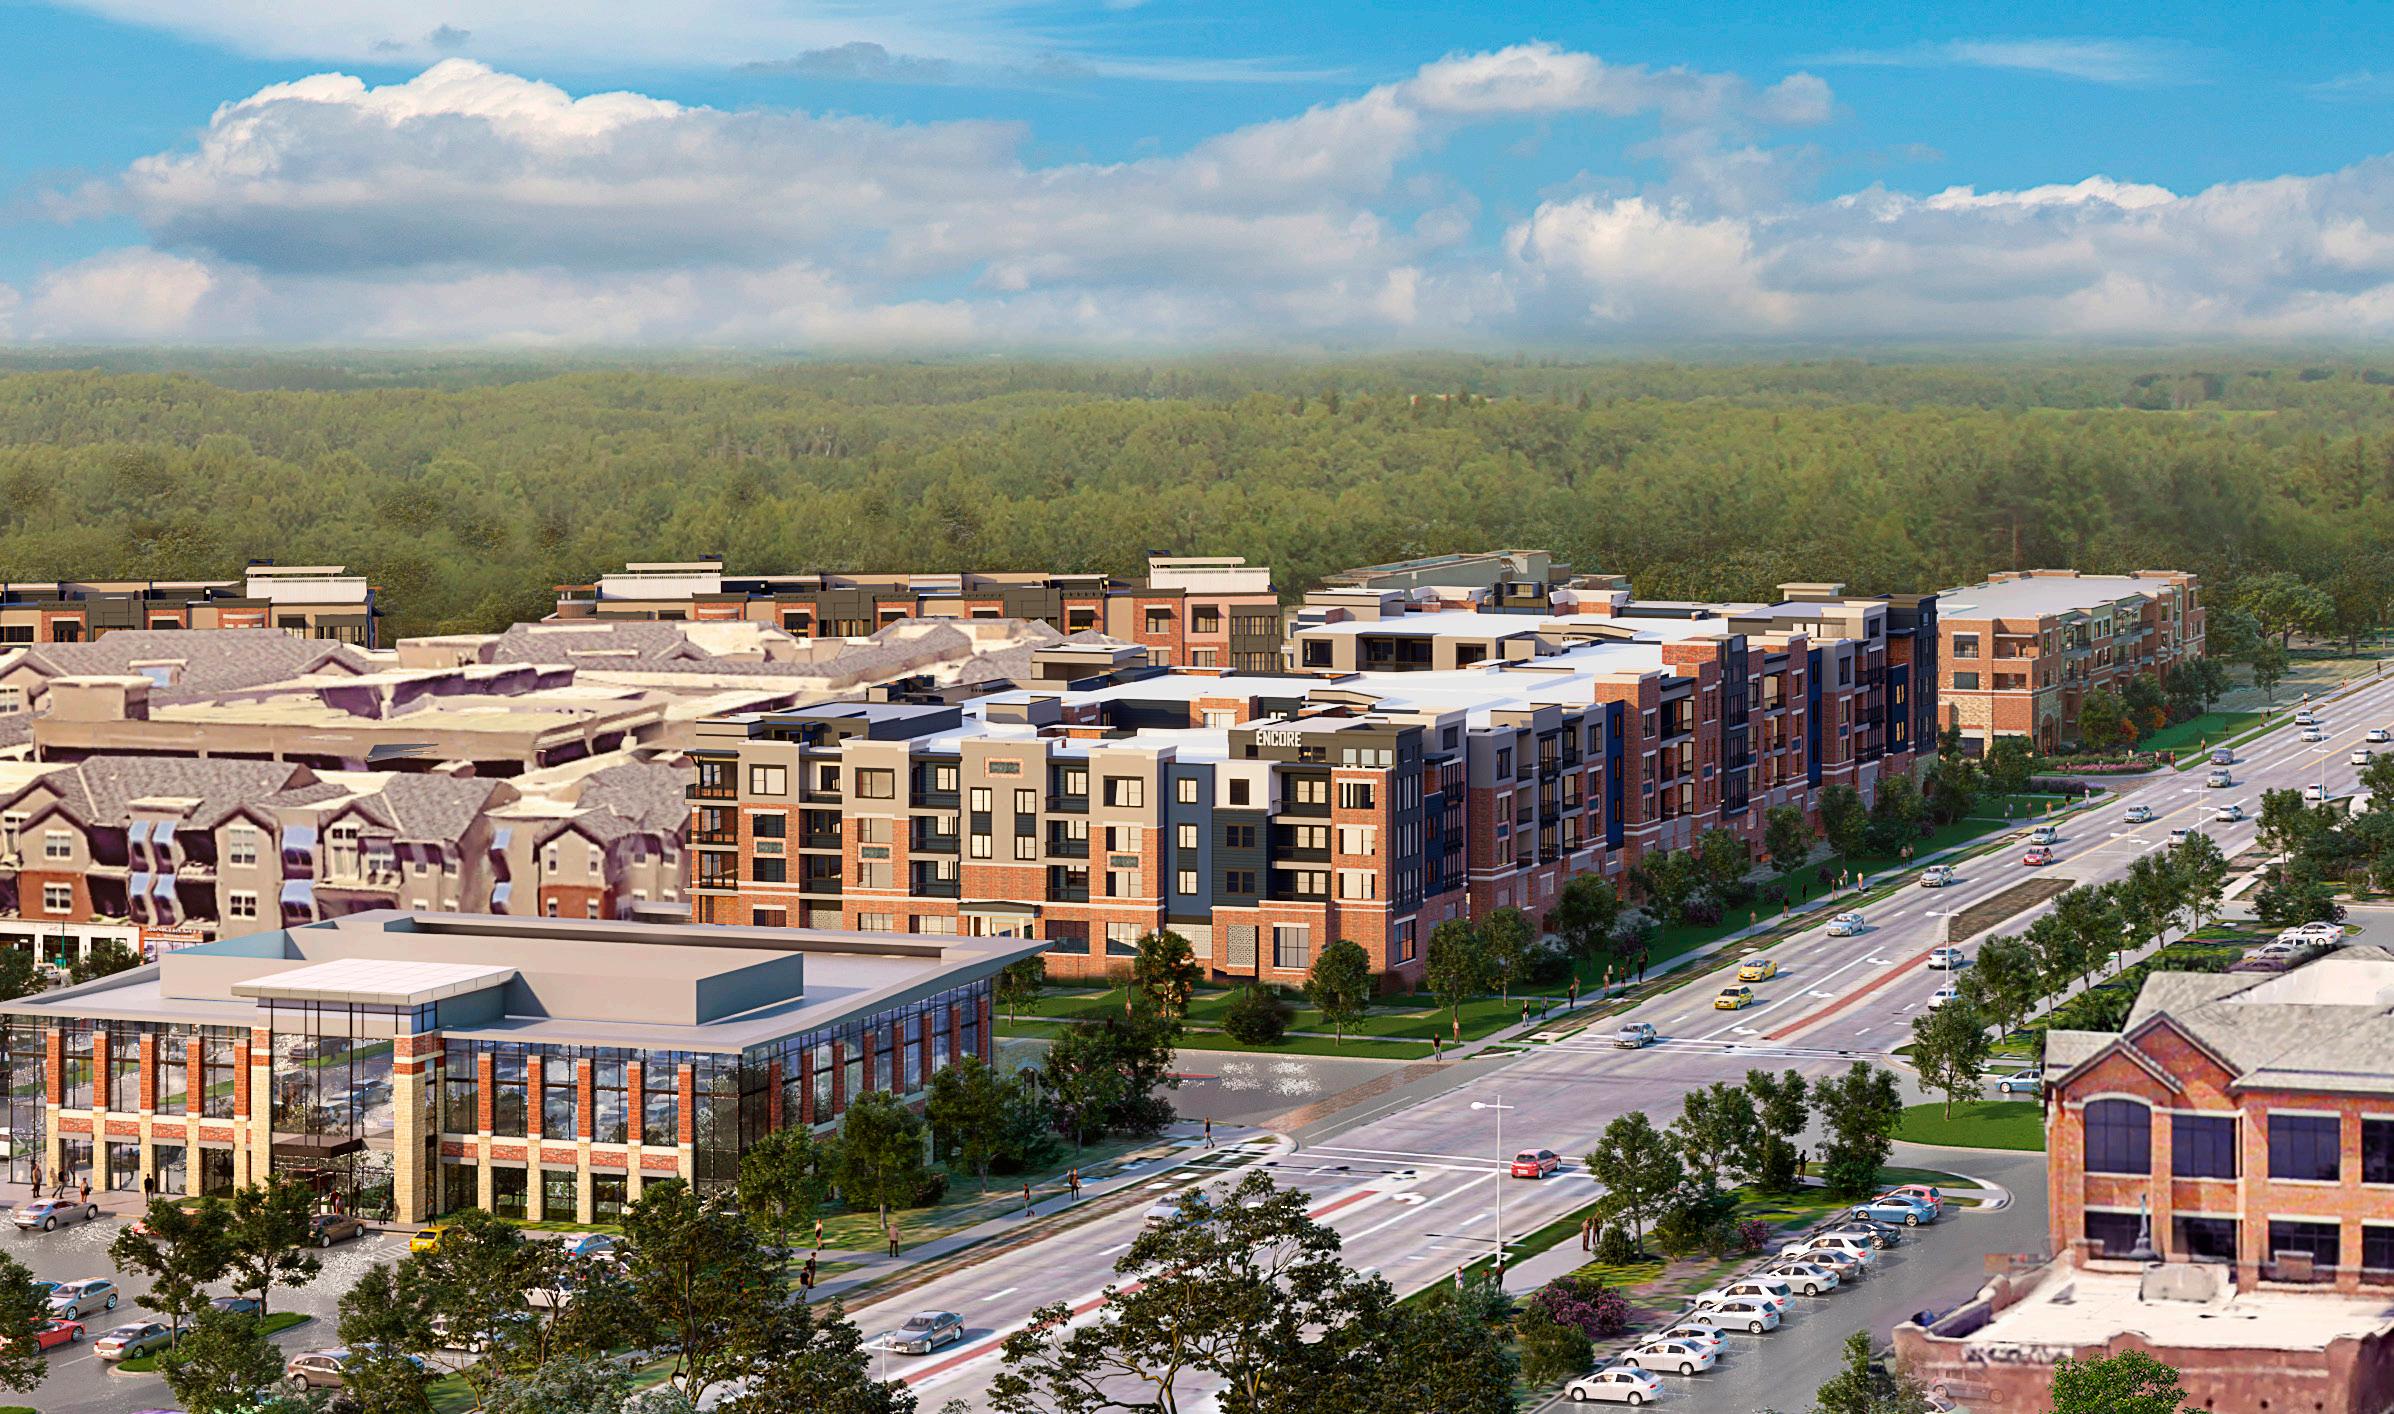
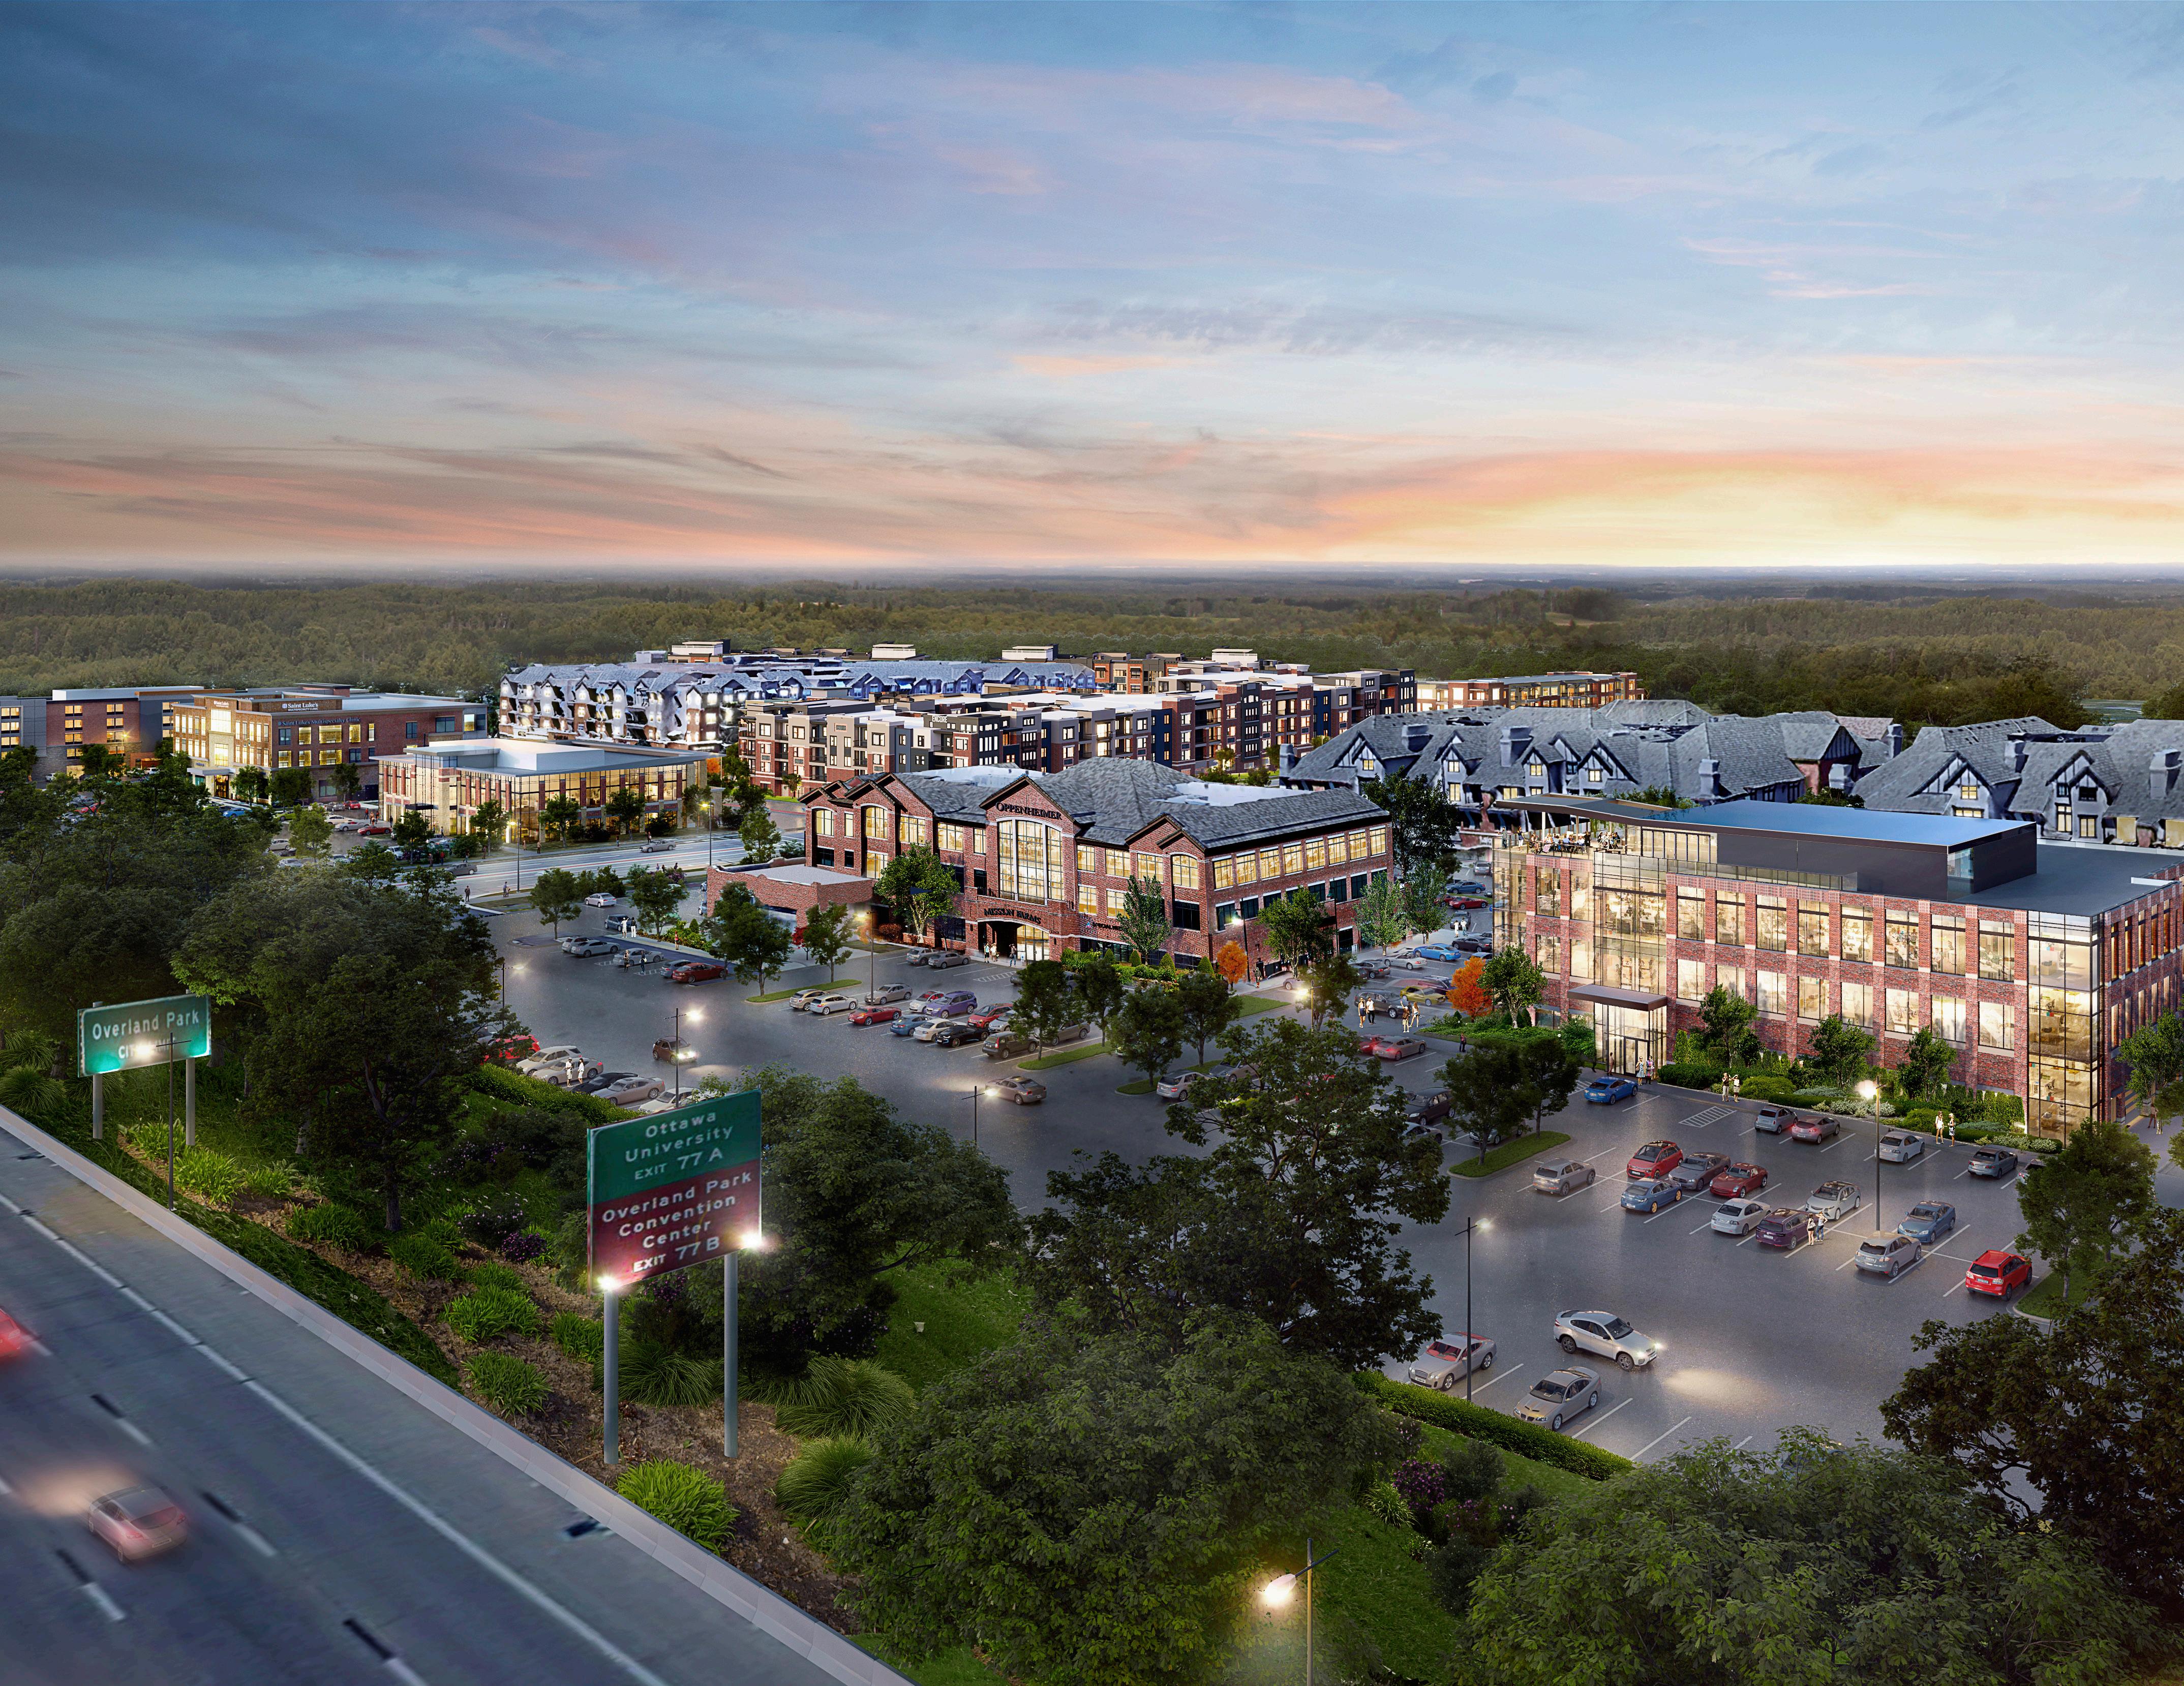
Encore
Encore Flats
Springhill Suites
St. Luke’s Medical
BIG PICTURE
Project Snapshot
Encore at Mission Farms
Encore Flats


Underwriting Approach
EPC FINANCIAL UNDERWRITING METRICS - GO OR NO-GO DECISION
Typical First to Market EPC Profile or Leasehold Interest
Yield on Cost (NOI/Cost) 6.5% - 7% Typical Exit Cap 5%
5 YR Asset IRR Target 20%
10 YR Asset IRR Target 15%
5 YR LP Equity Multiple 2x
10 YR LP Equity Multiple 3x
EPC / Weltner have adopted a set of metrics specific to the risk profile of the areas in which we develop. Below is a summary of the drivers which allow us and our capital partners to move forward at the outlined metrics for our projects:
1. Market driven lower cap rates at exit
2. Increased interest from capital sources (lower cost of capital due to reduced risk profile)
3. Directly in the growth path
4. Demographic Profile
5. Barrier to entry
6. Unique amenity profile in the community
Ownership Structure
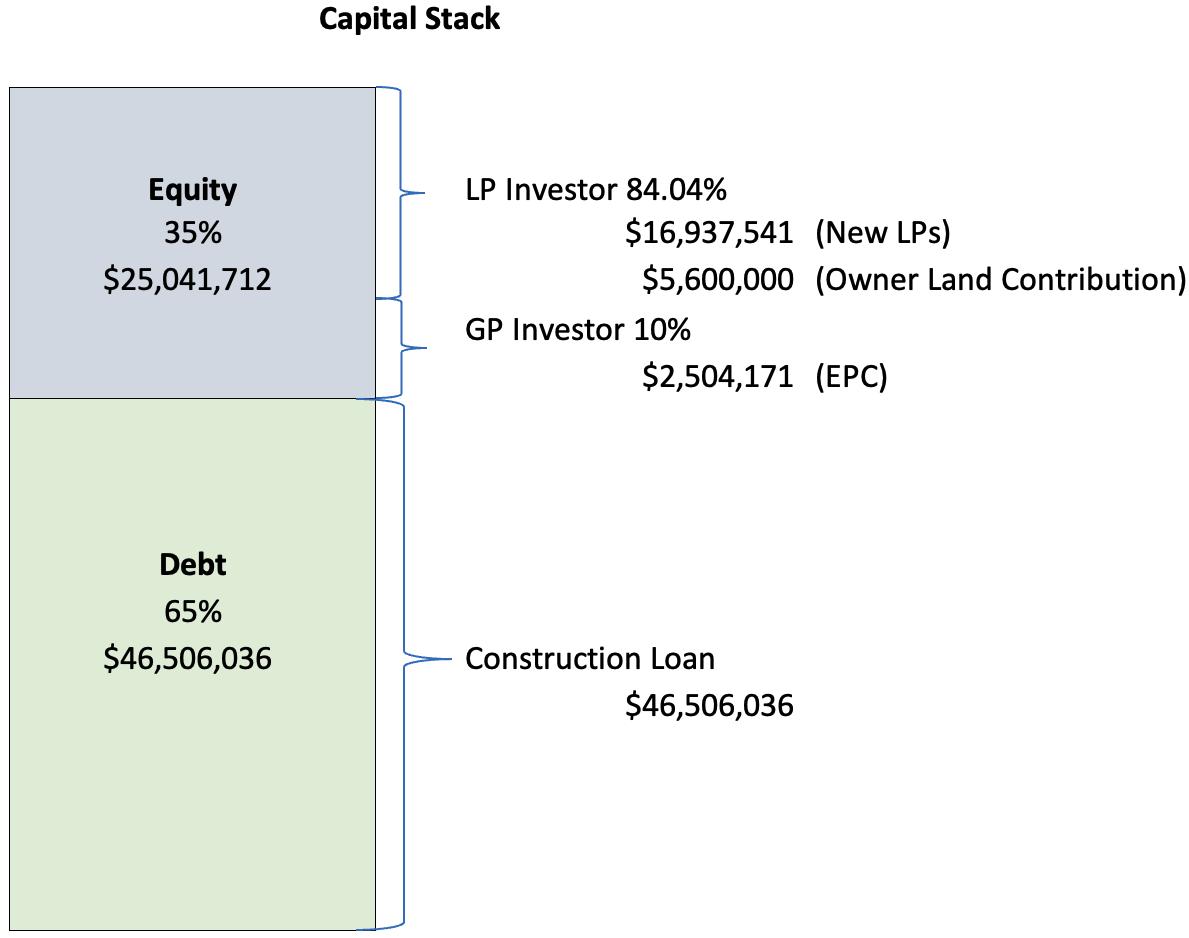
A new ownership entity will be set up for this asset. It is anticipated this asset will borrow 65% of the capital needed for the development, and the remaining 35% will come from cash investments (or bank recognized contributed assets).
EPC / Weltner will be the Manager of entity as well as the developer of the asset.

Why EPC / Weltner as Partners?
We intend to continue to deliver on Mission Farms vision of the highest quality, mixed-use development in the area. Our expertise to understand and meet market demand is what will make the Encore at Mission Farms successful.
Our team had developed all phases of Mission Farms into one of the most successful projects in the Kansas City Metro.
As a group we typically own a significant interest in the asset and offer like minded investors the opportunity to participate.
PRODUCT TYPES
APARTMENTS
OFFICE RETAIL
MIXED USE
MEDICAL
SENIOR

Section 2
DESIGNING FOR THE MARKET


ENCORE FLATS

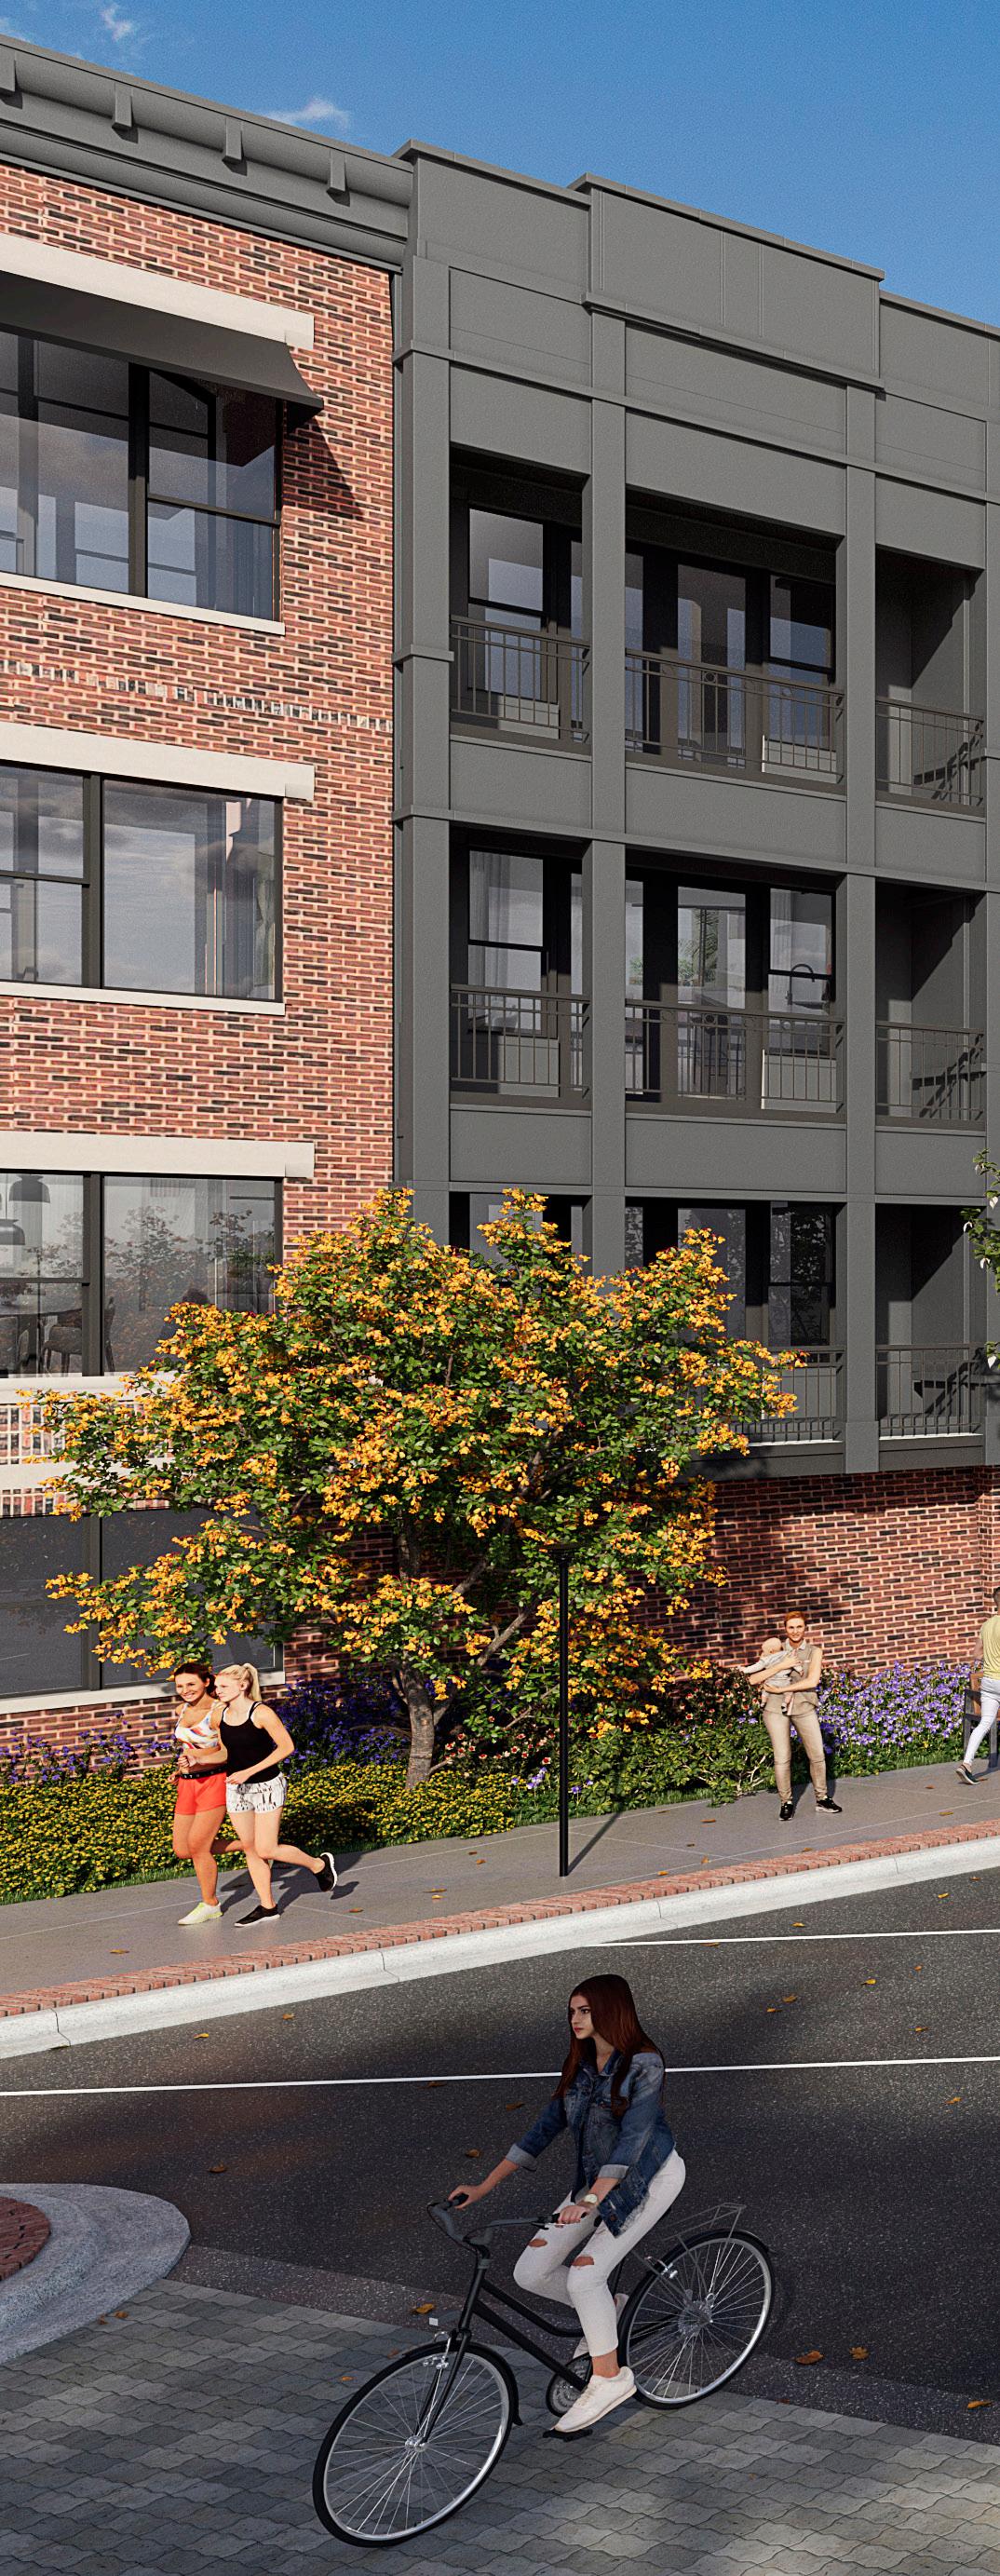
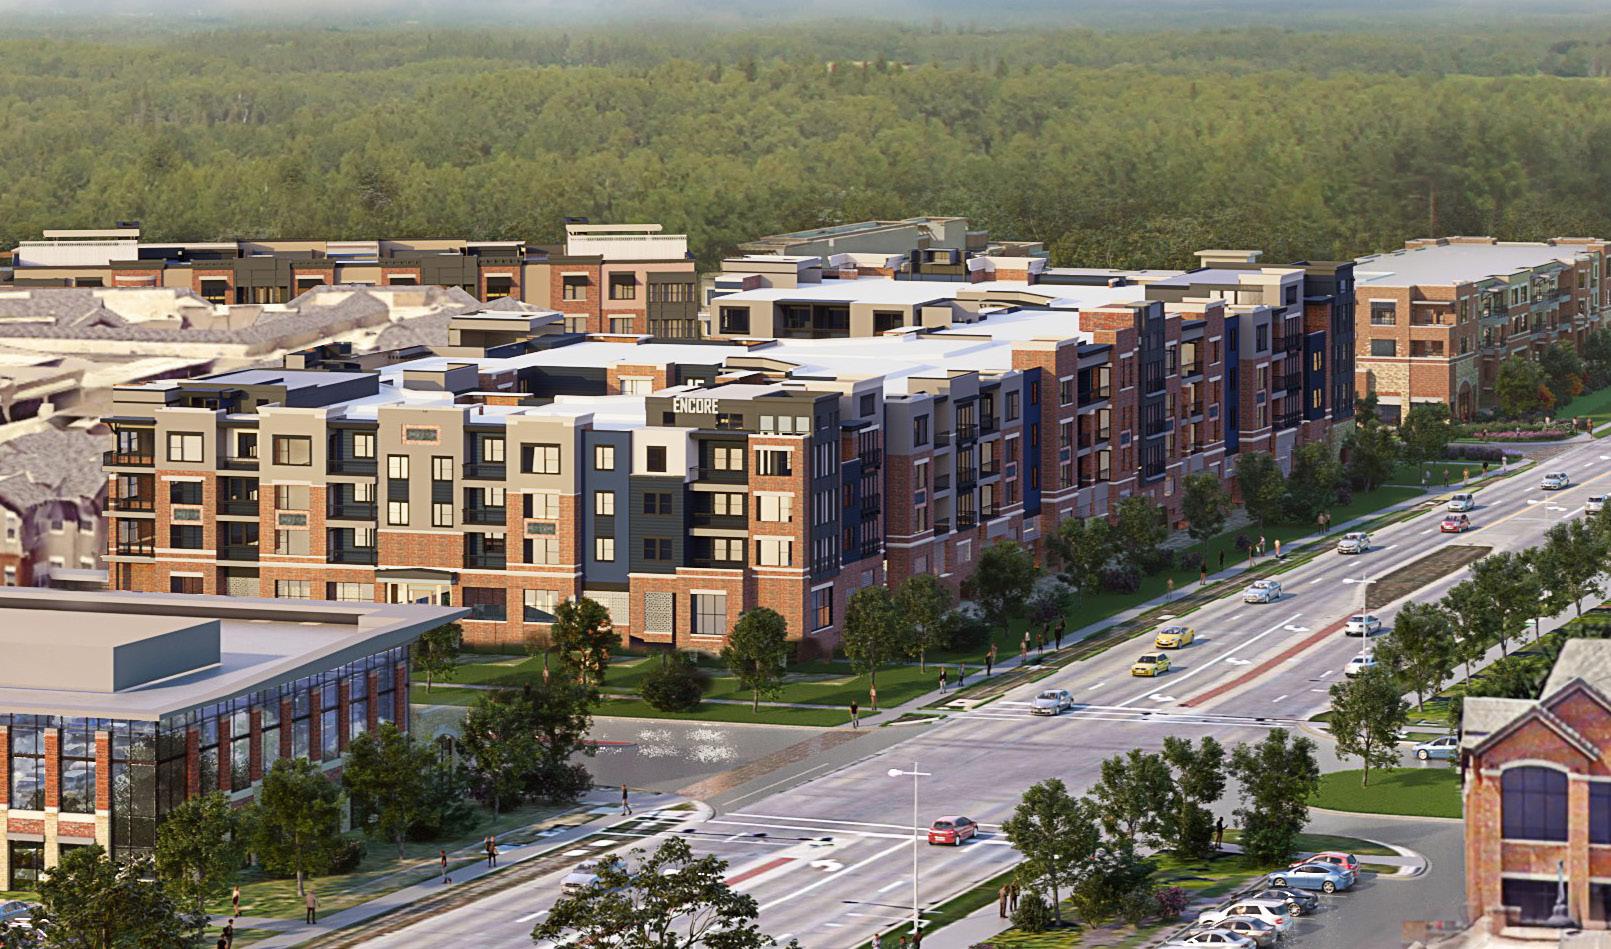
Design Concept
EPC Real Estate and Weltner Equities has designed and will develop 168 luxury market rate units to appeal to the 55 to 75 year old age bracket. The project will be branded as “The Encore” and will be one of 3 currently under development.
The Active Adult our target demographic is looking for a living and social experience after selling their home and before considering independent living.
The Encore Brand will create a “Four Seasons” resort feel for those users that remain vibrant and active without the need for physical or medical assistance. We intend to attract and appeal to empty nesters, early retirement and active senior cohorts.


EASY ACCESS TO SHOPS & DINING

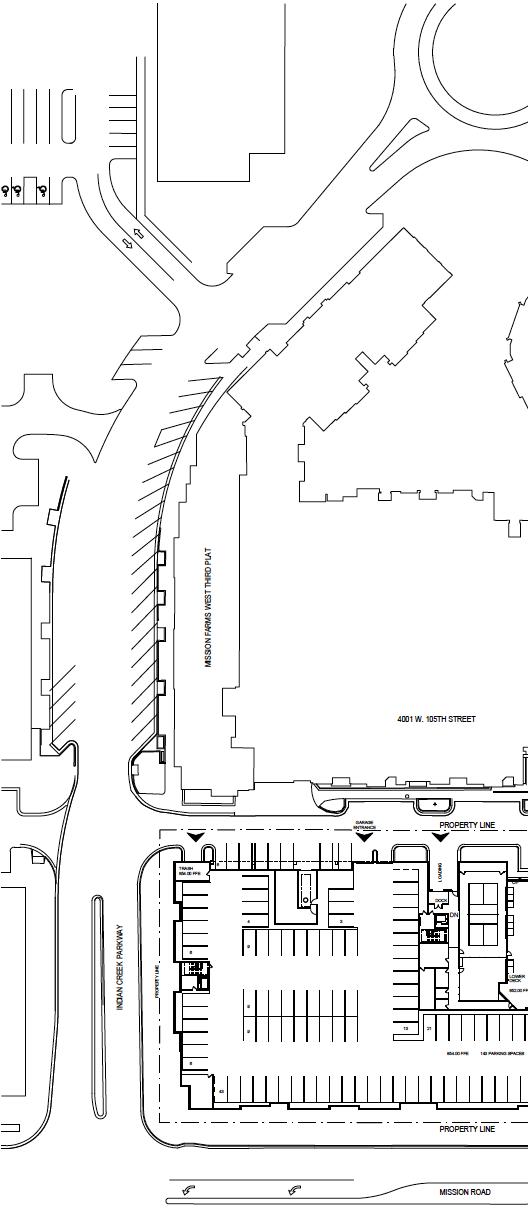
First Level Building 10
5 DIMENSIONS TO WELLNESS


Podium Level Building 10
5 DIMENSIONS TO WELLNESS


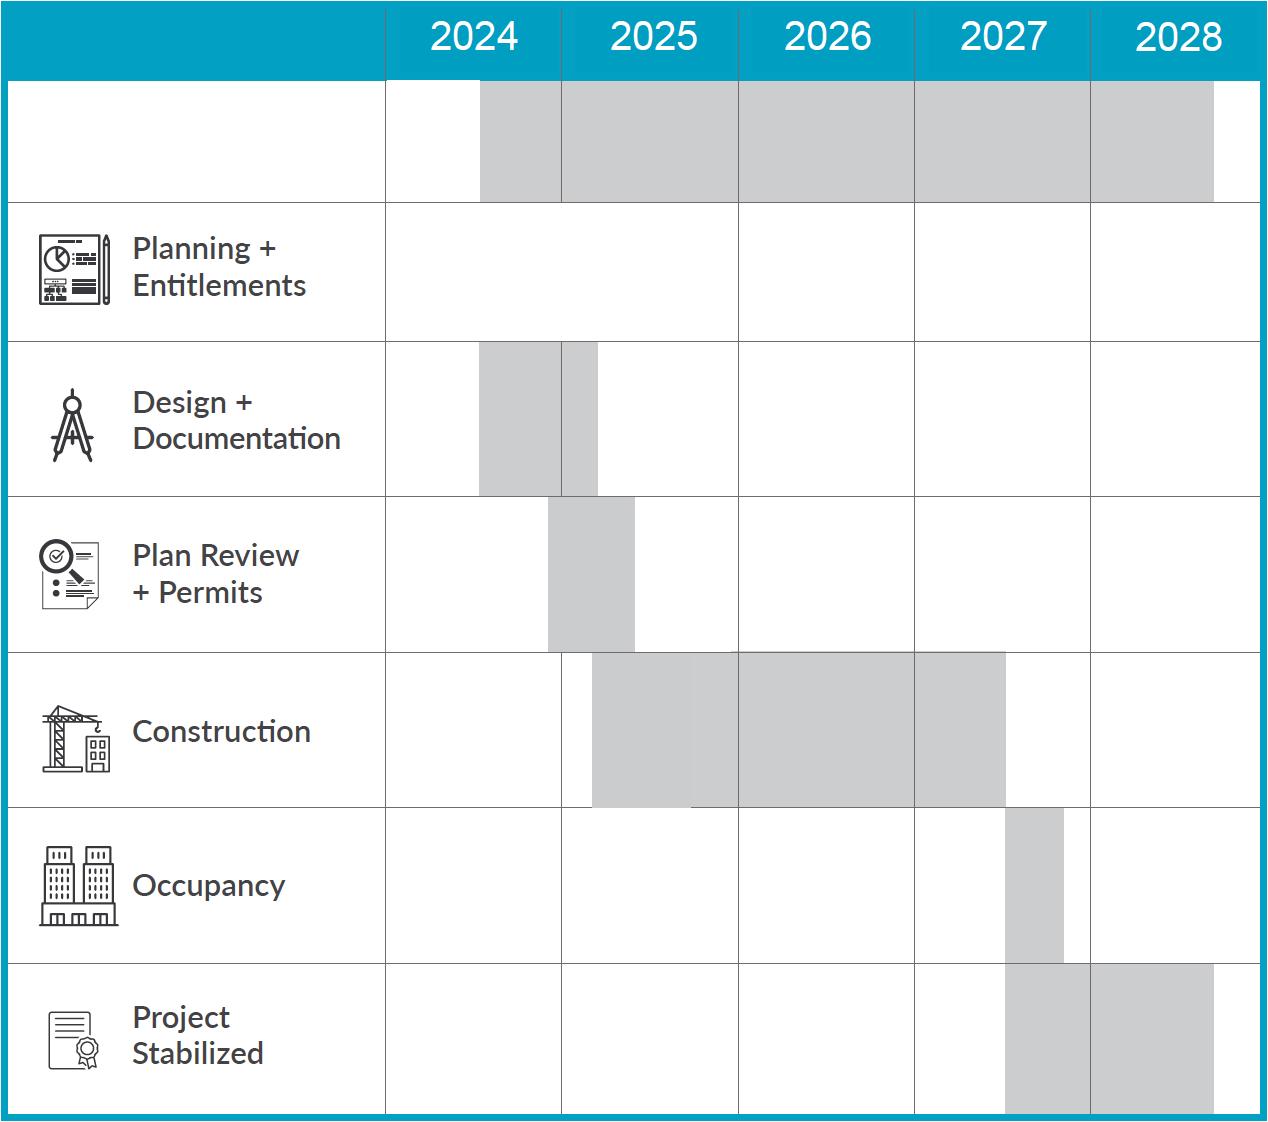
Project Timeline
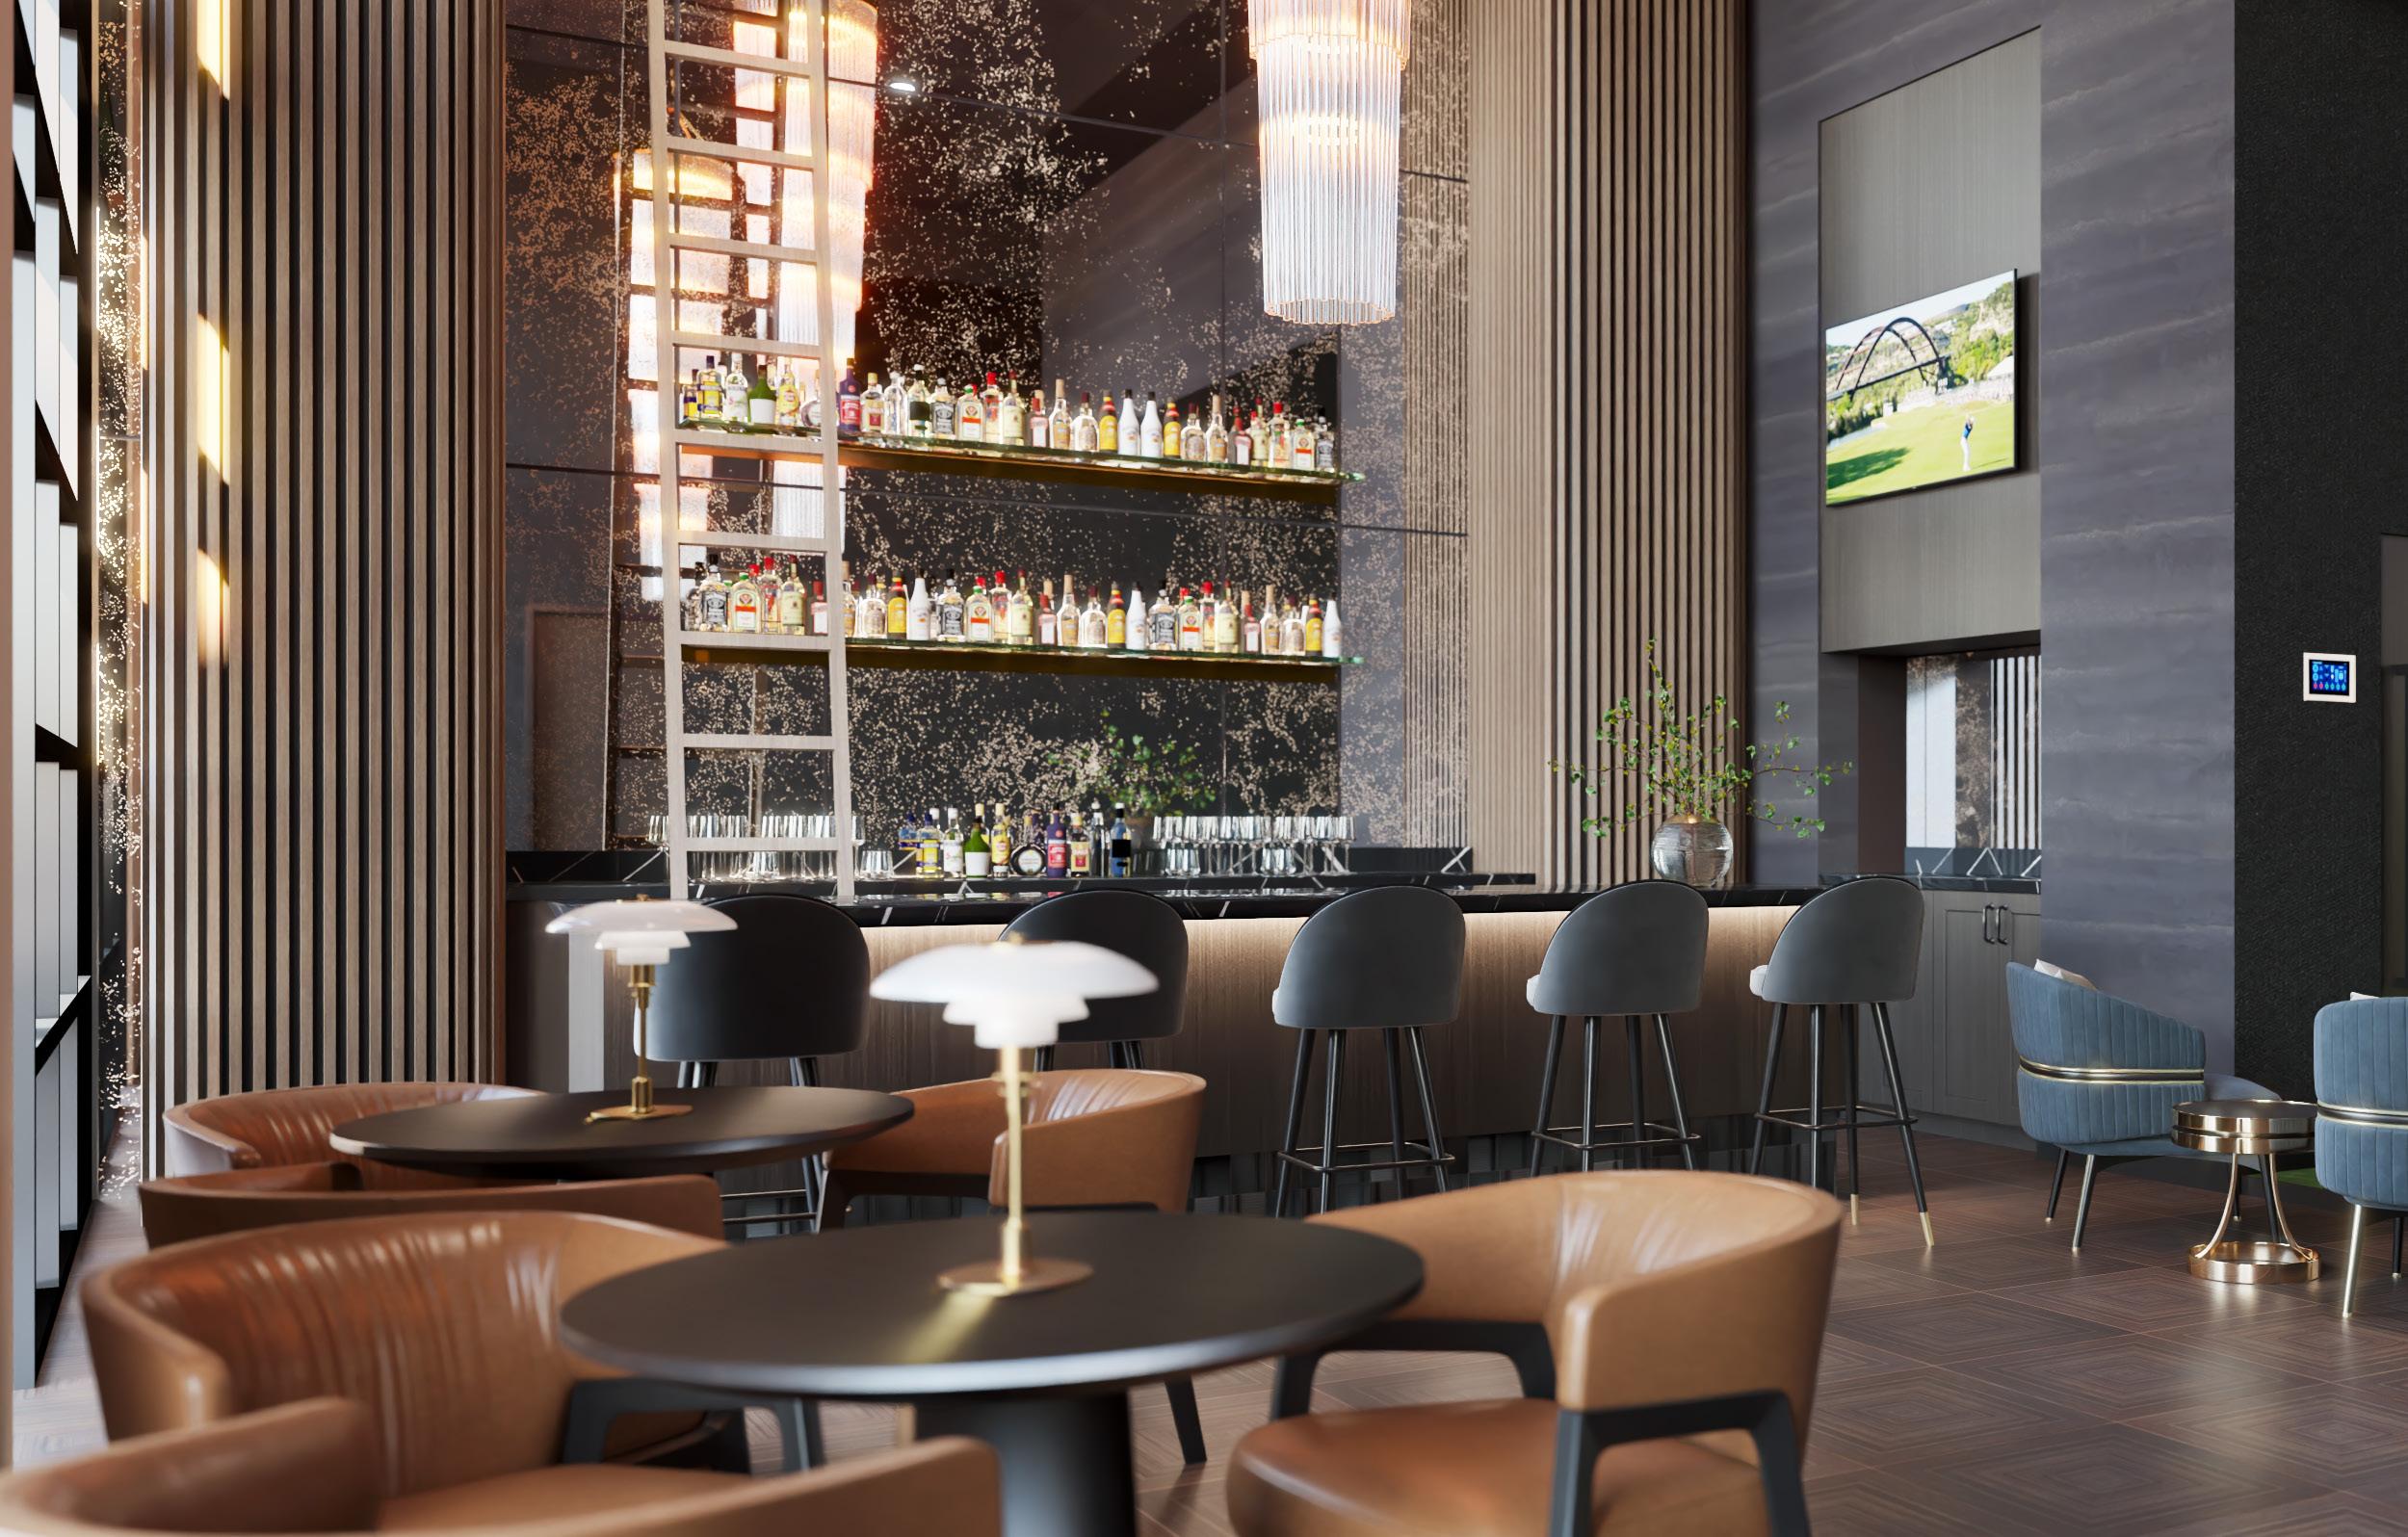
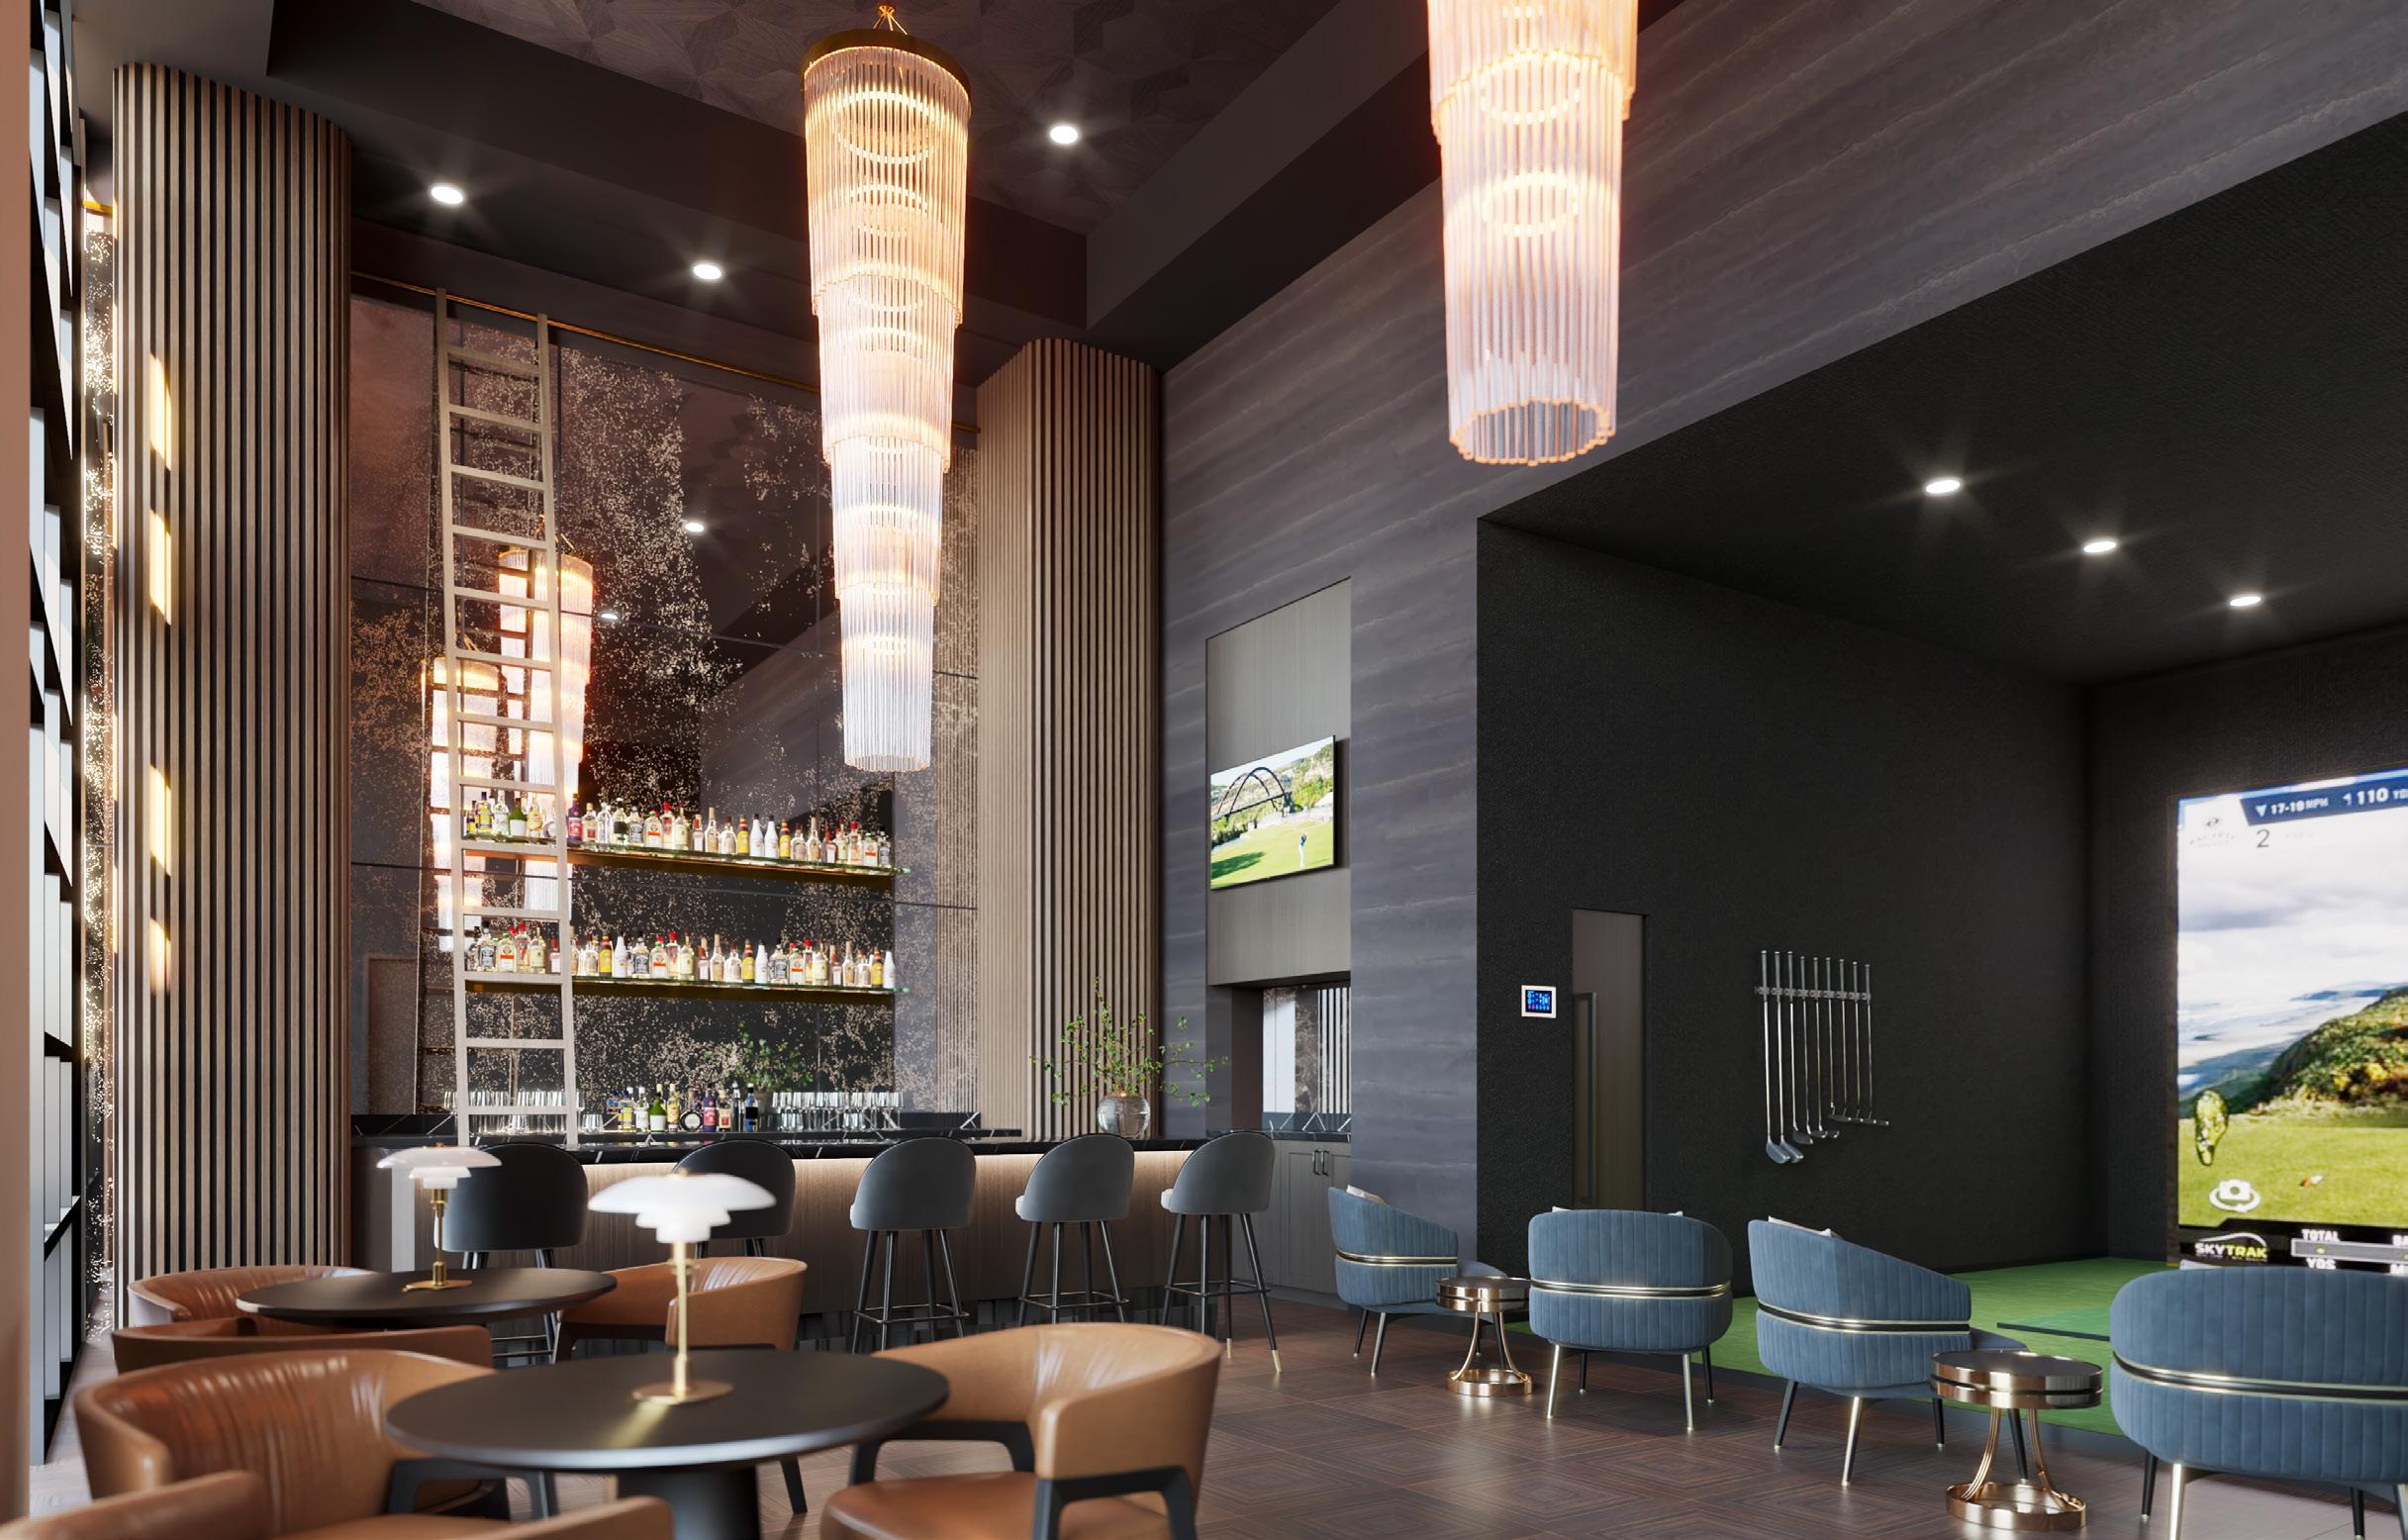
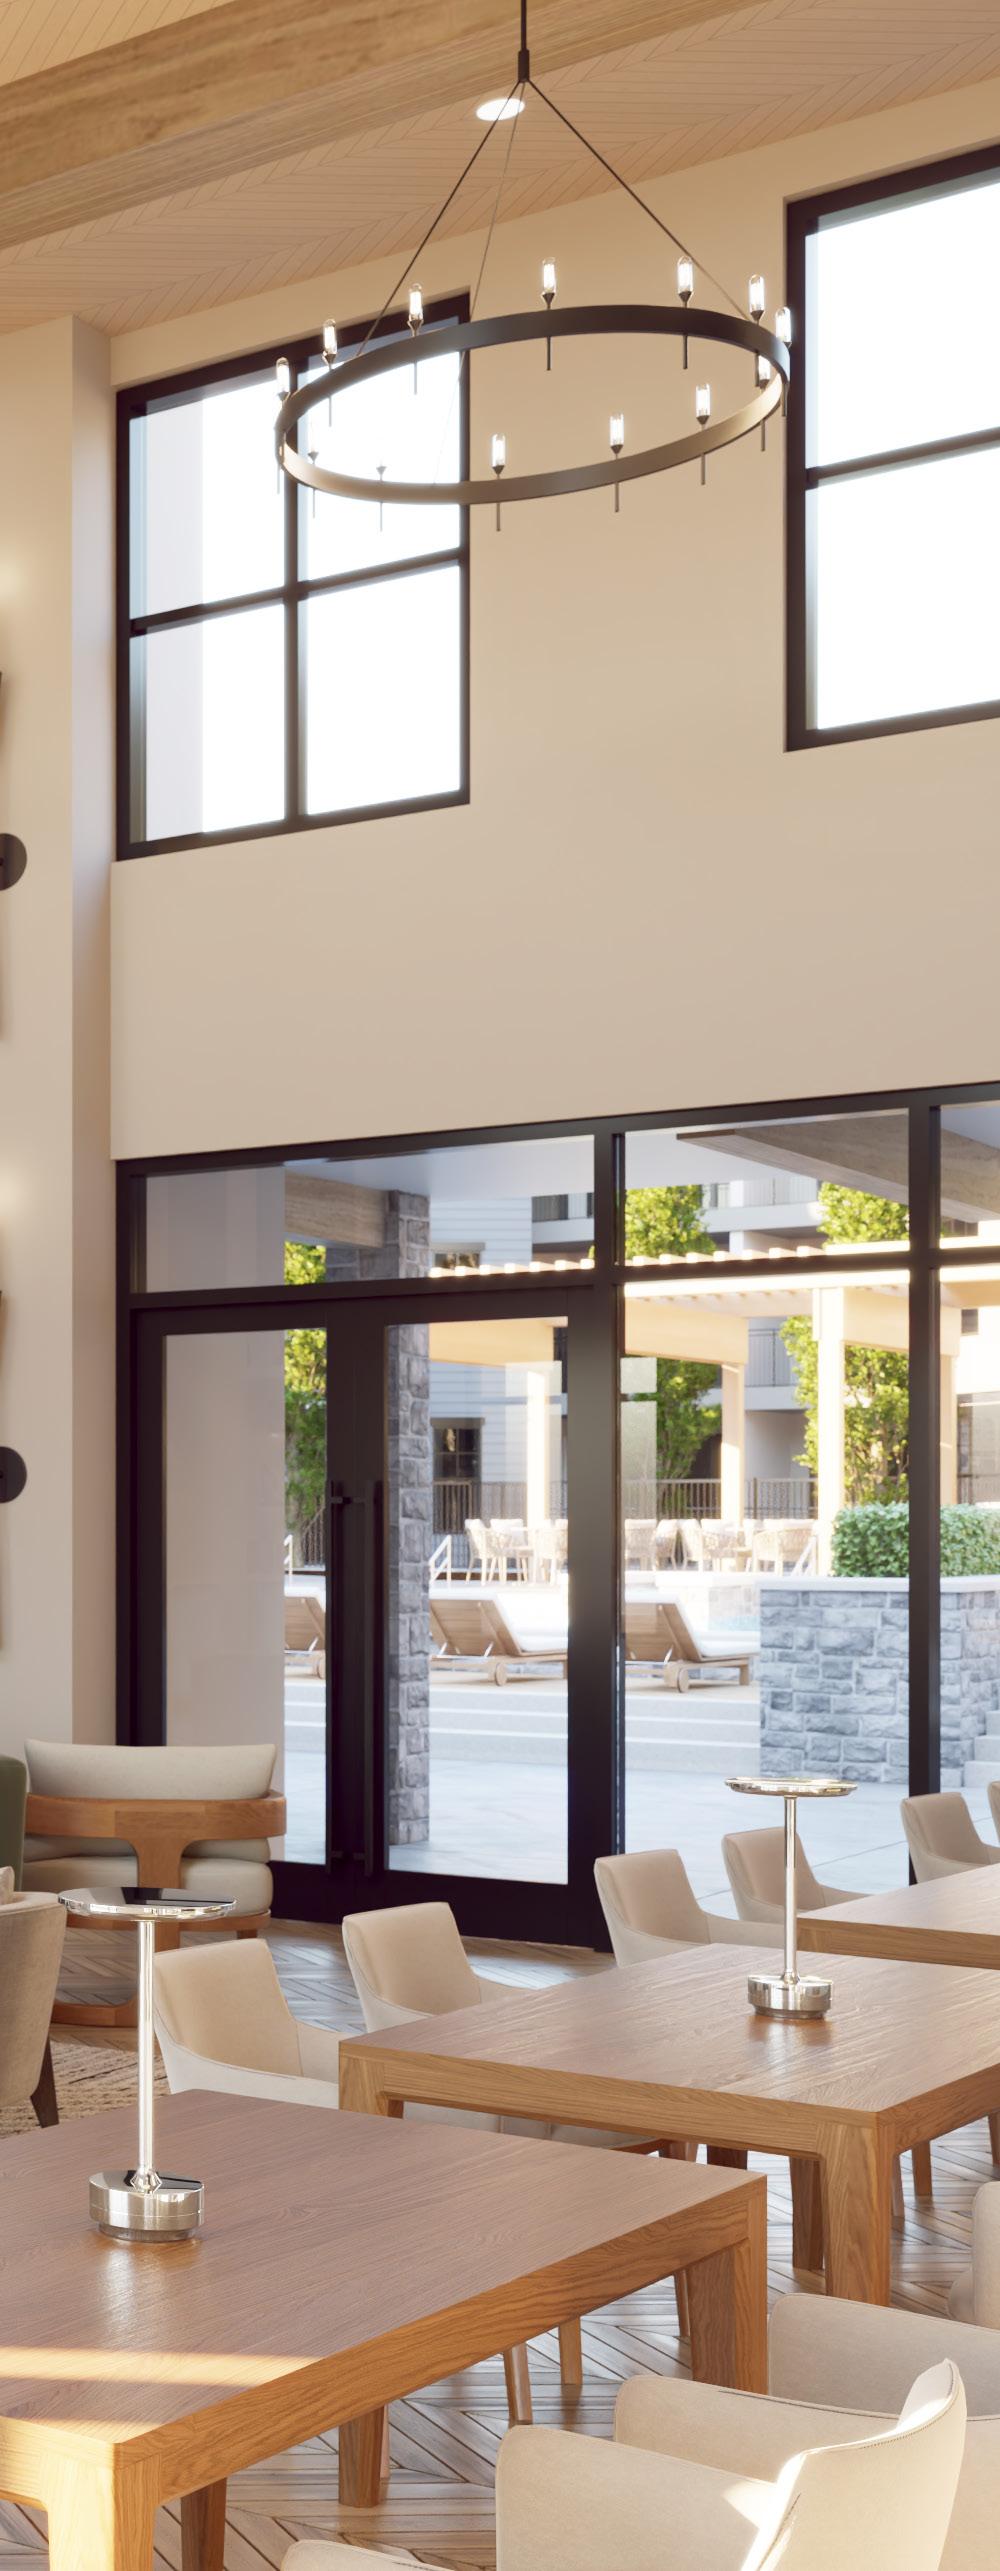
Amenities
Residents need to have access to the latest in amenities, promoting healthy living through both health and wellness. Wellness services include yoga and Pilates, spin classes and resistance training to art and ceramic classes. Also available will be wine bars, local taps, coffee bistros, and multiple dining venues with professional chef kitchens, and master grilling stations for a complete culinary experience. A further description of amenities can include:
• Multi-purpose room for theatre, academics
• Bistro/grab-and-go
• Event/demonstration kitchen
• Extensive fitness/yoga
• Library with research center
• Salon
• Fireside lounge
• Game room(s)
• Dog park
• Dog grooming
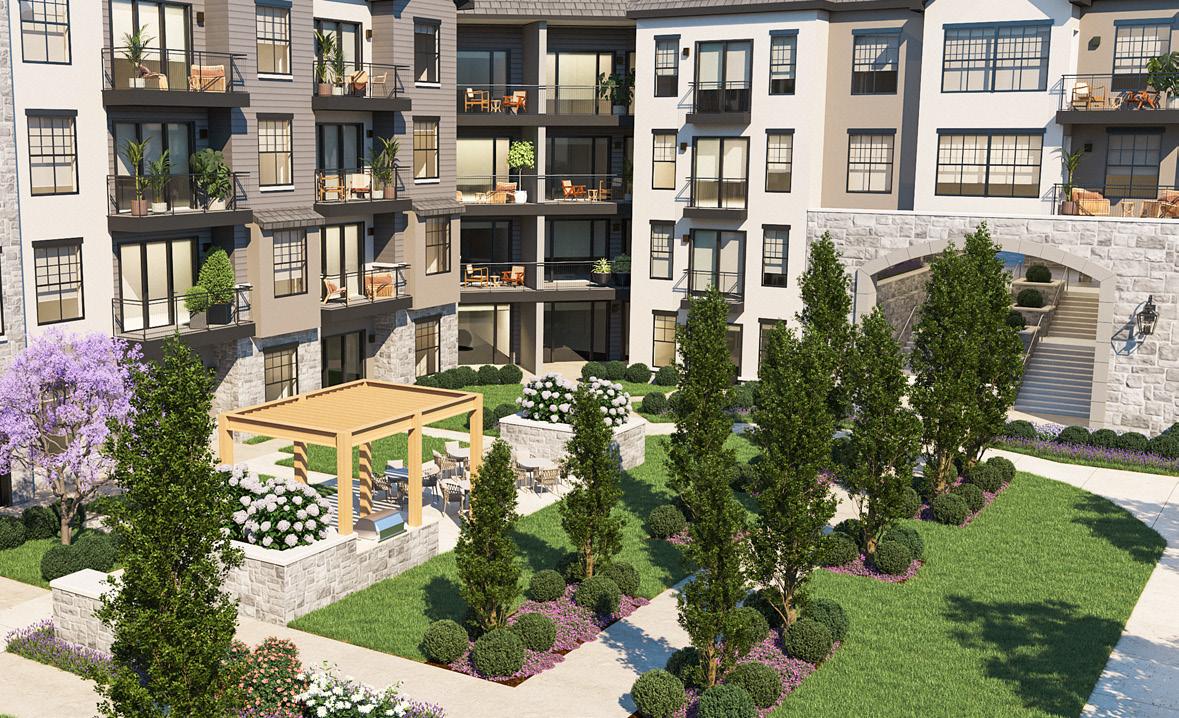
• Outdoor community garden
• Outdoor kitchen and grilles
• Outdoor fire pit/fireplace
• Outdoor gathering spots
• Outdoor pool designed for water aerobics
• Increased storage quantity and sizes
• Art and ceramic studio entertaining local artists
• Craft beer & wine bars
• Continuing education from local colleges and universities
• Community outreach opportunities & disaster
relief volunteer program
• Transportation through Uber/Lyft


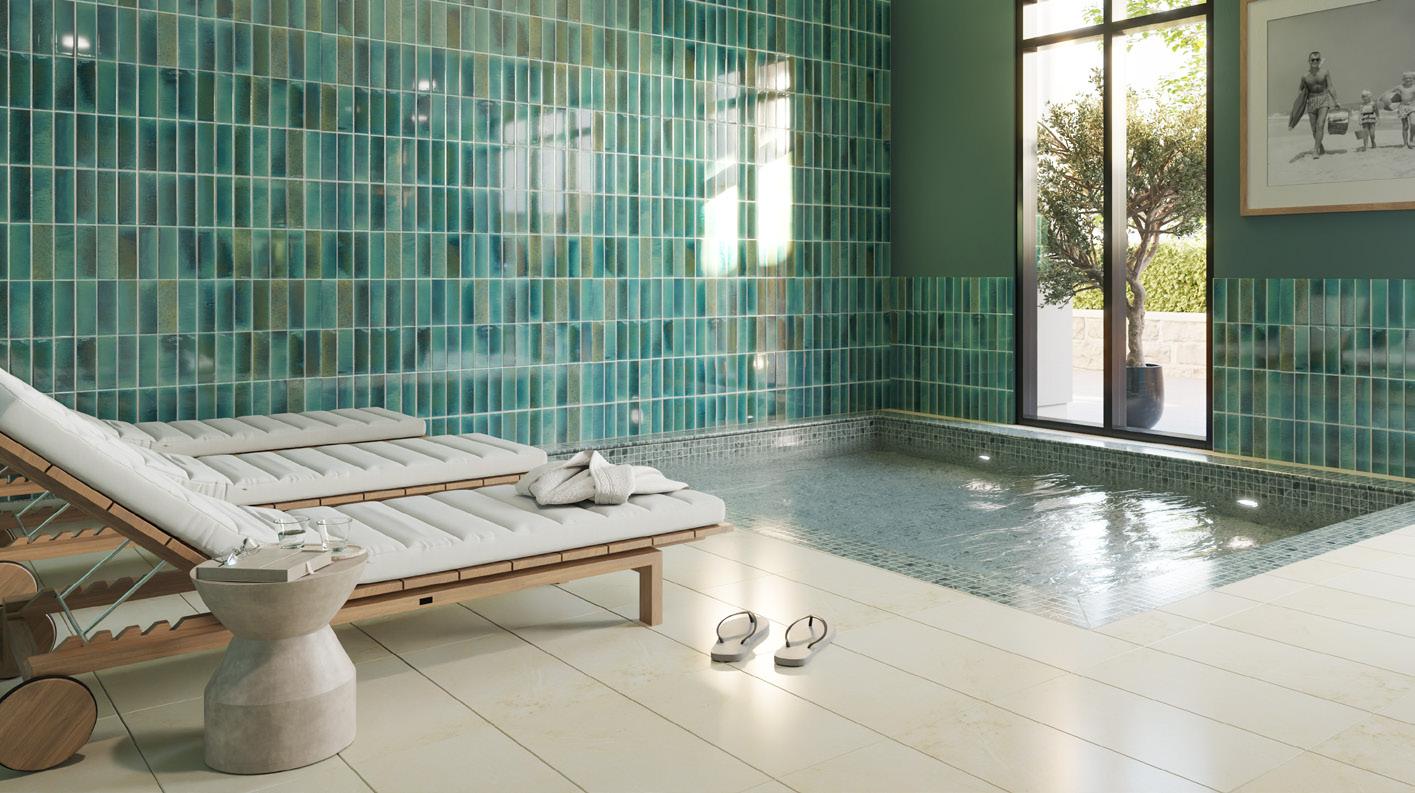
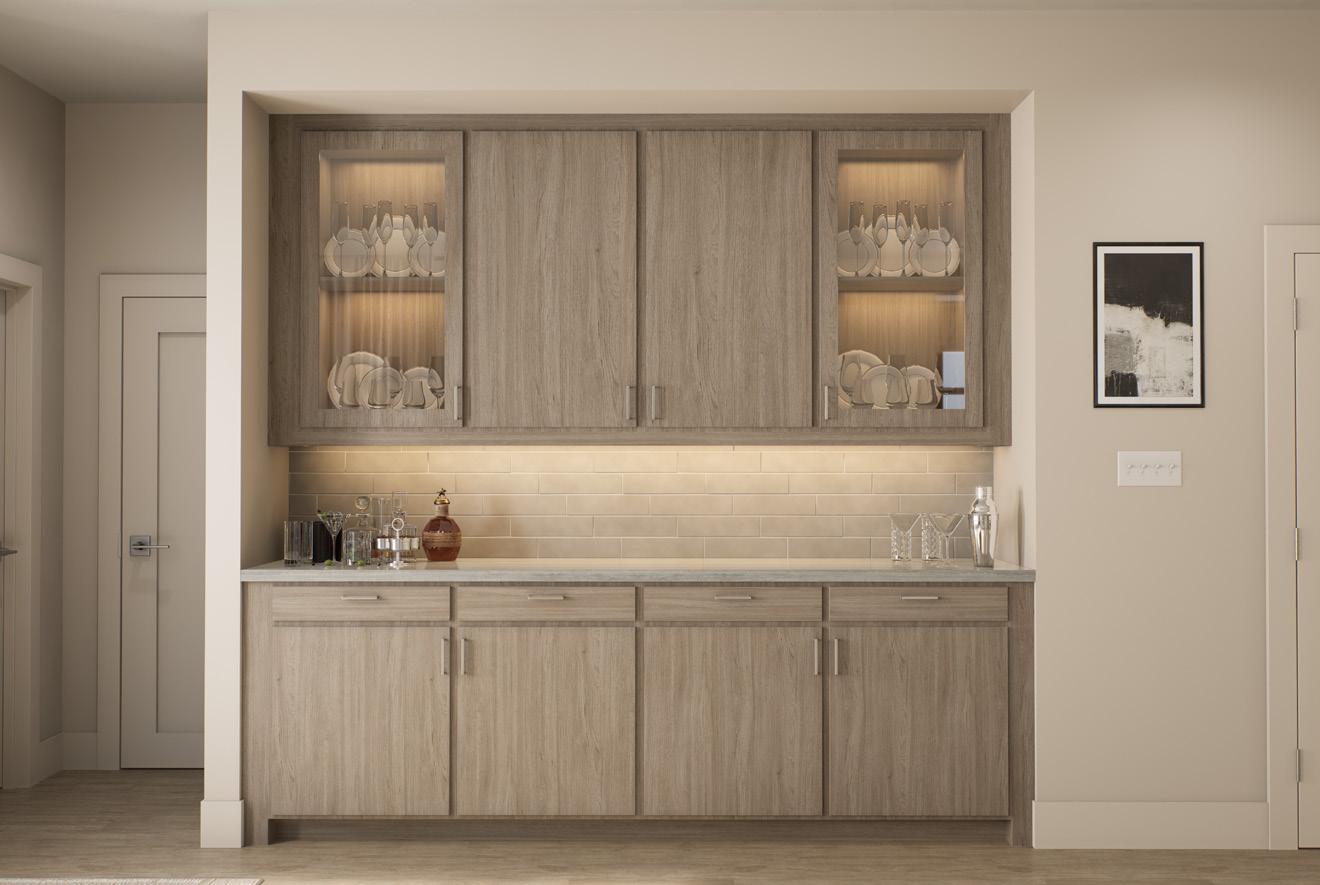
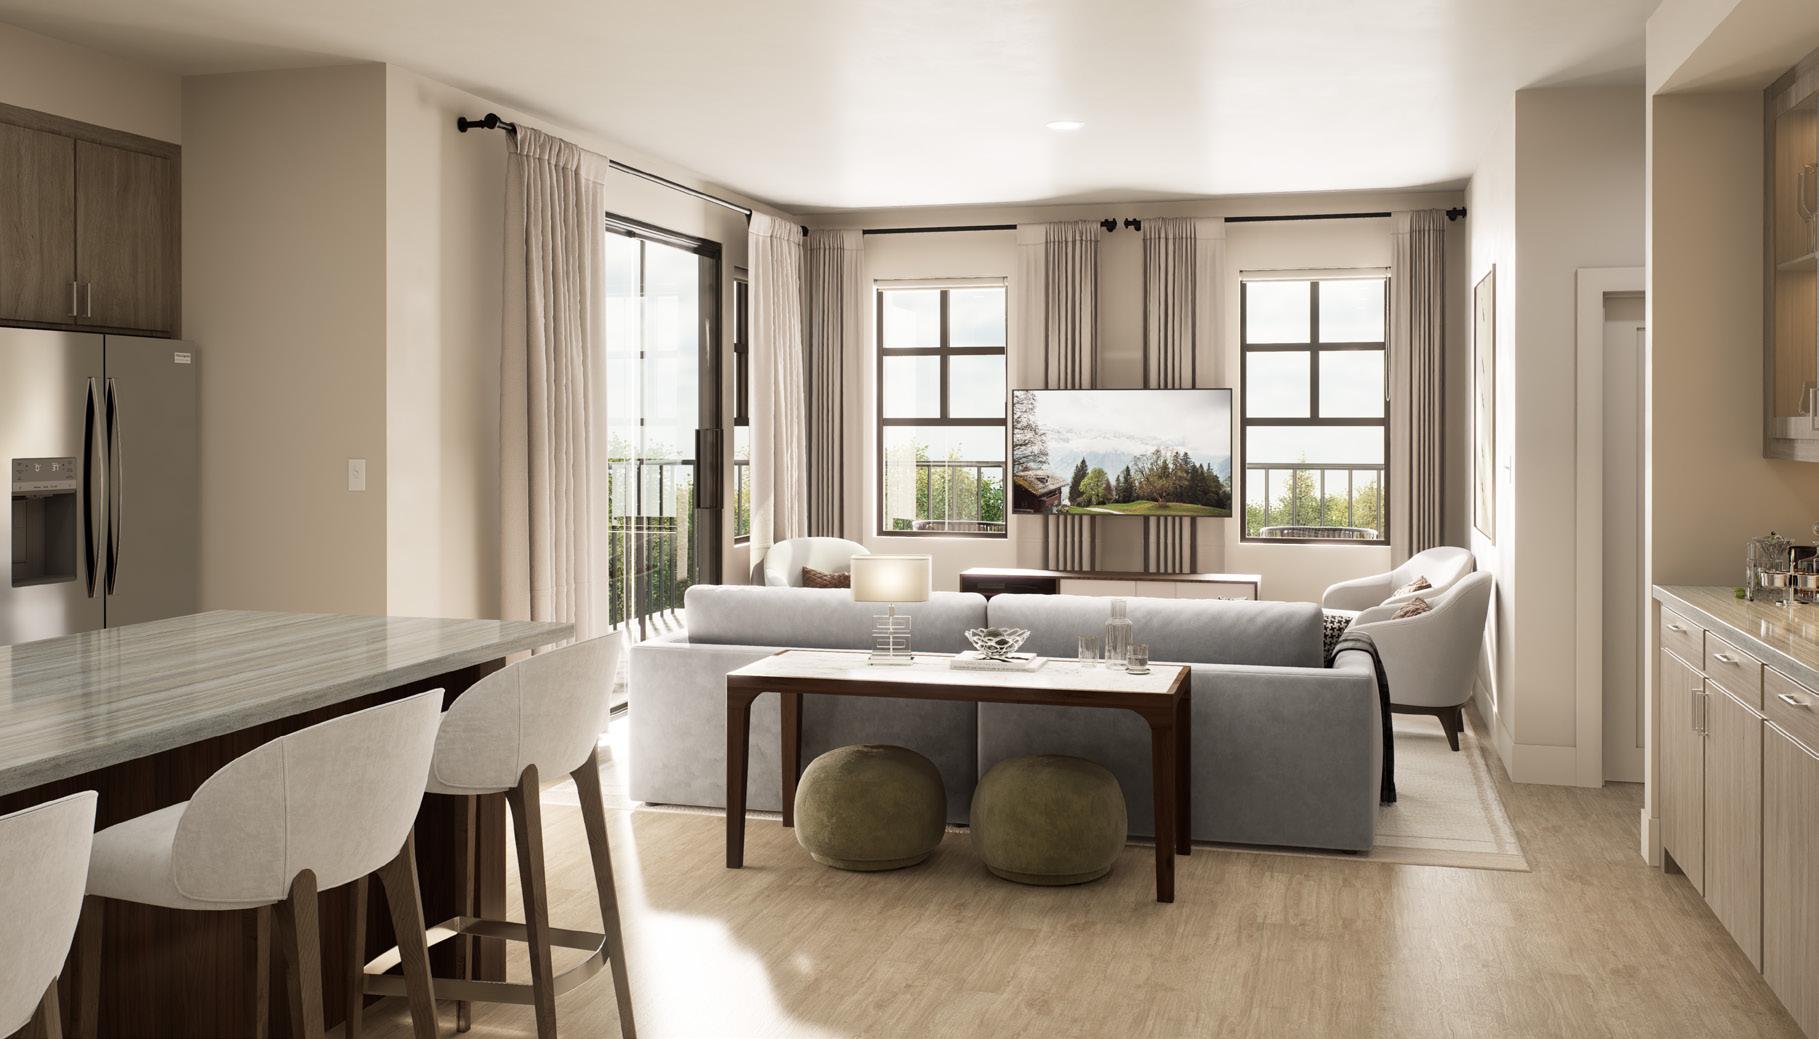
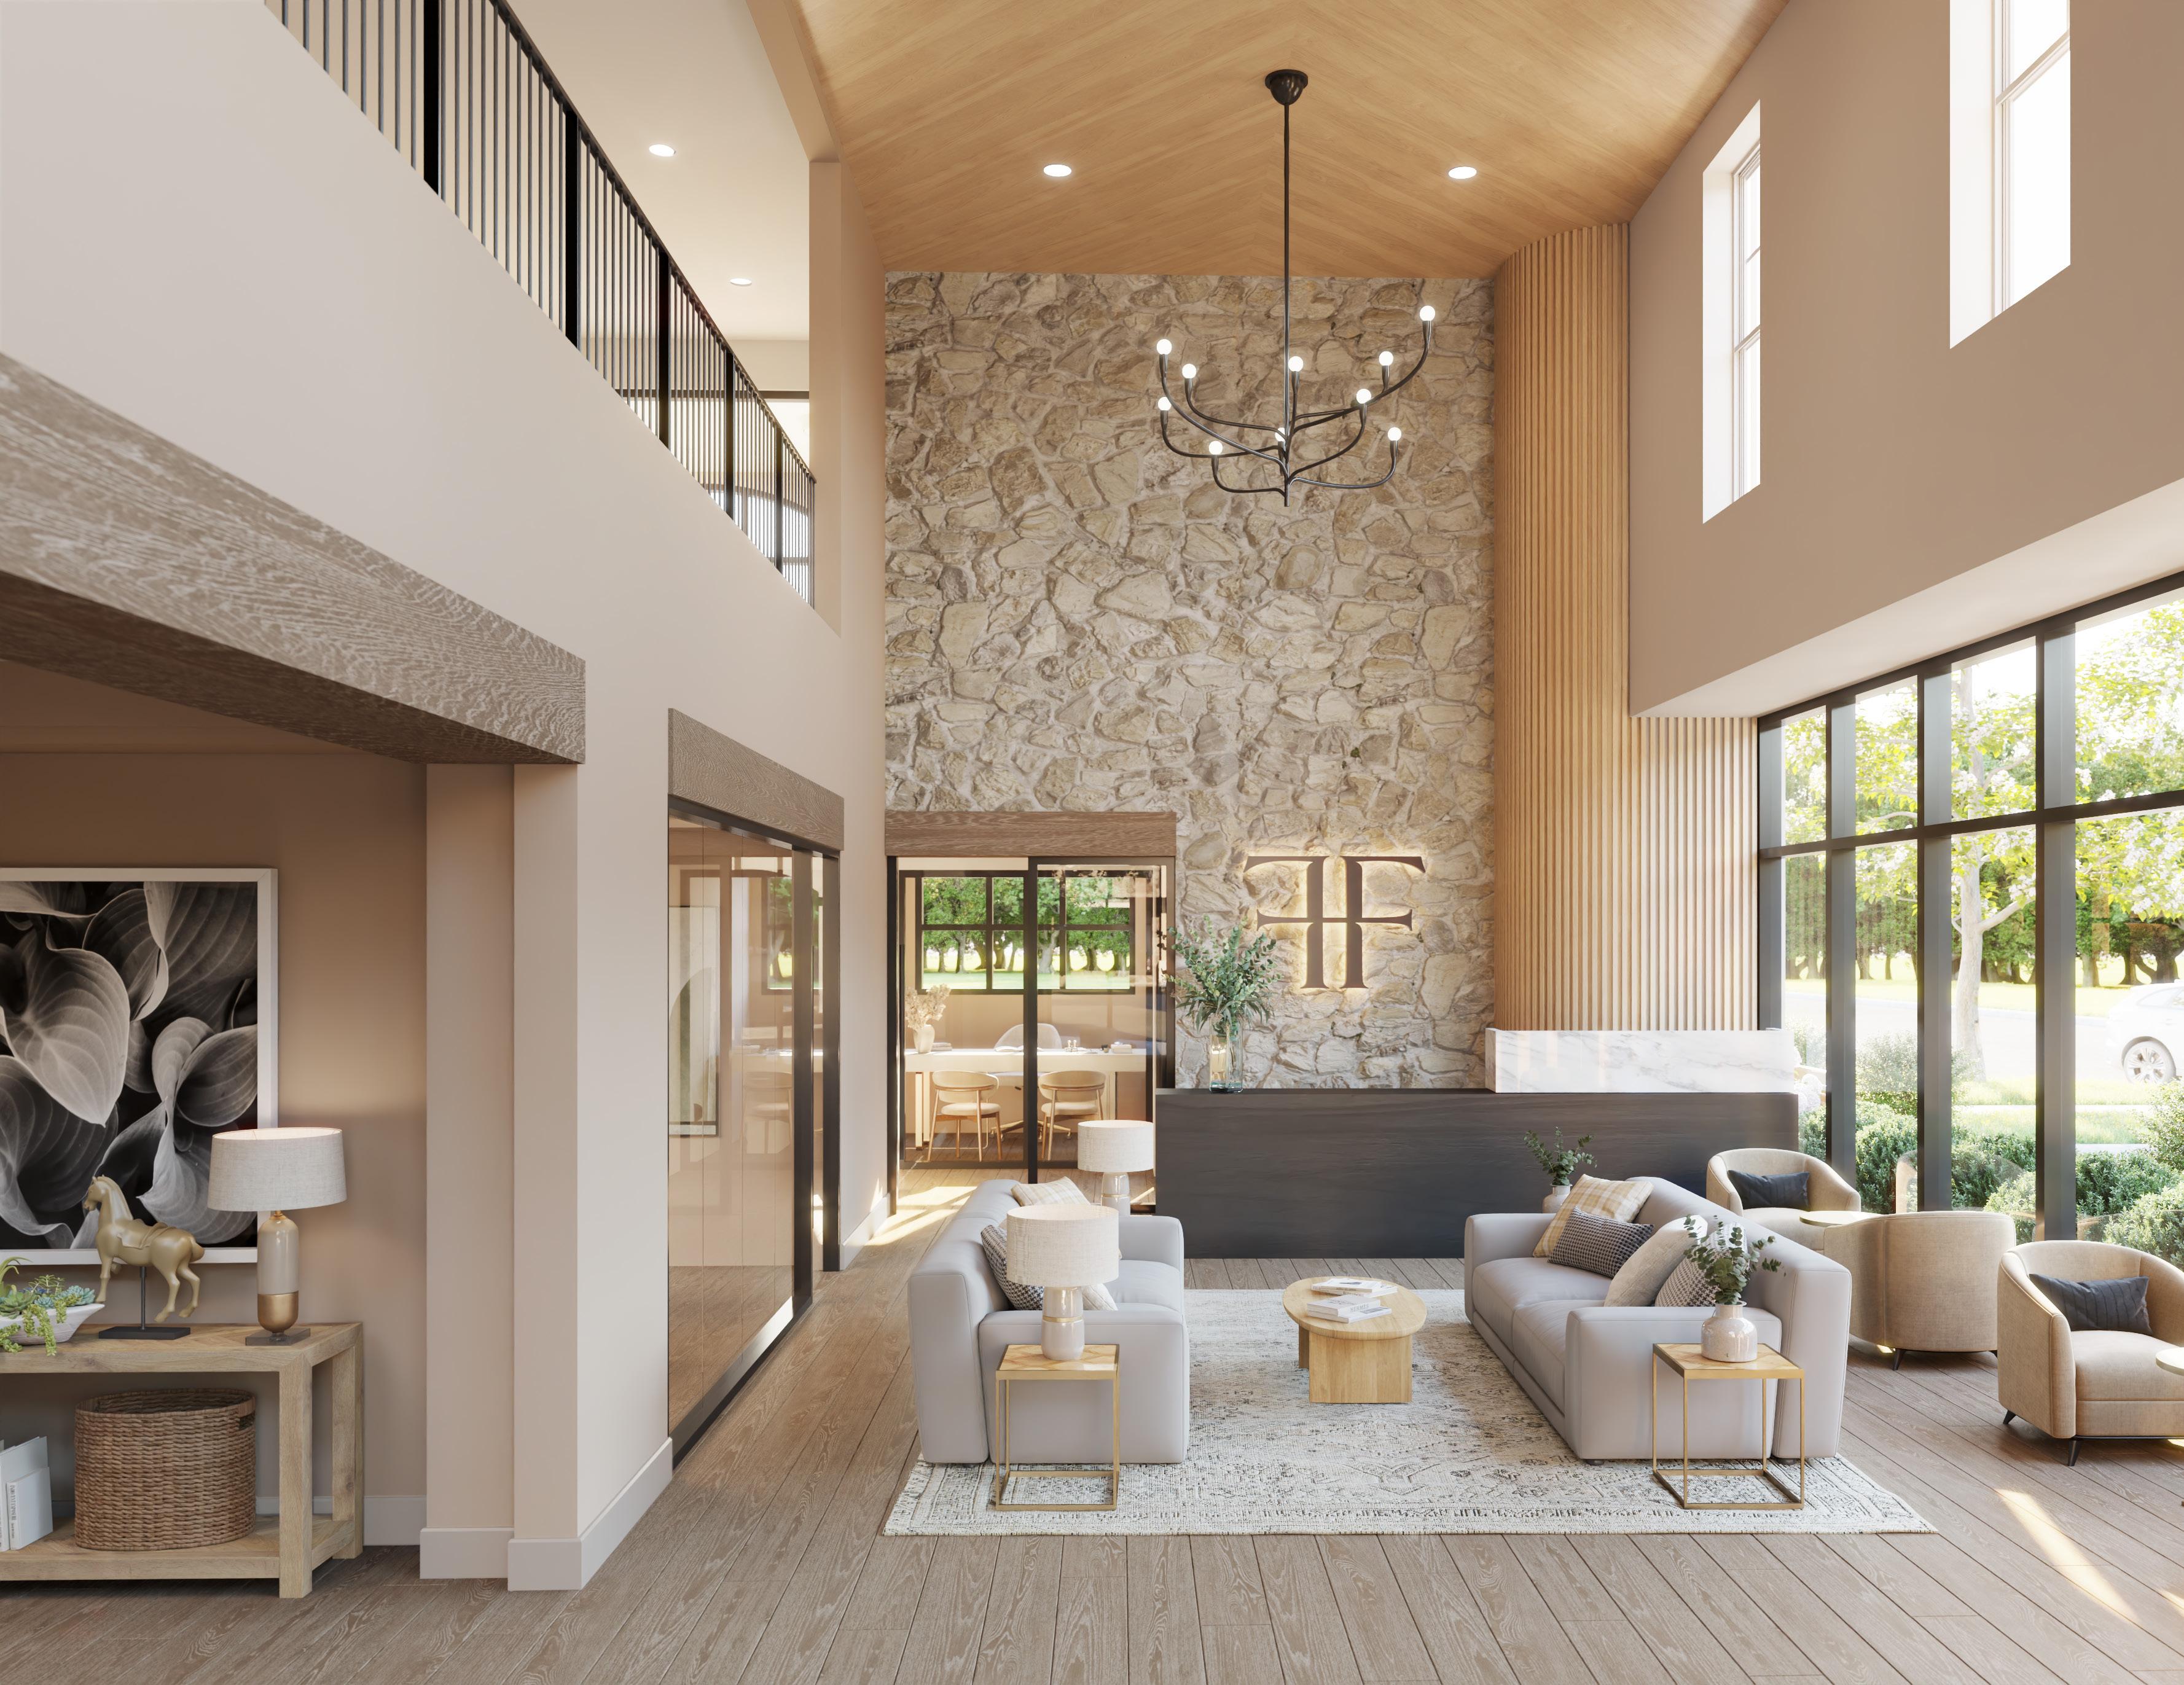
Finishes
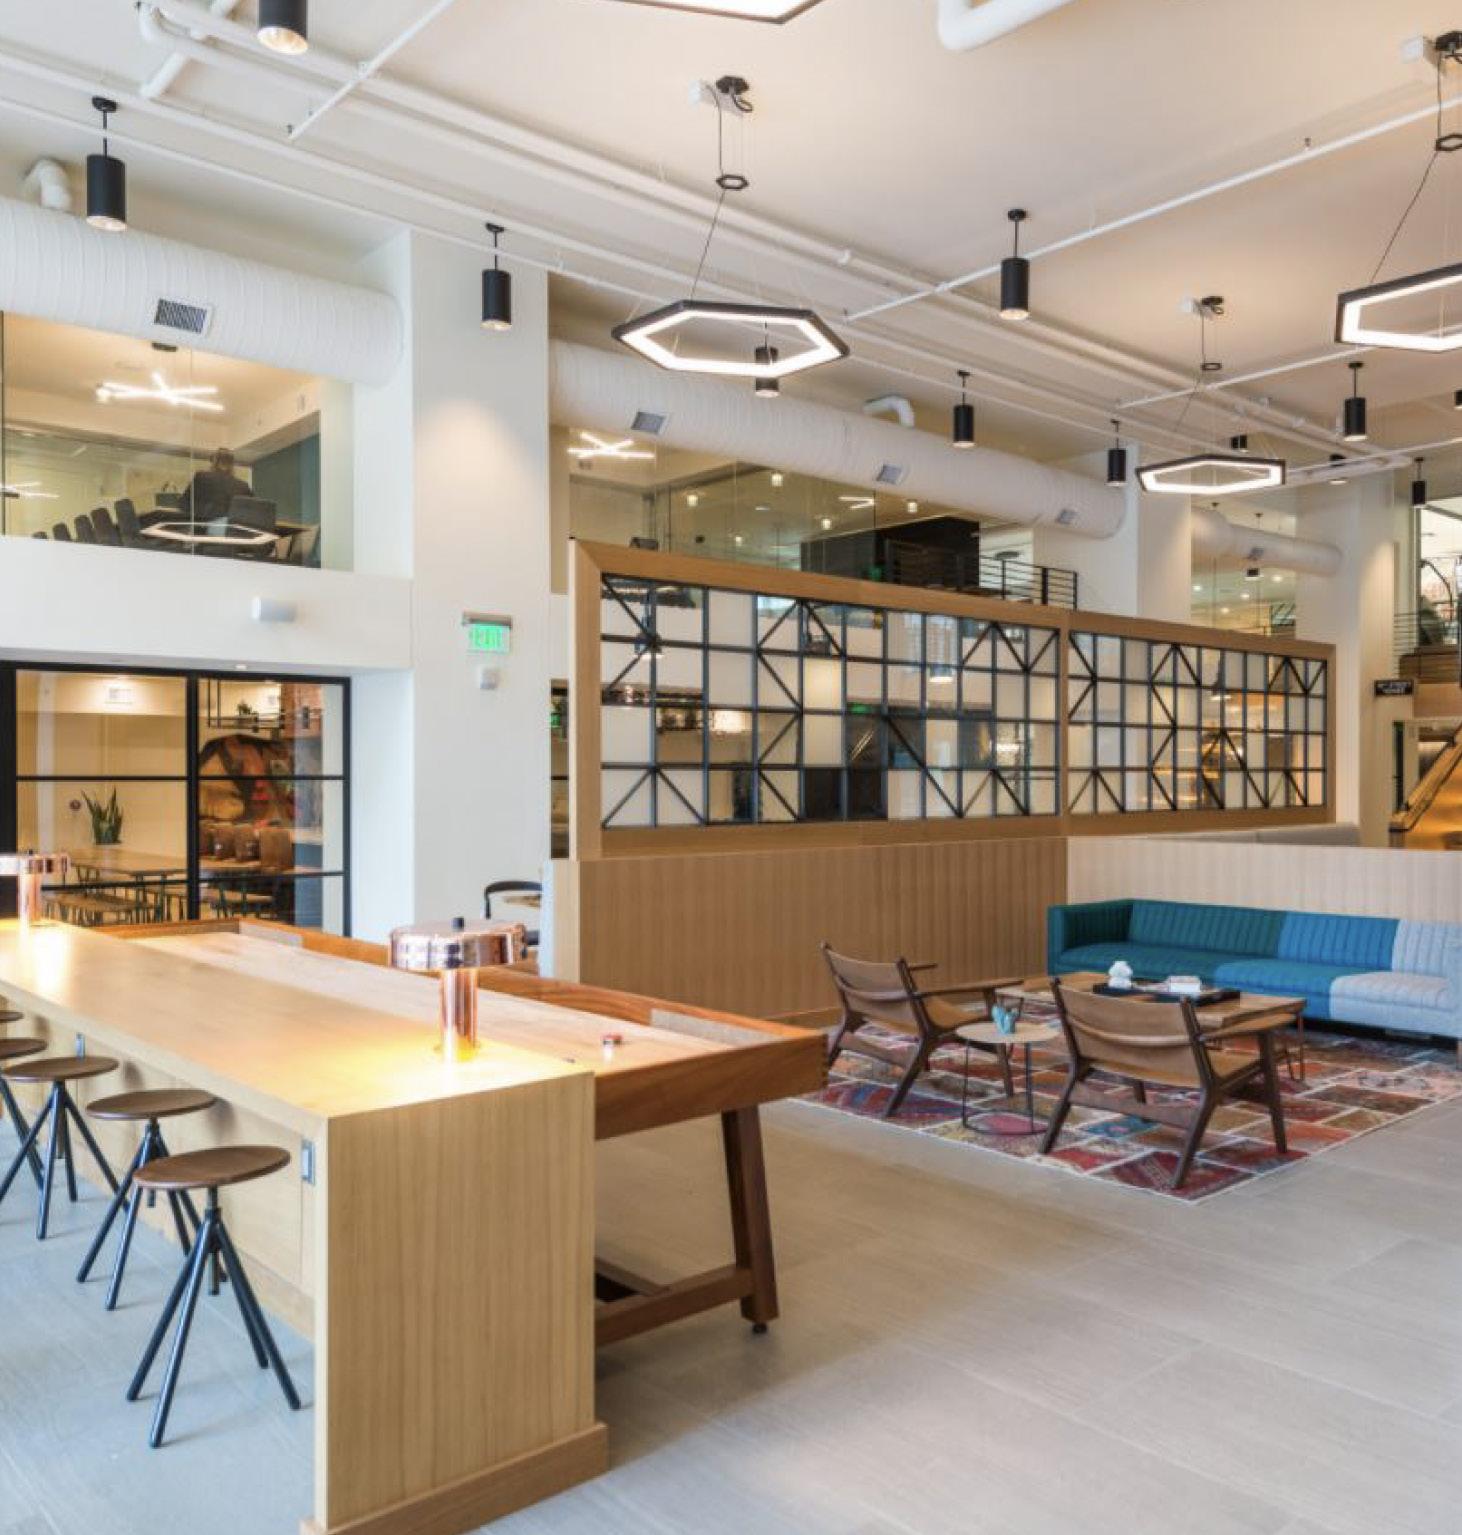
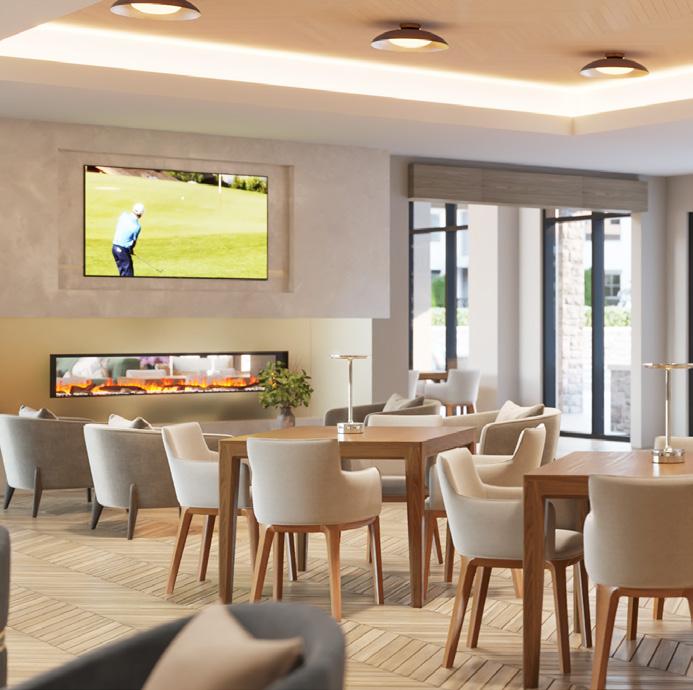
Our team has a high standard for our facility’s interiors. We want to deliver the best to our tenants and have a record of top quality units and common area.
FLOORING: Each project varies slightly as new products hit the market. We make our selections with durability and appearance top of mind. Primarily, the flooring has been wood-like vinyl plank flooring in the kitchen and family room, carpet in the bedrooms, and tile in the restrooms and laundry room.
COUNTERTOPS: As a high quality developer we only use granite or quartz. Primarily, we are currently sourcing quartz, but this is constantly threatened by tariffs. We have partners we work closely with to fabricate counter tops overseas in controlled facilities where we can change 1% of the aggregate mix to avoid certain tariffs. Timing of purchase will guide this selection.
HARDWARE, SINKS, ETC: Similar to above, we have proprietary sources and also work closely with sub trades to get the most current looks and best value. Since these are showpieces of a unit, we are always top of the market and due to bulk purchasing for all of our properties we get preferred pricing.
Our interior designer will collaborate with Hoefer Welker to ensure the best applications are selected at the right price point for our target demographic. Below and on the following page are examples of recent projects that are representative of typical unit and common area finishes.


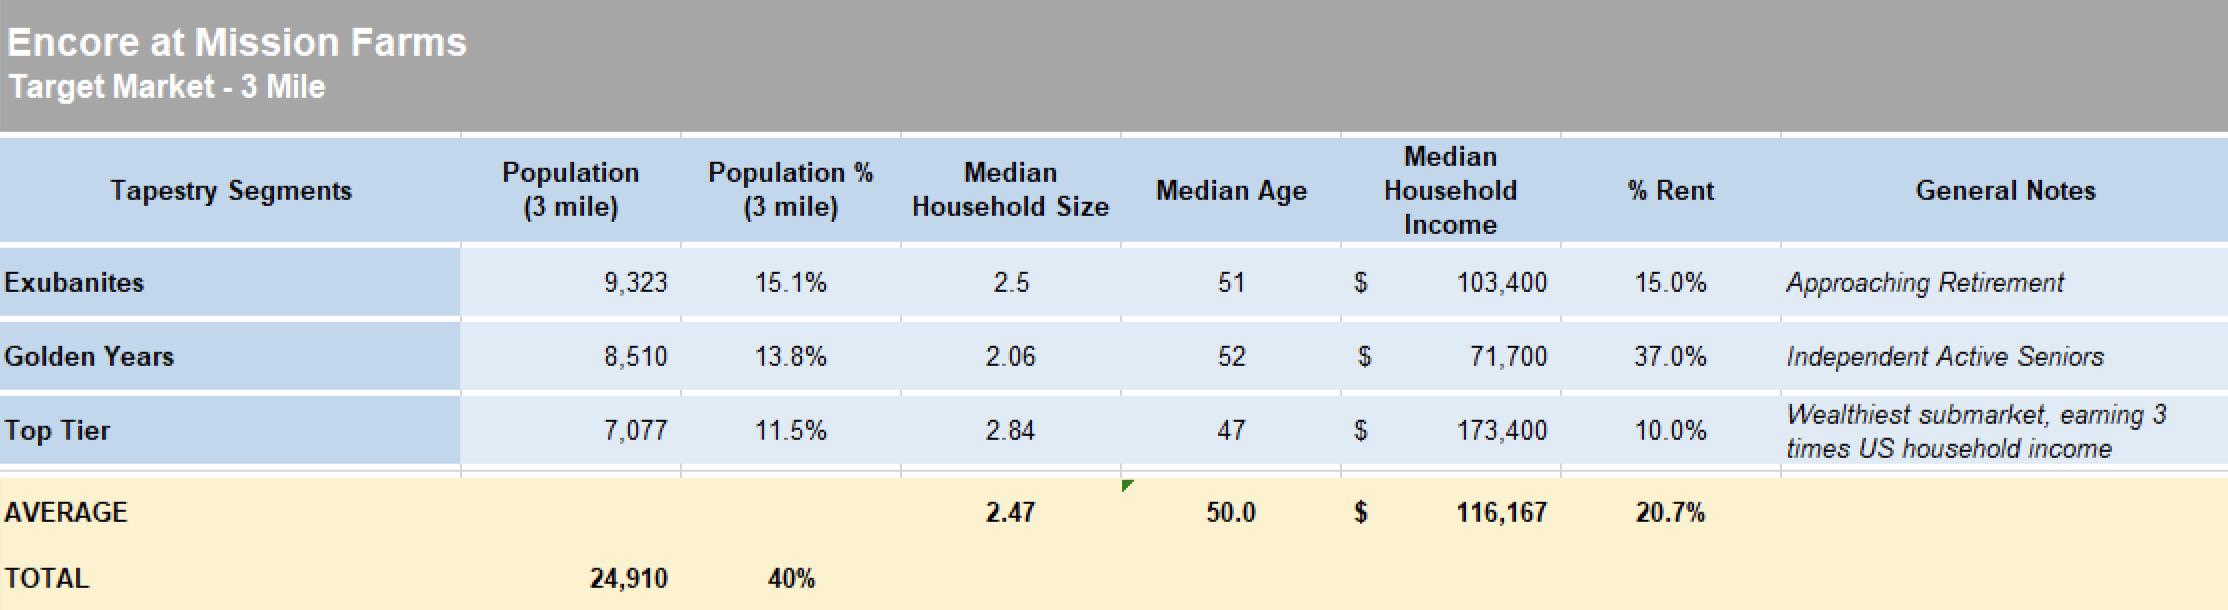
Renter Profile
The mix of lifestyle and economics are pushing healthy, young baby boomers to cons ider alternative housing options shifting away from either a single-family home or traditional senior living. Many 55+ boomers want what senior housing offers but don’t want or need to pay for a care component or meals. They are attracted to an environment that is wellness-based and sociallydriven but with greater flexibility. EPC believes Active Adult apartments are the answer.
“Consumer interest is rooted in a senior’s desire to strip away the cost, responsibility and commitment of home ownership and experience an entirely new option. While single-family homes are often isolating and lifestyle redundant day-to-day, the Active Adult environment is designed to be invigorating, collaborative and stimulating at a very competitive cost”.
Age targeted multi-family apartment communities are just beginning to be offered around the country. Unlike traditional senior living, active adult apartments are a separate product type with a different consumer base and unique benefits and risks.
“Active Adult” is different than independent living (IL). The word “senior” is eliminated because it consists of a younger and healthier cohort that dislikes thinking of themselves as senior. Conversely this group identifies with the term “active”.
SOCIOECONOMIC TRAITS OF TARGET USER
• They have cultivated a lifestyle that is both affluent and urban
• More interesting in quality than cost
• Prefer living in established neighborhoods
• Single and married primarily still working and self employed
• 43 percent of Golden Years live in multi-unit dwellings
• Purchasing power to what they want
• Highly educated
• Live balance lifestyle with time for grandkids and maintain close friends

Section 3
PROJECT ECONOMIC ANALYSIS
Development Budget
ACQUISITION COSTS
Land Costs
HARD COSTS
Site Work
Construction Costs
Hard Cost Contingency (3%)
Sales Tax Exemption
SOFT COSTS
Architectural / Engineering / Design
FFE, Gov Fees, Market Study, Startup
Legal
Marketing
Taxes
Insurance
Construction Financing Costs
Soft Cost Contingency (3%)
$5,650,000
$1,963,762
$50,536,253
$1,458,749
($1,911,279)
Total Hard Costs: $52,047,485
$1,676,500
$1,714,147
$200,000
$230,500
$300,000
$600,000
$6,016,156
$344,998
Development & Construction Management
TOTAL EST PROJECT COSTS
$2,000,000
$71,547,747
Costs & Economic Returns

KANSAS CITY MARKET Section
Market Demand Factors
Market Analysis | March 2024
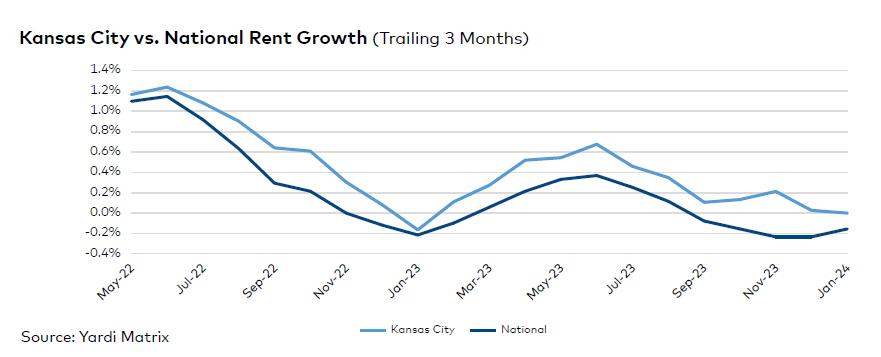
Stable Rent Growth Despite Pipeline Boom
Recent Kansas City Transactions
Taking all economic factors into account, Kansas City multifamily fared well in 2023. The metro recorded moderate rent growth but managed to outperform most of the country last year. On a trailing three-month basis through January, rents were flat, at $1,253, while the U.S. rate was down 0.2%. The metro’s average occupancy in stabilized assets, however, fell 80 basis points yearover-year, to 94.5%, as of January. Both working-class Renter-byNecessity and Lifestyle rates declined.
Kansas City employment expanded 2.4%, or 14,400 net jobs, in the 12 months ending in November, 20 basis points above the U.S. rate. The government sector led growth, with 10,400 positions added, for a 6.3% increase. The area’s unemployment rate stood at 2.5% as of December, 120 basis points lower than the U.S. average, according to preliminary data from the Bureau of Labor Statistics. A longer-term boost could come from the development of a $2 billion new ballpark, announced by the Kansas City Royals.
Developers had 8,236 units underway as of January across metro Kansas City, with an additional 53,000 units in the planning and permitting stages. The number of construction starts doubled in 2023, with 5,119 units breaking ground, up from 2,505 in 2022. The sales slowdown continued, with multifamily deals totaling just $414 million in 2023.
RENT TRENDS
➤ Kansas City rents plateaued on a trailing three- month (T3) basis through January, at $1,253, while the U.S. rate was down 0.2% during the same time frame. Year-over-year, rates were up 3.4% as of January, placing the metro fourth among major U.S. metros. Meanwhile, the na- tional figure improved just 0.5%, to $1,710.
➤ The average rent in the working-class Renter- by-Necessity segment recorded a small uptick on a T3 basis, up 0.1% in January, to $1,047. Meanwhile, the Lifestyle figure plateaued, at $1,509. RBN asking rents have been on a steady rise over the 12 months ending in Janu- ary. Meanwhile, Lifestyle numbers were in neg- ative territory in January (-0.5%) and February (-0.2%) of last year, on the tail end of a harsher seasonal slowdown.
➤ The metro’s average overall occupancy rate in stabilized properties stood at 94.5% as of Janu- ary, an 80-basis-point decrease in 12 months.
The Lifestyle rate recorded a 50-basis-point decline, to 94.7%. Meanwhile, occupancy in the RBN segment fell to 94.2%, down 100 basis points in the 12 months ending in January.
➤ Growth was clear across the map as of Janu- ary. Of the 42 submarkets tracked by Yardi Matrix, all but one recorded year-over-year rent improvements. The exception was Blue Springs, where the average was down 0.4%. Some of the metro’s most expensive submarkets saw consis- tent yearly gains, including Downtown Kansas City (2.9% to $1,596), Lenexa (5.2% to $1,469) and large swaths of Overland Park.
Market Demand Factors
10 Most Affordable US Markets
By Anca Gagiuc
Before the health crisis, metros located farther from gateway cities offered more attainable rents. Then the work-from-home trend morphed into a new way of living. Eliminating daily commutes enabled people to redesign their lives and suddenly, housing affordability improved, as long as relocation was considered.
City Kansas City was the most affordable major multifamily rental market, with the average RBN rent at $1,031 as of March, up 1.5% on a T3 basis and 8.0% above the rate posted in March last year. Here, RBN rent payment accounted for 23% of the area median income, the lowest rate in this group, on par with Cincinnati and Pittsburgh. In 2023 through April, deliveries represented 0.6% of total stock, on par with Cincinnati. Last year, the metro’s stock expanded by 0.9%.

Kansas