Spectral

CT Clinical case collection

Acknowledgement from contributing authors
“We wish to thank the following individuals for their assistance in bringing this book to publication: Begüm Demirler, MD, Department of Radiology, Dışkapı Yıldırım Beyazıt Education and Research Hospital, Ankara, Turkey, currently working at Cliniques Universitaires St-Luc in Brussels-Belgium, for her wonderful and meticulous job of collecting and editing clinical cases; Alain Vlassenbroek, PhD, Physicist at Philips, for his technical advice and enthusiasm; and Ronda Bruce, CT Marketing Manager at Philips, for her professionalism and help with the editing and publication process.”

Special focus
The future of spectral CT
Authors: Philippe Douek, Salim Si-Mohamed, Monica Sigovan, Loic Boussel
3 5 22 46 68 108 130 Spectral CT in head and neck disorders Authors: Jan Borggrefe, Nils Große-Hokamp Spectral CT in thoracic disorders Author: Emmanuel Coche Spectral CT in cardiovascular disorders Authors: Wang Yining, Zhengyu Y. Jin, Robbert W. van Hamersvelt, Tim Leiner Spectral CT in abdominal disorders Authors: Etienne Danse, Begum Demirler Simsir, Emmanuel Coche Spectral CT in musculoskeletal disorders Authors: David Maintz, Victor Neuhaus 146 162 182 Spectral CT in emergency department Authors: Begum Demirler Simsir, Emmanuel Coche Spectral CT in oncology Authors: Maria Barata, Celso Matos Spectral CT in radiation oncology Author: Thomas Merchant Contents Introduction Author: Emmanuel Coche 6 194 Technical aspects of spectral CT Author: Alain Vlassenbroek
Clinical evidence
Clinical case collection

Introduction
Dual-energy computed tomography (DECT) was first discussed in 1973 by Sir Godfrey Hounsfield.* In the last decade, CT vendors have introduced different techniques for dual-energy scanning following Sir Hounsfield’s approach. These scanning techniques, although promising, have inherent limitations as they require:
• Upfront selection of a dual-energy scan mode rather than a conventional scan mode
• Dose penalties
• Limited scan field of view (FOV)
• Limited gantry rotation time
• Restrictions on patient size
Due to these limitations, DECT was not widely adopted and found only slow inclusion over the years of select protocols (e.g., for evaluation of pulmonary emboli, kidney stones, and gout) into routine clinical practice.
The Philips IQon Spectral CT is the first and only detector-based spectral CT scanner. Instead of scanning the same slice at two different kVp settings, the IQon Spectral CT uses conventional scanning at a single kVp setting, and differentiates energy levels of X-ray photons after transmission through the patient’s body using a proprietary NanoPanel Prism detector and a novel spectral reconstruction technique.
The unique approach of the IQon Spectral CT to spectral scanning enables every routine CT scan to be a spectral scan, without requiring a prior selection of scan mode, change in workflow, impact on dose, restriction of field of view (FOV), increase in gantry rotation time, or limit to patient size. The IQon Spectral CT increases a radiologist’s diagnostic confidence by providing multiple layers of spectral data that improve tissue visualization and characterization with the potential to expand the clinical utility of CT.
This clinical image case book is a result of a collaborative effort from the growing IQon Spectral CT user community that aims to make spectral CT a standard of care. Together, they have assembled a comprehensive overview of this advanced technology and its applications in different clinical areas.
Cases will also highlight the benefits this technology has provided healthcare organizations around the world, and additional chapters will focus on the future of CT and advanced technology yet to come.
We hope you find the material useful for your practice, and an inspiration to make the switch from routine CT to Spectral CT.
Emmanuel Coche, MD, PhD Head of Department of Radiology, Scientific coordinator of the project Cliniques Universitaires St-Luc, Brussels, Belgium
5
Clinical case collection
*Hounsfield GN. Computerized transverse axial scanning (tomography): Part I. Description of system. BR J Radiol 1973;46(552):1016-1022
Technical aspects of spectral CT 6 Clinical case collection
Alain Vlassenbroek, PhD, CT Clinical Science, Philips Health Systems
Spectral computed tomography (CT) enables improvement of material separation and tissue characterization when compared to conventional CT. Recent developments in scanner and detector technology have revived the interest in spectral CT technology.
Conventional CT scanners use a detector technology with the crucial disadvantage that the detected X-ray photons are integrated, ignoring the abundant spectral information of the polychromatic X-ray spectrum passing through the imaged object. Research work on the separation of the X-ray beam into multiple energy windows shows great promise to further enhance the diagnostic capabilities of CT scanning.1 The most advanced form of spectral CT is enabled by photon counting detectors; highly efficient “low dose” detectors which count each individual incident X-ray and measure the energy of each photon. Photon counting uses narrow selectable sub-ranges (or bins) of the spectrum which can be used, for example, to detect and classify spectral “k-edge” patterns of clinical relevant materials at very low concentrations.2 Early results are extremely promising.3 However, this detector technology is not completely mature yet, is very expensive, and there is limited availability of validated contrast agents for k-edge imaging.
Current clinical spectral CT scanners enable the discrimination between different materials based on the differential X-ray attenuation properties in two “energy bands” of the spectrum instead of averaging the entire polychromatic X-ray beam as with conventional CT. In other words, the spectral dependencies of the net X-ray attenuation can be imaged and analyzed as a material characteristic and can be used to discriminate tissues beyond the Hounsfield unit paradigm. The “dual-energy” information can be obtained using various acquisition methods, each having its own advantages and disadvantages:
• Single X-ray source, dual kVp spin
• Single X-ray source, dual kVp switch
• Dual X-ray source
• Single X-ray source, dual-layer detector 4,5
The following chapter is dedicated to the innovative technological solution of the dual-layer detector technology that is the heart of the IQon Spectral CT, a spectral CT that only Philips offers.
The dual-layer detector
In a single source, dual-layer detector scanner configuration, one X-ray tube is used to expose a detector consisting of two layers of scintillators. The X-ray tube generates a polychromatic beam with a wide energy spectrum, typically from 20 keV up to the maximal photon energy, which is bounded by the selected tube voltage. The typical average energy, corresponding to the weighted average of the spectrum, of a 120 kVp X-ray spectrum depends on the size of the scanned object; in the case of a body scan, it is around 70 keV. The two layers of scintillators are directly on top of one another. The upper layer is made of a low density scintillator (yttrium-based) which is almost transparent to high X-ray energies, while the lower layer is made of a traditional GOS (gadolinium oxysulfide) scintillator which can absorb up to 99% of those high energies.
Introduction
7 Clinical case collection
In practice, a single CT scan is performed (e.g., 120 kVp or 140 kVp), and the first layer (upper) encountered by the X-ray photons absorbs most of the low-energy photons, while the bottom detector layer absorbs the remaining higher energy photons (Figure 1). In contrast to other approaches of dual-energy CT, there is no need to redundantly expose materials with both low and high kVp. Furthermore, since the spectral energy separation is intrinsic to the detection system, rather than sequentially generated at the X-ray source, this approach eliminates the time lag of sequential techniques, making it ideal for imaging moving organs, as in cardiac CT. In other words, the dual-layer technique is fully registered both spatially and temporally, and it has no spatial shift or dead time such as in dual kVp or dual tube techniques. The low- and high-energy projection data are perfectly aligned, enabling projection-based spectral decomposition, and providing the opportunity to properly account for beam hardening effects without the need for spatial or temporal interpolations.6,7
The low- and high-energy measured attenuations can also be combined to provide the attenuation over the entire X-ray spectrum and used to reconstruct a “true” conventional CT image (Figure 1), without the need to compensate for warping and shifting due to the time lags. This is different from the other currently available dual-energy technologies where low- and high-kVp images are obtained and blended to obtain a surrogate “conventional” image data set. The use of a single source also obviates the cross-scatter limitation of dual-source techniques 8 and enables full 50 cm field of view (FOV) imaging.
A schematic illustration of the dual-layer detection system. The upper layer is made of a low density scintillator (yttrium-based) which is almost transparent to high X-ray energies, while the lower layer is made of a traditional GOS (gadolinium oxysulfide) scintillator which can absorb up to 99% of those high energies. The acquisition enables the decomposition of the measured attenuation into the Compton-Scatter-like and photoelectric-like absorption basis. The low- and high-energy measured signals are also combined to provide the signal resulting from the entire X-ray spectrum which is used to reconstruct a “true” conventional CT image. From the spectral base images (SBI), all spectral results can be regenerated at the IntelliSpace Portal (ISP) console. An SBI follows the DICOM standard, and can be stored on the PACS of the hospital and retrieved at the ISP (Philips IntelliSpace Portal) console in the case a spectral retrospective analysis is needed.

8
Figure 1
Clinical case collection Raw (low energy) Material density pairs Virtual MonoE (40-200
Effective atomic number Projection space spectral reconstruction Beam hardening correction Weighted combination Raw (high energy) Conventional CT Spectral CT results
keV)
Photo-E Compton
Spectral base images (proprietary DICOM format)
In summary, with the dual-layer detector technique, spectral CT information can be retrieved from any conventional CT scan, without compromises to image quality or needed modifications to scan protocol parameters (rotation time, FOV, dose modulation, etc.), provided the scan is performed at 120 kVp or 140 kVp.9 Spectral analyses from scans at lower tube voltages still pose technological challenges because of the reduced high energy content of the X-ray beam. The reconstruction of selected spectral CT results from a 120 kVp or 140 kVp scan can be decided prospectively, but can also be obtained retrospectively for every scan. This additional information can be used to fine-tune the diagnosis in the case, for example, of an incidental finding. A missed injection is another typical scenario which cannot be known prospectively, but where diagnosis could be salvaged thanks to the available retrospective spectral reconstruction from the original scan without the need to re-inject and re-scan the patient (Figure 2).
The Alvarez-Macovski model
Attenuation of X-rays in matter at the typical energies used in CT consists of two main components:
• Incoherent scatter: the Compton scatter mechanism
• Photoelectric absorption
The dependency of Compton scatter on energy is reasonably well described by the Klein-Nishina function fc(E). The dependency of photoelectric absorption on energy goes roughly as fp(E)=1/E.3.2
The first investigations of dual-energy methods for CT were made by Alvarez and Macovski in 1976.10 Their main assumption in dual-energy CT (DECT) is that the linear attenuation coefficient µ(E) of all relevant materials can be modeled by the sum of these two mechanisms (Compton-photoelectric), where each component has the universal energy dependency described above (see Equation 1). With this model, the difference between materials is only in the relative weight of each of the above processes. In light materials (low atomic number Z), Compton scatter dominates, while in heavy materials (high Z), photoelectric absorption dominates.
Equation 1
µ(x,y,z,E)= µp(x,y,z,E) + µc(x,y,z,E)= αp(x,y,z)fp(E) + αc(x,y,z)fc(E)
αp =ρZ3.8 and αc= ρZ are the material coefficients, where ρ is the material mass density and Z its effective atomic number. Note that these material coefficients only depend on the material and not on the energy. The energy dependence is completely described by the universal energy functions fp(E) and fc(E) which do not depend on the material by assumption. Equation 1 describes the total attenuation as the sum of the two mechanisms. One simple way to solve Equation 1 and to determine the unknown pair (αp, αc) is to perform two independent measurements of µ(E) at two different energies Elow and Ehigh and to solve the system composed by the two equations (Equation 2) with the two unknown values αp and αc
Equation 2
µ(Elow)= αpfp(Elow) + αcfc(Elow)
µ(EHigh)= αpfp(Ehigh) + αcfc(Ehigh)
9
Clinical case collection
A
referred
CT
breath-hold results in a poor enhancement of the pulmonary arteries on the
CT images.
displays from left to right: monoenergetic 70 keV, monoenergetic 55 keV, monoenergetic 40 keV, and Z effective map showing a perfusion deficit of the lung parenchyma (white arrow). When decreasing the energy, the iodine attenuation is progressively boosted and reveals the presence of a thrombus (colored arrows) in a sub-segmental pulmonary artery corresponding to the territory of the perfusion deficit. (c) Monoenergetic 200 keV reduces beam hardening from dense contrast medium compared to conventional CT images.


10
Figure 2
A C B Clinical case collection
patient
to
for suspicion of pulmonary embolism. (a) A Valsalva maneuver during
conventional
(b) Magic Glass
In other words, Alvarez and Macovski demonstrated that, using a conventional X-ray source having a broad energy spectrum, a dual-energy acquisition enables the decomposition of the measured attenuation into the two-components model, Compton scatter αc and photoelectric absorption αp.
As an alternative, the X-ray attenuation coefficients of any material can be expressed as a linear combination of the attenuation of two base materials, where both materials differ in their photoelectric and Compton characteristics. This process is named ‘material decomposition,’ and it is obtained through a non-linear transformation of the low and high attenuation data.
As Alvarez and Macovski wrote, the optimal material base must be selected phenomenologically taking into account the energy range and the materials the X-ray beam is expected to transverse. If bone and water are chosen as the base materials for the decomposition, the information from the low and high attenuation data can be used to calculate the bone coefficients of the X-ray attenuation. These coefficients can then be used to create a bone image which allows the assessment of bony structures and calcifications. Alternatively, the water coefficients can be calculated to generate a soft tissue image where the bony structures are suppressed and which improves the visualization of structures previously hidden by bony anatomy. Any material pairs can be created from any other pairs as a linear transformation post-decomposition: a change of base. Other pairs of base materials with clinical relevance are iodine and calcium, iodine and water, or calcium and water. In cardiovascular imaging, the iodine images from an iodine-calcium pair can be of primary importance because they can help to better assess the iodinated lumen of the arteries which could be otherwise hidden by the presence of large calcified plaques. The water images from an iodine-water pair are ones in which all of the iodine is removed. These virtual non-contrast images (VNC) synthesize a pre-contrast scan.11,12 The water images from a calcium-water pair are ones in which all of the calcium is removed. These calcium suppressed images (CaSupp) can be used to improve the visualization of the bone marrow edema which is partially hidden by the presence of the bony structures in the conventional CT images.13
We must emphasize that the universal energy assumption is not 100% accurate and is only approximately met, especially at low energies where the photoelectric effect exhibits nonuniversal behavior. Moreover, Compton scattering and photoelectric absorption are not the only interaction mechanisms between X-rays and matter, and a third component: coherent scatter (Rayleigh scatter), although relatively small, cannot be completely neglected. This small coherent scatter influences different materials at different energy regimes. While the contribution of coherent scattering can be included in one of the basis functions, deviations from modeled universal energy dependencies impose generic limitations on all spectral CT systems that are based on dual-energy, regardless the technology used to acquire the dual-energy information. The impact is mainly at the low energy regime where spectral CT results somewhat deviate from theoretically expected values, especially for calcium and iodine.
Conventional CT images
Also sometimes known as “combined” images, in conventional CT images the low- and high-energy measured signals are combined to provide the conventional CT signal over the entire X-ray spectrum, and used to reconstruct a “true” conventional CT image. The generation of true conventional CT images is very useful from the workflow perspective. When a nonexperienced user starts to work with the IQon Spectral CT scanner, the application training usually starts with conventional CT scanning, and the additional spectral information is only
11
Clinical case collection
provided step-by-step and very progressively. This way, radiologists can make their diagnosis as they’re already accustomed to, while appreciating the added value of the spectral information to fine-tune their diagnosis. Recent publications9,14 demonstrated that the introduction of dual-layer detector neither compromises image quality of conventional images, nor increases radiation dose to the patients.
Spectral results
IQon Spectral CT users may plan the reconstruction of any spectral result prospectively in the exam card describing the acquisition/reconstruction parameters of a particular scan protocol. Spectral base images (SBI) can also be reconstructed, which contain the conventional CT together with the basis images, Compton-like (αc(x,y,z)) and photoelectric-like (αp(x,y,z)) images (see Figure 1). From an SBI, all spectral results can be regenerated at the IntelliSpace Portal (ISP) or scanner console. An SBI follows the DICOM standard, and can be stored on the PACS of the hospital and retrieved at the ISP (Philips IntelliSpace Portal) console in the case a spectral retrospective analysis is needed. As an alternative, a light “Spectral Viewer” version, the Magic Glass on PACS (MGoP), can also be installed on the PACS viewing stations. This light spectral viewer enables the regeneration of all the required spectral results in the PACS viewing environment. IQon Spectral CT systems provide a variety of images or spectral results as listed below:
Monoenergetic
Once the pair (αp, αc) is calculated for every voxel, and since fp(E) and fc(E) are known functions of energy, one may synthesize monochromatic images at different energies. These images can be used for routine diagnosis similar to conventional images. With a single scan at 120 kVp (or 140 kVp for obese patients), a dual-layer spectral CT acquisition allows the reconstruction of virtual monochromatic images from 40 keV up to 200 keV, in increments of 1 keV. The minimum of 40 keV was chosen in order to stay above the k-edge of the most common materials including iodine (iodine k-edge = 33 keV). If the scan is performed at 120 kVp, the conventional CT images of a typical-size patient will display an attenuation corresponding to the average of the X-ray spectrum (˜70 keV in a body scan) but with beam hardening artifacts from dense structures (like bones) which are due to the polychromatic nature of the X-ray beam. Since the photoelectric effect is dominant at lower keV, and is relatively high for high Z materials, low keV imaging (below 70 keV for body) can be used to enhance the absorption of high Z material such as iodine (Z=53), compared to the conventional CT images.15,16 This can be of particular interest to enhance the iodine uptake for patients with renal dysfunction, where the total injected volume of iodinated contrast medium is very limited. This attenuation boost can also be very useful in the case of a missed injection (Figure 2a and b). Compton scattering on the other hand is dominant at higher keVs and does not exhibit a strong relationship with Z. High keV imaging will then be of particular interest to minimize the absorption of high Z materials and minimize all types of associated artifacts (metal beam hardening from metal implants, beam hardening from dense contrast medium, blooming of stents or calcium, etc.) (Figure 2c).17,18,19
Virtual monoenergetic images obtained from the IQon Spectral CT scanner have low noise across the entire spectrum of energies,20 and this noise is lower than in conventional images due to the spectral reconstruction processing that includes noise suppression algorithms that make use of the additional spectral information. This provides significant SNR and CNR
12
Clinical case collection
improvements compared to conventional polyenergetic images. The low noise of monoenergetic images at various energy levels makes them usable at all energy levels, particularly at low energies for enhancing vascular contrast or improving lesion conspicuity and at higher energies for decreasing artifacts.
Monoenergetic (Equivalent to conventional CT)
Virtual monoenergetic images at predefined energies that provide equivalent CT number as conventional images scanned at 120 kVp. The equivalent monoenergetic energy depends on the typical size of the scan: 70 keV for body scans, 66 keV for head scans, 64 keV for infant scans.
Z Effective (Zeff)
Effective atomic number. Each voxel is set to a value in the range 5 to 30 representing the effective atomic number of that voxel. Z effective of air is set to zero. For reference, Z effective of water is 7.4, Z effective of cortical bone is 13.2, and Z effective of fat is 5.9. Z effective maps are very sensitive to materials characteristics (Figure 3) and can also be used to display perfusion maps and to identify very subtle perfusion deficits (Figure 2b). The accuracy measured on a Gammex phantom with iodine, calcium, and soft tissue inserts show that the majority of Z effective values are within 0.2 Z effective units and are consistent between 120 and 140 kVp scans.21
Iodine no Water [mg/ml*]
The iodine images are obtained from an iodine-water material decomposition. The image is scaled to iodine quantification in units of mg/ml. The asterisk in the mg/ml* unit indicates that the iodine quantification is only meaningful in regions with iodine uptake.
Iodine Density [mg/ml]
Also referred to as iodine map. This is a quantitative iodine image where voxel values are proportional and scaled to the iodine true concentration in units of mg/ml. Voxels without iodine content have zero iodine and hence are black (Figure 3).
Note: The algorithm includes a low bone removal threshold. Voxels with Ca content below the threshold are classified as containing iodine. The accuracy measured on a Gammex phantom with various concentrations of iodine (up to 20 mg/ml) show an iodine quantification to within 0.3 mg/ml, for both the Iodine no Water and iodine density measurements.21 In clinical conditions, an iodine concentration measurement of 0.5 mg/ml should be considered as the lower threshold for iodine uptake.
Virtual No Contrast (VNC) [HU]
This result imitates a monoenergetic 70 keV CT scan without contrast injection, and is derived from a CT scan with contrast enhancement. The quantified iodine content is translated to an HU number and subtracted from the contrast enhanced 70 keV images.
Note: Because the iodine quantification is based on the two-component model (water-iodine), any deviation from water dispersion is interpreted as nonzero iodine component. In particular, bone (calcium) is interpreted as a mixture of water-like and iodine-like material. The VNC algorithm does not attempt to separate bone and iodine. Therefore, the CT number [HU] of bone in VNC images is roughly half of its value in the original 70 keV image. A study comparing VNC and true non-contrast (TNC) images showed that the attenuation values from VNC in most abdominal tissues are within 10 HU of those obtained from unenhanced images, with the notable exception of subcutaneous fat.11,12 These results demonstrate the potential of VNC images to serve as a surrogate for unenhanced images in some clinical settings (Figure 4).
13
Clinical case collection


14 Clinical case collection
3 (Left)
Patient presented to the emergency department with abdominal pain. The conventional CT does not reveal any abnormality in the gallbladder. In the middle row, spectral attenuation curves reveal two different materials: a first region of interest (purple) with a CT number that is increasing with energy, typical of a low Z effective element (below the Z effective value of water), and a second region of interest (blue) with a CT number that is decreasing with the energy, typical of a Z effective above water. The differentiation between the two materials cannot be performed based on the conventional CT because the two attenuation curves cross each other around 70 keV (where the attenuation is equivalent to the conventional CT). The lower row displays spectral results in the Magic Glass, from left to right: 40 keV image, 200 keV image, iodine density image, and Z effective map. A gallstone is clearly revealed on the 40 keV image and with an inverted contrast on the 200 keV image. The iodine density shows a perfusion defect of the gallbladder wall due to the compression with the gallstone (white arrow), and the Z effective helps us to determine the gallstone composition with a Z effective below 6.5 typical of a cholesterolic composition.

A hyperdense lesion (65 HU) is visible on the right kidney on the conventional CT images obtained after contrast enhancement. The TNC image is shown in the upper right corner. The lower row displays spectral results in the Magic Glass, from left to right: conventional CT image, VNC image, Iodine no Water image, and iodine density image. Comparison between measurements performed on the TNC (55.4 HU) and VNC images (57.6 HU) demonstrates only a minor difference between them (difference = 2.2 HU), showing that the VNC images could perfectly replace the TNC images in this clinical scenario. Iodine concentration measurements in the same region of interest show values of no more than 0.3 mg/ml which can be considered as negligible. In other words, there is no contrast medium uptake in the lesion which can thus be considered as benign. The hyperdensity is of a hemorrhagic cyst.


15
Figure
Figure 4
Clinical case collection
Contrast enhanced structures displayed in volume rendering (VR) obtained from the axial monoenergetic 70 keV images where only the voxels classified as not bone are shown and others appear black. White arrow points to a narrowed left basilar artery.

16
Figure 5
Clinical case collection
Contrast-Enhanced Structures [HU]
Voxels that are not classified as bone show the corresponding HU of the reference monoenergetic 70 keV CT image. Other voxels appear black (Figure 5). These structures can, for example, be used as color overlays placed above other spectral results to enhance the regions with contrast uptake.
Iodine Removed [HU]
Voxels which are classified as not including iodine (above a minimal threshold) show the corresponding HU of the reference monoenergetic 70 keV CT image. Other voxels appear black. Pure soft tissues and calcium are combined in the iodine removed image.
Uric Acid [HU]
Voxels which are classified as including uric acid show the corresponding HU of the reference monoenergetic 70 keV CT image. Other voxels appear black. This image is useful to identify uric acid stones and separate them from calcified stones (Figure 6).
Uric Acid Removed [HU]
Voxels which are classified as not including uric acid (UA) show the corresponding HU of the reference Monoenergetic 70 keV CT image. Other voxels appear black. This image is useful to identify calcified stones and separate them from uric acid stones. UA and UA removed images are complementary to each other and are intended for uric acid/calcium classification. Pure soft tissues appear as part of the UA removed images (Figure 6).
Electron Density [%EDW]
Is a spectral result presenting the electron density (ED) of each voxel relative to the electron density of water (3.34 x1029 electrons x m-3) in units of percent. For example, the expected value for water in these units is 100 [%EDW]. Electron densities may be used as a basic input for radiotherapy planning systems and could be an essential input for the calculation of the proton stopping powers for proton therapy. In conventional CT, the electron densities are estimated by converting a CT image into ED by using a conversion table obtained by use of a calibration phantom with different material rods of known electron density. These calibration-based conversions aren’t capable of accounting for beam-hardening effects as they emerge in clinical scans. In spectral CT, ED can be measured directly with high accuracy (within 1% of the ED of water21), and without calibration since ED is directly related to the Compton scatter which is obtained by the spectral decomposition.
Calcium Suppression (CaSupp) [HU]
Are images that display the attenuation without the attenuation contribution of calciumbased materials.13 Same as the iodine suppression in VNC, but for various calcium-based material. A higher calcium suppressed Index (CSI) corresponds to a higher calcium composition weight (Figure 7).
17
Clinical case collection
Double oblique MPR image shows a calcified lesion and a uric acid stone side by side. The lower row displays spectral results in the Magic Glass, from left to right: conventional CT image, uric acid removed image, uric acid image, and Z effective map image. A comparative measurement on the conventional image shows that it is not possible to differentiate between them based on HU measurements (Calcified: 326.2 HU; UA stone: 329.4 HU). The Z effective map shows a large difference between the lesions (Calcified: 10.0; UA stone: 7.0) which enables us to classify them correctly.


18
Figure 6
Clinical case collection

19
Figure 7
Clinical case collection
A patient presenting to CT with knee pain. From left to right: Conventional CT image, CaSupp image, and MRI image. The conventional image does not show any abnormality. CaSupp image reveals edema which is confirmed by MRI.
References
1. Shlomka J.P., Roessl E., Dorsheid R., Dill S., Martens G., Istel T., Bäumer C., Hermann C., Steadman R., Zeitler G., Livne A., Proksa R., (2008), “Experimental Feasibility of Multi-Energy Photon Counting K-edge Imaging in Pre-Clinical Computed Tomography”, Phys.Med.Biol. 53, 4031-4047.
2. Roessl E., Proksa R., (2007) “K-edge imaging in X-ray computed tomography using multi-bin photon counting detectors”, Phys.Med.Biol. 52(15): 4679-4696.
3. Si-Mohamed S., Bar-Ness D., Sigovan M., Cormode D., Coulon P., Coche E., Vlassenbroek A., Norman G., Boussel L., Douek P.; Review of an initial experience with an experimental spectral photon-counting computed tomography system. Nuclear Instruments and Methods in Physics Research, Section A; Volume 873, 21 November 2017, Pages 27-35.
4. Fornaro J, Leschka S, Hibbeln D, Butler A, Anderson N, Pache G et al., Dual- and multi-energy CT: approach to functional imaging, Insights Imaging (2011), 2:149-159.
5. Vlassenbroek A, Dual Layer CT, in “Dual Energy CT in Clinical Practice”; Medical Radiology, DOI: 10 10.1007/978-3-642-01740-7, Springer-Verlag Berlin Heidelberg (2011).
6. Maass N, Baer M and Kachelriess M, Image-based dual energy CT using optimized precorrection functions: A practical new approach of material decomposition in image domain, Med.Phys. 36 (8), August 2009.
7. Fahmi R, Eck BL, Fares A, Levi J, Wu H, Vembar M et al., Dynamic Myocardial Perfusion in a Porcine Balloon-induced Ischemia Model using a Prototype Spectral Detector CT. Medical Imaging 2015: Biomedical Applications in Molecular, Structural, and Functional Imaging. Proc. of SPIE Vol. 9417, 94170Y-8.
8. Engel K.J., Herrmann C. and Zeitler G., (2008) “X-ray scattering in single and dual-source CT”, Med.Phys. 35 (1): pp. 318-332.
9. Hojjati M., Van Hedent S., Rassouli N., Tatsuoka C., Jordan D., Dhanantwari A., Rajiah P.; Quality of routine diagnostic abdominal images generated from a novel detector-based spectralCT scanner: a technical report on a phantom and clinical study. Abdom Radiol (NY). 2017 Nov;42(11):2752-2759. doi: 10.1007/s00261-017-1170-z.
10. Alvarez RE and Macovski A, Energy-selective Reconstructions in X-ray Computerized Tomography”, Phys. Med. Biol. 1976, vol.21, no.5, 733-744.
11. Sauter AP, Muenzel D, Dangelmaier J, Braren R, Pfeiffer F, Rummeny EJ, Noël PB, Fingerle AA.; Dual-layer spectral computed tomography: Virtual non-contrast in comparison to true non-contrast images. Eur. J Radiol 2018 Jul;104:108-114. doi: 10.1016/j.ejrad.2018.05.007.
12. Ananthakrishnan L., Rajiah P., Ahn R., Rassouli N., Xi Y., Soesbe T.C., Lewis M.A., Lenkinski R.E., Leyendecker J.R., Abbara S; Spectral detector CT-derived virtual non- contrast images: comparison of attenuation values with unenhanced CT; Abdom Radiol (NY). 2017 Mar;42(3):702-709. doi: 10.1007/s00261-016-1036-9.
13. Neuhaus V, Lennartz S, Abdullayev N, Große Hokamp N, Shapira N, Kafri G, Holz JA, Krug B, Hellmich M, Maintz D, Borggrefe J.; Bone marrow edema in traumatic vertebral compression fractures: Diagnostic accuracy of dual-layer detector CT using calcium suppressed images. Eur J Radiol. 2018 Aug;105:216-220. doi: 10.1016/j.ejrad.2018.06.009.
14. van Ommen F., Bennink E., Vlassenbroek A., Dankbaar J.W., Schilham A.M.R., Viergever M.A., de Jong H.W.A.M.; Image quality of conventional images of dual-layer SPECTRAL CT: A phantom study. Med Phys. 2018 May 10. doi: 10.1002/mp.12959.
15. Tsang D.S., Merchant T.E;., Merchant S.E., Smith H., Yagil Y., Hua C.H.; Quantifying potential reduction in contrast dose with monoenergetic images synthesized from dual-layer detector spectral CT. Br J Radiol. 2017 Oct;90(1078):20170290. doi:10.1259/bjr.20170290.
16. Nagayama Y., Nakaura T., Oda S., Utsunomiya D., Funama Y., Iyama Y., Taguchi N., Namimoto T., Yuki H., Kidoh M., Hirata K., Nakagawa M., Yamashita Y.; Dual-layer DECT for multiphasic hepatic CT with 50 percent iodine load: a matched-pair comparison with a 120 kVp protocol; Eur Radiol. 2018 Apr;28(4):1719-1730. doi: 10.1007/s00330-017-5114-3.
20
Clinical case collection
17. Wellenberg R.H., Boomsma M.F., van Osch J.A., Vlassenbroek A., Milles J., Edens M.A., Streekstra G.J., Slump C.H., Maas M.; Quantifying metal artefact reduction using virtual monochromatic dual-layer detector spectral CT imaging in unilateral and bilateral total hip prostheses; Eur J Radiol. 2017 Mar; 88:61-70. doi: 10.1016/j.ejrad.2017.01.002.
18. Hickethier T., Baeßler B., Kroeger J.R., Doerner J., Pahn G., Maintz D., Michels G., Bunck A.C.; Monoenergetic reconstructions for imaging of coronary artery stents using spectral detector CT: In-vitro experience and comparison to conventional images; J Cardiovasc Comput Tomogr. 2017 Jan - Feb;11(1):33-39. doi: 10.1016/j.jcct.2016.12.005.
19. Neuhaus V., Große Hokamp N., Abdullayev N., Rau R., Mpotsaris A., Maintz D., Borggrefe J.; Metal artifact reduction by dual-layer computed- tomography using virtual monoenergetic images; Eur J Radiol. 2017 Aug;93:143-148. doi: 10.1016/j.ejrad.2017.05.013.
20. Kalisz K., Rassouli N., Dhanantwari A., Jordan D., Rajiah P.; Noise characteristics of virtual monoenergetic images from a novel detector-based spectral CT scanner; Eur J Radiol. 2018 Jan;98:118-125. doi: 10.1016/j.ejrad.2017.11.005.
21. Chia-ho Hua, Nadav Shapira, Thomas E. Merchant, Paul Klahr, Yoad Yagil, Accuracy of electron density, effective atomic number, and iodine concentration determination with a dual-layer dualenergy computed tomography system, Med Phys. 2018 Jun;45(6):2486-2497.
21
Clinical case collection
Clinical evidence
Spectral CT in head and neck disorders
Jan Borggrefe, MD, Department of Diagnostic and Interventional Radiology, University Hospital of Cologne, Cologne, Germany
Nils Große Hokamp, MD, Department of Diagnostic and Interventional Radiology, University Hospital of Cologne, Cologne, Germany
22
Clinical
case collection
Unenhanced brain imaging using virtual monoenergetic images from the IQon Spectral CT, a spectral detector computed tomography (SDCT)
Unenhanced CT examinations of the brain are a frequently performed tomographic study in the emergency department (ED) of hospitals. CT scans are commonly ordered in the ED to scan patients involved in accidents or suffering from an acute neurological condition such as a hemorrhagic or ischemic stroke, severe headaches, or seizures. CT scans are a fast and reliable way to identify or rule out acute life-threatening conditions within the neurocranium. On the other hand, unenhanced cranial CTs require the use of rather high radiation doses compared to other CT examinations, resulting in a significant radiation exposure to radiosensitive organs such as the eyes and the thyroid gland.1 Thus, optimization of radiation exposure is of great importance when performing head CTs. However, dose reduction often increases image noise, so the applied dose should be balanced with the acquisition for optimal image quality.2
Quality criteria of an optimal head CT examination are 1) the differentiation between gray and white matter (which exhibits an absolute difference of approximately 10 HU values), 2) low image noise so as not to impair differentiation (in studies with an image noise of approximately 10 HU, differentiation of gray and white matter becomes virtually impossible), and 3) little or no artifacts in the subcallosal space and within the posterior fossa of the neurocranium. Low keV virtual monoenergetic images (VMI) from the IQon Spectral CT address this challenging situation by improving soft tissue contrast and by reducing image noise compared to conventional CT. We recently demonstrated this in a study that included 40 patients, showing that low keV VMI can improve the differentiation between gray and white matter by more than 3-fold as determined by contrast-to-noise ratio (CNR).3 Furthermore, the study demonstrated that noise within these virtual monoenergetic images is approximately 30% lower compared to conventional CT images. These findings illustrate the superiority in image quality of the 65 keV images from the SDCT IQon scanner compared to conventional CT images, showing that SDCT imaging would work well as a recommended standard for brain imaging.
There is a need for dedicated studies to investigate just how much SDCT of the head allows for a reduction of applied dose in comparison to conventional CT. In several studies, 40 keV images showed even greater image contrast than 65 keV images; however, over-enhancement of the skull did frequently impair diagnostic assessment of the subcalvarial space. In an updated algorithm for neuroimaging on SDCT, this issue was successfully addressed; now it appears that 40 keV images can be used for diagnostic assessment in many cases and actually exhibit an outstanding image contrast (Figure 1). For other body regions or studies, it has been shown that virtual monoenergetic images require an adjustment of window settings as the absolute attenuation values (in HU) differ substantially from conventional image reconstructions.4,5 Such values are yet to be determined for cranial CT imaging.
In studies investigating assessment of focal parenchymal brain lesions, low keV VMI derived from SDCT improved lesion delineation independent of lesion type.6 In comparison to conventional CT, SDCT improved sensitivity for the detection of new, formerly unknown brain lesions, especially in regard to focal hemorrhages. This indicates that low keV images may be beneficial for the early detection of acute ischemic stroke, the detection of diffuse brain injuries in the acute phase, the depiction of calcifications, and the identification of cystic lesions.
At the other end of the keV scale, higher keV virtual monoenergetic images have successfully reduced artifacts from orthopedic implants. We recently investigated a benefit regarding metal artifact reduction in the presence of lead for deep brain stimulation.7 These patients
23
Clinical case collection
Unenhanced cranial CT of a 55-year-old patient in conventional image and virtual monoenergetic image reconstruction at 40 keV. Note that gray-white matter differentiation is clearly superior in 40 keV images.
routinely undergo unenhanced cranial CT (CCT) after the procedure in order to determine correct positioning of electrodes and to rule out post-procedural hemorrhage. We found that high keV images were especially helpful if combined with dedicated algorithms for metal artifact reduction. In these types of images, sensitivity, and specificity for blood detection, was significantly improved. However, regarding the severe artifacts caused by coiling material in cerebral aneurysms, the benefit from VMI is limited; here, further advances are highly desirable.
Virtual non-contrast imaging and material quantification in the brain
Dual-energy CT allows an improved depiction, quantification, and separation of various tissue types such as iodine and calcium (see Chapter 1, Technical Aspects). In brain imaging, the virtual non-contrast (VNC) mode can be used for several indications. For dual-energy CT, Djurdjevic et al. proved that VNC is a powerful tool in order to predict the infarction development after endovascular stroke therapy by helping to detect the stasis of contrast medium within the brain tissue.8 This may be of particular interest in order to guide the surveillance and treatment of the patient after thrombectomy in regard to decision-making on the necessity of prolonged extubation, ICU surveillance, and early mobilization. Furthermore, as iodine removal may allow for the early detection of stroke hemorrhages after thrombectomy by separating blood from iodine, SDCT was shown to be a powerful tool for the detection of such complications.9,10 The VNC is further of value for the planning of brain biopsies, as calcifications of solid brain tumors or tumor cysts may impair biopsies and can be clearly differentiated from contrast enhancement using VNC images from SDCT (Figure 2).
In the planning of stroke treatments, an optimized imaging of the obstructing blood clot is of clinical interest as the relatively small clot structures may be partially obscured in CT by the stasis of blood, and as review of clot imaging may lead the clinician to draw conclusion with regard to clot compositions.

For example, numerous studies have shown that the hyperdensity of clots is strongly associated with the fraction of red blood cells (RBC) and improved functional outcome of stroke patients after 90 days. An ex vivo study showed that SDCT is a helpful tool for the differentiation of the blood clot components RBC and fibrin, which in contrast to RBC is

24
Figure 1
Conventional Virtual monoenergetic 40 keV Clinical case collection
Figure 2
For stereotactic biopsies of cerebral cystic lesions, we routinely perform an intraoperative contrast enhanced study; however, the presence of contrast enhancement makes it difficult to differentiate calcified walls of such lesions from the surrounding cerebral vasculature (arrow). Here, virtual non-contrast images often enable identification of these calcifications, resulting in easier and shorter biopsy times.


strongly associated with contrast enhancement of clots due to protein binding.11 The VNC allowed the clinician to accurately detect clot densities, such as in unenhanced imaging, even in enhanced studies, enabling differentiation of the thrombus types with respect to their red blood cell fraction. Furthermore, iodine uptake within thrombi can be quantified, allowing for an estimation of the fibrin fraction within the clots. A patient study by Grams et al. documented that DECT is helpful for the detection of residual thrombi in patients after stroke treatment.12
In body imaging, VNC images have successfully demonstrated image qualities comparable to true non-contrast acquisitions;13 while in brain imaging, the aforementioned strong necessity for low contrast resolution and low image noise results in obscured separation of gray and white matter in VNC images. In addition, the current algorithm may not fully suppress iodinated contrast-media in small subcalvarial vessels. Thus, there is need for a further improvement of VNC imaging with dedicated fine-tuning with regard to the depiction of low contrasts of the brain.
Quantitative imaging with respect to contrast media uptake is of interest for all body regions including head and neck imaging. In contrast to clinical MRI, which has some limitations in this regard, CT in general and SDCT in particular, allow for quantitative imaging of tissue components.14,15 This is of interest, as iodine content may be used for the differentiation of tumor types for the guidance of targeted biopsies, or even to serve as a biomarker in virtual biopsies. In gliomas, the tumor grade is associated with the prevalence and intensity of tumor-tissue enhancement. Further, lymphomas are thought to differ from gliomas with a tumor enhancement of particular high intensity; here, iodine maps may allow for accurate separation of these two entities.
Knowing the iodine content of lesions in baseline studies further allows for the evaluation of tumor response (e.g., for the differentiation of remaining metastases after radiation in the differential to radiation necrosis). Hence, for this purpose, SDCT may overcome the need for additional and expensive (yet frequently performed) PET/CT examinations. In addition, iodine quantification may prove beneficial for the early detection of therapeutic response. Feasibility studies proved that dual-energy CT also allows for the calculation of edema maps within the brain.16 Although such maps are not yet available for DECT scanners, it shows the potential for SDCT to assist with multiparametric image analysis by detecting specific tissue features with correction for edema (i.e., analogous to MRI FLAIR sequences).
25
Conventional Virtual non-contrast Clinical case collection
In preliminary studies, these edema maps allowed for an improved early depiction of brain infarction and thus for a more precise stroke scoring (i.e., when using the ASPECTS for pretherapeutic evaluation). Furthermore, edema maps could be used in tumor imaging and as an additional biomarker.
Contrast enhanced SDCT of the head and neck
Contrast enhanced CT of the head is a standard examination for the detection of vascular lesions in arterial and venous CT angiography and ischemic stroke. For the latter, CT perfusion is commonly used for the differentiation of penumbra and the core of infarction. Indisputably, in brain tumor imaging, MRI yields a better CNR in comparison to CT, and provides additional information such as diffusion imaging, fluid suppression, and susceptibility-weighted imaging. However, contrast enhanced CT is still used for various indications in cases of cerebral tumor diseases, including imaging of patients with contraindication for MRI, the use of CT perfusion for the detection of hyperperfused tumor foci, and treatment planning for stereotactic methods and bone-invading tumors. Thus, there is significant potential for SDCT to improve diagnostic tumor and stroke imaging in comparison to conventional CT.


The boost of CNR in contrast enhanced SDCT angiography was shown for intra- and extracranial vessels, enabling improved visual assessment of different vessels, including challenging segments in proximity to the skull base, extracranial vessels, or the cerebellar vessels.17 Here, the vessel depiction in areas susceptible to moderate artifacts was significantly enhanced, as the increase in image contrast at 40 keV outweighed the minimal increase in image noise. The low image noise is an inherent feature of the dual-layer detector technology used in the IQon Spectral CT scanner. In contrast to unenhanced CT, image noise in contrast enhanced CT does not appear to be clinically relevant. In comparison of 40 keV images with conventional images, we found only minimal blooming of carotid artery plaques, providing the ability to better assess the vessel lumen in the presence of strong calcifications and considerable improvements of vessel contrast, especially in investigations with suboptimal
Coronal maximum intensity projection of a SDCT angiography of a 48-year-old patient. Note that vessel contrast is clearly enhanced in 40 keV image reconstruction compared to conventional images.
26
Figure 3
Clinical case collection
Conventional Virtual monoenergetic 40 keV
vessel contrast.18 Therefore, 40 keV images from SDCT angiography provide clear visualization advantages compared to conventional images and may provide helpful supplemental imaging information (Figure 3).
The contrast boost of SDCT can now be used in different ways:
• By yielding optimal contrast in low contrast structures or in images with suboptimal contrast (i.e., due to delayed contrast enhancement or vessels with stents and calcifications).
• By reducing the application of contrast media, which is helpful for patients with impaired kidney function.4,18,19
Furthermore, the high contrast of low keV images can be used to reduce radiation exposure for the patient, as CNR may be comparable to conventional imaging with considerable dose reductions. To date, however, there are no structured studies addressing optimal radiation doses or contrast protocols for low keV SDCT angiography.
Enhanced contrast may be able to help the clinician detect subtle contrast enhancement in blood brain barrier disruptions, thereby allowing optimized SDCT post-processing to aid in the detection of cerebral metastases, especially in patients with contraindications for MRI. Furthermore, contrast enhanced SDCT could be used by the clinician to assist with stereotactic therapy planning, as well as enhance the detection of early stroke demarcation in CT angiography and CT perfusion.
SDCT imaging of the neck and spine
One of the most frequent instances of metal artifacts in neck imaging are dental implants. Such artifacts can disrupt CT image quality, and thus decrease the clinician’s ability to provide a confident diagnostic assessment of pathology, such as a tumor or abscess. In this situation, high keV images were again found to be helpful to reduce both hypo- and hyperdense artifacts. However, the extent of artifact reduction shows a strong dependence on the metal alloy. A particular advantage of IQon Spectral CT in this respect is the ability to seamlessly adjust keV levels in real time, allowing the clinician to find an optimal balance between artifact reduction (toward higher keV) and maintained tissue contrast (toward lower keV).20
The diagnostic assessment of the spinal canal with respect to tumor masses is of particular importance in oncologic staging examinations, yet frequently presents challenges for clinicians (e.g., beam hardening caused by the surrounding bone, often with only slight differences in image contrast). We recently demonstrated that virtual monoenergetic images have been beneficial in this type of situation, as they can help to enhance visualization of intraspinal tumors.21 As learned from angiographic studies in abdominal CT angiography, the improved vessel delineation and visualization may be promising for assessment of spinal vessel lesions such as acute vessel occlusions or dural fistulas.
In spine imaging, we found that high keV virtual monoenergetic images are helpful in reducing artifacts caused by spinal fusions.22 These artifact-reduced images allowed for an improved assessment of the spinal canal in oncologic staging examinations, as well as improvements in image quality for myelography exams.
In conclusion, for all tumor indications within the soft tissue, SDCT provides enhanced benefits for assessing iodine uptake of tumoral diseases of the head and neck, including lymph nodes, in a more quantitative fashion, as well as improvements in the visualization of head and neck tumors.
27
Clinical case collection
References
1. Wenz H, Maros ME, Meyer M, et al (2016) Intra-individual diagnostic image quality and organspecific-radiation dose comparison between spiral cCT with iterative image reconstruction and z-axis automated tube current modulation and sequential cCT. Eur J Radiol Open 3:182–190. doi: 10.1016/j.ejro.2016.05.006.
2. Weinstein MA, Duchesneau PM, MacIntyre WJ (1977) White and gray matter of the brain differentiated by computed tomography. Radiology 122:699–702. doi: 10.1148/122.3.699.
3. Neuhaus V, Abdullayev N, Grosse Hokamp N, et al (2017) Improvement of Image Quality in Unenhanced Dual-Layer CT of the Head Using Virtual Monoenergetic Images Compared With Polyenergetic Single-Energy CT. Invest Radiol 52:470–476. doi: 10.1097/LI.0000000000000367.
4. Große Hokamp N, Kessner R, Van Hedent S, et al (2018) Spectral detector CT pulmonary angiography: Improved diagnostic assessment and automated estimation of window settings. J. Comput. Assist. Tomogr. in Press.
5. Doerner J, Luetkens JA, Iuga A-I, et al (2017) Poly-energetic and virtual mono-energetic images from a novel dual-layer spectral detector CT: optimization of window settings is crucial to improve subjective image quality in abdominal CT angiographies. Abdom Radiol (New York). doi: 10.1007/s00261-017-1241-1.
6. Lennartz S, Laukamp K, Neuhaus V, et al (2017) Verbesserung der Bildqualität zur Detektion intrakranieller Blutungen und hypodenser Defektareale durch monoenergetische Rekonstruktionen der Spektraldetektor-Computertomografie. RöFo - Fortschritte auf dem Gebiet der Röntgenstrahlen und der Bildgeb Verfahren 189:S1–S124. doi: 10.1055/s-0037-1600199.
7. Große Hokamp N, Hellerbach A, Gierich A, et al (2018) Reduction of Artifacts Caused by Deep Brain Stimulating Electrodes in Cranial Computed Tomography Imaging by Means of Virtual Monoenergetic Images, Metal Artifact Reduction Algorithms, and Their Combination. Invest Radiol. doi: 10.1097/RLI.0000000000000460.
8. Djurdjevic T, Rehwald R, Knoflach M, et al (2017) Prediction of infarction development after endovascular stroke therapy with dual-energy computed tomography. Eur Radiol 27:907–917. doi: 10.1007/s00330-016-4412-5.
9. Van Hedent S, Große Hokamp N, Beck R, et al (2018) Differentiation of haemorrhage from iodine using spectral detector CT in a phantom study. Insights Imaging 1–642. doi: doi.org/10.1007/s13244-018-0603-8.
10. Riederer I, Sauter A, Renz M, et al (2017) Dual-layer Spektral-CT versus MRT bei der Differenzierung zwischen Hämorrhagie und Kontrastmittelextravasation nach mechanischer Rekanalisation. RöFo - Fortschritte auf dem Gebiet der Röntgenstrahlen und der Bildgeb Verfahren 189:S1–S124. doi: 10.1055/s-0037-1600404.
11. Borggrefe J, Kottlors J, Mirza M, et al (2017) Differentiation of Clot Composition Using Conventional and Dual-Energy Computed Tomography. Clin Neuroradiol. doi: 10.1007/s00062-017-0599-3.
12. Grams A, Knoflach M, Rehwald R, et al (2015) Residual Thromboembolic Material in Cerebral Arteries after Endovascular Stroke Therapy Can Be Identified by. AJNR Am J Neuroradiol 36:1413–1418.
13. Ananthakrishnan L, Rajiah P, Ahn R, et al (2017) Spectral detector CT-derived virtual non-contrast images: comparison of attenuation values with unenhanced CT. Abdom Radiol (New York) 42:702–709. doi: 10.1007/s00261-016-1036-9.
14. Pelgrim GJ, van Hamersvelt RW, Willemink MJ, et al (2017) Accuracy of iodine quantification using dual energy CT in latest generation dual source and dual layer CT. Eur Radiol 27:3904–3912. doi: 10.1007/s00330-017-4752-9.
15. Ehn S, Sellerer T, Muenzel D, et al (2017) Assessment of quantification accuracy and image quality of a full-body dual-layer spectral CT system. J Appl Clin Med Phys. doi: 10.1002/acm2.12243.
16. Grams AE, Djurdjevic T, Schiestl T, et al (2018) Dual-energy computed tomography for optimised visualisation of early cerebral infarctions after endovascular stroke therapy. Eur. Congr. Radiol.
28 Clinical case collection
17. Neuhaus V, Große Hokamp N, Abdullayev N, et al (2018) Comparison of virtual monoenergetic and polyenergetic images reconstructed from dual-layer detector CT angiography of the head and neck. Eur Radiol 28:1102–1110. doi: 10.1007/s00330-017-5081-8.
18. Zopfs D, Lennartz S, Laukamp K, et al (2018) Improved depiction of atherosclerotic carotid artery stenosis in virtual monoenergetic reconstructions of venous phase dual-layer computed tomography in comparison to polyenergetic reconstructions. Eur J Radiol 100:36–42. doi: 10.1016/j.ejrad.2018.01.008.
19. Tsang DS, Merchant TE, Merchant SE, et al (2017) Quantifying potential reduction in contrast dose with monoenergetic images synthesized from duallayer detector spectral CT. Br J Radiol 90:20170290. doi: 10.1259/bjr.20170290.
20. Große Hokamp N, Laukamp KR, Lennartz S, et al (2018) Artifact reduction from dental implants using virtual monoenergetic reconstructions from novel Spectral Detector CT. Eur J Radiol. doi: 10.1016/j.ejrad.2018.04.018.
21. Große Hokamp N, Abdullayev N, Borggrefe J (2018) Verbesserte Darstellung intraspinaler Lymphome mittels virtuell-monoenergetischen Rekonstruktionen der Dual-Energy-CT. RoFo Fortschritte auf dem Gebiete der Rontgenstrahlen und der Nukl. doi: 10.1055/a-0576-0935.
22. Große Hokamp N, Neuhaus V, Abdullayev N, et al (2018) Reduction of artifacts caused by orthopedic hardware in the spine in spectral detector CT examinations using virtual monoenergetic image reconstructions and metal-artifact-reduction algorithms. Skeletal Radiol 47:195–201. doi: 10.1007/s00256-017-2776-5.
29 Clinical case collection
History Benefits or pitfalls of dual-energy CT
Head and Neck
Key images
Findings
75-year-old male with left-sided oropharyngeal epidermoid carcinoma diagnosed in 2004 and treated with radiochemotherapy. Spectral CT was requested for monitoring of potential local progression.
Quantification of iodine uptake of the right-sided mass at the base of the tongue with iodine density and Z effective images. Better delineation of the left-sided oropharyngeal infiltration on iodine overlay images.
Axial images
Conventional CT with contrast showed a mass at the right side of the base of the tongue and left-sided oropharyngeal infiltration. Virtual monoenergetic images provided better delineation of the mass and oropharyngeal infiltration. Iodine density and Z effective images demonstrated increased iodine content (2.95 mg/ml) and higher effective atomic number (9.05) of the mass of the tongue quantitatively compared to unaffected left side of the tongue (iodine density: 1.42 mg/ml, effective atomic number: 8.24) and left submandibular lymph node (iodine content: 1.90 mg/ml, effective atomic number: 8.50). Iodine overlay images were helpful in better demonstrating the margins of the left oropharyngeal infiltration.
Discussion
Virtual monoenergetic images at lower keV could improve lesion enhancement in head and neck tumors. Iodine density and Z effective images quantitatively demonstrate the iodine content of a tongue mass and enlarged lymph nodes compared to unaffected adjacent structures. The quantification of the amount of iodine in head and neck masses and lymph nodes may be helpful in characterization of these lesions. Iodine overlay images also provide better delineation of the lesion and could be beneficial for demonstrating the tumor extent and invasion of the adjacent structures better, thus may help in staging.
This case was provided by Begüm Demirler Simsir and Emmanuel Coche, from Cliniques Universitaires St-Luc, Brussels-Belgium.
30
Case Spectral CT in head and neck disorders Clinical case collection
Conventional CT with contrast, axial image at 120 kVp: right-sided mass of the base of the tongue (blue arrow) and left-sided submandibular lymph node (white arrow).


Virtual monoenergetic axial image at 50 keV: better demarcation of the mass (arrow).
Iodine density image: increased iodine content of the right-sided mass of the tongue (3.05 mg/ml, blue arrow) compared to left side (1.30 mg/ml, white arrow) and increased iodine content of the left submandibular lymph node (1.90 mg/ml).

Z effective image: mass of the right side of the tongue (blue arrow) with increased iodine content which is color coded in dark blue. The effective atomic number is higher (9.09) compared to left side of the tongue (8.19, white arrow) and left submandibular lymph node (8.50, curved arrow), appearing color coded in lighter blue.

31 Clinical case collection

 Conventional CT with contrast, axial image at 120 kVp: oropharyngeal infiltration on the left side (arrow).
32 Clinical case collection Case 1 Head and Neck Continued
Virtual monoenergetic axial image at 50 keV: better delineation of the left-sided oropharyngeal infiltration (arrow) and invasion of the epiglottis.
Iodine density axial image: increased iodine content of the left-sided oropharyngeal infiltration (2.69 mg/ml, blue arrow) compared to right side of oropharynx (1.30 mg/ml, white arrow).
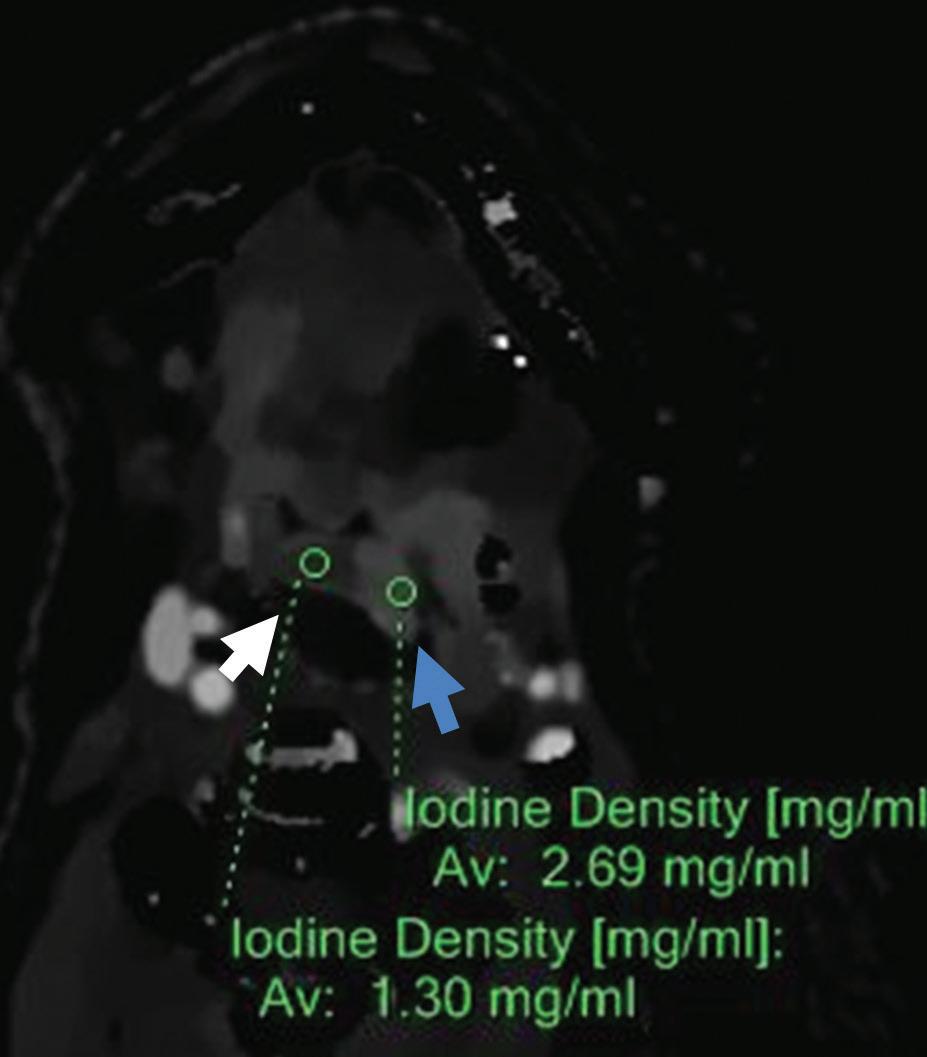
Z effective axial image: left side of oropharynx (blue arrow) with increased iodine content is color coded in dark blue and has higher effective atomic number (8.95) compared to right side of oropharynx (8.20) color coded in light blue-green (white arrow).

Iodine overlay axial image: better delineation of the extent of left-sided oropharyngeal and epiglottis infiltration (arrows).

33 Clinical case collection
History Benefits or pitfalls of dual-energy CT
Head and Neck
Key images
Findings
85-year-old female with previously diagnosed thyroid carcinoma treated by surgery and radiotherapy presented with severe dysphagia. Evaluation with spectral CT.
Better delineation of the paratracheal mass and the cervical lymph node with lower keV virtual monoenergetic and iodine overlay images. Quantification of iodine uptake of these lesions by iodine density and Z effective images.
Axial and coronal images
Conventional CT with contrast demonstrated a small left paratracheal mass in left thyroid bed and left level IIa enlarged lymph node suspicious for recurrent thyroid carcinoma. Virtual monoenergetic images at 55 keV and iodine overlay images better delineated the lesions. Iodine density and Z effective images showed increased iodine content of the mass in left thyroid bed (5.27 mg/ml) and the level IIa enlarged lymph node (3.79 mg/ml) quantitatively. Similarly, PET/CT performed the next day demonstrated high metabolic activity within the left paratracheal mass and left level IIa lymph node (SUVmax 4.8 and 10.4 respectively). The patient underwent lymph node biopsy for suspected recurrence.
Discussion
Iodine density and Z effective images could quantitatively demonstrate the iodine content of the paratracheal masses in thyroid bed after surgery and enlarged cervical lymph nodes suspicious of recurrence. Virtual monoenergetic images at low keV and iodine overlay images allow better delineation of these lesions with higher iodine content providing images similar to PET/CT.
This case was provided by Begüm Demirler Simsir and Emmanuel Coche, from Cliniques Universitaires St-Luc, Brussels-Belgium.
34 Clinical case collection
Case Spectral CT in head and neck disorders
Virtual monoenergetic image at 55 keV, axial image: better delineation of left paratracheal mass in thyroid bed (arrow).


Virtual non-contrast axial image: left paratracheal mass (arrow) with an attenuation value of 55.5 HU.
Iodine density axial image: increased iodine content of the left paratracheal mass in thyroid bed (5.27 mg/ml, arrow).

Z effective axial image: left paratracheal mass in thyroid bed (arrow) with increased iodine content is color coded in dark blue and has an effective atomic number of 9.64.
 Conventional CT with contrast, axial image at 120 kVp: left paratracheal nodular lesion (arrow) with an attenuation value of 197.3 HU.
35 Clinical case collection
Virtual monoenergetic image at 55 keV, coronal image: better delineation of left level IIa enlarged lymph node (arrow).
Virtual non-contrast coronal image: left level IIa enlarged lymph node (arrow) with an attenuation value of 39.9 HU.

Iodine density coronal image: increased iodine content of the left level IIa enlarged lymph node (3.79 mg/ml, arrow).

Z effective coronal image: left level IIa enlarged lymph node (arrow) with increased iodine content is color coded in dark blue and has an effective atomic number of 9.13.

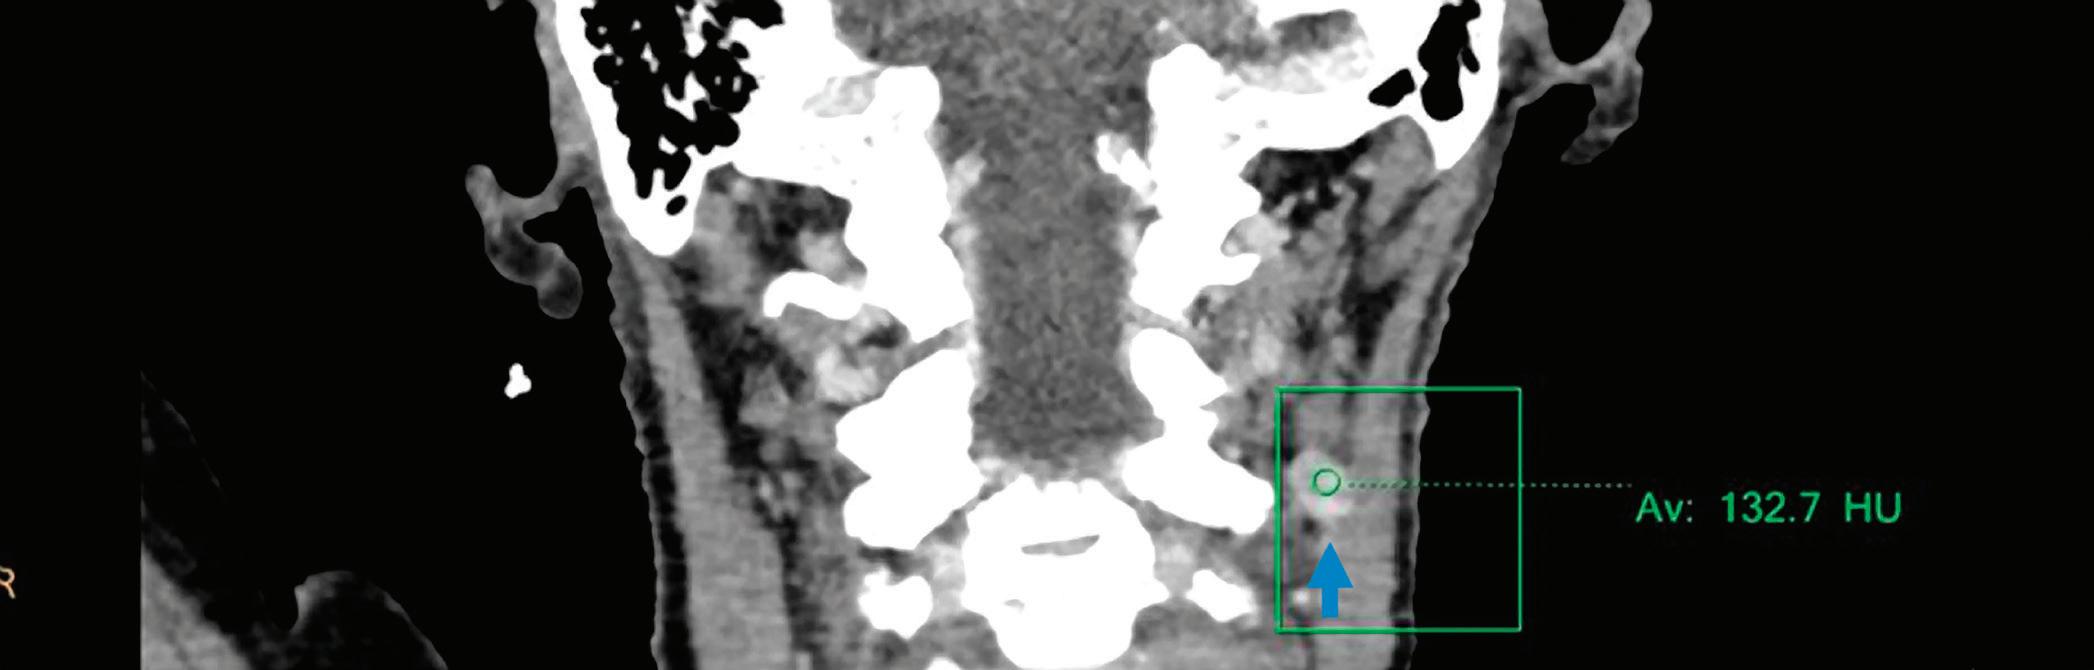
 Conventional CT with contrast, coronal image at 120 kVp: left level IIa enlarged lymph node (arrow) with an attenuation value of 132.7 HU.
36 Clinical case collection Case 2 Head and Neck Continued
Iodine overlay axial image: better delineation of left paratracheal mass in thyroid bed with higher iodine content (arrow).
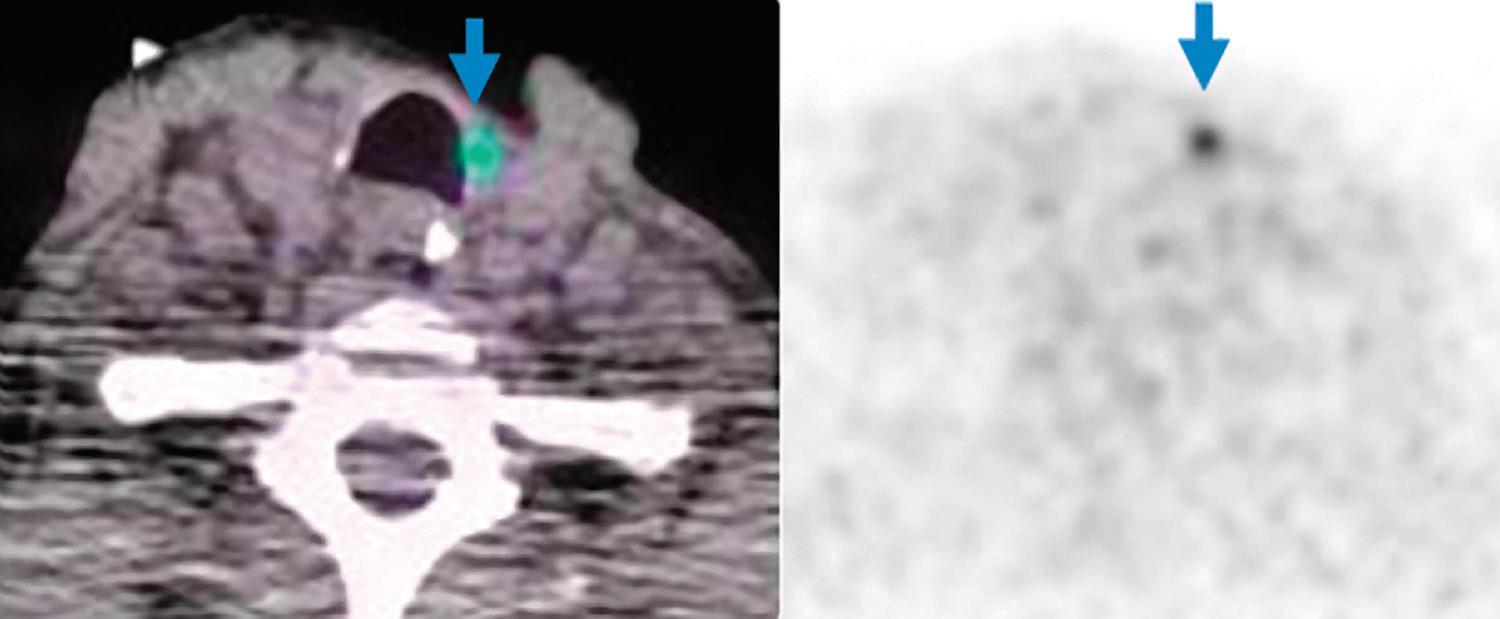
high metabolic activity within the left paratracheal mass in thyroid bed (SUVmax 4.8, blue arrows).

Iodine overlay coronal image: better delineation of left level IIa enlarged lymph node with higher iodine content (arrow).

 PET/CT axial images:
37 Clinical case collection
PET/CT coronal images: high metabolic activity within the left level IIa enlarged lymph node (SUVmax 10.4, arrows).
History
Benefits or pitfalls of dual-energy CT
Key images
Findings
33-year-old testicular carcinoma patient with previously resected brain metastasis presented with seizures.
Identification of iodine in an area of hemorrhage.
Axial images
Conventional non-contrast CT scan showed an area of hemorrhage on the right parietal lobe. A small portion showed contrast enhancement on lateral aspect of the lesion. Virtual non-contrast images were comparable to true non-contrast images. Iodine density and Z effective images showed iodine uptake indicating a metastatic foci with hemorrhagic component. The mass was resected and metastasis was confirmed at pathology.
Discussion
Contrast uptake could be masked by hyperdense hemorrhage in a hemorrhagic mass lesion on conventional CT images. Iodine density and Z effective images are useful to identify the presence of iodine in the lesion, and allowing therefore a more confident diagnosis of an underlying mass. Virtual non-contrast images are comparable to true non-contrast images. A reduction of radiation dose to the patient is possible by omitting true non-contrast images.
This case was provided by Begüm Demirler Simsir, Thierry Duprez and Emmanuel Coche, from Cliniques Universitaires St-Luc, Brussels-Belgium. Pathology images contributed by Julie Lelotte, from Cliniques Universitaires St-Luc, Brussels-Belgium.
38 Clinical case collection
Spectral CT in head and neck disorders
Brain Case
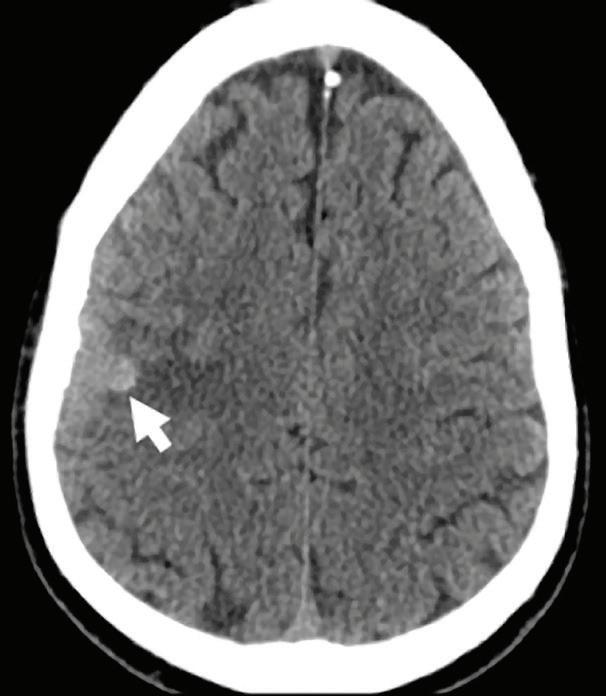
Conventional CT non-contrast axial image: hyperdense area of hemorrhage (arrow).
Virtual non-contrast axial image: hyperdense area of hemorrhage (arrow).
Conventional CT axial image with contrast: enhancement of the lateral aspect of the mass (arrow), difficult to differentiate from the hemorrhagic background.

Iodine density image: iodine uptake of the lateral portion of the lesion; iodine concentration of the mass (1.93 mg/ml, blue arrow) is higher compared to adjacent brain parenchyma (1.00 mg/ml, white arrow).


Z effective image: effective atomic number of the lateral portion of the mass is higher (8.70, blue arrow) compared to adjacent brain parenchyma (8.03, white arrow), indicating iodine uptake of the lesion.


Pathology image: infiltration of cerebral parenchyma by very atypical neoplastic cells. Some glandular and pseudoglandular structures (red arrow) and necrotic areas (black arrows) (Hematoxylin-Eosin, x200).
Pathology image, immunochemistry: quite diffuse membranous staining of CD30 (x200).

39 Clinical case collection
History Benefits or pitfalls of dual-energy CT
Key images Findings
Brain
Discussion
47-year-old female with a history of right middle cerebral artery (MCA, M1) stenosis and multiple stroke episodes was treated with IV thrombolysis and thrombectomy for another stroke episode in right MCA territory. Evaluation with spectral CT 24 hours later.
Differentiation of intracranial hemorrhage from contrast extravasation/staining after thrombectomy in acute stroke patients.
Axial images
Follow-up CT without contrast 24 hours after IV thrombolysis and thrombectomy demonstrated hyperdensity within right sylvian fissure and right-sided sulcal hyperdensities. Persistence of right sylvian fissure hyperdensity on virtual non-contrast images and lack of demonstration of iodine on iodine overlay images suggested hemorrhage rather than contrast extravasation in right sylvian fissure. Contrarily, right-sided sulcal hyperdensities were not visible on virtual non-contrast images, and iodine overlay images demonstrated iodine content in this area suggesting extravasated contrast rather than hemorrhage. These findings suggested a mixture of hemorrhage and contrast extravasation. Follow-up MRI FLAIR images 3 days later demonstrated persisting hyperintensity within right sylvian fissure confirming hemorrhage and lack of right sulcal hyperintensities confirmed early washout of extravasated contrast media.
On follow-up CT images of stroke patients after thrombectomy, hyperdensities caused by intracranial hemorrhage or contrast extravasation could be difficult to differentiate. Spectral CT could allow distinguishing intracranial hemorrhage from contrast staining with virtual non-contrast and iodine overlay images. This might eliminate the need for waiting for follow-up imaging to make the differentiation.
This case was provided by Begüm Demirler Simsir, Thierry Duprez and Emmanuel Coche, from Cliniques Universitaires St-Luc, Brussels-Belgium.
40 Clinical case collection
Case Spectral CT in head and neck disorders
Conventional CT axial image: hyperdensity in the right sylvian fissure (arrow).
Virtual non-contrast axial image: demonstration of hyperdensity (arrow) on virtual non-contrast images suggesting hemorrhage rather than contrast extravasation.
Iodine overlay axial image: lack of increased iodine content (arrow) in right sylvian fissure suggesting hemorrhage rather than contrast extravasation.
Conventional CT axial image: sulcal hyperdensity in right frontal region (arrow).


Virtual non-contrast axial image: lack of corresponding sulcal hyperdensity (arrow) on virtual non-contrast images suggesting contrast extravasation.
Iodine overlay axial image: demonstration of corresponding sulcal iodine content (arrow) suggesting contrast extravasation rather than hemorrhage.

Follow-up MRI 3 days later, axial FLAIR images: (a) persisting hyperintensity (arrow) within right sylvian fissure corresponding to hemorrhage. (b) Absence of sulcal hyperintensities confirming washout of contrast media.

41 Clinical case collection
A B
History Benefits or pitfalls of dual-energy CT
Brain and Vessels
Key images
Findings
50-year-old male presented with progressive speech difficulty and headache that started about 10 hours previously without motor or sensory symptoms, suspicious of stroke.
Virtual monoenergetic images at lower keV may provide better demonstration of hyperdense artery sign indicating thrombus on non-contrast images. After contrast administration, increased attenuation of iodine in vessels is obtained with lower keV virtual monoenergetic images. Iodine density and Z effective images help in diagnosing occluded segment of the vessel by demonstrating lack of iodine.
Axial and sagittal images
Conventional non-contrast axial CT images revealed hyperdense middle cerebral artery on the left and subtle hyperdensity of left internal carotid artery. Hyperdense left carotid artery was more prominent in virtual monoenergetic images at 40 keV. CT angiography revealed typical “flute beak” tapering and complete occlusion of the left internal carotid artery compatible with thrombosed dissection and partial thrombus extending to middle cerebral artery. Iodine density and Z effective images demonstrated narrowing and occlusion of the lumen of left internal carotid artery as well as thrombus extending to left middle cerebral artery. Virtual monoenergetic images at 50 keV provided increased attenuation of vessels. T2-weighted MRI images showed hyperintensity of left internal carotid artery and middle cerebral artery compatible with occlusion.
Discussion
Virtual monoenergetic images at lower keV could be helpful in increasing conspicuity of hyperdense vessels on non-contrast images as a sign of thrombus. After contrast administration, virtual monoenergetic images at lower keV increase vessel attenuation and thus may improve diagnostic performance with lower contrast volumes. Iodine density and Z effective images demonstrate lack of iodine within the lumen and help in diagnosis of vessel occlusion.
This case was provided by Begüm Demirler Simsir, Thierry Duprez and Emmanuel Coche, from Cliniques Universitaires St-Luc, Brussels-Belgium.
42 Clinical case collection
Case
Spectral CT in head and neck disorders
Conventional non-contrast CT axial image at 120 kVp: hyperdense and enlarged internal carotid artery (arrow).

Conventional non-contrast CT axial image at 120 kVp: hyperdense middle cerebral artery sign (arrow).


Conventional non-contrast CT axial image at 120 kVp: hyperdense left internal carotid artery intracavernous segment (arrow).
Virtual monoenergetic image at 40 keV: hyperdensity of left internal carotid artery intracavernous segment is more prominent (arrow).
43 Clinical case collection
Conventional CT angiography in sagittal reformation: demonstration of the narrowing (arrow) and occlusion of internal carotid artery.

Virtual monoenergetic image at 50 keV, sagittal reformation: better attenuation of internal carotid artery (arrow).


Iodine density sagittal image, sagittal reformation: tapering of the lumen of cervical segment of ICA (arrow).

Z effective image: tapering of the lumen of cervical segment of internal carotid artery color coded in dark blue (blue arrow) and occluded distal segment coded in light blue (white arrow).

CT angiography, axial image: demonstrating in a subtle way the narrowing and thrombus in middle cerebral artery (arrow).
Iodine density axial image: partial thrombus in left middle cerebral artery (arrow).

Z effective image: area of partial thrombus color coded in light blue (arrow).

44 Clinical case collection
Case 5 Brain and Vessels Continued


 T2-weighted axial MRI: hyperintense and slightly enlarged left internal carotid artery (blue arrow) compared to the normal right carotid artery with flow void (white arrow).
T2-weighted axial MR: hyperintense wall thickening of left internal carotid artery cavernous segment (blue arrow) compared to normal right carotid artery with flow void (white arrow).
T2-weighted axial MRI: hyperintense and slightly enlarged left internal carotid artery (blue arrow) compared to the normal right carotid artery with flow void (white arrow).
T2-weighted axial MR: hyperintense wall thickening of left internal carotid artery cavernous segment (blue arrow) compared to normal right carotid artery with flow void (white arrow).
45 Clinical case collection
T2-weighted axial MR: partial hyperintensity in left middle cerebral artery (blue arrow) compared to normal right middle cerebral artery with flow void (white arrow).
Clinical evidence
Spectral CT in thoracic disorders
Clinical case collection 46
Emmanuel Coche, MD, PhD, Head of Department of Radiology, Cliniques Universitaires St-Luc, Brussels, Belgium
Introduction
In daily practice, computed tomography (CT) represents the cornerstone imaging modality for the evaluation of various thoracic disorders. For many years, spectral CT has emerged as a new method of investigation for several diseases in the chest.1,2 With the benefits it provides in material decomposition, lung perfusion analysis, and improvements to image quality through artifact reduction or enhancements to iodine content in suboptimally enhanced vessels, the list of interesting and innovative applications for spectral CT continues to grow. The IQon Spectral CT was installed in our radiology department in May 2016 and has since been aiding our diagnostic capabilities. The goal of this chapter is to share our experience with this dual-layer, detector-based spectral CT system in our daily practice, and to provide a review of available literature on the topic.
Acquisition and review of chest images
In our practice, chest CT scans are obtained with a routine protocol using 120 kVp without modifying the imaging protocol or patient selection process to obtain spectral information. If the patient is obese, 140 kVp is preferred, and the mAs adjusted to keep the dose neutral. With the dual-layer, detector-based IQon Spectral CT system, SBI images (spectral base images) are captured during each CT examination. The SBI image data sets are loaded into the IntelliSpace workstation and inspected using different reconstruction algorithms. Analyzing the images using a dynamic approach is preferred. Virtual monoenergetic images can be extracted and extrapolated at wide energy levels, ranging from 40 to 200 keV, by simply sliding the cursor to the desired energy level on a dedicated workstation, or by using the Magic Glass on PACS app. The images are optimized by adjusting the contrast of the image, as well as the noise with potential reduction of artifacts. This simplified process for image acquisition and post-processing in dual-layer detector-based spectral CT may widen practical uses of spectral information in daily practice, such as for the evaluation of incidental findings or improvement of suboptimal studies. For chest image analysis, a recent study has shown that the optimal monochromatic energy level to analyze the lung parenchyma is around 50 to 55 keV.3 A set of images is systematically reconstructed at this energy and automatically sent to our PACS.
A material decomposition algorithm is also used in order to differentiate materials on the basis of the photoelectric effect within a certain density range, and by assigning colors to different materials. Iodine, Iodine no Water, and Z effective atomic number maps are generated and are used to highlight small differences in tissue composition. This allows us to obtain an instantaneous representation of a pulmonary perfusion, for example. Elimination of certain substances, such as iodine or calcium, can be performed as well to produce virtual non-contrast (VNC) or virtual non-calcium images.
General spectral CT applications
The use of virtual monoenergetic imaging
The use of virtual monochromatic dual-layer spectral CT imaging at high energy levels results in a significant reduction of streak artifacts produced by beam hardening.4 Monochromatic images obtained at higher energy simulate increased penetration of the X-ray beam and
Clinical case collection 47
are beneficial for reducing blooming and metallic artifacts. This technical capability can be useful when high-density contrast is present in the subclavian vein or in the superior vena cava during a pulmonary CT angiography performed at a high rate of injection or with dense contrast material (Figure 1). The energy level can be used at 200 keV with a significant reduction of artifacts and better visualization of obscured areas like axillae or subclavian regions. On the other hand, when virtual monochromatic imaging is used at low energy levels, the iodinated content of the vessel can be artificially highlighted, even in retrospect. This capability is particularly interesting in daily routine because there are many potential causes affecting the pulmonary vascular enhancement in chest CT, such as technical errors, extravasation, transient interruption of contrast material due to Valsalva maneuvers, or increased circulatory volume in pregnant women. This suboptimal opacification is rarely known in advance, and the use of virtual monoenergetic imaging retrospectively can improve vascular opacification at low energy levels (Figure 2). The performance of virtual monoenergetic imaging for pulmonary CT angiography (CTA) with a reduced iodine dose has been studied by various groups 5-9 Recently released noise-optimized virtual monoenergetic imaging techniques applied to CTA for imaging various body parts have shown improved image quality compared with traditional virtual monoenergetic images, particularly at 40 or 50 keV 6-8
Chest CT angiography performed in the context of acute chest pain. Contrast medium (350 mg I/ml) was injected through a right antecubital vein at a rate of 3 ml/sec. On the left, conventional images obtained at the level of the upper chest (mediastinal window) demonstrated heavy streak artifacts related to the dense contrast medium present in the right subclavian vein and obscuring the right axillar region. On the right, the same image displayed at 200 keV showed a significant reduction of artifacts with a better analysis of the right axillar region.

The use of virtual non-contrast and material specific maps
Virtual non-contrast (VNC) can delineate calcifications that are obscured by contrast material (Figure 3). Enhanced lymph nodes can be distinguished from lymph nodes that contain calcium silicates on VNC images, a characteristic that is important in identifying residual tumor and inflammatory processes. In a few cases, heavy calcifications, particularly coarse, low-density calcifications and hematomas, mimicking endoleaks can make a diagnosis difficult, especially in patients referred for acute chest pain, but these can be differentiated on VNC images.
Clinical case collection 48
Figure 1
Emergency imaging of patient for suspected PE. Spectral CT was performed after injection of contrast medium (100 ml Xenetix 350, Codali-Guerbet, France). The patient performed a Valsalva maneuver during the CT acquisition and the opacification of pulmonary arteries was judged of poor quality. Conventional CT images (Figure 2A, upper row) reformatted in the plane of a lower lobe pulmonary artery did not reveal any clot in the course of the vessel from the proximal part down to the periphery. Z effective map (Figure 2A , lower row) revealed a perfusion defect at the periphery of the lobe (red arrow). Spectral CT data were used to generate monochromatic images at 45 keV (Figure 2B) revealing a clot in a peripheral pulmonary artery (yellow arrow). Note the increased contrast level in the pulmonary vessels compared to the conventional CT images acquired at 120 kVp.


Clinical case collection 49
Figure 2
A B
Spectral CT seems to be a promising, noninvasive technique for the evaluation of lung morphology and functional information simultaneously, such as lung ventilation and perfusion. In literature, xenon gas (atomic number 54) has been used as an inhalation contrast agent for spectral CT of the lungs,10,11 but to the best of our knowledge, has not been studied with dual-layer CT technology. Volumetric whole lung or dynamic focal lung scan protocols can be used during the xenon wash-in and wash-out periods. Xenon-inhaled spectral CT has been applied to various pulmonary diseases including chronic obstructive pulmonary disease, asthma, and bronchiolitis obliterans. As in radionuclide ventilationperfusion scans, spectral CT may be used to depict ventilation-perfusion mismatch specifically caused by pulmonary embolism.12
Specific spectral applications
Pulmonary arteries and great vessels
The detection and risk stratification of acute pulmonary embolism (PE)
The diagnostic value of spectral CT for detecting pulmonary embolism has been demonstrated in several papers. The capability of dual-energy CT to use diagnostic information available from both low- and high-energy levels optimizes the contrast-to-noise ratio within pulmonary vessels and facilitates detection of peripheral endoluminal clots compared with images acquired at fixed energy alone (120 or 140 kVp). The low-energy acquisition can generate images with increased vascular enhancement, and therefore, can help in the detection of endovascular clots, even in non-angiographic chest CT with suboptimal opacification such as in protocols when CT acquisition is performed at the portal venous phase. Bae and colleagues have looked at whether virtual monoenergetic images of good quality obtained from dual-layer detector spectral CT can yield additional diagnostic information.9 They compared the diagnostic performance for detecting PEs with virtual monochromatic imaging at 40 keV and conventional 120 kVp images in patients with a suboptimally enhanced pulmonary artery. They found that 40 keV virtual monoenergetic images allowed for higher diagnostic accuracy in the detection of PEs versus conventional 120 kVp images. In addition to monochromatic images, produced at a lower energy if necessary, Iodine no Water or iodine maps can also help improve the diagnostic accuracy of pulmonary embolism, as mentioned before. The spectral CT lung blood volume quantification may help the clinician predict outcomes in patients with pulmonary embolism, but additional validation is needed.13 In our daily routine, the use of iodine, Iodine no Water, and Z effective atomic number maps is the first display used for the detection of small perfusion defects caused by peripheral pulmonary clots, followed by anatomical inspection of the corresponding suspicious feeding artery using the ‘Related Slice Function.’ The iodine distribution within the lung parenchyma is displayed on a gray-scale or in color with different optional color scales depending on user preference. With the advent of spectral CT, the way for diagnosing a PE has changed drastically in our daily routine.
Recently, some researchers in China14 evaluated 30 consecutive patients with enhanced chest CT. They evaluated the quality of enhancement within the superior vena cava (SVC) at different energy levels, and found that the optimal imaging of the SVC can be achieved on monoenergetic reconstructions at 40 keV by using the dual-layer IQon Spectral CT. For the aorta, the use of VNC can potentially eliminate the need for a true non-enhanced phase and can be useful for the detection of intramural hematoma or for the follow-up of aortic endografts.2
Clinical case collection 50
Patient imaged for lung cancer workup. The CT scan was directly acquired after injection of contrast medium. On image A (conventional CT), we can observe a right upper lung nodule (arrow) containing a high-density structure. Differentiation between calcium and iodine was not obvious. A lymphadenopathy was present in station 4R (arrow). On the VNC image (image B), it was demonstrated clearly that the dense material within the nodule was due to calcium and not iodine. This type of calcification (coarse) can be observed in lung cancer. On image C (Iodine map), iodine uptake was noted in the right upper lung nodule (1.44 mg Iodine/ml) and also in the right mediastinal adenopathy (0.58 mg Iodine/ml). Pathology revealed a right upper lobe lung adenocarcinoma and a metastatic adenopathy located in the station 4R. The same information was displayed in color on the Z effective map (image D).


Clinical case collection 51
Figure 3
A
C
B
D
Lung nodule characterization and follow-up
Spectral CT imaging has recently emerged as a promising imaging method for characterizing lung nodules. Spectral CT scans can simultaneously provide VNC images and an iodineenhanced image from a single scan performed after iodine contrast administration, allowing both measurement of nodule enhancement and detection of calcifications. Iodine map and Z effective maps can be generated, allowing quantification of iodine load within the nodule for further characterization (Figures 3 and 4). Another recent study15 has shown that spectral CT could help to demonstrate blood supply and indicate the invasion extent of pure “ground glass” nodules. The authors have demonstrated that monochromatic CT numbers of higher energy (especially 140 keV) would be better for diagnosing minimally invasive carcinoma versus lower energies. The advantages of this technique include reducing radiation exposure to patients by obviating baseline unenhanced scans, and reducing measurement error due to variation in regions of interest during subtraction of an unenhanced image from its enhanced counterpart. This technique may have applications in contrast-enhanced dynamic CT and perfusion CT for the differentiation of benign and malignant nodules. Some authors16 have demonstrated different patterns of iodine distribution on Z effective maps in various inflammatory and noninflammatory lesions of the lungs. Inflammatory lesions showed a tendency to have an increased enhancement of iodine compared to neoplasms. In contrast, pulmonary infarctions demonstrate homogeneous low iodine distribution on iodine map images, and pneumonia demonstrates heterogeneously decreased or increased iodine distribution. Lung abscess and other necrotic lung lesions do not demonstrate iodine distribution on iodine map images.
Mediastinal abnormalities
Spectral CT using a quantitative analytical method based on measurement of iodine concentration can be used to differentiate different types of mediastinal masses. A preliminary study17 showed that this technique was able to differentiate thymic epithelial tumors using single-phase scanning. Spectral CT and perfusion imaging that can detect the tumor microenvironment have not been extensively studied in the context of lymphoma, but there are a few studies on perfusion imaging showing decreased tumor perfusion values and normalization of peak tumor perfusion after treatment of lymphoma.18-20 Thyroid gland and parathyroid glands demonstrate highly vascularized tumors. Spectral CT performed in this clinical setting has the potential to further enhance diagnostic accuracy for mediastinal ectopic parathyroid adenoma and endothoracic goiter using iodine maps.21-22 Some authors have shown promising results for identification of benign and malignant thyroid nodules by in vivo iodine concentration measurement using spectral CT.21
Lung cancer and lymph nodes
Recently, several studies have indicated that intra-tumor iodine concentration measured by enhanced spectral CT is correlated with malignancy, histopathology, lymph node metastasis, gene expression, and therapeutic efficacy following radiation or chemotherapy in primary lung cancer.23-25 Iwano et al. first reported that intra-tumor iodine concentration is correlated with degree of tumor differentiation, and that high-grade tumors tend to have lower iodine concentrations.24
Some researchers have studied the potential interest of this technique in the field of response to therapy in lung cancer, but no extensive data exists in the literature. Baxa et al. demonstrated beneficial aspects of spectral CT in the functional evaluation of mediastinal lymph nodes by determining the arterial enhancement fraction with the dual-phase spectral CT approach.26-27 The authors have showed that there was a decrease in vascularization in the primary tumors with favorable response to anti-EGFR therapy following the failure of standard chemotherapy.
Clinical case collection 52
Patient with a history of papillary cancer of the thyroid gland underwent an enhanced chest CT. On the conventional CT image (Image A), a small lung nodule is observed in the left upper lobe. Monoenergetic images (Image B) displayed at 70 keV demonstrated the same image quality compared to 120 kV, and further characterization of the lung nodule was not possible. Iodine map (Image C) demonstrated a high value of iodine content (3.2 mg Iodine/ml). Z effective image (Image D) confirmed this high iodinated content within the lung nodule. Pathology revealed a metastasis of the thyroid carcinoma.


Clinical case collection 53
Figure 4
A
B
C
D
Spectral CT may also have potential applications in the pre- and postoperative evaluation of lung cancer. In patients with lung cancer, especially central lung cancer, spectral CT can depict the presence and extent of perfusion or ventilation defects and collateral ventilation when the mass involves the hilar vessels or bronchi, aiding in the preoperative prediction of postoperative pulmonary perfusion and ventilation function. The currently available spectral CT techniques available include iodine-based contrast-enhanced lung perfusion imaging and xenon- or krypton-enhanced spectral CT lung ventilation imaging. This latter technique holds promise for depicting ventilation patterns in lung diseases and ventilation/perfusion mismatch in pulmonary embolism, but requires further validation.
Pleural disorders, chest wall, and incidental findings
From our clinical experience, pleural enhancing nodules comprising primary or secondary tumors of the pleura, enhancing pleura encountered in empyema, may benefit directly from virtual monoenergetic imaging and improve the visualization of iodinated contrast uptake with a lesser amount of contrast medium. A recent study performed in 29 patients showed that CT values of the benign and malignant pleural effusions were statistically different (p < 0.05) at both 40 keV (43.15 versus 39.42 HU for benign and malignant pleural effusions respectively), and 100 keV monochromatic spectral CT images (9.11 versus 6.52 HU for benign and malignant pleural effusions respectively).28 The effective atomic number value of benign pleural effusion was also statistically different from that of malignant pleural effusion (p <0.05).
Other incidental findings localized in the chest wall, breasts (Figure 5), adrenal, and thyroid gland discovered during a routine chest CT examination or oncologic workup would benefit from this technique. Some authors have demonstrated that incidental adrenal nodules discovered during a contrast-enhanced spectral CT examination of the abdomen may avoid additional imaging studies for further nodule characterization.29
Conclusion
The dual-layer, detector-based spectral CT technology found only with the IQon Spectral CT enables on-demand retrospective spectral CT analysis, including virtual monochromatic imaging, Z effective and iodine mapping, and represents a significant step forward for various thoracic disorder workups. Our experience with this system revealed that this unique mode of spectral CT data acquisition has allowed us to improve our diagnostic accuracy and diagnostic confidence. At the present time, the most added value of this technology resides in the vascular domain, enabling the reduction of contrast medium dose, and improvement of vascular contrast enhancement. Future research is needed to demonstrate the clinical usefulness of this technology in the characterization of lung nodules and the potential role of iodine quantification in the evaluation of lung or mediastinal tumors before and after therapy. Undoubtedly, incidental chest findings will benefit from this retrospective spectral CT analysis.
Clinical case collection 54
Conventional CT scan with contrast (Image A) showed a focus (arrow) of subtle increased density in left breast. Virtual monoenergetic image at 45 keV (Image B) demonstrated the lesion with higher contrast (blue arrow) as well as left axillary lymph nodes (white arrow). Iodine density map (Image C) quantitatively demonstrated the higher iodine uptake of the breast lesion (2.05 mg/ml) and the lymph node (2.65 mg/ml) compared to normal appearing adjacent breast tissue (0.59 mg/ml). Z effective map (Image D) demonstrated higher effective atomic numbers of the breast mass and the the lymph node (8.38 and 8.73, respectively) compared to normal appearing adjacent breast tissue (7.64). Biopsy revealed invasive ductal carcinoma grade 2.

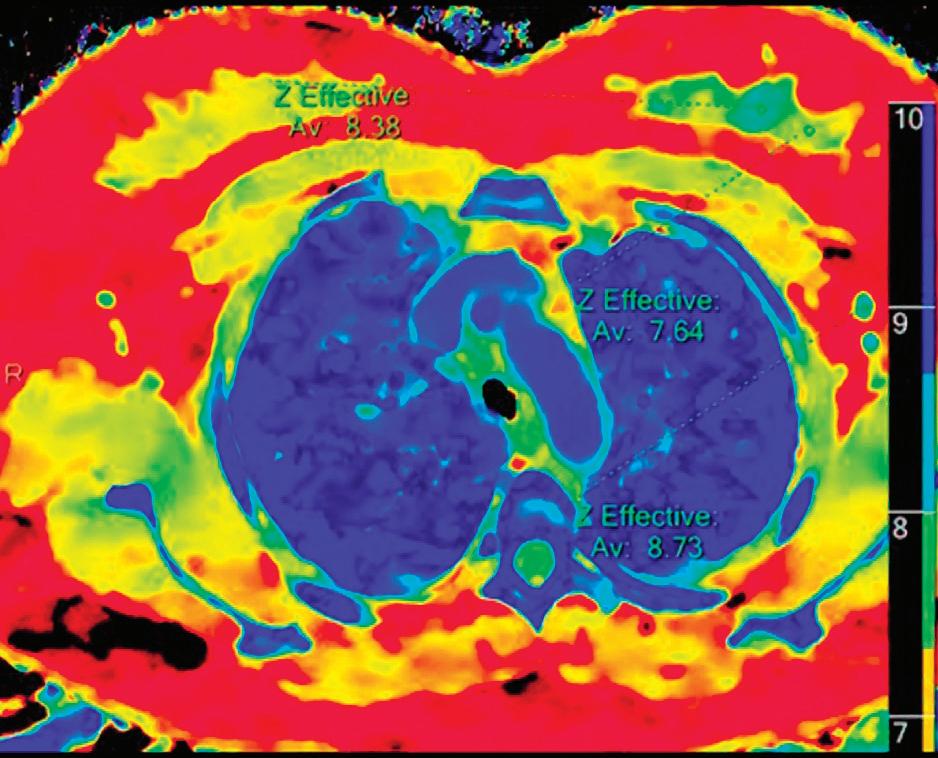


Clinical case collection 55
Figure 5
A
B
C
D
1. Lu GM, Zhao YE, Zhang LJ, Schoepf UJ. Dual-energy CT of the lung. AJR (2012) ;199 :S40-S53.
2. Ohana M, Yeung MY, Labani A, El Ghannudi, Roy C. Thoracic dual energy CT : acquisition protocols, current applications and future developments. Diagnostic and interventional Imaging (2014) ;95 :1017-1026.
3. Ohana M, Labani A, Severac F, et al. Single source dual energy CT : What is the optimal monochromatic energy level for the analysis of the lung parenchyma? Eur J Radiol (2017); 88 :163-170.
4. Wellenberg RH, Boomsma MF, van Osch JA, et al. Quantifying metal artefact reduction using virtual monochromatic dual-layer detector spectral CT imaging in unilateral and bilateral total hip prostheses. Eur Radiol (2017) ;88 :61-70.
5. Delesalle MA, Pontana F, Duhamel A, et al. Spectral optimization of chest CT angiography with reduced iodine load: experience in 80 patients evaluated with dual-source, dual-energy CT. Radiology (2013); 267:256–266.
6. Riffel P, Haubenreisser H, Meyer M, et al. Carotid dual-energy CT angiography: evaluation of low keV calculated monoenergetic datasets by means of a frequency-split approach for noise reduction at low keV levels. Eur J Radiol (2016); 85:720–725.
7. Beeres M, Trommer J, Frellesen C, et al. Evaluation of different keV-settings in dual-energy CT angiography of the aorta using advanced image-based virtual monoenergetic imaging. Int J Cardiovasc Imaging (2016); 32:137–144.
8. Wichmann JL, Gillott MR, De Cecco CN, et al. Dual-energy computed tomography angiography of the lower extremity runoff: impact of noise-optimized virtual monochromatic imaging on image quality and diagnostic accuracy. Invest Radiol (2016); 51:139–146.
9. Bae K, Jeon KN, Cho SB, et al. Improved Opacification of a Suboptimally Enhanced Pulmonary Artery in Chest CT: Experience Using a Dual-Layer Detector Spectral CT. Am J Roentgenol (2018);201:734-741.
10. Honda N, Osada H, Watanabe W, et al. Imaging of ventilation with dual-energy CT during breath-hold after single vital-capacity inspiration of stable xenon. Radiology (2012);262(1):262-8.
11. Chae EJ, Seo JB, Goo HW, et al. Xenon ventilation CT with a dual-energy technique of dual-source CT: initial experience. Radiology (2008);248(2):615-24.
12. Thieme SF, Becker CR, Hacker M, Nikolaou K, reiser MF, Johnson TR. Dual-energy CT for the assessment of lung perfusion-Correlation to scintigraphy. Eur J Radiol (2008) ;68(3) :369-74.
13. Apfaltrer P, Bachmann V, Meyer M, Henzler T, Barraza JM, Gruettner J, Walter T, Schoepf UJ, Schoenberg SO, Fink C. Prognostic value of perfusion defect volume at dual energy CTA in patients with pulmonary embolism : correlation with CTA obstruction scores, CT parameters of right ventricular dysfunction and adverse clinical outcome. Eur J Radiol. (2012);81(11):3592-7.
14. Wang GR, Wang ZW, Wang YN, Jin ZY. Application of the Dual-layer Spectral Detector CT in the CT Angiography of Superior Vena Cava. Zhongguo Yi Xue Ke Xue Yuan Xue Bao. 2017 Dec 20;39(6):806-811.
15. Zhang Y, Tang J, Xu J, Cheng J, Wu H. Analysis of pulmonary pure ground-glass nodule in enhanced dual energy CT imaging for predicting invasive adenocarcinoma: comparing with conventional thin-section CT imaging. J Thorac Dis (2017) ; 9 (12) : 4967-4978.
16. Chae EJ, Song JW, Seo JB, Krauss B, Jang YM, Song KS. Clinical utility of dual-energy CTin the evaluation of solitary pulmonary nodules :initial experience. Radiology (2008) ;249 (2) :671-681.
56 Clinical case collection
17. Chang S, Hur S, Im DJ, et al. Volume-based quantification using dual-energy computed tomography in the differentiation of thymic epithelial tumours: an initial experience. Eur Radiol. (2017);27:1992-200.
18. Dugdale PE, Miles KA, Bunce I, Kelley BB, Leggett DA. CT measurement of perfusion and per- meability within lymphoma masses and its ability to assess grade, activity, and chemotherapeutic re- sponse. J Comput Assist Tomogr 1999; 23:540–547.
19. Spira D, Vogel W, Bares R, Horger M. Volume- perfusion CT as an adjunct to whole-body contrastenhanced CT for monitoring response to therapy in lymphoma. Br J Haematol 2010; 151:293.
20. Kulkarni NM, Pinho DF, Narayanan S, Kambadakone AR. Imaging for oncologic response asessment in lymphoma. AJR Am J Roentgenol. (2017) ;208 :18-31.
21. Gao SY, Zhang XY, Wei W, et al. Identification of benign and malignant thyroid nodules by in vivo iodine concentration measurement using single-source dual energy CT. Medicine (2016);95:39(e4816).
22. Seyednejad N, Healy C, Tiwari P, et al. Dual-energy computed tomography: a promising novel preoperative localization study for treatment of primary hyperparathyroidism. The American Journal of Surgery (2016);211:839-845.
23. M. Aoki, H. Akimoto, M. Sato, K. Hirose, H. Kawaguchi, Y. Hatayama, H. et al. Impact of pretreatment whole-tumor perfusion computed tomography and 18F-fluorodeoxyglucose positron emission tomography/computed tomography measurements on local control of non-small cell lung cancer treated with stereotactic body radiotherapy. J. Radiat. Res. (2016), 57 (5): 533-540.
24. S. Iwano, R. Ito, H. Umakoshi, S. Ito, S. Naganawa. Evaluation of lung cancer by enhanced dual-energy CT: association between three-dimensional iodine concentration and tumour differentiation. Br. J. Radiol. (2015); 88 (1055).
25. X. Li, X. Meng, Z. Ye. Iodine quantification to characterize primary lesions, metastatic and non-metastatic lymph nodes in lung cancers by dual energy computed tomography: an initial experience Eur. J. Radiol. (2016); 85 (6): 1219-1223.
26. Baxa J, Matsoukova T, Krakorova G, Schmidt B, Schmidt B, Flohr T, Sedlmair M, et al. Dual-phase Dual-energy CT in patients treated with erlotinib for advanced non-small cell lung cancer: possible benefits of iodine quantification in response assessment. Eur radiol DOI 10.1007/ s00330-015-4092-6.
27. Baxa J, Vondrakova A, Matouskova T, Růžičková O, Schmidt B, Flohr T, et al. Dual-phase dual-energy CT in patients with lung cancer: assessment of the additional value of iodine quantification in lymph node therapy response. Eur radiol 2014 ; 24 :1981-1988.
28. Zhang X, Duan H, Yu Y, Ma C, Ren Z, Lei Y, et al. Differential diagnosis between benign and pleural effusion with dual-energy spectral CT. PLoS One (2018);13(4):e0193714.
29. Glazer D, Maturen K, Kaza R, Francis I, Keshavarzi N, Parker R, et al. Adrenal incidentaloma triage with single-source CT. AJR (2014);203:329-335.
57 Clinical case collection
History
Benefits or pitfalls of dual-energy CT
Key images
Findings
77-year-old male with metastatic non-small cell lung cancer. Follow-up CT after chemotherapy.
Demonstration of lack of perfusion and perfusion deficit in lung parenchyma.
Axial and coronal images
Conventional CT scan with contrast showed wedge-shaped consolidation and “ground glass” opacities in the right upper lobe. Right lower lobe pulmonary arteries were encased by the hilar mass. Iodine density and Z effective images demonstrated wedge-shaped area with lack of iodine in the right upper lobe indicating pulmonary infarct and perfusion decrease in the right lower lobe.
Discussion
Iodine density images allow quantification of iodine, which may help to assess the severity of the pulmonary perfusion defects and could be useful to identify occlusive defects/pulmonary infarct.
This case was provided by Begüm Demirler Simsir and Emmanuel Coche, from Cliniques Universitaires St-Luc, Brussels-Belgium.
58 Clinical case collection
Spectral CT in thoracic disorders
Chest Case
Conventional CT, coronal image: lung window shows an area of consolidation in the right upper lobe (arrow) without any parenchymal density change in the right lower lobe.


Iodine density coronal image: lack of iodine in the right upper lobe (0.0 mg/ml, blue arrow), decreased iodine in the right lower lobe (0.3 mg/ml, white arrow) compared to the left lung (1.0 mg/ml, open arrow).


Z effective coronal image: lower effective atomic number (7.17) in the right upper lobe lung area color coded in yellow and red (blue arrow) show no iodine content. Right lower lobe with lower effective atomic number (8.83) and lower iodine content color coded in light blue and yellow (white arrow) compared to left lung with a higher effective atomic number (10.66) color coded in dark blue (open arrow) which corresponds to higher iodine content.

 Conventional CT with contrast, axial image, mediastinal window.
Z effective axial image.
Conventional CT axial image, lung window: wedge-shaped consolidation and “ground glass” opacities (arrow).
Iodine density axial image.
Conventional CT with contrast, axial image, mediastinal window.
Z effective axial image.
Conventional CT axial image, lung window: wedge-shaped consolidation and “ground glass” opacities (arrow).
Iodine density axial image.
59 Clinical case collection
History Benefits or pitfalls of dual-energy CT
Key images Findings
50-year-old female with a history of left breast invasive carcinoma (2001) and a relapse in 2012. Follow-up imaging with spectral CT for a suspicion of distant metastasis.
Demonstration of iodine uptake of irregular pleural thickening with low keV, iodine density, and iodine overlay images, better evaluation of the local invasion of the lesion.
Axial and sagittal images
Conventional CT scan with contrast showed left-sided pleural thickening predominantly at the base of the lung. These lesions were considered as pleural carcinomatosis due to patient’s primary breast carcinoma. Biopsy results showed mesothelioma. Low keV (40 keV) monoenergetic images, iodine overlay images, Z effective, and iodine maps suggested diaphragmatic invasion which was later confirmed by MRI and histology.
Discussion
Spectral CT could be useful in quantitative demonstration of iodine content of pleural lesions and could indicate local invasion to adjacent structures such as diaphragm.
This case was provided by Begüm Demirler Simsir and Emmanuel Coche, from Cliniques Universitaires St-Luc, Brussels-Belgium.
60 Clinical case collection
Case Spectral CT in thoracic disorders
Chest
Conventional CT with contrast, mediastinal window, axial image: (a) demonstrated pleural thickening (arrows). Pleural thickening was more prominent on low keV (40 keV) image (b) (arrows). Iodine density map: (c) quantitatively demonstrated iodine uptake of thickened pleura (2.67 mg/ml and 2.36 mg/ml, arrows). Pleural thickening shown on iodine overlay image (d) (arrows).

A C B D 61 Clinical case collection


A B 62 Clinical case collection Case 2 Chest Continued
Conventional CT, sagittal image: (a) demonstrated the pleural lesion (arrow). Low keV (40 keV) monoenergetic image: (b) delineated the lesion better and was suspicious for diaphragm invasion (arrow).
Z effective sagittal image (a) demonstrated the relation of the pleural lesion that had high iodine content (color coded in dark blue, blue arrow) with diaphragm (color coded in light blue, white arrow). Iodine density sagittal image: (b) quantitatively showed higher iodine content of the lesion (2.52 mg/ml, blue arrow) compared to adjacent diaphragm (1.40 mg/ml, white arrow) suggesting invasion of the diaphragm. Iodine overlay sagittal image: (c) demonstrated the relation of the pleural lesion (blue arrow) with diaphragm (white arrow) suggesting invasion.
PET-CT coronal images: high metabolic activity of left basal pleura (SUVmax: 9.3, blue arrows). Note also the focus in left breast with slightly increased metabolic activity (SUVmax: 4.1, red arrows) which turned out to be a second relapse of breast carcinoma.


A B C 63 Clinical case collection
History
Benefits or pitfalls of dual-energy CT
Key images Findings
Chest and Oncology
Discussion
25-year-old male with Hodgkin’s lymphoma in remission, annual follow-up CT.
Help to evaluate the viability of a mediastinal mass in Hodgkin’s lymphoma in a patient in remission and help to monitor response to therapy.
Axial and coronal images
Conventional follow-up CT scan with contrast demonstrated an anterior mediastinal mass with calcifications, stable in size compared to previous CT examinations. Iodine density and Z effective images showed lack of iodine within the lesion indicative of nonviable/ fibrous residue rather than recurrence. Virtual non-contrast images demonstrated calcification within the mass and attenuation value of the mass (57.3 HU) similar to contrast enhanced images (57.2 HU and 59.8 HU). PET/CT at initial diagnosis, which took place 2.5 years prior, showed high metabolic activity within the enlarged mediastinal mass. After chemotherapy and radiotherapy, PET/CT performed one year later demonstrated significant decrease in size and lack of metabolic activity within the lesion, indicating good response to treatment.
Iodine density and Z effective spectral images may help to evaluate the viability of a mass seen on follow-up CT imaging in lymphoma patients and help to differentiate residual nonviable/fibrous mass from recurrence. Dual-energy CT could have a role in monitoring response to therapy and follow up in lymphoma patients with comparable images to PET/CT.
This case was provided by Begüm Demirler Simsir and Emmanuel Coche, from Cliniques Universitaires St-Luc, Brussels-Belgium.
64 Clinical case collection
Case Spectral CT in thoracic disorders

 Iodine density image: iodine density within the mass (0.34 mg/ml, arrow) is below accuracy threshold of iodine quantification (0.5 mg/ml).
65 Clinical case collection
Conventional CT with contrast, axial image: anterior mediastinal mass (arrow), stable in size.
Conventional CT coronal image, mediastinal window: anterior mediastinal mass with attenuation value of 59.8 HU (arrow).

Virtual non-contrast image: attenuation value of the mass is 57.3 HU and similar to contrast enhanced images (59.8 HU).

Iodine density image: iodine density within the mass (0.42 mg/ml) is below threshold (0.5 mg/ml).

Z effective image: mass shown without iodine content is color coded in yellow.

66 Clinical case collection Case 3 Chest and Oncology Continued

 PET/CT coronal images, performed at the time of diagnosis: large anterior mediastinal mass with high metabolic activity (arrows).
67 Clinical case collection
PET/CT coronal images, follow up 1 year later: significant decrease in size of the anterior mediastinal mass and lack of metabolic activity within the mass (arrows).
Clinical evidence
Spectral CT for cardiovascular disorders
Yining Wang, Department of Radiology, Peking Union Medical College Hospital, Beijing, China
Zhengyu Y. Jin, Department of Radiology, Peking Union Medical College Hospital, Beijing, China
Robbert W. van Hamersvelt, Department of Radiology, Utrecht University Medical Center, Utrecht, The Netherlands
Tim Leiner, Department of Radiology, Utrecht University Medical Center, Utrecht, The Netherlands
Clinical case collection 68
Dual-layer spectral detector CT is an exciting new technology that provides spectral information, and thus, the ability to perform material decomposition imaging (MDI) in all patients. All spectral information is contained in the spectral base image (SBI) data file, and there is no need for apriori specification of desired spectral reconstructions. An important point to emphasize is that due to simultaneous collection of low- and high-energy CT projection data, spectral reconstructions can be made with constant low noise levels, enabling high signal-to-noise ratio from 40-200 keV virtual monoenergetic (monoE) reconstructions.
Spectral CT will add new capabilities to cardiovascular CT. Following is a list of applications:
1) Spectral CT will enable mapping of iodine distribution in the imaged body region and can yield quantitative estimates of end-organ perfusion. Work by our group1 has demonstrated high accuracy for iodine quantification across a broad range of iodine concentrations because of the anti-correlated noise and iterative model-based reconstruction. This feature also enables generation of virtual non-contrast images from a contrast-enhanced data set, thereby potentially saving radiation dose because non-contrast imaging can be omitted.
2) Use of spectral CT has the ability to reduce contrast agent dose. As can be seen in Figure 1, the iodine mass attenuation coefficient has an inverse, near linear dependency on X-ray energy in diagnostic CT range. In other words, low virtual monoenergetic spectral reconstructions will increase iodine attenuation, leading to a brighter iodine “signal” in the vessels compared to conventional CT imaging. This phenomenon allows for a similar degree of vascular enhancement with the use of less iodine.2 Conversely, first-pass CTA-like contrast can be obtained from data sets acquired outside of the arterial phase.

Introduction Clinical case collection 69 Figure 1
3) Spectral CT will enable better visualization of areas with hyper- or hypoperfusion such as myocardial perfusion defects or endoleaks. For the latter application, there is an additional clear benefit because of the potential for substantial radiation-dose savings due to the ability to omit both the non-contrast enhanced as well as the arterial phase scan. Conventional CT techniques rely on a multi-phasic approach for endoleak detection with a non-contrast acquisition followed by arterial-phase and late-phase imaging. Despite this extensive protocol, detection of endoleaks can still be cumbersome, especially when there is slow flow. In the context of endoleak imaging, applications 1 and 2 as discussed previously can be combined to obviate the need for the non-contrast scan, and potentially, the arterial phase images.3 An added advantage is better depiction of stent integrity at high virtual monoenergetic levels.
4) Spectral CT can reduce blooming artifacts, which will enable more accurate assessment of the degree of stenosis in the presence of (partially) calcified atherosclerotic plaques. Not only will this lead to improved stenosis grading, but it will also enable more accurate estimation of pressure gradients across coronary stenoses in virtual fractional flow reserve (FFR) applications, which heavily rely on high-fidelity segmentation of the coronary lumen.
5) Finally, spectral CT enables the use of contrast agents other than iodine. Currently, iodine is the most widely used CT contrast agent, but spectral CT potentially allows for the use of other contrast agents as well. Particularly promising is the use of gadolinium at concentrations currently used for MR imaging. Dual-layer detector CT is also capable of highly accurate gadolinium quantification at concentrations typically seen in the body after injection of 0.1-0.2 mmol/kg body weight.4
Clinical case collection 70
References
1. Pelgrim GJ, van Hamersvelt RW, Willemink MJ, Schmidt BT, Flohr T, Schilham A, Milles J, Oudkerk M, Leiner T, Vliegenthart R. Accuracy of iodine quantification using dual-energy CT in latest generation dual source and dual layer CT. Eur Radiol 2017;27:3904-3912.
2. van Hamersvelt RW, Eijsvoogel NG, Mihl C, de Jong PA, Buls N, Das M, Wildberger JE, Leiner T, Willemink MJ. Reducing iodinated contrast agent concentrations with dual energy CT: a multivendor dynamic phantom study. Presented at ECR 2017 (http://bit.ly/2vW58fC).
3. van Hamersvelt RW, de Jong PA, Dessing TC, Leiner T, Willemink MJ. Dual energy CT to reveal pseudo leakage of frozen elephant trunk. J Cardiovasc Comput Tomogr 2017;11:240-241.
4. van Hamersvelt RW, Willemink MJ, de Jong PA, Milles J, Vlassenbroek A, Schilham AMR, Leiner T. Feasibility and accuracy of dual-layer spectral detector computed tomography for quantification of gadolinium: a phantom study. Eur Radiol 2017;27:3677-3686.
Clinical case collection 71
History
Benefits or pitfalls of dual-energy CT
Key images
Findings
Endoleak
Discussion
66-year-old male with history of abdominal aortic aneurysm for which an endograft was placed.
Spectral virtual low and high monoenergetic images enabled better assessment of endoleak and stent graft integrity.
Axial images
Conventional images show area with faintly higher attenuation dorsolateral to anterior graft leg (red arrow, middle panel). Endoleak is uncertain. Spectral virtual monoenergetic image at 48 keV clearly demonstrates contrast extravasation outside the stent graft, confirming the presence of an endoleak (red arrow, left panel). Spectral virtual monoenergetic image at 200 keV demonstrates irregularity in the anterior stent graft leg, suggesting subtle fracture of the graft, with type IV endoleak (white arrow, right panel).
Conventional CTA for endoleak detection commonly consists of both arterial and late phase acquisitions to maximize the sensitivity for endoleak detection. Spectral CT enables detection of endoleak and evaluation of graft integrity with a single phase acquisition, whereby contrast enhancement and depiction of graft structure can be individually optimized.
72 Clinical case collection
Spectral CT in cardiovascular disorders Case
Transverse slice at level of maximum aortic aneurysm diameter: Spectral virtual monoenergetic image at 48 keV clearly demonstrates endoleak.


Corresponding conventional image: Endoleak is only faintly visible and can easily be overlooked.
Corresponding spectral virtual monoenergetic image at 200 keV: shows subtle distortion of the stent graft.

73 Clinical case collection 1 2 3
History
Benefits or pitfalls of dual-energy CT
Low contrast dose in CCTA
Key images
Findings
Chest discomfort. CT was performed to assess the presence of coronary stenosis.
CT attenuation of the cardiac chambers and coronary arteries was enhanced at lower energy levels using spectral virtual monoenergetic images, which was useful for quantitative analysis of the coronary tree with dedicated software.
Axial images, curved planar reformations (CPR), multiplanar reformations (MPR) and volume rendering (VR)
The CCTA injection protocol consisted of injection of 18 mL of iodinated contrast media (concentration 400 mgI/mL) at a flow rate of 2 mL/s. The poor coronary enhancement at conventional CT made small coronary artery branches invisible. Spectral low keV virtual monoenergetic imaging was used to increase attenuation of iodine-containing coronary arteries, which was conclusive to observe small coronary branches and detect a latent lesion in the right atrium. The iodine density of the lesion in the right atrium was about 0.3 mg/mL, which was indicative of low enhancement.
Discussion
Conventional CCTA demands a relatively large amount of contrast agent to achieve satisfactory contrast enhancement of the coronary lumen, while spectral low keV virtual monoenergetic imaging will achieve equivalent or better enhancement with a reduced dose of contrast agent. In addition, Spectral CT improves the detection of latent lesions, which is complementary to qualitative diagnosis.
74 Clinical case collection
Spectral CT in cardiovascular disorders Case
Conventional Image
Conventional image: Coronary artery lumen appears smaller in conventional CT images compared to spectral low keV virtual monoenergetic image. Note invisibility of small branches.
Monoenergetic 40 keV Image
Conventional Image Monoenergetic 40 keV Image
Spectral virtual monoenergetic 40 keV image: Shows better depiction of both the main coronary arteries (white arrow) as well as small coronary artery branches (yellow arrows).
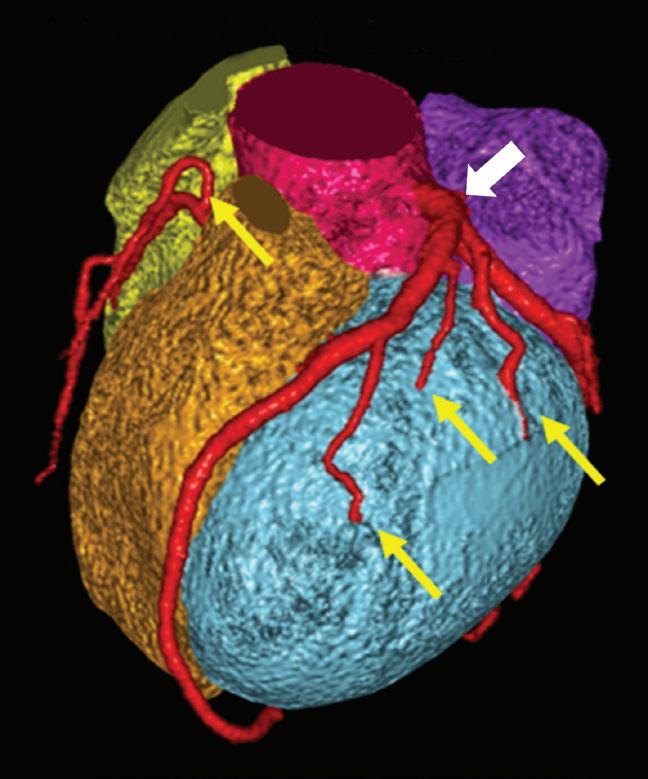


75 Clinical case collection
Conventional image CPR: Shows poor enhancement of the coronary artery lumen. The plaque border in proximal LAD is not clear and image noise is high.


Spectral virtual monoenergetic 40 keV image CPR: Shows excellent coronary enhancement despite low contrast dose. The plaque border in the proximal LAD is clear, and there is less image noise compared to the conventional image.


Iodine density
Conventional image: The left ventricle exhibits good enhancement but opacification of the right half of the heart is poor, limiting differentiation of the myocardium from the blood pool.

Spectral virtual monoenergetic 40 keV image: Shows clear enhancement of both the left and right cardiac chambers, despite the low concentration of contrast agent in the right half of the heart. The improved contrast unveils a lowdensity filling defect in right atrium and the boundary of lesion is clear.
Spectral iodine density map: Shows iodine concentration in different cardiac structures. The lesion in right atrium has no iodine uptake, and the boundary of lesion is clear.
Conventional Image Monoenergetic 40 keV Image
76 Clinical case collection Case 2 Low contrast dose in CCTA Continued
Conventional Image Monoenergetic 40 keV Image
The iodine density of the lesion in right atrium was about 0.3 mg/mL, which demonstrated that iodine uptake was low, indicating low blood supply of the lesion.
Postoperative pathology: The volume of tumor is about 2 x 1 x 1cm, the basal area of tumor is about 1.5 x 0.7cm. Pathological diagnosis: Right atrial myxoma.

Conventional
CT value (HU) Mono E 40 keV CT value (HU) Iodine density (mg/mL) Left ventricle 251.6 550.9 6.1 Right ventricle 67.8 160.4 1.6 Right atrial lesion 45.1 53.9 0.3
Table 1: The measurement values in left and right ventricle and right atrial lesion
image
77 Clinical case collection
History
Tetralogy of Fallot (TOF)
Benefits or pitfalls of dual-energy CT
13-year-old male presented for imaging 13 years after surgery for Tetralogy of Fallot. Physical examination showed pulmonary stenosis six months ago.
The use of spectral low virtual monoenergetic, iodine density, and virtual non-contrast reconstructions allowed for a more detailed evaluation of cardiac anatomy and post-surgical changes after surgery for Tetralogy of Fallot.
Key images
Findings
Axial images, curved planar reformation (CPR)
The conventional image demonstrates enlargement of all cardiac chambers, but the boundaries between the cavities and abnormal cardiac structures are not clear. Spectral virtual monoenergetic 50 keV image and iodine density map allow for improved identification of pulmonary stenosis and overriding aorta, while VNC image clearly shows postoperative changes after ventricular septal defect repair.
Discussion
Due to the low contrast agent dose and altered hemodynamics after surgical correction of Tetralogy of Fallot, there is poor opacification of cardiac chambers, which limits identification of relevant cardiac structures. Spectral CT enabled retrospective identification of all necessary information, which is especially helpful in patients with congenital heart disease.
78 Clinical case collection
Spectral CT in cardiovascular disorders Case
50 keV Image
Conventional image: Coronary and pulmonary arteries cannot be identified clearly.

Spectral virtual monoenergetic 50 keV image: Coronary and pulmonary arteries can be delineated clearly.

79 Clinical case collection
Conventional Image Monoenergetic
Conventional Image
Monoenergetic 50 keV Image
Conventional axial image: The boundaries of the heart chambers are not clear. The CT value of the LV cavity is 158.8 HU.
Spectral virtual monoenergetic 50 keV axial image: Clearly shows the boundaries of all cardiac chambers. The CT value of the LV cavity is boosted to 438.8 HU.


Conventional Image
Monoenergetic 40 keV Image
Conventional image: Aorta and pulmonary artery have poor enhancement and poor contrast.

Monoenergetic 40 keV image: Aorta and pulmonary artery have good contrast, which can display the pulmonary stenosis clearly (arrow).

80 Clinical case collection Case 3 Tetralogy of fallout Continued
Conventional image MPR: Left and right ventricle are poorly enhanced. The lesion with high density (arrow) was suspected as partial ventricular septal defect with aorta overriding left and right ventricles.


Virtual monoenergetic 50 keV image: Left and right ventricles now show good enhancement. The boundary of the membranous septum is clear. The CT value of the lesion (arrow) remains unchanged, which means that this lesion is not a structure that contains contrast agent.


Iodine density
Iodine density image MPR: The lesion (arrow) has no iodine uptake, and thus it was considered as postoperative changes.
VNC image MPR: The lesion with high density (arrow) was considered as postoperative calcification.
Conventional Image Aorta Aorta Aorta Aorta VNC Monoenergetic 50 keV Image
81 Clinical case collection
History
Benefits or pitfalls of dual-energy CT
Key images
Findings
Superior vena cava imaging
Discussion
Dialysis tube placement after surgery, CT re-examination before extubation to exclude thrombus.
Spectral virtual low monoenergetic images increased confidence of evaluation of superior vena cava.
Axial images, multiplanar reformations (MPR)
Enhancement of the superior vena cava in conventional images is not suited for diagnosis. It is impossible to assess the presence of thrombus. Spectral virtual monoenergetic images at 40 keV improved attenuation of iodine and depiction of the superior vena cava. Spectral low keV virtual monoenergetic images, iodine density images, and effective atomic number images are useful for the detection of small thrombus attached to the superior vena cava cannula.
Imaging of the superior vena cava requires the injection of a larger dose of contrast agent in order to achieve satisfactory enhancement. In addition, the conventional helical scan is susceptible to heart and blood vessel pulsation artifacts. The application of prospective ECG-gating scan helps in reducing the radiation dose and avoiding pulsation artifacts. In addition, the spectral virtual low monoenergetic imaging can reduce the amount of contrast agent and improve the detection of small hidden lesions.
82 Clinical case collection
Spectral CT in cardiovascular disorders Case
Conventional image: Attenuation of the superior vena cava lumen is 74.8 HU, and superior vena cava enhancement is insufficient to rule out the presence of thrombus.

Spectral virtual monoenergetic 40 keV image: The CT value of the superior vena cava lumen increased to 164.9 HU, and the superior vena cava is now evaluable. The arrow indicates potential filling defect, suggesting small thrombus.


Injection protocol: Contrast concentration: 370 mgI/mL, Contrast volume 30 mL, flow rate 3 mL/s. The total amount of saline is 40 mL, and the flow rate is 4 mL/s
Scanning protocol: ECG-gating, step-and-shoot, delayed acquisition 60s after contrast injection
Conventional image: The CT value of the superior vena cava lumen was measured to be 74.8 HU.
Spectral virtual monoenergetic 40 keV image: The CT value of the superior vena cava lumen was increased to 164.9 HU. The superior vena cava is now sufficiently enhanced for evaluation. The red circle showed a lowdensity filling defect indicating a suspected small thrombus formation.
Iodine density image: The superior vena cava lumen is filled with iodinecontaining blood, and the red arrow indicates a small area free of iodine. The measured iodine density is 0 mg/mL, suggesting the presence of a small thrombus formation. The blue arrow indicates the superior vena cava cannula (dialysis tube). The yellow arrow shows a little local iodine retention.

Z effective image: The normal superior vena cava lumen exhibited an effective atomic number of 8.5 (light blue color). The red arrow indicates the location of the thrombus on the dialysis cannula with an effective atomic value of 7.3 (orange color).

S1 – superior vena cava S2 – filling defect Conventional image (HU) 74.8 HU 23.9 HU Monoenergetic 40 keV image (HU) 164.9 HU 12.2 HU Iodine density (mg/ml) 1.8 mg/ml 0.0 mg/ml Z effective image 8.5 7.3 83 Clinical case collection
Table 1: Measurement table of superior vena cava lumen and filling defect area
History
Benefits or pitfalls of dual-energy CT
Key images
Findings
Portal vein and inferior vena cava
Discussion
Postoperative CT examination in patient with known liver cancer.
Spectral virtual low monoenergetic images increased attenuation value of portal vein and inferior vena cava to facilitate diagnostic evaluation.
Multiplanar reformation (MPR), volume rendering (VR)
Venous phase images show low luminal contrast leading to low diagnostic confidence. Spectral virtual low monoenergetic reconstructions improved attenuation of iodine, which led to improved opacification of inferior vena cava and the portal venous system. In addition, the spectral low monoenergetic reconstruction improved image quality by reducing noise.
Imaging of the venous system requires the injection of a larger dose of contrast agent to achieve satisfactory enhancement, and the conventional venous phase does not meet the requirements of portal venous and inferior vena cava imaging. Spectral virtual low monoenergetic reconstructions at 40 keV improved intravenous enhancement, facilitating high-quality venous imaging, reduced image noise, improved image quality, and improved depiction of abdominal organ lesions.
84 Clinical case collection
Spectral CT in cardiovascular disorders Case
Injection protocol: Contrast concentration 300 mgI/mL, contrast volume 80 mL, flow rate 2.5 mL/s

Scanning protocol: Venous phase imaging, helical acquisition 65s after contrast injection


Conventional image MPR: Venous phase image shows low attenuation of inferior vena cava, with measured value of 125.4 HU, leading to poor depiction of the inferior vena cava and portal venous system. Note boundary of right adrenal space.


Conventional image VR: Venous phase image shows poor depiction of inferior vena cava and portal venous systems.

Spectral virtual monoenergetic 40 keV image, MPR: The CT value of the inferior vena cava lumen increased to 380.6 HU. Attenuation of the inferior vena cava and portal venous system is now good, and the portal venous tortuous vascular mass was observed. Note lower image noise compared to the conventional image, and the improved definition of right adrenal gland including the inner cystic necrotic area.
Spectral virtual monoenergetic 40 keV image, VR: The inferior vena cava and portal venous system can be clearly seen, showing portal venous distortion and dilation, with good vascular enhancement. The right adrenal gland is indicated in purple.
Conventional Image MPR
Monoenergetic 40 keV Image MPR
Conventional Image VR
85 Clinical case collection
Monoenergetic 40 keV Image VR
History
Myocardial ischemia 1
Benefits or pitfalls of dual-energy CT
Key images
Findings
Patient presented with intermittent chest pain and congestion for one month. ECG showed a QS segment or Q-wave in leads V1-V2. Echocardiography showed a decline of left ventricular diastolic function.
Low monoenergetic, iodine density, and effective atomic number (Z effective) spectral image reconstructions improve visualization of the myocardial perfusion defect compared to conventional CT.
Axial images
The conventional images showed low attenuation of second diagonal branch, but there was no obvious myocardial density abnormality in conventional short axis images. Z effective map, iodine density map, and fusion images clearly showed the ischemic myocardial area. No iodine uptake was found given the iodine density in the region of interest (0 mg/ml). Effective atomic number (7.2) was significantly lower than that of the surrounding normal myocardium (8.7).
Discussion
Conventional CCTA enables detection of coronary artery stenosis and coronary artery plaque, but cannot evaluate myocardial ischemia. Spectral CT analysis can assist in the diagnosis of myocardial ischemia downstream to coronary stenoses and is more sensitive compared to using HU values for this purpose.
86 Clinical case collection
Spectral CT in cardiovascular disorders Case
Conventional CT VR image: shows mixed plaque, calcifications, and tapering of the distal part of the left coronary artery system and interruption of the second diagonal branch (D2) (arrow).


Conventional MIP image: shows absence of contrast medium in the distal D2 branch (arrow).

Corresponding invasive digital subtraction angiography: confirms distal D2 occlusion (arrow).
Conventional CT image in midventricular short axis orientation: Shows homogeneous left ventricular wall thickness without obvious attenuation differences.

Fusion of conventional CT with spectral Z effective image: Shows abnormally low Z effective values in the left ventricular anteroseptal myocardium (color coded in purple, arrow).

Spectral Iodine no Water image: Shows lack of iodine uptake in the left ventricular anteroseptal myocardium (0.0 mg/ml, arrow) compared to remote normal appearing myocardium (2.2-2.3 mg/ml).
Spectral Z effective image: Shows abnormally lower effective atomic number (7.2, arrow) in left ventricular anteroseptal myocardium compared to normal appearing myocardium (8.7).
 Image 1
Image 4
Image 6
Image 2
Image 3
Image 5
Image 1
Image 4
Image 6
Image 2
Image 3
Image 5
87 Clinical case collection
Image 7
History
Benefits or pitfalls of dual-energy CT
Key images
Myocardial ischemia 2
Findings
59-year-old male with history of stable chest pain.
Spectral iodine density and Z effective images unmask myocardial perfusion defect in patient with coronary artery disease.
Short axis conventional and short axis spectral iodine density and Z effective multiplanar reformations (MPR), invasive coronary angiogram
Conventional image shows relatively uniform density of the myocardium, although there are subtle differences in HU values. Spectral iodine density and Z effective images, however, clearly unmask a large perfusion defect in the antero- and inferoseptal regions. Invasive coronary angiography with fractional flow reserve (FFR) measurement confirms presence of significant coronary stenosis in the left anterior descending coronary artery which supplies the hypoperfused region of the septum.
Discussion
Spectral CT allows for evaluation of the significance of coronary artery stenosis by enabling quantitative assessment of myocardial iodine distribution. This may aid in the selection of patients for percutaneous coronary angioplasty.
88 Clinical case collection
Spectral CT in cardiovascular disorders Case
Short axis MPR of conventional CT image: Shows near homogeneous enhancement of the LV myocardium, although there are subtle differences in HU values of the different regions of interest.


Spectral iodine density map in the short axis orientation: Clearly shows a large perfusion defect with very low iodine concentration (0.2 mg/mL, red arrow) compared to normally enhancing remote areas of the myocardium (between 1.0-1.8 mg/mL iodine uptake).

Spectral Z effective map in the short axis orientation: Confirms low iodine concentration. The effective atomic number of the perfusion defect is close to water (7.3), whereas normally enhancing remote areas of the myocardium have an effective atomic number of close to 8.0 because of iodine uptake.
Invasive coronary angiography: Confirms the presence of significant LAD stenosis. The FFR value was 0.7 (normal: > 0.8).

89 Clinical case collection
History
Benefits or pitfalls of dual-energy CT
Key images
Findings
Heavily calcified coronary arteries
Discussion
70-year-old male with history of atypical chest pain.
Spectral Iodine no Water images enabled better assessment of coronary artery lumen in a patient with heavily calcified coronary arteries.
Axial images, curved multiplanar reformation (MPR)
Conventional image shows heavily calcified proximal left anterior descending coronary artery (LAD). The lumen is essentially nonevaluable rendering the study non-diagnostic. Spectral Iodine no Water source image and stretched MPR depicts the vascular lumen selectively and is capable of removing most of the vascular wall calcium. The lumen can now be evaluated, showing that the origin of the left main coronary is narrowed, whereas the distal left main and LAD appear to be patent without significant stenosis.
Spectral CT allows for reduction of the impact of coronary vascular wall calcium on evaluation of the presence and degree of coronary artery stenosis. In addition, reconstructions can be created that allow for quantitative evaluation of iodine uptake in the myocardium.
90 Clinical case collection
Spectral CT in cardiovascular disorders Case
Conventional CT image: Shows heavy calcifications in the proximal LAD (red arrow), which makes evaluation of this vessel impossible.

Spectral Iodine no Water image: Shows greatly reduced calcium burden, which makes the LAD evaluable. There is a significant stenosis at the ostium of the left main coronary artery (red arrow). Further distally, there are no significant lesions in the proximal LAD.

91 Clinical case collection
History
Coronary plaque evaluation
Benefits or pitfalls of dual-energy CT
Patient presented with sudden chest pain at night, sweating and chest congestion, and pain radiating to left upper limb. V1 - V5 ST segment elevation on ECG, diagnosed as acute ST-elevation myocardial infarction (Killip grade 1).
Virtual monoenergetic images at high keV are effective in reducing blooming artifacts from the mixed plaque and in more clearly displaying the stenosis of the coronary lumen. Virtual monoenergetic images at low keV and Z effective maps are useful for differentiating the plaque composition.
Key images
Findings
Axial images, curved plane reformatted (CPR) images
Multiple lesions were shown in the coronary arteries, including a mixed plaque at the proximal right coronary artery. Monoenergetic 90 keV images reduced the blooming artifact from calcifications and provided a better estimation of the lumen stenosis. Iodine no Water, monoenergetic 60 keV, monoenergetic 200 keV images, and Z effective maps demonstrated the plaque composition clearly.
Discussion
CCTA spectral imaging not only provides conventional coronary artery images but also reduces blooming artifacts from calcifications and helps in differentiating the composition of different types of plaques.
92 Clinical case collection
Spectral CT in cardiovascular disorders Case
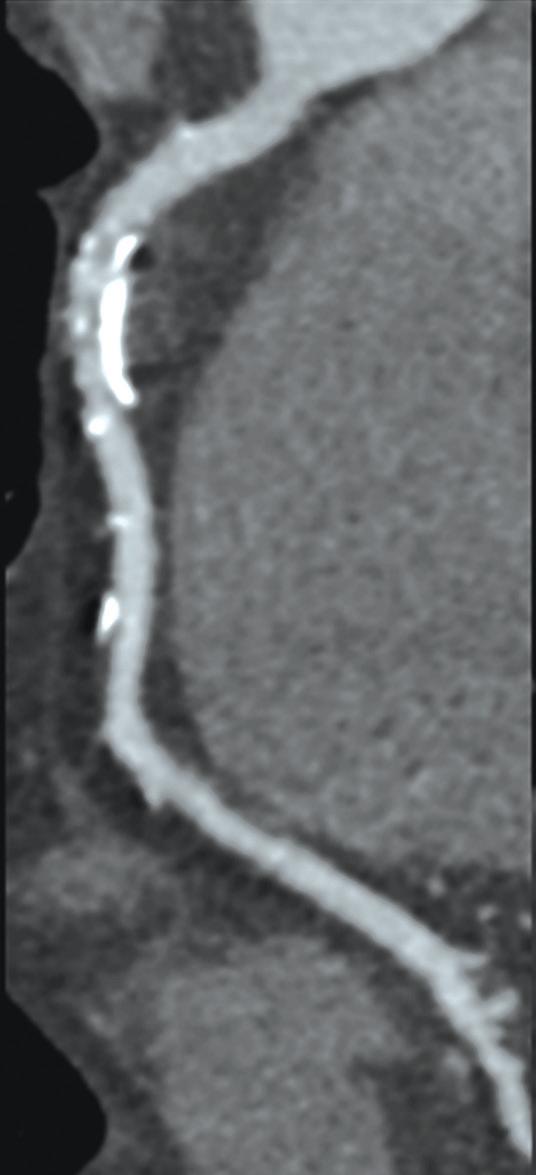


 Image 1: Volume rendering (VR) of coronary artery tree, multiple lesions and coronary artery stenoses were found.
Image 2-4, CPR images of coronary arteries: indicate stenoses and a mixed plaque at the proximal right coronary artery (RCA).
Image 2: Conventional CT images, WL/WW:200/1000 HU
Image 6: Coronary stenosis estimation was improved using virtual monoenergetic 90 keV images.
Image 5, conventional CT images: Over-estimation of stenosis due to blooming artifacts from calcifications.
Axial images of RCA
Image 3: Conventional CT images, WL/WW:300/1500 HU
Image 7, conventional CT images: Over-estimation of stenosis due to blooming artifacts from calcifications.
Image 4: Monoenergetic 90 keV images, WL/WW:200/1000 HU
Image 1: Volume rendering (VR) of coronary artery tree, multiple lesions and coronary artery stenoses were found.
Image 2-4, CPR images of coronary arteries: indicate stenoses and a mixed plaque at the proximal right coronary artery (RCA).
Image 2: Conventional CT images, WL/WW:200/1000 HU
Image 6: Coronary stenosis estimation was improved using virtual monoenergetic 90 keV images.
Image 5, conventional CT images: Over-estimation of stenosis due to blooming artifacts from calcifications.
Axial images of RCA
Image 3: Conventional CT images, WL/WW:300/1500 HU
Image 7, conventional CT images: Over-estimation of stenosis due to blooming artifacts from calcifications.
Image 4: Monoenergetic 90 keV images, WL/WW:200/1000 HU
93 Clinical case collection 1 5 2 6 3 7 4 8
Image 8: Coronary stenosis estimation was improved using virtual monoenergetic 90 keV images.


 Image 10, RCA VR from conventional CT images: severe stenosis at middle segment of RCA (arrow).
Image 9: DSA showed mild stenoses at proximal and middle segments of RCA, which were in accordance with results shown in monoenergetic 90 keV images (arrow).
Image 10, RCA VR from conventional CT images: severe stenosis at middle segment of RCA (arrow).
Image 9: DSA showed mild stenoses at proximal and middle segments of RCA, which were in accordance with results shown in monoenergetic 90 keV images (arrow).
94 Clinical case collection Case 9 Coronary plaque evaluation Continued 9 10 11
Image 11, RCA MIP from conventional CT images: severe stenosis at middle segment of RCA (arrow).

95 Clinical case collection 12
Image 12: CPR of RCA, monoenergetic 90 keV image showed the mixed plaque. Spectral Magic Glass shows the detail of green cubic ROI: Iodine no water, monoenergetic 60 keV, Z effective, and monoenergetic 200 keV images can help to indicate the plaque composition, calcification (dark blue arrow) and non-calcified plaque (light blue arrow).
History
Benefits or pitfalls of dual-energy CT
Key images
Findings
Coronary artery stent evaluation
Discussion
Patient with cardiac disease, previous myocardial infarction located in the inferior and posterior wall.
Iodine no Water images highlighted the iodine uptake while reducing the metal artifacts of the stent. Stent lumen was also better evaluated.
Axial images, curved plane reformatted (CPR) images
Due to metal artifacts, conventional CCTA image was unable to show the in-stent situation clearly. However, monoenergetic 50 keV and Iodine no Water images could be used to evaluate the restenosis. Z effective images helped differentiate the components of the plaque. Monoenergetic 50 keV images also clearly showed the myocardium defect, which was obviously different from the normal tissue. Iodine no Water images showed the low iodine content.
Detection of stent restenosis is particularly important for coronary stent follow-up examination. Conventional images can be challenging to interpret due to metal artifacts. Therefore, an analysis with multiple spectral results (monoenergetic 50 keV, Iodine no Water, Z effective image) can be used to display the restenosis of the stent and can also show the myocardial ischemia of the endocardium and help to more accurately evaluate the status of the coronary arteries and myocardium
96 Clinical case collection
Spectral CT in cardiovascular disorders Case


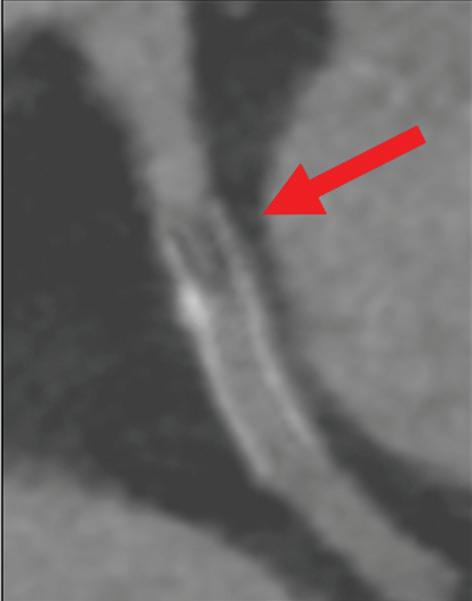 Image 2d: Magnified view of the coronary stent (arrow).
Image 2b, Conventional CPR image of circumflex artery: Even after adjusting WL and WW, inner stent attenuation difference still cannot be shown clearly.
Image 2c, Circumflex artery Iodine no Water CPR image: Metal artifacts are effectively reduced and in-stent plaque is shown more clearly (arrow).
Image 2a, Conventional CPR image of circumflex artery: Proximal circumflex artery cannot reflect stent patency due to metal artifacts.
Image 2d: Magnified view of the coronary stent (arrow).
Image 2b, Conventional CPR image of circumflex artery: Even after adjusting WL and WW, inner stent attenuation difference still cannot be shown clearly.
Image 2c, Circumflex artery Iodine no Water CPR image: Metal artifacts are effectively reduced and in-stent plaque is shown more clearly (arrow).
Image 2a, Conventional CPR image of circumflex artery: Proximal circumflex artery cannot reflect stent patency due to metal artifacts.
97 Clinical case collection 1 2a
2b 2c
Image 1, Conventional volume rendered (VR) image of the circumflex artery after stent implantation: Stent was indicated by the yellow arrow.
2d
Image
Monoenergetic 150 keV image: CT value of contrast medium in the blood is decreased. The plaque visualization is therefore poor. However, the stent metal artifacts are reduced effectively, and the stent is displayed more clearly.
Monoenergetic 50 keV image: CT value of the contrast medium in the blood is increased, the contrast between plaque and contrast medium contained in the stent is improved. The plaque in the stent is shown clearly (arrow).

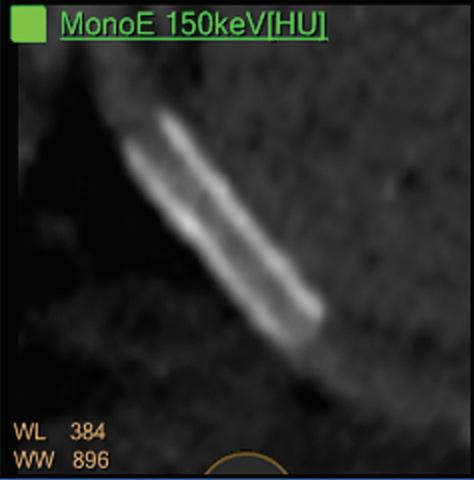

Image
Water
Highlights the contrast media, plaque in stent is clearly displayed (arrow).


Image
Stent, iodine, and plaque in stent were shown in different colors because of their different effective atomic numbers. Plaque in stent is demonstrated clearly (arrow).
3d, Z effective image:
Image 3c, Iodine no
image:
3b,
3a,
DSA image (Image 4a) indicated that there is a moderate stenosis in the proximal left circumflex artery (arrow) which is in accordance with the results shown in Iodine no Water image (Image 4b).
98 Clinical case collection Case 10 Coronary
stent evaluation Continued 3a 4a 4b 3b 3c 3d
Image 3, Left circumflex artery CPR images: In-stent plaque occurred after stent implantation. Spectral Magic Glass result is shown above.
artery
All spectral images clearly showed subendocardial perfusion defect in the inferior wall of the myocardium.


99 Clinical case collection
Image 7, Cardiac axial Z effective fused image: Abnormal Z effective number in the inferior wall of the myocardium (arrow).
Image 6, Cardiac axial Iodine no Water image: Band of low iodine uptake in the inferior wall of the myocardium (arrow).
5 6 7
Image 5, Left circumflex artery monoenergetic 50 keV CPR image: Band of low attenuation area in the inferior wall of the myocardium (arrow).
History
Cardiac thrombus
Benefits or pitfalls of dual-energy CT
Young female patient with retrosternal pain for four months; HR 89 BPM, arrhythmia; ECG showed arrhythmia and persistent atrial fibrillation. Echocardiography: 23x35mm irregular soft tissue abnormality located close to ascending aortic root.
One benefit of CCTA spectral imaging on the IQon Spectral CT is the ability to use the iodine measurement tool to differentiate thrombus from atrial slow flow; in this case, in the low attenuation area located in the left atrial appendage.
Key images
Findings
Axial and sagittal images
Conventional CT image with contrast showed low attenuation in the left atrial appendage (CT value 50.9 HU). However, differentiation between a soft tissue mass, thrombus, or atrial slow flow was not possible. Iodine density of the lesion was 0 mg/ml, indicating lack of iodine within the lesion.
The spectral attenuation curve of the lesion was flat, showing that the changes in the CT number of the lesion were not significant with an increasing energy. Based on that, the spectrum analysis finally suggested that the lesion in the left atrial appendage was a thrombus.
Discussion
CT value of left atrial appendage was 50.9 HU, which was close to soft tissue in conventional CCTA images; therefore, the lesion could not be clearly characterized. However, demonstration of lack of iodine (0 mg/ml) on iodine density images allowed the clinician to clearly rule out the possibility of atrial slow flow and soft tissue lesions.
100 Clinical case collection
Spectral CT in cardiovascular disorders Case

 Image 1, conventional image: Low attenuation area in left atrial appendage (arrow).
101 Clinical case collection 1 2
Image 2, Iodine no Water image: Area of low iodine uptake in left atrial appendage (arrow).
Images 3b and 3c: The lesion visualization was improved at monoenergetic 40 keV (3b) compared to 90 keV (3c) images. Monoenergetic 40 keV image (3b) increased the CT value of the heart chambers allowing a larger contrast difference between left atrial appendage content and normal heart chambers, with only a minimal increase in noise.


effective
lesion was color coded in orange in Z effective map, corresponding to an abnormally low value.
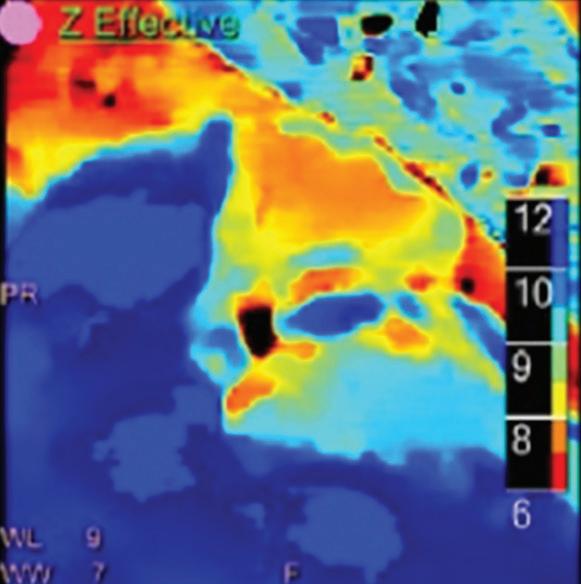 Image 3a: Spectral Magic Glass green box focused on the left atrial appendage abnormality (arrow).
Image 3d, Iodine no Water image: Highlighted the difference between the lesion and normal enhanced chamber.
Image 3a: Spectral Magic Glass green box focused on the left atrial appendage abnormality (arrow).
Image 3d, Iodine no Water image: Highlighted the difference between the lesion and normal enhanced chamber.
102 Clinical case collection Case 11 Cardiac thrombus Continued 3a
Image 3e, Z
image: Left atrial appendage
3b
3c
3d
3e
Details of iodine density and Z effective numbers related to images 4 and


 Image 5, iodine density map: No iodine uptake in left atrial appendage abnormality (0.0 mg/ml, blue circle).
Image 4, Z effective image: Effective atomic number of the lesion in left atrial appendage, color coded in dark orange, is lower (7.3, blue circle) than the chamber (12.8, purple circle) and the myocardium (10.2, green circle).
Image 6, spectral attenuation curve analysis: Mean attenuation of the lesion in left atrial appendage (indicated as S1) does not change as keV increases.
Image 5, iodine density map: No iodine uptake in left atrial appendage abnormality (0.0 mg/ml, blue circle).
Image 4, Z effective image: Effective atomic number of the lesion in left atrial appendage, color coded in dark orange, is lower (7.3, blue circle) than the chamber (12.8, purple circle) and the myocardium (10.2, green circle).
Image 6, spectral attenuation curve analysis: Mean attenuation of the lesion in left atrial appendage (indicated as S1) does not change as keV increases.
S1 (lesion) S2 (left
Iodine density (mg/ml) 0.0 15.9 5.9 Z effective number 7.3 12.8 10.2 103 Clinical case collection 4 6 5
5.
artial appendage) S3 (myocardium)
History
Cardiac tumor
Benefits or pitfalls of dual-energy CT
61-year-old female, BMI 28.5 kg/m,2 HR 72-82 bpm presented with episodic chest pain with night sweats for 4 months, fever for 2 weeks. No cardiac structural change or vascular modification detected on echocardiography.
Besides providing information about coronary artery anatomy, CCTA spectral imaging can also be used to determine the different tissue components of the space-occupying lesions and to determine pericardial metastasis.
Key images
Findings
Axial images, volume rendered (VR) images
On conventional CT images accurate analysis of the mediastinal space-occupying lesion was not obvious. The measured CT value was 60.1 HU at the periphery (S1) and 30.5 HU in the central part of the lesion (S3). On monoenergetic 50 keV images, the peripheral areas appeared more dense with a CT value 117 HU, while the CT value of the central portion appeared less dense with a density of only 13.2 HU. Iodine density images demonstrated iodine uptake of the peripheral areas of the lesion (0.8 mg/ml), while the central area of the lesion showed no blood supply (0 mg/ml). Z effective images also showed a difference between effective atomic numbers of the periphery compared to the central area (7.9 and 7.1 respectively). However, no difference in iodine content or effective atomic numbers was found between peripheral areas of the space occupying lesion and the thickened pericardium (S2, see Table 1).
In spectral analysis, the spectral attenuation curves, Z effective map, histogram, monoenergetic 50 keV CT value, and scatter plot of S1 and S2 were basically similar, suggesting that they were homologous. The central area of the lesion (S3) was completely different from S1 and S2, suggesting they were non-homologous.
Discussion
In spectral analysis, the distribution patterns of spectral curves, histograms, and scatter plots of various tissue components are different, and this can help to determine the tissue homology.
104 Clinical case collection
Spectral CT in cardiovascular disorders Case
Conventional CCTA image showed the details of different branches of coronary arteries. The position of RCA, right atrium and right ventricle were changed due to the space occupying lesion. The lumen of the RCA was also narrowed (red arrow). VR image showed the occupying lesion in the mediastinum (blue color). Images 4a-d showed the axial views of the heart. The heterogeneous low attenuation lesion was adjacent to the ascending aorta and the pulmonary artery trunk. Irregularly thickened pericardium was also noted.


Monoenergetic 50 keV
Iodine density image
Z effective image
Monoenergetic 50 keV, Iodine density, Z effective images showed that the periphery of the lesion was solid and enhancing; however, no enhancement was found in the central area. Quantitative measurements of the solid peripheral components of the lesion, thickened pericardium, and the central area of the lesion were shown as follows:
Table 1: Quantitative measurement
S1 - solid component of the lesion
S2 - thickened pericardium
Conventional CT value 60.1 HU 53.3 HU 30.5 HU Monoenergetic 50 keV CT value 117.0 HU 114.8 HU 13.2 HU Iodine density 0.8 mg/ml 0.7 mg/ml 0.0 mg/ml Z effective number 7.9 7.8 7.1 105 Clinical case collection 1 5 6 7 2 3 4 a c b d
S3 - core of the lesion
Spectral attenuation curves: S1 and S2 are two similar curves, indicating that S1 and S2 are homologous.

S3 is different from S1 and S2, which means that they are non-homologous.
Histogram Z effective: Histogram of S1 and S2 are similar, which means that they are homologous. S3 is non-homologous with S1 and S2.

Z effective/monoenergetic 50 keV scatter plot showed that the distribution of S1 and S2 are similar, which means they are homologous. However, the distribution of S3 is different from S1 and S2, which means they are non-homologous.

106 Clinical case collection Case 12 Cardiac tumor Continued 8 9 10
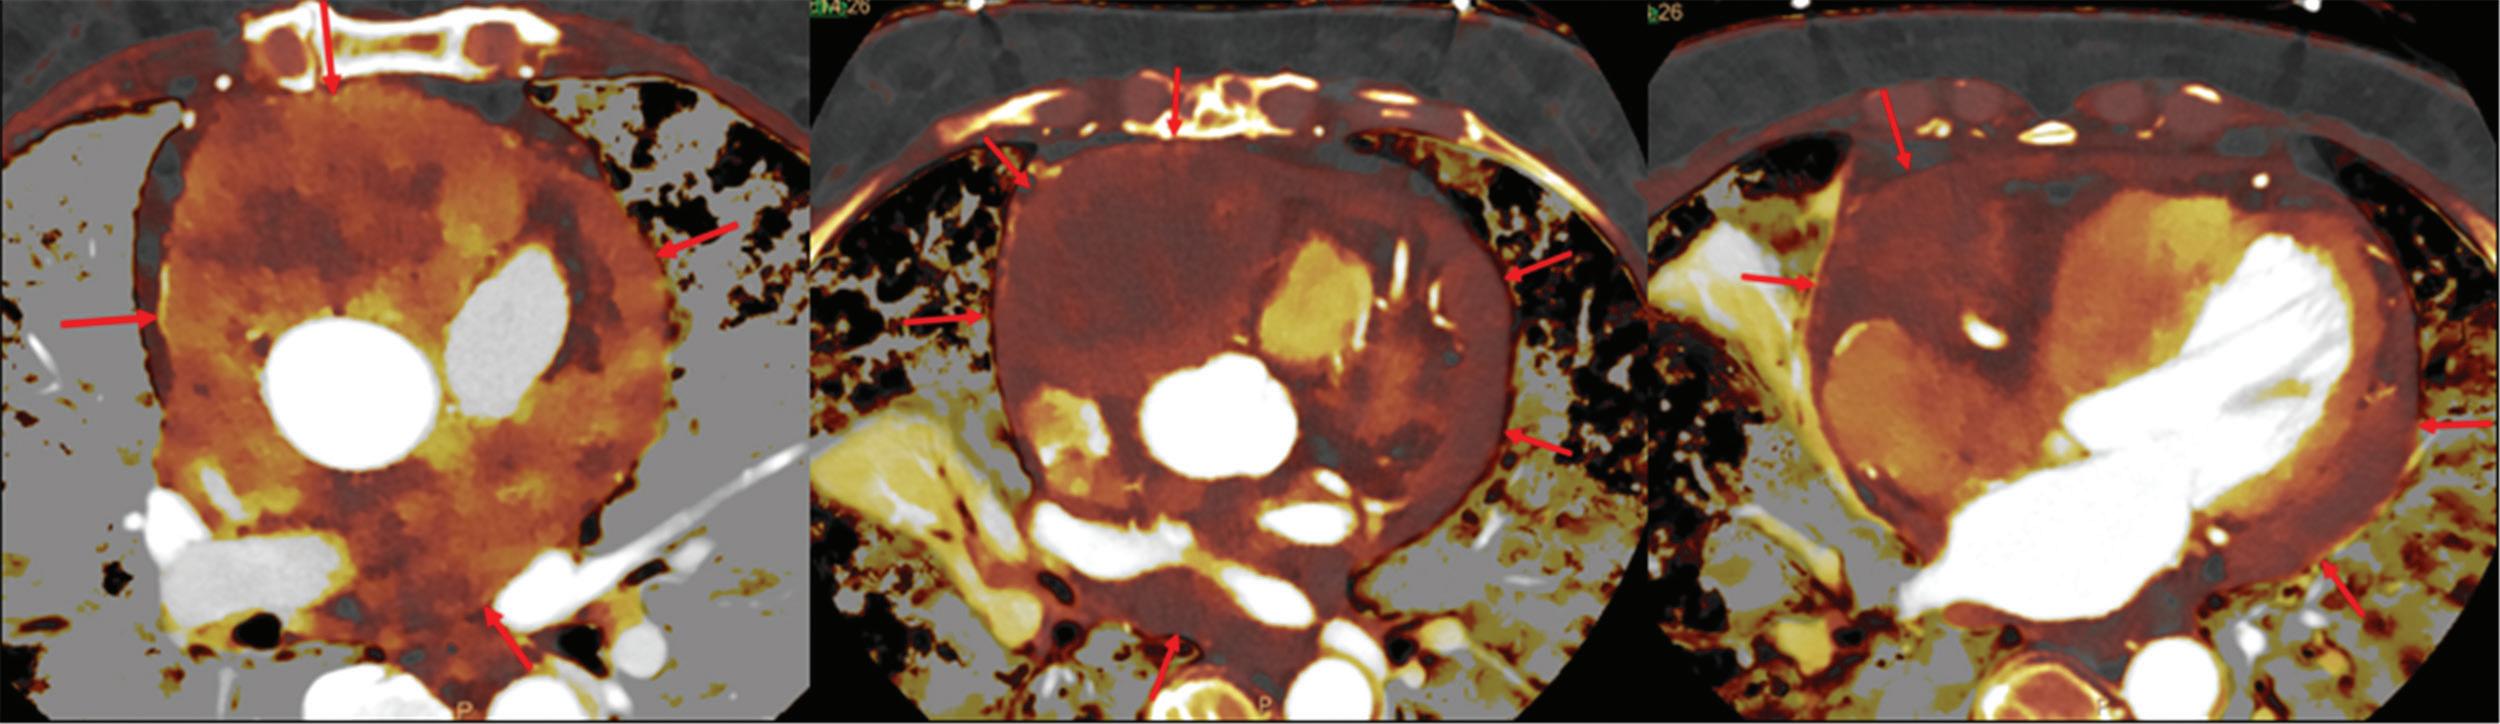
 Image 12: PET/CT images, multiple space-occupying lesions which have already metastasized to pericardium (arrows). This result was also proved by PET/CT.
CT guided pericardial biopsy: (Pericardial mass), papillary arranged atypical cells. Considering the result with immunohistochemistry, it is suggested to be mesothelioma, with fibrous tissue at one side.
Image 12: PET/CT images, multiple space-occupying lesions which have already metastasized to pericardium (arrows). This result was also proved by PET/CT.
CT guided pericardial biopsy: (Pericardial mass), papillary arranged atypical cells. Considering the result with immunohistochemistry, it is suggested to be mesothelioma, with fibrous tissue at one side.
107 Clinical case collection 11 12
Image 11: Z effective fused images
Spectral CT in abdominal disorders
Etienne Danse, MD, PhD, Director of the CT Unit, Department of Radiology, Cliniques Universitaires St-Luc, Brussels, Belgium
Begüm Demirler Șimșir, MD, visiting research fellow, Department of Radiology, Cliniques Universitaires St-Luc, Brussels, Belgium
Emmanuel Coche, MD, PhD, Head of Department of Radiology, Cliniques Universitaires St-Luc, Brussels, Belgium
Clinical case collection 108
Clinical evidence
Introduction
The IQon Spectral CT uses dual-energy spectral technology to provide users with enhanced imaging capabilities, helping to improve diagnostic confidence. Dual-energy CT (DECT) has existed in clinical practice for many years. There are a number of publications and clinical studies available that demonstrate the major capabilities of DECT based on its image quality improvement with monoenergetic reconstructions, virtual non-enhanced reconstructed images, and material decomposition images.1
In this chapter, we will focus on the significance and benefits of spectral CT in abdominal imaging, using several powerful examples based on our experiences to support our discussion, as well as a comparison of both phantom and patient images obtained from the IQon Spectral CT versus those from a single layer 64-row CT. After a thorough review, a statistically significant increase in global image quality in images obtained from the spectral CT, including visualization of the splanchnic vascular network, has been demonstrated.2
The tools derived from spectral CT for abdominal analysis
Virtual non-contrast reconstructed images, monoenergetic images at different energy levels from 40 to 200 keV, iodine maps, and Z effective maps are the spectral results commonly reviewed when spectral CT examinations are performed for abdominal imaging. The only requirement is to scan the patients with an X-ray tube operated at 120 kVp or 140 kVp.
Virtual non-contrast images
The iodine extraction is optimal on portal series and can be done on arterial phase when liver protocols are performed.3 Presently, software is unable to extract excretory phases containing an excess of iodine contrast within the urinary tract.4 Skipping the true noncontrast series when they were initially needed helps to reduce the radiation dose. In a study including 202 patients with acute abdominal pain, mean CT attenuation values were similar on VNC compared to true non-contrast images, with good image quality, mild noise, and good acceptability. Detection of hemorrhage was similar by both VNC and true non-contrast images, whereas the radiation dose was reduced by 33-47% when true non-contrast images were omitted.5 With spectral CT systems, the attenuation values of different tissues of the abdominal area have showed comparable and valid values between VNC and true non-contrast acquisition, apart from subcutaneous fat tissue.4 It should be noted though that some recent studies have shown contradictory results and demonstrated substantial differences between fluid, fat, and renal tissues on virtual non-contrast images and true non-contrast acquisitions.6
Monoenergetic images
Virtual monoenergetic (MonoE) images could be reconstructed from 40 to 200 keV. For the analysis, image quality from reconstructed 70 keV spectral images and conventional images acquired at 120 kVp were compared. The 70 keV spectral images were found to demonstrate better image quality compared to the conventional images.7
In routine practice, we recommend using virtual monoenergetic images reconstructed at a low energy level to help enhance iodine contrast within vessels as well as the viscerae. This assists clinicians in better detection of hypervascular lesions at the arterial phase compared to conventional images.8
Clinical case collection 109
Low-energy monoenergetic images
On unenhanced acquisitions, low-energy reconstruction helps increase detection of initially non-visible structures, like gallbladder and biliary stones9,10 (Figure 1). On enhanced CT acquisitions, the availability of lower energy reconstructed images has multiple advantages:11,12
• For strictly vascular applications, the amount of iodine volume can be reduced to 50%, without impacting diagnostic capabilities
• The use of higher iodine contrast medium is not required
• Detection of hypervascular lesions at the arterial phase is optimized
• Detection of bleeding sources is optimized in acute settings (Figure 2)
• Assessment of organ perfusion is optimized, particularly for the bowel and the liver
Excellent quality images are also obtained with 350 to 370 mg/ml iodine contrast concentrations, which means that higher iodine concentrations are not required for common angiographic CT examinations of the abdomen.
In patients with renal function impairment, when the clinical question is focused on a vascular problem or a hypervascular condition visible at the arterial phase, spectral CT images can be useful in enabling the use of reduced contrast medium with the combination of image reconstruction at lower energies.13
For vascular applications, this approach has great diagnostic value for demonstrating vessel patency, or for endoleak detection when endovascular prosthesis controls are performed with CT angiography.11,14
High-energy monoenergetic images
This option is useful for optimal detection of slightly calcified gallbladder stones.15 In addition, when combined with a dedicated metal artifact reduction software such as OMAR, this type of spectral result can greatly reduce streak artifact caused by the presence of metal objects.16
Iodine maps
Iodine maps can be a great help with perfusion assessments of the liver, kidney, pancreas, and bowel wall, as well as perfusion defects within the gallbladder wall.
The amount of iodine in the area selected or region of interest (ROI) is measured in mg/ml. In the abdominal area, it can help to confirm the presence or absence of iodine uptake (>= 0.5 mg/ml is the cut-off value).
Z effective values of the tissue
The Z effective color map of a selected slice can be of great clinical value in the identification or assessment of an organ perfusion, helping to enhance tissue structures and allowing a clinician to more clearly visualize a normal status versus perfusion abnormalities.
Detection of cholesterol stones in the biliary tract and the amount of cholesterol within the considered stone are possible by simply looking at the color content of the gallbladder stones which are similar to the fatty tissue of the abdomen (Figure 1).
Clinical case collection 110
(a) Conventional CT shows enlarged common bile duct (arrow) without identification of the cause.

(b) Monoenergetic image at 40 keV demonstrates a hypoattenuating round-shaped lesion (arrow).

(c) Virtual non-contrast image demonstrates lack of calcium content of the lesion. (d) Z effective map demonstrates the lesion with a low atomic number color coded in orange/red (arrow) related to an entrapped cholesterol stone (which was later endoscopically removed).
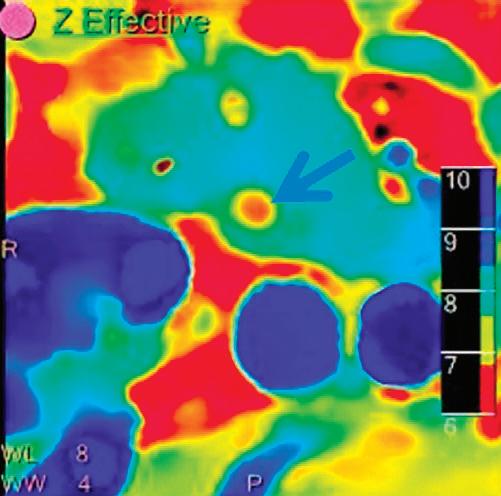


Patient with acute necrotizing pancreatitis and active bleeding detected with CT. (a) 3D reconstruction conventional series: bleeding is shown (frame), the left gastric artery is not visible. (b) 3D reconstruction monoenergetic (40 keV): improved visualization of the vessels, a part of the left gastric artery is visible (arrow). (c) Angiography: left gastric artery (arrows) is demonstrated as the source of the bleeding (frame).
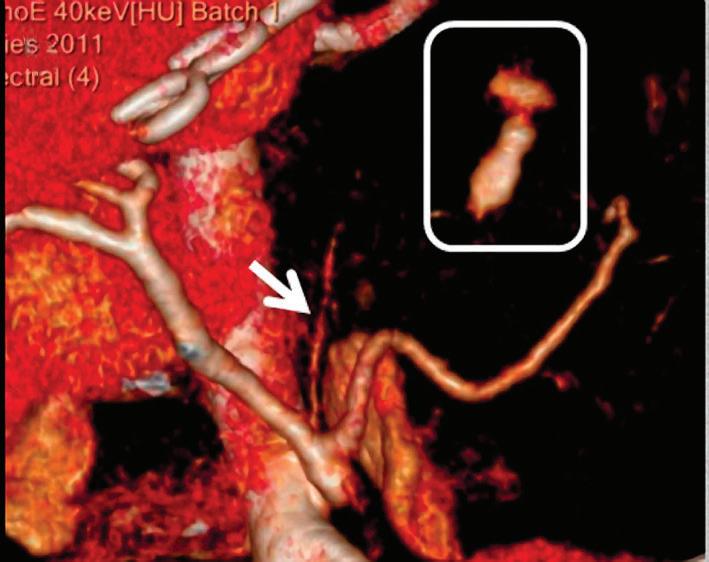
Clinical case collection 111
Figure 2
Figure 1
A A B C B C D
Improved detection of right-sided renal infarct with spectral data (upper row). (a) Conventional portal phase image: demonstrates a hypodense parenchymal area (arrow). (b) Iodine no Water image: demonstrates low iodine content (0.56 mg/ml), (upper to the iodine uptake threshold value of 0.5 mg/ml) in this area (arrow) compared to normal appearing adjacent parenchyma (5.64 mg/ml). (c) Z effective map: demonstrates the infarct area color coded in yellow (arrow) and normal appearing adjacent renal parenchyma color coded in dark blue.

Improved detection of pyelonephritis (lower row). (a) Conventional portal phase image: demonstrates a hypodense paranchymal area (arrow). (b) Iodine no Water image: demonstrates the hypoperfused area with lower iodine content (arrow) compared to normal appearing renal parenchyma (iodine contents; 3.49 mg/ml and 5.42 mg/ml respectively). (c) Z effective map demonstrates this area color coded in light blue (arrow) and normal appearing renal parenchyma color coded in dark blue.

As well as improving detection of renal infarcts and pyelonephritis, spectral CT could also help in differential diagnosis by allowing iodine quantification when conventional CT appearances of renal infarct and pyelonephritis overlap.


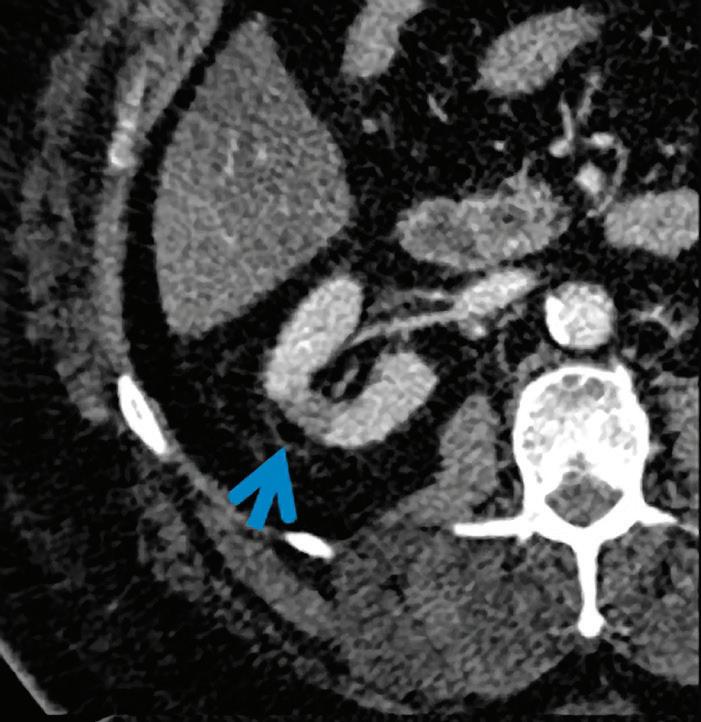
Clinical case collection 112
Figure 3
A D B E C F
Common and uncommon abdominal applications of spectral CT
Routine use of spectral CT in abdominal examinations has helped give rise to a greater understanding of many conditions, in acute settings, in oncology, and in the management of chronic disorders such as kidney and biliary stones. Additionally, studies have shown that it can reduce the need for follow-up exams as clinicians benefit from access to a greater number of enhanced tools and imaging results available for image analysis on spectral imaging systems.17
There are multiple papers available concluding that spectral CT gives reliable image quality, without dose penalty for the patient.18-20
Kidneys: stone composition
More and more, spectral CT is being used for the characterization of kidney stones. These types of images require analysis using dedicated software that can assist in the detection of uric acid components within stones and distinguish it from calcium. Although this ability has been possible in CT since 2010, the struvite component remains difficult to assess.21,22
Kidneys: inflammation, ischemia, and tumors
Iodine maps, Z effective maps, and monoenergetic reconstructions at lower energy levels can be useful for better detection of renal infarcts and distinguishing infarction from acute pyelonephritis (Figure 3).
The availability of VNC contributes to a better diagnostic approach to initially nonsuspected cystic renal lesions, when the acquired series is only at the portal phase and the HU attenuation of the lesion is higher than 20. In these inconclusive CT examinations, the option is to call back the patient for an additional unenhanced acquisition, or for an abdominal sonography. The VNC images available with spectral CT are therefore helpful to attest the HU attenuation of the cystic lesion in the same session. Iodine maps help to confirm the absence of perfusion of the lesion.
Biliary stones
Ultrasound and MRI are the imaging methods of choice when gallbladder and biliary tracts stones are considered. Nevertheless, in many acute conditions, an abdominal CT is performed as it can help the clinician in diagnosing initially unsuspected cholecystitis and biliary tract obstruction. Stone detection is achievable with conventional CT images in a range from 25 to 88%, depending on the series;23 this detection is based on the kilovoltage of the CT system and the composition of the stone (presence of enough calcium and/or fat).
The role of CT is improved by the availability of virtual monoenergetic images, which have been recently noted as being valid in the better detection of gallbladder stones at different levels of energies, particularly the non-calcified forms.9,10,15
Bowel
All the tools available with the IQon Spectral CT have a valid application in the evaluation of bowel disease, including oncology, vascular disorders, infection, inflammation, and trauma.24
The availability of virtual non-contrast images in the data set of an abdominal CT focused on the bowel has several advantages:
• The true non-contrast acquisition can be deleted from the protocol when portal acquisition is included. This means a reduced radiation dose to the patient.
• Retrospective non-contrast images are useful when the chosen acquisition protocol does not include a non-contrast phase. In the acute setting, it helps to detect wall perfusion.25
Clinical case collection 113
• When oral contrast has been given before the CT examination, virtual extraction of the bowel content can help the clinician to detect or exclude a bowel suture leak.
• Colorectal cancer can be differentiated from stool.26
The use of low-energy reconstructed images contributes to a better assessment of the wall enhancement in patients suspected of intestinal ischemia, mainly when complicated bowel obstruction is questionable27 (Figure 4). The combined use of the low-energy images with iodine and Z effective maps is useful for better visualization of a gut wall perfusion and the detection of an acute bleeding source, as well as hypervascular lesions.28,29 Acute inflammation of the bowel could also be better detected when the injection quality is poor.
Colon cancer differentiation can be predicted by using the iodine concentration measured within the tumor, if an early arterial acquisition is performed.30 In poorly differentiated carcinomas, the vascularity of the tumor is increased, causing a higher iodine amount (1.59 mg/ml in poorly differentiated carcinomas vs 1.01 mg/ml in well differentiated carcinomas).
In rectal cancer cases, the malignant nodes have different spectral data compared to benign nodes, including iodine concentration measurement, Z effective values, and additional parameters, as well as the HU ratio between 80 and 140 keV values.31
Liver
In routine practice, liver CT protocols include non-contrast, arterial, portovenous, and late phases after contrast injection. VNC images can replace adequately true non-contrast images generated from arterial or portal phase.3 Lower energy reconstructed series are helpful for a better lesion detection (Figure 5).
Liver steatosis is a common clinical condition. Imaging methods are required to detect and follow steatotic patients and assess fibrosis. MRI and controlled attenuation parameters provided by Fibroscan (CAP) are considered as the reference for non-invasive methods. In this condition, ultrasound and CT have limited abilities. Currently, the use of spectral CT cannot replace MRI or CAP for liver steatosis assessment, but ongoing research shows promise.32, 33
Iron deposition can be evaluated with spectral CT in clinically relevant iron accumulation without interference of combined liver steatosis. However, it requires specific software to be implemented in the routine practice.34
Hepatocarcinoma (HCC) detection remains difficult to assess with CT. MRI is the non-invasive diagnostic and follow-up imaging method of choice; however, access to MRI is limited, and this technique also has several contraindications. Spectral CT could be an alternative method for the detection of HCC (including size < 10 mm) by using lower energy reconstructed images. This boost of contrast-to-noise ratio has already been demonstrated with iterative reconstructions in conventional imaging.35,36 Promising results have been reported and have demonstrated that the treated HCC could be optimally evaluated with spectral CT. Furthermore, spectral CT could be an additional method to assess response to therapy by measuring iodine concentration within the tumor.37
Various oncologic uses
Spectral CT can contribute to a better detection of metastatic melanoma within the abdominal cavity and in the bowel wall using arterial series reconstructed with low keV and with iodine map reconstructions.38 The response to therapy could be better assessed with a combination of RECIST criteria and spectral CT data.39
Local staging of uterine malignancies are generally evaluated with MRI. CT is used for the local and distant staging, as well as follow-up. It has been reported that the local myometrial invasion can be assessed with spectral CT. This imaging method can be an interesting alternative when MRI is not available40 (Figure 6).
Clinical case collection 114
Coronal conventional portal phase images (a and b) and VNC image (c) show a hypoattenuating bowel segment at the transition zone of obstruction (arrows) with preserved but reduced enhancement when HU point zones are compared between the VNC and portal phases. Reduced perfusion of one bowel segment (arrow) on 40 keV image (d), confirmed on iodine map (0.20 mg/ml, arrow (e). Surgical resection of the ischemic bowel segment (f).


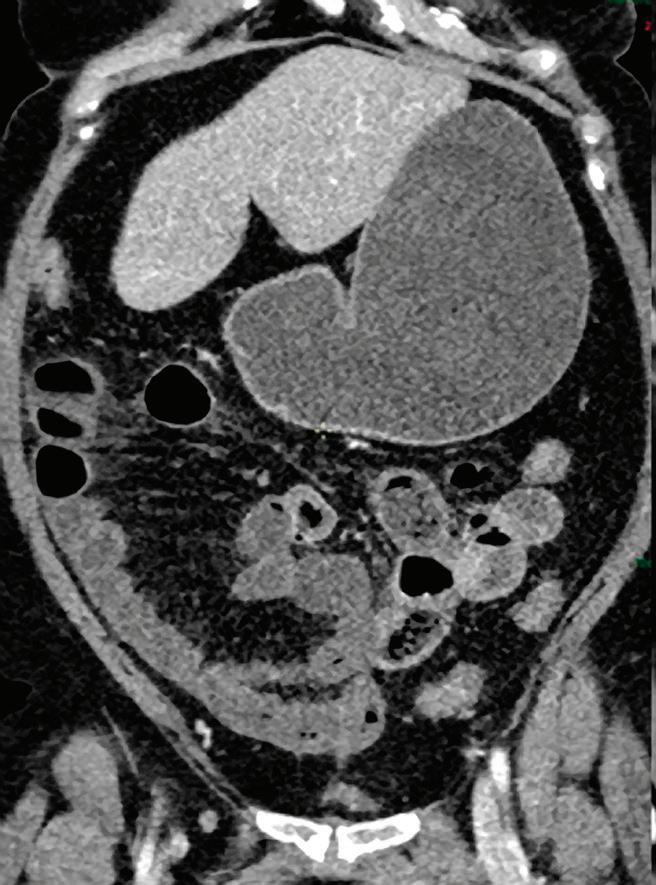


Clinical case collection 115
Figure 5
Hepatocellular carcinoma on SVIII.
(a) Lesion missed on arterial phase.
(b) Lesion is visible (arrow) on monoenergetic image at 40 keV.
(c) Enhancing liver lesion (arrow) confirmed on MRI with contrast.
Figure 4
Small bowel obstruction (SBO).
A A F B B C C D E
Patient
endometrial carcinoma. Note the close correlation between myometrial invasion detected by spectral CT series (a) iodine density image, (b) Z effective map, and (c) MRI (arrows). (d)


Clinical case collection 116
Figure 6
A B C D
with
Pathology image of the specimen demonstrating myometrial invasion (courtesy of Pr Et Marbaix).
Conclusion
The information presented in this chapter helps to demonstrate how spectral CT has contributed to better management of abdominal conditions in adult patients. Spectral CT can replace true non-contrast acquisitions, provide an assessment of organ perfusion, assist in detection and following of hypervascular lesions at the arterial phase (HCC and melanoma), demonstrate the source of acute abdominal bleeding, characterize kidney stones, and provide an additional tool in colorectal and uterine cancer staging. Assessment of chronic liver disease (steatosis and iron accumulation) still remains under evaluation, but could soon be available in daily practice.
Clinical case collection 117
References
1. Patino, M., et al., Material Separation Using Dual-Energy CT: Current and Emerging Applications. Radiographics, 2016. 36(4): p. 1087-105.
2. Hojjati, M., et al., Quality of routine diagnostic abdominal images generated from a novel detector-based spectral CT scanner: a technical report on a phantom and clinical study. Abdom Radiol (NY), 2017. 42(11): p. 2752-2759.
3. Zhang, L.J., et al., Liver virtual non-enhanced CT with dual-source, dual-energy CT: a preliminary study. Eur Radiol, 2010. 20(9): p. 2257-64.
4. Ananthakrishnan, L., et al., Spectral detector CT-derived virtual non-contrast images: comparison of attenuation values with unenhanced CT. Abdom Radiol (NY), 2017. 42(3): p. 702-709.
5. Im, A.L., et al., Dual energy CT in patients with acute abdomen; is it possible for virtual non-enhanced images to replace true non-enhanced images? Emerg Radiol, 2013. 20(6): p. 475-83.
6. Durieux, P., et al., Abdominal Attenuation Values on Virtual and True Unenhanced Images Obtained With Third-Generation Dual-Source Dual-Energy CT. AJR Am J Roentgenol, 2018: p. 1-17.
7. Pinho, D.F., et al., Initial experience with single-source dual-energy CT abdominal angiography and comparison with single-energy CT angiography: image quality, enhancement, diagnosis and radiation dose. Eur Radiol, 2013. 23(2): p. 351-9.
8. Grosse Hokamp, N., et al., Assessment of arterially hyper-enhancing liver lesions using virtual monoenergetic images from spectral detector CT: phantom and patient experience. Abdom Radiol (NY), 2017.
9. Uyeda, J.W., I.J. Richardson, and A.D. Sodickson, Making the invisible visible: improving conspicuity of noncalcified gallstones using dual-energy CT. Abdom Radiol (NY), 2017.
10. Li, H., et al., Clinical value of spectral CT in diagnosis of negative gallstones and common bile duct stones. Abdom Imaging, 2015. 40(6): p. 1587-94.
11. Kalisz, K., et al., Update on Cardiovascular Applications of Multienergy CT. Radiographics, 2017. 37(7): p. 1955-1974.
12. Nagayama, Y., et al., Dual-layer DECT for multiphasic hepatic CT with 50 percent iodine load: a matched-pair comparison with a 120 kVp protocol. Eur Radiol, 2018. 28(4): p. 1719-1730.
13. Lin, Y.M., et al., Attenuation values of renal parenchyma in virtual noncontrast images acquired from multiphase renal dual-energy CT: Comparison with standard noncontrast CT. Eur J Radiol, 2018. 101: p. 103-110.
14. Tsang, D.S., et al., Quantifying potential reduction in contrast dose with monoenergetic images synthesized from dual-layer detector spectral CT. Br J Radiol, 2017. 90(1078): p. 20170290.
15. Chen, A.L., et al., Detection of gallbladder stones by dual-energy spectral computed tomography imaging. World J Gastroenterol, 2015. 21(34): p. 9993-8.
16. Lee, Y.H., et al., Metal artefact reduction in gemstone spectral imaging dual-energy CT with and without metal artefact reduction software. Eur Radiol, 2012. 22(6): p. 1331-40.
17. Wortman, J.R., et al., Dual-Energy CT of Incidental Findings in the Abdomen: Can We Reduce the Need for Follow-Up Imaging? AJR Am J Roentgenol, 2016: p. W1-w11.
18. Purysko, A.S., et al., Comparison of radiation dose and image quality from single-energy and dual-energy CT examinations in the same patients screened for hepatocellular carcinoma. Clin Radiol, 2014. 69(12): p. e538-44.
19. Uhrig, M., et al., Advanced abdominal imaging with dual energy CT is feasible without increasing radiation dose. Cancer Imaging, 2016. 16(1): p. 15.
20. Wichmann, J.L., et al., Single- and dual-energy CT of the abdomen: comparison of radiation dose and image quality of 2nd and 3rd generation dual-source CT. Eur Radiol, 2017. 27(2): p. 642-650.
21. Hidas, G., et al., Determination of renal stone composition with dual-energy CT: in vivo analysis and comparison with x-ray diffraction. Radiology, 2010. 257(2): p. 394-401.
118 Clinical case collection
22. Mansouri, M., et al., Dual-Energy Computed Tomography Characterization of Urinary Calculi: Basic Principles, Applications and Concerns. Curr Probl Diagn Radiol, 2015. 44(6): p. 496-500.
23. Chan, W.C., et al., Gallstone detection at CT in vitro: effect of peak voltage setting. Radiology, 2006. 241(2): p. 546-53.
24. Fulwadhva, U.P., J.R. Wortman, and A.D. Sodickson, Use of Dual-Energy CT and Iodine Maps in Evaluation of Bowel Disease. Radiographics, 2016. 36(2): p. 393-406.
25. Oda, S., et al., Clinical potential of retrospective on-demand spectral analysis using dual-layer spectral detector-computed tomography in ischemia complicating small-bowel obstruction. Emerg Radiol, 2017.
26. Ozdeniz, I., et al., Dual-energy CT characteristics of colon and rectal cancer allows differentiation from stool by dual-source CT. Diagn Interv Radiol, 2017. 23(4): p. 251-256.
27. Darras, K.E., et al., Virtual monoenergetic reconstruction of contrast-enhanced dual energy CT at 70keV maximizes mural enhancement in acute small bowel obstruction. Eur J Radiol, 2016. 85(5): p. 950-6.
28. Martin, S.S., et al., Noise-Optimized Virtual Monoenergetic Dual-Energy CT Improves Diagnostic Accuracy for the Detection of Active Arterial Bleeding of the Abdomen. J Vasc Interv Radiol, 2017. 28(9): p. 1257-1266.
29. Sun, H., et al., Dual-source dual-energy CT angiography with virtual non-enhanced images and iodine map for active gastrointestinal bleeding: image quality, radiation dose and diagnostic performance. Eur J Radiol, 2015. 84(5): p. 884-91.
30. Chuang-Bo, Y., et al., Quantitative assessment of the degree of differentiation in colon cancer with dual-energy spectral CT. Abdom Radiol (NY), 2017. 42(11): p. 2591-2596.
31. Al-Najami, I., et al., Dual-Energy CT of Rectal Cancer Specimens: A CT-based Method for Mesorectal Lymph Node Characterization. Dis Colon Rectum, 2016. 59(7): p. 640-7.
32. Kramer, H., et al., Accuracy of Liver Fat Quantification With Advanced CT, MRI, and Ultrasound Techniques: Prospective Comparison With MR Spectroscopy. AJR Am J Roentgenol, 2017. 208(1): p. 92-100.
33. Hyodo, T., et al., Contrast-enhanced intraductal ultrasonography for thickened bile duct wall. J Gastroenterol, 2001. 36(8): p. 557-9.
34. Joe, E., et al., Feasibility and accuracy of dual-source dual-energy CT for noninvasive determination of hepatic iron accumulation. Radiology, 2012. 262(1): p. 126-35.
35. Pregler, B., et al., Low Tube Voltage Liver MDCT with Sinogram-Affirmed Iterative Reconstructions for the Detection of Hepatocellular Carcinoma. Sci Rep, 2017. 7(1): p. 9460.
36. De Cecco, C.N., et al., Virtual unenhanced imaging of the liver with third-generation dual-source dual-energy CT and advanced modeled iterative reconstruction. Eur J Radiol, 2016. 85(7): p. 1257-64.
37. Mule, S., et al., Can dual-energy CT replace perfusion CT for the functional evaluation of advanced hepatocellular carcinoma? Eur Radiol, 2017.
38. Uhrig, M., et al., Improved detection of melanoma metastases by iodine maps from dual energy CT. Eur J Radiol, 2017. 90: p. 27-33.
39. Uhrig, M., et al., Monitoring targeted therapy using dual-energy CT: semi-automatic RECIST plus supplementary functional information by quantifying iodine uptake of melanoma metastases. Cancer Imaging, 2013. 13(3): p. 306-13.
40. Rizzo, S., et al., Evaluation of deep myometrial invasion in endometrial cancer patients: is dual-energy CT an option? Radiol Med, 2018. 123(1): p. 13-19.
119 Clinical case collection
History
Benefits or pitfalls of dual-energy CT
Key images
Findings
Abdomen
Discussion
63-year-old male presented with left flank pain and decreased renal function (creatinine: 3.9 mg/dl, GFR: 15 ml/min).
Characterization of ureteral stone
Axial and coronal images
Conventional non-contrast/renal colic protocol CT scan showed a calcification along the course of left proximal ureter. Low atomic number of stone in Z effective images (6.91) and removal of stone in uric acid suppressed images were indicative of uric acid stone. The patient had type 2 diabetes as a risk factor with low urine pH of 5, and urinary alkalinization was prescribed. Double J stent was placed. Follow up CT one month later showed disappearance of the stone.
Urinary tract stone composition could be characterized quantitatively with Z effective images and also with the help of uric acid suppressed and uric acid only images. Identification of stone composition is important to determine the appropriate therapy option.
This case was provided by Begüm Demirler Simsir, Etienne Danse and Emmanuel Coche, from Cliniques Universitaires St-Luc, Brussels-Belgium.
120 Clinical case collection
Case Spectral CT in abdominal disorders


 Conventional CT non-contrast axial image: calcification along the course of the left proximal ureter (arrow).
Z effective image: low effective atomic number (6.91) of stone color coded in orange (arrow).
Uric acid suppressed image: the stone was removed from the image (arrow).
Conventional CT non-contrast axial image: calcification along the course of the left proximal ureter (arrow).
Z effective image: low effective atomic number (6.91) of stone color coded in orange (arrow).
Uric acid suppressed image: the stone was removed from the image (arrow).
121 Clinical case collection
Uric acid only image: only the stone was shown (arrow).


 Z effective image: low effective atomic number (6.91) of stone color coded in orange (arrow).
Uric acid suppressed image: the stone was removed from the image (arrow).
Uric acid only image: only the stone was shown (arrow).
Z effective image: low effective atomic number (6.91) of stone color coded in orange (arrow).
Uric acid suppressed image: the stone was removed from the image (arrow).
Uric acid only image: only the stone was shown (arrow).
122 Clinical case collection Case 1 Abdomen Continued
Conventional CT non-contrast coronal image: calcification along the course of the left proximal ureter (arrow).

123 Clinical case collection
Follow up conventional CT non-contrast coronal image: one month later, no stone was detected. A double J is present on the left side.
History
Benefits or pitfalls of dual-energy CT
Key images Findings
Abdomen and Oncology
Discussion
66-year-old male, focal bladder lesion encountered during prostate ultrasonography. Evaluation with dual-energy CT.
Better demonstration of the bladder wall thickening at lower keV monoenergetic images, quantification of iodine uptake by iodine density and Z effective images.
Axial images
Conventional CT with contrast showed focal thickening of the posterior and left lateral bladder wall. The HU values were similar at affected posterior site (46.8 HU) and unaffected anterior site (44.4 HU) of the bladder wall. Virtual monoenergetic images at 45 keV better demonstrated increased iodine uptake in the thickened bladder wall. Iodine density and Z effective images showed iodine uptake quantitatively at affected and unaffected sites. Transurethral resection was performed, and histology results revealed papillary urothelial carcinoma.
Virtual monoenergetic images at lower keV provide increased conspicuity of thickened bladder wall with increased iodine uptake. Iodine density and Z effective images could also quantitatively demonstrate the increased iodine uptake in the lesion compared to unaffected parts of the bladder wall.
This case was provided by Begüm Demirler Simsir, Etienne Danse and Emmanuel Coche, from Cliniques Universitaires St-Luc, Brussels-Belgium. Pathology images contributed by Julie Lelotte, from Cliniques Universitaires St-Luc, Brussels-Belgium.
124 Clinical case collection
Case Spectral CT in abdominal disorders
Conventional CT with contrast, axial image at 120 kVp: posterior-left lateral bladder wall thickening. The HU values are similar at affected posterior-left lateral wall (46.8 HU, blue arrow) and unaffected anterior wall (44.4 HU, white arrow).


Virtual monoenergetic axial image at 45 keV: better demonstration of bladder wall thickening (arrow).
Iodine density axial image: increased iodine uptake (1.29 mg/ml) of thickened posterior bladder wall (blue arrow) compared to unaffected anterior site (0.12 mg/ml, white arrow).

Z effective axial image: posterior bladder wall with increased iodine content is color coded in green-blue and has higher effective atomic number (8.05, blue arrow) compared to unaffected anterior bladder wall (7.34) that is color coded in yellow (white arrow).

Papillary lesion with diffuse hyperplasia of urothelium, without infiltration of lamina propria (HE x5).

Urothelium showing architectural disturbance with high atypia (HE x10).

125 Clinical case collection
History
Benefits or pitfalls of dual-energy CT
Key images
Findings
Abdomen and Oncology
Discussion
68-year-old male with metastatic (bone and lymph nodes) prostate cancer presented for follow-up.
Quantification of iodine uptake by enlarged metastatic lymph node.
Axial images
Conventional axial CT images showed an enlarged left para-ureteral lymph node at the level of the iliac bifurcation with attenuation value of 68 HU. True non-contrast images were not obtained, the attenuation of the lymph node was 30 HU on virtual non-contrast images. Iodine density and Z effective images showed iodine uptake of the lymph node quantitatively. A follow-up CT 3.5 months later showed significant increase in size, indicating progressive disease.
Iodine density and Z effective images may quantitatively demonstrate the increased iodine uptake in the lymph nodes and help in diagnosing metastatic lymph nodes.
This case was provided by Begüm Demirler Simsir, Etienne Danse and Emmanuel Coche, from Cliniques Universitaires St-Luc, Brussels-Belgium.
126 Clinical case collection
Case Spectral CT in abdominal disorders


 Conventional CT with contrast, axial image: enlarged (25x20 mm) left para-ureteral lymph node at the level of iliac bifurcation (arrow) with attenuation value of 68 HU.
(LEFT) Follow-up (3.5 months later) conventional CT with contrast, axial image: significant increase in size of the lymph node (60x53 mm).
Virtual non-contrast image: enlarged lymph with attenuation value of 30 HU.
Iodine density image: iodine uptake (1.08 mg/ml) of the lymph node.
Conventional CT with contrast, axial image: enlarged (25x20 mm) left para-ureteral lymph node at the level of iliac bifurcation (arrow) with attenuation value of 68 HU.
(LEFT) Follow-up (3.5 months later) conventional CT with contrast, axial image: significant increase in size of the lymph node (60x53 mm).
Virtual non-contrast image: enlarged lymph with attenuation value of 30 HU.
Iodine density image: iodine uptake (1.08 mg/ml) of the lymph node.
127 Clinical case collection
Z effective image: iodine content of the lymph node color coded in green-blue with effective atomic number of 8.07.
History Benefits or pitfalls of dual-energy CT
Key images
Findings
Abdomen and Vessels
Discussion
81-year-old male on anticoagulation therapy due to paroxysmal atrial fibrillation presented with severe periumbilical abdominal pain and painful palpable abdominal mass.
Virtual non-contrast images may have the potential to replace true non-contrast images to reduce the radiation dose.
Axial images
Conventional axial CT with contrast was performed and heterogeneous left rectus muscle hematoma with active contrast extravasation was demonstrated. Inferior epigastric artery was seen posterior to the hematoma as the suspected origin. On virtual non-contrast images, heterogeneous hematoma was demonstrated without the active contrast extravasation, providing images comparable to true non-contrast images. Angiography confirmed the diagnosis of inferior epigastric artery bleeding, and the patient was treated successfully with coil embolization.
Virtual non-contrast images may have the potential to replace true non-contrast images in acute vascular abdominal emergencies, and thus radiation dose to the patient could be reduced.
This case was provided by Begüm Demirler Simsir, Etienne Danse and Emmanuel Coche, from Cliniques Universitaires St-Luc, Brussels-Belgium.
128 Clinical case collection
Case Spectral CT in abdominal disorders
Conventional CT with contrast axial image, arterial phase: active bleeding in rectus hematoma (white arrow). Left inferior epigastric artery posterior to the hematoma (blue arrow).


Virtual non-contrast axial image: active contrast extravasation was not seen.
Digital substraction angiography (DSA) image of inferior epigastric artery, showing contrast extravasation (arrows).


129 Clinical case collection
DSA image showing successful coil embolization.
Clinical evidence
Spectral CT in musculoskeletal disorders
David Maintz, MD, Department of Diagnostic and Interventional Radiology, University Hospital of Cologne, Cologne, Germany
Victor Neuhaus, MD, Department of Diagnostic and Interventional Radiology, University Hospital of Cologne, Cologne, Germany
Clinical case collection 130
Introduction
Musculoskeletal imaging in conventional CT suffers from low contrast of several soft tissues, the lack of visibility of bone marrow changes, and artifacts caused by metal implants. The strength of CT in regard to musculoskeletal imaging is the assessment of cortical and trabecular bone. The value of the new imaging qualities of spectral CT as investigated so far is described in this chapter.
Bone
Bone mineral density measurements
Osteoporosis is a widespread disease in elderly men and women. It leads to a pathologic reduction of bone strength which results in fractures, hereby causing severe pain, immobility, neurologic symptoms, and increased mortality.1,2 The surrogate parameter for the detection of reduced bone strength is the measurement of bone mineral density in different skeletal regions such as the spine, the hip, and the forearm. Dual-energy X-ray absorptiometry (DXA) is the standard device for bone mineral density (BMD) measurements, detecting areal BMD from low dose dual-energy X-ray data. For the individual patient, a measured T-score (a standardized score, comparing BMD to the average value of a 30-year-old healthy adult) of -2.5 or less is defined as osteoporosis by the World Health Organization.3 However, DXA suffers from several limitations such as overlap of calcified plaques and measurement errors due to fat tissue. As an alternative to DXA, Quantitative Computed Tomography (QCT) is able to perform three-dimensional volumetric bone mineral density measurements in the targeted bone tissues. QCT commonly uses a calibration phantom, which is scanned synchronous or asynchronous with the patient in order to allow for a precise volumetric BMD (vBMD) estimation over several time points and different scanners.4 However, QCT also suffers from partial volume effects and inhomogeneous bone marrow, which influences the results of the measurements.5
With regard to BMD measurements, the dual-energy CT data acquired with a spectral detector CT (SDCT) allow for a material decomposition similar to DXA, which is considered to be more robust due to the 3D spatial resolution. Furthermore, the dual-energy CT data might allow for an equally accurate calibration in comparison to phantom-based QCT, and the anticipated ability of SDCT to identify calcium-hydroxyapatite might improve precision of vBMD estimation significantly.
In the few existing phantom-based studies, spectral CT data derived from SDCT proved to allow for an accurate quantification of BMD using different approaches for differentiation of calcium-hydroxyapatite.6,7 In one study, BMD quantification was performed using mass attenuation coefficients across different virtual monoenergetic levels,6 while in the other study by Mei and colleagues, calibration measurements were performed and thus attenuation profiles specific for the scanner used in that study were acquired.7 In both studies, SDCT vBMD values of calcium-hydroxyapatite specific BMD were compared to DXA and QCT showing close correlation.6,7 In addition to the known advantages of measuring BMD in CT in comparison to DXA, the measurement of BMD in SDCT appears to have distinct advantages in comparison to QCT. 7 First, vBMD measured in obese patients should not be affected by beam hardening since material decomposition is performed in the projection space, and thus beam hardening artifacts are corrected.6-9 Second, calcium-hydroxyapatite specific
Clinical case collection 131
measurements of vBMD should be less susceptible to other materials affecting attenuation such as fat and iodine.7 Correspondingly, vBMD measured in QCT was found to be higher than vBMD measured in SDCT, which may indicate a more accurate measurement by SDCT. 7
In SDCT, the measurements of vBMD can be performed retrospectively since they do not require an additional phantom. Further, different scanning protocols applying different tube voltages and tube currents can be used to acquire the dual-energy CT data, enabling accurate opportunistic screening for osteoporosis in CT scans performed for different clinical indications.6,7 Since the above-mentioned studies were ex vivo and conducted on phantoms, which contained only calcium-hydroxyapatite and water, further patient-based studies are required to confirm these investigations in vivo and to evaluate applicability of the proposed material decomposition in the presence of diverse confounding materials.
Detection of traumatic bone marrow changes
While CT is the method of choice for the accurate three-dimensional depiction of bone structure in clinical imaging, providing an excellent depiction of cortical and trabecular bone, magnetic resonance imaging is superior to CT for visualization of bone marrow changes. Fluid-sensitive sequences combined with T1-weighted sequences allow the diagnosis of bone marrow edema, while in conventional CT, the bone marrow is obscured by the trabecular bone.10,11 As SDCT allows for a material decomposition (e.g., iodine, fat, and calcium), virtual material maps can be reconstructed, in which these materials are subtracted or enhanced. With regard to bone, these opportunities of SDCT appear clinically relevant. The material maps could be used to diagnose bone marrow edema.
Calcium suppressed (CaSupp) images are SDCT reconstructions in which the identified virtual calcium component has been subtracted reducing cortical and trabecular bone obscuring the bone marrow. In this condition, diffuse bone marrow changes which are normally not visible in conventional CT can be assessed (Figure 1). Visualization of bone marrow changes can either be achieved by using a material decomposition process, in which the spectral based images (SBI) are converted into sets of dynamic material pairs (soft tissue and a material with a user-defined level of calcium composition that is indicated by the calcium suppression index (CSI) value enabling reconstruction of calcium suppressed images) or by three material decomposition (enabling reconstruction of red marrow maps, yellow marrow maps, and calcium-hydroxyapatite maps.)12,13 In opposition to the technical approaches to dual-energy CT offered by other vendors, the extent of calcium subtraction in CaSupp images can be modified in order to target varying calcium densities and to achieve optimal contrast of bone marrow edema. Therefore, different calcium suppression indices (CSI) can be chosen while reading the images. Here, CSI can be adjusted on a scale from 25 to 100; a high CSI targets tissues with a high calcium composition weight, while a low CSI targets tissues with a low calcium composition weight.
The possibility to adjust CSI while reading the images appears to offer a certain advantage, since bone marrow edema adjacent to the endplates of the vertebrae (which can be obscured by the denser cortical bone) can be visualized by choosing slightly lower CSI of 70 and 80 in contrast to 90 and 100, which depict bone marrow edema within the trabecular bone compartment. Primary studies investigating CaSupp as well as three material decomposition imaging showed a high sensitivity and specificity for the detection of traumatic bone marrow edema in vertebral compression fractures in correlation with MRI.12,13 Furthermore, the investigated high negative predictive value emphasizes the potential of CaSupp to rule out bone marrow edema due to acute vertebral fractures. In this regard, there was an excellent inter-rater agreement reported, indicating a robust clinical applicability of these maps. Finally, CaSupp might allow detection of occult fractures since bone marrow edema was also detected in vertebrae without obvious signs of fractures in conventional CT. Thus, SDCT might allow a reduction in the number of MRI examinations needed in order to differentiate acute from older fractures.
Clinical case collection 132
84-year-old male patient who underwent SDCT of the lumbar spine due to severe lower back pain. Grayscale conventional CT images (A) show four fractured thoracolumbar vertebrae. Additional MRI confirmed bone marrow edema in lumbar vertebrae 3, 4, and 5 in fluid sensitive STIR sequence (B, marked in red) and T1-weighted sequence (C). CaSupp images (D) show bone marrow edema in lumbar vertebrae 3, 4, and 5 (marked in red) in correlation to the MRI. In addition, CaSupp images rule out acute fracture of thoracic vertebra 12 and lumbar vertebra 1, which showed a fracture on conventional CT, but no bone marrow edema in MRI and CaSupp images (marked in blue).


Detection of bone marrow changes due to malignant lesions
Bone metastases in cancer patients are associated with poor prognosis and skeletal complications. Thus, an early detection of bone metastases is required in order to provide appropriate treatment.14 However, assessment of bone lesion in conventional CT is limited to size, margin, location, and density of the lesion itself and the surrounding bone. Therefore, using CT alone, bone lesions might remain undiagnosed or unclear in regard to their etiology. Thus, more expensive additional diagnostic modalities are frequently being performed such as positron emission tomography or bone scintigraphy, in order to enhance the detection of bone lesions and their etiologic characteristics.15 In the first studies, SDCT has been found to enable differentiation of bone metastases and normal bone as well as to enable visualization of bone marrow changes adjacent to bone lesions in CaSupp images.16,17 Furthermore, iodine quantification has been investigated as a promising parameter for the separation of vertebral trabecular bone metastases and healthy trabecular bone.18 Detection of bone marrow changes as well as increased iodine uptake adjacent to vertebral lesion might allow earlier detection and accurate classification of otherwise unclear vertebral lesions. Additionally, this might spare additional imaging tools such as positron emission tomography or bone scintigraphy. However, for these purposes, further structured investigations are needed.
Imaging of metal implants and surrounding tissues
The increasing prevalence of orthopedic metal implants is a challenge for diagnostic imaging, especially in computed tomography, since image quality and diagnostic accuracy of CT
Clinical case collection 133
Figure 1
A Conventional CT B STIR C T1w D CaSupp
might be severely impaired by metal artifacts. Artifacts are caused by complete absorption of the photons of the X-ray (photon starvation) and increased attenuation of the low energy photons in comparison to the high energy photons of the X-ray (beam hardening).19,20 In general, the severity of the artifacts is influenced by the thickness of the metal implants as well as the alloy, of which the metal implants are made.21,22 As shown in ex vivo phantombased studies as well as in vivo patient-based studies for metal artifacts, in general, virtual monoenergetic images reconstructed from SDCT are a powerful tool in order to improve image quality around implants.21-23 Virtual monoenergetic images at high keV reduce beam hardening artifacts and moderate photon starvation artifacts without leading to significant additional artifacts, and thus improve the assessment of the bone adjacent to metal implants as well as the implant itself.21-23
With regard to smaller metal implants in the spine or in the extremities, virtual monoenergetic images at high keV can completely remove artifacts.22,23 Also, moderate artifacts due to total arthroplasties of the hips can be reduced significantly using virtual monoenergetic images.21,23 However, severe artifacts, especially photon starvation artifacts caused by unilateral or bilateral total arthroplasties of the hip, could not be reduced to a satisfactory extent (Figure 2).21,23 Therefore, it is of dedicated interest that current studies find different strengths of virtual monoenergetic images as well as iterative algorithms dedicated for orthopedic


71-year-old male patient who received a staging CT due to esophageal cancer. Conventional CT images (A) show severe artifacts caused by bilateral total arthroplasty of the hips. On virtual monoenergetic images at high keV (B and C), those artifacts are only slightly reduced. Conventional CT images post-processed with a dedicated algorithm (OMAR) (D) show improved visibility of the intrapelvic structures. However, artifacts close to the implants remain visible. The combination of virtual monoenergetic images at high keV and the dedicated algorithm (E and F) demonstrate nearly complete removal of the artifacts, as well as significantly improved assessment of adjacent and intrapelvic structures.
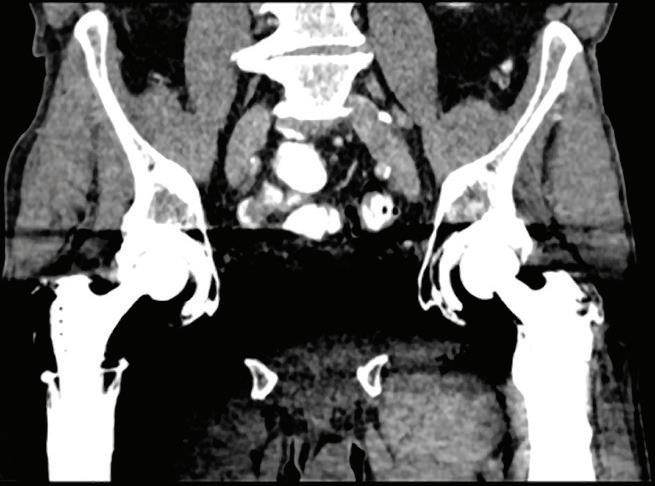
Clinical case collection 134
Figure 2
Conventional CT OMAR A D B E C F VMI
VMI 200
140 keV OMAR + VMI 140 keV
keV OMAR + VMI 200 keV
metal artifact reduction.22,24 Here, first results indicate a benefit for metal artifact reduction when using a combination of iterative metal artifact reduction and virtual monoenergetic images in cases of uni- and bilateral total arthroplasties of the hip, especially in case of severe photon starvation artifacts overlaying the pelvic organs (Figure 2).
Soft tissue
Visualization of intervertebral discs
Visualization of soft tissue adjacent or in between bones, especially intervertebral discs, is limited in conventional CT, and thus, in contrast to MRI, the diagnosis of herniated intervertebral discs remains challenging in conventional CT. In a case review study, the use of CaSupp in imaging of the intervertebral discs has been found to be beneficial, since the suppression of the vertebral bone increases visibility of the intervertebral discs.25 This might enable improved detection of pathologies such as herniated discs. However, further research is needed to confirm these preliminary findings.
Imaging of intraspinal metastases
Similar to pathologies of the intervertebral discs, the imaging of intraspinal metastases can be challenging in conventional CT due to the low contrast between intraspinal masses and the cerebrospinal fluid. However, conventional CT is the modality of choice used to detect advanced stage of cancer. Thus, additional MRI is required to assess intraspinal metastases. Accurate assessment of intraspinal metastases is needed because these metastases might cause neurologic symptoms and require surgical resection. The depiction of intraspinal metastases due to malignancies is improved in virtual monoenergetic images at low keV, which offer increased iodine attenuation, while image noise remains fairly low, and thus increases visibility as well as demarcation towards cerebrospinal fluid as well as epidural fat (Figure 3). While some intraspinal metastases cannot be detected or are difficult to assess in conventional CT, virtual monoenergetic images reconstructed at low keV allow easy assessment and detection of spinal metastases in the spinal canal.26 Thus, imaging of intraspinal metastases using MRI might not be necessary in all cases of intraspinal metastases, and virtual monoenergetic images might allow earlier detection in staging CT before clinical symptoms due to spinal stenosis occur.
Imaging of intramuscular metastases
Skeletal muscle metastases are often missed in staging CTs of oncologic patients. This is due to the fact that other organs or anatomic regions demand more attention by radiologists since skeletal muscle metastases are rare in the majority of cancer patients. Additionally, contrast between muscle tissue and the metastases is usually low. Iodine overlay images reconstructed from SDCT improve the detection of intramuscular metastases (Figure 4). In a patient-based study, sensitivity for skeletal muscle metastases by malignant melanoma has been found to be significantly improved in iodine overlay images, while specificity remains constant.27
Future applications in musculoskeletal imaging
While several advantages of SDCT over conventional CT in musculoskeletal imaging have already been investigated, many more clinical applications will follow since SDCT has just been recently introduced to clinical routine. Moreover, some applications of dual-energy CT in musculoskeletal imaging have been discovered for other approaches to dual-energy CT (e.g., detection of gout tophi or visualization of collagenous structures such as ligaments or tendons).28
Clinical case collection 135
78-year-old female patient diagnosed with metastatic lung cancer (A, upper row), and a 77-year-old male patient diagnosed with metastatic prostate cancer (B, lower row), who received a staging CT. In patient A, conventional images show an osseous metastasis, which is partially localized within the spinal canal. In patient B, conventional images revealed an obliteration of epidural fat within the spinal canal due to suspected intraspinal metastasis. MRI (contrast-enhanced, fat-saturated T1-weighted sequence) and virtual monoenergetic images (VMI) at 40 keV both clearly depict intraspinal tumor growth in patient A and intraspinal spreading in patient B. Note that the contrast and delineation toward the cerebrospinal fluid and the spinal content is significantly improved in VMI at 40 keV in contrast to conventional CT images.


Clinical case collection 136
Figure 3
Conventional CT
A B
Conventional CT
MRI MRI VMI 40 keV VMI 40 keV
35-year-old male patient who received a staging CT due to metastatic malignant melanoma. Metastases to the right (A) and left (B) musculus gluteus maximus as well as to the paravertebral muscles (C and D) are difficult to detect in conventional CT (red arrows), and in some cases, might have remained undiagnosed; while in iodine overlay images (lower row), those metastases (red arrows) are easy to detect due to improved contrast to surrounding normal muscle tissue.


Clinical case collection 137
Figure 4
A Conventional CT
B Conventional CT
Iodine overlay image
C Conventional CT
Iodine overlay image
D Conventional CT
Iodine overlay image
Iodine overlay image
References
1. Fink HA, Ensrud KE, Nelson DB, et al. Disability after clinical fracture in postmenopausal women with low bone density: the fracture intervention trial (FIT). Osteoporos Int. 2003 Jan;14(1):69-76.
2. Bliuc D, Nguyen ND, Milch VE, Nguyen TV, Eisman JA, Center JR. Mortality risk associated with low-trauma osteoporotic fracture and subsequent fracture in men and women. JAMA. 2009 Feb 4;301(5):513-21.
3. Prevention and management of osteoporosis. World Health Organ Tech Rep Ser. 2003;921:1-164, back cover.
4. Engelke K, Lang T, Khosla S, et al. Clinical Use of Quantitative Computed Tomography-Based Advanced Techniques in the Management of Osteoporosis in Adults: the 2015 ISCD Official Positions-Part III. J Clin Densitom. 2015 Jul-Sep;18(3):393-407.
5. Kuiper JW, van Kuijk C, Grashuis JL, Ederveen AG, Schütte HE. Accuracy and the influence of marrow fat on quantitative CT and dual-energy X-ray absorptiometry measurements of the femoral neck in vitro. Osteoporos Int. 1996;6(1):25-30.
6. van Hamersvelt RW, Schilham AMR, Engelke K, et al. Accuracy of bone mineral density quantification using dual-layer spectral detector CT: a phantom study. Eur Radiol. 2017 Oct; 27(10):4351-4359.
7. Mei K, Schwaiger BJ, Kopp FK, et al. Bone mineral density measurements in vertebral specimens and phantoms using dual-layer spectral computed tomography. Sci Rep. 2017 Dec 13;7(1):17519.
8. Maass C, Baer M, Kachelriess M. Image-based dual energy CT using optimized precorrection functions: a practical new approach of material decomposition in image domain. Med Phys. 2009 Aug;36(8):3818-29.
9. Kalender WA, Klotz E, Kostaridou L. An algorithm for noise suppression in dual energy CT material density images. IEEE Trans Med Imaging. 1988;7(3):218-24.
10. Lenchik L, Rogers LF, Delmas PD, Genant HK. Diagnosis of osteoporotic vertebral fractures: importance of recognition and description by radiologists. AJR Am J Roentgenol. 2004 Oct;183(4):949-58.
11. Uppin AA, Hirsch JA, Centenera LV, et al. Occurrence of new vertebral body fractures after percutaneous vertebroplasty in patients with osteoporosis. Radiology. 2003 Jan;226(1):119-24.
12. Schwaiger BJ, Gersing AS, Hammel J, et al. Three-material decomposition with dual-layer spectral CT compared to MRI for the detection of bone marrow edema in patients with acute vertebral fractures. Skeletal Radiol. 2018 May 25.
13. Neuhaus V, Lennartz S, Abdullayev N, et al. Bone marrow edema in traumatic vertebral compression fractures: Diagnostic accuracy of dual-layer detector CT using calcium suppressed images. Eur J Radiol. https://doi.org/10.1016/j.ejrad.2018.06.009.
14. Reddi AH, Roodman D, Freeman C, Mohla S. Mechanisms of Tumor Metastasis to the Bone: Challenges and Opportunities. J Bone Miner Res. 2003 Feb;18(2):190-4.
15. Rybak LD, Rosenthal DI. Radiological imaging for the diagnosis of bone metastases. Q J Nucl Med 2001; 45:53–64.
16. Abdullayev N, Romman Z, Pahn G, Shapira N, Kafri G. Visualizing bone marrow in the presence of bone lesion with calcium-suupressed CT images. Available from: http://clinical.netforum. healthcare.philips.com/global/Explore/Case-Studies/CT/Visualizing-bone-marrow-in-thepresence-of-bone-lesions-with-calcium-suppressed-CT-images.
17. Grosse Hokamp N, Abdullayev N, Neuhaus V, Holz J, Maintz D, Borggrefe J. Calcium suppression in spectral detector computed tomography improves visualization of bone metastasis. Presented at ECR 2018.
18. Abdullayev N, et al. Spectral Detector Computed Tomography Iodine Density Thresholds for the Separation of Vertebral Bone Metastases. submitted to Investigative Radiology.
19. Mori I, Machida Y, Osanai M, Iinuma K. Photon starvation artifacts of X-ray CT: their true cause and a solution. Radiol Phys Technol. 2013 Jan;6(1):130-41.
138 Clinical case collection
20. Brooks RA, Di Chiro G. Beam hardening in x-ray reconstructive tomography. Phys Med Biol. 1976 May;21(3):390-8.
21. Wellenberg RH, Boomsma MF, van Osch JA, et al. Quantifying metal artefact reduction using virtual monochromatic dual-layer detector spectral CT imaging in unilateral and bilateral total hip prostheses. Eur J Radiol. 2017 Mar;88:61-70.
22. Große Hokamp N, Neuhaus V, Abdullayev N, et la. Reduction of artifacts caused by orthopedic hardware in the spine in spectral detector CT examinations using virtual monoenergetic image reconstructions and metal-artifact-reduction algorithms. Skeletal Radiol. 2018 Feb;47(2):195-201.
23. Neuhaus V, Große Hokamp N, Abdullayev N, et al. Metal artifact reduction by dual-layer computed tomography using virtual monoenergetic images. Eur J Radiol. 2017 Aug;93:143-148.
24. Laukamp KR, Lennartz S, Neuhaus VF, et al. CT metal artifacts in patients with total hip replacements: for artifact reduction monoenergetic reconstructions and post-processing algorithms are both efficient but not similar. Eur Radiol. 2018 May 3.
25. Lennartz S, Romman Z, Pahn G, Shapira N, Kafri G. Visualizing intervertebral disc herniation with calcium-suppressed CT images. Available from: http://clinical.netforum.healthcare.philips.com/ us_en/Explore/Case-Studies/CT/Visualizing-intervertebral-disc-herniation-with-calciumsuppressed-CT-images.
26. Abdullayev N, Maus V, Kiel A, et al. Improved detection of intraspinal metastases in dual-layer detector CT: Diagnostic accuracy of virtual monoenergetic reconstructions compared with polyenergetic reconstructions. Unpublished.
27. Lennartz S, Le Blanc M, Abdullayev N, et al. Improved detection of skeletal muscle metastases in iodine-density overlay maps and virtual monoenergetic reconstructions provided by spectral detector CT. Presented at ECR 2018.
28. Mallinson PI, Coupal TM, McLaughlin PD, Nicolaou S, Munk PL, Ouellette HA. Dual-Energy CT for the Musculoskeletal System. Radiology. 2016 Dec;281(3):690-707.
139 Clinical case collection
History
Benefits or pitfalls of dual-energy CT
Key images
Findings
62-year-old female with left hip prosthesis presented with hip pain. Decreased metal artifact at higher keV virtual monoenergetic images.
Axial images
Extensive metal artifacts from hip prosthesis were seen on conventional CT images. This made evaluation of the periprosthetic bone and adjacent soft tissue challenging. The artifacts were significantly lower at virtual monoenergetic spectral images at 200 keV.
Discussion
Virtual monoenergetic imaging at higher keV could significantly reduce metal artifacts and improve diagnostic image quality at periprosthetic areas.
This case was provided by Begüm Demirler Simsir and Emmanuel Coche, from Cliniques Universitaires St-Luc, Brussels-Belgium.
140 Clinical case collection
Case Spectral CT in musculoskeletal disorders
MSK


 Virtual monoenergetic image at 200 keV at the same level: significantly reduced metal artifacts allowing better delineation of prosthesis and evaluation of periprosthetic areas.
Conventional CT axial images: periprosthetic area around left hip obscured by metal artifacts (arrows).
Virtual monoenergetic axial image at 200 keV: bone window.
Virtual monoenergetic image at 200 keV at the same level: significantly reduced metal artifacts allowing better delineation of prosthesis and evaluation of periprosthetic areas.
Conventional CT axial images: periprosthetic area around left hip obscured by metal artifacts (arrows).
Virtual monoenergetic axial image at 200 keV: bone window.
141 Clinical case collection
Conventional CT axial images: bone window.
History Benefits or pitfalls of dual-energy CT
Key images
Findings
MSK and Oncology
Discussion
68-year-old male with history of right nephrectomy due to renal carcinoma 10 years ago and removal of lymph nodes. The patient had a partial resection of the right psoas muscle due to metastasis in the following years.
Increased conspicuity of contrast uptake and better demarcation of the right psoas nodular lesion on lower keV monoenergetic images.
Coronal and axial images
Conventional coronal and axial CT images with and without contrast showed an enhancing mass in right residual psoas muscle. The mass had increased in size compared to previous examinations. Virtual non-contrast images were comparable to true non-contrast images. The mass was better delineated on virtual monoenergetic images at 45 keV. Iodine density and Z effective images showed iodine uptake quantitatively compared to unaffected parts of the psoas muscle. The patient underwent resection of the mass, and pathology results were compatible with metastasis of chromophobe renal cell carcinoma. The follow-up images 6 months later did not show contrast uptake or attenuation difference in the surgery location; so the small soft tissue density was regarded as a postoperative change, and follow-up evaluation was decided.
The attenuation difference between the mass with increased iodine uptake and unaffected segments of psoas muscle was increased at virtual monoenergetic images at 45 keV. Increased conspicuity of contrast uptake of a mass on virtual monoenergetic images at lower keV may improve diagnostic performance. Iodine density and Z effective images could also demonstrate the iodine uptake quantitatively.
This case was provided by Begüm Demirler Simsir and Emmanuel Coche, from Cliniques Universitaires St-Luc, Brussels-Belgium.
142 Clinical case collection
Case
Spectral CT in musculoskeletal disorders
Conventional CT with contrast, coronal image at 120 kVp: enhancing mass in right psoas muscle (arrow).
Virtual monoenergetic coronal image at 45 keV: better demarcation of the enhancing mass in right psoas muscle (arrow).
True non-contrast CT, axial image: right psoas muscle mass (37.9 HU, arrow).
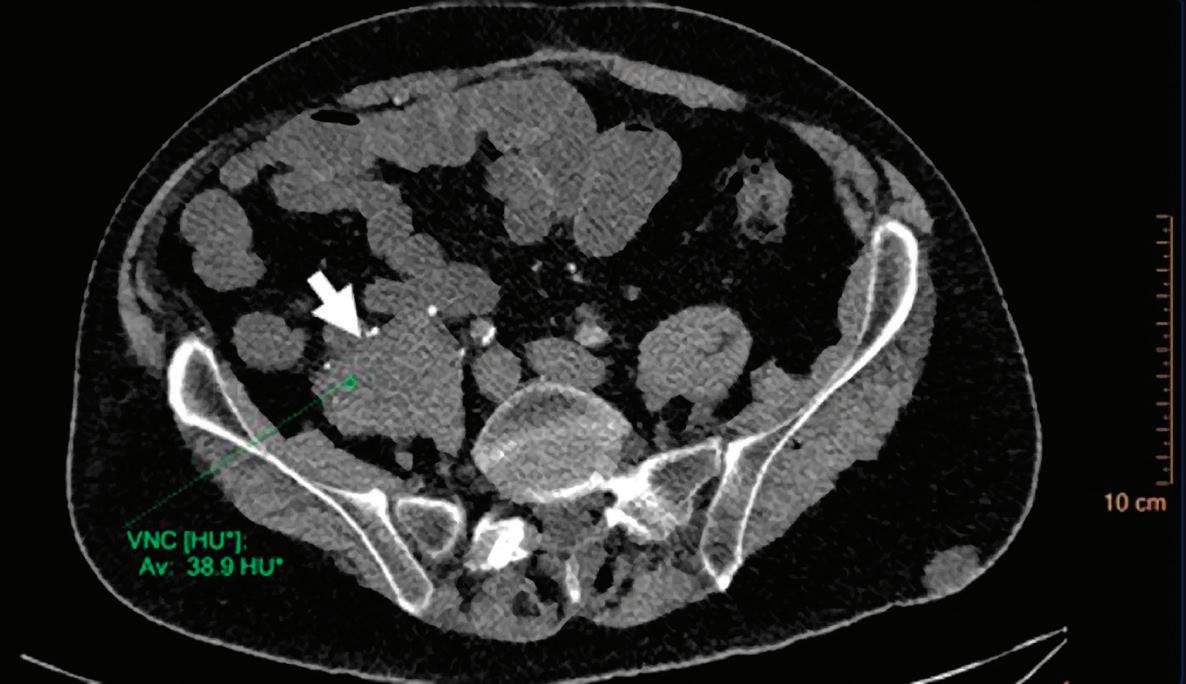

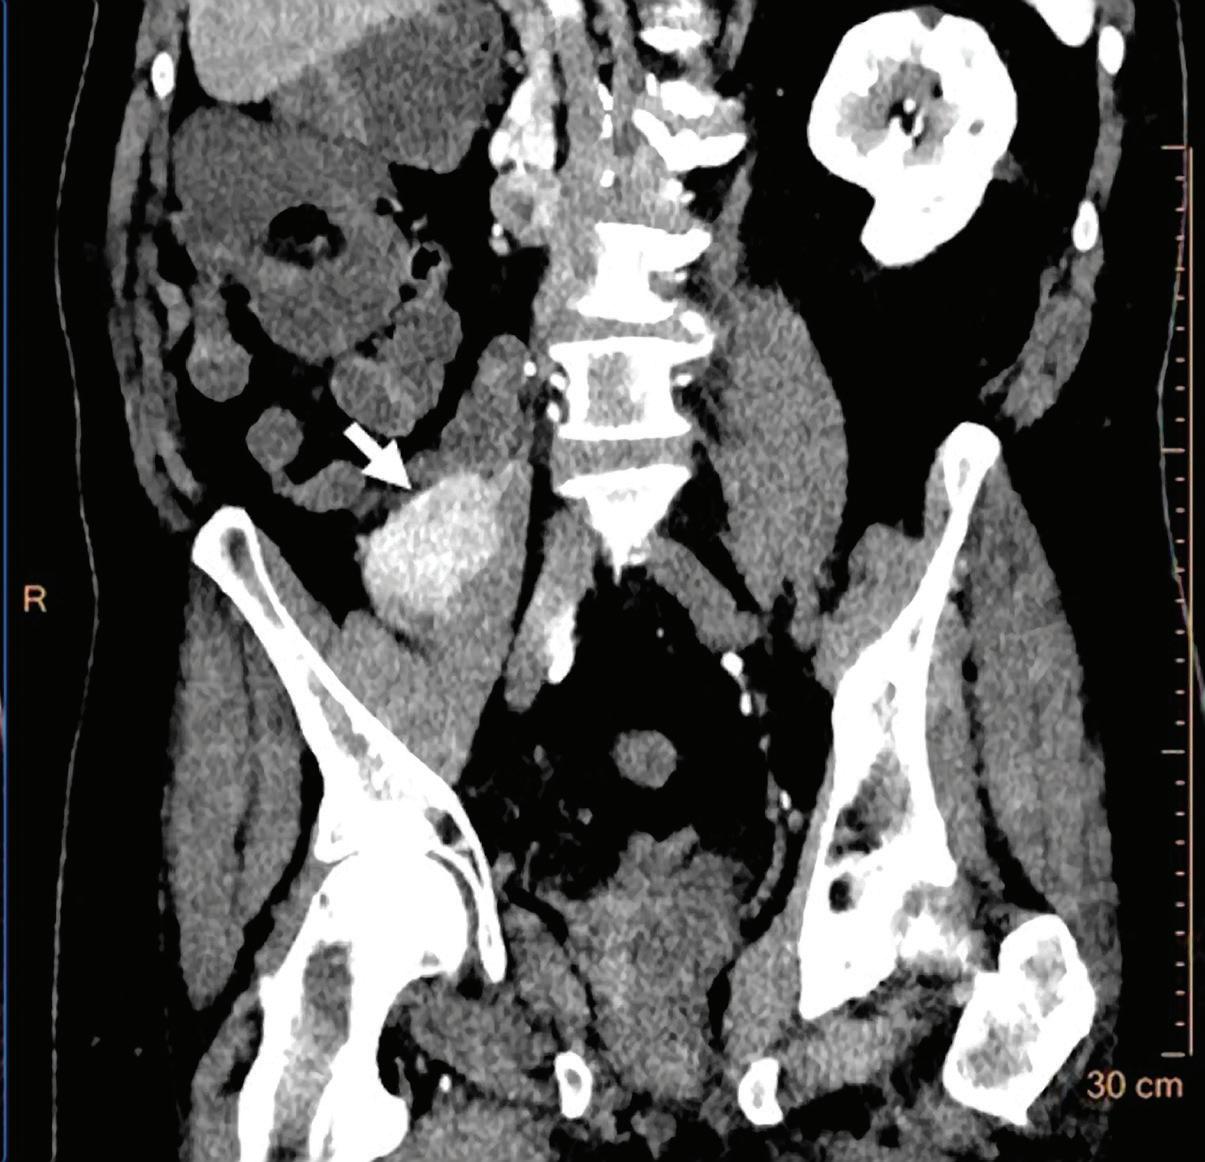
Virtual non-contrast CT, axial image: right psoas muscle mass density (38.9 HU, arrow) was comparable to true non-contrast images (37.9 HU).

143 Clinical case collection
Virtual non-contrast image: shows right psoas muscle mass (arrow). Images were comparable to true non-contrast images.


Virtual monoenergetic image at 45 keV: better demarcation of right psoas muscle (arrow).
Iodine density image: increased iodine uptake in right psoas muscle mass (white arrow, 2.41 mg/ml) compared to unaffected medial portion of the muscle (blue arrow, 0.19 mg/ml).


Z effective image: contrast uptaking right psoas muscle mass color coded in blue (white arrow) had higher effective atomic number (8.56) compared to unaffected medial portion of psoas muscle (7.40) color coded in yellow (blue arrow).
 Conventional CT with contrast axial image at 120 kVp: enhancing mass in right psoas muscle (arrow).
144 Clinical case collection Case 2 MSK and Oncology Continued
Follow-up (6 months later) conventional CT with contrast, axial image: soft tissue density at the location of surgery (arrow) without contrast uptake regarded as postoperative changes rather than residue or recurrence.

Follow-up iodine density image: iodine uptake of the soft tissue density (arrow) was measured at 0.27 mg/ml (below threshold of 0.5 mg/ml).

Z effective image: soft tissue density at the location of surgery with similar effective atomic number (7.44, white arrow) to contralateral psoas muscle (7.46, blue arrow) both color coded in yellow.

145 Clinical case collection
Spectral CT in emergency department
Begüm Demirler Șimșir, MD, visiting research fellow, Department of Radiology, Cliniques Universitaires St-Luc, Brussels, Belgium
Emmanuel Coche, MD, PhD, Head of Department of Radiology, Cliniques Universitaires St-Luc, Brussels, Belgium
Clinical case collection 146
Special focus
Spectral CT provides additional information to conventional CT in emergency settings and offers the opportunity to help clinicians achieve a definitive diagnosis, as well as reducing the need for follow-up scans. With clinical results such as material decomposition, virtual monoenergetic imaging, and virtual non-contrast imaging, the IQon Spectral CT provides enhanced diagnostic benefits without increased radiation dose to the patient.
The advantage of this dual-layer spectral CT is when images are obtained at 120 or 140 kVp, spectral data is available for all patients without the need for prior selection of a specific protocol. Spectral CT has shown to add value in many emergency conditions, such as those discussed in other chapters. For example, in abdomen exams, we can highlight the interesting and unprecedented applications of spectral CT as assisting with the detection of gallstones (Figure 1), removal of iodine for detection of urinary tract stones (see clinical case Emergency: Abdomen discussed in this section), gallbladder wall (Figure 1), solid organ perfusion assessment (Figure 2), boosting of contrast media in low dose CT angiography for patients with poor renal functions (see clinical case Emergency: Abdomen and Vessels in this section), and detection of contrast extravasation.


In this chapter, we will focus on the role of spectral CT in emergency brain, head and neck, and musculoskeletal conditions.
Patient with recurrent severe cholecystitis: (a) Conventional CT with contrast, axial image: no stone detected in gallbladder. (b) Iodine density image: gallbladder wall defect related to severity of infection (blue arrow). (c) Z effective image: a large stone is visible and color coded in red corresponding to low atomic number (white arrow), and gallbladder defect is also demonstrated (blue arrow). (d) MRI and (e) ultrasound images were available on PACS and demonstrated the gallbladder stone (white arrows).
Clinical case collection 147
Introduction
Figure 1
A D E B C
Upper row: Hepatic infarct in a patient with acute hypovolemic shock: (a) Portal phase conventional CT axial image. (b) Iodine density axial image: demonstrating lack of iodine within the liver parenchyma (0.07 mg/ml, arrow). (c) Liver parenchyma is color coded in yellow (arrow) on Z effective map indicating low atomic number and lack of iodine content.
Lower row: Previous CT examination of the patient before hepatic infarct: (d) Portal phase conventional CT axial image. (e) Iodine density axial image demonstrating iodine content of the liver parenchyma (1.59 mg/ml, arrow). (f) Liver parenchyma is color coded in light blue (arrow) on Z effective map indicating normal iodine content.


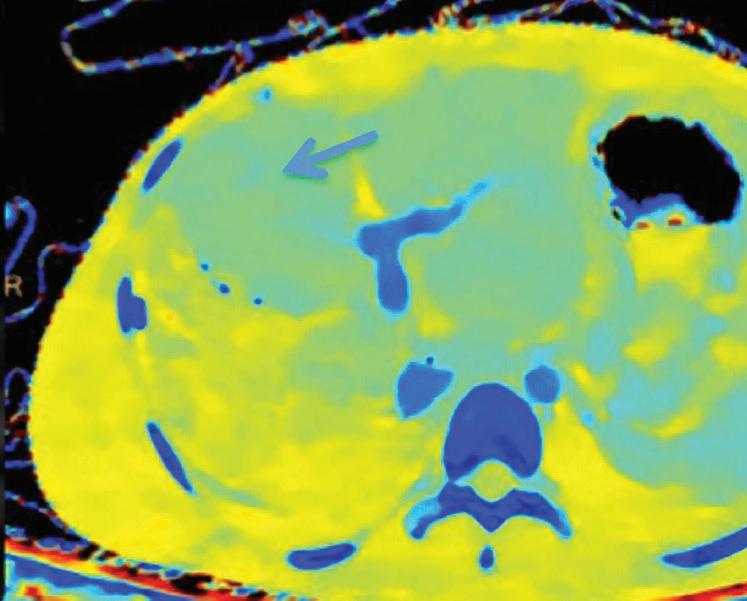


Emergency brain imaging
In the setting of acute neurologic conditions, non-contrast CT is the initial imaging modality to investigate acute intracranial hemorrhage (ICH) and stroke due to its availability and acquisition speed, and in the presence of MRI contraindications.1 As well as providing conventional images, spectral CT can contribute to diagnosis of acute conditions (e.g., detection of intracranial hemorrhage, differentiation of iodine from hemorrhage, and detection of infarction after intra-arterial revascularization therapy for acute stroke, reduction of metallic artifacts from aneurysm clips or coils, beam hardening artifacts in posterior fossa, and gray-white matter differentiation) with additional data sets generating virtual non-contrast images, virtual monoenergetic images at low and high keV, iodine, and Z effective maps.
Detection of intracranial hemorrhage
Non-traumatic intracranial hemorrhage primarily originates from hypertension, cerebral amyloid angiopathy, or anticoagulation. ICH can also arise secondarily from underlying conditions such as brain neoplasms and vascular malformations.2 An underlying tumor accounts for 10% of all spontaneous intracranial hemorrhage cases.3 However, when contrast enhanced conventional CT is performed with the suspicion of an underlying mass, a hyperattenuating hematoma could mask an enhancing solid lesion.4 Detection of an
Clinical case collection 148
Figure 2
A D B E C F
underlying cause is critical in patient management as well as patient prognosis.5 Spectral CT with virtual non-contrast images, iodine density, and iodine fusion images allows identification of iodine within the hyperattenuating lesion and aids in diagnosis of an underlying mass (see Head and Neck clinical case 3, Brain).
In the setting of intracranial hemorrhage, conventional true non-contrast images were compared with virtual non-contrast images obtained from spectral CT after contrast administration.6 Although contrast-to-noise ratio (CNR) was relatively lower, virtual non-contrast (VNC) images were found to be sufficient for the detection of the bleeding. Thus, spectral CT could be an ideal imaging modality for patients with acute ICH with the advantages of reducing both scanning time and radiation dose.5,6
Differentiating iodine from hemorrhage after intra-arterial revascularization in acute ischemic stroke
After intra-arterial stroke therapy, follow-up conventional non-contrast CT scans are obtained to rule out hemorrhage as a major complication of the procedure.7 However, it could be challenging to differentiate a hyperattenuation resulting from hemorrhage versus contrast extravasation or staining. Hemorrhage persists for several days to weeks, whereas early washout is seen in cases of contrast extravasation.7,8 Therefore, currently, a follow-up non-contrast CT scan is performed in 24 - 48 hours, and persistence of the hyperattenuation indicates hemorrhage, whereas early washout is indicative of contrast extravasation.7,9 Earlier accurate diagnosis of hemorrhage is crucial to allow an earlier decision-making regarding whether to continue or reverse anticoagulant therapy.10 Spectral CT was found useful in immediate differentiation of hemorrhage from contrast extravasation or staining on initial images in single acquisition with the help of virtual non-contrast images, iodine maps and overlay images.9,11,12 Hyperattenuating areas persisting as hyperdensities on virtual non-contrast CT were rated as hemorrhage, whereas hyperattenuating areas that were demonstrated as hyperdensities exclusively on iodine-only images and were not seen on virtual non-contrast images were rated as contrast staining or extravasation13 (See Head and Neck clinical case 4, Brain).
Detection of infarct after intra-arterial revascularization
Apart from detection of hemorrhage and blood brain disruption after intra-arterial revascularization, it has been shown that the infarct area could be depicted more accurately by spectral CT with iodine map and virtual non-contrast images compared to conventional CT.14-16
Artifact reduction
Metallic artifacts from clips and coils usually degrade the image, and evaluation of the patency of the adjacent vessels becomes challenging. The use of higher monoenergetic images could reduce these metallic artifacts as well as beam hardening artifacts in posterior fossa resulting in improved image quality.17,18
Assessment of gray-white matter differentiation
Evaluation of gray-white matter differentiation is important in suspected acute stroke patients. Loss of gray-white matter differentiation indicates cytotoxic edema, an early sign of ischemia and infarct.19 Virtual monoenergetic images at low keV were found to be superior to conventional CT in differentiating gray and white matter.20 Optimal image quality with higher contrast-to-noise and signal-to-noise ratios were observed at 65 keV reconstructed images which could enable earlier depiction of ischemic changes20-21 (Figure 3).
Clinical case collection 149
Patient with basilar artery occlusion presented with sudden onset of left sided hemiparesis and dysarthria. (a) Conventional CT without contrast, axial image at 120 kVp: basilar artery (arrow). (b) Virtual monoenergetic axial image at 40 keV: better demonstration of hyperdense basilar artery indicating a thrombus (arrow). (c) CT angiography, sagittal image: demonstration of the occluded basilar artery segment of 1.1 cm (arrow). (d) CT angiography, axial image at 120 kVp: subtle hypodensity on the right side of pons (arrow). (e) Virtual monoenergetic axial image at 40 keV: better demonstration of hypodensity of right side of pons (arrow). (f) Iodine density map: demonstrating lower iodine content in this area (arrow). (g) Z effective map: area with lower iodine content on the right side of pons is color coded in red (arrow). (h) Iodine overlay image: demonstrating corresponding area with lower iodine content (arrow). (i) Conventional CT without contrast, axial image at 120 kVp: 48 hours later, prominent hypodensity in the corresponding right side of pons (arrow) confirming ischemia.

Emergency head and neck imaging (infection and inflammation)

Infection and inflammation
Early and effective treatment is crucial in patients with suspected head and neck abscesses. CT is the modality of choice for evaluation of neck abscesses, and the neck spaces involved and diagnosis could be challenging in some cases.22 Spectral CT could contribute to better delineation of head and neck abscesses and could be helpful in early detection as well as better demonstrating its extent with the use of virtual monoenergetic images at low keV,


Clinical case collection 150
Figure 3
B E H C F I A D G
Z effective, and iodine density maps (Figure 4). Furthermore, monoenergetic images at lower keV and iodine maps could improve the attenuation of adjacent vasculature and help in prevention of bleeding during an incision or drainage.23


Artifact reduction
Higher keV monoenergetic images were found to be useful to reduce artifacts from dental implants and cervical spinal metallic implants which results in improved image quality and diagnostic confidence.24-26

Patient with dental abscess presented with pain and swelling in right submandibular region. Magic Glass coronal view. (a) Conventional CT coronal image: shows heterogeneous lesion in right submandibular area. (b) Virtual monoenergetic image at 40 keV: better delineates the borders of the abscess showing submental extension (arrows). (c) Iodine density coronal image: demonstrates increased iodine content of the abscess wall (2.30 mg/ml, blue arrow) compared to normal left submandibular area (1.34 mg/ml, open arrow), and central part of the abscess without iodine content (0.02 mg/ml, white arrow). (d) Z effective coronal image: wall of right submandibular abscess with increased iodine content is color coded in darker blue and has higher effective atomic number (8.53, blue arrow) compared to unaffected left submandibular area (8.08, open arrow) that is color coded in lighter blue-green. Central portion of the abscess without iodine content is color coded in yellow-orange (white arrow).

Clinical case collection 151
Figure 4
A B C D
Left
is not well demonstrated. (b) Virtual monoenergetic axial image at 40 keV: better demonstrates hypodense central area of the left psoas muscle (arrow). (c) Iodine density axial image: shows lack of iodine within the central area (0.00 mg/ml, white arrow), compared to peripheral areas of the muscle (1.18 mg/ml, blue arrow). (d) The central area of the muscle without iodine content has lower atomic number and color coded in yellow (white arrow) compared to periphery of the muscle color coded in light blue (blue arrow) on Z effective map.


Emergency musculoskeletal imaging
Currently, spectral CT is used in clinical practice to detect monosodium urate (MSU) crystals in and around joints in gout arthropathy as a non-invasive method which has also been shown to be valuable in acute settings.27 There are other several musculoskeletal acute conditions in which spectral CT can aid in diagnosis through different applications such as energy-specific imaging for metallic artifact reduction of implants and prosthesis, materialspecific imaging for detection of bone marrow edema in trauma patients with virtual calcium suppressed images, and assessment of tendons and ligaments.28 Additionally, assessment of iodine content could aid in diagnosis of intramuscular hematoma (Figure 5). Spectral CT with dual-layer detector has the advantage of performing dual-energy analysis on every data set acquired, eliminating the need for prospective selection of a dual-energy protocol.29

Clinical case collection 152
Figure 5
A
Left-sided psoas hematoma in a patient receiving anticoagulation therapy. Magic Glass axial view. (a) Conventional axial CT with contrast:
psoas hematoma
B C D
Acute gout arthritis
Acute gout arthritis presents as an acute periarticular inflammatory response to presence of monosodium urate crystals in soft tissues and joints. The classical presentation is pain of the first metacarpophalangeal joint (podagra), and it is the most common crystal arthropathy.30 Differential diagnosis includes septic arthritis, trauma, and pseudogout. Although it mainly involves the knee joint, exclusion of septic arthritis is difficult in some cases and requires arthrocentesis. Trauma is usually excluded by patient history. Pseudogout is diagnosed by calcium pyrophosphate presence in the synovial fluid. Although diagnosis of gout could be typically made invasively through detection of monosodium urate crystals in the involved synovial joint, in 25% of cases, it may not be identifiable.31 Early diagnosis is important, as it can lead to joint destruction if left untreated.32 Imaging methods such as radiography, ultrasound, conventional CT, and MRI have not been shown to be sensitive or specific enough to demonstrate urate crystals.33-35 Spectral CT allows material differentiation based on the attenuation difference of materials with high atomic number (calcium) and low atomic number (uric acid) at different energy levels; thus, characterization of urate and differentiation from calcium is possible.36,37 It has been shown that spectral CT with material decomposition is an accurate and specific non-invasive method to diagnose acute gout.32,38,39
Metal artifact reduction
Conventional CT evaluation of metallic prosthesis, implants and their loosening, and the assessment of fractures and infection around them could be challenging due to metal artifacts. Metallic implants also cause distortion in MRI images. Spectral CT provides energyspecific images and with higher monoenergetic images, metal artifacts could be reduced, and image quality could be improved without increased radiation dose to the patient.40,41
Bone marrow edema in acute trauma
Bone marrow edema related to trauma is presumed as trabecular microfractures, and MRI is the modality of choice for its evaluation.42-44 Conventional CT fails to detect bone marrow edema due to overlying trabecular bone, thus it is not possible to depict the age of the fracture or to detect a bone bruise in the context of trauma.45 It has been demonstrated that spectral CT with material decomposition and calcium suppressed images is successful in depicting traumatic bone marrow edema of the knee and ankle46-48 (see chapter on MSK diseases) as well as vertebral compression fractures.49-51 Although MRI maintains its position in demonstrating bone marrow edema, spectral CT is a promising method especially in emergency settings to detect occult fractures and differentiate acute fractures from older ones where MRI is contraindicated or not available.52
Evaluation of tendons and ligaments
Conventional CT has limitations in evaluation of soft tissues such as tendons and ligaments compared to ultrasound and MRI. Spectral CT, with enhanced characterization of collagenous structures, has been shown to be promising in the evaluation of tendons and ligaments which are composed of collagen, elastin, and glycosaminoglycan.53 Assessment of avulsion, thickening, and compression could be possible with material differentiation applications allowing differentiation of collagen.54,55 Although tendons and ligaments could be demonstrated, the data regarding spectral CT evaluation of tendons and ligaments is controversial and has some limitations.56-59 Future studies and technological advancements are required to show its true utility in this area.
Clinical case collection 153
References
1. Salmela, M.B., Mortazavi, S., Jagadeesan, B.D. et al. ACR Appropriateness Criteria® Cerebrovascular Disease. J Am Coll Radiol. 2017; 14: S34–S61.
2. Qureshi AI, Tuhrim S, Broderick JP, Batjer HH, Hondo H, Hanley DF. Spontaneous intracerebral hemorrhage. N Engl J Med 2001; 344: 1450–60.
3. Fewel ME, Thompson BG Jr, Hoff JT. Spontaneous intracerebral hemorrhage: a review. Neurosurg Focus. 2003 Oct 15 ;15 (4):E1. Review.
4. Kim SJ, Lim HK, Lee HY, Choi CG, Lee DH, Suh DC, et al. Dual-energy CT in the evaluation of intracerebral hemorrhage of unknown origin: differentiation between tumor bleeding and pure hemorrhage. AJNR Am J Neuroradiol 2012; 33: 865–72.
5. Cho SB, Baek HJ, Ryu KH, Moon JI, Choi BH, Park SE, et al. (2017) Initial clinical experience with dual-layer detector spectral CT in patients with acute intracerebral haemorrhage: A single-centre pilot study. PLoS ONE 12(11): e0186024.
6. Ferda J, Novak M, Mirka H, et al. The assessment of intracranial bleeding with virtual unenhanced imaging by means of dual-energy CT angiography. Eur Radiol 2009;19:2518–22.
7. Mericle RA, Lopes DK, Fronckowiak MD, et al. A grading scale to predict out-comes after intra-arterial thrombolysis for stroke complicated by contrast extravasation. Neurosurgery 2000;46:1307–14; discussion 1314 –15.
8. Jang YM, Lee DH, Kim HS, Ryu CW, Lee JH, Choi CG, Kim SJ, Suh DC. The Fate of High-Density Lesions on the Non-contrast CT Obtained Immediately After Intra-arterial Thrombolysis in Ischemic Stroke Patients. Korean J Radiol. 2006 Oct-Dec;7(4):221-28.
9. Phan CM, Yoo AJ, Hirsch JA, Nogueira RG, Gupta R. Differentiation of hemorrhage from iodinated contrast in different intracranial compartments using dual-energy head CT. AJNR Am J Neuroradiol. 2012;33:1088–94.
10. Greer DM, Koroshetz WJ, Cullen S, Gonzalez RG, Lev MH. Magnetic resonance imaging improves detection of intracerebral hemorrhage over computed tomography after intra-arterial thrombolysis. Stroke 2004;35(2):491–95.
11. Gupta R, Phan CM, Leidecker C, et al. Evaluation of dual-energy CT for differentiating intracerebral hemorrhage from iodinated contrast material staining. Radiology. 2010;257:205–11.
12. Postma AA, Das M, Stadler AAR, Wildberger JE. Dual-Energy CT: What the Neuroradiologist Should Know. Current Radiology Reports. 2015;3(5):16.
13. Morhard D, Ertl L, Gerdsmeier-Petz W, Ertl-Wagner B, SchulteAltedorneburg G (2014) Dual-energy CT immediately after endovascular stroke intervention: prognostic implications. Cardiovasc Intervent Radiol 37:1171–78.
14. Djurdjevic, T. et al. Prediction of infarction development after endovascular stroke therapy with dual-energy computed tomography. European radiology, 10.1007/s00330-016-4412-5 (2016).
15. Gariani J, et al. Diagnosis of acute ischemia using dual energy CT after mechanical thrombectomy. J Neurointerv Surg. 2016;8:996–1000.
16. Riederer I, Fingerle AA, Baum T, et al. Acute infarction after mechanical thrombectomy is better delineable in virtual non-contrast compared to conventional images using a dual-layer spectral CT. Scientific Reports. 2018;8:9329.
17. Shinohara Y, Sakamoto M, Iwata N, et al. Usefulness of monochromatic imaging with metal artifact reduction software for computed tomography angiography after intracranial aneurysm coil embolization. Acta Radiol 2014;55 (8):1015–23.
18. Hixson HR, Leiva-Salinas C, Sumer S, Patrie J, Xin W, Wintermark M. Utilizing dual energy CT to improve CT diagnosis of posterior fossa ischemia. J Neuroradiol. 2016 Oct;43(5):346-52.
19. Birenbaum D, Bancroft LW, Felsberg GJ. Imaging in acute stroke. West J Emerg Med. 2011;12: 67–76.
20. Pomerantz SR, Kamalian S, Zhang D, et al. Virtual mono-chromatic reconstruction of dual-energy unenhanced head CT at 65-75 keV maximizes image quality compared with conventional polychromatic CT. Radiology 2013;266(1): 318–25.
154 Clinical case collection
21. Neuhaus V, Abdullayev N, Große Hokamp N, Pahn G, Kabbasch C, Mpotsaris A, Maintz D, Borggrefe J. Improvement of Image Quality in Unenhanced Dual-Layer CT of the Head Using Virtual Monoenergetic Images Compared With Polyenergetic Single-Energy CT. Invest Radiol. 2017 Aug;52(8):470-76.
22. Capps EF, Kinsella JJ, Gupta M, et al. Emergency imaging assessment of acute, nontraumatic conditions of the head and neck. Radiographics 2010; 30: 1335–52.
23. Roele ED, Timmer VCML, Vaassen LAA, van Kroonenburgh AMJL, Postma AA. Dual-Energy CT in Head and Neck Imaging. Current Radiology Reports. 2017;5(5):19.
24. Große Hokamp N, Laukamp KR, Lennartz S, Zopfs D, Abdullayev N, Neuhaus VF, Maintz D, Borggrefe J. Artifact reduction from dental implants using virtual monoenergetic reconstructions from novel spectral CT. Eur J Radiol. 2018;104(7):136-42.
25. Zhou C, Zhao YE, Luo S, Shi H, Li L, Zheng L, et al. Monoenergetic imaging of dual-energy CT reduces artifacts from implanted metal orthopedic devices in patients with factures. Acad Radiol. 2011;18(10):1252–7.
26. Guggenberger R, Winklhofer S, Osterhoff G, Wanner GA, Fortunati M, Andreisek G, et al. Metallic artefact reduction with monoenergetic dual-energy CT: systematic ex vivo evaluation of posterior spinal fusion implants from various vendors and different spine levels. Eur Radiol. 2012;22(11):2357–64.
27. Aran S, Daftari Besheli L, Karcaaltincaba M, Gupta R, Flores EJ, Abujudeh HH. Applications of dual-energy CT in emergency radiology. AJR Am J Roentgenol. 2014;202:W314–24.
28. Mallinson PI, Coupal TM, McLaughlin PD, et al. Dual-Energy CT for the musculoskeletal system. Radiology. 2016;281:690–707.
29. Rassouli N, Etesami M, Dhanantwari A, Rajiah P. Detector-based spectral CT with a novel dual-layer technology: principles and applications. Insights into Imaging. 2017;8(6):589-98.
30. Bardin T, Richette P. Definition of hyperuricemia and gouty conditions. Curr Opin Rheumatol. 2014;26(2):186–91.
31. Swan A, Amer H, Dieppe P. The value of synovial fluid assays in the diagnosis of joint disease: a literature survey. Ann Rheum Dis. 2002;61(6):493–8.
32. Choi HK, Al-Arfaj AM, Eftekhari A, Munk PL, Shojania K, Reid G, Nicolaou S. Dual-energy computed tomography in tophaceous gout. Annals of the Rheumatic Diseases. 2009;68:1609–12.
33. Monu JU, Pope TL Jr. Gout: a clinical and radiologic review. Radiol Clin North Am 2004; 42:169–184 Choi MH, MacKenzie JD, Dalinka MK. Imaging features of crystal-induced arthropathy. Rheum Dis Clin North Am 2006; 32:427–46 [viii.]
34. Thiele RG, Schlesinger N. Diagnosis of gout by ultra-sound. Rheumatology (Oxford) 2007; 46:1116–1121 Thiele RG. Role of ultrasound and other advanced imaging in the diagnosis and management of gout. Curr Rheumatol Rep 2011; 13:146–53.
35. Perez-Ruiz F, Naredo E. Imaging modalities and monitoring measures of gout. Curr Opin Rheumatol 2007; 19:128–33.
36. Johnson TR, Krauss B, Sedlmair M, et al. Material differentiation by dual-energy CT: initial experience. Eur Radiol. 2007;17:1510–17.
37. Nicolaou S, Yong˜Hing CJ, Galea˜Soler S, Hou DJ, Louis L, Munk P. Dual-energy CT as a potential new diagnostic tool in the management of gout in the acute setting. Am J Roentgenol 2010; 194: 1072–8.
38. Bongartz T, Glazebrook KN, Kavros SJ, Murthy NS, Merry SP, Franz WB, 3rd, et al. Dual-energy CT for the diagnosis of gout: An accuracy and diagnostic yield study. Ann Rheum Dis. 2015;74:1072–7.
39. Glazebrook KN, Guimarães LS, Murthy NS et al. Identification of intraarticular and periarticular uric acid crystals with dual-energy CT: initial evaluation. Radiology 2011;261(2):516–24.
40. Bamberg F, et al. Metal artifact reduction by dual energy computed tomography using monoenergetic extrapolation. Eur Radiol. 2011;21(7):1424–29.
155 Clinical case collection
References
41. Zhou C, Zhao YE, Luo S, et al. Monoenergetic imaging of dual-energy CT reduces artifacts from implanted metal orthopedic devices in patients with fractures. Acad Radiol 2011; 18:1252–57.
42. Boks SS, Vroegindeweij D, Koes BW, Hunink MG, Bierma-Ze- instra SM. Follow-up of occult bone lesions detected at MR imaging: systematic review. Radiology 2006;238:853-62.
43. Mandalia V, Henson JH. Traumatic bone bruising—a review article. Eur J Radiol 2008;67:54–61.
44. Qaiyum M, Tyrrell PN, McCall IW, et al. MRI detection of unsuspected vertebral injury in acute spinal trauma: incidence and significance. Skeletal Radiol. 2001;30(6):299–304.
45. Ballane G, Cauley JA, Luckey MM, El-Hajj Fuleihan G. Worldwide prevalence and incidence of osteoporotic vertebral fractures. Osteoporos Int. 2017 May;28(5):1531-42.
46. Pache G, Krauss B, Strohm P, et al. Dual-energy CT virtual noncalcium technique: detecting posttraumatic bone marrow lesions-feasibility study. Radiology 2010;256(2): 617–24.
47. Seo SH, Sohn YJ, Lee CH, Park SH, Kim HW, Juhng SK. Dual-energy CT for detection of traumatic bone bruises in the knee joint. J Korean Soc Radiol 2013; 69:487–94.
48. Guggenberger R, Gnannt R, Hodler J, et al. Diagnostic performance of dual-energy CT for the detection of traumatic bone marrow lesions in the ankle: comparison with MR imaging. Radiology 2012;264(1):164-73.
49. Petritsch B, Kosmala A, Weng AM, Krauss B, Heidemeier A, Wagner R, et al. Vertebral compression fractures: third-generation dual-energy CT for detection of bone marrow edema at visual and quantitative analyses. Radiology. 2017;284(1):161–8.
50. Kaup M., Wichmann J. L., Scholtz J. E., et al. Dual-energy CT-based display of bone marrow edema in osteoporotic vertebral compression fractures: impact on diagnostic accuracy of radiologists with varying levels of experience in correlation to MR imaging. Radiology. 2016;280(2):510–19.
51. Schwaiger BJ, Gersing, AS, Hammel, J. et al. Three-material decomposition with dual-layer spectral CT compared to MRI for the detection of bone marrow edema in patients with acute vertebral fractures. Skeletal Radiol 2018 May 25.
52. Omoumi P, Verdun FR, Guggenberger R, Andreisek G, Becce F. Dual-energy CT: basic principles, technical approaches, and applications in musculoskeletal imaging (part 2). Semin Musculoskelet Radiol 2015;19(5):438–45.
53. Franchi M, Quaranta M, Macciocca M, De Pasquale V, Ottani V, Ruggeri A. Structure relates to elastic recoil and functional role in quadriceps tendon and patellar ligament. Micron. 2009;40:370–7.
54. Johnson TR, Krauss B, Sedlmair M, et al. Material differentiation by dual energy CT: initial experience. Eur Radiol 2007; 17:1510–17.
55. Goo HW, Goo JM. Dual-energy CT: new horizon in medical imaging. Korean J Radiol. 2017;18:555–69.
56. Lohan DG, Motamedi K, Chow K, Habibi R, Panknin C, Ruehm SG, et al. Does dual energy CT of lower-extremity tendons incur penalties in patient radiation exposure or reduced multiplanar reconstruction image quality? AJR Am J Roentgenol 2008;191:1386-90.
57. Deng K, Sun C, Liu C, Ma R. Initial experience with visualizing hand and foot tendons by dual-energy computed tomography. Clin Imaging 2009;33:384-9.
58. Sun C, Miao F, Wang XM, Wang T, Ma R, Wang DP, et al. An initial qualitative study of dual-energy CT in the knee ligaments. Surg Radiol Anat 2008;30:443-7.
59. Fickert S, Niks M, Dinter DJ, Hammer M, Weckbach S, Schoenberg SO, et al. Assessment of the diagnostic value of dual-energy CT and MRI in the detection of iatrogenically induced injuries of anterior cruciate ligament in a porcine model. Skeletal Radiol 2013;42:411-7.
156 Clinical case collection
157 Clinical case collection
History Benefits or pitfalls of dual-energy CT
Key images Findings
Emergency: Abdomen
Discussion
65-year-old female was found unconscious at home. Brain and carotid CT excluded acute vascular cerebral pathology. High fever, hypotension, and signs of multiorgan failure indicated sepsis, and abdominal dual-energy CT was performed to determine the origin.
Virtual non-contrast images help demonstrate urinary tract stones obscured by iodine by removing iodine remaining from recent previous studies.
Axial images
Conventional CT scan showed iodine in the urinary tract from previous studies and demonstrated decreased areas of enhancement of left renal parenchyma with perirenal fat infiltration. Mild hydronephrosis was present, but urinary tract stone could not be distinguished from iodine. Virtual non-contrast images demonstrated the stone in left upper ureter as a cause of obstruction. Iodine density and Z effective images showed renal parenchymal areas with lower iodine content compatible with pyelonephritis, and also allowed better demarcation of these areas. The stone was removed by ureteroscopy. Urine and blood culture was positive for E. coli. The patient was treated with nephrostomy and responded well clinically to appropriate antibiotic therapy according to antibiogram results.
Iodine in urinary tract from recent previous studies may obscure urinary stones. Virtual non-contrast images demonstrate the stone by removing iodine from the image. This is particularly important in diagnosis for appropriate treatment. Such patients may develop serious complications like severe pylenephritis and septic shock. Urinary stones might be hidden due to contrast medium excretion in the urinary tract. Spectral CT has the capacity to separate iodine from calcium and demonstrate the presence of a stone.
This case was provided by Begüm Demirler Simsir, Etienne Danse and Emmanuel Coche, from Cliniques Universitaires St-Luc, Brussels-Belgium.
158 Clinical case collection
Case Spectral CT in emergency department
Conventional CT axial image: proximal ureter stone (white arrow) cannot be distinguished from iodine in the urinary tract (blue arrow) from recent previous imaging with contrast.


Virtual non-contrast axial image: demonstration of proximal ureter stone (arrow) by removal of iodine in urinary tract.
Iodine density axial image: iodine density of the affected areas of left kidney is decreased (2.04 mg/ml, blue arrow) compared to adjacent non-affected parenchyma (5.52 mg/ml, white arrow). Note the removal of the stone on this iodine density image.
Z effective axial image: lower effective atomic number (8.40) and lower iodine content of the affected part of the left kidney is color coded in light blue-green (blue arrow) compared to adjacent non-affected renal parenchyma with higher effective atomic number (9.75) color coded in dark blue (white arrow).

159 Clinical case collection
History
Emergency: Abdomen and Vessels
Benefits or pitfalls of dual-energy CT
Key images Findings
51-year-old female with impaired renal function (creatinine: 1.65 mg/dl, GFR: 36 ml/min) due to lupus nephritis underwent right renal biopsy that was complicated by perirenal hematoma. Drop of hemoglobin level was noted. The patient was referred to dual-energy CT to exclude active bleeding. Due to impaired renal function, CT was performed with reduced contrast volume (40 ml).
Boosting of contrast enhancement at lower keV virtual monoenergetic images allows the use of low contrast volume for 3D volume rendering images.
Axial images, 3D volume rendered images
Conventional axial CT with low contrast volume (40 ml) was performed and interruption of right posterior renal capsule and perirenal hematoma was demonstrated without active bleeding. Renal defect was better demarcated on virtual monoenergetic images at 40 keV. Conventional 3D volume rendered images were of poor quality. 3D volume rendered images at 40 keV provided significantly improved image quality.
Discussion
Virtual monoenergetic images at 40 keV improve visualization of vessels at dual-energy CT angiography. Diagnostic images could be provided with low-contrast volume in patients with poor renal function by dual-energy CT angiography that enables boosting of contrast enhancement at lower keV.
This case was provided by Begüm Demirler Simsir, Etienne Danse and Emmanuel Coche, from Cliniques Universitaires St-Luc, Brussels-Belgium.
160 Clinical case collection
Case Spectral CT in emergency department
Conventional CT with contrast axial image, arterial phase: interruption of right posterior renal capsule (white arrow) and perirenal hematoma (blue arrows), no active bleeding was demonstrated.


Conventional 3D volume rendered image: poor quality with low (40 ml) contrast volume.
3D volume rendered image at 40 keV: good quality image generated with boosted contrast.

161 Clinical case collection
Virtual monoenergetic axial images at 40 keV: better demonstration of the defect (arrow).
Spectral CT in oncology
Clinical case collection 162 Special focus
Maria Barata, MD, Radiology Unit, Champalimaud Foundation, Lisbon, Portugal Celso Matos, MD, PhD, Head of Clinical and Experimental Imaging, Champalimaud Foundation, Lisbon, Portugal
Multi-detector computed tomography (MDCT) is an essential part of the armamentarium of oncologic imaging because of its availability, rapid acquisition time, and superior image quality. Dual-energy computed tomography (DECT) represents an innovative imaging technique, the basic principle of which lies in the analysis of the spectral dependencies of the net X-ray attenuation in two separate photon spectra during the CT acquisition, enabling the transition from density-based imaging to spectral imaging.
The IQon Spectral CT was installed in our radiology department in January 2017 and has been aiding our practice in patient pathological evaluations since. With the IQon Spectral CT, spectral information is obtained through a dual-layer spectral detector in addition to conventional CT density information. Using this technique, the low- and high-energy data sets are acquired simultaneously, without any time or spatial misregistration.1 Furthermore, the IQon Spectral CT captures this spectral information every time, without special planning or set-up. This means we can analyze the spectral data in any image retrospectively, which is very useful considering the high prevalence of unexpected incidental findings in clinical practice.2
The aim of this chapter is to provide an overview of the benefits and opportunities spectral CT provides in oncologic imaging, as well as to discuss the IQon Spectral CT utility for potential application in clinics based on our experience and reviewed literature.
Clinical applications
Spectral CT with a single acquisition allows the simultaneous generation of multiple data sets including:
• Different material-specific images: iodine mapping, virtual non-contrast (VNC) images, Z effective images, and calcium suppressed (CaSupp) images
• Energy-specific images: virtual monoenergetic (MonoE) images
The multi-parametric approach of spectral CT provides several advantages in oncologic imaging. The safety to patients for CT examinations is improved by reducing radiation dose and contrast medium administered, while at the same time, this approach provides advantages in tumor detection, characterization, and evaluation of response to therapy (Table 1).
Material-specific applications
Virtual non-contrast images
After material decomposition, the iodine content may be eliminated from the images, and VNC images can be generated. These images may replace the conventional unenhanced images, thereby decreasing the radiation burden to the patient significantly. This advantage is especially beneficial in young patients who are more at risk for radiation-induced consequences, or in patients who will undergo repeated follow-up CT examinations— a common scenario in oncologic imaging.
Clinical case collection 163
Introduction
Data sets
Advantages of spectral CT
Replace unenhanced conventional acquisition
Radiation dose reduction*
VNC
Iodine mapping
Depict fat, cystic components/necrosis, blood, calcifications
Improve diagnostic confidence
Identify and quantify intralesional iodine uptake
May replace perfusion for evaluation of angiogenesis
Lesion characterization**
Lesion detection and characterization**
Predict and assess tumor response to therapy***
Radiation dose reduction*
Z effective and CaSupp
Monoenergetic
Improve diagnostic confidence
Improve lesion contrast and conspicuity (low Monoenergetic)
Low energy levels, closer to the k-edge of iodine, significant increase in mean attenuation of contrast-enhanced structures
Reduce metallic artifacts (high Monoenergetic)
Opportunity to analyze attenuation curves of different materials at distinct energy levels
*Safety: Radiation dose reduction; Amount of contrast material reduction
**Diagnosis: Lesion characterization; Lesion detection; Image quality
Lesion detection and characterization**
Lesion detection and characterization**
Amount of contrast material reduction*
Image quality**
Lesion characterization**
***Response to therapy assessment: Predict and assess tumor response to therapy
An increasing number of scientific papers in international literature has shown that VNC images represent a clinically feasible surrogate of conventional unenhanced images for various anatomic regions. This technique allows reliable assessment of pre-contrast lesion attenuation.3-9 Furthermore, VNC images are able to depict a broad range of different structural features that may be found in lesions, helping with lesion characterization including areas of low attenuation (e.g., fat, cystic components, or necrosis), intermediate attenuation (e.g., solid component or debris), and high attenuation (e.g., hemorrhagic or protein-rich content, calcifications).3,5-8,10,11
Despite the improvements seen in recent years in the image quality provided by DECT systems, there are still some limitations of VNC reconstructed images.1,12 First, VNC overestimates the HU of fat relative to conventional unenhanced images.4,5 In addition, in VNC, small calcifications may be suppressed since on VNC images a reduction in the size of calcifications has been found compared to the true unenhanced data sets.3,7 Radiologists should be aware of these limitations when incorporating VNC data sets into their clinical routine protocols.
Clinical case collection 164
Table 1
Iodine mapping
Iodine images may be displayed as gray-scale images or as color coded overlay maps. Spectral CT can also provide a direct and accurate quantification of the iodine uptake in milligrams per milliliters (mg/ml). A lesion iodine concentration greater than 0.5 mg/ml has been suggested as highly indicative of lesion iodine uptake.8,13
Spectral CT-derived maps of iodine can be used to identify iodine uptake in tumors and can act as a surrogate for lesion vascularization. Beyond its diagnostic value for lesion detection and characterization (i.e., differential diagnosis of a lesion too small to be differentiated from a tiny cyst and/or a solid tumor/differentiation between a tiny cyst and a small solid tumor; evaluation of complex renal or adnexal cysts), iodine maps may also be beneficial for the assessment of lesion response after therapy. Iodine concentration quantification may also be useful for differentiation between benign and malignant lymph nodes, helping nodal staging.
Head and neck tumors. The use of iodine mapping in head and neck oncology imaging may improve lesion detection, increase lesion delineation,14 help to differentiate between benign and malignant tumors,15,16 or between tumor recurrence and post-therapeutic changes,17 as well as nodal staging.18,19 In a study by Kuno et al., iodine maps improved the accuracy of diagnosis of cartilage invasion in laryngeal and hypopharyngeal squamous cell carcinoma.14
The difficult task of detection for an underlying tumor as the cause of intracerebral hemorrhage is crucial. Preliminary results reported higher accuracy of DECT-derived color coded iodine images and virtual unenhanced images for detection of tumor enhancement compared to conventional post-contrast CT in this clinical scenario.20
Thoracic tumors. Iodine uptake has been used to characterize pulmonary nodules21 and to assess tumor grading and therapy response of thoracic tumors.22,23 DECT-derived maps of iodine distribution in the pulmonary parenchyma can also be used as a surrogate for pulmonary perfusion, which may be of particular interest in the preoperative evaluation of patients with lung cancer and in the assessment of pulmonary embolism as a common complication of malignancies.17,24
Liver tumors. Iodine maps improve visualization and detection of contrast uptake, potentially increasing the diagnostic confidence for assessment of metastatic liver lesion contrast enhancement or conversely ruling out the presence of any contrast enhancement in small benign cystic lesions.3,17 Atypical hemangiomas, which are frequently observed in patients with liver cirrhosis, represent an imaging challenge when attempting to differentiate them from hepatocellular carcinoma (HCC).17,25,26 Lv et al.25 demonstrated that lesion-specific iodine concentration could be used to differentiate hepatic hemangiomas from HCC. In addition, accurate detection and quantification of iodine concentration can be used as a more reliable and reproducible biomarker of tumor vascularity and may predict the likelihood of tumor response to antiangiogenic therapy.26-28 In a recent study, iodine density images from DECT provided good correlation with arterial perfusion images from perfusion CT in a group of HCC patients treated with sorafenib, with much lesser radiation dose (DLP 228 mGy*cm vs 1020 mGy*cm respectively).29 Iodine maps also have a diagnostic value in the assessment of HCC response to radiofrequency ablation30 or transarterial chemoembolization.31 Another potential advantage of iodine-quantification is the differentiation between malignant and benign thrombosis in patients with HCC and portal thrombus or vena cava invasion.32
Pancreatic tumors. Even when using an optimized protocol, approximately 11% of pancreatic ductal adenocarcinomas remain undetected on MDCT images because of the lack of a visible attenuation difference between the tumor and the adjacent pancreatic parenchyma.26
Because spectral CT-derived iodine images typically have higher CNRs, small or isoattenuating pancreatic ductal adenocarcinomas and cystic pancreatic neoplasms may be best seen on these images.17 In McNamara’s study of patients with small pancreatic ductal adenocarcinomas, subjective lesion conspicuity and readers’ confidence were
Clinical case collection 165
highest with iodine images.33 Review of iodine images yielded additional information in 50% of cases in a population of 44 patients with focal pancreatic disease and proved useful for identifying the relationship of tumors with peripancreatic vessels.34 In Lin’s study of patients with small insulinomas, the use of iodine images together with low-energy images resulted in a further increase in detection from 87% with DECT low-energy image viewing alone and 87% with iodine image viewing alone, to 95.8%35 (Figure 1).


Gastrointestinal tumors. In gastric adenocarcinoma, quantitative iodine concentration (IC) measurements may be helpful to distinguish differentiated carcinoma from undifferentiated carcinoma, and metastatic lymph nodes from non-metastatic lymph nodes,36-37 and to assess response to neoadjuvant chemotherapy (NC). Tang et al. demonstrated that changes in the IC had more accuracy for predicting good response to NC than tumor thickness, with IC on the arterial phase being a better predictor than IC on the venous phase.38 Gastrointestinal stromal tumors (GIST), are extremely rare, corresponding to 1–3% of malignant gastrointestinal tumors, which are usually located in the stomach and small intestine. With the recent introduction of targeted therapy with imatinib, clinical management and prognosis of GIST patients have improved significantly.17 These new molecularly targeted drugs require different response criteria than the traditional tumor response criteria (e.g., WHO or RECIST), as several studies have suggested.38-40 Choi et al. have proposed the measurement of CT attenuation values as a potential indicator of GIST response in patients undergoing targeted therapy.41 Iodine-related attenuation was demonstrated to be a more robust response parameter than the Choi criteria, without the need of unenhanced acquisition.42 Iodine maps were demonstrated to be useful in detecting colorectal cancer
Neuroendocrine tumor of the head of the pancreas incidentally found during a CT examination with a single acquisition in the venous phase. (a) Coronal and (d) axial conventional images, (b, e) corresponding monoenergetic 50 keV images, and (c, f) Volume rendered (VR) reconstructions obtained from monoenergetic 50 keV images. Note the improvement in the conspicuity and delineation of the tumor (white arrow) in low monoenergetic images compared to the conventional ones. Multiplanar VR reconstructions rule out invasion of superior mesenteric-portal vein confluence (blue arrow).


Clinical case collection 166
Figure 1
A D B E C F
without bowel preparation43 and in evaluating extracolonic spread of the tumor.44 In a recent study, enhanced DECT proved to be as accurate as MRI in differentiating between benign and malignant lymph nodes in rectal cancer.45
Renal and adrenal gland tumors. Contrast-enhanced-DECT images are particularly useful for the characterization of incidental renal or supra-renal lesions and for their follow-up, without the need of conventional unenhanced acquisition, translating into achieving a 30% mean dose savings for triphasic and up to 50% for biphasic renal protocols in daily clinical practice.17 It is also very useful in depicting hypervascular renal cell carcinoma metastasis in the liver or other sites, such as in the peritoneum and bowel wall (Figures 2 and 3).
Gynecologic tumors. Iodine images in gynecologic cancer are useful for characterization of a complex ovarian cyst (by detecting and quantifying subtle enhancing mural nodules or papillary projections) and for detection of enhancing subdiaphragmatic, intramuscular, infiltrating muscular, or bowel implants, which sometimes could not be differentiated from the surrounding tissues by the mean attenuation values.46 As previously stated, another important role of these data sets is the differentiation between benign and malignant lymph nodes.36,45,46
Z effective
Spectral CT is able to generate Z effective images that show the mean atomic number of the material present in a voxel (Z effective values) and can be displayed as color coded overlay maps. Z effective images may be helpful to enhance the visual differences between different tissue types.46 Furthermore, due to the high atomic number of iodine compared to other tissues present in the human body, the Z effective images can highlight enhancing structures (Figures 2, 3, 4, and 5) and could be used for quantitative analysis to differentiate benign from malignant tumors or lymph nodes.16,45,47
Calcium suppressed images
The IQon Spectral CT scanner is also able to generate virtual calcium suppressed (CaSupp) images. Kosmala et al. demonstrated an excellent diagnostic performance of visual and ROI-based analyses of dual-energy virtual non-calcium images for assessing bone marrow infiltration in patients with multiple myeloma (sensitivity of 93.3%, specificity of 92.4%, accuracy of 92.7%), with precision comparable to that of MR imaging.48
Energy-specific applications
Dedicated post-processing of DECT data sets also provide the possibility to reconstruct virtual monoenergetic (MonoE) images. The selected monoenergetic images should target the diagnostic task. Use of low monoenergetic images (40-60 keV), acquired closer to the k-edge of iodine, improves lesion detection and makes vascular studies possible with a significant reduction of the amount of contrast material administrated.49 On the other hand, high monoenergetic images (100-200 keV) provide less contrast but are useful to reduce artifacts caused by metal implants. This technique can also be used in the setting of tissue characterization by analyzing attenuation curves of different materials at distinct energy levels.17,50
Head and neck tumors. In a study on head and neck squamous cell carcinoma (SCC), reconstruction of monochromatic virtual images at 60 keV resulted in improvement of subjective image quality, higher tumor attenuation, and increased tumor contrast-tonoise ratio.51
Thoracic abnormalities. Delesalle et al. demonstrated that low virtual monochromatic images (≤ 60 keV) provide optimal diagnostic enhancement of the pulmonary arteries for diagnosing pulmonary embolism with only 25–35 ml of iodinated contrast material (iodine concentration 370 mg/ml).49 The role of spectral CT in chest tumors is discussed more in detail in the chapter dealing with thoracic disorders.
Clinical case collection 167
Effectiveness of spectral CT imaging for detection of hypervascular liver metastases. A small hypervascular metastasis (arrow) from renal cell carcinoma. (a) Axial contrast-enhanced conventional CT image obtained in the arterial phase, corresponding (b) monoenergetic 50 keV, and (c) Z effective image.


Effectiveness of spectral CT imaging for detection of a peritoneal implant from a renal cell carcinoma invading the bowel wall (arrow). (a) Coronal contrast-enhanced conventional CT image obtained in the arterial phase, corresponding (b) Z effective, (c) monoenergetic 50 keV, and (d) iodine-density image.


Clinical case collection 168
Figure 3
A
B D
C
Figure 2
A B C
Multifocal HCC treated with sorafenib. (a) A small nodule (arrow) is barely seen on conventional axial CT image, acquired at late arterial phase after administration of 70 ml of contrast material (iodine concentration 350 mg/ml). (b) Monoenergetic 50 keV and (c) Z effective images improve the detection of this small nodule as well as allowing better evaluation of the peripheral solid component of both nodules seen in these images, with a precision comparable to that of (d) post contrast MR image.
A small isoattenuating pancreatic adenocarcinoma (arrow), (a) which tend to blend into normal parenchyma on conventional axial CT image, acquired at pancreatic parenchymal phase with administration of 70 ml of contrast material (iodine concentration 350 mg/ml). (b) Monoenergetic 50 keV and (c) Z effective images improve detection by increasing conspicuity and contrast between tumor and normal parenchyma.

Liver tumors. Use of low-monoenergetic images on late arterial phase improves the detection of hypervascular liver lesions (e.g., HCC in cirrhotic liver) (Figure 4).3,17,52,53 It also improves detection of hypovascular liver metastases on portal-venous-phase.54


Pancreatic tumors. Several studies have demonstrated an obvious advantage of DECT for detection and staging of pancreatic adenocarcinoma using the low-monoenergetic data sets (Figure 5), regardless of the timing of the acquisition applied (single venous phase,55 pancreatic parenchymal phase,56 single split bolus single acquisition57).
Renal tumors. Low-monoenergetic images, as similar to iodine mapping, are useful for tumor detection, characterization, and assessment of tumor response to targeted therapy. Several studies demonstrated that renal lesions could be accurately characterized in a singlephase dual-energy protocol, with subsequent significant decrease in image interpretation time and radiation exposure.17


Clinical case collection 169 A B C D
Figure 4
Figure 5
A
B C
Conclusion
Spectral CT provides several beneficial applications in oncologic imaging. The possibility of obtaining different material-specific and energy-specific data sets during a single scan can improve detection and characterization of tumors. The safety of CT examinations may also be improved by reduction of radiation dose to the patient and the amount of administrated contrast material. In addition, this approach may be auxiliary in the prediction and evaluation of tumor response to therapy and in the detection of cancer-related comorbidities and complications.
Clinical case collection 170
References
1. McCollough CH, et al. Dual- and multi-energy CT: principles, technical approaches, and clinical applications. Radiology. 2015; 276: 637-653.
2. Gabbai M, et al. The clinical impact of retrospective analysis in spectral detector dual energy body CT. RSNA 2013, Chicago.
3. De Cecco CN, et al. Dual-Energy CT: Oncologic Applications. AJR. 2012; 199: 98-105.
4. Ananthakrishnan L, et al. Spectral detector CT-derived virtual non-contrast images: comparison of attenuation values with unenhanced CT. Abdom Radiol. 2017; 42: 702-709.
5. Ho LM, et al. Characterization of adrenal nodules with dual-energy CT: can virtual unenhanced attenuation values replace true unenhanced attenuation values? AJR. 2012; 198: 840–845.
6. De Cecco CN, et al. Dual energy CT (DECT) of the liver: conventional virtual unenhanced images. Eur Radiol. 2010; 20: 2870-2875.
7. Mileto A, et al. Pancreatic dual-source dual energy CT: is it time to discard unenhanced imaging? Clin Radiol. 2012; 67: 334-339.
8. Chandarana H, et al. Iodine quantification with dual energy CT: phantom study and preliminary experience with renal masses. AJR. 2011; 196: 693-700.
9. Pelgrim G J, et al. Accuracy of iodine quantification using dual energy CT in latest generation dual source and dual layer CT. Eur Radiol. 2017; 27: 3904-3912.
10. Ascenti G, et al. Dual-source dual energy CT evaluation of complex cystic renal masses. AJR. 2012; 199: 1026-1034.
11. Chae EJ, et al. Dual-energy computed tomography characterization of solitary pulmonary nodules. J Thorac Imaging. 2010; 25: 301-310.
12. De Cecco CN, et al. Virtual unenhanced images of the abdomen with 3rd generation dual-source dual-energy CT and 3rd generation iterative reconstruction: image quality, attenuation and radiation dose. RSNA 2014, Chicago.
13. Ascenti G, et al. Distinguishing enhancing from nonenhancing renal masses with dual-source dual energy CT: iodine quantification versus standard enhancement measurements. Eur Radiol. 2013; 23: 2288-2295.
14. Kuno H, et al. Evaluation of cartilage invasion by laryngeal and hypopharyngeal squamous cell carcinoma with dual-energy CT. Radiology. 2012; 265: 488-496.
15. Gao SY, et al. Identification of benign and malignant thyroid nodules by in vivo iodine concentration measurement using single-source dual energy CT. Medicine 2016; 95 (39): e4816.
16. Li M, et al. Dual-energy computed tomography imaging of thyroid nodule specimens: comparison with pathologic findings. Invest Radiol. 2012; 47: 58-64.
17. De Cecco CN, et al. Dual Energy in Oncology. Springer. 2015.
18. Tawfik AM, et al. Comparison of dual-energy CT-derived iodine content and iodine overlay of normal, inflammatory and metastatic squamous cell carcinoma cervical lymph nodes. Eur Radiol. 2014; 24: 574-580.
19. Liu X, et al. Papillary thyroid cancer: dual-energy spectral CT quantitative parameters of preoperative diagnosis of metastasis to the cervical lymph nodes. Radiology. 2014; 275: 167-176.
20. Kim SJ, et al. Dual-energy CT in the evaluation of intracerebral hemorrhage of unknown origin: differentiation between tumor bleeding and pure hemorrhage. AJNR. 2012; 33: 865-872.
21. Zhang Y, et al. Can spectral CT imaging improve the differentiation between malignant and benign solitary pulmonary nodules? PLOS ONE 2016|DOI: 10.1371/journal.pone.0147537.
22. Iwano S, et al. Evaluation of lung cancer by enhanced dual-energy CT: association between three-dimensional iodine concentration and tumour differentiation. Br J Radiol. 2015; 88 (1055).
23. Coche E. Evaluation of lung tumor response to therapy: current and emerging techniques. Diagnostic and Interventional Imaging 2016; 97: 1053-1065.
Clinical case collection 171
References
24. Otrakji A, et al. Dual-energy CT: spectrum of thoracic abdnormalities. Radiographics 2016; 36: 38-52.
25. Lv P, et al. Differentiation of small hepatic hemangioma from small hepatocellular carcinoma: recently introduced spectral CT method. Radiology. 2011; 259: 720-729.
26. Marin D, et al. State of the art: dual-energy CT of the abdomen. Radiology. 2014; 271: 327-342.
27. Chen B, et al. Precision of iodine quantification in hepatic CT: effects of iterative reconstruction with various imaging parameters. AJR. 2013; 200: 475-482.
28. Dai X, et al. Quantitative therapy response assessment by volumetric iodine-uptake measurement: initial experience in patients with advanced hepatocellular carcinoma treated with sorafenib. Eur J Radiol. 2013; 82: 327-334.
29. Gordic S, et al. Correlation between dual-energy and perfusion CT in patients with hepatocellular carcinoma. Radiology. 2016; 280: 78-87.
30. Lee SH, et al. Dual-energy computed tomography to assess tumor response to hepatic radiofrequency ablation: potential diagnostic values of virtual noncontrast images and iodine maps. Invest Radiol. 2011; 46:77-84.
31. Lee JA, et al. Dual-energy CT to detect recurrent HCC after TACE: initial experience of color-coded iodine CT imaging. Eur J Radiol. 2013; 82: 569-576.
32. Qian LJ, et al. Differentiation of neoplastic from bland macroscopic portal vein thrombi using dual-energy spectral CT imaging: a pilot study. Eur Radiol. 2012; 22: 2178-2185.
33. McNamara MM, F et al. Multireader evaluation of lesion conspicuity in small pancreatic adenocarcinomas: complimentary value of iodine material density and low keV simulated monoenergetic images using multiphasic rapid kVp-switching dual energy CT. Abdom Imaging. 2015; 40:1230-1240.
34. Chu AJ, et al. Dual-source, dual-energy multidetector CT for the evaluation of pancreatic tumours. Br J Radiol. 2012; 85: 891–898.
35. Lin XZ, Wu ZY, Tao R. Dual energy spectral CT imaging of insulinoma-value in preoperative diagnosis compared with conventional multi-detector CT. Eur J Radiol. 2012; 81:2487–2494.
36. Pan Z et al. Gastric Cancer Staging with Dual Energy Spectral CT Imaging. PLOS ONE 2013; 8 (2): e53651.
37. Liang P, et al. Iodine concentration in spectral CT: assessment of prognostic determinants in patients with gastric adenocarcinoma. AJR. 2017; 209: 1033-1038.
38. Tang L, et al. Evaluating the response of gastric carcinomas to neoadjuvant chemotherapy using iodine concentration on spectral CT: a comparison with pathological regression. Clinical Radiology. 2015; 70: 1198-1204
39. Benjamin RS, et al. We should desist using RECIST, at least in GIST. J Clin Oncol. 2007; 25:1760-1764
40. Meyer M, et al. CT-based response assessment of advanced gastrointestinal stromal tumor: dual energy CT provides a more predictive imaging biomarker of clinical benefit than RECIST or Choi criteria. Eur J Radiol. 2013; 82: 923-928.
41. Choi H, et al. Correlation of computed tomography and positron emission tomography in patients with metastatic gastrointestinal stromal tumor treated at a single institution with imatinib mesylate: proposal of new computed tomography response criteria. J Clin Oncol. 2007; 25: 1753-1759.
42. Apfaltrer P, et al. Contrast-enhanced dual-energy CT of Gastrointestinal Stromal Tumors: is iodine-related attenuation a potential indicator of tumor response? Invest Radiol. 2012; 47: 65-70.
43. Boellaard TN, et al. The feasibility of colorectal cancer detection using dual-energy computed tomography with iodine mapping. Clin Radiol. 2013; 68:799-806.
44. Chen CY, et al. Utility of the iodine overlay technique and virtual non-enhanced images for the preoperative T staging of colorectal cancer by dual-energy CT with tin filter technology. PLOS ONE 2014; 9, e113589.
45. Al-Najami I, et al. Dual-energy CT can detect malignant lymph nodes in rectal cancer. Eur Radiol. 2017; 90: 81-88.
46. Benveniste AP, et al. Potential application of dual-energy CT in gynecologic cancer: initial experience. AJR. 2017; 208: 695-705.
Clinical case collection 172
47. Papadakis A, Damilakis J. Spectral CT: On the accuracy of concentration and effective atomic number estimation. Phisic Medica. 2016; 32: 232-233.
48. Kosmala A, et al. Multiple myeloma and dual-energy CT: diagnostic accuracy of virtual noncalcium technique for detection of bone marrow infiltration of the spine and pelvis. Radiology. 2018; 286: 205-213.
49. Delesalle MA, et al. Spectral optimization of chest CT angiography with reduced iodine load: experience in 80 patients evaluated with dual-source, dual-energy CT. Radiology. 2013; 267: 256-266.
50. Agrawal MD, et al. Oncologic applications of dual-energy CT in abdomen. Radiographics. 2014; 34: 589-612.
51. Wichmann JL, et al. Virtual monoenergetic dual-energy computed tomography: optimization of kiloelectron volt settings in head and neck cancer. Invest Radiol. 2014; 49: 735-741.
52. Marin D, et al. Hypervascular liver tumors: low tube voltage, high tube current multidetector CT during late hepatic arterial phase for detection – initial clinical experience. Radiology. 2009; 251: 771-779.
53. Altenbernd J, et al. Dual- energy-CT of hypervascular liver lesions in patients with HCC: investigation of image quality and sensitivity. Eur Radiol. 2011; 21:738-743.
54. Yamada Y, et al. Virtual monochromatic spectral imaging for the evaluation of hypovascular hepatic metastases: the optimal monochromatic level with fast kilovoltage switching dual-energy computed tomography. Invest Radiol. 2012; 47: 292-298.
55. Macari M, et al. Dual-source dual-energy MDCT of pancreatic adenocarcinoma: initial observations with data generated at 80 kVp and simulated weighted-average 120 kVp. AJR. 2010; 194: 27-32.
56. Patel BN, et al. Single-source dual-energy spectral multidetector CT of pancreatic adenocarcinoma: optimization of energy level viewing significantly increases lesion contrast. Clin Radiol. 2013; 68:1 48-154.
57. Brook OR, et al. Split-bolus spectral multidetector CT of the pancreas: assessment of radiation dose and tumor conspicuity. Radiology. 2013: 269:139–148.
Clinical case collection 173
History Benefits or pitfalls of dual-energy CT
Abdomen and Oncology
Key images
Findings
55-year-old male with a renal mass found during a routine abdominal ultrasonography. Evaluation conducted on the dual-energy IQon Spectral CT.
Low monoenergetic images better delineate renal tumors and help enhance the clinician’s ability to detect renal vein thrombosis. By analyzing attenuation curves, it is possible to characterize a thrombus as tumoral.
Axial images and attenuation curves
On the conventional CT images obtained during the nephrographic phase after 60 ml of contrast administration (iodine concentration 350 mg/ml), the borders of a renal tumor were less well delineated compared to the virtual monoenergetic images at 50 keV. Moreover, the low monoenergetic images showed renal vein invasion, which was difficult to see on the conventional CT images. A left nephrectomy was performed, and histological results revealed clear cell carcinoma with invasion of the renal vein.
Discussion
Dedicated post-processing of dual-energy CT data sets provided the opportunity to reconstruct virtual monoenergetic images. The use of low monoenergetic images (40-60 keV), acquired closer to the k-edge of iodine, enhances the clinician’s capability for lesion detection and makes vascular studies possible with lowered contrast material administered. This technique can also be used in the setting of tissue characterization by analyzing attenuation curves of different materials at distinct energy levels.
This
case was provided by Maria Barata and Celso Matos from Fundação Champalimaud, Portugal.
174 Clinical case collection
Case Spectral CT in oncology
Contrast-enhanced conventional CT axial image: It is difficult to delineate the borders of the tumor, especially anteriorly, and to depict the renal vein thrombosis (white circle).


Virtual monoenergetic axial image at 50 keV: Better delineates the renal tumor and improves the detection of the thrombus in the vein (white circle).
Attenuation curves: the attenuation curve of the ROI that represents the thrombus in the left renal vein (magenta color) is similar to the ROI that is representative of the tumor (blue color), which suggests a tumoral thrombus.

Macroscopic photograph of nephrectomy specimens shows a solid tumor and signs of venous invasion (white arrows).

Histopathological features characteristic of high grade clear cell carcinoma (HE x 10).

175 Clinical case collection
History Benefits or pitfalls of dual-energy CT
Abdomen and Oncology
Key images Findings
69-year-old male presented with abdominal pain. Dual-energy CT images from the IQon Spectral CT showed a hypervascular pancreatic tumor consistent with a possible neuroendocrine tumor.
Virtual monoenergetic images at lower keV increases the mean attenuation values of vascularized tumors, making the diagnosis of hypervascular small lesions possible through a single CT acquisition obtained during the venous phase. Volume rendering (VR) reconstructions obtained from the data sets provide an opportunity to enhance the clinician’s ability to visualize the lesion that is being studied.
Axial and VR images
On the conventional CT axial image obtained during the venous phase after 70 ml of contrast (iodine concentration 350 mg/ml), the tumor present in the head of the pancreas was not clearly visualized. There was an obvious hypervascular tumor in the corresponding virtual monoenergetic axial image at 50 keV. Only the VR reconstructions generated from the low monoenergetic data sets could depict the tumor and stage it, excluding the presence of vascular invasion. A cephalic pancreaticoduodenectomy was performed and histological results revealed a neuroendrocrine tumor (pT1 N0 R0).
Discussion
There is an obvious advantage of dual-energy CT for detection and staging of pancreatic tumors using low monoenergetic data sets. This improvement in the clinician’s ability to visualize the pathology in question also leads to an opportunity to reduce CT examinations to a single post-contrast acquisition, which also means a reduced radiation dose to the patient in daily clinical practice.
This
case was provided by Maria Barata and Celso Matos from Fundação Champalimaud, Portugal.
176 Clinical case collection
Case Spectral CT in oncology
Conventional CT with contrast, venous phase, axial image: The cephalic pancreatic tumor (white arrow) tends to blend into normal parenchyma.


Virtual monoenergetic axial image at 50 keV shows a hypervascular tumor in the head of the pancreas (white arrow).
VR reconstructions obtained from conventional CT images do not show the tumor.
Multiplanar VR reconstructions obtained from virtual monoenergetic at 50 keV show the tumor and rule out invasion of superior mesenteric-portal vein confluence (blue arrows).
Macroscopic specimens of cephalic pancreaticoduodenectomy reveals a tumor without vascular invasion.


Histopathological findings (HE x 0.25, HE x 20, synaptophysin x 0.25) characteristic of a neuroendocrine tumor. Proliferation index through ki-67 expression (ki-67 x 20).

177 Clinical case collection
History Benefits or pitfalls of dual-energy CT
Abdomen and Oncology
Key images
Findings
71-year-old male presented with ocular melanoma, increase in number and size of cystic liver lesions on abdominal ultrasound, evaluation with spectral CT.
Demonstration of iodine content of a gallbladder lesion quantitatively by iodine density and Z effective images. Better demonstration and delineation of gallbladder and small liver mass with virtual monoenergetic images at lower keV and iodine overlay images.
Axial and coronal images
Ultrasound showed increase in number and size of cystic liver lesions compared to previous imaging and sludge-like echogenicity in gallbladder. CT evaluation demonstrated an enhancing nodular lesion in gallbladder with HU values of 38 and 82.9 on true noncontrast and arterial phase images respectively. Virtual non-contrast images also showed similar HU (39.6 HU) to true non-contrast images. Iodine density and Z effective images demonstrated iodine uptake of the lesion. Virtual monoenergetic images at 40 keV and iodine overlay images allowed better delineation of the gallbladder mass and a small liver mass which was subtle on conventional images. PET/CT demonstrated high metabolic activity within the gallbladder mass (SUVmax 8.7). The lesion was found highly suspicious of melanoma metastasis. The patient underwent surgical biopsy and liver lesions were confirmed as melanoma metastasis. The patient was treated with immunotherapy and chemotherapy, however, follow-up CT showed progressive disease with increase of size of liver and gallbladder lesions.
Discussion
Spectral CT has the ability to quantitatively determinate the iodine content of a solid gallbladder mass. Virtual monoenergetic images at lower keV and iodine overlay images allow better demonstration and delineation of solid gallbladder mass and small liver metastasis with higher contrast.
This case was provided by Begüm Demirler Simsir, Etienne Danse and Emmanuel Coche, from Cliniques Universitaires St-Luc, Brussels-Belgium.
178 Clinical case collection
Case Spectral CT in oncology

179 Clinical case collection
Ultrasound image: sludge-like echogenicity in gallbladder (arrow).
(a) Conventional axial CT image without contrast: Gallbladder lesion (arrow) with an attenuation value of 38 HU. (b) Conventional axial CT arterial phase image: Contrast uptake of the lesion (82.9 HU, white arrow) and small subtle liver mass (blue arrow).

(c) Virtual non-contrast image: Gallbladder lesion (white arrow) with a similar attenuation value (39.6 HU) to true non-contrast image (38 HU). (d) Virtual monoenergetic image at 40 keV, arterial phase: Gallbladder (white arrow) and liver mass (blue arrow) are both more prominent.
Iodine overlay axial image: Gallbladder (white arrow) and small liver mass (blue arrow) with higher iodine content are more prominent.

180 Clinical case collection Case 3 Abdomen and Oncology Continued a c b d
Iodine density coronal images, arterial phase: Higher iodine content of the gallbladder mass (1.66 mg/ml, white arrow), compared to adjacent normal appearing liver parenchyma (0.09 mg/ml, blue arrow).

Z effective coronal images, arterial phase: Higher effective atomic number of the gallbladder mass (8.37, white arrow) color coded in green compared to adjacent normal appearing liver parenchyma (7.38, blue arrow) color coded in yellow.

PET/CT coronal images: High metabolic activity within the gallbladder mass (SUVmax 8.7, arrows).

Follow-up conventional CT 9 months later, axial image, arterial phase: Progression of the disease with enlargement of the gallbladder mass (arrow).

181 Clinical case collection
Spectral CT in radiation oncology
Thomas E. Merchant, DO, PhD, Chairman, Department of Radiation Oncology, Baddia J. Rashid Endowed Chair in Radiation Oncology, St. Jude Children’s Research Hospital, Memphis, Tennessee, U.S.A.
Clinical case collection 182 Special focus
Not long after its invention in the 1970s, computed tomography (CT) was exploited by the medical field and became fundamental to the development of modern treatment planning and delivery in radiation oncology. The earliest large-scale applications of CT-based treatment simulation included patients with prostate cancer, lung cancer, or head and neck tumors. CT adequately discriminated between tumor tissue and normal tissues at these sites, which were prioritized for radiation dose escalation or normal tissue sparing. Dose-calculation algorithms were developed that incorporated CT data because CT data could be acquired with minimal geometric distortion, and it was possible to correct for tissue heterogeneity. Electron or tissue density measures required for radiation-dose calculations could also be derived.
Integrated systems that incorporated CT for reproducible patient localization, tumor and normal tissue visualization, precise dose calculation and optimization, and verification were not widely available until the 1990s. The design and development of CT scanners for radiation oncology followed shortly thereafter. Those advances included a wide bore, flat couch top, and integrated software and hardware for tumor localization, isocenter marking, and imaging protocols. CT remains the “gold standard” three-dimensional (3D) imaging modality used for radiation-dose calculation and patient positioning and verification. Other imaging modalities have remained secondary to CT in the treatment-planning process, including those that provide better soft-tissue contrast or more functional information.
With the development of high-speed multidetector CT technology and methods, 4D-CT has proven valuable to account for respiratory or other types of organ motion during treatment planning. The basis for CT as the fundamental treatment-planning data set was further extended by the development of image-processing algorithms capable of reliable registration of other types of imaging modalities. The advent of cone-beam CT in the treatment-delivery environment and its role in image guidance for daily radiation therapy has further improved clinical radiation therapy, the accuracy of treatment, and realization of the goal to deliver the prescription dose to a well-defined target and lower doses to critical normal tissue structures. The development of CT in radiation oncology continues as clinicians seek to further improve radiation treatment planning and dose calculation, investigate adaptive therapy, and incorporate tumor and normal tissue response into their plans for care. Advances in the field of radiation oncology beyond conventional fractionated, conformal, and intensitymodulated photon therapies, include new requirements for precision and stereotaxic treatment. Hypofractionated irradiation regimens, brachytherapy, particle therapies, and others require improved reproducibility, tissue differentiation and characterization, larger fields of view, geometric accuracy, and high-speed data acquisition and processing.
The advent of dual-layer detector CT systems in diagnostic imaging and their eventual incorporation into the workflow of radiation oncology practice and research provide a new opportunity to assess and expand the role of CT because of the unique features and functions associated with this technology (e.g., improved image quality and iodine contrast enhancement). New roles include more accurate tissue characterization, improved contrast enhancement, functional information, radiation dose calculation, proton-stopping power ratio determination, treatment response assessment, and increased safety. We can project future uses of dual-layer detector CT based on past experiences, when devices built for diagnostic purposes were modified for use in the radiation oncology department.
Clinical case collection 183
Introduction
Uncertainty in clinical radiation oncology
There are numerous uncertainties in clinical radiation oncology. These are accounted for by well-defined clinical processes. Patient-positioning uncertainty is reduced by a simulation process that begins with the treatment-planning CT performed in the treatment position, the construction of customized immobilization devices, and indexing patient position with respect to the geometry of the planned treatment device. The physician is responsible for contouring the target volume and critical normal tissue structures for treatment planning. Targeting has many sources of uncertainty related to the underlying disease process and radiation delivery. The gross tumor volume typically includes the residual tumor and may include the tumor bed. The clinical target volume is the gross tumor volume with an additional margin added to account for subclinical tumor extension. These margins vary according to the disease process and may be on the order of millimeters or centimeters. The planning target volume has an additional geometric margin that is meant to account for positional uncertainty. This margin may be a few millimeters for body sites such as the brain, where fixation is excellent and intra/interfractional positioning differences are small, or larger for extracranial sites, where the nonrigidity of the body makes it challenging to precisely reproduce the treatment position daily. There is uncertainty in radiation-dose calculation. Changes in tissue composition, the volume or shape of the target, or the external contour of the patient due to weight gain or loss over the treatment course may influence the effective path length and attenuation of the beam directed at the target.
Radiation-dose calculations
Calculating the dose of radiation to administer to a patient requires an understanding of the attenuation of the beam and the composition of tissue between the surface of the patient, the tumor, and beyond. In the early treatment-planning systems, tissue heterogeneity was not considered. Clinical photon beams interact with tissue and the Compton effect predominates. Modern photon radiation-dose calculations correct for tissue heterogeneity to reduce uncertainties in absolute dose and rely on calibration curves to map CT numbers (Hounsfield units) to electron or tissue density that is utilized by dose-computation algorithms for generating heterogeneity-correction factors. A potential advantage of dual-energy and dual-layer CT systems is that they further improve the dose-calculation accuracy by considering tissue heterogeneity. These systems produce pixel-by-pixel parametric images of electron density and effective atomic number from which tissue attribution is possible and elemental composition can be estimated. Tissues in the beam path can be better characterized by this new capability than by simple approaches of calibration-curve mapping. The concept of using proton-stopping power images for dose calculation is highlighted by Figure 1.
The ability of dual-energy and dual-layer detector CT systems to improve radiation dose calculation was recognized early by several groups, especially those seeking to improve dose calculation for patients treated with brachytherapy or proton therapy. Dose heterogeneity correction for low-energy brachytherapy sources using dual-energy CT (DECT) images was investigated by Mashouf S et al.1 The new DECT technology overcomes the inaccuracies associated with the practice of tissue segmentation, in which actual tissue composition is ignored during the dose-calculation process. The lower energy range for the radiation sources used in brachytherapy are subject to photoelectric processes and highly dependent on tissue composition for dose calculation. Additional applications of dual-source CT, a type of DECT, were summarized by van Elmpt W et al.2 These applications include tissue characterization, dose calculation and its use in brachytherapy, proton therapy, artifact
Clinical case collection 184
reduction, and other radiotherapy purposes. The key feature of this review was the potential to improve dose estimation for brachytherapy, photon therapy, and proton therapy by using dual-energy imaging techniques. Monte Carlo calculations, the most accurate method for estimating proton therapy dose, depend on the type of DECT scanner used, and the estimated differences have clinically meaningful implications when calculating proton range.3 The differences were greatest comparing single-energy CT (SECT) and DECT scanners; however, the key finding was that twin-beam scanning was less accurate than dual-spiral or dual-source devices, which is attributed in part to geometric misalignment.
Dose calculations in clinical radiation therapy require the accurate assessment of electron density because of the energy spectrum and a sufficiently large field of view that encompasses not only the patient but also the immobilization devices and positioning systems, including the treatment couch top. In a study using the IQon Spectral CT system, the electron-density measurements, effective atomic number determination, and iodine quantitation were highly accurate and not sensitive to scan or reconstruction parameters.4 For kilovoltage-dose calculations, Vaniqui A et al. compared SECT and DECT methods of tissue segmentation. They found that SECT material segmentation may lead to an underestimation of the dose to organs at risk in the proximity of bone.5 Reduced errors in dose calculations near metal implants,6 and decreased metal artifact in all types of radiotherapy planning have also been investigated.7 Small differences (1.2%) were observed when the value of DECT in proton-dose calculations was assessed for simulations of patients with head and neck cancer.8


Clinical case collection
185
Figure 1
Treatment planning Mean ionization potential (I-value) images Bethe formula Calculated stopping power images Electron density images Atomic number images Dualenergy CT scan Calibration curve Singleenergy CT scan Treatment planning Mapped stopping power images HU images Conventional approach New approach
The feasibility of using proton-stopping power images to calculate radiation dose. Abbreviation: HU, Hounsfield unit; SPR, stopping power ratio.
Range of uncertainty in proton therapy and accuracy of proton-stopping power
To create more accurate electron density and effective atomic number images, a number of groups have researched the use of spectral CT data to calculate proton-stopping power and reduce range uncertainty in clinical proton therapy. The current practice in radiation oncology is to map Hounsfield units via a single calibration curve to calculate the proton-stopping power ratio, which requires error-inducing assumptions. Error estimates are as high as 3% to 3.5%, depending the types of tissues in the beam path. Many believe that more accurate estimates of proton-stopping power, through more accurate estimates of electron density and effective atomic number, will reduce uncertainty to less than 1%. Considering that reducing side effects is a primary goal for clinical trials involving children with cancer and further optimizing proton therapy is a primary goal for treating all patients, minimizing uncertainty will reduce the dose to critical normal tissues in a broad range of clinical scenarios.
Realizing the clinical goal to implement dual-layer CT technology directly in the treatment planning process requires calibration of materials and stopping-power calculation, tissuemimicking phantom imaging and irradiation, application of results to relevant clinical conditions by using patient data sets, assessing benefit by using accepted dose-effects models, and integrating mapped values to clinical treatment-planning systems to perform comparative planning studies. DECT has been studied to assess its role in estimating proton-stopping power ratio9,10, including ex vivo measurements that showed the stoppingpower ratio calculation of DECT is more accurate than that of SECT. 11 Wohlfahrt P et al. found that, compared to standard approaches, direct stopping-power ratio predictions in a validated model were more robust and accurate for large target volumes, and could play a direct role in particle therapy-planning applications.12 Compared to SECT, DECT may be used to reduce the bias in water-equivalent range predictions.13 A previous study by Wohlfahrt P et al. also showed in cohorts of patients with head and neck cancer or prostate cancer that the respective differences in water-equivalent range shifts measured 1.1 mm (1.2%) and 4.1 mm (1.7%) and were clinically significant.14 In a unique clinical scenario where other materials were considered, the mean percent error in stopping-power ratio for silicone implants was reduced from 11.46% for SECT to 0.49% for DECT.15 Zhu J and Penfold SN showed that DECT-based proton treatment planning in a commercial treatment-planning system was attractive, owing to the ability of DECT to characterize density and chemical composition of patient tissues.16 Yamada S et al. showed that dose distributions on virtual, unenhanced images generated from post-contrast DECT scans were almost equivalent to those on true unenhanced images.17 Virtual unenhanced images remove the iodine signals from the enhanced images, avoid incorrect calculated doses because of increased beam attenuation, which is caused by the high-attenuation characteristics of iodine, and permit the use of a single post-contrast scan for tumor delineation and dose calculation. Instead of using virtual unenhanced Hounsfield unit images, our group showed that iodine enhancement could also be greatly reduced on directly calculated proton-stopping power images from post-contrast DECT scans.18
Because inaccurate conversion of CT data to water-equivalent path length is an important source of uncertainty in ion-treatment planning, DECT may help reduce CT number ambiguities and deviations in stopping-power ratio. As shown by Hünemohr N et al., uncertainty was reduced from 3.1% to 0.7% for soft tissue and 0.8% to 0.1% for bone.19 DECT also facilitates tissue segmentation as inputs to Monte Carlo simulations for in vivo PET-activation studies evaluating range uncertainty.20
Clinical case collection 186
Tumor characterization and image quality


Radiation oncologists are eager to characterize tumor and noninvolved normal tissues to delineate target volume and avoid toxicity. The advent of highly conformal radiation therapy, the feasibility of dose painting, and the realization of pencil-beam scanning proton therapy have provided new treatment-planning challenges and opportunities to differentially irradiate high-risk tumor subvolumes when reliably identified. DECT has been used to accurately differentiate and characterize normal tissues for radiotherapy applications, including treatment planning of radiation therapy,21-23 identifying subvolumes within the gross tumor volume for dose paintin,24 and reducing metal artifact for more accurate tumor delineation in dental regions, spine, and hips.25,26 In the preclinical setting, DECT has been used to evaluate bone marrow edema attributed to radiation-induced damage.27 The concept of tumor characterization is highlighted in Figures 2-4.
(2)
demonstrating the extent of the
panels include conventional CT, monoenergetic 40 keV, iodine-density, and Z effective images. (3) Contrast-enhanced sagittal CT images of pediatric low-grade glioma demonstrating the extent of the tumor in the optic pathway. Left → right, panels include conventional CT, monoenergetic 40 keV, iodine-density, and Z effective images. (4) Contrast-enhanced axial CT images of pediatric Ewing sarcoma demonstrating the extent of the tumor in the bone and soft tissue. Left → right, panels comparing pre- vs. post-chemotherapy monoenergetic 40 keV images and pre- vs. post-chemotherapy Z effective images.
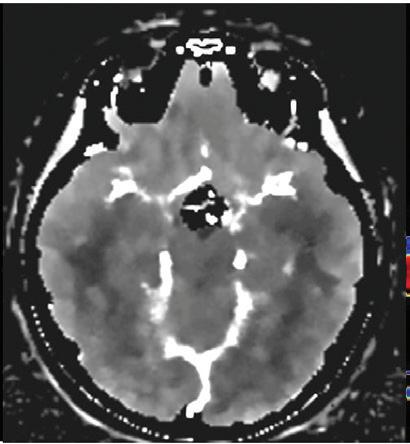

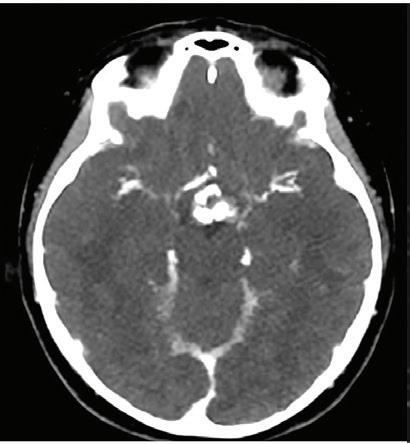


Clinical case collection 187
Figures 2-4
Contrast-enhanced axial CT images of pediatric craniopharyngioma
suprasellar tumor. Left → right,
3 4 2
Evaluation of treatment response
CT is the standard approach for target localization and radiation-dose calculation. The IQon Spectral CT increases the value of CT in radiation treatment planning by functionally defining tissues and enabling clinicians to characterize differences, such as carbon/oxygen ratio, iodine density, electron density, and other features that might be exploited in clinical radiotherapy. The assessment of tissue hypoxia serves as a poignant example of the benefit of spectral CT. Adult and pediatric tumors have regions of hypoxia that are biologically distinct and prone to increased resistance to therapy. Targeting regions of hypoxia for increased treatment intensity could be a means to overcoming radiation resistance.
Imaging and quantification of the relative amounts of oxygen and other elements in tissues is a feature of spectral CT imaging that should be investigated further. Nontarget hypoxic normal tissues are prone to injury. Establishing normal ranges in these imaging parameters would help identify injured normal tissue that might be avoided during radiation-treatment planning. Quantitatively assessing the iodine concentration also holds promise to accurately assess tumor vascularity, hypoxia, and treatment response.
Spectral CT data are acquired in a dual-layer detector system under all conditions; these data make up an invaluable data set for retrospective research, enabling investigators to map treatment failures to quantitative imaging used to plan treatments. The dual-layer detector CT system can store spectral data for retrospective analysis; however, this is not possible for every type of DECT system. Some DECT scanners will not generate dual-energy data if used for conventional scans. Serial imaging, often performed during radiation therapy and necessitated by changes in patient anatomy or to account for alterations in the size and shape of the target, provides additional opportunities to obtain quantitative imaging data, including reassortment of underlying elements and radiobiological conditions, and to monitor treatment response.
DECT systems have been used to assess the response of solid tumors to radiation therapy and chemotherapy. In one study, iodine quantitation correlated with measurements obtained from FDG-PET/CT, suggesting that DECT-based iodine quantitation might substitute for assessing lung cancer response to treatment.28 A decrease in iodine density in the arterial phase has been used to assess the response to therapy in patients with cervical cancer.29 DECT was also used successfully in a murine soft-tissue sarcoma model; DECT imaging enabled investigators to quantify liposomal iodine and gold nanoparticle accumulation and assess vascular permeability after treatment with chemotherapy and variable doses of radiation therapy.30 An earlier study compared the abilities of SECT and DECT to derive the concentrations of oxygen and carbon in human tissues for ion therapy applications.31 DECT more accurately assigned concentrations than did SECT when noise and other parameters of uncertainty were not considered.
The blood volume of tumors can be more accurately assessed by average iodine density than by average CT value, and the former has been proposed as a noninvasive, quantitative method to assess radioresistance attributed to the presumed hypoxic cell fraction of a given tumor.32 The same group showed that in a series of patients with lung cancer, local tumor control rates are worse in patients with lower average iodine density, and higher average iodine density is significantly associated with local tumor control.
Effective atomic number (Z effective value), as a response parameter, was investigated in patients with rectal cancer treated with neoadjuvant therapy that included irradiation. Al-Najami I et al. showed that a reduction in the Z effective value after therapy was associated with better pathologic response.33
Clinical case collection 188
Patient safety
Patients who receive radiation therapy are frequently imaged. Despite the relatively large difference between the exposure during therapeutic irradiation and exposure during diagnostic or treatment-planning studies, there are concerns about excessive radiation dose. Reducing dose is desirable in most settings, is possible with DECT technology, and should be feasible with a dual-layer detector CT.34 Contrast medium is underutilized in general radiation oncology departments because of the lack of consistent imaging protocols, concern about reactions, staff monitoring requirements, cost, age of the patients, and lack of temporal coordination with diagnostic studies. Improved visualization of contrast-enhanced structures gained by using dual-layer detector CT systems may facilitate the use of lower doses of contrast agents, increase patient safety, and increase the use of contrast in some departments.35 A 50% reduction in contrast dose on a 50 keV image should maintain comparable or improve the contrast-to-noise ratio, compared with polychromatic CT in more than 80% of CT studies. Radiation therapy might be safer if dual-energy or dual-layer CT technology is used to identify functionally compromised tissues during radiation planning. Bahig H et al. quantified lung function in a planning study to show how the results correlated well with functional single-photon emission CT/CT imaging.36 They proposed treatment plans that include functional lung-sparing irradiation.
Summary
The IQon Spectral CT system was commissioned in 2016 for clinical use in the Department of Radiation Oncology at St. Jude Children’s Research Hospital in Memphis, Tennessee. The installation was one of the first in the United States and unique, with respect to its focused application: radiation treatment planning and the evaluation of children treated with photon and proton therapy. The IQon Spectral CT joins other platforms for dedicated use in radiation oncology, including Philips 1.5T Ingenia MR, 3.0T Ingenia MR, and the Vereos digital PET/CT systems. The Department of Radiation Oncology at St. Jude Children’s Research Hospital is committed to protocol-based clinical research in pediatric oncology, advancing radiation therapy for children, and innovation in radiation treatment planning using photons and protons, adaptive therapy, and novel response evaluation.
Our selection of the IQon Spectral CT was based on the system’s ability to meet the rigorous geometric accuracy and tissue-characterization requirements for radiation-dose calculation. The system was installed in the world’s first and only proton therapy center dedicated solely to the treatment of children with cancer. There is potential for translational research to improve relative proton-stopping power calculations through more accurate estimation of electron density and effective atomic number. Key features of the current system that are relevant to radiation oncology research and practice include increased iodine contrast enhancement, accurate estimation of electron density and effective atomic number, field of view for electron density and effective atomic number data estimation, reduced imaging artifacts, spatially and temporally synchronized acquisition of spectral data, CT simulation software integration with external laser alignment systems, thin-slice imaging without beam hardening artifacts, connectivity with Oncology Information Systems, and the American College of Radiology–American Association of Physicists in Medicine (ACR-AAPM) technical standards for CT simulation. Important features that are relevant to a practice limited to children, adolescents, and young adults with cancer are high-quality virtual monoenergetic and non-contrast images. Future considerations to extend the value of spectral CT in radiation oncology should include 4D-CT for organ motion management, imaging biomarkers for treatment response assessments, connectivity of quantitative imaging data with radiation treatment–planning systems, AAPM Task Group No. 66 couch compliance,37 and potentially a larger bore (>70 cm).
Clinical case collection 189
References
1. Mashouf S, Lechtman E, Lai P, Keller BM, Karotki A, Beachey DJ, Pignol JP. Dose heterogeneity correction for low-energy brachytherapy sources using dual-energy CT images. Phys Med Biol. 2014 Sep 21;59(18):5305-16. doi: 10.1088/0031-9155/59/18/5305. PubMed PMID: 25146446.
2. van Elmpt W, Landry G, Das M, Verhaegen F. Dual energy CT in radiotherapy: current applications and future outlook. Radiother Oncol. 2016 Apr;119(1):137-44. doi: 10.1016/j.radonc.2016.02.026.
PubMed PMID: 26975241.
3. Almeida IP, Schyns LEJR, Vaniqui A, van der Heyden B, Dedes G, Resch AF, Kamp F, Zindler JD, Parodi K, Landry G, Verhaegen F. Monte Carlo proton dose calculations using a radiotherapy specific dual-energy CT scanner for tissue segmentation and range assessment. Phys Med Biol. 2018 May 29; 63(11)115008. doi: 10.1088/1361-6560/aabb60. PubMed PMID: 29616662.
4. Hua CH, Shapira N, Merchant TE, Klahr P, Yagil Y. Accuracy of electron density, effective atomic number, and iodine concentration determination with a dual-layer dual-energy computed tomography system. Med Phys. 2018 Apr 6. doi: 10.1002/mp.12903. [Epub ahead of print]
PubMed PMID: 29624708.
5. Vaniqui A, Schyns LEJR, Almeida IP, van der Heyden B, van Hoof SJ, Verhaegen F. The impact of dual energy CT imaging on dose calculations for pre-clinical studies. Radiat Oncol. 2017 Nov 21;12(1):181. doi: 10.1186/s13014-017-0922-9. PubMed PMID: 29157265; PubMed Central PMCID: PMC5696722.
6. Huang JY, Followill DS, Howell RM, Liu X, Mirkovic D, Stingo FC, Kry SF. Approaches to reducing photon dose calculation errors near metal implants. Med Phys. 2016 Sep;43(9):5117. doi: 10.1118/1.4960632. PubMed PMID: 27587042; PubMed Central PMCID: PMC4991994.
7. Schwahofer A, Bär E, Kuchenbecker S, Grossmann JG, Kachelrieß M, Sterzing F. The application of metal artifact reduction (MAR) in CT scans for radiation oncology by monoenergeti extrapolation with a DECT scanner. Z Med Phys. 2015 Dec;25(4):314-325. doi: 10.1016/j.zemedi.2015.05.004. PubMed PMID: 26144602.
8. Hudobivnik N, Schwarz F, Johnson T, Agolli L, Dedes G, Tessonnier T, Verhaegen F, Thieke C, Belka C, Sommer WH, Parodi K, Landry G. Comparison of proton therapy treatment planning for head tumors with a pencil beam algorithm on dual and single energy CT images. Med Phys. 2016 Jan;43(1):495. doi: 10.1118/1.4939106. PubMed PMID: 26745942.
9. Zhang YN, Fowler KJ, Hamilton G, Cui J, Sy EZ, Balanay M, Hooker JC, Szeverenyi N, Sirlin CB. Liver fat imaging - a clinical overview of ultrasound, CT, and MR imaging. Br J Radiol. 2018 May 3:20170959. doi: 10.1259/jr.20170959. [Epub ahead of print] PubMed PMID: 29722568.
10. Shen C, Li B, Chen L, Yang M, Lou Y, Jia X. Material elemental decomposition in dual and multi-energy CT via a sparsity-dictionary approach for proton stopping power ratio calculation. Med Phys. 2018 Apr;45(4):1491-1503. doi: 10.1002/mp.12796. PubMed PMID: 29405340; PubMed Central PMCID: PMC5904041.
11. Xie Y, Ainsley C, Yin L, Zou W, McDonough J, Solberg TD, Lin A, Teo BK. Ex vivo validation of a stoichiometric dual-energy CT proton stopping power ratio calibration. Phys Med Biol. 2018 Mar 7;63(5):055016. doi: 10.1088/1361-6560/aaae91. PubMed PMID: 29513647.
12. Wohlfahrt P, Möhler C, Richter C, Greilich S. Evaluation of stopping-power prediction by dualand single-energy computed tomography in an anthropomorphic ground-truth phantom. Int J Radiat Oncol Biol Phys. 2018 Jan 1; 100(1):244-253. doi: 10.1016/j.ijrobp.2017.09.025. PubMed PMID: 29079119.
13. Bär E, Lalonde A, Zhang R, Jee KW, Yang K, Sharp G, Liu B, Royle G, Bouchard H, Lu HM. Experimental validation of two dual-energy CT methods for proton therapy using heterogeneous tissue samples. Med Phys. 2018 Jan; 45(1):48-59. doi: 10.1002/mp.12666. PubMed PMID: 29134674.
14. Wohlfahrt P, Möhler C, Stützer K, Greilich S, Richter C. Dual-energy CT based proton range prediction in head and pelvic tumor patients. Radiother Oncol. 2017 Dec;125(3):526-533. doi: 10.1016/j.radonc.2017.09.042. PubMed PMID: 29050953.
190 Clinical case collection
15. Michalak G, Taasti V, Krauss B, Deisher A, Halaweish A, McCollough C. A comparison of relative proton stopping power measurements across patient size using dual- and single-energy CT. Acta Oncol. 2017 Nov;56(11):1465-1471. doi: 10.1080/0284186X.2017.1372625. PubMed PMID: 28885130.
16. Zhu J, Penfold SN. Review of 3D image data calibration for heterogeneity correction in proton therapy treatment planning. Australas Phys Eng Sci Med. 2016 Jun;39(2):379-390. doi: 10.1007/s13246-016-0447-9. PubMed PMID: 27115163.
17. Yamada S, Ueguchi T, Ogata T, Mizuno H, Ogihara R, Koizumi M, Shimazu T, Murase K, Ogawa K. Radiotherapy treatment planning with contrast-enhanced computed tomography: feasibility of dual-energy virtual unenhanced imaging for improved dose calculations. Radiat Oncol. 2014 Jul 29;9:168. doi: 10.1186/1748-717X-9-168. PubMed PMID: 25070169; PubMed Central PMCID: PMC4118618.
18. Hua CH, Shapira N, Merchant TE, Klahr P, Yagil Y. Accuracy of electron density, effective atomic number, and iodine concentration determination with a dual-layer dual-energy computed tomography system. Med Phys. 2018 Jun;45(6):2486-2497. doi: 10.1002/mp.12903. Epub 2018 Apr 23. PubMed PMID:29624708.
19. Hünemohr N, Paganetti H, Greilich S, Jäkel O, Seco J. Tissue decomposition from dual energy CT data for MC based dose calculation in particle therapy. Med Phys. 2014 Jun;41(6):061714. doi: 10.1118/1.4875976. PubMed PMID: 24877809; PubMed Central PMCID: PMC4032427.
20. Berndt B, Landry G, Schwarz F, Tessonnier T, Kamp F, Dedes G, Thieke C, Würl M, Kurz C, Ganswindt U, Verhaegen F, Debus J, Belka C, Sommer W, Reiser M, Bauer J, Parodi K. Application of single- and dual-energy CT brain tissue segmentation to PET monitoring of proton therapy. Phys Med Biol. 2017 Mar 21;62(6):2427-2448. doi: 10.1088/1361-6560/aa5f9f. PubMed PMID: 28182581.
21. Lapointe A, Lalonde A, Bahig H, Carrier JF, Bedwani S, Bouchard H. Robust quantitative contrast-enhanced dual-energy CT for radiotherapy applications. Med Phys. 2018 Apr 26. doi: 10.1002/mp.12934. [Epub ahead of print] PubMed PMID: 29697145.
22. Zhao W, Vernekohl D, Han F, Han B, Peng H, Yang Y, Xing L, Min JK. A unified material decomposition framework for quantitative dual- and triple-energy CT imaging. Med Phys. 2018 Apr 21. doi: 10.1002/mp.12933. [Epub ahead of print] PubMed PMID: 29679500.
23. Men K, Dai J, Chen X, Li M, Zhang K, Huang P. Dual-energy imaging method to improve the image quality and the accuracy of dose calculation for cone-beam computed tomography. Phys Med. 2017 Apr;36:110-118. doi: 10.1016/j.ejmp.2017.03.023. PubMed PMID: 28410679.
24. Gainey M, Carles M, Mix M, Meyer PT, Bock M, Grosu AL, Baltas D. Biological imaging for individualized therapy in radiation oncology: part I physical and technical aspects. Future Oncol. 2018 Apr;14(8):737-749. doi: 10.2217/fon-2017-0464. PubMed PMID: 29521520.
25. Kovacs DG, Rechner LA, Appelt AL, Berthelsen AK, Costa JC, Friborg J, Persson GF, Bangsgaard JP, Specht L, Aznar MC. Metal artefact reduction for accurate tumour delineation in radiotherapy. Radiother Oncol. 2018 Mar; 126(3):479-486. doi: 10.1016/j.radonc.2017.09.029.. PubMed PMID: 29050958; PubMed Central PMCID: PMC5864514.
26. Wang T, Ishihara T, Kono A, Yoshida N, Akasaka H, Mukumoto N, Yada R, Ejima Y, Yoshida K, Miyawaki D, Kakutani K, Nishida K, Negi N, Minami T, Aoyama Y, Takahashi S, Sasaki R. Application of dual-energy CT to suppression of metal artefact caused by pedicle screw fixation in radiotherapy: a feasibility study using original phantom. Phys Med Biol. 2017 Jul 17;62(15):6226-6245. doi: 10.1088/1361-6560/aa7d7f. PubMed PMID: 28675378.
27. Poort LJ, Stadler AAR, Ludlage JHB, Hoebers FJP, Kessler PAWH, Postma AA. Detection of bone marrow edema pattern with dual-energy computed tomography of the pig mandible treated with radiotherapy and surgery compared with magnetic resonance imaging. J Comput Assist Tomogr.
191 Clinical case collection
References
2017 Jul/Aug;41(4):553-558. doi: 10.1097/RCT.0000000000000559. PubMed PMID: 28722700.
28. Ren Y, Jiao Y, Ge W, Zhang L, Hua Y, Li C, Zhai W, Tang X, He W, Fang M, Zheng X. Dual-energy computed tomography-based iodine quantitation for response evaluation of lung cancers to chemoradiotherapy/radiotherapy: a comparison with fluorine-18 fluorodeoxyglucose positron emission tomography/computed tomography-based positron emission tomography/computed tomography response evaluation criterion in solid tumors. J Comput Assist Tomogr. 2018 Apr 2. doi: 10.1097/ RCT.0000000000000734. [Epub ahead of print] PubMed PMID: 29613988.
29. Jiang C, Yang P, Lei J, Li J, Yan K, Li F, Yan R, Xia L. The application of iodine quantitative information obtained by dual-source dual-energy computed tomography on chemoradiotherapy effect monitoring for cervical cancer: a preliminary study. J Comput Assist Tomogr. 2017 Sep/Oct;41(5):737-745. doi: 10.1097/RCT.0000000000000603. PubMed PMID: 28448413.
30. Ashton JR, Castle KD, Qi Y, Kirsch DG, West JL, Badea CT. Dual-energy CT imaging of tumor liposome delivery after gold nanoparticle-augmented radiation therapy. Theranostics. 2018 Feb 12;8(7):1782-1797. doi: 10.7150/thno.22621. eCollection 2018. PubMed PMID: 29556356; PubMed Central PMCID: PMC5858500.
31. Landry G, Gaudreault M, van Elmpt W, Wildberger JE, Verhaegen F. Improved dose calculation accuracy for low energy brachytherapy by optimizing dual energy CT imaging protocols for noise reduction using sinogram affirmed iterative reconstruction. Z Med Phys. 2016 Mar;26(1):75-87.
doi: 10.1016/j.zemedi.2015.09.001. PubMed PMID: 26422576.
32. Aoki M, Takai Y, Narita Y, Hirose K, Sato M, Akimoto H, Kawaguchi H, Hatayama Y, Miura H, Ono S. Correlation between tumor size and blood volume in lung tumors: a prospective study on dual-energy gemstone spectral CT imaging. J Radiat Res. 2014 Sep;55(5):917-923.
doi: 10.1093/jrr/rru026. PubMed PMID: 24829253; PubMed Central PMCID: PMC4202284.
33. Al-Najami I, Drue HC, Steele R, Baatrup G. Dual energy CT - a possible new method to assess regression of rectal cancers after neoadjuvant treatment. J Surg Oncol. 2017 Dec;116(8):984-988.
doi: 10.1002/jso.24761. PubMed PMID: 28703886.
34. Dzierma Y, Minko P, Ziegenhain F, Bell K, Buecker A, Rübe C, Jagoda P. Abdominal imaging dose in radiology and radiotherapy - phantom point dose measurements, effective dose and secondary cancer risk. Phys Med. 2017 Nov;43:49-56. doi: 10.1016/j.ejmp.2017.10.019. PubMed PMID: 29195562.
35. Tsang DS, Merchant TE, Merchant SE, Smith H, Yagil Y, Hua CH. Quantifying potential reduction in contrast dose with monoenergetic images synthesized from dual-layer detector spectral CT. Br J Radiol. 2017 Oct;90(1078):20170290. doi: 10.1259/bjr.20170290. PubMed PMID: 28749176; PubMed Central PMCID: PMC5853359.
36. Bahig H, Campeau MP, Lapointe A, Bedwani S, Roberge D, de Guise J, Blais D, Vu T, Lambert L, Chartrand-Lefebvre C, Lord M, Filion E. Phase 1-2 study of dual-energy computed tomography for assessment of pulmonary function in radiation therapy planning. Int J Radiat Oncol Biol Phys. 2017 Oct 1;99(2):334-343. doi: 10.1016/j.ijrobp.2017.05.051. PubMed PMID: 28871983.
37. Mutic S, Palta JR, Butker EK, Das IJ, Huq MS, Loo LN, Salter BJ, McCollough CH, Van Dyk J; AAPM Radiation Therapy Committee Task Group No. 66. Quality assurance for computed-tomography simulators and the computed-tomography-simulation process: report of the AAPM Radiation Therapy Committee Task Group No. 66. Med Phys. 2003 Oct;30(10):2762-3792. PubMed PMID: 14596315.
192 Clinical case collection
193 Clinical case collection
The future of spectral CT
Philippe Douek, PhD, MD, Department of Radiology, University Lyon 1 Claude Bernard, Lyon, France
Salim Si-Mohamed, MD, BSc, Department of Radiology, University Lyon 1 Claude Bernard, Lyon, France
Monica Sigovan, PhD, Department of Radiology, University Lyon 1 Claude Bernard, Lyon, France
Loic Boussel, PhD, MD, Department of Radiology, University Lyon 1 Claude Bernard, Lyon, France
Clinical case collection 194
Spectral photon-counting CT (SPCCT) is an emerging X-ray imaging technology that extends the scope of available diagnostic imaging tools. The main advantage of photon-counting CT technology is better sampling of the spectral information from the transmitted spectrum in order to benefit from additional physical information being produced during matter interaction, including photoelectric and Compton effects, and the k-edge effect. The k-edge, which is specific for a given element, is the increase in X-ray absorption of the element above the binding energy between its inner electronic shell and the nucleus. Hence, the spectral information contributes to better characterization of tissues and materials of interest, explaining the excitement surrounding this area of X-ray imaging. Other improvements of SPCCT compared with conventional CT, such as higher spatial resolution, lower radiation exposure, and lower noise are also expected to provide benefits for diagnostic imaging.
In this review, we describe multi-energy CT imaging, from dual-energy to photon-counting technology, and our initial experience results using a clinical-scale spectral photon-counting CT prototype system. In addition, possible clinical applications are introduced.
Introduction
Computed tomography (CT) is one of the main imaging modalities in clinical use. The number of CT scans performed worldwide per year is now numbered in the hundreds of millions.1 CT systems can be found in general, -ology specific, and emergency settings nearly everywhere in the world, with applications in the diagnosis of many different conditions and injuries. It provides three-dimensional images of the linear attenuation coefficient distribution of a patient, helping to enhance delineation of organs and tissue. However, there are five major limitations to current CT technologies with current contrast agents:
1) Spatial resolution (around 0.5 mm), even if better than other non-invasive technologies such as MRI or PET, is still a limitation for assessment of small structures such as the lumens of coronary arteries and atherosclerotic plaques.
2) Contrast between different tissues or materials is often insufficient, especially for soft tissue, because CT images are not tissue-type specific. In addition, different tissue types often have similar attenuation values.
3) X-ray attenuation measured by CT and expressed in Hounsfield units (HU) does not allow an absolute quantification of the contrast agent injected (e.g., iodine) since it combines the attenuation of the contrast material to be quantified and the attenuation of the underlying tissue. Furthermore, the attenuation of a material depends on the energy of the X-ray spectrum used.
4) CT scanning is a relatively high radiation-dose procedure. In general, its use is therefore mostly for diagnostic imaging, and is limited for screening of large populations or repeated examinations in the presence of a chronic disease.
Clinical case collection 195
Abstract
5) Iodine-based contrast agents currently in use are not specific and thus do not detect or monitor pathologic processes in patients in a targeted fashion. These limitations impair the diagnostic performance of CT in all medical fields where CT is applied.


A recent, notable development in the field of CT is the analysis of spectral information of X-rays that have passed through the subject. Although this concept has been discussed since CT was invented,2-4 the technology to accurately record this information has only become available over the past decade. Conventional CT scanners integrate all the signals from the detected transmitted X-ray photons into a single attenuation signal without recording any information on their individual energies (Figure 1A). Over the past few years, a variety of systems that are given the term dual-energy CT (DECT) and use energy-integrating detectors (EIDs) have been introduced to the market, demonstrating the benefits of spectral detection by acquiring two energetically distinct data sets (Figure 1B and 1C). Nevertheless, DECT systems do not typically have improved spatial resolution compared to single-energy CT scanners, which are still limited by the scintillators used to convert photons into light that spread the signal spatially, and by the noise resulting from the signal integration process and the associated detection electronics. Furthermore, DECT systems only perform a two-point analysis of the X-ray attenuation, which improves tissue characterization and allows quite precise iodine quantification, but is insufficient to accurately discriminate between iodine and calcium, especially at low radiation dose. In addition, many DECT systems expose the


Clinical case collection 196
Figure 1
Energy integrating detectors A B C D Global information Multiple spectral discriminations Dual spectral discriminations Dual spectral discriminations Dual-source CT energy integrating detectors Dual-source
energy integrating detectors SPCCT photon-counting detectors
Representation of the information provided by the energy-integrating detectors in single-energy CT systems (A), dual-source DECT systems (B) and dual-layer detector based DECT systems (C), compared to SPCCT systems that allow several data sets to be derived from a transmitted spectrum (D).
CT
patient to two energy beams that can result in potentially high radiation exposure, and motion can create issues for aligning the two data sets. Finally, no specific contrast agent has been developed for DECT due to the lack of sensitivity of such systems for specific material imaging.5 Systems based on photon-counting detectors (PCDs) were only recently introduced to the field of CT imaging (Figure 1D). These PCDs are the subject of ongoing research and development in CT systems,5,7-10 and have energy discrimination capabilities based on analysis of the pulse height of each detected photon of the transmitted X-ray spectrum and the count of their number above different energy thresholds or in multiple energy windows.7 The number of energy bins (windows) depends on the design of the detection chain of the PCDs and the energy thresholds can be selected depending on the chosen application. Hence, the transmitted spectrum is divided into several energy bins leading to better sampling of the X-ray spectrum than DECT. This characteristic allows detection of k-edges within certain energy windows and simultaneous distinction between different attenuation profiles, such as those specific to different contrast agents, allowing multicontrast agent imaging.6 In addition, due to their architecture and detection mechanism, PCDs can provide improved spatial resolution and a reduction in radiation dose compared to conventional CT.11 Although all of these advantages have the potential to improve the five intrinsic limitations of the conventional CT imaging described above, SPCCT systems do face a few technical challenges such as handling the high photon flux used in CT (approximately 109 counts/sec/mm2).5
SPCCT systems are being investigated for CT applications as the next step to derive more information from transmitted X-ray photons. In this review, we describe experimental spectral photon-counting technology, and the results of our initial experience using a pre-clinical spectral photon-counting CT (SPCCT). In addition, possible SPCCT clinical applications are introduced.
Multi-energy CT imaging
With single-energy CT imaging systems, tissues and materials can have the same attenuation values (i.e., Hounsfield unit values) despite having different compositions based on their mass density,12 leading to a potential misclassification of pathologies, e.g., in differentiation between hemorrhage and tissue in a kidney cyst, or in separating calcified plaques from the lumen of vessels filled with iodine. Pitfalls such as these have encouraged the development of multi-energy CT imaging techniques, based on acquiring more than one data set from energetically distinct X-ray spectra. The first technology based on a multi-energy approach that has been translated to clinical use is DECT imaging. SPCCT is a next generation, multienergy technology that is being seriously considered for clinical translation, with the first report of SPCCT scans of patients being recently published.13
SPCCT systems
SPCCT can be considered an extension of the detection based dual-energy CT technology12 (Figure 1C), but with completely different detector technology. In this system, each X-ray photon is absorbed in the sensor and produces a small charge cluster (˜2 fC or 10,000 electrons with ˜100 μm spread) that can be collected by pixelated electrodes connected to individual electronic readout channels in an application-specific integrated circuit (ASIC). This technique has many advantages over conventional CT detectors, such as individual photon counting and photon energy discrimination, the absence of electronic noise (due to the lower threshold discriminating between electronic noise and X-ray pulses), improved spatial resolution (because of small charge cluster size and the absence of electronic noise allowing reduced pixel size), size compared to scintillator and photodiode conventional CT detectors, and the absence of dead space between detectors.26
Hence, SPCCT technology allows the discrimination of the energies of individual photons enabling advanced material characterization tasks, which are only partially provided by dual-energy techniques. While the number of independent readings per frame and detector
Clinical case collection 197
pixel in conventional CT or DECT is limited to one or two, respectively, in SPCCT, it is mainly limited by the number of energy thresholds implemented in the ASIC’s hardware per channel (Figure 1C). In practice, the number of reported thresholds used in SPCCT systems range from four to eight.13,27 This provides the ability to better differentiate between different tissue types, even if the number of thresholds needs to be adapted to the intrinsic energy resolution and low-energy tailing behavior of the spectral detectors. Thus, the biggest advantage of SPCCT over DECT is the improved spectral sampling because of intrinsic energy resolution and energy windowing functionality absent in all DECT.7,12 SPCCT is expected to outperform dual-energy techniques because of the following potential benefits:
1) Better spatial resolution, with a higher modulation transfer function in the usual range 0-15 lp/cm and significant strength in the extension to 25 lp/cm because of the smaller pixel size of PCDs. Consequently, this is leading to sharper edges and better delineation of structures in reconstructed images, with the additional value of decreasing the partial volume effects from small objects.
2) Improved contrast-to-noise ratio images due to the reduction of noise at low dose since photon counting does not have a noise floor from electronics and lower statistical noise due to counting versus integration compared to the EIDs.27
3) A reduction in radiation dose and/or contrast media volume, due to the improved contrast-to-noise ratio of contrast-enhanced tissues at a given dose.
In addition, SPCCT is expected to present the following new capabilities:
1) The opportunity to decompose more than two basic materials from multiple energy bins, enabling simultaneous multi-agent imaging.
2) Absolute quantification of specific contrast materials. PCDs allow for an exact physical representation of pixel values, with quantitative information processed by the SPCCT system from the spectrum transmitted through the subject. This allows for measurement of the absolute concentration of targeted or non-targeted contrast media in regionsof-interest.
3) The opportunity to map k-edge materials by using specific reconstructed images.7,28,29 Image reconstruction in SPCCT has been a topic of intense research in the last decade, in particular when it was realized that the discrimination of energies of individual photons not only allows one to selectively image, but to also quantify the concentrations of contrast agents based on elements with high atomic numbers. This approach, called k-edge imaging, is based on the detection of the strong attenuation variation due to photoelectric effect at the specific binding energy of the K-shell electron of an atom (e.g., 50.2 keV for gadolinium, 80.7 keV for gold). k-edge imaging allows for measuring the absolute concentration of the targeted material used.
4) Lastly, similar to DECT systems, SPCCT allows reconstruction of monoenergetic images at desirable energies, leading to an increase in contrast of high atomic number materials at low kilovoltage due to the photoelectric effect.
However, certain limitations that are intrinsic to this technology have to be considered. Photon-counting detectors cannot function accurately with high count rates. Indeed, high count rates (i.e., high photon flux) can result in frequent instances of two photons being absorbed very close together in time, and being incorrectly counted as a single photon with an energy equal to the sum of the energy of both photons. This effect, called electronic pileup, results in reduction of the energy resolution and impacts image quality.5,7,30,31 Because of this, there is an interest in having fast readout electronics and small detector pixels in order to decrease the count rate per pixel. However, reducing the pixel size too much can lead to
Clinical case collection 198
an increase of another limitation of PCDs that is called “charge sharing,” i.e., the electron charge cloud caused by photon absorption in the detector being shared between two nearby pixels, also causing distortions in the spectral response.
Over the past 10 years, the field of SPCCT imaging has been the subject of significant research and development. In 2007, Roessl and Proksa demonstrated the additional value of the spectral information using simulated images of an atherosclerotic coronary vessel filled with a gadolinium-based contrast agent.29 Cormode et al. demonstrated the spectral capabilities of SPCCT by using gold nanoparticles and an iodine contrast agent simultaneously. The gold nanoparticles were targeted to the macrophages of atherosclerotic plaque due to a coating similar to HDL and were well visualized, accumulating in the plaques of a mouse model of atherosclerosis, whereas the iodine contrast agent could be discriminated in the blood and calcified structures also distinguished at the same time.6 In addition, SPCCT has recently been tested in vitro for dual-contrast colonography using iodine-filled lumen and gadolinium-tagged polyps, allowing for a potential differentiation between polyps and tagged fecal material.39
In this context, SPCCT is a promising new tool that could assess lesion characteristics beyond what is currently achievable with conventional CT or MRI, with accurate quantification and the possibility of using targeted contrast agents. Furthermore, the accurate absolute quantification opens the way to functional imaging. Recently, the first patients were scanned with this technology for abdominal imaging without any use of contrast media,13 endorsing the concept that PCDs have a role to play as a next generation of CT systems.
Preliminary results using a spectral photon-counting CT prototype system
Experimental SPCCT prototype
A prototype spectral photon-counting computed tomography system derived from a modified clinical CT with a small field of view (FOV) is being tested in our center (Figure 3A). It allows in vivo acquisitions with a temporal resolution of 0.75 second (Figure 3B). For each single acquisition, we reconstructed multiple image types, i.e., images equivalent to conventional CT images, and the specific material images that we were interested in, such as water, iodine, and k-edge gadolinium images with a material decomposition process based on a maximum-likelihood method.28,29

Clinical case collection 199
Figure 3
(A) Photograph of the SPCCT system. (B) Characteristics of the current system.
Parameter Scanner specifications Base platform iCT Tube voltage 80, 100, 120 kVp Tube current 10-100mA Acquisition modes Axial, Step and Shoot, helical Z-coverage 2 mm FOV 168 mm Minimum rotation time 0.75 sec/rotation A B
Contrast agent imaging
SPCCT is expected to require less contrast material to be administered to patients than the currently used amounts due to a better contrast-to-noise ratio (CNR), particularly at low current dose.7,42 Most importantly, SPCCT provides additional energy information and will allow enhanced contrast of different materials in the body due to material mapping as in current DECT imaging, but with an improved signal-to-noise ratio thanks to the multipleenergy bins and less noise.
Contrast agents reported for SPCCT imaging have been based on heavy elements such as the lanthanides (e.g., gadolinium), gold, ytterbium, bismuth, and tantalum, whose k-edges lie within the aforementioned range.6,7,12,29,36,37,42,43
A first proof of principle measurement using the scanner described has been performed on a phantom made of Delrin (PTFE, d=1.4 mg/ml, diameter = 15 cm) containing multiple test tubes of different dilutions of iodine contrast agent (Iomeron, 400 mg/ml, Bracco) and gadolinium chelate solutions (Multihance, 0.5 mmol/ml, Bracco) (from 2.5 to 8 mg/ml of gadolinium and iodine), and phosphate buffered saline (PBS), as shown in Figure 4. The conventional image doesn’t allow either the determination of a material or the discrimination of the iodine from the gadolinium. On the contrary, the iodine material decomposition image and the gadolinium k-edge image successfully show only the specific materials, with signal intensity in proportion to the agents’ absolute concentrations. There is a suppression of the background in the specific images (e.g., the plastic phantom), improving the signal-to-background ratio. This stems from the fact that the specific information about the presence of contrast is obtained by a measured difference in attenuation above and below the k-edge feature of the element (e.g., 50.3 keV for gadolinium). In addition, the water image not only shows the solutions due to their water content, but also the plastic since it is made of elements close in atomic number to those that make up water.
In conclusion, new contrast agents could be developed to benefit from the advantages and opportunities of the SPCCT associated with k-edge detection.44 We expect that future improvements in SPCCT technology and also contrast agents properties will lead to more sensitive k-edge detection. The field of X-ray contrast agents in general is experiencing a renaissance in recent years, with many publications on new formulations.45,46 Agents capable of sustained blood pool imaging, molecular imaging, and cell tracking have been reported.47-52 These developments provide opportunities for improving the imaging of specific physiopathologic phenomena, such as organ perfusion, tissue permeability, inflammation, edema, and fibrosis, as well as opportunities to facilitate molecular imaging in the future.6,36,53
Potential clinical applications
Stent imaging
Blooming artifacts in standard CT angiography images related to vascular calcifications and metallic stents impair the visualization of the vascular lumen, reducing the possibility of diagnosis of coronary stenosis or in-stent restenosis. Indeed, blooming artifacts can cause under- or over-estimation of the vessel lumen because of the thicker appearance of highly attenuating materials.54 Therefore, there is a need to decrease blooming artifacts, which are due mainly to highly attenuating material artifacts and the partial volume averaging effect. The higher spatial resolution inherent to SPCCT systems can decrease the partial volume effect and therefore might be expected to reduce blooming.
We have tested the capability of SPCCT to improve the visualization of stent architecture compared to a standard CT system (Brilliance 64, Philips, Cleveland, USA: B64). The apparent width of the metallic struts was smaller on SPCCT than on the standard CT for the stent. Thus, SPCCT enables improved visualization of stent metallic mesh due to a significant reduction of blooming artifacts caused by increased spatial resolution compared to conventional CT.
Clinical case collection 200


Clinical case collection 201
Figure 4
Overlay Conventional
Spectral photon-counting images of a phantom containing multiple test tubes of different dilutions of gadolinium chelate and iodine contrast agent solutions (conventional CT, material decomposition water, iodine, k-edge gadolinium images, and an overlay of the material-specific images).
image
Water image
Gadolinium image Iodine image
Figure 5
Comparison of conventional and volume rendering CT images of a stent using the same reconstruction and acquisition parameters on an EID-based CT and the SPCCT (voxel size: 0.1*0.1*0.1 mm).
EID-based CT SPCCT
Specific quantitative imaging
With conventional CT systems, the characterization of tissue relies only on the CT attenuation values without and with injection of contrast media at consecutive time points, such as the arterial, portal, and urinary phase. Despite the fact that multi-phase contrast enhanced imaging helps to characterize pathologies, it is undermined by the lack of specific absolute quantitative evaluation of contrast media biodistribution. Indeed, in various pathological findings, the assessment of enhancement is incorrect due to the surrounding tissue, such as in the case of a hemorrhage renal cyst, which has slight inner enhancement. Taking advantage of the specific characterization and quantification of k-edge elements, we performed a study of the renal biodistribution of a gadolinium contrast agent (Multihance, 0.5 mmol/ml, Bracco) after intravenous injection into a rabbit. We found a higher concentration of gadolinium in the urinary cavity than in the renal cortex during a urinary phase, matching the pharmacokinetics of gadolinium contrast media. This preliminary result supports quantitative characterization of pathologic processes such as ischemic lesion or tumor enhancement.


Multiphase imaging
One of the main advantages of SPCCT is to image multiple contrast agents simultaneously due to specific discrimination, using their k-edge signatures and/or material decomposition. By dividing the spectrum into well-chosen energy-based data sets, it would be possible to detect multiple elements such as gadolinium, gold, bismuth, ytterbium, tantalum, whose k-edges are in the relevant energy range of the X-ray spectrum used, this latter being ˜40-100 keV. Note that while the X-rays used in SPCCT range between ˜25-120 keV, k-edge imaging requires a sufficient number of photons above and below the k-edge, therefore excluding elements whose k-edges are much below 40 or over 100 keV. This will potentially permit a new form of functional imaging, where multiple contrast agents with different pharmacokinetics are used simultaneously in the same biological system. For example, with the use of different contrast agents in the vascular system injected sequentially, within a single scan, we would be able to image multiple uptake phases of a given tissue/organ (Figure 7); or the use of a combination of one non-specific and one specific contrast agent for the simultaneous imaging of the vascular lumen and vascular wall in pathologies such as atherosclerosis;6 or for the simultaneous imaging of the different biodistributions of two contrast agents, such as gold nanoparticles and iodine contrast agents, to probe different biological processes and diseases in a single scan (Figure 8). Note that gold nanoparticles are a good candidate for k-edge imaging, as has been shown previously.6,55,56 In addition, they have the potential to circulate longer than iodinated contrast agents for improved blood pool imaging and possessing high biocompatibility.52,57
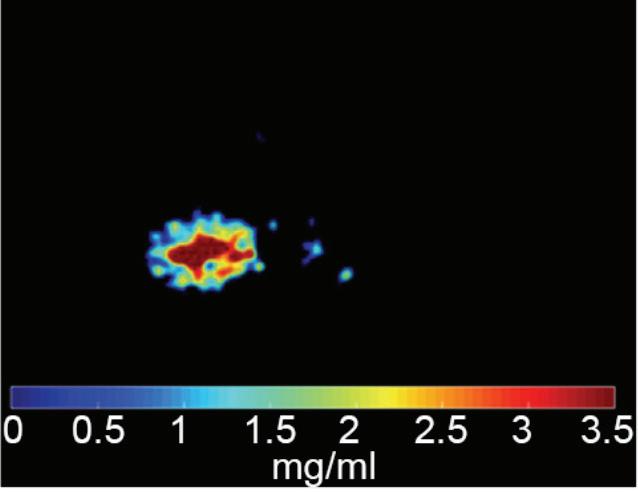
Clinical case collection 202
Figure 6
Spectral photon-counting images (conventional, gadolinium k-edge, and overlay images) 60 seconds after injection of a gadolinium chelate into a rabbit. Gadolinium k-edge images allow the quantification of gadolinium content, with 2.92 mg/ml in the urinary cavity and 1.63 mg/ml in the renal cortex, for example.
Conventional image Gadolinium image Overlay
Using SPCCT with multiple contrast agents would have the benefit of 100% spatial registration for all reconstructed images without any registration technique in contrast to the current multiple phase acquisitions with dual-source CT and kVp-switching, where image registration remains a limiting factor.58 Moreover, successfully imaging multiple uptake phases in a single scan could significantly lower patient radiation exposure, while at the same time, providing important diagnostic capabilities.
Graph depicting one phase imaging per acquisition using a single contrast agent (blue curve – scan at time A to get arterial phase, time B to get portal phase, and time C to get late phase) compared to the potential of SPCCT multiphase imaging per acquisition using dual-contrast discrimination which allows, with delayed injection of a second contrast agent (red curve), simultaneous arterial and portal phase imaging (scan at time B), or portal and late phase imaging (scan at time C).
Spectral photon-counting images (conventional, iodine, gold k-edge) showing wash out of iodine in the ureters (arrow) and blood vessels (head arrow) filled with a blood pool-based gold nanoparticles in favor of dual-phase dual-contrast imaging. Note that the vertebral vessels are better visualized on the gold-specific image than on the conventional image since the CNR increased due to the suppression of the background.


Clinical case collection 203
Figure 7
Arterial phase Portal phase Portal phase Late phase Time Objective value A Arterial phase B C
Figure 8
Conventional image
Iodine image
Gold image
Multi-phase imaging
Conclusion
In conclusion, spectral photon-counting CT imaging represents an emerging field of CT, already existing for clinical use with dual-energy CT systems, and being investigated with the photon-counting CT systems. Our preliminary results show the spectral possibilities offered by the photon-counting technology, demonstrating potential application for cardiovascular diseases, organ perfusion, and molecular imaging. Moreover, these findings point to preclinical and clinical applications using multiple types of contrast agents, and also for multi-phase imaging in a single scan. In addition, it highlights the need to develop SPCCT-specific contrast agents, which could expand the field of CT-based molecular imaging and create new paradigms in diagnostic imaging.
Funding sources:
This project has received funding from the EU’s H2020 research and innovation program under the grant agreement No. 633937.
Clinical case collection 204
References
1. Health equipment - Computed tomography (CT) scanners - OECD Data [Internet]. theOECD. [cited 2017 Feb 22].
Available from: http://data.oecd.org/healtheqt/computed-tomography-ct-scanners.htm
2. Lehmann LA, Alvarez RE, Macovski A, Brody WR, Pelc NJ, Riederer SJ, et al. Generalized image combinations in dual KvP digital radiography. Med Phys. 1981;8(5):659–67.
3. Brody WR, Cassel DM, Sommer FG, Lehmann LA, Macovski A, Alvarez RE, et al. Dual-energy projection radiography: initial clinical experience. AJR Am J Roentgenol. 1981;137(2):201–5.
4. Alvarez RE, Macovski A. Energy-selective reconstructions in X-ray computerized tomography. Phys Med Biol. 1976;21(5):733–44.
5. Taguchi K, Frey EC, Wang X, Iwanczyk JS, Barber WC. An analytical model of the effects of pulse pileup on the energy spectrum recorded by energy resolved photon counting x-ray detectors. Med Phys. 2010;37(8):3957–69.
6. Cormode DP, Roessl E, Thran A, Skajaa T, Gordon RE, Schlomka J-P, et al. Atherosclerotic plaque composition: analysis with multicolor CT and targeted gold nanoparticles. Radiology. 2010;256(3):774–82.
7. Taguchi K, Iwanczyk JS. Vision 20/20: Single photon counting x-ray detectors in medical imaging. Med Phys. 2013;40(10):100901.
8. Schmitzberger FF, Fallenberg EM, Lawaczeck R, Hemmendorff M, Moa E, Danielsson M, et al. Development of low-dose photon-counting contrast-enhanced tomosynthesis with spectral imaging. Radiology. 2011;259(2):558–64.
9. Liu X, Persson M, Bornefalk H, Karlsson S, Xu C, Danielsson M, et al. Spectral response model for a multibin photon-counting spectral computed tomography detector and its applications. J Med Imaging Bellingham Wash. 2015;2(3):033502.
10. Shikhaliev PM. Energy-resolved computed tomography: first experimental results. Phys Med Biol. 2008 Oct 21;53(20):5595–613.
11. McCollough CH, Chen GH, Kalender W, Leng S, Samei E, Taguchi K, et al. Achieving routine submillisievert CT scanning: report from the summit on management of radiation dose in CT. Radiology. 2012;264(2):567–80.
12. McCollough CH, Leng S, Yu L, Fletcher JG. Dual- and multi-energy CT: principles, technical approaches, and clinical applications. Radiology. 2015;276(3):637–53.
13. Pourmorteza A, Symons R, Sandfort V, Mallek M, Fuld MK, Henderson G, et al. Abdominal imaging with contrast-enhanced photon-counting CT: first human experience. Radiology. 2016;279(1):239–45.
14. Petersilka M, Bruder H, Krauss B, Stierstorfer K, Flohr TG. Technical principles of dual source CT. Eur J Radiol. 2008;68(3):362–8.
15. Primak AN, Giraldo JCR, Eusemann CD, Schmidt B, Kantor B, Fletcher JG, et al. Dual-source dual-energy CT with additional tin filtration: Dose and image quality evaluation in phantoms and in vivo. AJR Am J Roentgenol. 2010;195(5):1164–74.
16. Primak AN, Ramirez Giraldo JC, Liu X, Yu L, McCollough CH. Improved dual-energy material discrimination for dual-source CT by means of additional spectral filtration. Med Phys. 2009;36(4):1359–69.
17. Hsieh J. Dual-energy CT with fast-KvP switch. Med Phys. 2009;36(6):2749–2749.
18. Kalender WA, Perman WH, Vetter JR, Klotz E. Evaluation of a prototype dual-energy computed tomographic apparatus. I. Phantom studies. Med Phys. 1986;13(3):334–9.
19. Lehmann LA, Alvarez RE, Macovski A, Brody WR, Pelc NJ, Riederer SJ, et al. Generalized image combinations in dual KvP digital radiography. Med Phys. 1981;8(5):659–67.
20. Altman A, Carmi R. A double-layer detector, dual-energy CT — principles, advantages and applications. Med Phys. 2009;36(6):2750–2750.
Clinical case collection 205
References
21. Fleischmann D, Boas FE. Computed tomography--old ideas and new technology. Eur Radiol. 2011;21(3):510–7.
22. Grajo JR, Patino M, Prochowski A, Sahani DV. Dual energy CT in practice: Basic principles and applications. Applied Radiology. 2016;
23. Dinkel J, Khalilzadeh O, Phan CM, Goenka AH, Yoo AJ, Hirsch JA, et al. Technical limitations of dual-energy CT in neuroradiology: 30-month institutional experience and review of literature. J Neurointerventional Surg. 2015;7(8):596–602.
24. Alvarez R, Seppi E. A comparison of noise and dose in conventional and energy selective computed tomography. IEEE Trans Nucl Sci. 1979;26(2):2853–6.
25. Roessl E, Herrmann C, Kraft E, Proksa R. A comparative study of a dual-energy-like imaging technique based on counting-integrating readout. Med Phys. 2011;38(12):6416–28.
26. Iwanczyk JS, Nygård E, Meirav O, Arenson J, Barber WC, Hartsough NE, et al. Photon counting energy dispersive detector arrays for x-ray imaging. IEEE Trans Nucl Sci. 2009;56(3):535–42.
27. Gutjahr R, Halaweish AF, Yu Z, Leng S, Yu L, Li Z, et al. Human imaging with photon countingbased computed tomography at clinical dose levels: contrast-to-noise ratio and cadaver studies. Invest Radiol. 2016;51(7):421–9.
28. Schlomka JP, Roessl E, Dorscheid R, Dill S, Martens G, Istel T, et al. Experimental feasibility of multi-energy photon-counting K-edge imaging in pre-clinical computed tomography. Phys Med Biol. 2008;53(15):4031–47.
29. Roessl E, Proksa R. K-edge imaging in x-ray computed tomography using multi-bin photon counting detectors. Phys Med Biol. 2007;52(15):4679.
30. Cammin J, Xu J, Barber WC, Iwanczyk JS, Hartsough NE, Taguchi K. A cascaded model of spectral distortions due to spectral response effects and pulse pileup effects in a photon-counting x-ray detector for CT. Med Phys. 2014;41(4):041905.
31. Wang AS, Harrison D, Lobastov V, Tkaczyk JE. Pulse pileup statistics for energy discriminating photon counting x-ray detectors. Med Phys. 2011;38(7):4265–75.
32. Zainon R, Ronaldson JP, Janmale T, Scott NJ, Buckenham TM, Butler APH, et al. Spectral CT of carotid atherosclerotic plaque: comparison with histology. Eur Radiol. 2012;22(12):2581–8.
33. Feuerlein S, Roessl E, Proksa R, Martens G, Klass O, Jeltsch M, et al. Multienergy photoncounting K-edge imaging: potential for improved luminal depiction in vascular imaging. Radiology. 2008;249(3):1010–6.
34. Markus Firsching, Anthony P. Butler, Nicola Scott, Nigel G. Anderson, Thilo Michel, Gisela Anton. Contrast agent recognition in small animal CT using the Medipix2 detector. Nuclear Instruments and Methods in Physics Research. 2009;Volume 607, Issue 1, Pages 179–182.
35. Fredenberg E, Hemmendorff M, Cederström B, Aslund M, Danielsson M. Contrast-enhanced spectral mammography with a photon-counting detector. Med Phys. 2010;37(5):2017–29.
36. Pan D, Roessl E, Schlomka J-P, Caruthers SD, Senpan A, Scott MJ, et al. Computed tomography in color: NanoK-enhanced spectral CT molecular imaging. Angew Chem Int Ed Engl. 2010;49(50):9635–9.
37. Pan D, Schirra CO, Senpan A, Schmieder AH, Stacy AJ, Roessl E, et al. An early investigation of ytterbium nanocolloids for selective and quantitative “multicolor” spectral CT imaging. ACS Nano. 2012;6(4):3364–70.
38. Schirra CO, Senpan A, Roessl E, Thran A, Stacy AJ, Wu L, et al. Second generation gold nanobeacons for robust k-edge imaging with multi-energy ct. J Mater Chem. 2012;22(43):23071–7.
39. Muenzel D, Bar-Ness D, Roessl E, Blevis I, Bartels M, Fingerle AA, et al. Spectral photon-counting ct: initial experience with dual-contrast agent k-edge colonography. Radiology. 2016;160890.
40. Schlomka JP, Roessl E, Dorscheid R, Dill S, Martens G, Istel T, et al. Experimental feasibility of multi-energy photon-counting K-edge imaging in pre-clinical computed tomography. Phys Med Biol. 2008;53(15):4031–47.
206 Clinical case collection
41. Roessl E, Proksa R. K-edge imaging in x-ray computed tomography using multi-bin photon counting detectors. Phys Med Biol. 2007;52(15):4679.
42. Schirra CO, Brendel B, Anastasio MA, Roessl E. Spectral CT: a technology primer for contrast agent development. Contrast Media Mol Imaging. 2014;9(1):62–70.
43. Caschera L, Lazzara A, Piergallini L, Ricci D, Tuscano B, Vanzulli A. Contrast agents in diagnostic imaging: Present and future. Pharmacol Res. 2016;110:65–75.
44. Cormode DP, Naha PC, Fayad ZA. Nanoparticle contrast agents for computed tomography: a focus on micelles. Contrast Media Mol Imaging. 2014;9(1):37–52.
45. Speck U. Contrast agents: X-ray contrast agents and molecular imaging—a contradiction? Handb Exp Pharmacol. 2008;(185 Pt 1):167–75.
46. De La Vega JC, Häfeli UO. Utilization of nanoparticles as X-ray contrast agents for diagnostic imaging applications. Contrast Media Mol Imaging. 2015;10(2):81–95.
47. Naha PC, Zaki AA, Hecht E, Chorny M, Chhour P, Blankemeyer E, et al. Dextran coated bismuth-iron oxide nanohybrid contrast agents for computed tomography and magnetic resonance imaging. J Mater Chem B Mater Biol Med. 2014;2(46):8239–48.
48. Eck W, Nicholson AI, Zentgraf H, Semmler W, Bartling S. Anti-CD4-targeted gold nanoparticles induce specific contrast enhancement of peripheral lymph nodes in X-ray computed tomography of live mice. Nano Lett. 2010;10(7):2318–22.
49. Meir R, Shamalov K, Betzer O, Motiei M, Horovitz-Fried M, Yehuda R, et al. Nanomedicine for cancer immunotherapy: tracking cancer-specific t-cells in vivo with gold nanoparticles and ct imaging. ACS Nano. 2015;9(6):6363–72.
50. Cole LE, Vargo-Gogola T, Roeder RK. Bisphosphonate-functionalized gold nanoparticles for contrast-enhanced X-ray detection of breast microcalcifications. Biomaterials. 2014;35(7):2312–21.
51. Chhour P, Naha PC, O’Neill SM, Litt HI, Reilly MP, Ferrari VA, et al. Labeling monocytes with gold nanoparticles to track their recruitment in atherosclerosis with computed tomography. Biomaterials. 2016;87:93–103.
52. Cai Q-Y, Kim SH, Choi KS, Kim SY, Byun SJ, Kim KW, et al. Colloidal gold nanoparticles as a blood-pool contrast agent for X-ray computed tomography in mice. Invest Radiol. 2007;42(12):797–806.
53. Allijn IE, Leong W, Tang J, Gianella A, Mieszawska AJ, Fay F, et al. Gold nanocrystal labeling allows low-density lipoprotein imaging from the subcellular to macroscopic level. ACS Nano. 2013;7(11):9761–70.
54. Mahnken AH. CT Imaging of Coronary Stents: Past, Present, and Future. ISRN Cardiol [Internet]. 2012 [cited 2017 Jan 9];2012. Available from: http://www.ncbi.nlm.nih.gov/pmc/articles/PMC3446716/
55. Galper MW, Saung MT, Fuster V, Roessl E, Thran A, Proksa R, et al. Effect of computed tomography scanning parameters on gold nanoparticle and iodine contrast. Invest Radiol. 2012;47(8):475–81.
56. Naha PC, Lau KC, Hsu JC, Hajfathalian M, Mian S, Chhour P, et al. Gold silver alloy nanoparticles (GSAN): an imaging probe for breast cancer screening with dual-energy mammography or computed tomography. Nanoscale. 2016;8(28):13740–54.
57. Naha PC, Chhour P, Cormode DP. Systematic in vitro toxicological screening of gold nanoparticles designed for nanomedicine applications. Toxicol Vitro Int J Publ Assoc BIBRA. 2015;29(7):1445–53.
58. Grosjean R, Sauer B, Guerra RM, Daudon M, Blum A, Felblinger J, et al. Characterization of human renal stones with mdct: advantage of dual energy and limitations due to respiratory motion. Am J Roentgenol. 2008;190(3):720–8.
207 Clinical case collection


