20 minute read
Technical aspects of spectral CT 6 Clinical case collection


Alain Vlassenbroek, PhD, CT Clinical Science, Philips Health Systems
Spectral computed tomography (CT) enables improvement of material separation and tissue characterization when compared to conventional CT. Recent developments in scanner and detector technology have revived the interest in spectral CT technology.
Conventional CT scanners use a detector technology with the crucial disadvantage that the detected X-ray photons are integrated, ignoring the abundant spectral information of the polychromatic X-ray spectrum passing through the imaged object. Research work on the separation of the X-ray beam into multiple energy windows shows great promise to further enhance the diagnostic capabilities of CT scanning.1 The most advanced form of spectral CT is enabled by photon counting detectors; highly efficient “low dose” detectors which count each individual incident X-ray and measure the energy of each photon. Photon counting uses narrow selectable sub-ranges (or bins) of the spectrum which can be used, for example, to detect and classify spectral “k-edge” patterns of clinical relevant materials at very low concentrations.2 Early results are extremely promising.3 However, this detector technology is not completely mature yet, is very expensive, and there is limited availability of validated contrast agents for k-edge imaging.
Current clinical spectral CT scanners enable the discrimination between different materials based on the differential X-ray attenuation properties in two “energy bands” of the spectrum instead of averaging the entire polychromatic X-ray beam as with conventional CT. In other words, the spectral dependencies of the net X-ray attenuation can be imaged and analyzed as a material characteristic and can be used to discriminate tissues beyond the Hounsfield unit paradigm. The “dual-energy” information can be obtained using various acquisition methods, each having its own advantages and disadvantages:
• Single X-ray source, dual kVp spin
• Single X-ray source, dual kVp switch
• Dual X-ray source
• Single X-ray source, dual-layer detector 4,5
The following chapter is dedicated to the innovative technological solution of the dual-layer detector technology that is the heart of the IQon Spectral CT, a spectral CT that only Philips offers.
The dual-layer detector
In a single source, dual-layer detector scanner configuration, one X-ray tube is used to expose a detector consisting of two layers of scintillators. The X-ray tube generates a polychromatic beam with a wide energy spectrum, typically from 20 keV up to the maximal photon energy, which is bounded by the selected tube voltage. The typical average energy, corresponding to the weighted average of the spectrum, of a 120 kVp X-ray spectrum depends on the size of the scanned object; in the case of a body scan, it is around 70 keV. The two layers of scintillators are directly on top of one another. The upper layer is made of a low density scintillator (yttrium-based) which is almost transparent to high X-ray energies, while the lower layer is made of a traditional GOS (gadolinium oxysulfide) scintillator which can absorb up to 99% of those high energies.
In practice, a single CT scan is performed (e.g., 120 kVp or 140 kVp), and the first layer (upper) encountered by the X-ray photons absorbs most of the low-energy photons, while the bottom detector layer absorbs the remaining higher energy photons (Figure 1). In contrast to other approaches of dual-energy CT, there is no need to redundantly expose materials with both low and high kVp. Furthermore, since the spectral energy separation is intrinsic to the detection system, rather than sequentially generated at the X-ray source, this approach eliminates the time lag of sequential techniques, making it ideal for imaging moving organs, as in cardiac CT. In other words, the dual-layer technique is fully registered both spatially and temporally, and it has no spatial shift or dead time such as in dual kVp or dual tube techniques. The low- and high-energy projection data are perfectly aligned, enabling projection-based spectral decomposition, and providing the opportunity to properly account for beam hardening effects without the need for spatial or temporal interpolations.6,7
The low- and high-energy measured attenuations can also be combined to provide the attenuation over the entire X-ray spectrum and used to reconstruct a “true” conventional CT image (Figure 1), without the need to compensate for warping and shifting due to the time lags. This is different from the other currently available dual-energy technologies where low- and high-kVp images are obtained and blended to obtain a surrogate “conventional” image data set. The use of a single source also obviates the cross-scatter limitation of dual-source techniques 8 and enables full 50 cm field of view (FOV) imaging.
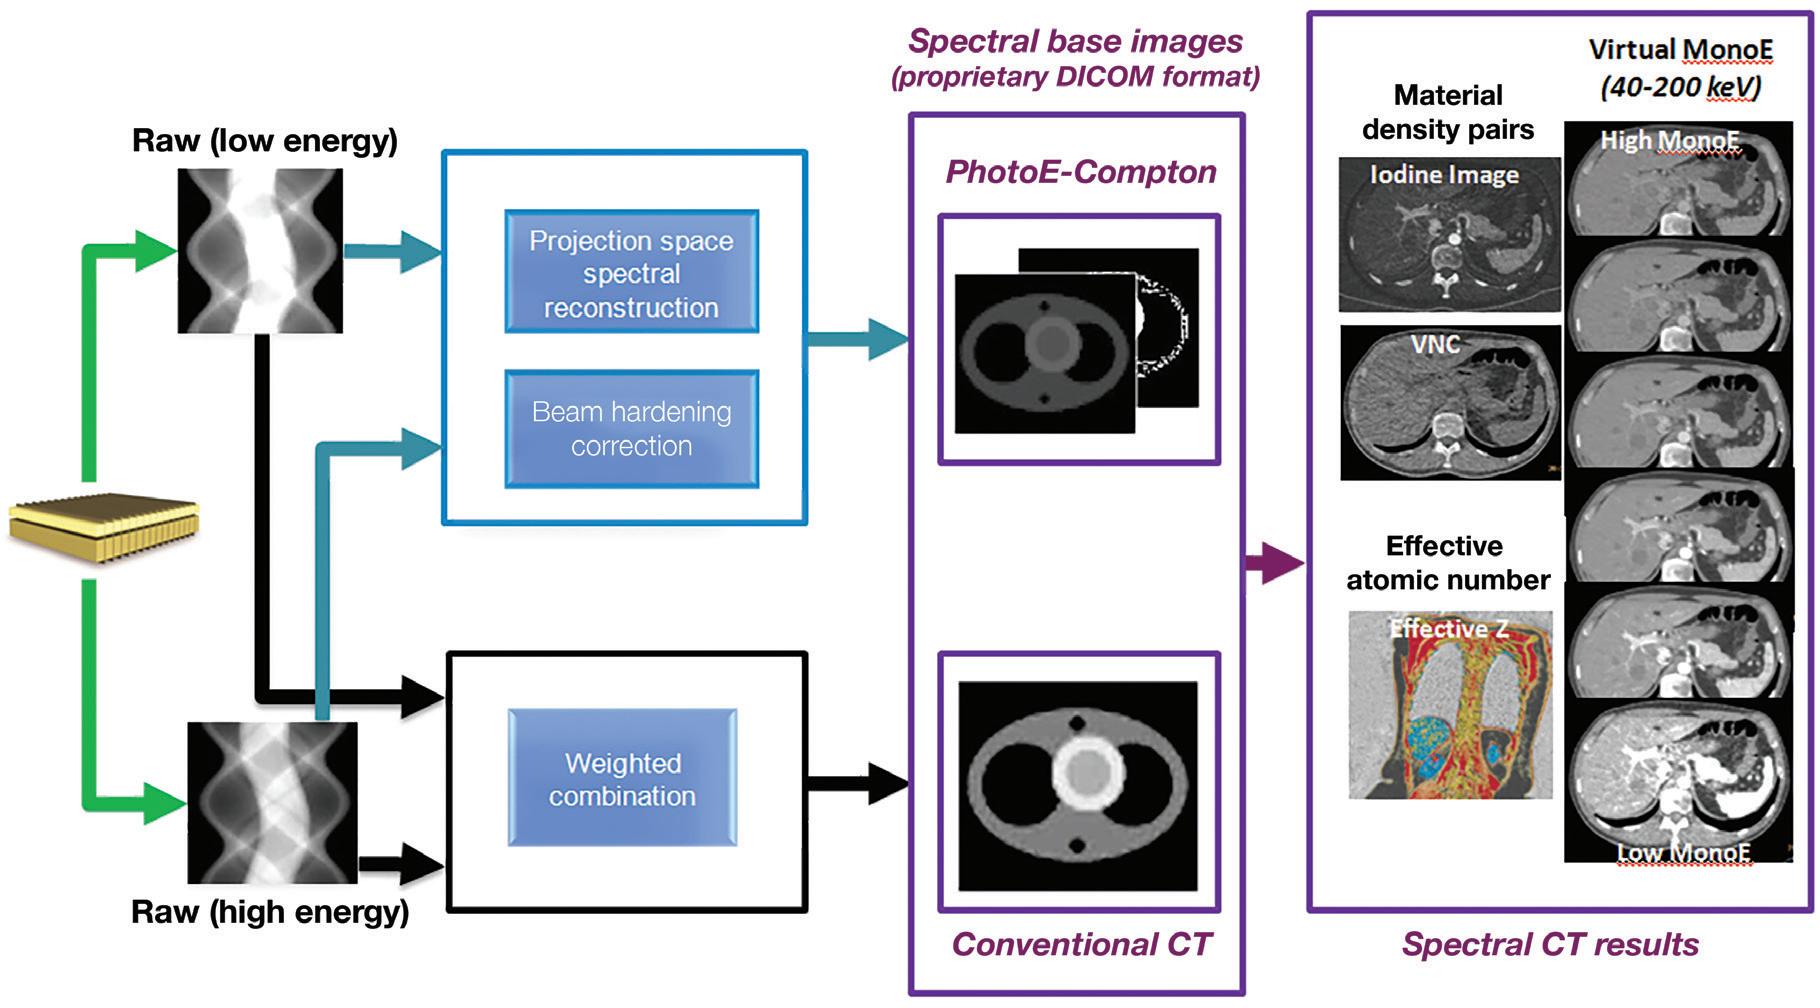
A schematic illustration of the dual-layer detection system. The upper layer is made of a low density scintillator (yttrium-based) which is almost transparent to high X-ray energies, while the lower layer is made of a traditional GOS (gadolinium oxysulfide) scintillator which can absorb up to 99% of those high energies. The acquisition enables the decomposition of the measured attenuation into the Compton-Scatter-like and photoelectric-like absorption basis. The low- and high-energy measured signals are also combined to provide the signal resulting from the entire X-ray spectrum which is used to reconstruct a “true” conventional CT image. From the spectral base images (SBI), all spectral results can be regenerated at the IntelliSpace Portal (ISP) console. An SBI follows the DICOM standard, and can be stored on the PACS of the hospital and retrieved at the ISP (Philips IntelliSpace Portal) console in the case a spectral retrospective analysis is needed.
In summary, with the dual-layer detector technique, spectral CT information can be retrieved from any conventional CT scan, without compromises to image quality or needed modifications to scan protocol parameters (rotation time, FOV, dose modulation, etc.), provided the scan is performed at 120 kVp or 140 kVp.9 Spectral analyses from scans at lower tube voltages still pose technological challenges because of the reduced high energy content of the X-ray beam. The reconstruction of selected spectral CT results from a 120 kVp or 140 kVp scan can be decided prospectively, but can also be obtained retrospectively for every scan. This additional information can be used to fine-tune the diagnosis in the case, for example, of an incidental finding. A missed injection is another typical scenario which cannot be known prospectively, but where diagnosis could be salvaged thanks to the available retrospective spectral reconstruction from the original scan without the need to re-inject and re-scan the patient (Figure 2).
The Alvarez-Macovski model
Attenuation of X-rays in matter at the typical energies used in CT consists of two main components:
• Incoherent scatter: the Compton scatter mechanism
• Photoelectric absorption
The dependency of Compton scatter on energy is reasonably well described by the Klein-Nishina function fc(E). The dependency of photoelectric absorption on energy goes roughly as fp(E)=1/E.3.2
The first investigations of dual-energy methods for CT were made by Alvarez and Macovski in 1976.10 Their main assumption in dual-energy CT (DECT) is that the linear attenuation coefficient µ(E) of all relevant materials can be modeled by the sum of these two mechanisms (Compton-photoelectric), where each component has the universal energy dependency described above (see Equation 1). With this model, the difference between materials is only in the relative weight of each of the above processes. In light materials (low atomic number Z), Compton scatter dominates, while in heavy materials (high Z), photoelectric absorption dominates.
Equation 1 µ(x,y,z,E)= µp(x,y,z,E) + µc(x,y,z,E)= αp(x,y,z)fp(E) + αc(x,y,z)fc(E) αp =ρZ3.8 and αc= ρZ are the material coefficients, where ρ is the material mass density and Z its effective atomic number. Note that these material coefficients only depend on the material and not on the energy. The energy dependence is completely described by the universal energy functions fp(E) and fc(E) which do not depend on the material by assumption. Equation 1 describes the total attenuation as the sum of the two mechanisms. One simple way to solve Equation 1 and to determine the unknown pair (αp, αc) is to perform two independent measurements of µ(E) at two different energies Elow and Ehigh and to solve the system composed by the two equations (Equation 2) with the two unknown values αp and αc
Equation 2 µ(Elow)= αpfp(Elow) + αcfc(Elow) µ(EHigh)= αpfp(Ehigh) + αcfc(Ehigh)
A referred
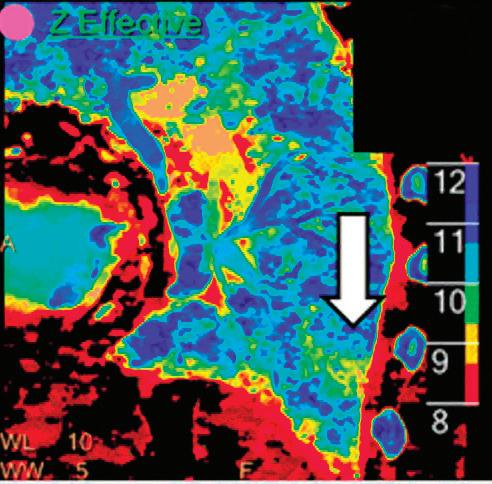
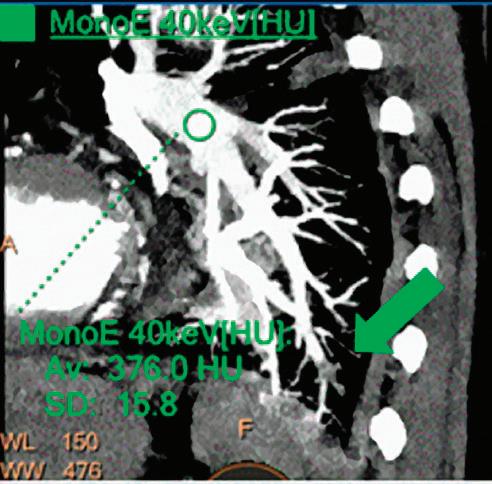
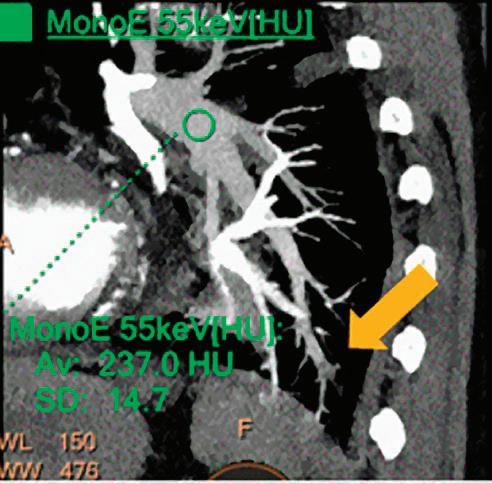
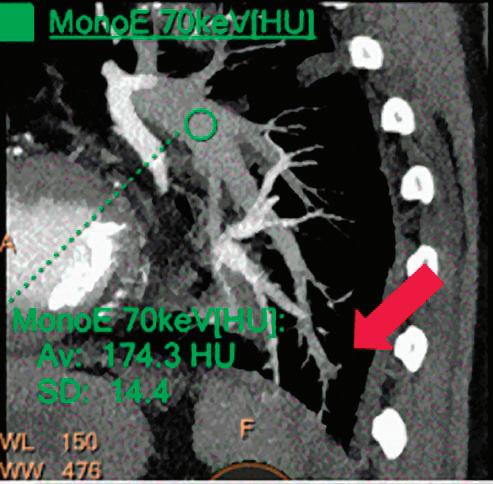
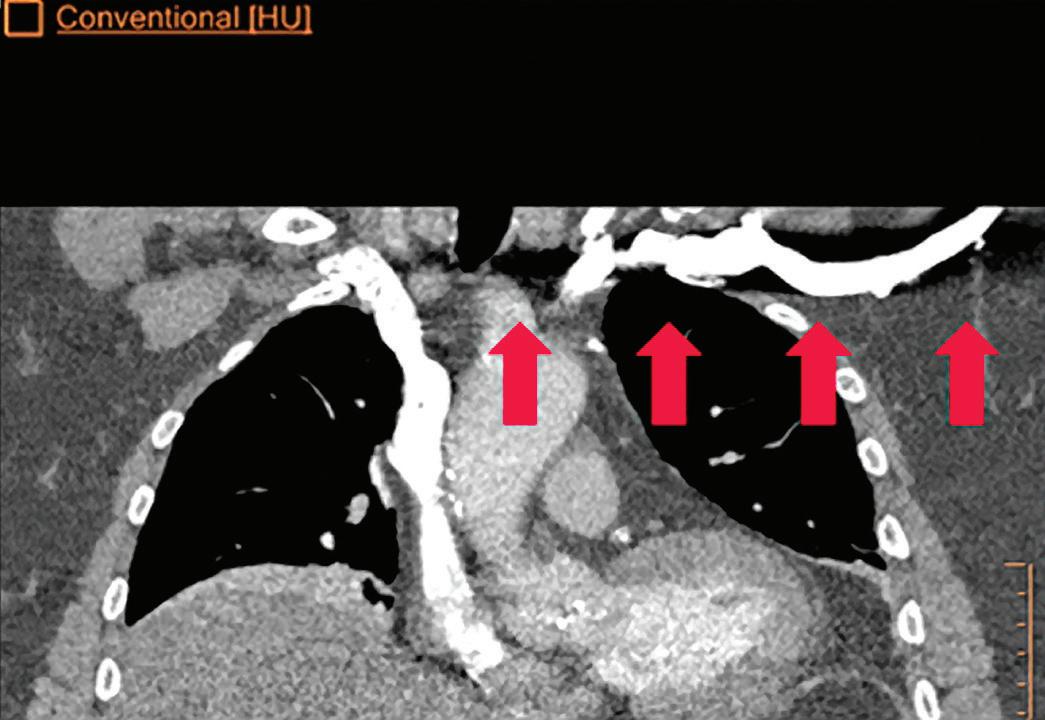
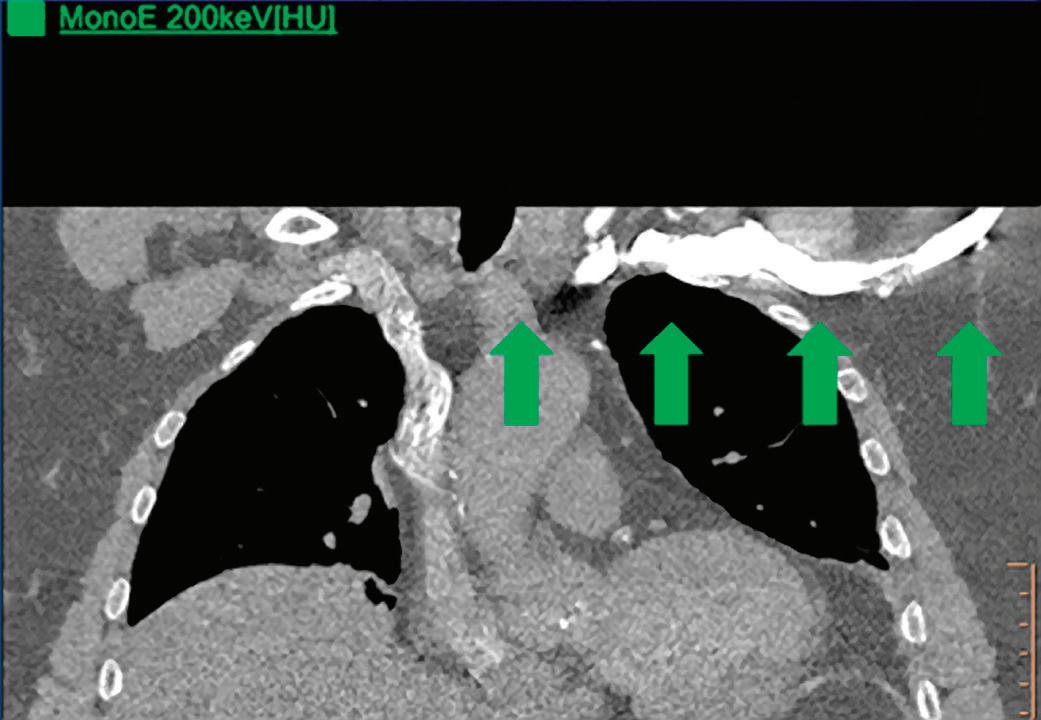
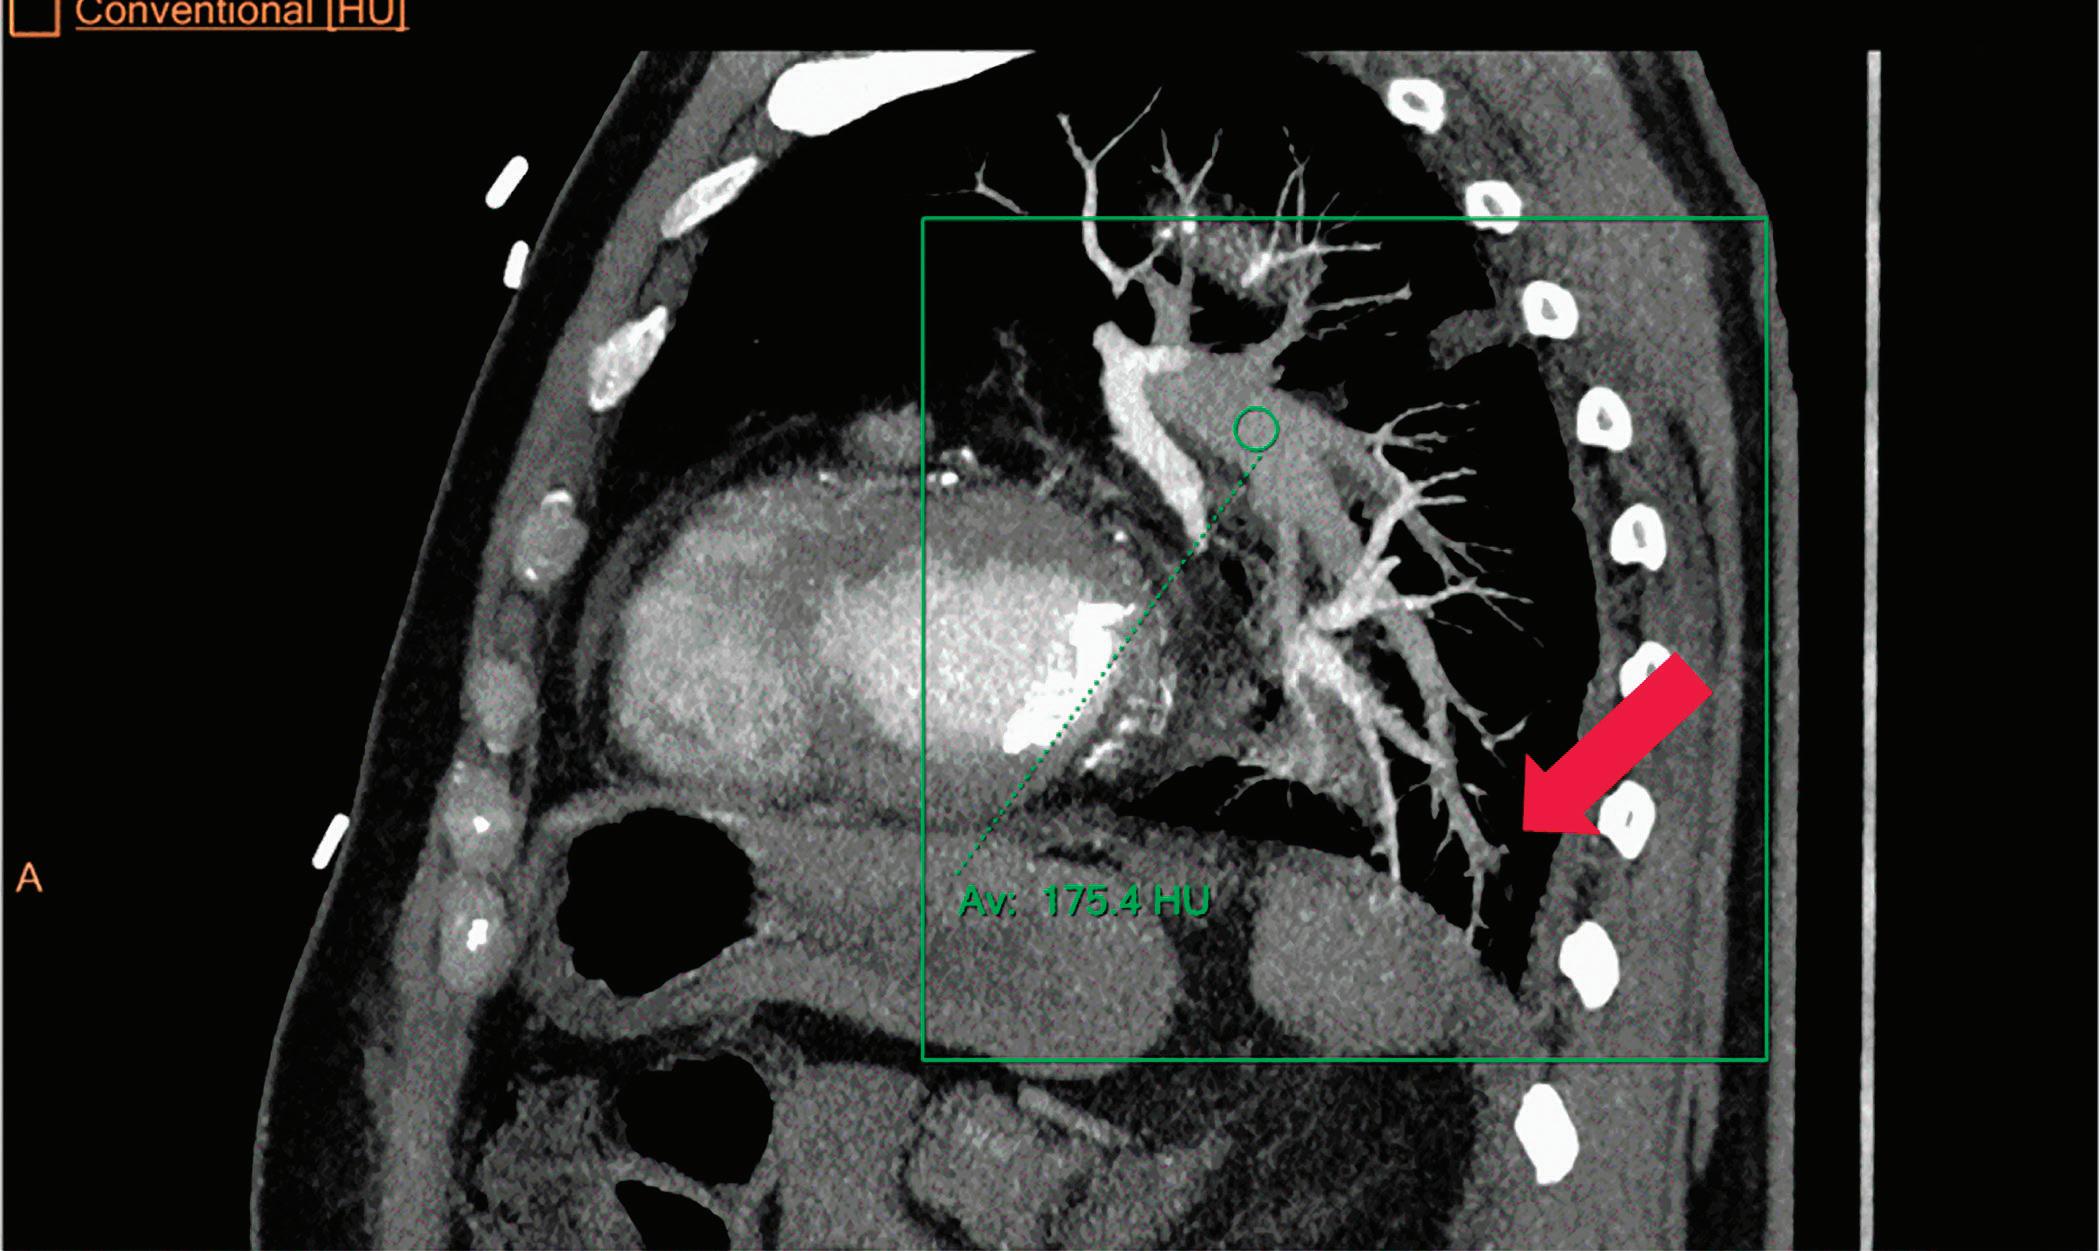
CT breath-hold results in a poor enhancement of the pulmonary arteries on the displays from left to right: monoenergetic 70 keV, monoenergetic 55 keV, monoenergetic 40 keV, and Z effective map showing a perfusion deficit of the lung parenchyma (white arrow). When decreasing the energy, the iodine attenuation is progressively boosted and reveals the presence of a thrombus (colored arrows) in a sub-segmental pulmonary artery corresponding to the territory of the perfusion deficit. (c) Monoenergetic 200 keV reduces beam hardening from dense contrast medium compared to conventional CT images.
CT images.
In other words, Alvarez and Macovski demonstrated that, using a conventional X-ray source having a broad energy spectrum, a dual-energy acquisition enables the decomposition of the measured attenuation into the two-components model, Compton scatter αc and photoelectric absorption αp.
As an alternative, the X-ray attenuation coefficients of any material can be expressed as a linear combination of the attenuation of two base materials, where both materials differ in their photoelectric and Compton characteristics. This process is named ‘material decomposition,’ and it is obtained through a non-linear transformation of the low and high attenuation data.
As Alvarez and Macovski wrote, the optimal material base must be selected phenomenologically taking into account the energy range and the materials the X-ray beam is expected to transverse. If bone and water are chosen as the base materials for the decomposition, the information from the low and high attenuation data can be used to calculate the bone coefficients of the X-ray attenuation. These coefficients can then be used to create a bone image which allows the assessment of bony structures and calcifications. Alternatively, the water coefficients can be calculated to generate a soft tissue image where the bony structures are suppressed and which improves the visualization of structures previously hidden by bony anatomy. Any material pairs can be created from any other pairs as a linear transformation post-decomposition: a change of base. Other pairs of base materials with clinical relevance are iodine and calcium, iodine and water, or calcium and water. In cardiovascular imaging, the iodine images from an iodine-calcium pair can be of primary importance because they can help to better assess the iodinated lumen of the arteries which could be otherwise hidden by the presence of large calcified plaques. The water images from an iodine-water pair are ones in which all of the iodine is removed. These virtual non-contrast images (VNC) synthesize a pre-contrast scan.11,12 The water images from a calcium-water pair are ones in which all of the calcium is removed. These calcium suppressed images (CaSupp) can be used to improve the visualization of the bone marrow edema which is partially hidden by the presence of the bony structures in the conventional CT images.13
We must emphasize that the universal energy assumption is not 100% accurate and is only approximately met, especially at low energies where the photoelectric effect exhibits nonuniversal behavior. Moreover, Compton scattering and photoelectric absorption are not the only interaction mechanisms between X-rays and matter, and a third component: coherent scatter (Rayleigh scatter), although relatively small, cannot be completely neglected. This small coherent scatter influences different materials at different energy regimes. While the contribution of coherent scattering can be included in one of the basis functions, deviations from modeled universal energy dependencies impose generic limitations on all spectral CT systems that are based on dual-energy, regardless the technology used to acquire the dual-energy information. The impact is mainly at the low energy regime where spectral CT results somewhat deviate from theoretically expected values, especially for calcium and iodine.
Conventional CT images
Also sometimes known as “combined” images, in conventional CT images the low- and high-energy measured signals are combined to provide the conventional CT signal over the entire X-ray spectrum, and used to reconstruct a “true” conventional CT image. The generation of true conventional CT images is very useful from the workflow perspective. When a nonexperienced user starts to work with the IQon Spectral CT scanner, the application training usually starts with conventional CT scanning, and the additional spectral information is only provided step-by-step and very progressively. This way, radiologists can make their diagnosis as they’re already accustomed to, while appreciating the added value of the spectral information to fine-tune their diagnosis. Recent publications9,14 demonstrated that the introduction of dual-layer detector neither compromises image quality of conventional images, nor increases radiation dose to the patients.
Spectral results
IQon Spectral CT users may plan the reconstruction of any spectral result prospectively in the exam card describing the acquisition/reconstruction parameters of a particular scan protocol. Spectral base images (SBI) can also be reconstructed, which contain the conventional CT together with the basis images, Compton-like (αc(x,y,z)) and photoelectric-like (αp(x,y,z)) images (see Figure 1). From an SBI, all spectral results can be regenerated at the IntelliSpace Portal (ISP) or scanner console. An SBI follows the DICOM standard, and can be stored on the PACS of the hospital and retrieved at the ISP (Philips IntelliSpace Portal) console in the case a spectral retrospective analysis is needed. As an alternative, a light “Spectral Viewer” version, the Magic Glass on PACS (MGoP), can also be installed on the PACS viewing stations. This light spectral viewer enables the regeneration of all the required spectral results in the PACS viewing environment. IQon Spectral CT systems provide a variety of images or spectral results as listed below:
Monoenergetic
Once the pair (αp, αc) is calculated for every voxel, and since fp(E) and fc(E) are known functions of energy, one may synthesize monochromatic images at different energies. These images can be used for routine diagnosis similar to conventional images. With a single scan at 120 kVp (or 140 kVp for obese patients), a dual-layer spectral CT acquisition allows the reconstruction of virtual monochromatic images from 40 keV up to 200 keV, in increments of 1 keV. The minimum of 40 keV was chosen in order to stay above the k-edge of the most common materials including iodine (iodine k-edge = 33 keV). If the scan is performed at 120 kVp, the conventional CT images of a typical-size patient will display an attenuation corresponding to the average of the X-ray spectrum (˜70 keV in a body scan) but with beam hardening artifacts from dense structures (like bones) which are due to the polychromatic nature of the X-ray beam. Since the photoelectric effect is dominant at lower keV, and is relatively high for high Z materials, low keV imaging (below 70 keV for body) can be used to enhance the absorption of high Z material such as iodine (Z=53), compared to the conventional CT images.15,16 This can be of particular interest to enhance the iodine uptake for patients with renal dysfunction, where the total injected volume of iodinated contrast medium is very limited. This attenuation boost can also be very useful in the case of a missed injection (Figure 2a and b). Compton scattering on the other hand is dominant at higher keVs and does not exhibit a strong relationship with Z. High keV imaging will then be of particular interest to minimize the absorption of high Z materials and minimize all types of associated artifacts (metal beam hardening from metal implants, beam hardening from dense contrast medium, blooming of stents or calcium, etc.) (Figure 2c).17,18,19
Virtual monoenergetic images obtained from the IQon Spectral CT scanner have low noise across the entire spectrum of energies,20 and this noise is lower than in conventional images due to the spectral reconstruction processing that includes noise suppression algorithms that make use of the additional spectral information. This provides significant SNR and CNR improvements compared to conventional polyenergetic images. The low noise of monoenergetic images at various energy levels makes them usable at all energy levels, particularly at low energies for enhancing vascular contrast or improving lesion conspicuity and at higher energies for decreasing artifacts.
Monoenergetic (Equivalent to conventional CT)
Virtual monoenergetic images at predefined energies that provide equivalent CT number as conventional images scanned at 120 kVp. The equivalent monoenergetic energy depends on the typical size of the scan: 70 keV for body scans, 66 keV for head scans, 64 keV for infant scans.
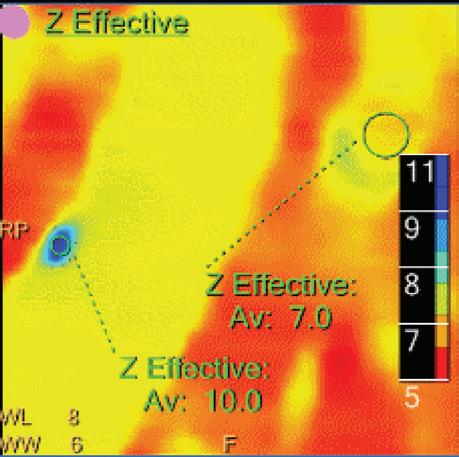
Z Effective (Zeff)
Effective atomic number. Each voxel is set to a value in the range 5 to 30 representing the effective atomic number of that voxel. Z effective of air is set to zero. For reference, Z effective of water is 7.4, Z effective of cortical bone is 13.2, and Z effective of fat is 5.9. Z effective maps are very sensitive to materials characteristics (Figure 3) and can also be used to display perfusion maps and to identify very subtle perfusion deficits (Figure 2b). The accuracy measured on a Gammex phantom with iodine, calcium, and soft tissue inserts show that the majority of Z effective values are within 0.2 Z effective units and are consistent between 120 and 140 kVp scans.21
Iodine no Water [mg/ml*]
The iodine images are obtained from an iodine-water material decomposition. The image is scaled to iodine quantification in units of mg/ml. The asterisk in the mg/ml* unit indicates that the iodine quantification is only meaningful in regions with iodine uptake.
Iodine Density [mg/ml]
Also referred to as iodine map. This is a quantitative iodine image where voxel values are proportional and scaled to the iodine true concentration in units of mg/ml. Voxels without iodine content have zero iodine and hence are black (Figure 3).
Note: The algorithm includes a low bone removal threshold. Voxels with Ca content below the threshold are classified as containing iodine. The accuracy measured on a Gammex phantom with various concentrations of iodine (up to 20 mg/ml) show an iodine quantification to within 0.3 mg/ml, for both the Iodine no Water and iodine density measurements.21 In clinical conditions, an iodine concentration measurement of 0.5 mg/ml should be considered as the lower threshold for iodine uptake.
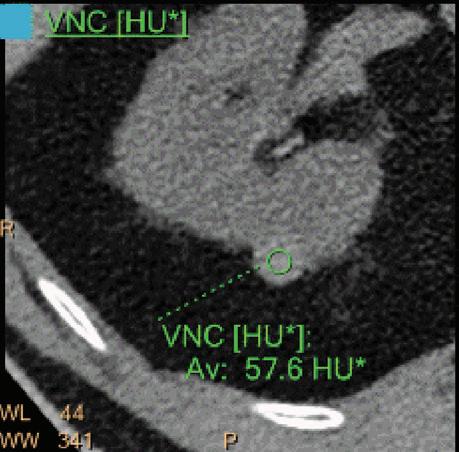
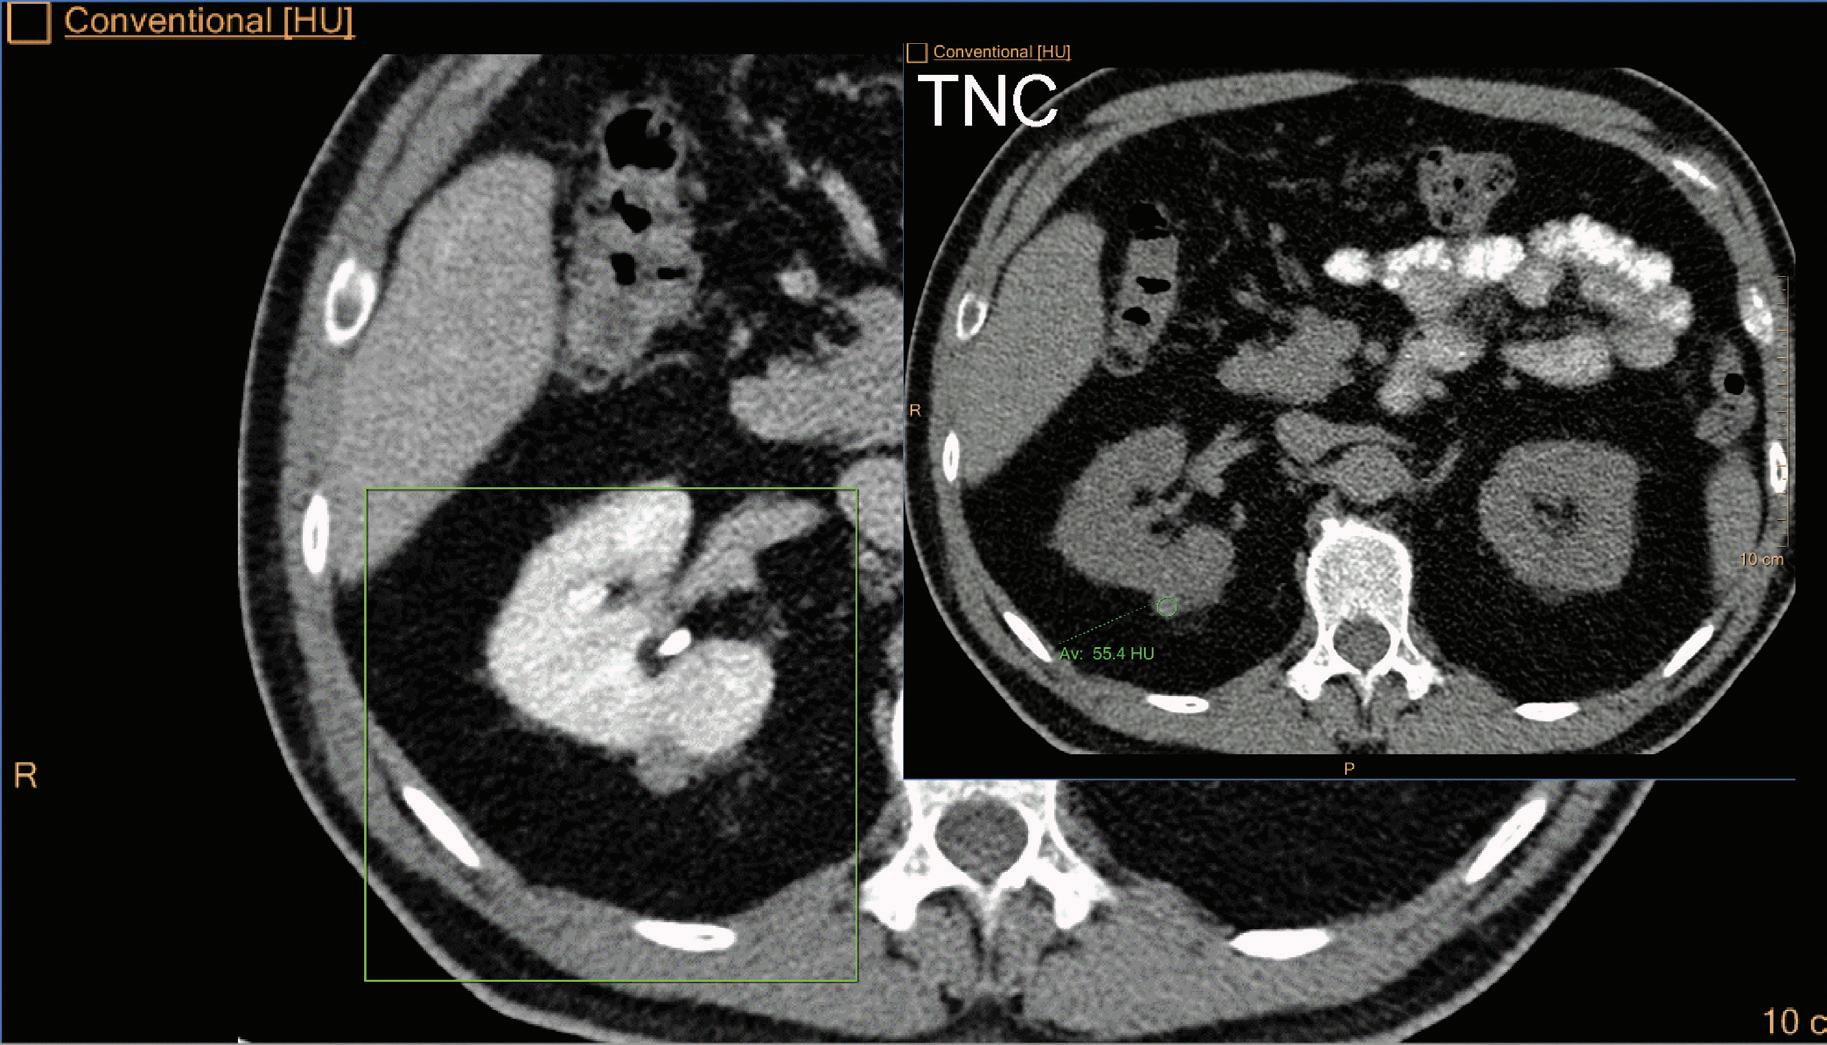
Virtual No Contrast (VNC) [HU]
This result imitates a monoenergetic 70 keV CT scan without contrast injection, and is derived from a CT scan with contrast enhancement. The quantified iodine content is translated to an HU number and subtracted from the contrast enhanced 70 keV images.
Note: Because the iodine quantification is based on the two-component model (water-iodine), any deviation from water dispersion is interpreted as nonzero iodine component. In particular, bone (calcium) is interpreted as a mixture of water-like and iodine-like material. The VNC algorithm does not attempt to separate bone and iodine. Therefore, the CT number [HU] of bone in VNC images is roughly half of its value in the original 70 keV image. A study comparing VNC and true non-contrast (TNC) images showed that the attenuation values from VNC in most abdominal tissues are within 10 HU of those obtained from unenhanced images, with the notable exception of subcutaneous fat.11,12 These results demonstrate the potential of VNC images to serve as a surrogate for unenhanced images in some clinical settings (Figure 4).
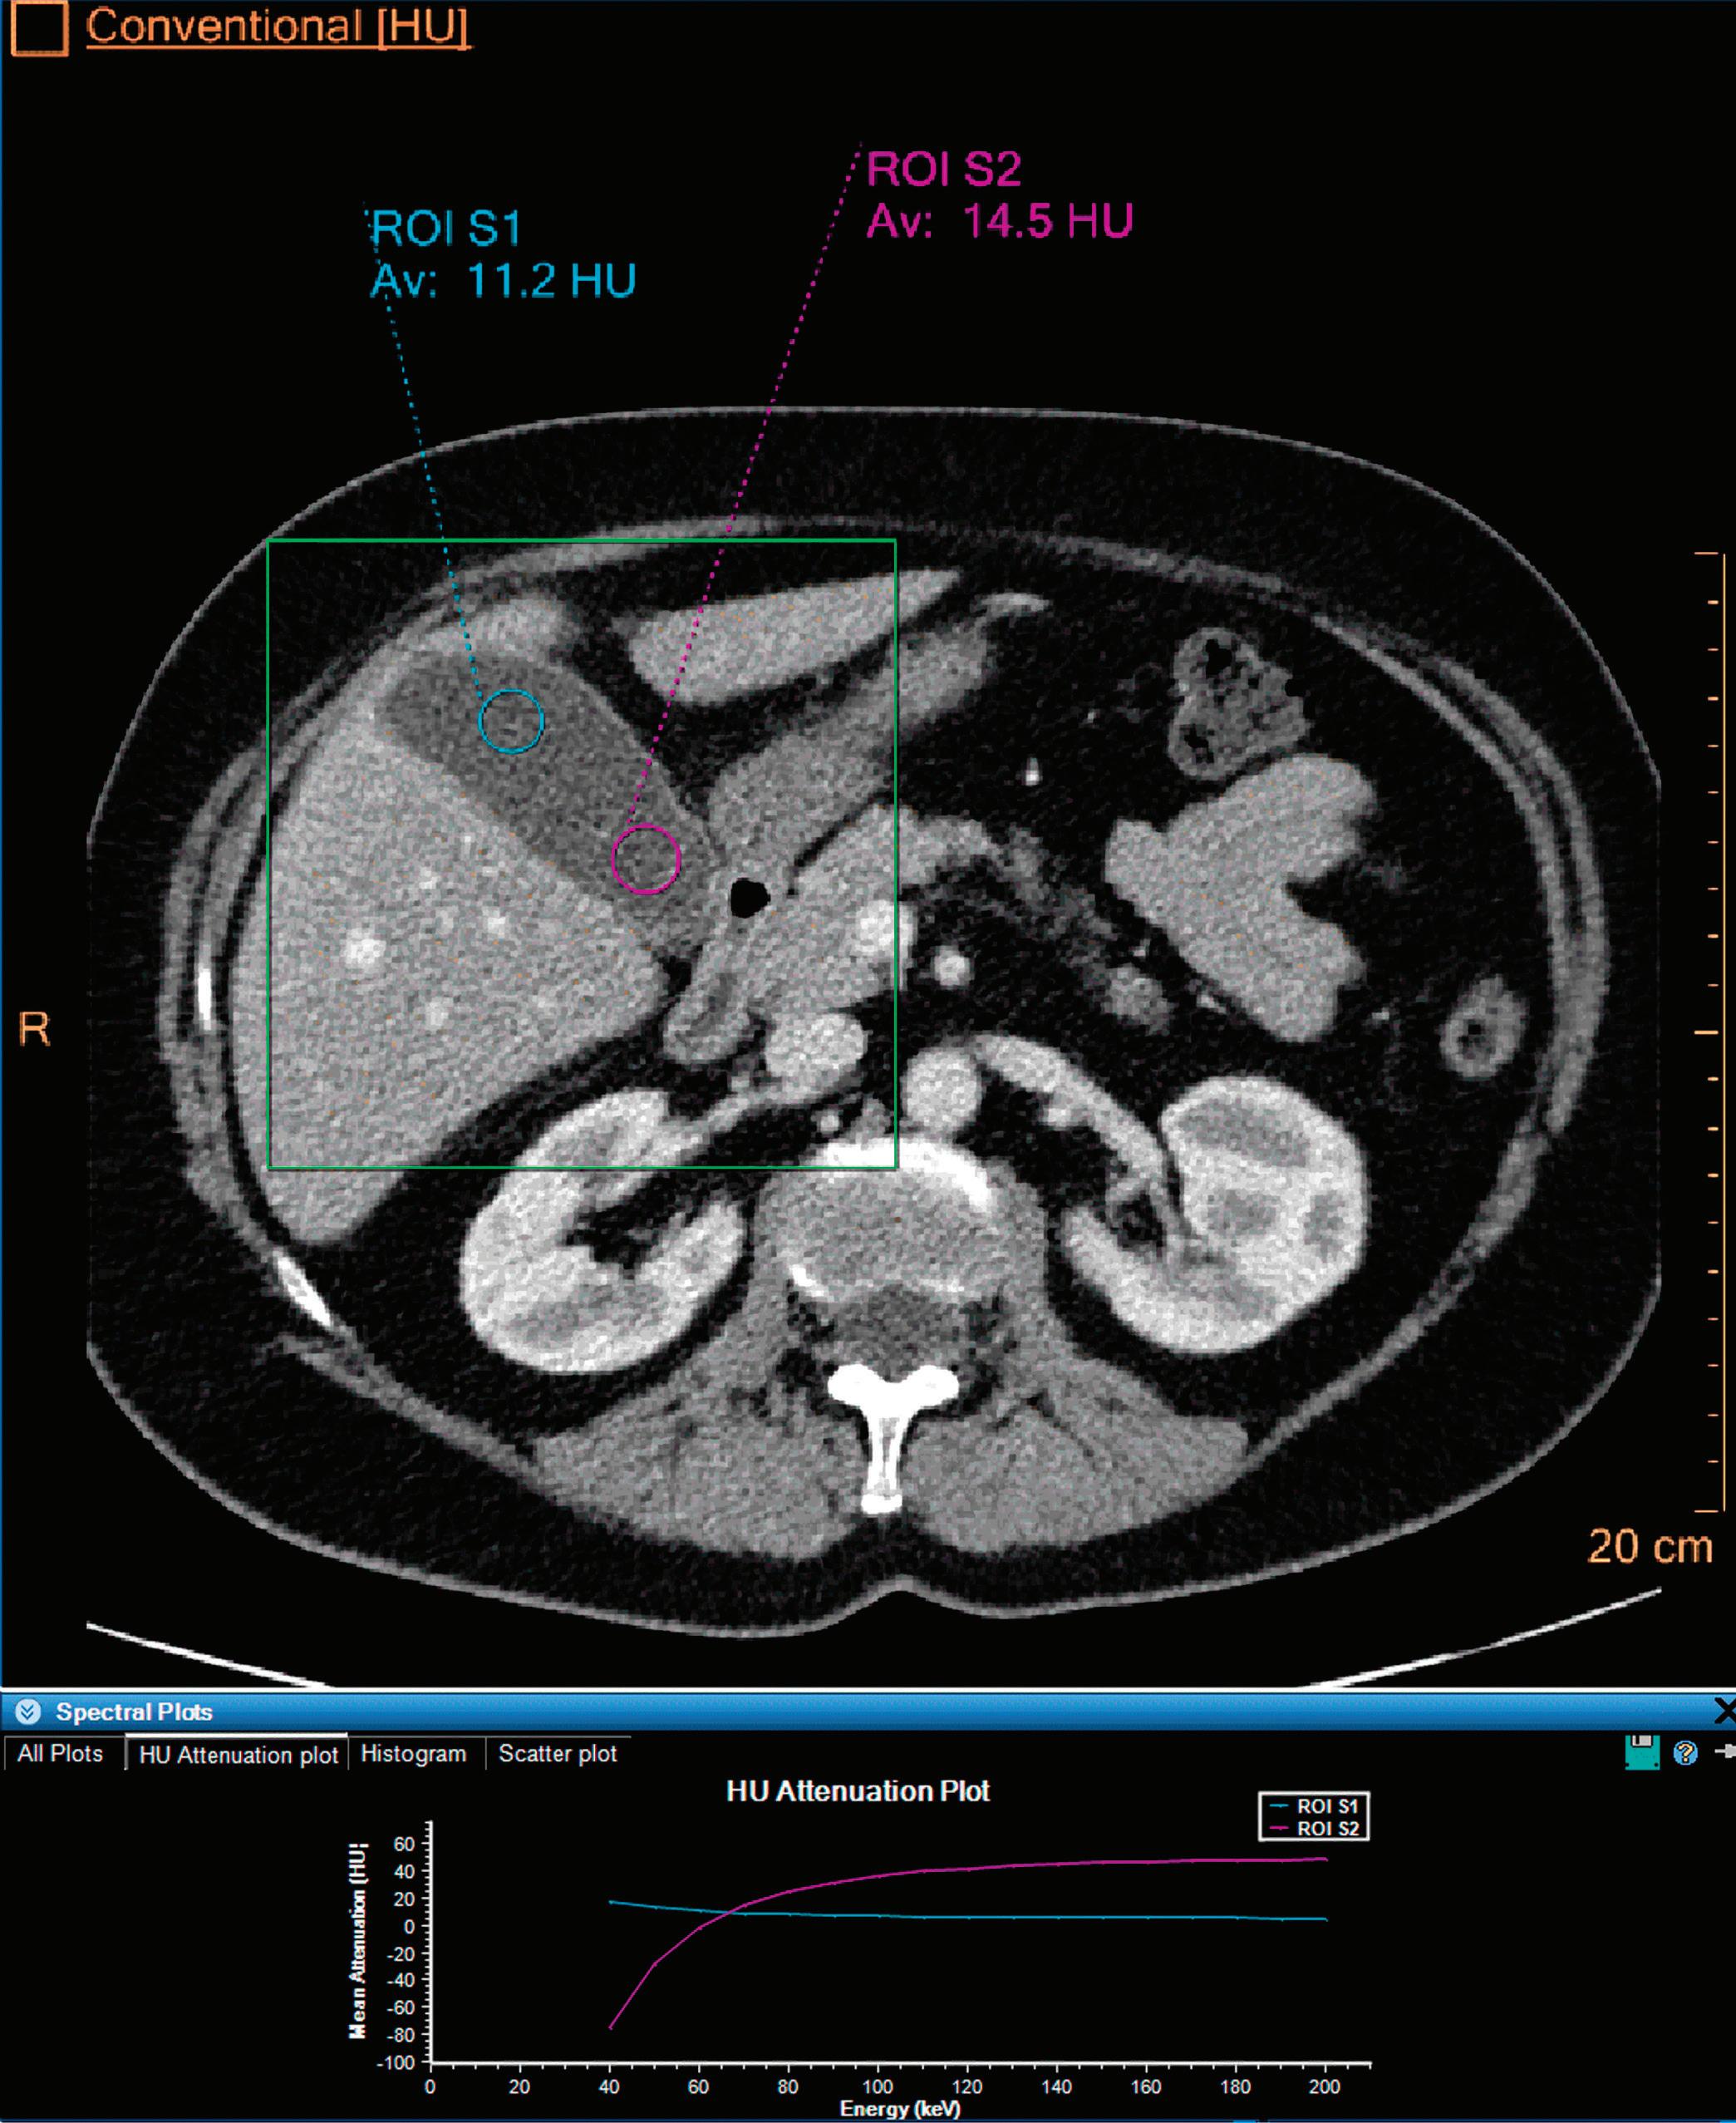
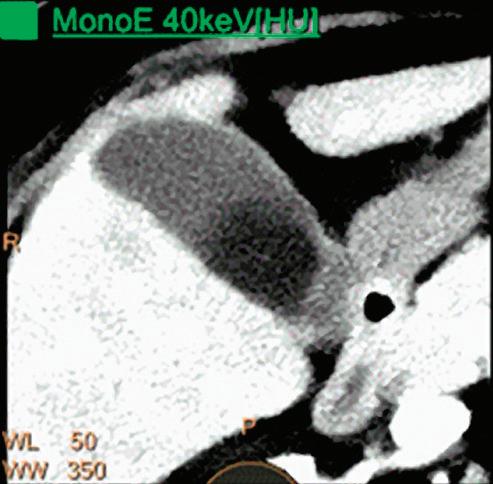
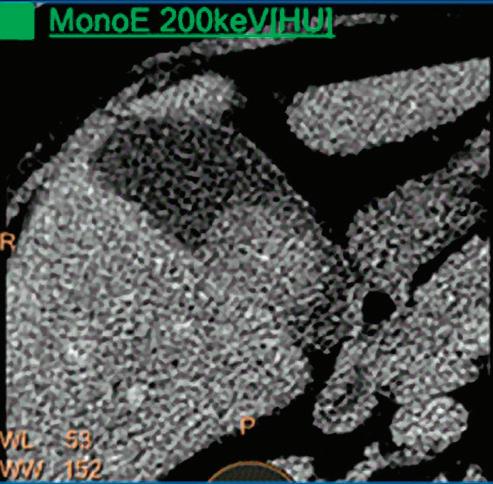
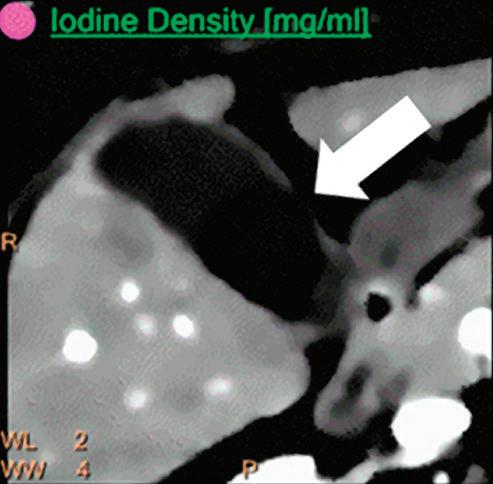
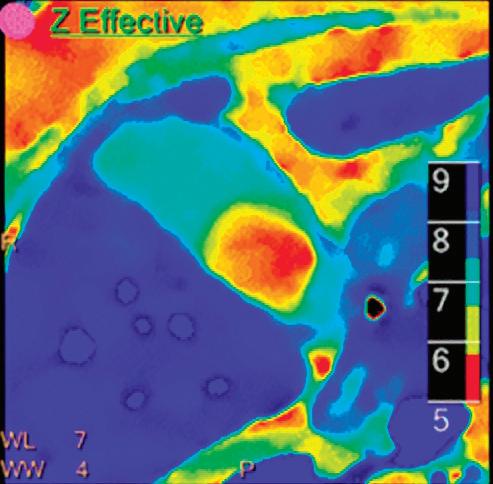
3 (Left)
Patient presented to the emergency department with abdominal pain. The conventional CT does not reveal any abnormality in the gallbladder. In the middle row, spectral attenuation curves reveal two different materials: a first region of interest (purple) with a CT number that is increasing with energy, typical of a low Z effective element (below the Z effective value of water), and a second region of interest (blue) with a CT number that is decreasing with the energy, typical of a Z effective above water. The differentiation between the two materials cannot be performed based on the conventional CT because the two attenuation curves cross each other around 70 keV (where the attenuation is equivalent to the conventional CT). The lower row displays spectral results in the Magic Glass, from left to right: 40 keV image, 200 keV image, iodine density image, and Z effective map. A gallstone is clearly revealed on the 40 keV image and with an inverted contrast on the 200 keV image. The iodine density shows a perfusion defect of the gallbladder wall due to the compression with the gallstone (white arrow), and the Z effective helps us to determine the gallstone composition with a Z effective below 6.5 typical of a cholesterolic composition.
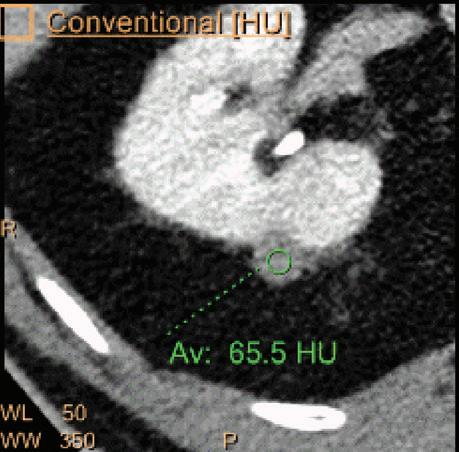
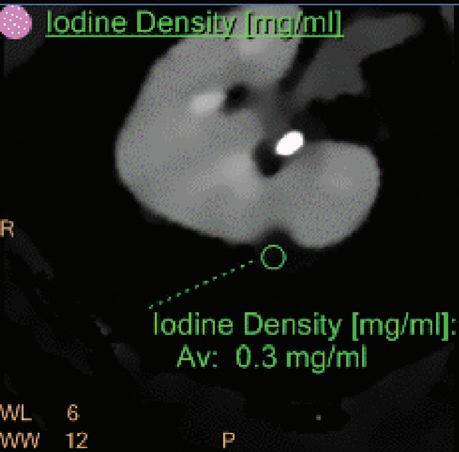
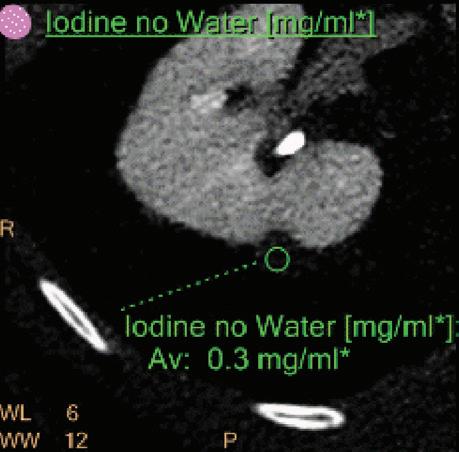
A hyperdense lesion (65 HU) is visible on the right kidney on the conventional CT images obtained after contrast enhancement. The TNC image is shown in the upper right corner. The lower row displays spectral results in the Magic Glass, from left to right: conventional CT image, VNC image, Iodine no Water image, and iodine density image. Comparison between measurements performed on the TNC (55.4 HU) and VNC images (57.6 HU) demonstrates only a minor difference between them (difference = 2.2 HU), showing that the VNC images could perfectly replace the TNC images in this clinical scenario. Iodine concentration measurements in the same region of interest show values of no more than 0.3 mg/ml which can be considered as negligible. In other words, there is no contrast medium uptake in the lesion which can thus be considered as benign. The hyperdensity is of a hemorrhagic cyst.
Contrast enhanced structures displayed in volume rendering (VR) obtained from the axial monoenergetic 70 keV images where only the voxels classified as not bone are shown and others appear black. White arrow points to a narrowed left basilar artery.
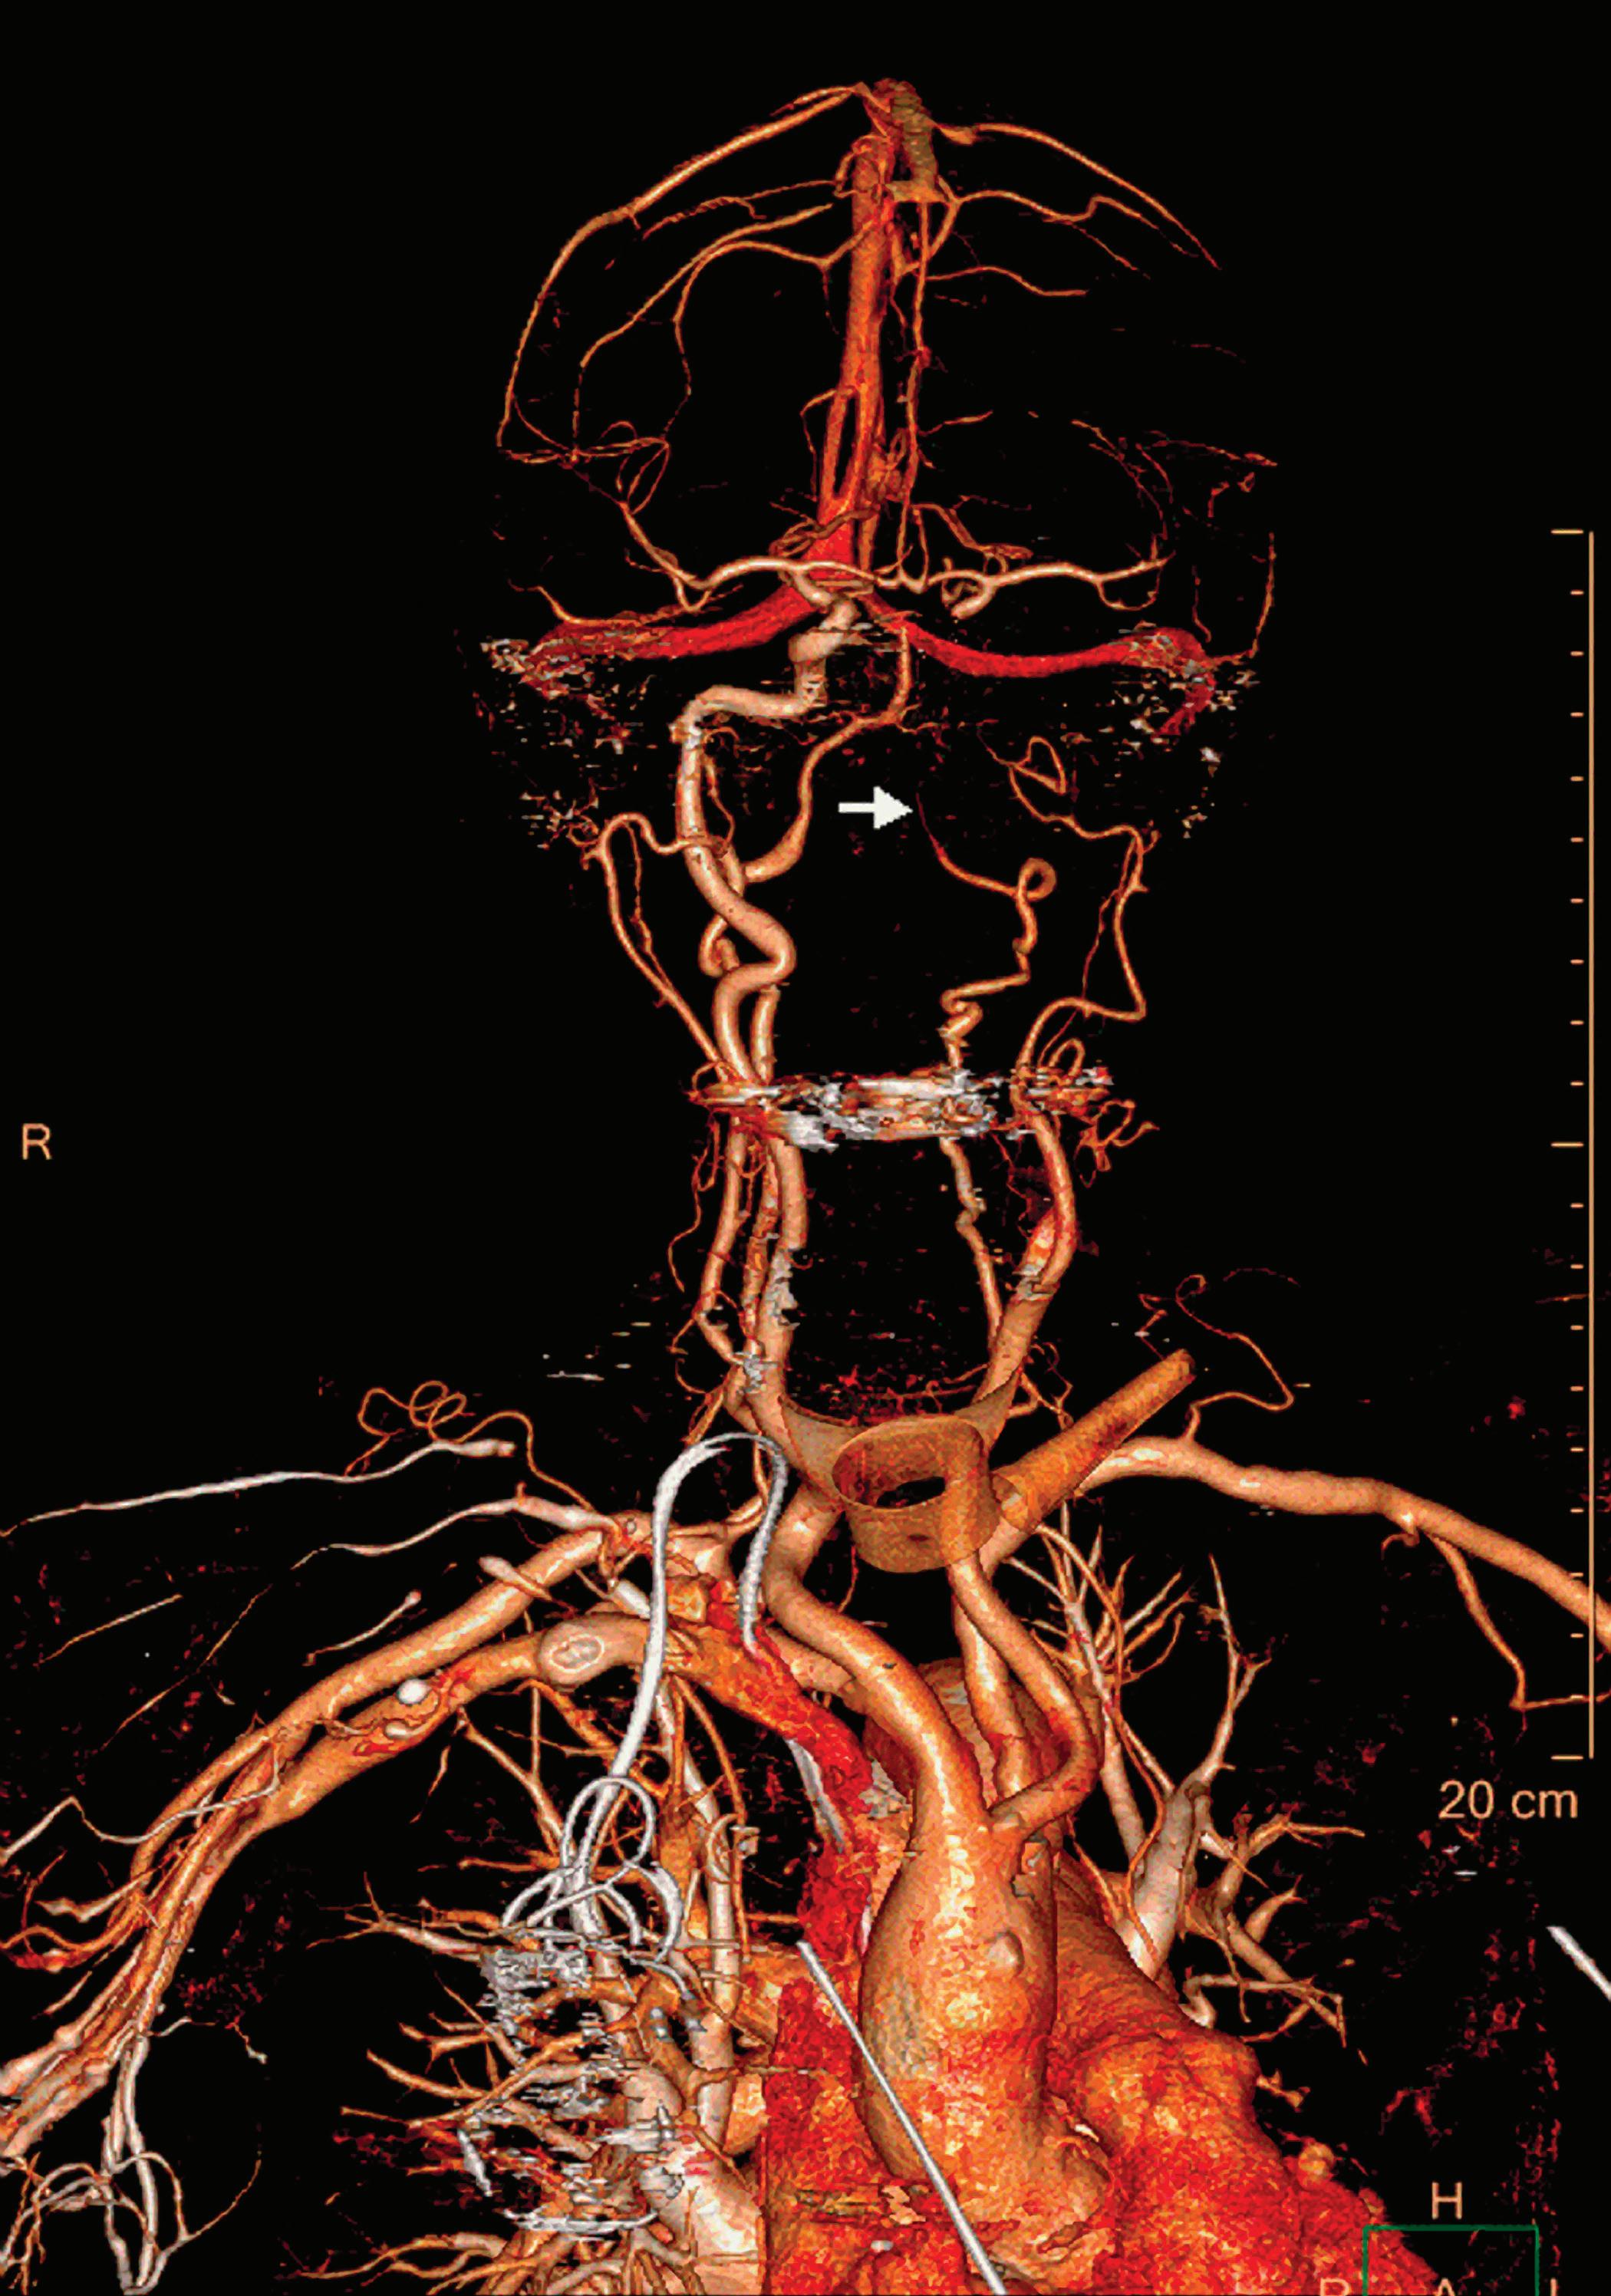
Contrast-Enhanced Structures [HU]
Voxels that are not classified as bone show the corresponding HU of the reference monoenergetic 70 keV CT image. Other voxels appear black (Figure 5). These structures can, for example, be used as color overlays placed above other spectral results to enhance the regions with contrast uptake.
Iodine Removed [HU]
Voxels which are classified as not including iodine (above a minimal threshold) show the corresponding HU of the reference monoenergetic 70 keV CT image. Other voxels appear black. Pure soft tissues and calcium are combined in the iodine removed image.
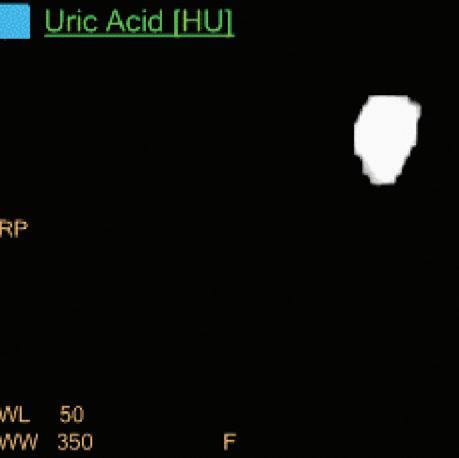
Uric Acid [HU]
Voxels which are classified as including uric acid show the corresponding HU of the reference monoenergetic 70 keV CT image. Other voxels appear black. This image is useful to identify uric acid stones and separate them from calcified stones (Figure 6).
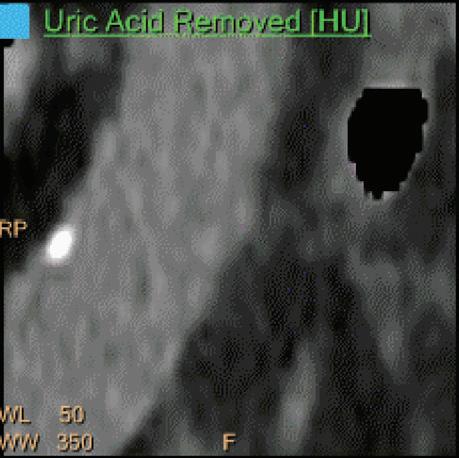
Uric Acid Removed [HU]
Voxels which are classified as not including uric acid (UA) show the corresponding HU of the reference Monoenergetic 70 keV CT image. Other voxels appear black. This image is useful to identify calcified stones and separate them from uric acid stones. UA and UA removed images are complementary to each other and are intended for uric acid/calcium classification. Pure soft tissues appear as part of the UA removed images (Figure 6).
Electron Density [%EDW]
Is a spectral result presenting the electron density (ED) of each voxel relative to the electron density of water (3.34 x1029 electrons x m-3) in units of percent. For example, the expected value for water in these units is 100 [%EDW]. Electron densities may be used as a basic input for radiotherapy planning systems and could be an essential input for the calculation of the proton stopping powers for proton therapy. In conventional CT, the electron densities are estimated by converting a CT image into ED by using a conversion table obtained by use of a calibration phantom with different material rods of known electron density. These calibration-based conversions aren’t capable of accounting for beam-hardening effects as they emerge in clinical scans. In spectral CT, ED can be measured directly with high accuracy (within 1% of the ED of water21), and without calibration since ED is directly related to the Compton scatter which is obtained by the spectral decomposition.
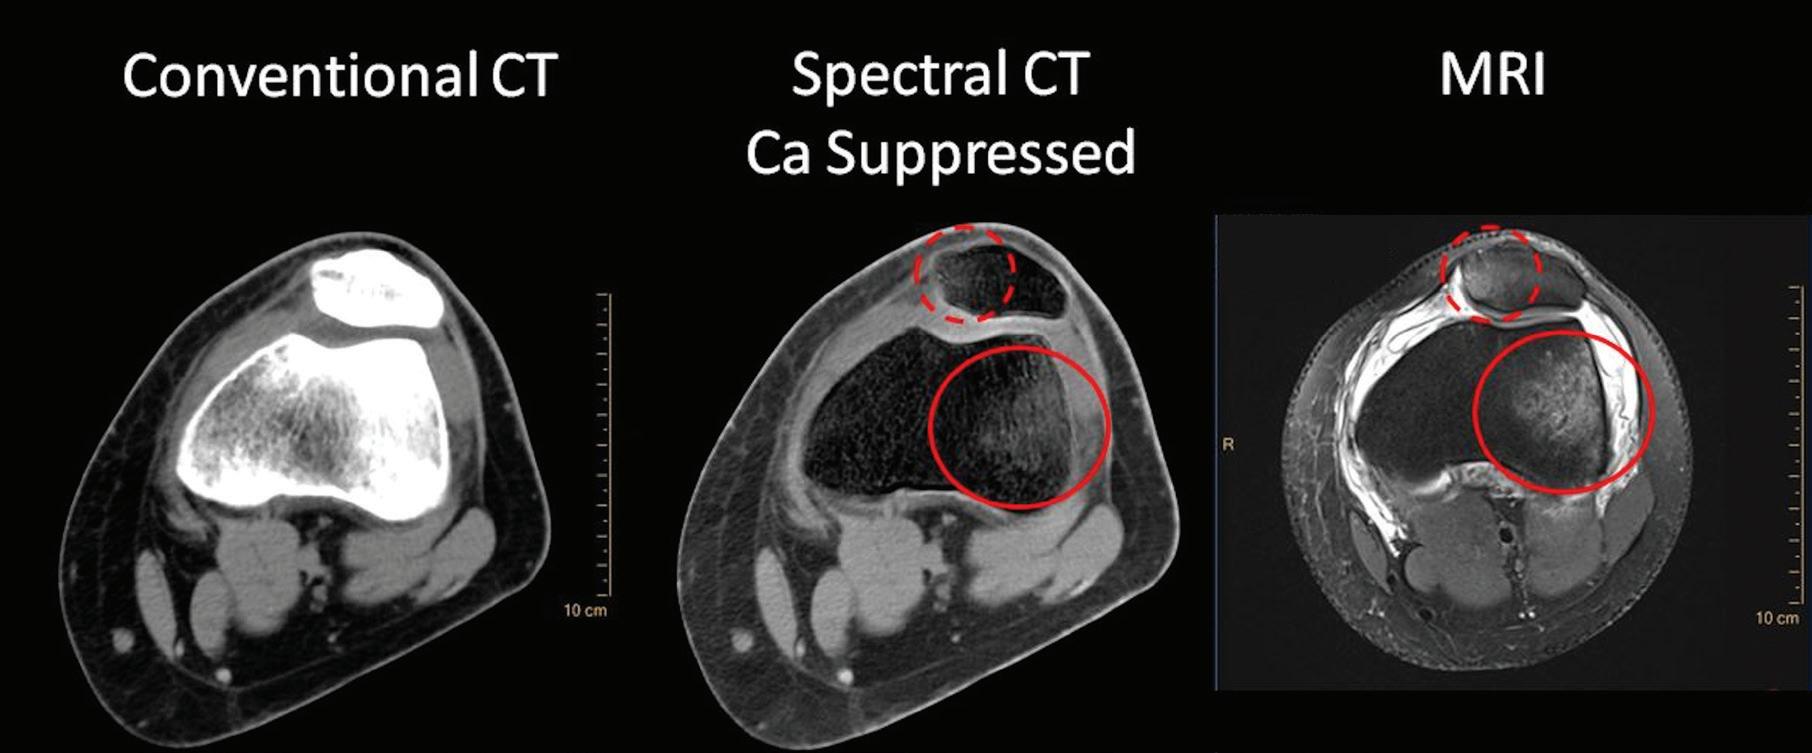
Calcium Suppression (CaSupp) [HU]
Are images that display the attenuation without the attenuation contribution of calciumbased materials.13 Same as the iodine suppression in VNC, but for various calcium-based material. A higher calcium suppressed Index (CSI) corresponds to a higher calcium composition weight (Figure 7).
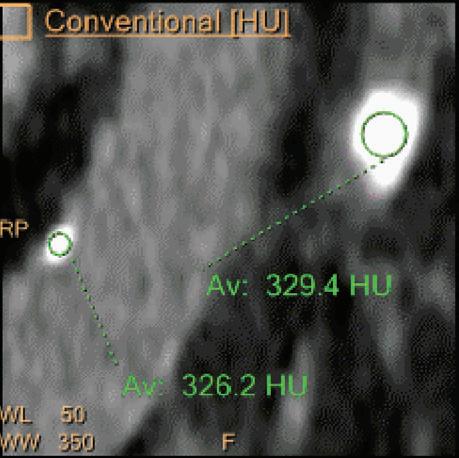
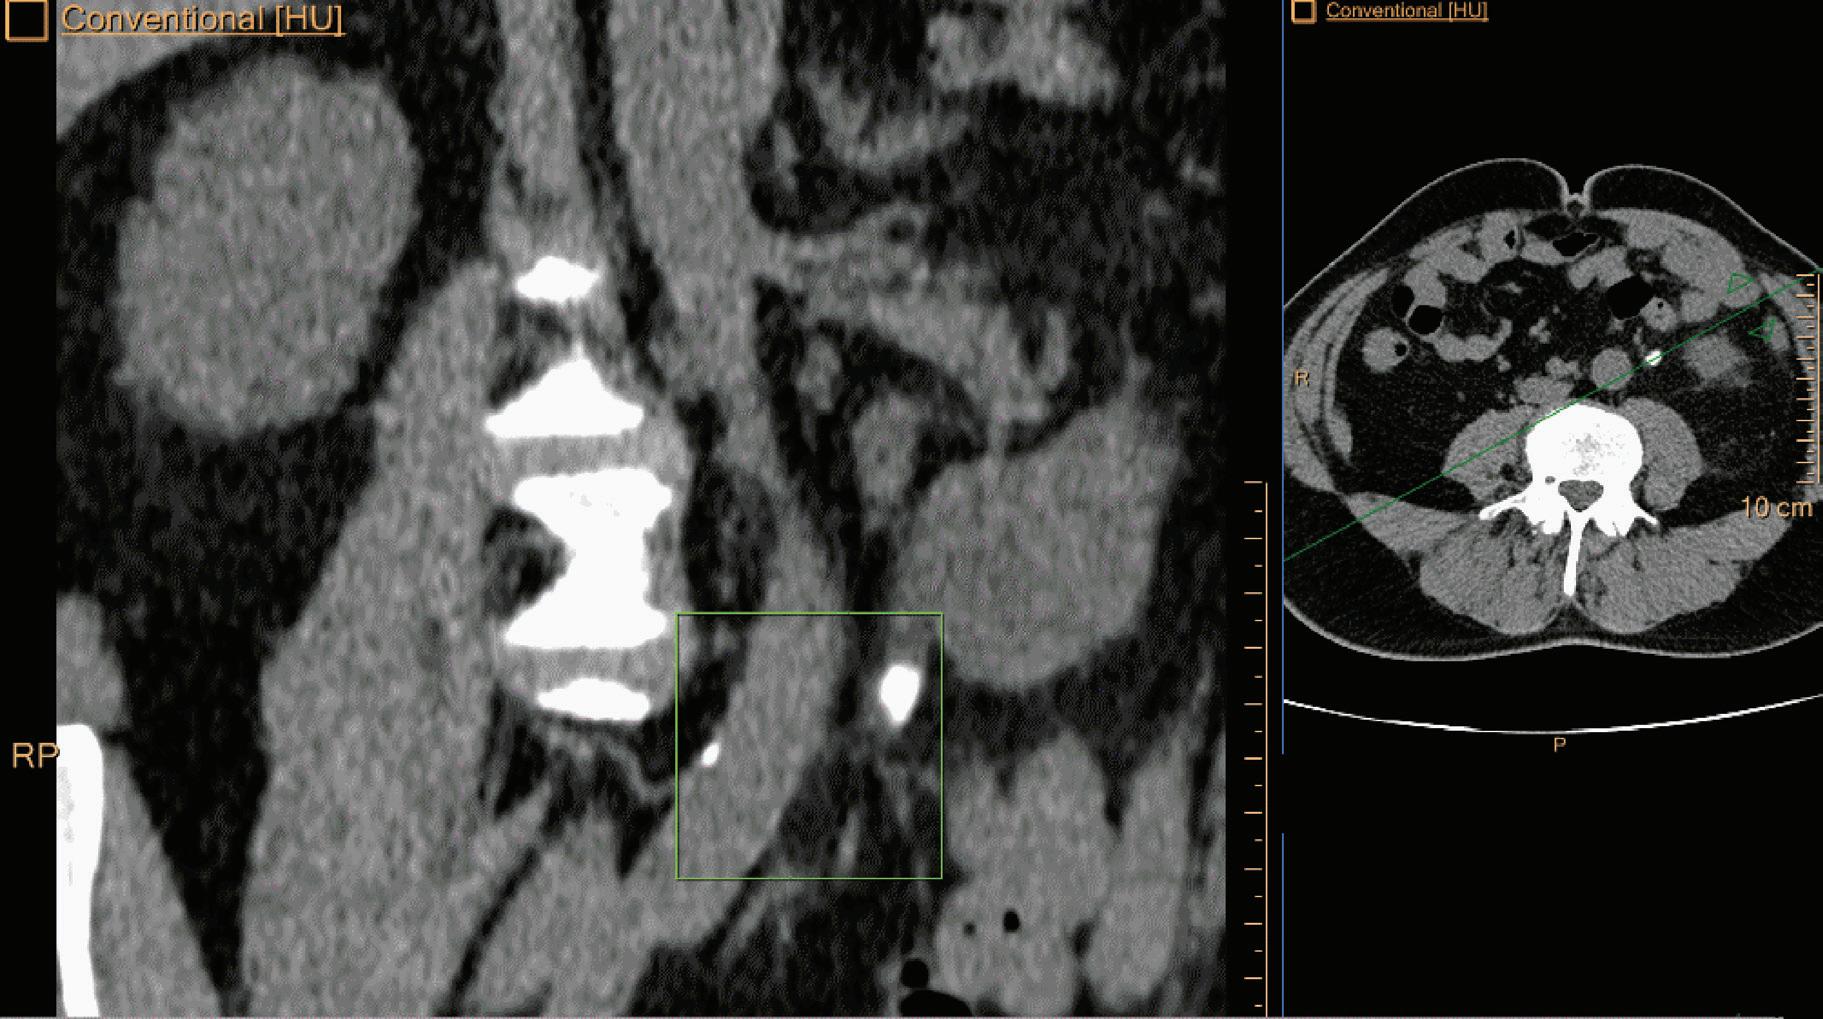
Double oblique MPR image shows a calcified lesion and a uric acid stone side by side. The lower row displays spectral results in the Magic Glass, from left to right: conventional CT image, uric acid removed image, uric acid image, and Z effective map image. A comparative measurement on the conventional image shows that it is not possible to differentiate between them based on HU measurements (Calcified: 326.2 HU; UA stone: 329.4 HU). The Z effective map shows a large difference between the lesions (Calcified: 10.0; UA stone: 7.0) which enables us to classify them correctly.
References
1. Shlomka J.P., Roessl E., Dorsheid R., Dill S., Martens G., Istel T., Bäumer C., Hermann C., Steadman R., Zeitler G., Livne A., Proksa R., (2008), “Experimental Feasibility of Multi-Energy Photon Counting K-edge Imaging in Pre-Clinical Computed Tomography”, Phys.Med.Biol. 53, 4031-4047.
2. Roessl E., Proksa R., (2007) “K-edge imaging in X-ray computed tomography using multi-bin photon counting detectors”, Phys.Med.Biol. 52(15): 4679-4696.
3. Si-Mohamed S., Bar-Ness D., Sigovan M., Cormode D., Coulon P., Coche E., Vlassenbroek A., Norman G., Boussel L., Douek P.; Review of an initial experience with an experimental spectral photon-counting computed tomography system. Nuclear Instruments and Methods in Physics Research, Section A; Volume 873, 21 November 2017, Pages 27-35.
4. Fornaro J, Leschka S, Hibbeln D, Butler A, Anderson N, Pache G et al., Dual- and multi-energy CT: approach to functional imaging, Insights Imaging (2011), 2:149-159.
5. Vlassenbroek A, Dual Layer CT, in “Dual Energy CT in Clinical Practice”; Medical Radiology, DOI: 10 10.1007/978-3-642-01740-7, Springer-Verlag Berlin Heidelberg (2011).
6. Maass N, Baer M and Kachelriess M, Image-based dual energy CT using optimized precorrection functions: A practical new approach of material decomposition in image domain, Med.Phys. 36 (8), August 2009.
7. Fahmi R, Eck BL, Fares A, Levi J, Wu H, Vembar M et al., Dynamic Myocardial Perfusion in a Porcine Balloon-induced Ischemia Model using a Prototype Spectral Detector CT. Medical Imaging 2015: Biomedical Applications in Molecular, Structural, and Functional Imaging. Proc. of SPIE Vol. 9417, 94170Y-8.
8. Engel K.J., Herrmann C. and Zeitler G., (2008) “X-ray scattering in single and dual-source CT”, Med.Phys. 35 (1): pp. 318-332.
9. Hojjati M., Van Hedent S., Rassouli N., Tatsuoka C., Jordan D., Dhanantwari A., Rajiah P.; Quality of routine diagnostic abdominal images generated from a novel detector-based spectralCT scanner: a technical report on a phantom and clinical study. Abdom Radiol (NY). 2017 Nov;42(11):2752-2759. doi: 10.1007/s00261-017-1170-z.
10. Alvarez RE and Macovski A, Energy-selective Reconstructions in X-ray Computerized Tomography”, Phys. Med. Biol. 1976, vol.21, no.5, 733-744.
11. Sauter AP, Muenzel D, Dangelmaier J, Braren R, Pfeiffer F, Rummeny EJ, Noël PB, Fingerle AA.; Dual-layer spectral computed tomography: Virtual non-contrast in comparison to true non-contrast images. Eur. J Radiol 2018 Jul;104:108-114. doi: 10.1016/j.ejrad.2018.05.007.
12. Ananthakrishnan L., Rajiah P., Ahn R., Rassouli N., Xi Y., Soesbe T.C., Lewis M.A., Lenkinski R.E., Leyendecker J.R., Abbara S; Spectral detector CT-derived virtual non- contrast images: comparison of attenuation values with unenhanced CT; Abdom Radiol (NY). 2017 Mar;42(3):702-709. doi: 10.1007/s00261-016-1036-9.
13. Neuhaus V, Lennartz S, Abdullayev N, Große Hokamp N, Shapira N, Kafri G, Holz JA, Krug B, Hellmich M, Maintz D, Borggrefe J.; Bone marrow edema in traumatic vertebral compression fractures: Diagnostic accuracy of dual-layer detector CT using calcium suppressed images. Eur J Radiol. 2018 Aug;105:216-220. doi: 10.1016/j.ejrad.2018.06.009.
14. van Ommen F., Bennink E., Vlassenbroek A., Dankbaar J.W., Schilham A.M.R., Viergever M.A., de Jong H.W.A.M.; Image quality of conventional images of dual-layer SPECTRAL CT: A phantom study. Med Phys. 2018 May 10. doi: 10.1002/mp.12959.
15. Tsang D.S., Merchant T.E;., Merchant S.E., Smith H., Yagil Y., Hua C.H.; Quantifying potential reduction in contrast dose with monoenergetic images synthesized from dual-layer detector spectral CT. Br J Radiol. 2017 Oct;90(1078):20170290. doi:10.1259/bjr.20170290.
16. Nagayama Y., Nakaura T., Oda S., Utsunomiya D., Funama Y., Iyama Y., Taguchi N., Namimoto T., Yuki H., Kidoh M., Hirata K., Nakagawa M., Yamashita Y.; Dual-layer DECT for multiphasic hepatic CT with 50 percent iodine load: a matched-pair comparison with a 120 kVp protocol; Eur Radiol. 2018 Apr;28(4):1719-1730. doi: 10.1007/s00330-017-5114-3.
17. Wellenberg R.H., Boomsma M.F., van Osch J.A., Vlassenbroek A., Milles J., Edens M.A., Streekstra G.J., Slump C.H., Maas M.; Quantifying metal artefact reduction using virtual monochromatic dual-layer detector spectral CT imaging in unilateral and bilateral total hip prostheses; Eur J Radiol. 2017 Mar; 88:61-70. doi: 10.1016/j.ejrad.2017.01.002.
18. Hickethier T., Baeßler B., Kroeger J.R., Doerner J., Pahn G., Maintz D., Michels G., Bunck A.C.; Monoenergetic reconstructions for imaging of coronary artery stents using spectral detector CT: In-vitro experience and comparison to conventional images; J Cardiovasc Comput Tomogr. 2017 Jan - Feb;11(1):33-39. doi: 10.1016/j.jcct.2016.12.005.
19. Neuhaus V., Große Hokamp N., Abdullayev N., Rau R., Mpotsaris A., Maintz D., Borggrefe J.; Metal artifact reduction by dual-layer computed- tomography using virtual monoenergetic images; Eur J Radiol. 2017 Aug;93:143-148. doi: 10.1016/j.ejrad.2017.05.013.
20. Kalisz K., Rassouli N., Dhanantwari A., Jordan D., Rajiah P.; Noise characteristics of virtual monoenergetic images from a novel detector-based spectral CT scanner; Eur J Radiol. 2018 Jan;98:118-125. doi: 10.1016/j.ejrad.2017.11.005.
21. Chia-ho Hua, Nadav Shapira, Thomas E. Merchant, Paul Klahr, Yoad Yagil, Accuracy of electron density, effective atomic number, and iodine concentration determination with a dual-layer dualenergy computed tomography system, Med Phys. 2018 Jun;45(6):2486-2497.


