13 minute read
M Chenniappan, A Kader Sahib

JOURNAL OF THE INDIAN MEDICAL ASSOCIATION, VOL 118, NO 06, JUNE 2020
Student's Corner ECG : The Other Face
Advertisement
M Chenniappan 1 , A Kader Sahib 2
Since its discovery in 1902 by William Einthoven, the electrocardiogram (ECG) has served as the most cost-effective investigation. Its usefulness in cardiac conditions, both in coronary and non coronary heart disease is well established. However, most often it is believed that the ECG is a cardiac investigation, utilised only for diagnosing cardiac condition. The beauty of ECG is that it can provide valuable information in variety of non-cardiac conditions also. In this article we explore the usefulness of ECG in many non cardiac situations.
1. CHRONIC OBSTRUCTIVE PULMONARY DISEASE (COPD) :
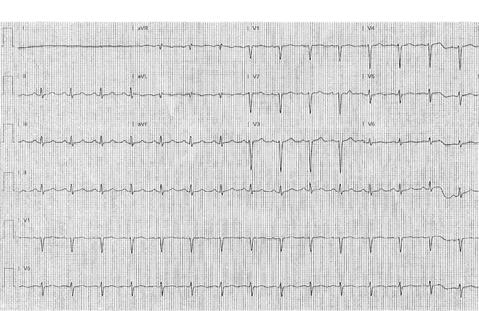
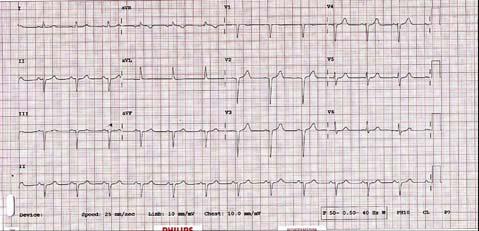
This ECG is very useful in COPD to assess the prognosis. A peculiar ECG sign in COPD is
‘Lead I sign’ or ‘Schamroth sign’ which is low voltage P, QRS, T in L I because of vertical axis of all the vectors 1 (Fig.1). The ECG may also show Right Ventricular hypertrophy and Right Axis Deviation which are the signs of Cor Pulmonale where the prognosis is bad. In addition to this, the symmetrical T inversion in chest leads may be due to Right Ventricular Ischemia rather than Coronary Artery Disease which also indicates a bad prognosis.
2. PULMONARY THROMBO EMBOLISM
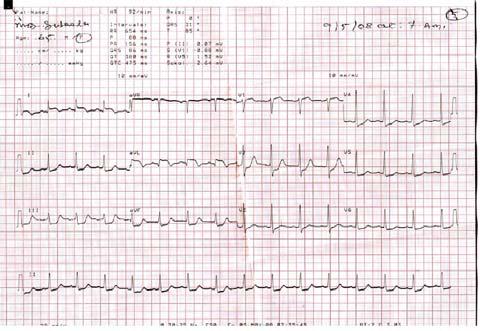
There are many ECG signs described in pulmonary thromboembolism. The most important and common ECG sign is symmetrical inversion of T wave in anterior chest leads 2 . (Fig.2) This is due to Right Ventricular Ischemia and dilatation where Right ventricle occupies region of V1-V3. This ECG sign in appropriate clinical setting not only establishes the diagnosis but also indicates poor response to treatment as well as poor prognosis.
3. SKELETAL ABNORMALITIES
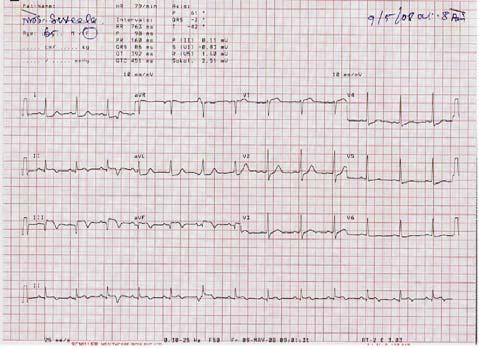
ECG may be abnormal due to skeletal abnormalities such as kyphoscoliosis. The common ECG sign is non progression of R wave in chest leads due to shifting 43 of the heart (Fig.3) Non progression of R wave is defined as R wave less than 3mm in V3 when chest electrodes are correctly placed. In this situation, taking ECG one space below or above may increase the R wave voltage in V3 in which case anterior MI as the
Fig 1. ECG showing Schamroth sign
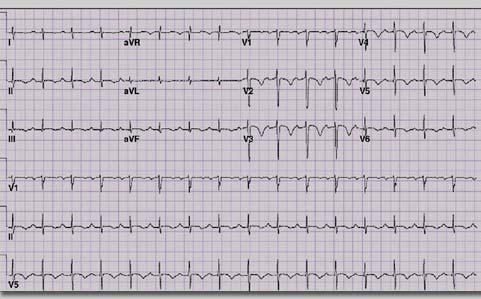
Fig.2 ECG in acute pulmonary embolism showing symmetrical T inversion in V1 –V4
1 Adjunct Professor,Tamilnadu Dr MGR Medical University, Tamil Nadu; Senior consultant cardiologist, Ramakrishna Medical Centre,Apollo Speciality Hospital, Trichy 2 Chief Interventional Consultant cardiologist, Apollo Speciality hospital, Trichy
Received on : 09/06/2020 Accepted on : 15/06/2020
cause of non-progression of R wave is unlikely
Fig 3. ECG mimicking anterior MI in a patient with skeletal abnormalities
JOURNAL OF THE INDIAN MEDICAL ASSOCIATION, VOL 118, NO 06, JUNE 2020
4. CENTRAL NERVOUS SYSTEM DISORDERS (CNS) :
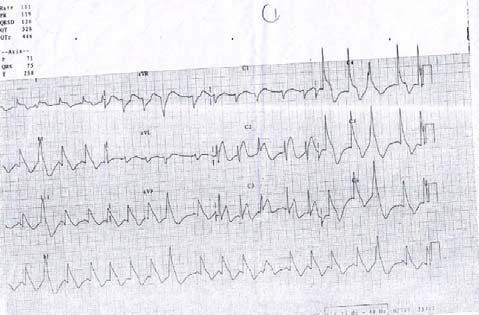
ECG can be abnormal in certain CNS disorders. Sub arachnoid haemorrhage (SAH) and some cases of stroke usually produce deep, broad T inversion (Fig.4). CAD also produces deep T inversion in chest leads. But in SAH, T inversion is deep, broad and splayed with prolonged QT interval 3 (Fig.4).Rarely in SAH, ECG may show ST elevation mimicking acute ST elevation MI (Fig.4a). This is due to excessive catecholamines released from brain producing extensive myocardial injury. Thrombolysis here is disastrous. In some patients with vertebro basilar insufficiency, atrial fibrillation can occur.
5. GASTRO INTESTINAL DISORDERS (GID)
Some GID may also produce ECG changes. Acute pancreatitis can sometimes produce ECG changes mimicking acute coronary syndrome (Fig.5) The ECG changes in pancreatitis are due to proteolytic enzymes released by pancreas injuring the myocardium. The clinical correlation with ECG interpretation in this situation is crucial as the treatment given for Acute Coronary Syndrome will worsen pancreatitis. In some patients, oesophageal disorders not only mimic CAD but can also produce ECG changes 4 due to associated coronary spasm known as ‘Linked Angina’ (Fig 6) 44
6. ELECTROLYTE DISTURBANCES
Electrolyte disturbance can cause significant ECG changes. The relationship between active potential and ECG is shown Fig.7. The QRS corresponds to sodium entry, calcium to ST segment and potassium to T wave.
A. POTASSIUM :
Hyperkalemia initially produces Tall T waves (Fig 8), with increasing levels producing P and QRS changes 5 . The ECG changes appear beyond 6meq/L. When hyperkalemia produces tall T waves, it may be mistaken for acute subendocardial ischemia (Fig9). Hyperkalemia produces Tall T with narrow base and sharp apex; acute ischemia produces Tall T waves with wide base and blunt apex.
Hypokalemia: Hypokalemia produces low voltage T waves with prominent U waves. Usually the ECG changes occur when potassium is <2.7meg/l. Whenever there is a low voltage T wave, one should look for ‘u’ wave to rule out hypokalemia. When K is less than 1.7 meq./L, it produces significant ST depression, low voltage T and prominent U mimicking acute coronary syndrome 5 (Fig.10).The apparent QT prolongation in hypokalemia differentiates it from acute
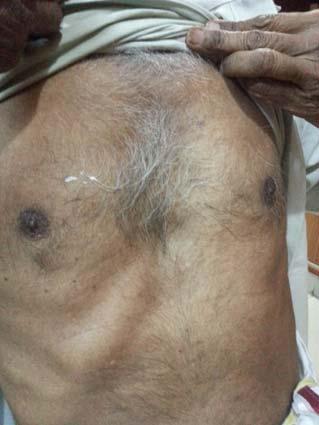

Fig 4a.ST elevation in a patient with SAH (Courtesy : Life in The Fast lane)
Fig 3a.The patient showing skeletal abnormality whose ECG is shown in Fig 3
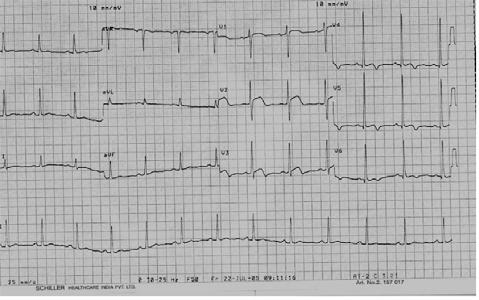
Fig 4: Deep broad splayed T inversion with prolonged QT interval in SAH myocardial injury.
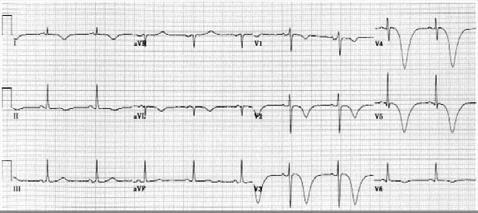
Fig 5. ECG in a patient with acute pancreatitis showing ST coving mimicking acute coronary syndrome
JOURNAL OF THE INDIAN MEDICAL ASSOCIATION, VOL 118, NO 06, JUNE 2020
B.CALCIUM :
The abnormalities in calcium produce ST changes. Hypercalcemia produces short QT interval due to a short ST segment and hypocalcemia produces prolonged QT interval due to a prolonged ST segment 5 (Fig.11,12). 45

Fig 6 .A patient with esophageal spasm showing transient ST elevation due to transient coronay spasm (Linked Angina)
Digoxin produces short QT interval due to shortening of ST segment because of intracellular hypercalcemia
7. HYPOTHERMIA
Hypothermia is defined as core body temperature below 95 degrees Fahrenheit. ECG changes appear below 90 deg. F and when the temperature approximates 86 deg. F, 80% of patients show an extra deflection at the end of QRS which is known as Osborn wave 6 (Fig 13). This change which was described by Dr.John Osborn is due to the gradient of potassium current between epicardial and endocardial surfaces.
8.PNEUMOTHORAX
Diagnosis of pneumothorax is purely clinical. ECG changes are due to shifting of the heart which gets normalised immediately after the relief of pneumothorax.(Fig 14, 15). Comparison of the previous ECGs is very crucial. Although Acute Pulmonary Embolism can present with acute dyspnea with clear lungs, clinical differentiation and rapid reversal of ecg
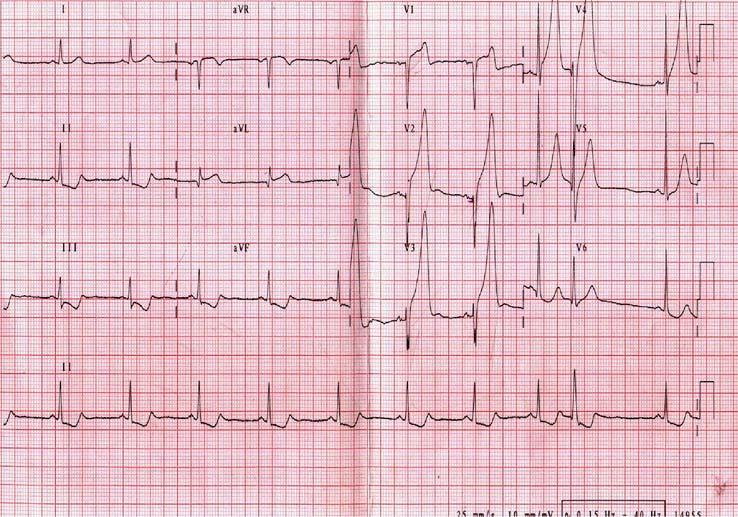
Fig.7 Relationship between action potential, movement of ions and ECG.
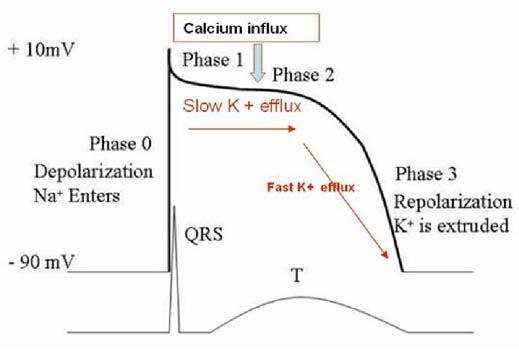
Fig.9. ECG showing tall T waves due to sub endocardial ischemia. (broad base with blunt apex)
Fig 8. ECG showing hyperkalemia. Tall T with a narrow base and sharp apex. (Courtesy Tutor health)
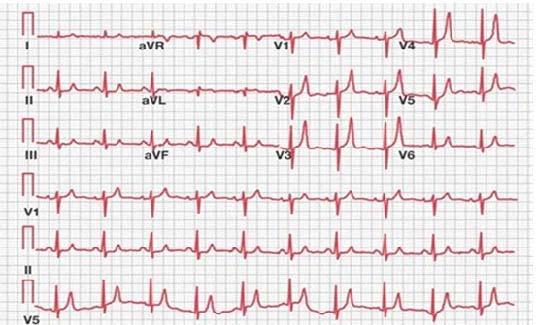
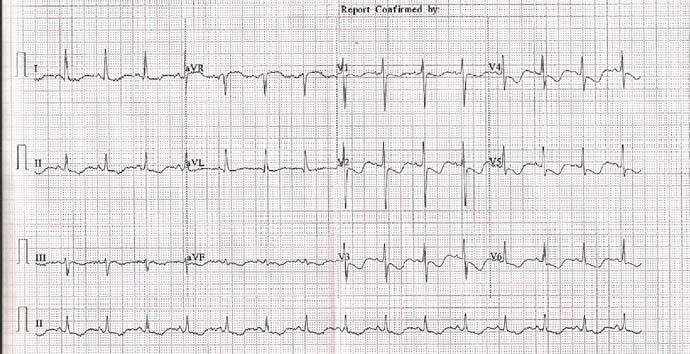
Fig 10: ECG in severe hypokalemia showing down sloping ST depression, low voltage T wave and prominent U extending into next P wave.
changes would help to arrive at a correct diagnosis.
JOURNAL OF THE INDIAN MEDICAL ASSOCIATION, VOL 118, NO 06, JUNE 2020
9.DRUG TOXICITY :
Many non-cardiac drugs produce ECG changes at their toxic levels. Tricyclic antidepressant toxicity typically produces wide QRS, sinus tachycardia and terminal R in avR. These ECG changes are due to depressed Na entry during phase 0 of action potential. Terminal R wave in avR more than 3mm, QRS duration more than 100m.sec and sinus tachycardia are bad prognostic signs 7 (Fig.16). Many chemotherapeutic drugs especially anthracyclines cause cardiac dysfunction and induce changes of myocardial ischemia
10. POISONING
Cardiac toxicity is a common finding in patients who have been poisoned with wide variety of chemical agents. Carbon monoxide (CO) poisoning typically produces ischemic changes in ECG due to inhibition 46
of cellular respiration 8 . (Fig.17)
Organo phosphorous poisoning, cyanide poisoning and heavy metal poisoning produce arrhythmias and ECG changes. One of the common insecticides which is used in South India is Aluminium Phosphide (ALP). ALP poisoning produces cellular hypoxia due to inhibition of cytochrome oxidase in mitochondria. This may produce diffuse ST elevation mimicking Acute Myocardial Infarction (Fig.18).
11. TREMORS
Tremors due to various reasons especially Parkinsonism produce somatic tremor artefacts (STA). This STA will mimic arrhythmias such as atrial flutter, powerful antiarrhythmic agents and DC shock 9 . The
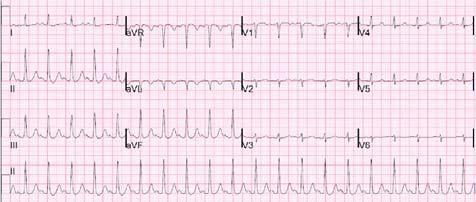
Fig.11. ECG showing short QT due to shortened ST segment interval due to hypercalcemia.(Incidental Technical Dextrocardia)
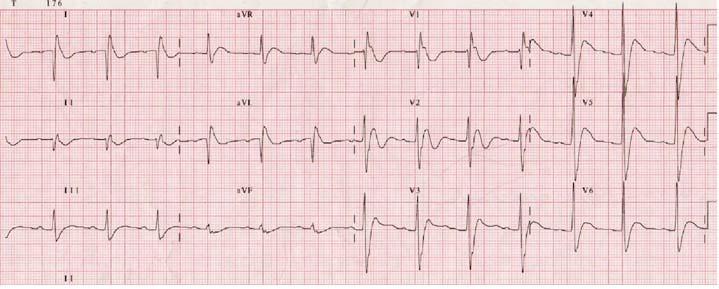
Fig.14. ECG showing sinus tachycardia, low voltage and nonprogression of R wave in chest leads due to Pneumothorax on left side shifting the heart to right side.
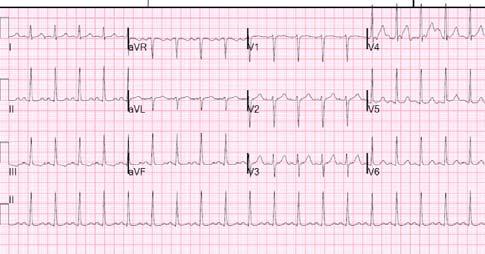
Fig.12. ECG showing Prolonged ST segment due to hypocalcemia.
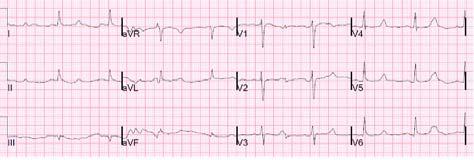
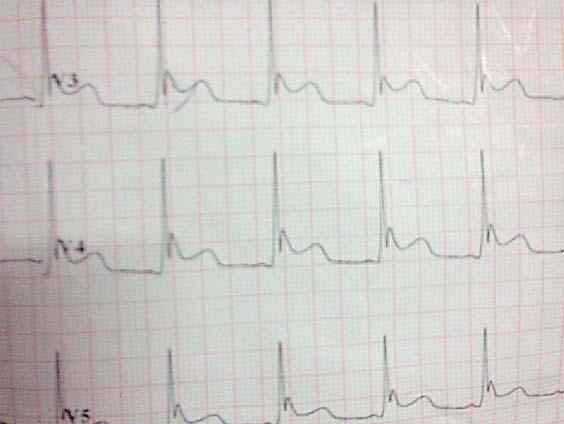
Fig.15. ECG after the relief of Pneumothorax .Please note progression and good voltage of R wave in left sided leads.
Fig.13. Hypothermia showing Osborn Wave.(arrow).This hypothermia was due to paracetamol poisoning.
Torsade de pointes and may be wrongly treated with
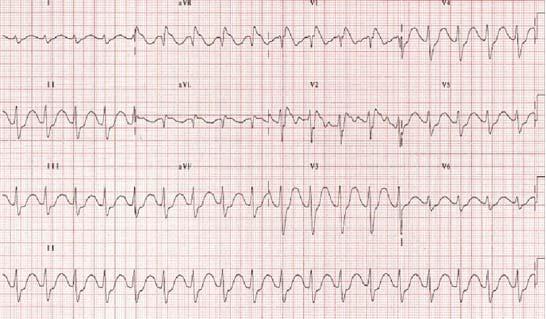
Fig.16. ECG showing sinus tachycardia, wide QRS and tall R in avR due to tricyclic antidepressant toxicity.
JOURNAL OF THE INDIAN MEDICAL ASSOCIATION, VOL 118, NO 06, JUNE 2020
clinical examination during the arrhythmia will show disparity between pulse and ECG. The ECG in Parkinsonism is shown in Fig.19, which exactly looks like Torsade de pointes. Careful examination of L II which is simultaneously recorded with other leads did not show the arrhythmia, confirming the diagnosis of tremors. Further careful examination of limb leads confirms that the leads using left arm such as L1, L III, avL show the ECG changes and not L II which is not using left upper limb indicating the tremor is maximum in left upper limb. So, the ECG can be utilized not only to diagnose tremors but also the limb of tremors! 47
12. LEAD MISPLACEMENT
Upper arm lead reversal is well known to cause technical dextrocardia where limb leads show the evidence of dextrocardia (P,QRS negative in L I and positive in avR) but chest leads show normal R wave progression (fig 20).
Less well known is the reversal of electrodes between upper and lower limbs 10 . In Fig.20a and Fig. 20b upper, lower limb lead reversal actually changes site of infarction. The actual inferior wall MI is shown as High lateral MI due to upper, lower limb lead reversal
13. PREGNANCY
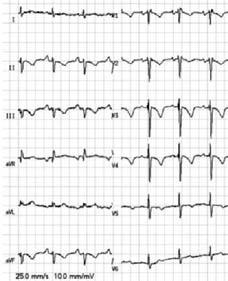
Fig.19. ECG showing Parkinson tremor mimicking Torsade de Pointes. Note that LII which is simultaneously recorded with LI and LIII does not show same ecg changes confirming STA
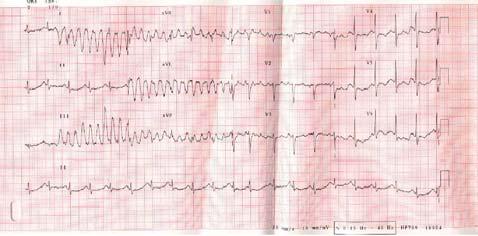
Fig.17. ECG showing diffuse T inversion due to CO monoxide poisoning which is an indication for hyperbaric therapy.
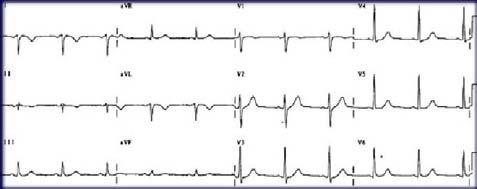
Fig 20: Right arm and left arm lead reversal leading to positive complexes in lead aVR and negative complexes in lead I
Fig, 18.ECG showing diffuse ST elevation due to ALP poisoning.(see text)
Pregnancy produces a lot of ECG changes such
Fig 20 a. ECG showing High lateral MI like picture because of upper limb, lower limb lead reversal.
JOURNAL OF THE INDIAN MEDICAL ASSOCIATION, VOL 118, NO 06, JUNE 2020
Table 1 — Pathologic changes in ECG in pregnancy
Sinus Bradycardia A.V.Blocks (New onset) Complex Premature beats Atrial Fibrillation Significant chamber enlargements (LA,LV,RV) Ischemic changes(deep T inversion, ST elevation or depression)
Fig.20 b. Correctly recorded ECG showing actual inferior MI

Fig 21: ECG changes in pregnancy
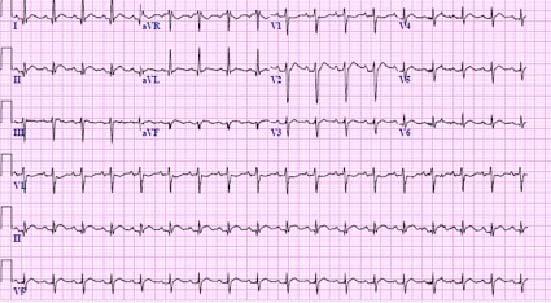

Fig.22a: ECG of the same pt. in fig .22 in lying posture showing normal axis.
as Sinus tachycardia, nonspecific ST T changes, short PR, rare premature beats and minor axis deviation
The pathological changes in ECG during pregnancy are listed in Table 1.
14. POSTURE:
Changes in posture itself can produce significant ECG changes. Standing may produce T wave changes and axis shift (Fig.22); so, when interpreting ECG, it is important to know in which position the ECG has been taken. 48
15. RENAL DISEASE :
ECG in chronic kidney disease (CKD) usually shows LVH, Left Atrial Enlargement and most often hyperkalemia 12 . Sometimes combination of electrolyte abnormalities may produce some typical ECG changes which are diagnostic of chronic renal diseases. The combination of hypocalcemia and hyperkalemia shows prolonged ST segment (Hypocalcemia) and peak T waves (hyperkalemia) (Fig.23). Although in this ECG, T wave is not typical of hyperkalemia because of decreased amplitude, one must suspect associated
Fig. 22: ECG in erect posture showing right axis deviation;Compare the ECG in lying posture (fig.22a) towards left due to elevation of diaphragm 11 (Fig.21).
hyperkalemia because of T waves with a sharp apex.
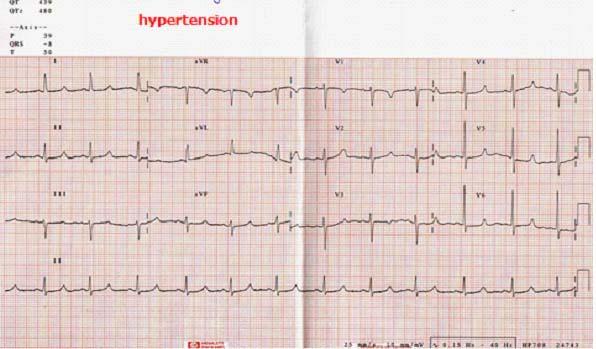
Fig 23: ECG in a CKD patient with hypocalcemia and hyperkalemia
JOURNAL OF THE INDIAN MEDICAL ASSOCIATION, VOL 118, NO 06, JUNE 2020
CONCLUSION :
Most often, whenever there are ECG changes it is presumed, it is due to cardiac disease. It should be realised that many non cardiac conditions can produce significant ECG changes which are mistaken for cardiac disease and wrongly treated especially in critical care settings. The clinical correlation, careful study of ECG and awareness of ECG changes in non cardiac conditions will prevent many such therapeutic disasters.
R EFERENCES
1 Harrigan RA, Jones K — ABC of clinical electrocardiography.
Conditions affecting the right side of the heart. BMJ 2002
May 18;324(7347):1201-4. 2 Panos RJ, Barish RA, Depriest WW, et al — The electrocardiographic manifestations of pulmonary embolism.
J Emerg Med 1988; 6:301-7. 3 Di Pasquale G, Andreoli A, Lusa M, et al. — Cardiologic complications of subarachnoid hemorrhage. J Neurosurg Sci 1998; 42(suppl 1):33-6. 4 Baldi F, Ferrarini F — Non-cardiac chest pain: a real clinical problem. Eur J Gastroenterol Hepatol 1995; 7:1136-40.
5 Surawicz B. Electrolytes, hormones, temperature, and miscellaneous factors: electrophysiologic basis of ECG and
cardiac arrhythmias. Baltimore, MD: Williams & Wilkins, 1995; 426-53. 6 Gussak I, Bjerregaard P, Egan T, et al — ECG phenomenon called the J wave. J Electrocardiol 1995; 28:49–58. 7 Groleau G, Jotte R, Barish R — The electrocardiographic manifestations of cyclic antidepressant therapy and overdose: a review. J Emerg Med 1990; 8:597–605. 8 Marius-Nunez AL — Myocardial infarction with normal coronary arteries after acute exposure to carbon monoxide.
Chest 1990; 97:491-4 9 Knight BP, Pelosi F, Michaud GF, et al — Clinical consequences of electrocardiographic artifact mimicking ventricular tachycardia. N Engl J Med 1999; 341:1270-4 10 Peberdy MA, Ornato JP — Recognition of electrocardiographic lead misplacements. Am J Emerg Med 1993; 11: 403-5 11 L.Feldman, Harold H Hill — Electrocardiogram of the normal heart in pregnancy. American Heart Journal Oct 1934. Volume 10, Issue 1: 110-17 12 Chijioke A, Makusidi AM — Electrocardiographic abnormalities among dialysis naïve chronic kidney disease patients in Ilorin
Nigeria. Ann Afr Med 2012 Jan-Mar; 11(1):21-6.
49